Article

Design Method for Hybrid Electric Vehicle Powertrain Configuration with a Single Motor

1
School of Mechanical Engineering, Sichuan University of Science and Engineering, Zigong 643000, China
2
Artificial Intelligence Key Laboratory of Sichuan Province, Sichuan University of Science and Engineering, Zigong 643000, China
3
State Key Laboratory of Mechanical Transmissions, Chongqing University, Chongqing 400044, China
*
Author to whom correspondence should be addressed.
Sustainability 2022, 14(13), 8225; https://doi.org/10.3390/su14138225
Submission received: 25 May 2022 / Revised: 29 June 2022 / Accepted: 1 July 2022 / Published: 5 July 2022
(This article belongs to the Special Issue Emerging Research in Intelligent New Energy Vehicles)

Abstract

:
Existing design methods for hybrid power system configurations obtain new solutions based on experience, structure improvement or optimization, exhaustive searching, and the screening of schemes at the expense of less innovation and less efficiency. Furthermore, these methods lack mechanisms involving automotive theory to guide powertrain configuration design. In this study, a design method of configuration with a single motor based on basic schemes of speed and torque decoupling was proposed from the perspective of the hybrid electric vehicle fuel-saving mechanism. First, the coupling characteristics of speed and torque in the basic scheme were analyzed from four perspectives. Thereafter, new configurations that meet operation requirements were derived via configuration reconstruction, which combined the better basic schemes with brakes, clutches, and transmissions. A multidimensional evaluation and screening method based on dynamic performance, economic performance, and adaptability was built. A comparison of S-4 with Toyota Hybrid System, which was performed to demonstrate the feasibility of the design method, revealed that both configurations perform similarly in terms of economic performance, but the dynamic performance of the S-4 is greater by approximately 50%. The times required to attain 100 km/h from 0 km/h for THS and S-4 are 13.5 s and 6.69 s, respectively.

1. Introduction

Energy and environmental regulations and policies have promoted the rapid development of hybrid electric vehicles (HEVs) [1]. Compared to traditional fuel vehicles, hybrid vehicles have an electric drive system. Through flexible control strategies, the goal of reducing emissions and fuel consumption can be achieved. However, the system structure of HEVs is complicated. According to the power flow direction and power coupling mode, HEVs can be divided into series, parallel, and power-split types (series-parallel type) [2].
Series HEVs are directly driven by a motor. The engine only serves the electric system and is completely decoupled from the wheels. It can run continually in an economic region and has a single configuration scheme. Parallel HEVs can realize the torque decoupling of engines and wheels. The power-split hybrid vehicle power system employs a planetary gear (PG) as the power coupling mechanism. Through the control of the motor and generator, speed decoupling or torque decoupling between the engine and the wheels can be realized [3]. In the literature [4,5], the power-split mode of a single PG was classified; the input and output split configurations are suitable for low- and high-speed working conditions, respectively. In addition, owing to the different connection possibilities of components and gear trains, the number of schemes for the power-split configuration is more than those for the other two types of hybrid powertrain configurations, which makes the design more complicated.
Avoiding patent restrictions and developing a hybrid system with better performance is a concern for the automotive industry, and a set of advanced configuration design methods is a prerequisite for solving the above problems. Traditional design methods can improve existing structures or optimize the size parameters, but fail to improve design efficiency and choose optimal configuration. The combination of input and output power-split modes using a single PG and synchronizer, which reduces the loss of power flow in energy conversion, has been realized [6]. In the literature [7,8,9], the distribution of mechanical points of compound power-split PGs was optimized by utilizing the lever [10] and matrix methods to realize the combination of input power-split and compound power-split modes, which widened the efficient operation range of the transmission system. However, the above methods lack systematic theoretical guidance and are not easily applicable to other configurations.
Currently, many abstract methods have been applied to configuration design. These methods are usually based on exhaustive mathematical principles, using graphics or dynamic equations as configuration expression tools. The basic design process is as follows: scheme generation → scheme screening → simulation verification → optimal solution.
Graphics-based methods use graphics to represent various schemes and intuitively show the connection between various components. Hong [11] proposed a mechanical innovation design method in 1992, which exploited the existing mechanism, transformed it into a vertex–edge diagram [12], and then recombined it to obtain new schemes. Owing to the numerous power-split configuration schemes, it is not realistic to use graphs to represent them manually. Therefore, mathematical expression methods have been deduced, and algorithms for graphs have been generated [13,14], which further broaden the application range of this method. This method has been used to design parallel and power-split configurations [15,16,17]. Yang et al. proposed an improved graph theory design method [18] and used a neural network model [19] to improve design efficiency. A new design method employing the tree diagram concept in graph theory, which reduces invalid structures in the scheme generation stage, was proposed [20]. In the literature [21], the lever method was utilized to express all single-mode schemes of double PGs. The dynamic and economic performances of different PG characteristic parameters for these schemes were analyzed, and the optimal scheme was selected. The above graphics-based methods convert graphics into mathematical language that can be operated by a computer and employ algorithms to realize the automatic generation and screening of schemes when possible schemes increase significantly. However, it is hard to build the dynamic relationship using graphics tools to complete performance simulation.
Researchers have determined the relationship between the various components in the configuration using a dynamic matrix equation concerning PGs. A dynamic automatic modeling method that omits the graphical expression, which uses the lever method or matrix method (such adjacency method) to obtain the dynamic matrix equation, was proposed [22,23]. This model explores and derives different numbers of PGs using a coefficient matrix involving the moment of inertia of each component and the number of teeth, thus significantly improving the efficiency of the design process. In the literature [24], the influence of different numbers of clutches on the configuration cost and complexity was considered, and this method was used to design the power-split configuration of dual planetary sets. This design method was extended to a single-motor configuration containing an automatic transmission [25], and the coefficient matrix was improved by incorporating the representation method of the adjacency matrix from graph theory. Another dynamic modeling design method combined with a graph theory model considering different operation modes was proposed, and the scheme of the dual planetary set with multiple actuators was screened [26]. At present, the automatic modeling method still lacks universality, but it is worthy to improve the configuration’s mathematical model.
The abovementioned graphics or dynamic design methods yield a feasible scheme through the mathematical principles of combination and exhaustion and yield an optimal solution. In addition, the alternative scheme depends on a preset range of components; therefore, the presumed optimal scheme may only be the second-best solution [
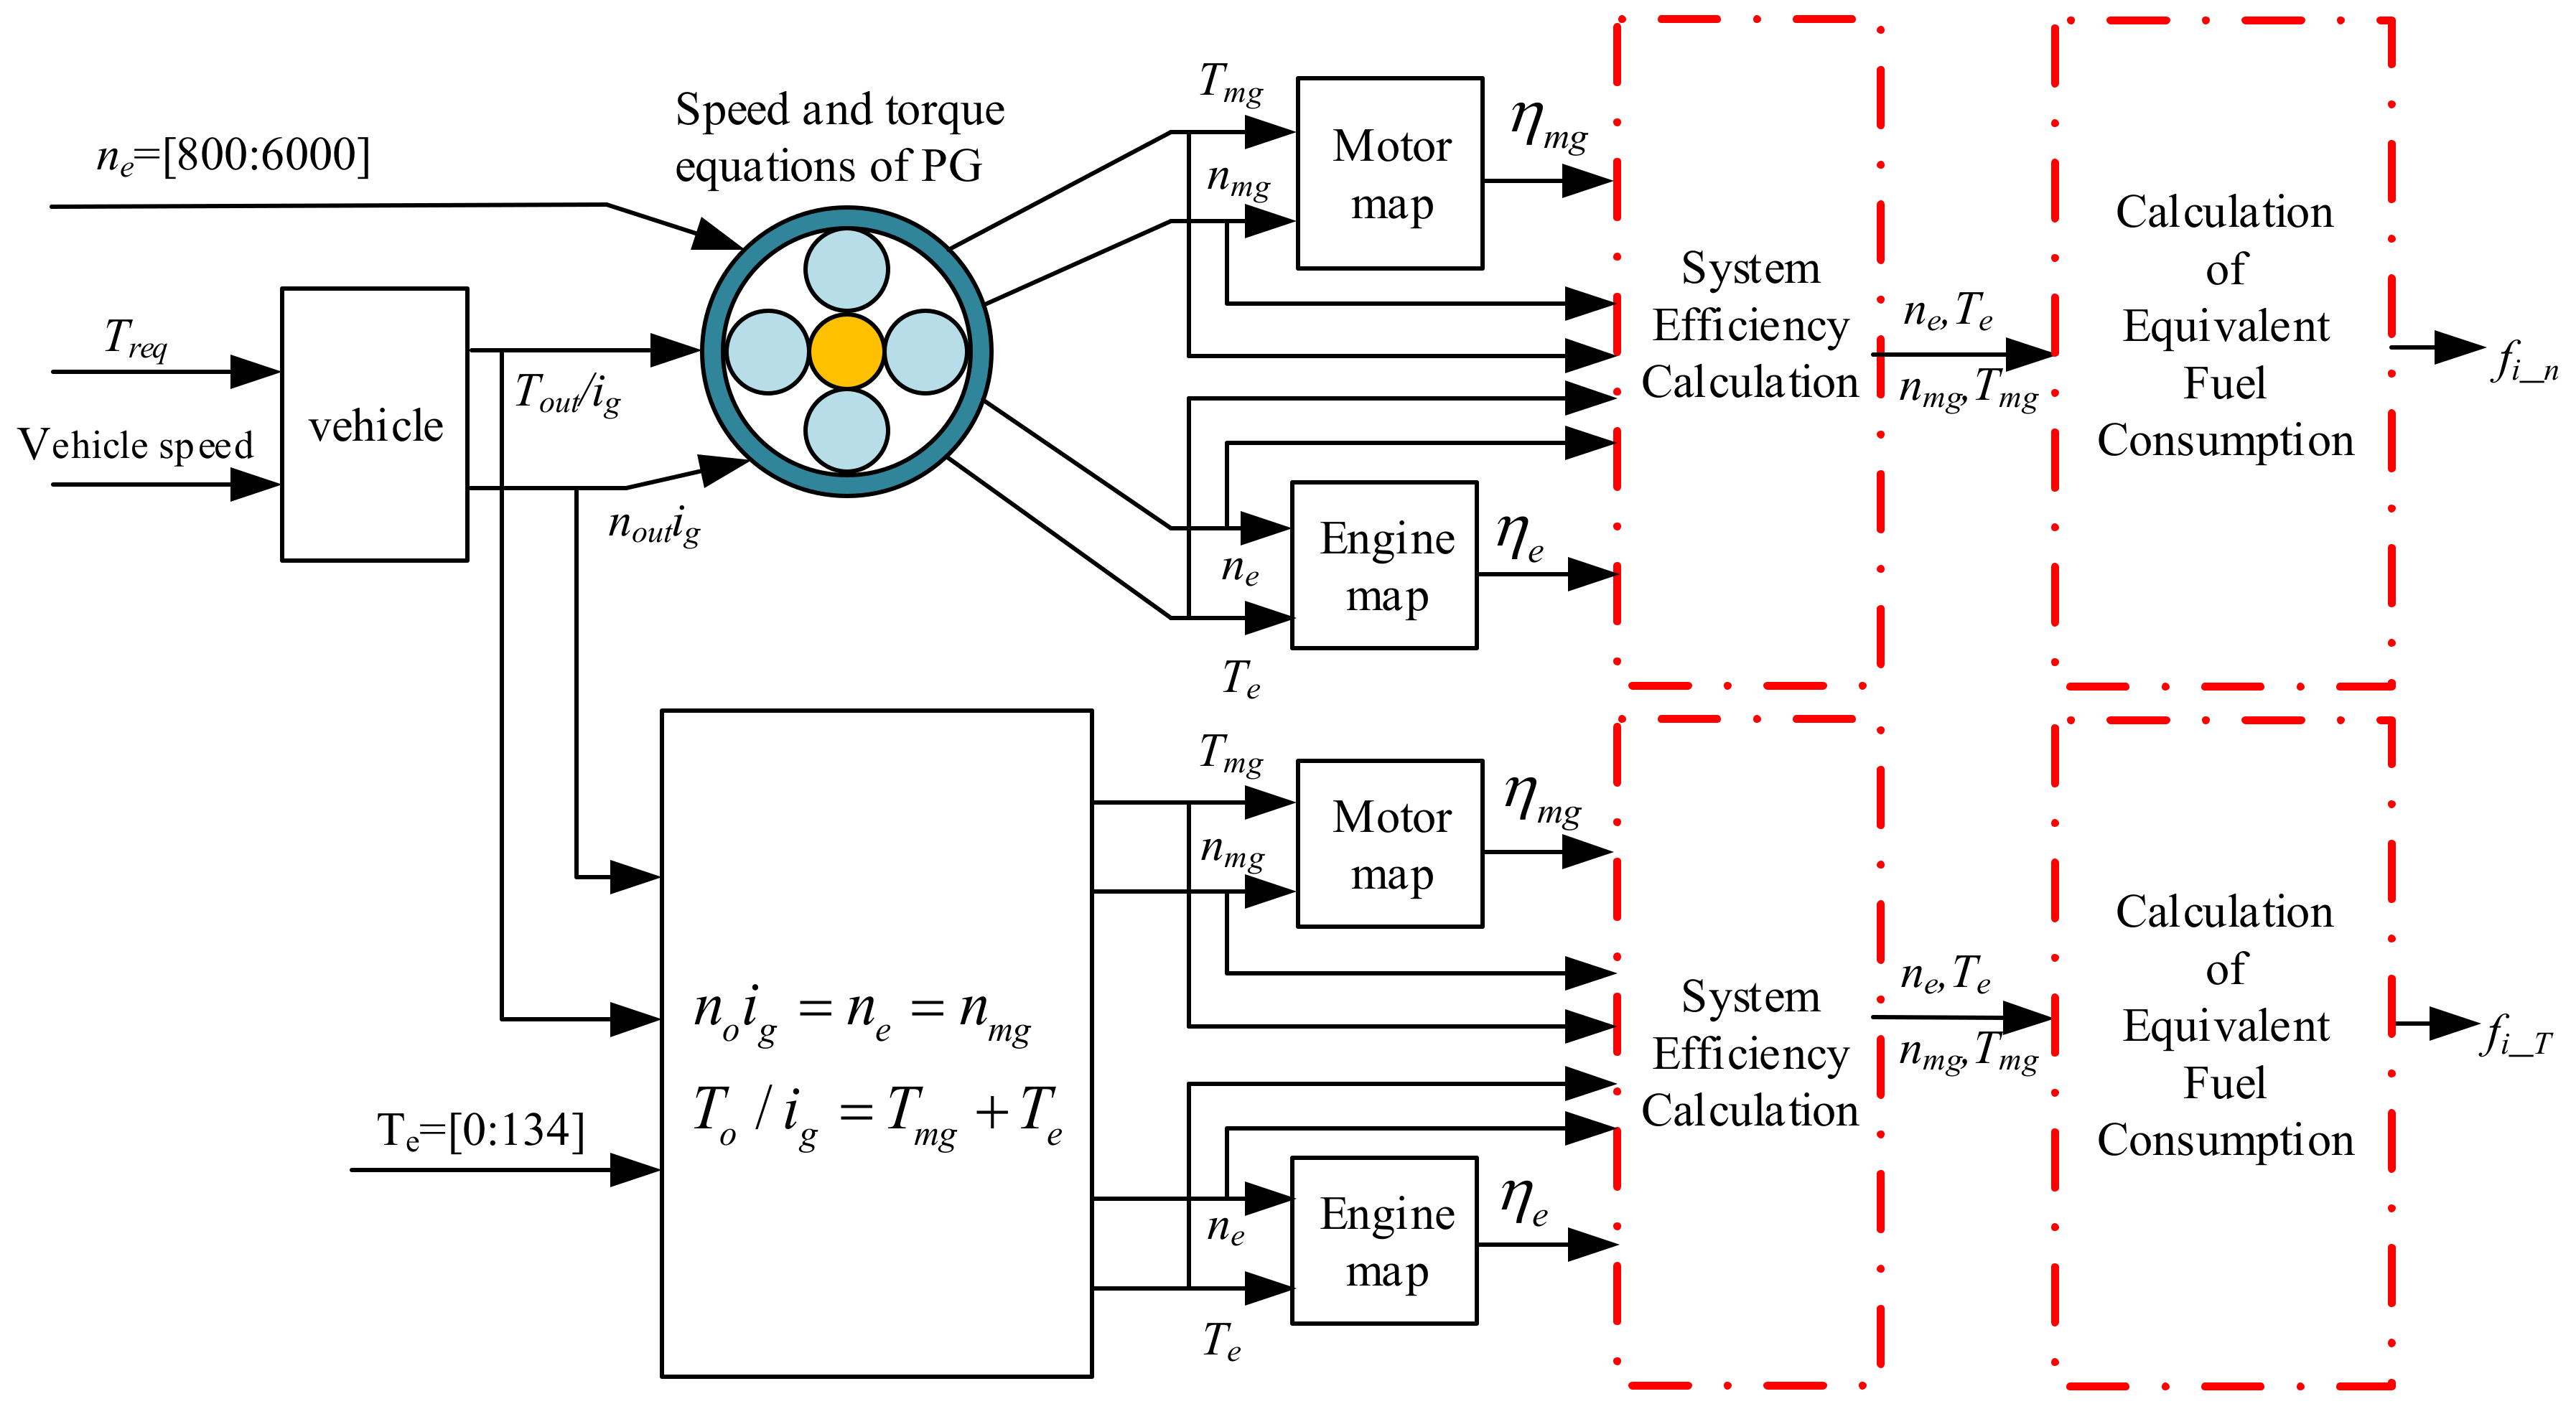
27]. Currently, there is no principle for the fuel-saving mechanism of HEVs (the engine works in the economic area under the coordinated control of the motor through the power coupling mechanism) to guide the design of HEV powertrains. Therefore, in this study, based on the fuel-saving mechanism of HEVs, a systematic design method for a single-motor hybrid power system was proposed. We optimized and screened the basic schemes of speed and torque coupling by four capability indicators. Thereafter, a configuration reconstruction was performed to further improve the configuration. Relying on the multiangle evaluation of each configuration scheme, the HEV powertrain configuration of a single motor with an ideal comprehensive performance was obtained. A chart of the design method is shown in Figure 1.
The contribution of this article is that it proposes a design method of basic configuration analysis, selection, reconstruction, and multiangle evaluation to generate and choose the feasible powertrain configuration solution.
This article is organized as follows. In Section 2, we focus on four aspects: speed-decoupling ability, torque-decoupling ability, electric power characteristics, and torque amplification ability. We analyzed the basic schemes of speed and torque and explored the working principle and characteristics of the basic decoupling ways. In Section 3, configuration reconstruction methods are studied. After introducing the indicator of adaptability, the multiangle evaluation method of configuration is established in Section 4; the optimal single-motor scheme S-4 is obtained. To verify the validity of the above works, Section 5 presents comparison performances between S-4 and the Toyota Hybrid System (THS). In Section 6, a summary and outlook of the study are provided.

2. Analyses on Basic Scheme

This study investigates the fuel-saving mechanism of an HEV, which adjusts the torque and speed of the engine with a motor to ensure that the engine working point is distributed in the high-efficiency area, and achieves the purpose of reducing fuel consumption. There are two factors affecting fuel saving: the distribution of engine operating points directly affects fuel consumption, and electric power loss indirectly affects the fuel-saving effect. Through research on means of speed coupling and torque coupling, in this section, we explore the performances of the basic schemes employing the two methods above. Moreover, we lay the foundation for the design of a complex hybrid power configuration.

2.1. Analyses of Basic Scheme of Speed Coupling

A PG is a typical speed-coupling mechanism, and basic schemes of speed coupling around the PG can be analyzed with the lever method. For a single PG, six basic schemes exist according to the connection position, as shown in Figure 2.
The speed and torque equations of a single PG set are as follows:
n c = k n R + n s 1 + k n c
T c = 1 + k T s = 1 + k T R k T c

2.1.1. Speed-Decoupling Capability

The ability to adjust the engine speed to the SER shown in Figure 3 can be used as an index to measure the speed-decoupling performance. The speed transmission ratio, in, is defined as the ratio of ne to nout. Therefore, determining the engine points distributed in the SER by in and nout along with the constraints of Equations (1) and (2) allows the evaluation of these schemes. The parameters of the power source used in this study are listed in Table 1. The speed-decoupling ability of the six basic schemes was calculated, as shown in Figure 4 and Table 2. The results show that schemes b and d have no speed-decoupling ability, and in the other schemes, the speed-decoupling ability is rapidly weakened with an increase in Tout.

2.1.2. Electric Power Characteristics

The proportion of electric power is defined as the absolute value of the MG power divided by the engine power under current working conditions [7,28,29,30], and it can characterize the mechanical transmission performance of the speed-coupling mechanism. It is expected that more engine power directly reaching the wheel through the mechanical path will avoid the energy loss caused by multiple power conversions of the electrical path. This could lower the peak power of the motor demand as well as the maximum charge and discharge power of the battery when the proportion of electric power is reduced. The electric power proportion of the six schemes was calculated, as shown in Figure 5. It can be observed that with the same k, schemes a and e have the best mechanical transmission characteristics, b and d have the worst, and c and f are average.

2.1.3. Torque Amplification Capability

The torque amplification capability represents the driving ability of the system, which has a significant influence on the climbing and acceleration performance of a vehicle. Considering the constraints of the external characteristics of the power sources and the torque balance equation of the PG, the relationships between the maximum Tout, k, and nout of each scheme were calculated, as shown in Figure 6. Among these schemes, the Tout of schemes a, b, and d decreases with the increase in k; the Tout of schemes e and f increases with the increase in k; however, the Tout of scheme c is less affected by k. For the maximum Tout, schemes b and d have poor torque transmission performance because of their quantities of Tout, whose maximum does not exceed 55 Nm; schemes a and c exhibit the best torque transmission performance; schemes e and f are average. As nout increases, the MG speed enters the constant-power region, and Tmg decreases. Therefore, the peak of Tout is limited. As shown by a, c, and f, the maximum Tout begins to bend downward and decreases sharply when nout reaches a certain value.

2.2. Analyses of Basic Scheme of Torque Coupling

The application of the torque-coupling scheme corresponds to a parallel HEV. The ability to adjust the engine torque to the TER in Figure 7 can be used as an index to measure the torque-decoupling performance. According to the position of the motor, three basic schemes can be obtained, as shown in Figure 8, in which the motor is placed in front of the transmission, in the transmission, and behind the transmission. In Scheme A, the motor gear was coupled with the engine gear. The motor gear in Scheme B is independent of the engine gear. Scheme C is a special case of Scheme B. The basic scheme of torque coupling is divided into two types: the first is the coupling of img and ie, and the second is that img is not related to ie. Here, the motor transmission ratio and engine transmission ratio are img and ie, respectively.

2.2.1. Torque-Decoupling Capability

In this section, the relationship between the torque-decoupling ability and the motor gear and engine gear is studied. The torque-coupling configuration satisfies Equations (4)–(6). Similar to the calculation of the speed economic region, the percentages of schemes in the torque economic region are calculated by the following formulas:
n e = n o u t / i o u t
n m g = n o u t / i m g
T o u t = T e i e + T m g i m g
In terms of Scheme a, Scheme b and Scheme c, six sub-schemes employing the parameters of Table 3 are analyzed: Scheme Ⅰ belongs to type 1, and the rest belong to type 2. In addition, all of them use the same six-gear transmission and final drive. Therefore, the relationships, as shown in Figure 9 and Table 4, between the torque-decoupling ability and motor gear are obtained in a similar manner to the calculation of speed-decoupling ability.
According to Figure 9, first, it is difficult to consider the decoupling ability of both high-speed and high-torque conditions with only motor gears, such as Scheme Ⅲ. Second, a better decoupling ability can be obtained under high-speed and high-torque conditions if the range of img is wider, such as in Scheme Ⅱ. Third, for Scheme Ⅰ, with a motor in front of the transmission, a strong torque-decoupling ability can be obtained without a complicated structure.
The influence of the engine gear (employing Scheme Ⅱ-a) on the torque-decoupling capability was analyzed, as shown in Figure 10. By maintaining the range of engine gear ratio unchanged, as shown in a–d, the decoupling ability weakens with a smaller number of engine gears; by ensuring that the number of engine gears is unchanged, as shown in e–h, decoupling ability weakens if the maximum gear ratio decreases or the smallest gear ratio increases.

2.2.2. Torque Amplification Capacity

The relationship between the peak Tout of the configurations and nout should be discussed using the same set of transmission ratios. Accordingly, the ki of Scheme Ⅰ and the img of Schemes Ⅱ and Ⅲ are optimized, employing an acceleration time of 0–100 km as the objective function. The optimization and simulation results of the maximum Tout are shown in Table 5, and all schemes have similar maximal Tout curve shapes. By comparison, Scheme Ⅰ has a better dynamic performance, with the shortest acceleration time and the highest peak Tout. In the second type of scheme, the dynamic performance of Ⅲ-a is significantly worse than that of the other schemes. For II-a and II-c, they do not require a significant number of motor gears, because the difference in power performance is not guaranteed, and there is no need to increase the motor gears at the expense of the system complexity.

2.3. Selection of Basic Scheme

Based on the above analysis of four aspects of the basic scheme of speed coupling, the selection of these schemes was conducted. Each indicator of the basic scheme is classified into five levels: A, good; B, slightly better; C, average; D, slightly worse; and E, bad. The results are shown in Table 6.
According to Table 6, Scheme a and Scheme c should be selected as the optimal basic scheme of speed coupling. We should avoid a situation in which a single coupling scheme, which is the average level, might be ideal after configuration reconstruction and topology design. Therefore, Scheme e and Scheme f were also selected.
In Table 4, Figure 10, and Table 5, the torque-decoupling ability and torque amplification ability of Scheme Ⅰ are typically close to Scheme Ⅱ; thus, both of them were selected as the basic torque-coupling schemes. Considering the decoupling performance and system complexity, the range of img and ie should be as large as possible, and the gear numbers of ie and img should not be significantly large. Subsequent works are based on these schemes and the conclusions above.

3. Reconstruction of Configuration

The decoupling of the hybrid power system depends on the motor to increase the decoupling ability of the system. A single-motor configuration can theoretically meet only one decoupling requirement. The basic schemes selected in Section 2 cannot be adapted to complex working conditions. Therefore, configuration reconstruction is conducted in combination with a clutch, braking devices, and four-speed transmission in this section.
Single-motor configurations after reconstruction can be divided into types S and T. S contains PG, whereas T does not. Configuration reconstruction of type S is based on the basic schemes of speed coupling and transmission. The arrangement of the PG and transmission should be considered. According to Equation (2), the factor determining the internal torque of the PG is the output torque, Tout. If transmission can decouple Tout from the wheel, the torque of the PG components can be well adjusted. Therefore, placing a transmission on the output shaft of the PG is the ideal choice. The scheme of torque coupling combined with transmission is analyzed in detail in Section 2.2.
Hybrid power systems should meet electric driving, engine driving, hybrid driving and braking energy recovery, and parking charging modes. Therefore, type S should add brakes to the engine shaft and motor shaft to realize the functions above. The clutch used for the PG can convert type S to type T. For type T, the above functions can be realized by adding a clutch between the engine and motor in type T. The obtained single-motor configurations are shown in Figure 11.

4. Optimization and Evaluation

4.1. Multi-Objective Optimization

4.1.1. Parameters and Premise

To analyze and evaluate the configuration, this section describes the multi-objective genetic algorithm optimization of the main parameters of the configuration. The optimization variables, including the speed ratio and characteristic parameters referring to practical experience values, are listed in Table 7.
Subsequent optimization and simulation require specific parameters of vehicle power and structure. With respect to a Mercedes Pullman saloon, the parameters are listed in Table 8. Engine and motor efficient maps are presented in Figure 12.

4.1.2. Objective Function

The configuration parameters were optimized by employing the acceleration time and fuel consumption as target functions. The time is relative to the maximal acceleration, which is a function of Tout, and the calculation processes of peak Tout are shown in Figure 13. The processes were divided into speed coupling and torque coupling.
Therefore, max Tout is obtained according to Formula (6).
T o u t _ m a x v = m a x T o u t _ m a x . i g 1 , T o u t _ m a x . i g 2 , , T o u t _ m a x . i g 4
The relationship between speed and rolling resistance is as follows:
F f v = m g f + 12.96 C d A v 2 21.15 + m g i
where i is the road gradient. Vehicle longitudinal acceleration, a, and acceleration time, t 100 , are expressed as follows.
a = m i n i 0 T o u t _ m a x v r , m g μ F f v δ m
t 100 = 0 100 3.6 1 a d v
Fuel consumption is determined by the driving cycle, operating modes, and efficiency of the power sources and transmissions. The WLTP cycle was used as the working condition input, as shown in Figure 14. The fuel consumption and engine working point distribution of the configuration were obtained under the control of the DP strategy. The minimal equivalent fuel consumption, fi, corresponding to each working point was calculated using the process shown in Figure 15 under two coupling methods.
System efficiency is calculated as follows:
η s y s = P m η m g + P r e q P e / η e       n m g T m g < 0 P r e q P m η m g + P e / η e     n m g T m g > 0
where ηsys represents system efficiency at both discharging and charging. The rate of fuel consumption is
b e ( η s y s ) = 3600 46 η s y s
where b e η s y s is the rate of fuel consumption in g/kWh considering system efficiency, and 46 is a constant related to the heating value of the fuel.
f i = P r e q b e
If it is a type S configuration, minimal fi can be obtained by comparing fi_n and fi_T to obtain the economy objective function, as follows:
o b j _ e c o = i = 1 1800 f i
The fitness function, shown in Formula (14), is the sum of the standardized target functions multiplied by weights. Parameters were optimized under different weights to obtain optimal results using the Pareto method.
f i t n e s s = w 1 o b j _ e c o 1000 + w 2 t 100 13
where w1 and w2 are the weights corresponding to the fuel consumption and acceleration time, respectively. In the economic target item, “1000” is a standardization parameter, and the unit is gram. Similarly, “13” is another standardized parameter, and the unit is second.

4.1.3. Constraints and Optimization Results

When the clutch engages, the dynamic equations of the S schemes are as follows:
n o i g = n e = n m g
T o i g = T m g + T e
The speed and torque equations of the S schemes when the clutch disengages and those of both T schemes are listed in Table 9, while multi-objective optimization results are shown in Table 10.

4.2. Evaluation and Analysis of Configuration

The best configuration can be selected by evaluating three aspects: dynamic property, economy, and adaption. The adaptability of the schemes concerns the economic performance of the configuration under different working conditions. The indicator of adaptability, fk, corresponding to one driving cycle is defined as:
f k = F u e l F u e l r e q ,  
F u e l r e q = 100 E 4.6 × 10 4 × 0.7 × s ,
E = P r e q d t
where Fuelreq (L/100 km), an ideal consumption made by the self-requirement of the working conditions, is not associated with the configuration. Fuel (L/100 km), which is determined by the configuration and working conditions, is a parameter of interest; E is the energy consumption calculated by the integral of Preq; Preq is the power demand at a certain moment; and s is the mileage corresponding to the working conditions.
Under the control of DP and four representative conditions, WLTP, HWFET, ARTERIAL, and LA92, the value of Fuel for each working condition can be obtained. The values of fk are listed in Table 11. The adaptability, f, of the configuration under the four working conditions can be calculated using Formula (18).
f = 1 n i = 1 n = 4 f k
In Table 12, three indicators for each scheme are listed. To comprehensively consider the indicators of these schemes, we need to normalize the three indicators by the standardization method of standard deviation presented in Equation (19).
y i j = x i j x j ¯ var ( x j )
where yij is the result of standardizing xij, x ¯ is an average from the indicator of a certain row, j, in Table 13, and var ( x j ) is the variance of the indicator of a certain row, j.
Standardization results are shown in Table 13 and Figure 16, where the lower the value, the better the performance of the scheme. Therefore, considering the economy, power performance, and adaptability comprehensively, the configuration S-4 corresponds to the optimal solution.

5. Simulation and Verification

To verify the validity of the proposed configuration design method and the configuration obtained using this method, this chapter analyzes two aspects of economy and power performance, including engine operating point adjustment ability, electrical power loss, output torque characteristics, and 0–100 km acceleration time. Currently, the most representative hybrid power system is THS [30,31]. Figure 17 shows its configuration. The parameters of the optimized THS are listed in Table 14.

5.1. Fuel Economy

By simulation under WLTC, the fuel consumption of THS is 4.68 L/100 km, and the consumption of S-4 is 4.74 L/100 km. There is no significant economic difference between the two configurations, which can be attributed to electric power loss and engine operating point distribution.
It can be observed from Table 15 and Figure 18 that the electric power loss of THS (>0.5 kW, 74.12%) is higher than that of S-4 (>0.5 kW, 20.11%). As shown in Table 16, fuel consumption (<260 g/kWh) is defined as high efficiency, and the proportion of S-4 that works at a high efficiency is 27.48% lower than that of THS.

5.2. Power Performance

The dynamic simulation results were obtained considering the maximum driving force of the wheel as the goal for determining the state of the power sources, as shown in Figure 19. When the speed < 141 km/h, the driving force of S-4 is higher than that of THS.
Because the wheel drive forces of S-4 and THS are opposite before and after 141 km/h, the red curve and the blue dashed line intersect at u = 180 km/h (time = 37.4 s). The accelerated simulation results are shown in Figure 20 and Table 17. S-4 exhibits power performance advantages. The acceleration time of 0–100 km/h for THS and S-4 are 13.5 s and 6.69 s, respectively.

6. Conclusions

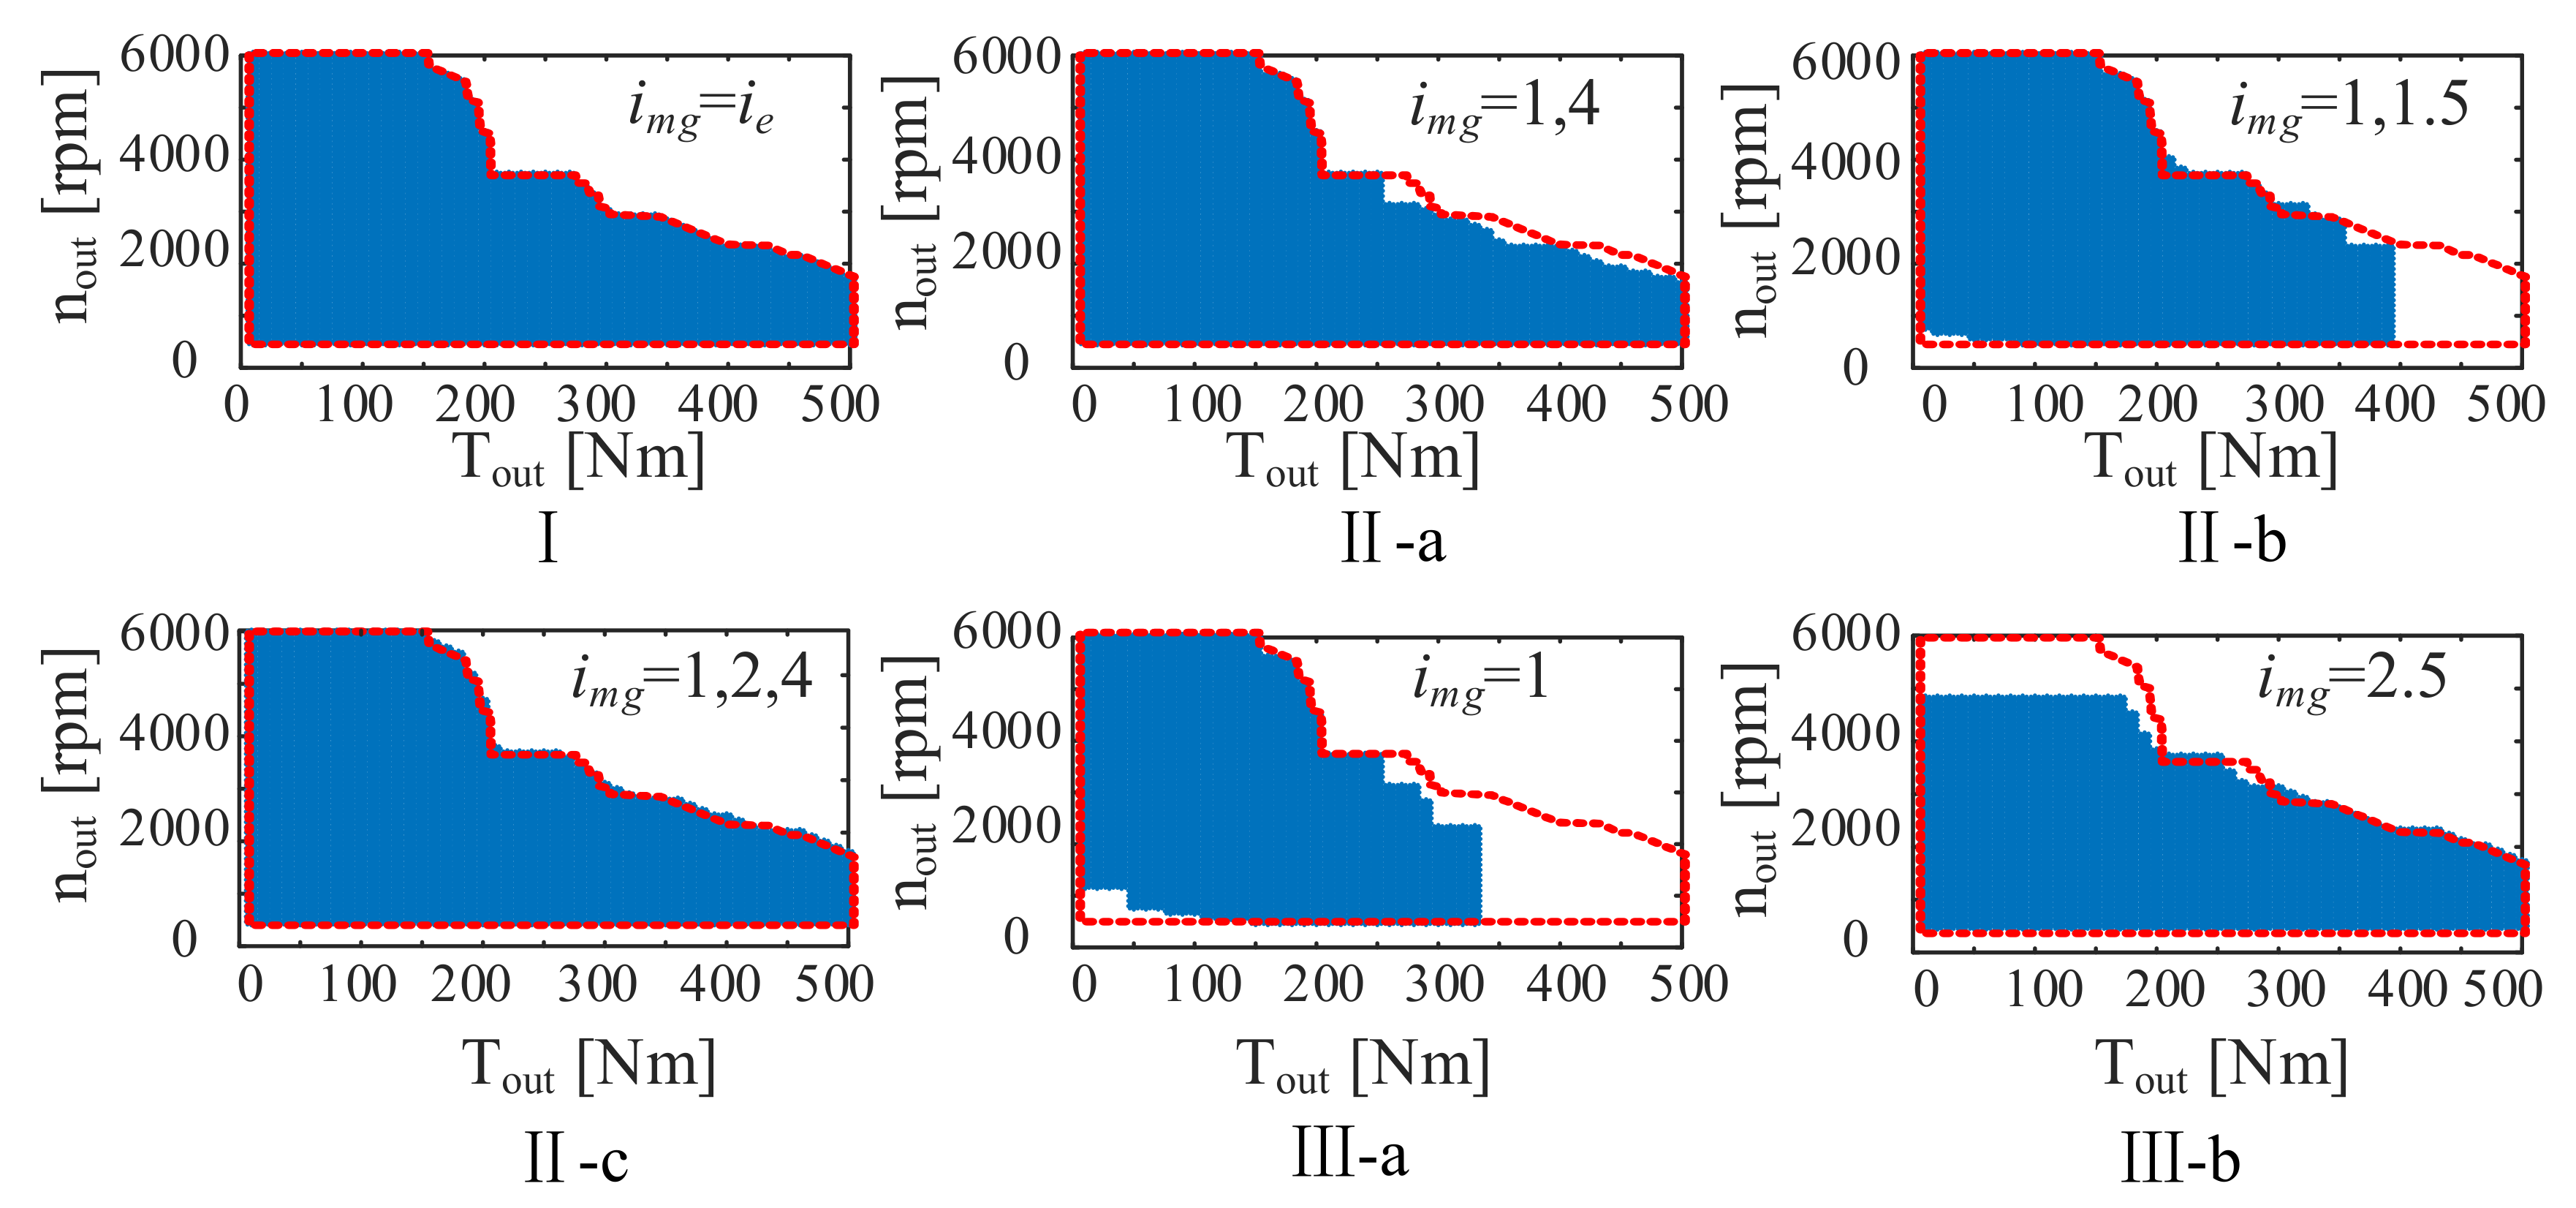
Based on the fuel-saving mechanism of HEVs, this study proposed a configuration design method. Considering a single-motor hybrid power system as the research object, four capability indicators, including speed-decoupling ability, torque-decoupling ability, electric power characteristics, and torque amplification ability, were proposed to analyze the characteristics of the basic speed and torque-coupling schemes, and six schemes were selected with respect to the four capabilities. To improve the chosen schemes, research on configuration reconstruction was conducted. By establishing a multiangle evaluation and selection method for power, economy, and working condition adaptability, the best configuration, S-4, was obtained from these feasible scheme sets. Comparing S-4 and THS by simulation analysis to verify the availability of the design method, it was found that the dynamic performance of S-4 is better than that of THS owing to S-4′s higher driving force. The times required to attain 100 km/h from 0 km/h for THS and S-4 are 13.5 s and 6.69 s, respectively. Furthermore, its economy is almost equal to that of THS: The consumption of S-4 is 4.74 L/100 km, the consumption of THS is 4.68 L/100 km. S-4 has lower electric loss, and THS works more in high-efficiency regions.
The contribution of this article is that it proposes a design method of basic (preliminary) configuration analysis, selection, reconstruction, and multiangle evaluation. The method based on a fuel-saving mechanism provides a clear thread to indicate configuration design without resorting to exhaustive search principles.
Dual-motor configurations or more complex hybrid power systems can be designed using this method. More performance indicators, such as cost and complexity, can be introduced to evaluate the configuration from the perspective of commercial products.

Author Contributions

Conceptualization, G.F., L.Z. and M.H.; methodology, G.F. and L.Z.; software, G.F., B.H. and L.Z.; validation, G.F. and L.Z.; formal analysis, B.H.; investigation, B.H.; resources, B.H.; data curation, B.H.; writing—original draft preparation, L.Z. and G.F.; writing—review and editing, L.Z.; visualization, L.Z. and Q.J.; supervision, M.H.; project administration, B.H. and M.H.; funding acquisition, B.H. and M.H. All authors have read and agreed to the published version of the manuscript.

Funding

This research was funded by the Foundation of Artificial Intelligence Key Laboratory of Sichuan Province grant number 2020RYY01, the National Natural Science Foundation of the People’s Republic of China grant number 52072053, the National Key R&D Program of China grant number 2018YFB0106102, and the Science and Technology Department of Sichuan Province grant 2021YFG0050.

Institutional Review Board Statement

Not applicable.

Informed Consent Statement

Not applicable.

Data Availability Statement

The data presented in this study are available on request from the corresponding author.

Acknowledgments

We all authors are greatly acknowledged for their financial support in making this research possible.

Conflicts of Interest

The authors declare no conflict of interest.

Nomenclature

H E V Hybrid electric vehicle
P G Planetary gear
S E R Speed economic range
T E R Torque economic range
M G Motor/generator
D P Dynamic programming
n e Speed of engine
n o u t Speed of PG’s output shaft
n s Speed of PG’s sun gear
n c Speed of PG’s carrier gear
n R Speed of PG’s ring gear
n m g Speed of motor/generator
T s Torque of PG’s sun gear
T R Torque of PG’s sun gear
T c Torque of PG’s carrier gear
T e Torque of engine
T o u t Torque of PG’s output shaft
T m g Speed of motor/generator
k Ratio of teeth number of PG ring gear to teeth number of PG sun gear
i e Ratio of engine speed
i g Speed ratio of transmission
i m g Speed ratio of motor
k i Coupling coefficient
t 100 Acceleration time of 0–100 km/h
WLTPWorld Light Vehicle Test Procedure
HWFETHighway Fuel Economy Test
ARTERIALARTERIAL Cycle
LA92California Unified Cycle

References

  1. Qing, L.; Feng, G. Summary and suggestions on new energy automobile industry development policies. In Proceedings of the 9th China Science and Technology Policy and Management Academic Annual Conference, Jinan, China, 26–27 October 2013; pp. 1–14. [Google Scholar]
  2. Eshani, M.; Gao, Y.; Gay, S.; Emadi, A. Modern Electric, Hybrid Electric, and Fuel Cell Vehicles; CRC Press: New York, NY, USA, 2009. [Google Scholar]
  3. Shi, D.; Pisu, P.; Chen, L.; Wang, S.; Wang, R. Control design and fuel economy investigation of power split HEV with energy regeneration of suspension. Appl. Energy 2016, 182, 576–589. [Google Scholar] [CrossRef]
  4. Yang, H.; Cho, S.; Kim, N.; Lim, W.; Cha, S. Analysis of planetary gear hybrid powertrain system part 1: Input split system. Int. J. Automot. Technol. 2007, 8, 771–780. [Google Scholar]
  5. Yang, H.; Kim, B.; Park, Y.; Lim, W.; Cha, S. Analysis of planetary gear hybrid powertrain system part 2: Output split system. Int. J. Automot. Technol. 2009, 10, 381–390. [Google Scholar] [CrossRef]
  6. Lei, Y.; Minghui, H. Parameter optimization and performance analysis of a new power split powertrain. J. Chongqing Univ. 2020, 43, 12–20. [Google Scholar]
  7. Shengdun, Z.; Xuesong, Y.; Hongwei, Y.; Yuanyuan, Y. Parameter optimization of a two mode planetary coupled hybrid electric power system. In Proceedings of the China Association for Science and Technology Annual Meeting, Beijing, China, 30 May 2016; pp. 27–31, 52. [Google Scholar]
  8. Wang, W.; Song, R.; Liu, S.; Zhai, X.; Cao, Y. An analysis on the configuration of dual-mode power-split hybrid powertrain system. Automot. Eng. 2015, 724, 648–654. [Google Scholar]
  9. Zhen, W.; Yahui, C.; Baohui, X.; Xiaofeng, X. Analysis and design of dual mode power split continuously variable transmission. J. Mech. Transm. 2020, 44, 49–58. [Google Scholar]
  10. Benford, H.; Leising, M. The Lever Analogy: A New Tool in Transmission Analysis; SAE Technical Paper No. 810102; SAE International: Warrendale, PA, USA, 1981. [Google Scholar] [CrossRef]
  11. Yan, H.-S. A methodology for creative mechanism design. Mech. Mach. Theory 1992, 27, 235–242. [Google Scholar] [CrossRef]
  12. West, D.B. Introduction to Graph Theory; Pearson College Div: New York, NY, USA, 2006. [Google Scholar]
  13. Yan, H.-S.; Chiu, Y.-T. An algorithm for the construction of generalized kinematic chains. Mech. Mach. Theory 2013, 62, 75–98. [Google Scholar] [CrossRef]
  14. Yan, H.-S.; Chiu, Y.-T. An improved algorithm for the construction of generalized kinematic chains. Mech. Mach. Theory 2014, 78, 229–247. [Google Scholar] [CrossRef]
  15. Hoang, N.-T.; Yan, H.-S. Configuration Synthesis of Novel Series-Parallel Hybrid Transmission Systems with Eight-Bar Mechanisms. Energies 2017, 10, 1044. [Google Scholar] [CrossRef] [Green Version]
  16. Ngo, H.-T.; Yan, H.-S. Configuration synthesis of parallel hybrid transmissions. Mech. Mach. Theory 2016, 97, 51–71. [Google Scholar] [CrossRef]
  17. Tao, D.; Hao, Z.; Peng, T. Research on structural innovation design of parallel hybrid powertrain. Automot. Eng. 2018, 40, 997–1004. [Google Scholar]
  18. Yang, Y.; Mi, J.; Hu, X.; Qin, D. Graph theory modeling and dynamics analysis on the coupled planetary transmission system of HEV. Automot. Eng. 2015, 54, 9–15. [Google Scholar]
  19. Yalian, Y.; Qiyuan, D.; Qiangshou, L. A neural network fuel consumption model hybrid of EVT system. J. Chongqing Univ. 2019, 42, 1–9. [Google Scholar]
  20. Deng, T.; Tang, P.; Su, Z.; Luo, Y. Systematic Design and Optimization Method of Multimode Hybrid Electric Vehicles Based on Equivalent Tree Graph. IEEE Trans. Power Electron. 2020, 35, 13465–13474. [Google Scholar] [CrossRef]
  21. Kang, J.; Kim, H.; Kum, D. Systematic Design of Input- and Output-Split Hybrid Electric Vehicles with a Speed Reduction/Multiplication Gear Using Simplified-Lever Model. IEEE Trans. Intell. Transp. Syst. 2019, 21, 3799–3810. [Google Scholar] [CrossRef]
  22. Liu, J.; Peng, H. A systematic design approach for two planetary gear split hybrid vehicles. Veh. Syst. Dyn. 2010, 48, 1395–1412. [Google Scholar] [CrossRef]
  23. Jiang, X.; Hu, J.; Peng, H.; Chen, Z. A Design Methodology for Hybrid Electric Vehicle Powertrain Configurations with Planetary Gear Sets. J. Mech. Des. 2020, 143, 1–16. [Google Scholar] [CrossRef]
  24. Zhang, X.; Li, S.E.; Peng, H.; Sun, J. Efficient Exhaustive Search of Power-Split Hybrid Powertrains with Multiple Planetary Gears and Clutches. J. Dyn. Syst. Meas. Control 2015, 137, 121006. [Google Scholar] [CrossRef]
  25. Peng, H.; Qin, D.; Hu, J.; Fu, C. Synthesis and analysis method for powertrain configuration of single motor hybrid electric vehicle. Mech. Mach. Theory 2019, 146, 103731. [Google Scholar] [CrossRef]
  26. Gu, J.; Zhao, Z.; Chen, Y.; He, L.; Zhan, X. Integrated optimal design of configuration and parameter of multimode hybrid powertrain system with two planetary gears. Mech. Mach. Theory 2019, 143, 103630. [Google Scholar] [CrossRef]
  27. Silvas, E.; Hofman, T.; Serebrenik, A.; Steinbuch, M. Functional and Cost-Based Automatic Generator for Hybrid Vehicles Topologies. IEEE/ASME Trans. Mechatron. 2015, 20, 1561–1572. [Google Scholar] [CrossRef] [Green Version]
  28. Gupta, A.; Ramanarayanan, C. Analysis of circulating power within hybrid electric vehicle transmissions. Mech. Mach. Theory 2013, 64, 131–143. [Google Scholar] [CrossRef]
  29. Kim, H.; Kum, D. Comprehensive Design Methodology of Input- and Output-Split Hybrid Electric Vehicles: In Search of Optimal Configuration. IEEE/ASME Trans. Mechatron. 2016, 21, 2912–2923. [Google Scholar] [CrossRef]
  30. Wang, W.; Song, R.; Guo, M.; Liu, S. Analysis on compound-split configuration of power-split hybrid electric vehicle. Mech. Mach. Theory 2014, 78, 272–288. [Google Scholar] [CrossRef]
  31. Suzuki, Y.; Nishimine, A.; Baba, S.; Miyasaka, K.; Tsuchida, M.; Endo, H.; Yamamura, N.; Miyazaki, T. Development of New Plug-in Hybrid Transaxle for Compact-Class Vehicles; SAE Technical Paper; SAE International: Warrendale, PA, USA, 2017. [Google Scholar]
Figure 1. Design progress.
Sustainability 14 08225 g001
Figure 2. Six basic schemes of speed coupling based on a single planetary set.
Sustainability 14 08225 g002
Figure 3. Speed economic region.
Sustainability 14 08225 g003
Figure 4. Speed-decoupling ability of six basic schemes.
Sustainability 14 08225 g004
Figure 5. Characteristic of electric power of the six configurations.
Sustainability 14 08225 g005
Figure 6. Relationships of Tout, k, and nout.
Sustainability 14 08225 g006aSustainability 14 08225 g006b
Figure 7. Torque economic region.
Sustainability 14 08225 g007
Figure 8. Basic schemes of torque coupling.
Sustainability 14 08225 g008
Figure 9. Simulation results of torque-decoupling capability.
Sustainability 14 08225 g009
Figure 10. Influence law of ie based on Scheme Ⅱ-a.
Sustainability 14 08225 g010
Figure 11. Reconstruction of configuration results. (a) Reconstruction of the S schemes. (b) Reconstruction of T schemes.
Sustainability 14 08225 g011
Figure 12. Power sources map. (a) Engine map. (b) Motor map.
Sustainability 14 08225 g012
Figure 13. Calculation process of max Tout. (a) Calculation process of speed-coupling scheme. (b) Calculation process of the torque-coupling scheme.
Sustainability 14 08225 g013
Figure 14. WLTP operating conditions.
Sustainability 14 08225 g014
Figure 15. Equivalent fuel consumption calculation process.
Sustainability 14 08225 g015
Figure 16. Multiangle evaluation of configuration.
Sustainability 14 08225 g016
Figure 17. THS configuration.
Sustainability 14 08225 g017
Figure 18. Distribution of engine operating points.
Sustainability 14 08225 g018
Figure 19. Vehicle driving force and resistance.
Sustainability 14 08225 g019
Figure 20. Vehicle speed simulation.
Sustainability 14 08225 g020
Table 1. Parameters of power sources.
Power SourceParameterValueUnit
MGRated power50kw
Rated/maximum speed4000/12,000rpm
Peak torque120Nm
EngineMaximum power63kw
Peak torque138 (@3900 rpm)Nm
Speed range800–6000rpm
Table 2. Quantitative results of speed-decoupling ability.
Schemeabcdef
Percentage of decoupling region40.39%046.98%029.44%33.25%
Table 3. Parameters of six schemes of torque coupling.
TypeSchemeMG in Front of
Transmission
MG in
Transmission
MG behind of Transmission
1img = ie
2Ⅱ-aimg1 = 1, img2 = 4
Ⅱ-bimg1 = 1, img2 = 1.5
Ⅱ-cimg1 = 1, img2 = 2, img3 = 4
Ⅲ-aimg = 1
Ⅲ-bimg = 2
Table 4. Quantitative results of torque-decoupling capability.
SchemeⅡ-aⅡ-bⅡ-cⅢ-aⅢ-b
Decoupling region50.8%51.9%45.1%56.7%39%44%
Table 5. Peak Tout simulation results of torque coupling.
SchemeParameters of Optimization t 100 Curve of Speed-Tout
Scheme Ⅰki = 1.38
(img = kiie)
7.05 s Sustainability 14 08225 i001
Scheme Ⅱ-aimg1 = 4
img2 = 1.5
7.24 s Sustainability 14 08225 i002
Scheme Ⅱ-cimg1 = 4
img2 = 2.49
img3 = 1.83
7.18 s Sustainability 14 08225 i003
Scheme Ⅲ-aimg = 28.55 s Sustainability 14 08225 i004
Table 6. Classification table of evaluation.
ProjectABCDE
Speed-decoupling abilitycae, fb, d
Electrical power characteristiceac, fb, d
Torque amplification capabilityace, fb, d
Table 7. Variable scope.
VariableScopeMax Quantity
Speed ratio of transmission–engine (ie)0.5–54
Speed ratio of transmission–motor (img)0.5–52
Coupling coefficient (ki)0.5–21
PG characteristic parameter (k)1.5–41
Final drive ratio (i0)3–61
Table 8. Vehicle parameter specification.
ParameterValueUnit
Curb weight (m)1760kg
Frontal area (A)2.5m2
Drag coefficient (Cd)0.313-
Mass conversion factor (δ)1.04-
Tire radius (r)0.347m
Adhesion coefficient (μ)0.9-
Rolling resistance coefficient (f)0.015-
Motor/Generator rated power62kw
Motor/Generator rated speed4000/9000rpm
Motor/Generator peak torque150N∙m
Engine max power63kw
Engine peak torque138(@3900 rpm)N∙m
Engine speed scope800–6000rpm
Table 9. Speed and torque equations of S and T configurations.
SchemeSpeed EquationTorque Equation
S-1 n o i g = k n e + n m g ( 1 + k ) T o i g = 1 + k T m g = 1 + k T e k
S-2 n o i g = k n m g + n e 1 + k T o i g = 1 + k T e = 1 + k T m g k
S-3 n o i g = 1 + k n m g n e k T o i g = k T e = k T m g ( 1 + k )
S-4 n o i g = 1 + k n e n m g k T o i g = k T m g = k T e ( 1 + k )
T-1 n e = n o i e , n m g = n o i e k i T o i e = T e + T m g k i
T-2 n e = n o i e , n m g = n o i m g T o = T e i e + T m g i m g
Table 10. Multi-objective optimization results of configuration.
Schemeki0ie1ie2ie3ie4kiimg1img2
S-11.985.6942.181.430.63
S-21.515.142.051.440.69
S-33.164.5842.281.60.78
S-41.55.9742.391.471.07
T-15.513.91.831.210.651.5
T-24.753.932.31.540.763.981.51
Table 11. Adaptability simulation results under working conditions.
fkHWFETARTERIALLA92WLTC
S-12.96 4.78 2.72 2.83
S-22.97 4.74 2.76 2.82
S-32.80 4.66 2.79 2.80
S-42.89 4.54 2.73 2.80
T-13.35 5.52 2.83 2.88
T-23.44 5.62 2.86 2.89
Table 12. Configuration performance analysis results.
IndicatorS-1S-2S-3S-4T-1T-2
Fuel consumption (L/100 km)4.784.764.744.744.864.88
Acceleration time
0–100 km(s)
7.447.727.947.649.447.83
Adaptability f3.323.32 3.26 3.24 3.64 3.70
Table 13. Standardization results of configuration performance.
IndicatorS-1S-2S-3S-4T-1T-2
Economy −0.22 −0.54 −0.87 −0.87 1.08 1.41
Dynamic property−0.77 −0.39 −0.09 −0.50 1.98 −0.24
Adaptability −0.46−0.46−0.76−0.861.121.42
Table 14. Optimized parameters of THS.
Parameterki0imgir
value2.783.911.481
Table 15. Electric power-loss statistics.
Power Loss (kW)<0.30.3–0.40.4–0.50.5–0.80.8–11–1.5>1.5
THS (%)17.293.225.3619.316.8929.628.31
S-4 (%)68.236.035.6311.135.53.080.4
Table 16. Fuel consumption rate statistics.
Fuel Consumption (g/kWh)<260260–280280–300300–320320–350350–380>380
THS (%)67.699.796.842.413.498.711.07
S-4 (%)40.2122.6510.325.768.186.846.03
Table 17. Summary of simulation results.
Fuel Consumption/(L/100 km)Acceleration Time/(s)Maximum Speed/(km/h)
0–50 km0–100 km
THS4.685.8813.5205
S-44.741.796.69213
Difference−0.064.096.818
Publisher’s Note: MDPI stays neutral with regard to jurisdictional claims in published maps and institutional affiliations.

