
The Influence of Consumption Context on Indulgent Versus Healthy Yoghurts: Exploring the Relationship between the Associated Emotions and the Actual Choices


Abstract
:1. Introduction
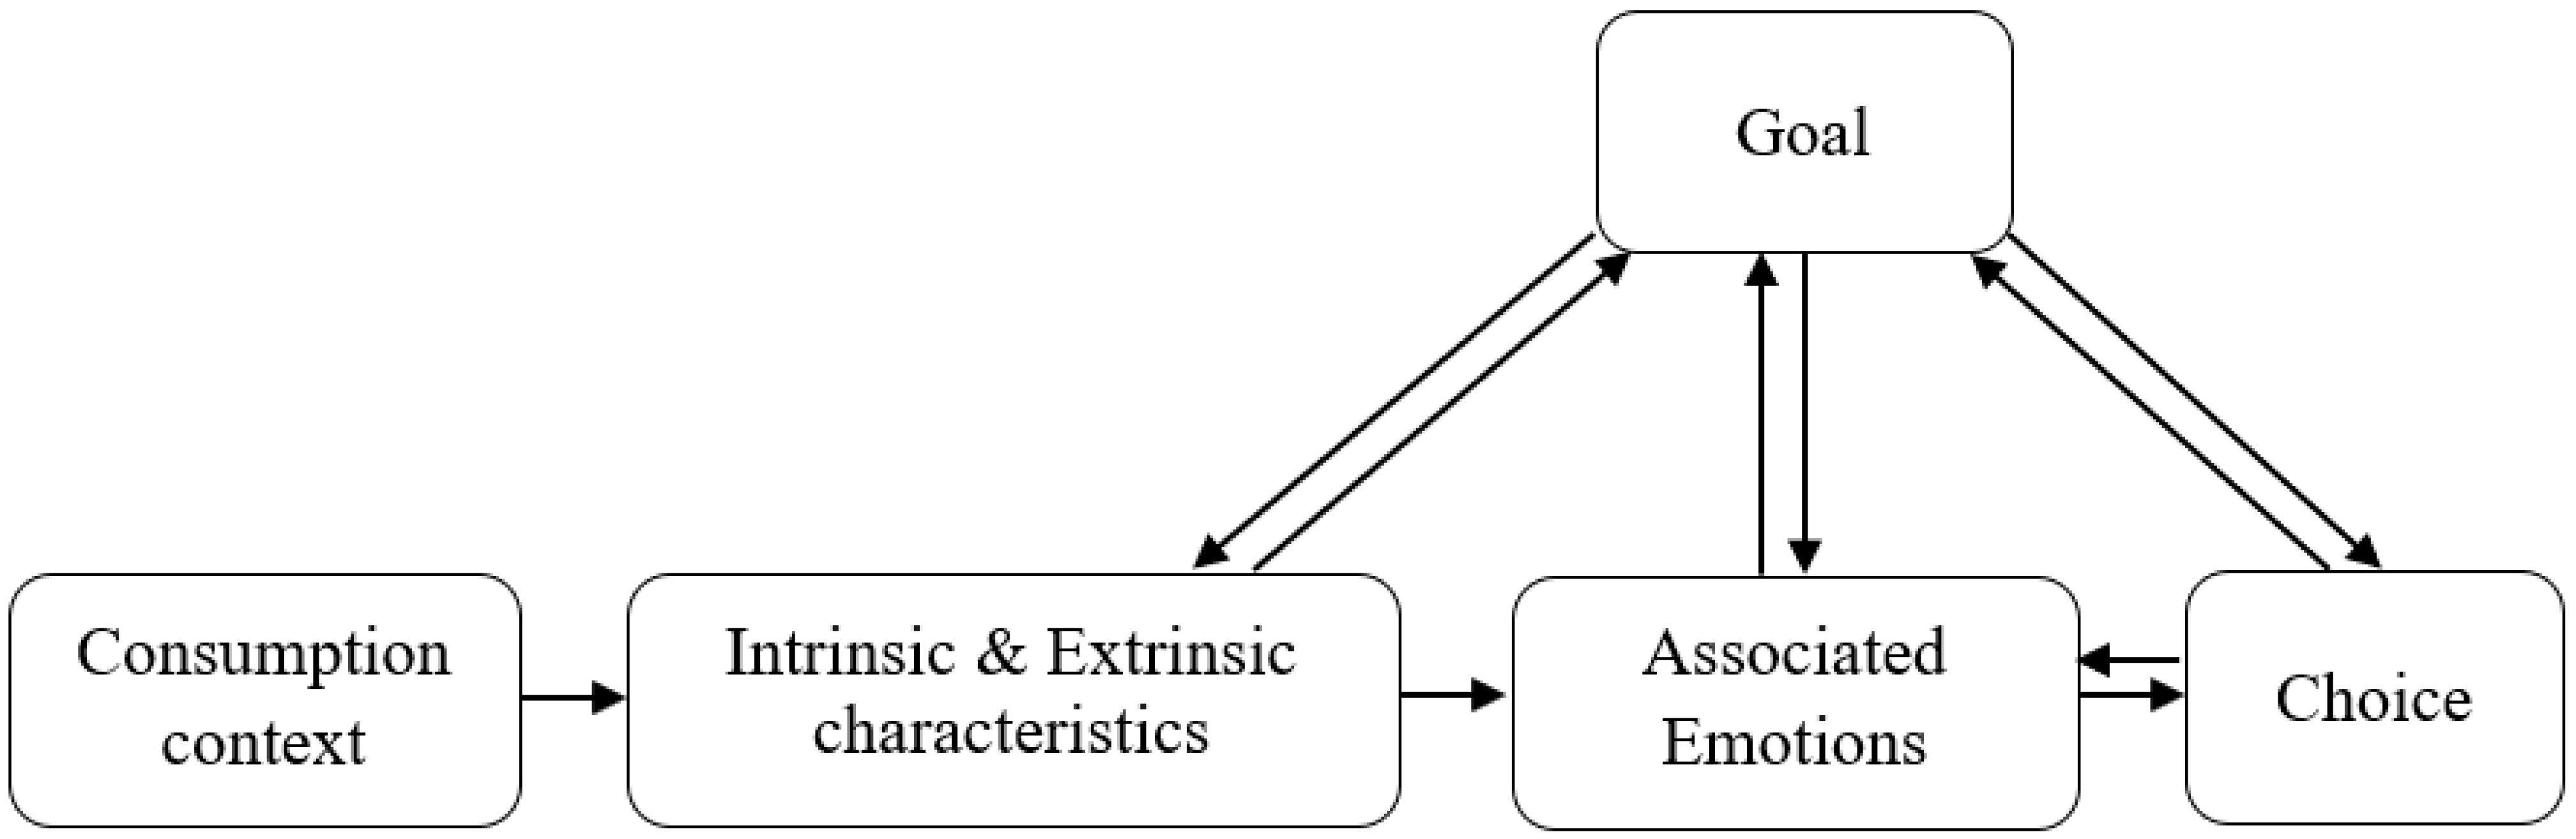
Conceptual Framework and Hypotheses
2. Methods
2.1. Participants
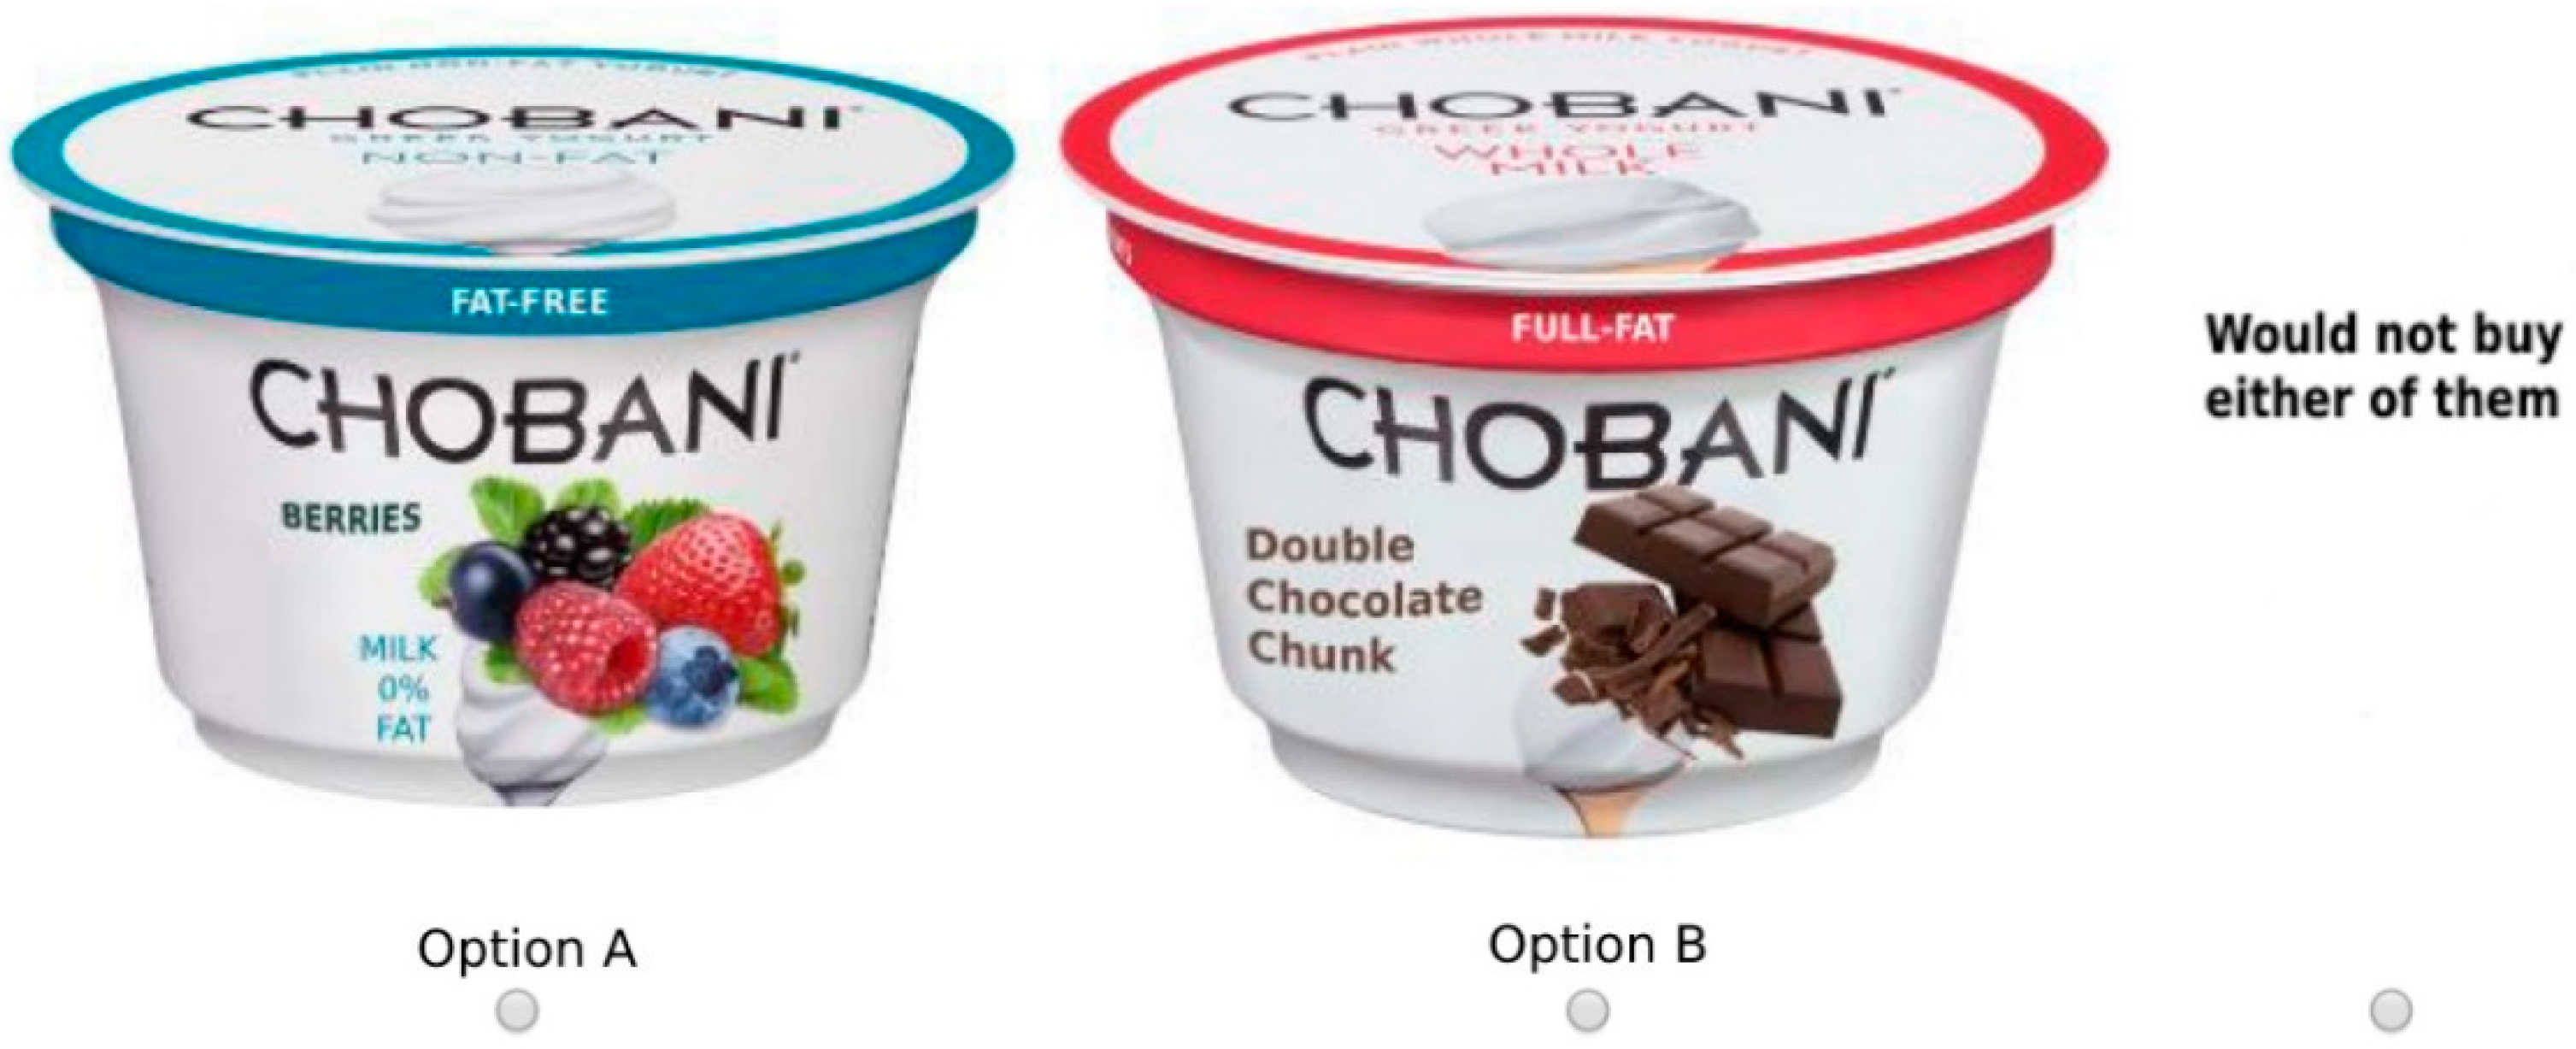
2.2. Stimuli
2.3. Procedure
2.4. Data Analysis
2.4.1. Statistical Analysis of the Emotional Variables
2.4.2. Econometric Specification—Discrete Choice Experiment
2.5. Relationship between Product Choices and Associated Emotions
3. Results
3.1. Sample Characteristics
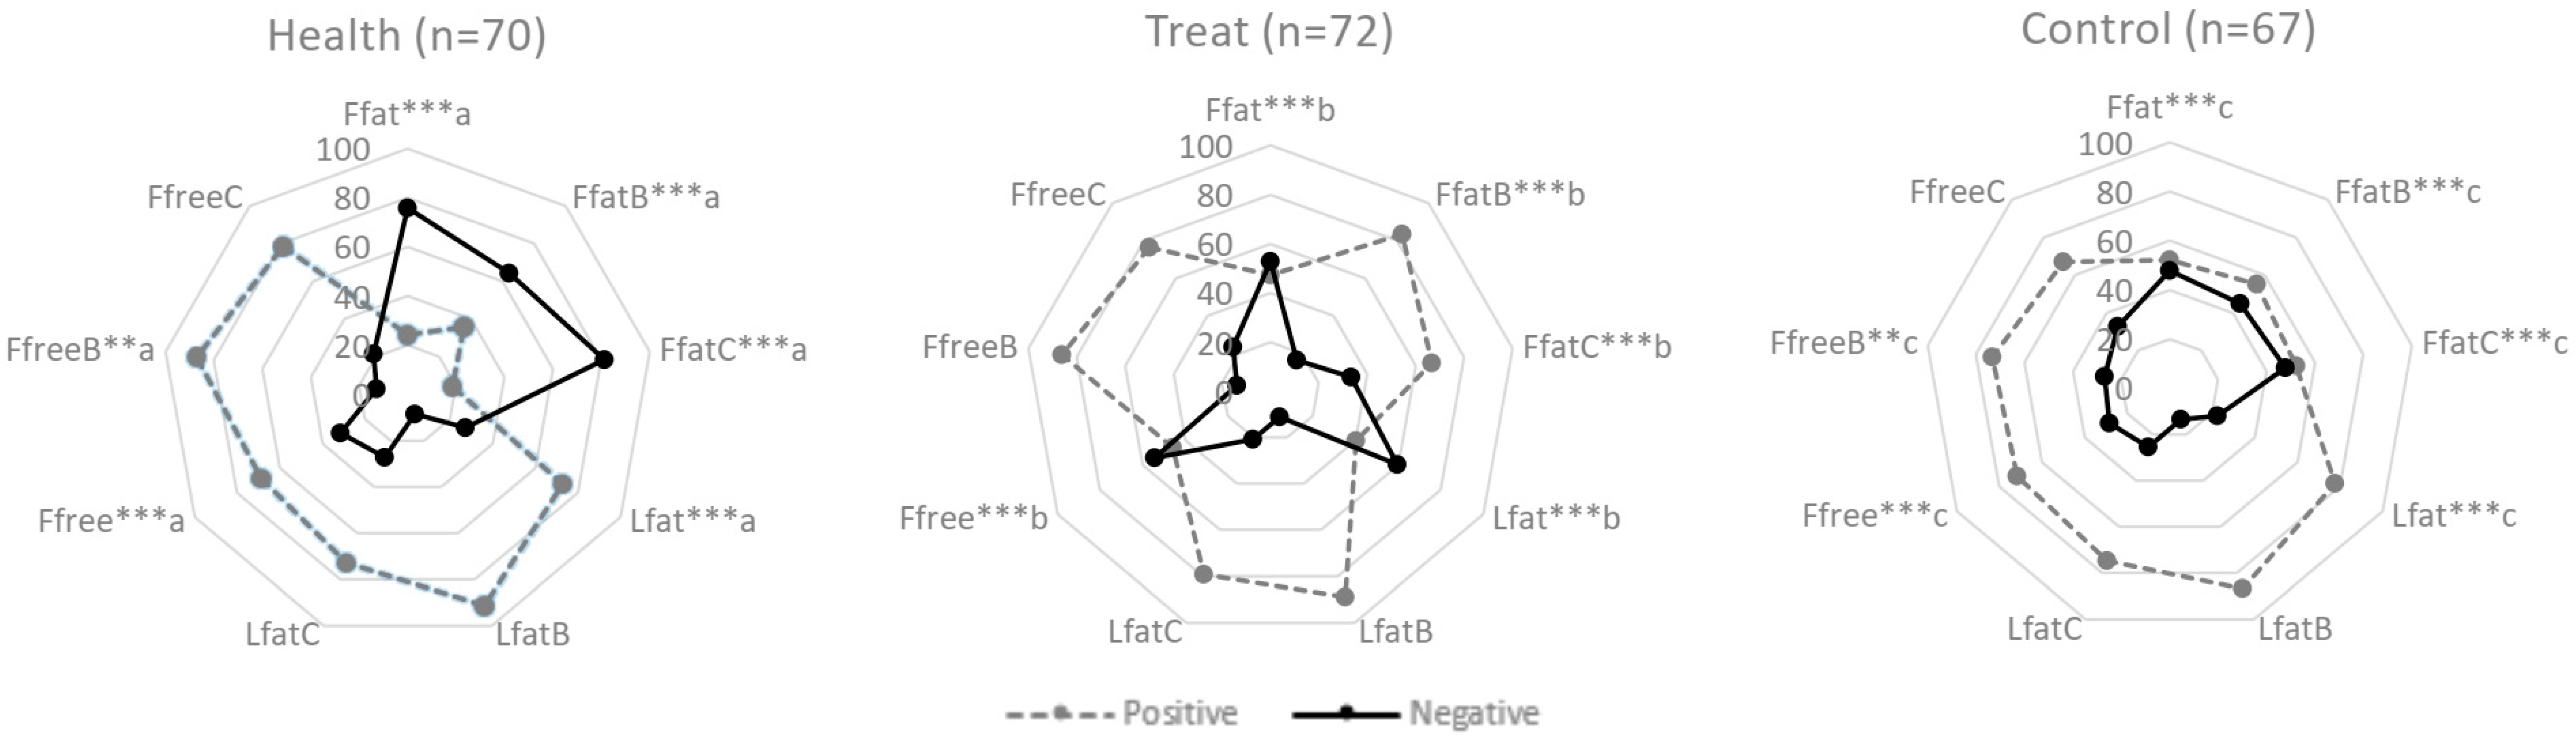
3.2. Consumption Context: Descriptive Analysis of the Associated Emotions
3.3. Estimates from the Random Parameter Logit Model
4. Discussion
5. Conclusions
Author Contributions
Funding
Institutional Review Board Statement
Informed Consent Statement
Acknowledgments
Conflicts of Interest
Abbreviations
Appendix A

| No. | NC Levels | Sensory Properties |
|---|---|---|
| 1 | Full-fat | Plain |
| 2 | Low-fat | With berries |
| 3 | Fat-free | With double chocolate chunk |
References
- Loebnitz, N.; Grunert, K.G. Impact of Self-Health Awareness and Perceived Product Benefits on Purchase Intentions for Hedonic and Utilitarian Foods with Nutrition Claims. Food Qual. Prefer. 2018, 64, 221–231. [Google Scholar] [CrossRef]
- De-Magistris, T.; Gracia, A. Do Consumers Care about Organic and Distance Labels? An Empirical Analysis in Spain. Int. J. Consum. Stud. 2014, 38, 660–669. [Google Scholar] [CrossRef]
- Smith, R. Regulation (EC) No 1924/2006 of the European Parliament and of the Council. In Core EU Legislation; Macmillan Education: London, UK, 2015; pp. 183–186. ISBN 978-1-137-54501-5. [Google Scholar]
- Ballco, P.; de-Magistris, T. Valuation of Nutritional and Health Claims for Yoghurts in Spain: A He-donic Price Approach. Span. J. Agric. Res. 2018, 16, e0108. [Google Scholar] [CrossRef]
- Ballco, P.; de-Magistris, T.; Caputo, V. Consumer Preferences for Nutritional Claims: An Exploration of Attention and Choice Based on an Eye-Tracking Choice Experiment. Food Res. Int. 2019, 116, 37–48. [Google Scholar] [CrossRef]
- Jurado, F.; Gracia, A. Does the Valuation of Nutritional Claims Differ among Consumers? Insights from Spain. Nutrients 2017, 9, 132. [Google Scholar] [CrossRef] [Green Version]
- Bialkova, S.; Sasse, L.; Fenko, A. The Role of Nutrition Labels and Advertising Claims in Altering Consumers’ Evaluation and Choice. Appetite 2016, 96, 38–46. [Google Scholar] [CrossRef]
- Suzuki, S.; Park, J. Consumer Evaluation of Healthy, Unpleasant-Tasting Food and the Post-Taste Effect of Positive Information. Food Qual. Prefer. 2018, 66, 107–110. [Google Scholar] [CrossRef]
- Hamblin, J. A Credibility Crisis in Food Science. Available online: https://www.theatlantic.com/health/archive/2018/09/what-is-food-science/571105/ (accessed on 24 February 2019).
- Dhar, R.; Wertenbroch, K. Consumer Choice between Hedonic and Utilitarian Goods. J. Mark. Res. 2000, 37, 60–71. [Google Scholar] [CrossRef]
- Chandon, P.; Wansink, B. The Biasing Health Halos of Fast-Food Restaurant Health Claims: Lower Calorie Estimates and Higher Side-Dish Consumption Intentions. J. Consum. Res. 2007, 34, 301–314. [Google Scholar] [CrossRef] [Green Version]
- de Andrade, J.C.; Nalério, É.S.; Giongo, C.; de Barcellos, M.D.; Ares, G.; Deliza, R. Influence of Evoked Contexts on Rating-Based Conjoint Analysis: Case Study with Lamb Meat. Food Qual. Prefer. 2016, 53, 168–175. [Google Scholar] [CrossRef]
- Köster, E.P. Diversity in the Determinants of Food Choice: A Psychological Perspective. Food Qual. Prefer. 2009, 20, 70–82. [Google Scholar] [CrossRef]
- Carver, C.S.; Scheier, M.F. Control Theory: A Useful Conceptual Framework for Personality–Social, Clinical, and Health Psychology. Psychol. Bull. 1982, 92, 111–135. [Google Scholar] [CrossRef] [PubMed]
- Fishbach, A.; Friedman, R.S.; Kruglanski, A.W. Leading Us Not into Temptation: Momentary Allurements Elicit Overriding Goal Activation. J. Pers. Soc. Psychol. 2003, 84, 296–309. [Google Scholar] [CrossRef] [PubMed]
- Barsalou, L.W. Deriving Categories to Achieve Goals. In Psychology of Learning and Motivation; Bower, G.H., Ed.; Academic Press: Cambridge, MA, USA, 1991; Volume 27, pp. 1–64. [Google Scholar]
- Jakubanecs, A.; Fedorikhin, A.; Iversen, N.M. Consumer Responses to Hedonic Food Products: Healthy Cake or Indulgent Cake? Could Dialecticism Be the Answer? J. Bus. Res. 2018, 91, 221–232. [Google Scholar] [CrossRef] [Green Version]
- Ratneshwar, S.; Pechmann, C.; Shocker, A.D. Goal-Derived Categories and the Antecedents of Across-Category Consideration. J. Consum. Res. 1996, 23, 240–250. [Google Scholar] [CrossRef]
- Johnson, A.R.; Stewart, D.W. A Reappraisal of the Role of Emotion in Consumer Behavior. In Review of Marketing Research; Emerald Group Publishing Limited: Bingley, UK, 2005; Volume 1, pp. 3–34. [Google Scholar]
- Mellers, B.A.; McGraw, A.P. Anticipated Emotions as Guides to Choice. Curr. Dir. Psychol. Sci. 2001, 10, 210–214. [Google Scholar] [CrossRef]
- Rivis, A.; Sheeran, P.; Armitage, C.J. Expanding the Affective and Normative Components of the Theory of Planned Behavior: A Meta-Analysis of Anticipated Affect and Moral Norms. J. Appl. Soc. Psychol. 2009, 39, 2985–3019. [Google Scholar] [CrossRef]
- Loewenstein, G.; Lerner, J.S. The Role of Affect in Decision Making. In Handbook of Affective Science; Davidson, R., Goldsmith, H., Scherer, K., Eds.; Oxford University Press: Oxford, UK, 2003; pp. 619–642. [Google Scholar]
- Baumeister, R.F.; Vohs, K.D.; DeWall, C.N.; Zhang, L. How Emotion Shapes Behavior: Feedback, Anticipation, and Reflection, Rather than Direct Causation. Pers. Soc. Psychol. Rev. 2007, 11, 167–203. [Google Scholar] [CrossRef]
- Richard, R.; van der Pligt, J.; de Vries, N. Anticipated Affect and Behavioral Choice. Basic Appl. Soc. Psychol. 1996, 18, 111–129. [Google Scholar] [CrossRef]
- Hur, J.; Jang, S.S. Anticipated Guilt and Pleasure in a Healthy Food Consumption Context. Int. J. Hosp. Manag. 2015, 48, 113–123. [Google Scholar] [CrossRef]
- Vogel, D.L.; Wester, S.R.; Wei, M.; Boysen, G.A. The Role of Outcome Expectations and Attitudes on Decisions to Seek Professional Help. J. Couns. Psychol. 2005, 52, 459–470. [Google Scholar] [CrossRef] [Green Version]
- Lindsey, L.L.M. Anticipated Guilt as Behavioral Motivation an Examination of Appeals to Help Unknown Others Through Bone Marrow Donation. Hum. Commun. Res. 2005, 31, 453–481. [Google Scholar] [CrossRef]
- Baumeister, R.F.; Stillwell, A.M.; Heatherton, T.F. Guilt: An Interpersonal Approach. Psychol. Bull. 1994, 115, 243–267. [Google Scholar] [CrossRef] [PubMed] [Green Version]
- Steenhuis, I. Guilty or Not? Feelings of Guilt about Food among College Women. Appetite 2009, 52, 531–534. [Google Scholar] [CrossRef] [PubMed]
- Wansink, B.; Chandon, P. Can “Low-Fat” Nutrition Labels Lead to Obesity? J. Mark. Res. 2006, 43, 605–617. [Google Scholar] [CrossRef]
- Freedman, J.L.; Wallington, S.A.; Bless, E. Compliance without Pressure: The Effect of Guilt. J. Pers. Soc. Psychol. 1967, 7, 117–124. [Google Scholar] [CrossRef]
- Richins, M.L. Measuring Emotions in the Consumption Experience. J. Consum. Res. 1997, 24, 127–146. [Google Scholar] [CrossRef]
- Bagozzi, R.P.; Gopinath, M.; Nyer, P.U. The Role of Emotions in Marketing. J. Acad. Mark. Sci. 1999, 27, 184. [Google Scholar] [CrossRef]
- Nguyen-Rodriguez, S.T.; Unger, J.B.; Spruijt-Metz, D. Psychological Determinants of Emotional Eating in Adolescence. Eat. Disord. 2009, 17, 211–224. [Google Scholar] [CrossRef] [Green Version]
- Jiang, Y.; King, J.M.; Prinyawiwatkul, W. A Review of Measurement and Relationships between Food, Eating Behavior and Emotion. Trends Food Sci. Technol. 2014, 36, 15–28. [Google Scholar] [CrossRef]
- Schouteten, J.J.; De Steur, H.; Sas, B.; De Bourdeaudhuij, I.; Gellynck, X. The Effect of the Research Setting on the Emotional and Sensory Profiling under Blind, Expected, and Informed Conditions: A Study on Premium and Private Label Yogurt Products. J. Dairy Sci. 2017, 100, 169–186. [Google Scholar] [CrossRef] [PubMed] [Green Version]
- Bettman, J.R. An Information Processing Theory of Consumer Choice; Advances in Marketing Series; Addison-Wesley: Boston, MA, USA, 1979; ISBN 978-0-201-00834-0. [Google Scholar]
- Bettman, J.R.; Luce, M.F.; Payne, J.W. Constructive Consumer Choice Processes. J. Consum. Res. 1998, 25, 187–217. [Google Scholar] [CrossRef]
- Engel, J.F.; Blackwell, R.D.; Kollat, D.T. Consumer Behavior; Dryden Press: Hinsdale, IL, USA, 1978; ISBN 978-0-03-089673-6. [Google Scholar]
- Piqueras-Fiszman, B.; Jaeger, S.R. The Impact of the Means of Context Evocation on Consumers’ Emotion Associations towards Eating Occasions. Food Qual. Prefer. 2014, 37, 61–70. [Google Scholar] [CrossRef]
- Machín, L.; Giménez, A.; Vidal, L.; Ares, G. Influence of Context on Motives Underlying Food Choice. J. Sens. Stud. 2014, 29, 313–324. [Google Scholar] [CrossRef]
- Fernqvist, F.; Ekelund, L. Credence and the Effect on Consumer Liking of Food—A Review. Food Qual. Prefer. 2014, 32, 340–353. [Google Scholar] [CrossRef] [Green Version]
- Steenkamp, J.-B.E.M. Conceptual Model of the Quality Perception Process. J. Bus. Res. 1990, 21, 309–333. [Google Scholar] [CrossRef]
- Gutjar, S.; de Graaf, C.; Kooijman, V.; de Wijk, R.A.; Nys, A.; ter Horst, G.J.; Jager, G. The Role of Emotions in Food Choice and Liking. Food Res. Int. 2015, 76, 216–223. [Google Scholar] [CrossRef]
- Desmet, P.M.A.; Schifferstein, H.N.J. Sources of Positive and Negative Emotions in Food Experience. Appetite 2008, 50, 290–301. [Google Scholar] [CrossRef]
- Kim, H.J.; Park, J.; Kim, M.; Ryu, K. Does Perceived Restaurant Food Healthiness Matter? Its Influence on Value, Satisfaction and Revisit Intentions in Restaurant Operations in South Korea. Int. J. Hosp. Manag. 2013, 333, 397–405. [Google Scholar] [CrossRef]
- Bublitz, M.G.; Peracchio, L.A.; Block, L.G. Why Did I Eat That? Perspectives on Food Decision Making and Dietary Restraint. J. Consum. Psychol. 2010, 20, 239–258. [Google Scholar] [CrossRef]
- Lancaster, K.J. A New Approach to Consumer Theory. J. Political Econ. 1966, 74, 132–157. [Google Scholar] [CrossRef]
- Lusk, J.L.; Schroeder, T.C. Are Choice Experiments Incentive Compatible? A Test with Quality Differentiated Beef Steaks. Am. J. Agric. Econ. 2004, 86, 467–482. [Google Scholar] [CrossRef] [Green Version]
- McFadden, D. Conditional Logit Analysis of Qualitative Choice Behaviour. In Frontiers in Econometrics; Academic Press: New York, NY, USA, 1973; pp. 105–142. [Google Scholar]
- Kaneko, D.; Toet, A.; Brouwer, A.-M.; Kallen, V.; van Erp, J.B.F. Methods for Evaluating Emotions Evoked by Food Experiences: A Literature Review. Front. Psychol. 2018, 9, 911. [Google Scholar] [CrossRef] [PubMed] [Green Version]
- Dorado, R.; Chaya, C.; Tarrega, A.; Hort, J. The Impact of Using a Written Scenario When Measuring Emotional Response to Beer. Food Qual. Prefer. 2016, 50, 38–47. [Google Scholar] [CrossRef]
- Köster, E.P.; Mojet, J. From Mood to Food and from Food to Mood: A Psychological Perspective on the Measurement of Food-Related Emotions in Consumer Research. Food Res. Int. 2015, 76, 180–191. [Google Scholar] [CrossRef]
- Laurans, G.F.G.; Desmet, P.M.A. Introducing PrEmo2: New Directions for the Non-Verbal Measurement of Emotion in Design. In Proceedings of the 8th International Conference on Design and Emotion, London, UK, 11–14 September 2012. [Google Scholar]
- Den Uijl, L.C.; Jager, G.; Zandstra, E.H.; de Graaf, C.; Kremer, S. Self-Reported Food-Evoked Emotions of Younger Adults, Older Normosmic Adults, and Older Hyposmic Adults as Measured Using the PrEmo2 Tool and the Affect Grid. Food Qual. Prefer. 2016, 51, 109–117. [Google Scholar] [CrossRef]
- Curtin, R.; Presser, S.; Singer, E. The Effects of Response Rate Changes on the Index of Consumer Sentiment. Public Opin. Q 2000, 64, 413–428. [Google Scholar] [CrossRef] [Green Version]
- Desai, N.T.; Shepard, L.; Drake, M.A. Sensory Properties and Drivers of Liking for Greek Yogurts. J. Dairy Sci. 2013, 96, 7454–7466. [Google Scholar] [CrossRef] [Green Version]
- Phillips, S.; Pinckaers, M. Retail Foods. The Dutch Food Retail Report 2019; Global Agricultural Information Network: Washington, DC, USA, 2019; p. 9.
- Street, D.J.; Burgess, L. The Construction of Optimal Stated Choice Experiments: Theory and Methods; John Wiley & Sons: Hoboken, NJ, USA, 2007; ISBN 978-0-470-14855-6. [Google Scholar]
- Train, K. Discrete Choice Methods with Simulation; Cambridge University Press: Cambridge, UK, 2003. [Google Scholar]
- Macht, M.; Gerer, J.; Ellgring, H. Emotions in Overweight and Normal-Weight Women Immediately after Eating Foods Differing in Energy. Physiol. Behav. 2003, 80, 367–374. [Google Scholar] [CrossRef]
- Dias, P.G.I.; Sajiwani, J.W.A.; Rathnayaka, R.M.U.S.K. Consumer Perception and Sensory Profile of Probiotic Yogurt with Added Sugar and Reduced Milk Fat. Heliyon 2020, 6, e04328. [Google Scholar] [CrossRef]
- Kim, S.Y.; Hyeonbin, O.; Lee, P.; Kim, Y.-S. The Quality Characteristics, Antioxidant Activity, and Sensory Evaluation of Reduced-Fat Yogurt and Nonfat Yogurt Supplemented with Basil Seed Gum as a Fat Substitute. J. Dairy Sci. 2020, 103, 1324–1336. [Google Scholar] [CrossRef]
- Olivares, M.L.; Shahrivar, K.; de Vicente, J. Soft Lubrication Characteristics of Microparticulated Whey Proteins Used as Fat Replacers in Dairy Systems. J. Food Eng. 2019, 245, 157–165. [Google Scholar] [CrossRef]
- Fu, R.; Li, J.; Zhang, T.; Zhu, T.; Cheng, R.; Wang, S.; Zhang, J. Salecan Stabilizes the Microstruc-ture and Improves the Rheological Performance of Yogurt. Food Hydrocoll. 2018, 81, 474–480. [Google Scholar] [CrossRef]
- Lyman, B. The Nutritional Values and Food Group Characteristics of Foods Preferred during Various Emotions. J. Psychol. 1982, 112, 121–127. [Google Scholar] [CrossRef] [PubMed]
- Macdiarmid, J.I.; Hetherington, M.M. Mood Modulation by Food: An Exploration of Affect and Cravings in ‘Chocolate Addicts’. Br. J. Clin. Psychol. 1995, 34, 129–138. [Google Scholar] [CrossRef] [PubMed]
- Cardi, V.; Leppanen, J.; Treasure, J. The Effects of Negative and Positive Mood Induction on Eating Behaviour: A Meta-Analysis of Laboratory Studies in the Healthy Population and Eating and Weight Disorders. Neurosci. Biobehav. Rev. 2015, 57, 299–309. [Google Scholar] [CrossRef]
- Ballco, P.; Gracia, A. Do Market Prices Correspond with Consumer Demands? Combining Market Valuation and Consumer Utility for Extra Virgin Olive Oil Quality Attributes in a Traditional Producing Country. J. Retail. Consum. Serv. 2020, 53, 101999. [Google Scholar] [CrossRef]
- Piqueras-Fiszman, B.; Jaeger, S.R. Emotion Responses under Evoked Consumption Contexts: A Focus on the Consumers’ Frequency of Product Consumption and the Stability of Responses. Food Qual. Prefer. 2014, 35, 24–31. [Google Scholar] [CrossRef]
- Piqueras-Fiszman, B.; Jaeger, S.R. The Impact of Evoked Consumption Contexts and Appropriateness on Emotion Responses. Food Qual. Prefer. 2014, 32, 277–288. [Google Scholar] [CrossRef]
- Gibson, E.L. Emotional Influences on Food Choice: Sensory, Physiological and Psychological Pathways. Physiol. Behav. 2006, 89, 53–61. [Google Scholar] [CrossRef]
- Jerolmack, C.; Khan, S. Talk Is Cheap: Ethnography and the Attitudinal Fallacy. Sociol. Methods Res. 2014, 43, 178–209. [Google Scholar] [CrossRef]
- De Houwer, J.; Moors, A. How to Define and Examine the Implicitness of Implicit Measures. In Implicit Measures of Attitudes; The Guilford Press: New York, NY, USA, 2007; pp. 179–194. ISBN 978-1-59385-402-7. [Google Scholar]
- de Wijk, R.A.; Kooijman, V.; Verhoeven, R.H.G.; Holthuysen, N.T.E.; de Graaf, C. Autonomic Nervous System Responses on and Facial Expressions to the Sight, Smell, and Taste of Liked and Disliked Foods. Food Qual. Prefer. 2012, 26, 196–203. [Google Scholar] [CrossRef]
- Ballco, P.; Jurado, F.; Gracia, A. Do Health Claims Add Value to Nutritional Claims? Evidence from a Close-to-Real Experiment on Breakfast Biscuits. Food Qual. Prefer. 2020, 85, 103968. [Google Scholar] [CrossRef]
- de-Magistris, T.; López-Galán, B.; Ballco, P. Do Virtual Reality Experiments Replicate Projection Bias Phenomena? Examining the External Validity of a Virtual Supermarket. J. Agric. Econ. 2021, 73, 20–34. [Google Scholar] [CrossRef]
- Jaeger, S.R.; Hort, J.; Porcherot, C.; Ares, G.; Pecore, S.; MacFie, H.J.H. Future Directions in Sensory and Consumer Science: Four Perspectives and Audience Voting. Food Qual. Prefer. 2017, 56, 301–309. [Google Scholar] [CrossRef]

| Sample | Treatments | |||
|---|---|---|---|---|
| Health | Indulgent | Control | ||
| Number of participants | 209 | 70 | 72 | 67 |
| Gender [χ2 = 2.185, p-value = 0.335] | ||||
| Male | 34.5 | 34.3 | 40.3 | 28.4 |
| Female | 65.5 | 65.7 | 59.7 | 71.6 |
| Age (years) [χ2 = 7.391, p-value = 0.286] | ||||
| Age of responders: mean (SD) | 28.7 (9.9) | 27.4 (6.8) | 30.5 (11.9) | 28.2 (10.1) |
| 18–25 | 44.5 | 44.3 | 38.9 | 50.8 |
| 25–30 | 28.7 | 35.7 | 25.0 | 25.4 |
| 30–40 | 18.7 | 15.7 | 25.0 | 14.9 |
| >40 | 8.1 | 4.3 | 11.1 | 9.0 |
| Completed education level [χ2 = 11.981, p-value = 0.286] | ||||
| Less than high school degree | 0.5 | - | - | 1.5 |
| High school graduate | 18.7 | 12.9 | 22.2 | 20.9 |
| Associate degree (2 years) | 1.4 | 1.4 | 1.4 | 1.5 |
| Bachelor’s degree | 39.7 | 41.4 | 36.1 | 41.8 |
| Master’s degree | 32.1 | 38.6 | 26.4 | 31.3 |
| Doctoral degree | 7.7 | 5.7 | 13.9 | 3.0 |
| Body Mass Index (BMI) [χ2 = 319.540, p-value = 0.590] | ||||
| Underweight | 55.0 | 55.7 | 50.0 | 59.7 |
| Normal weight | 23.9 | 14.3 | 26.4 | 31.3 |
| Overweight | 6.2 | 10.0 | 8.3 | - |
| Pre-obese | 8.1 | 11.4 | 8.3 | 4.5 |
| Obese | 6.7 | 8.6 | 6.9 | 4.5 |
| Emotions | Treatment 1 (n = 70)–Health | |||||||||
|---|---|---|---|---|---|---|---|---|---|---|
| Products | Ffat | FfatB | FfatC | Lfat | LfatB | LfatC | Ffree | FfreeB | FfreeC | |
| Desire | 7.1 | 7.1 | 11.4 | 4.3 | 14.3 | 11.4 | 4.3 | 21.4 | 20.0 | |
| Satisfied | 11.4 | 17.1 | 5.7 | 47.2 | 57.1 | 35.7 | 41.4 | 40.1 | 35.9 | |
| Proud | 4.3 | 0 | 0 | 14.3 | 8.6 | 5.7 | 18.5 | 17.1 | 5.7 | |
| Joy | 1.4 | 11.4 | 1.4 | 7.1 | 11.4 | 20.0 | 4.3 | 8.6 | 17.1 | |
| Disgust | 11.4 | 4.3 | 8.6 | 2.9 | 1.4 | 4.3 | 10.0 | 1.4 | 0 | |
| Dissatisfied | 27.2 | 18.6 | 21.4 | 7.1 | 1.4 | 2.9 | 8.6 | 5.7 | 10.0 | |
| Worried | 24.3 | 38.7 | 45.8 | 0 | 2.9 | 12.9 | 0 | 1.4 | 8.6 | |
| Bored | 12.9 | 2.9 | 5.7 | 17.1 | 2.9 | 7.1 | 12.9 | 4.3 | 2.7 | |
| Emotions | Treatment 2 (n = 72)—Indulgent | |||||||||
| Products | Ffat | FfatB | FfatC | Lfat | LfatB | LfatC | Ffree | FfreeB | FfreeC | |
| Desire | 5.6 | 23.6 | 26.4 | 1.4 | 12.5 | 11.1 | 2.8 | 12.5 | 12.5 | |
| Satisfied | 32.0 | 41.7 | 23.6 | 29.1 | 50.0 | 41.7 | 29.2 | 44.4 | 29.2 | |
| Proud | 1.4 | 2.8 | 0 | 5.6 | 8.3 | 2.8 | 8.3 | 11.1 | 6.9 | |
| Joy | 8.3 | 15.3 | 16.7 | 4.2 | 18.0 | 23.5 | 5.6 | 18.0 | 27.7 | |
| Disgust | 6.9 | 2.8 | 6.9 | 8.3 | 4.2 | 1.4 | 6.9 | 4.2 | 2.8 | |
| Dissatisfied | 20.8 | 4.2 | 11.1 | 20.8 | 4.2 | 12.5 | 20.8 | 5.6 | 12.5 | |
| Worried | 6.9 | 6.8 | 12.5 | 0 | 0 | 2.8 | 0 | 0 | 4.2 | |
| Bored | 18.1 | 2.8 | 2.8 | 30.6 | 2.8 | 4.2 | 26.4 | 4.2 | 4.2 | |
| Emotions | Treatment 3 (n = 67)—Control | |||||||||
| Products | Ffat | FfatB | FfatC | Lfat | LfatB | LfatC | Ffree | FfreeB | FfreeC | |
| Desire | 10.5 | 11.9 | 19.4 | 6.0 | 7.5 | 20.9 | 3.0 | 17.9 | 11.9 | |
| Satisfied | 31.3 | 32.8 | 17.9 | 47.8 | 52.2 | 31.3 | 49.3 | 31.3 | 31.3 | |
| Proud | 0 | 0 | 0 | 10.5 | 4.5 | 0 | 11.9 | 7.5 | 6.0 | |
| Joy | 10.5 | 10.4 | 14.9 | 13.4 | 22.4 | 22.4 | 7.5 | 16.4 | 17.9 | |
| Disgust | 6.0 | 4.5 | 14.9 | 1.5 | 6.0 | 7.5 | 4.5 | 4.5 | 9.0 | |
| Dissatisfied | 17.8 | 10.5 | 7.5 | 3.0 | 1.4 | 10.4 | 10.4 | 9.0 | 8.9 | |
| Worried | 10.5 | 22.4 | 22.4 | 0 | 0 | 4.5 | 0 | 1.5 | 9.0 | |
| Bored | 13.4 | 7.5 | 3.0 | 17.8 | 6.0 | 3.0 | 13.4 | 11.9 | 6.0 | |
| Emotions | Health (n = 70) | |||||||||
|---|---|---|---|---|---|---|---|---|---|---|
| Products | Ffat a,b,c | FfatB a,b,c | FfatC a,b,c | Lfat a,b,c | LfatB | LfatC | Ffree a,c | FfreeB a,c | FfreeC | |
| Positive | 24.3 | 35.7 | 18.6 | 72.9 | 91.4 | 72.9 | 68.6 | 87.1 | 78.6 | |
| Negative | 75.7 | 64.3 | 81.4 | 27.1 | 8.6 | 27.1 | 31.4 | 12.9 | 21.4 | |
| d Appropriateness—Mean (SD) | 3.9 (2.1) a,b | 4.0 (2.1) a,b,c | 3.0 (1.9) a,b,c | 6.9 (1.6) a,b | 7.0 (1.7) | 6.3 (2.0) | 7.1 (2.0) a,b,c | 7.3 (1.8) | 6.6 (2.2) | |
| Treat (n = 72) | ||||||||||
| Positive | 47.2 | 83.3 | 66.7 | 40.3 | 88.9 | 79.2 | 45.8 | 86.1 | 76.4 | |
| Negative | 52.8 | 16.7 | 33.3 | 59.7 | 11.1 | 20.8 | 54.2 | 13.9 | 23.6 | |
| d Appropriateness—Mean (SD) | 4.6 (3.3) | 7.1 (1.9) | 6.6 (2.4) | 4.9 (2.5) | 7.3 (1.7) | 6.9 (1.8) | 4.6 (2.5) | 7.1 (1.7) | 6.7 (2.0) | |
| Control (n = 67) | ||||||||||
| Positive | 52.2 | 55.2 | 52.2 | 77.6 | 86.6 | 74.6 | 71.6 | 73.1 | 67.2 | |
| Negative | 47.8 | 44.8 | 47.8 | 22.4 | 13.4 | 25.4 | 28.4 | 26.9 | 32.8 | |
| d Appropriateness—Mean (SD) | 5.4 (2.3) | 5.7 (2.2) | 5.1 (2.7) | 6.5 (2.7) | 6.9 (1.5) | 6.2 (2.3) | 6.2 (2.3) | 6.8 (1.9) | 6.0 (2.5) | |
| Emotion—χ2(2) | 12.7 *** | 33.5 *** | 34.6 *** | 25.0 *** | 0.8 | 0.8 | 11.9 *** | 5.7 ** | 2.6 | |
| Appropriateness—df (2), F (p-value) | 8.5 *** | 40.8 *** | 42.0 *** | 17.6 *** | 1.0 | 2.2 | 21.0 *** | 1.6 | 1.6 | |
| Control | Health | Indulgent | ||||
|---|---|---|---|---|---|---|
| Random Parameters in the Utility Function | ||||||
| Coefficient | T-ratio (z) | Coefficient | T-ratio (z) | Coefficient | T-ratio (z) | |
| No-buy | −2.49 *** | −8.52 | −0.68 ** | −2.27 | −1.32 *** | −5.03 |
| Low-fat | 0.77 *** | 3.50 | 2.80 *** | 8.86 | 0.43 * | 1.83 |
| Fat-free | 0.67 ** | 2.50 | 3.73 *** | 7.73 | 0.13 | 0.52 |
| Berries | 0.81 ** | 2.34 | 0.71 *** | 2.62 | 2.42 *** | 5.13 |
| Choco | −0.71 | −1.49 | −0.01 | −0.04 | 2.40 *** | 4.33 |
| Standard deviations of parameter distribution | ||||||
| Low-fat | 0.95 *** | 2.64 | 0.58 ** | 2.30 | 0.91 *** | 2.64 |
| Fat-free | 1.48 *** | 4.66 | 2.04 *** | 5.06 | 1.43 *** | 4.34 |
| Berries | 2.13 *** | 5.77 | 1.58 *** | 5.01 | 3.13 *** | 4.61 |
| Choco | 3.29 *** | 6.52 | 2.18 *** | 5.84 | 4.65 *** | 6.00 |
| N | 1809 | 1890 | 1944 | |||
| Log-likelihood | −406.62 | −351.23 | −373.96 | |||
| χ2 | 511.69 | 681.78 | 577.00 | |||
| Pseudo-R2 | 0.39 | 0.49 | 0.44 | |||
| Control (n = 67) | Health (n = 70) | Treat (n = 72) | ||||||||||
|---|---|---|---|---|---|---|---|---|---|---|---|---|
| Choices with Positive Emotions | Choices with Negative Emotions | Choices with Positive Emotions | Choices with Negative Emotions | Choices with Positive Emotions | Choices with Negative Emotions | |||||||
| Attributes | n | % | n | % | n | % | n | % | n | % | n | % |
| Ffat | 17 | 25.4 | 1 | 1.5 | 4 | 5.7 | 0 | 0.0 | 6 | 8.3 | 1 | 1.4 |
| FfatB | 20 | 29.9 | 3 | 4.5 | 10 | 14.3 | 1 | 1.4 | 31 | 43.1 | 1 | 1.4 |
| FfatC | 16 | 23.9 | 2 | 3.0 | 1 | 1.4 | 0 | 0.0 | 31 | 43.1 | 2 | 2.8 |
| Lfat | 21 | 31.3 | 0 | 0.00 | 15 | 21.4 | 5 | 7.1 | 10 | 13.9 | 2 | 2.8 |
| LfatB | 28 | 41.8 | 1 | 1.5 | 23 | 32.9 | 2 | 2.9 | 34 | 45.8 | 1 | 1.4 |
| LfatC | 21 | 31.3 | 0 | 0.0 | 21 | 30.0 | 2 | 2.9 | 28 | 38.9 | 0 | 0.0 |
| Ffree | 21 | 31.3 | 0 | 0.0 | 26 | 37.1 | 6 | 8.6 | 10 | 13.9 | 0 | 0.0 |
| FfreeB | 26 | 38.8 | 1 | 1.5 | 47 | 67.1 | 1 | 1.4 | 26 | 36.1 | 1 | 1.4 |
| FfreeC | 17 | 25.4 | 1 | 1.5 | 38 | 54.3 | 0 | 0.0 | 27 | 37.5 | 1 | 1.4 |
Publisher’s Note: MDPI stays neutral with regard to jurisdictional claims in published maps and institutional affiliations. |
© 2022 by the authors. Licensee MDPI, Basel, Switzerland. This article is an open access article distributed under the terms and conditions of the Creative Commons Attribution (CC BY) license (https://creativecommons.org/licenses/by/4.0/).
Share and Cite
Ballco, P.; Piqueras-Fiszman, B.; van Trijp, H.C.M. The Influence of Consumption Context on Indulgent Versus Healthy Yoghurts: Exploring the Relationship between the Associated Emotions and the Actual Choices. Sustainability 2022, 14, 8224. https://doi.org/10.3390/su14138224
Ballco P, Piqueras-Fiszman B, van Trijp HCM. The Influence of Consumption Context on Indulgent Versus Healthy Yoghurts: Exploring the Relationship between the Associated Emotions and the Actual Choices. Sustainability. 2022; 14(13):8224. https://doi.org/10.3390/su14138224
Chicago/Turabian StyleBallco, Petjon, Betina Piqueras-Fiszman, and Hans C. M. van Trijp. 2022. "The Influence of Consumption Context on Indulgent Versus Healthy Yoghurts: Exploring the Relationship between the Associated Emotions and the Actual Choices" Sustainability 14, no. 13: 8224. https://doi.org/10.3390/su14138224
APA StyleBallco, P., Piqueras-Fiszman, B., & van Trijp, H. C. M. (2022). The Influence of Consumption Context on Indulgent Versus Healthy Yoghurts: Exploring the Relationship between the Associated Emotions and the Actual Choices. Sustainability, 14(13), 8224. https://doi.org/10.3390/su14138224