
African Vulture Optimization Algorithm-Based PI Controllers for Performance Enhancement of Hybrid Renewable-Energy Systems

 ,
,  ,
,  ,
,  ,
,
Abstract
:1. Introduction
- Applying the incremental-conductance method combined with the PI controllers for the MPP tracking of PV and wind systems.
- Introducing a novel algorithm called the African Vultures Optimization Algorithm for tuning the PI controllers in the hybrid system.
- Comparing the results of the application of the AVOA with the PSO method.
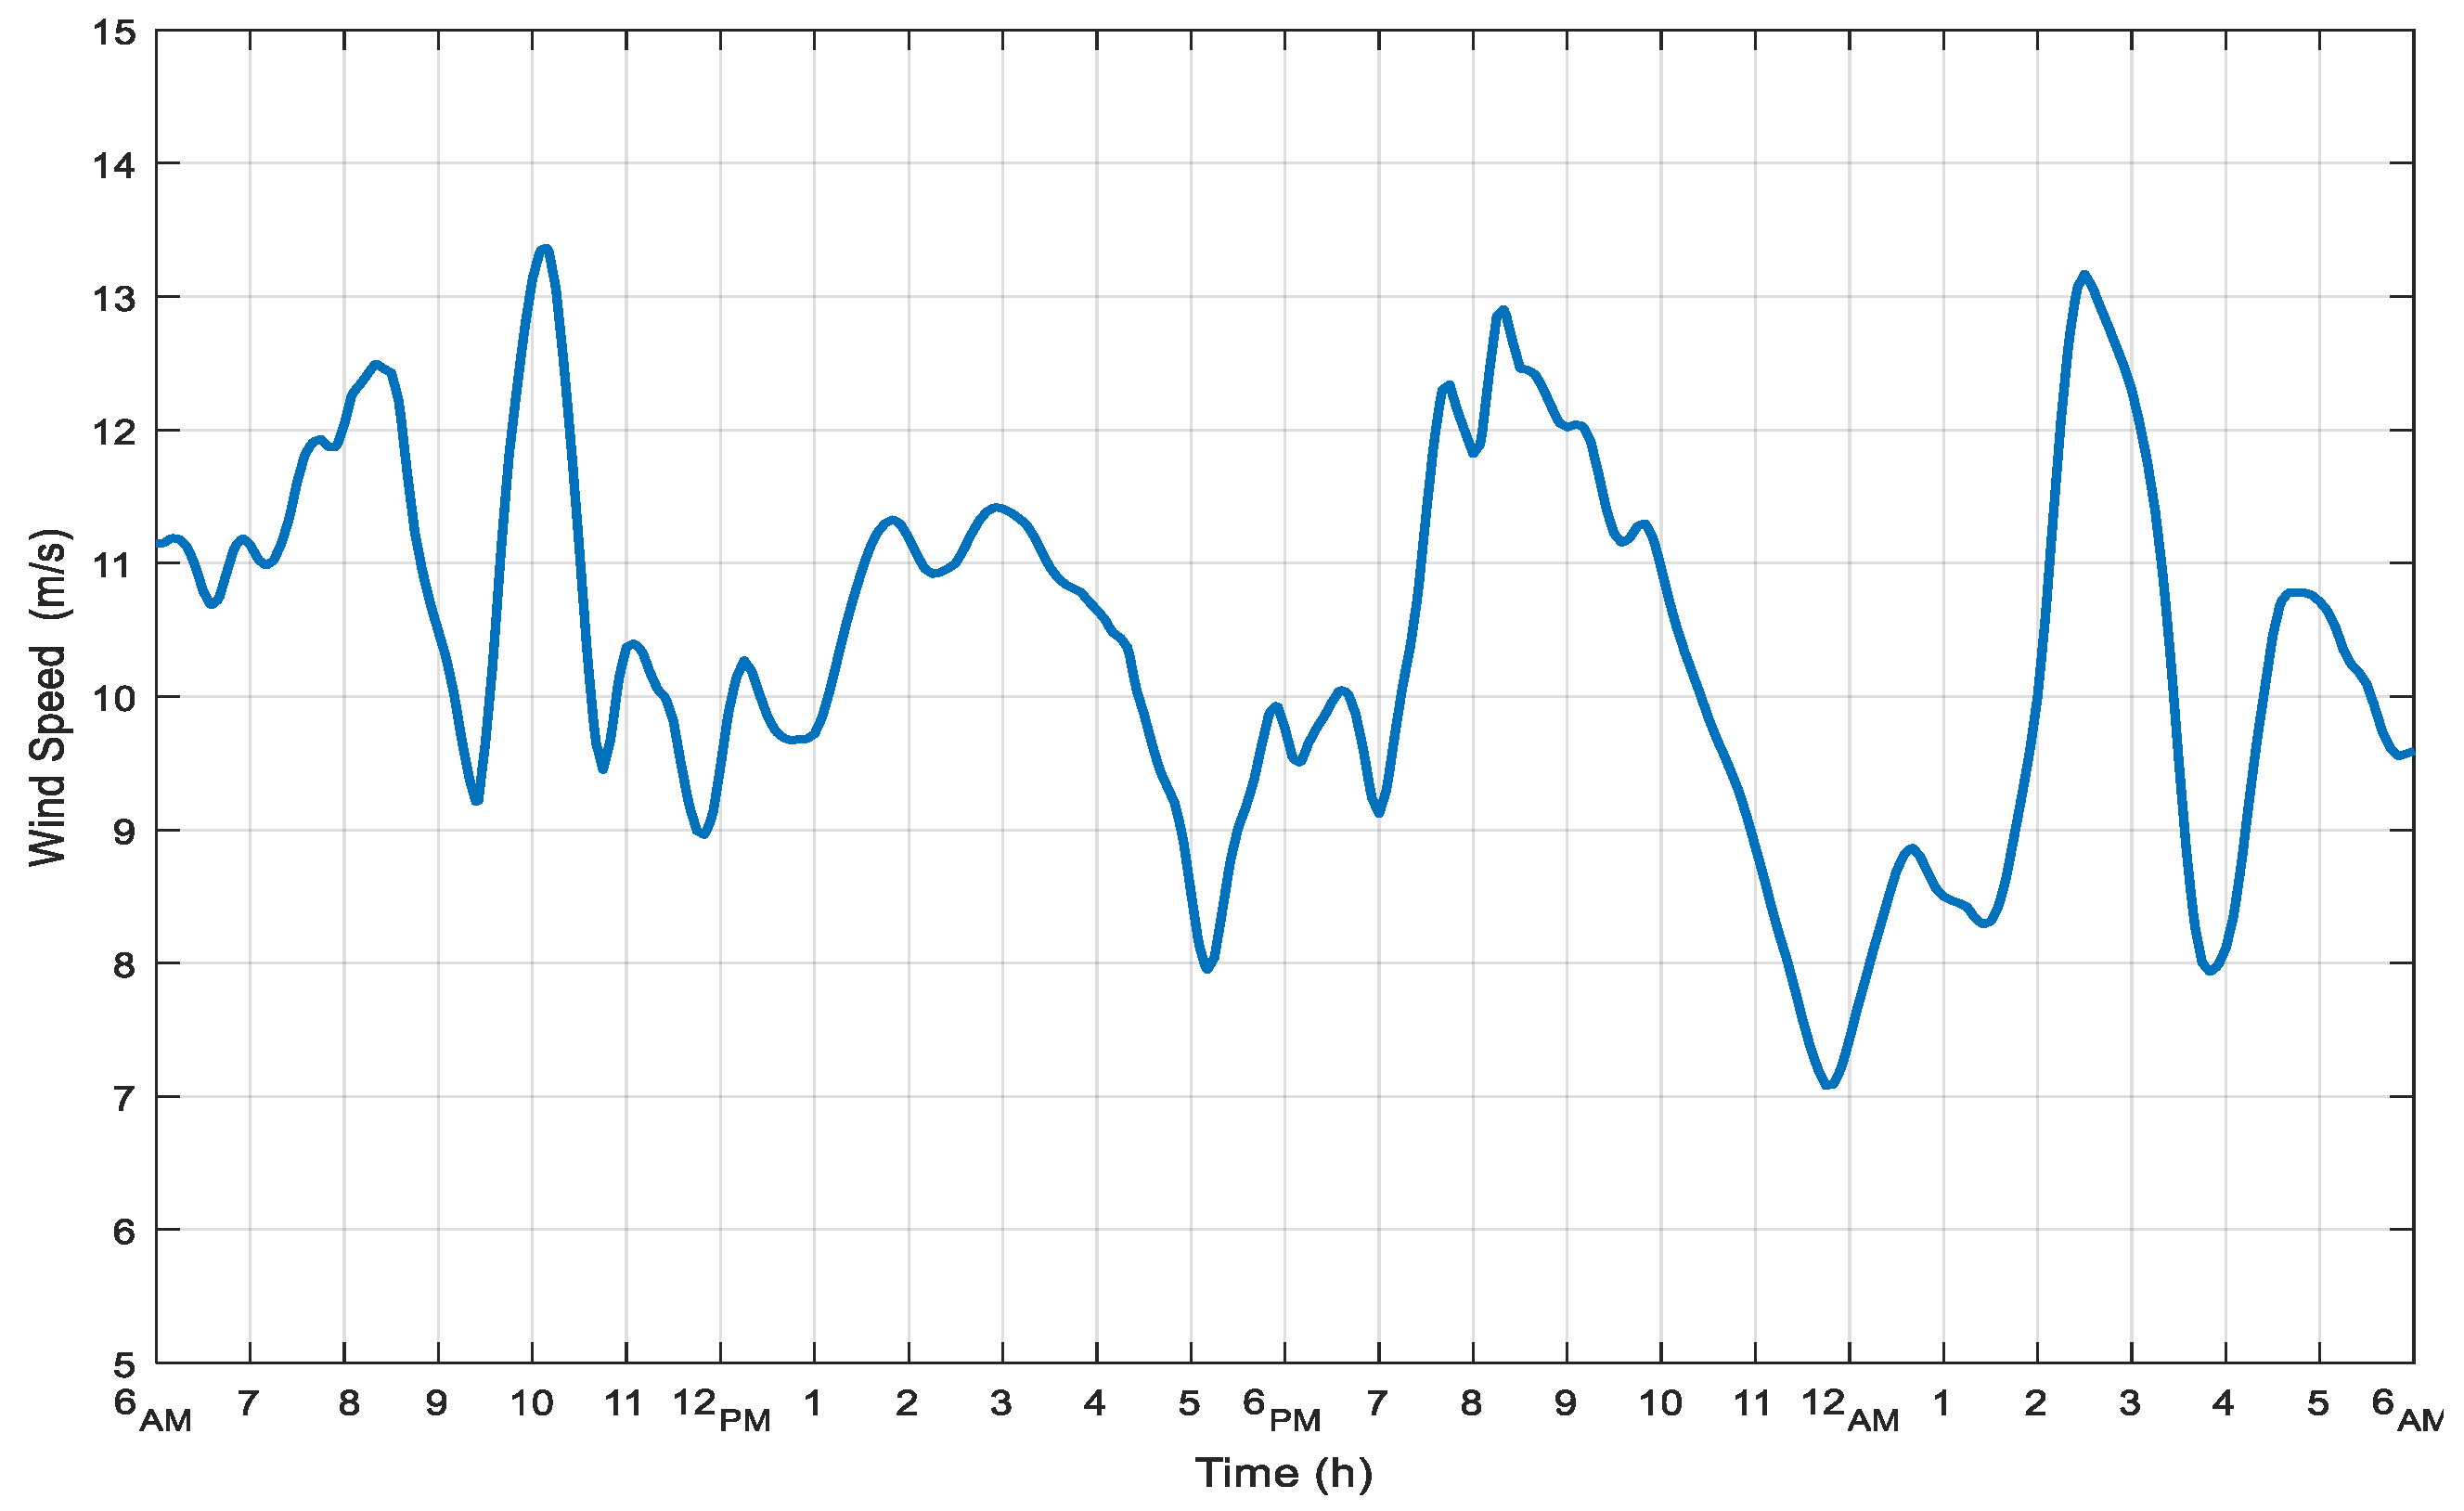
- Implementing a storage system to smooth the fluctuations in the output of renewable systems, i.e., wind and PV systems, because of the irregular nature of wind speed and solar irradiance.
2. Hybrid DC Microgrid System
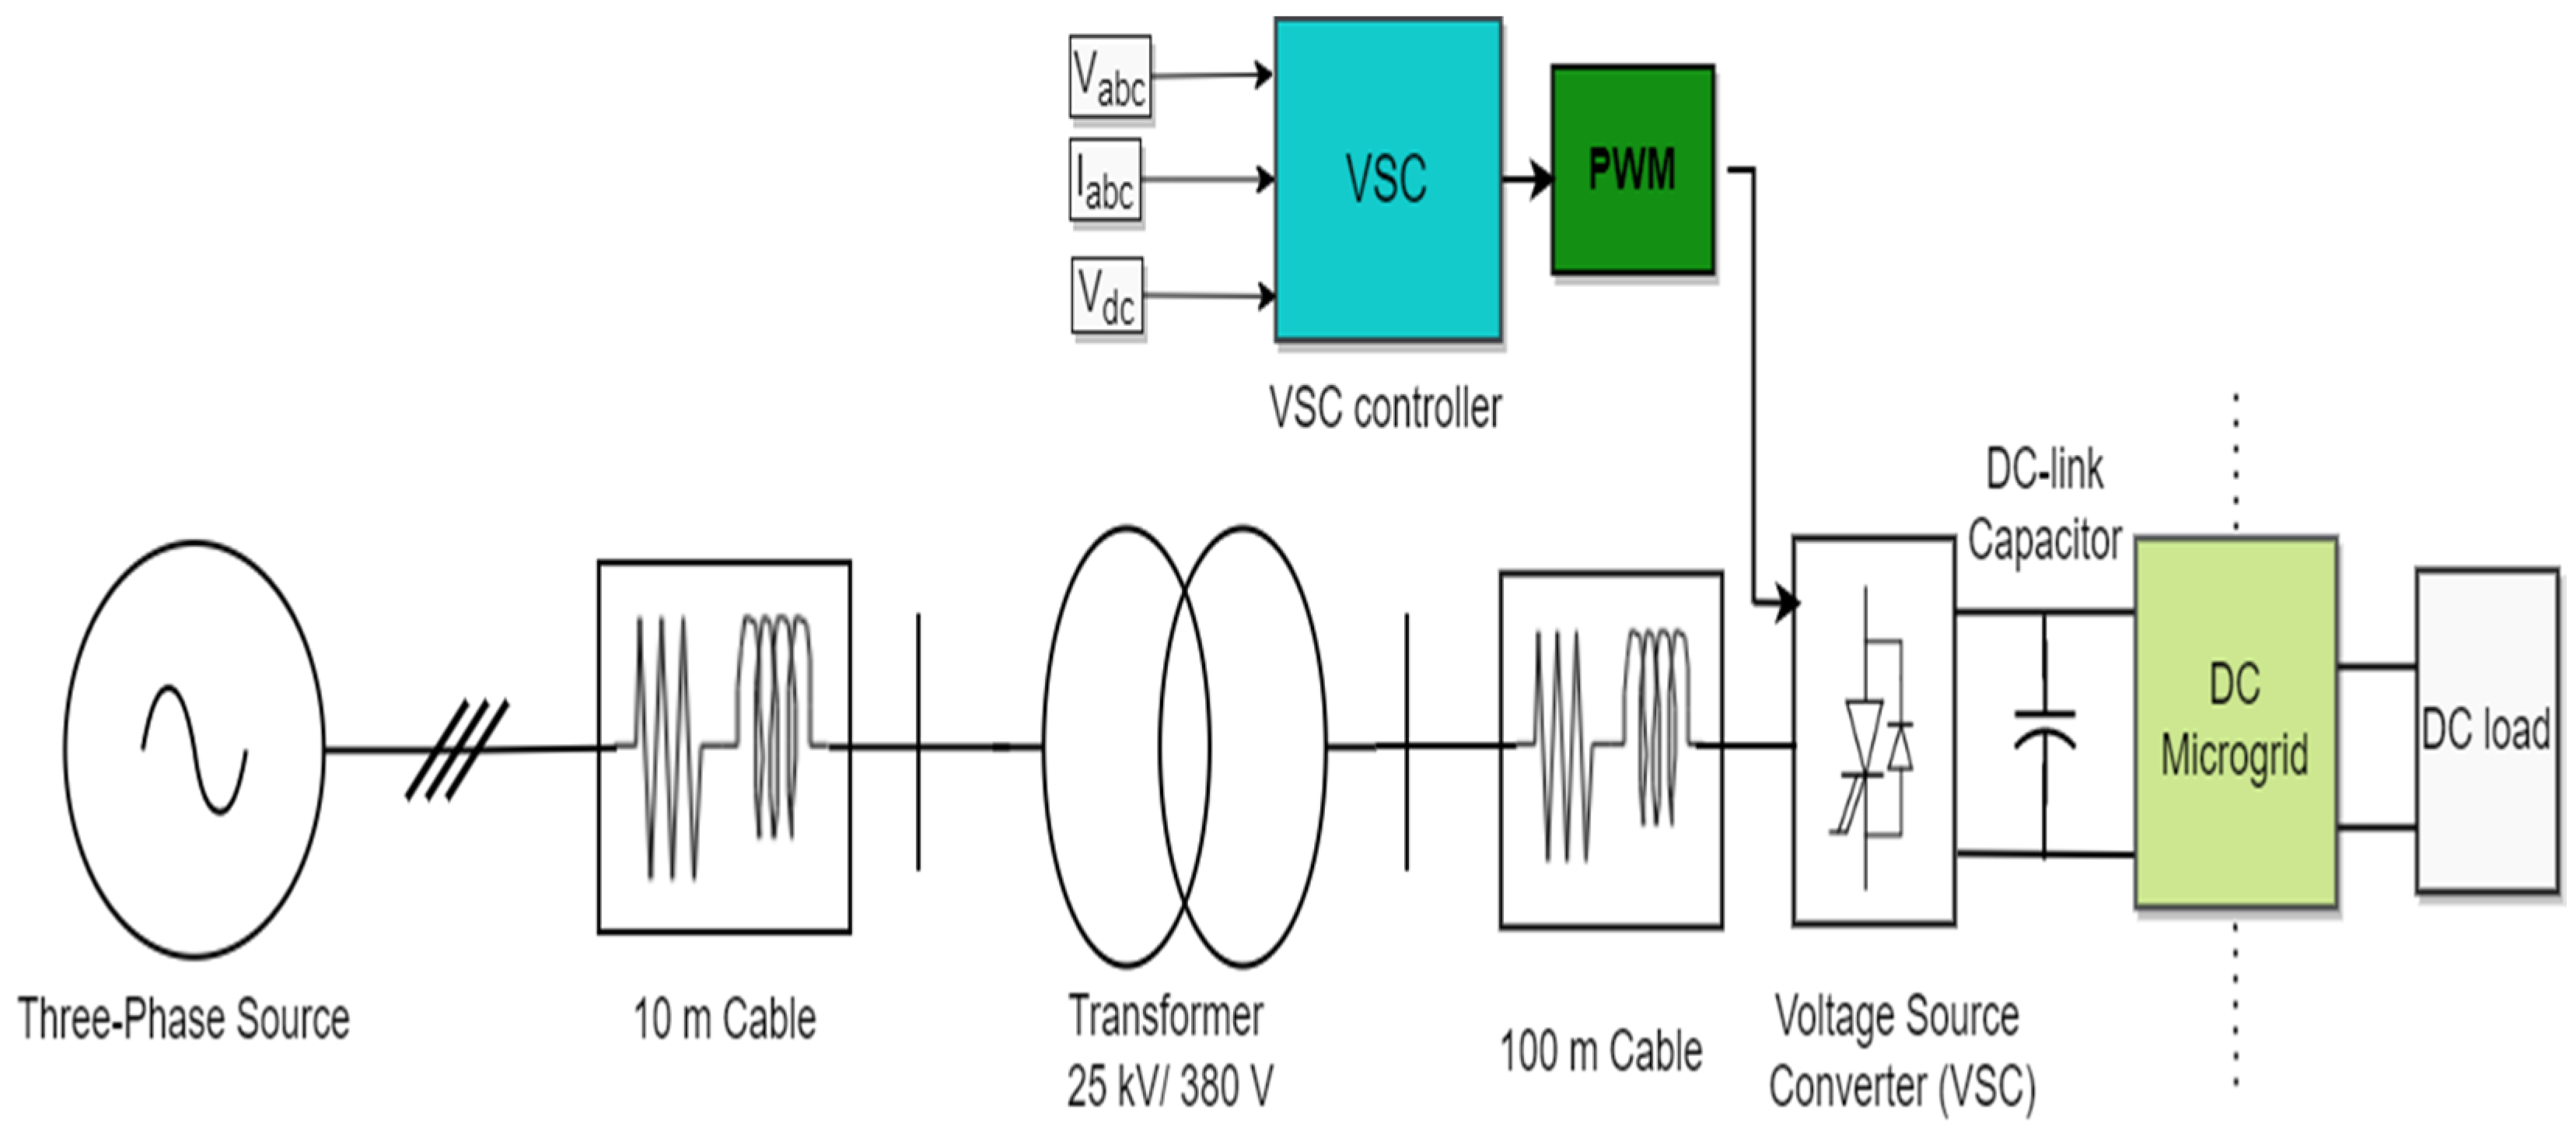
2.1. AC System
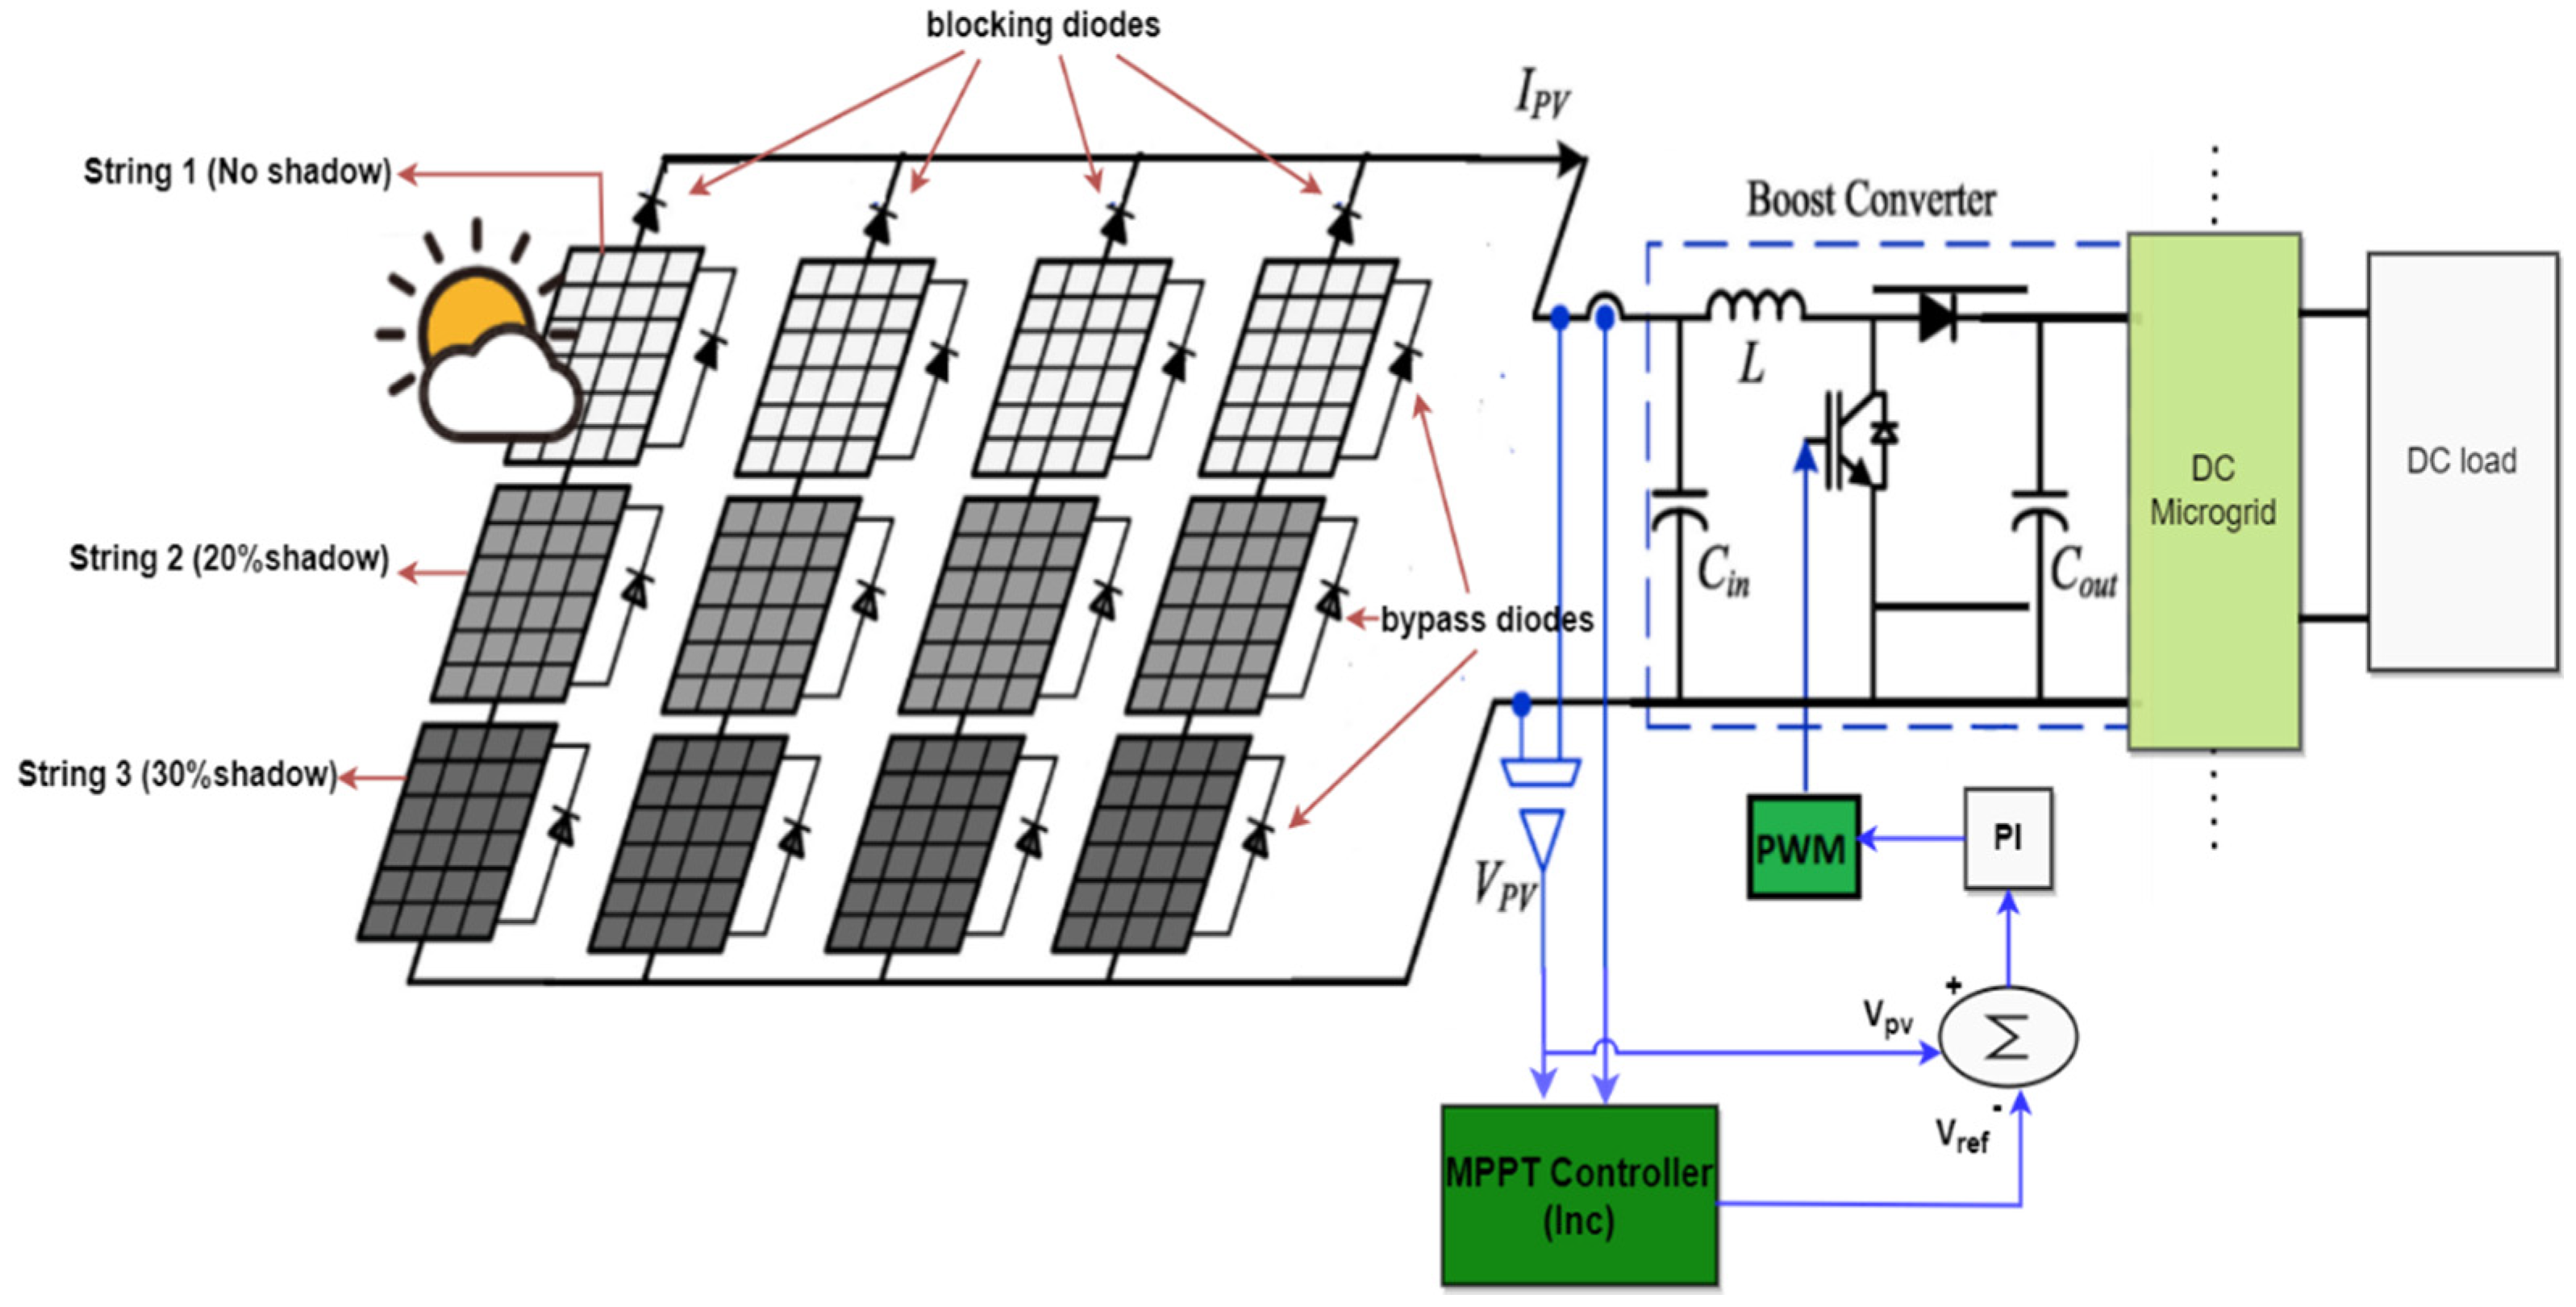
2.2. PV System
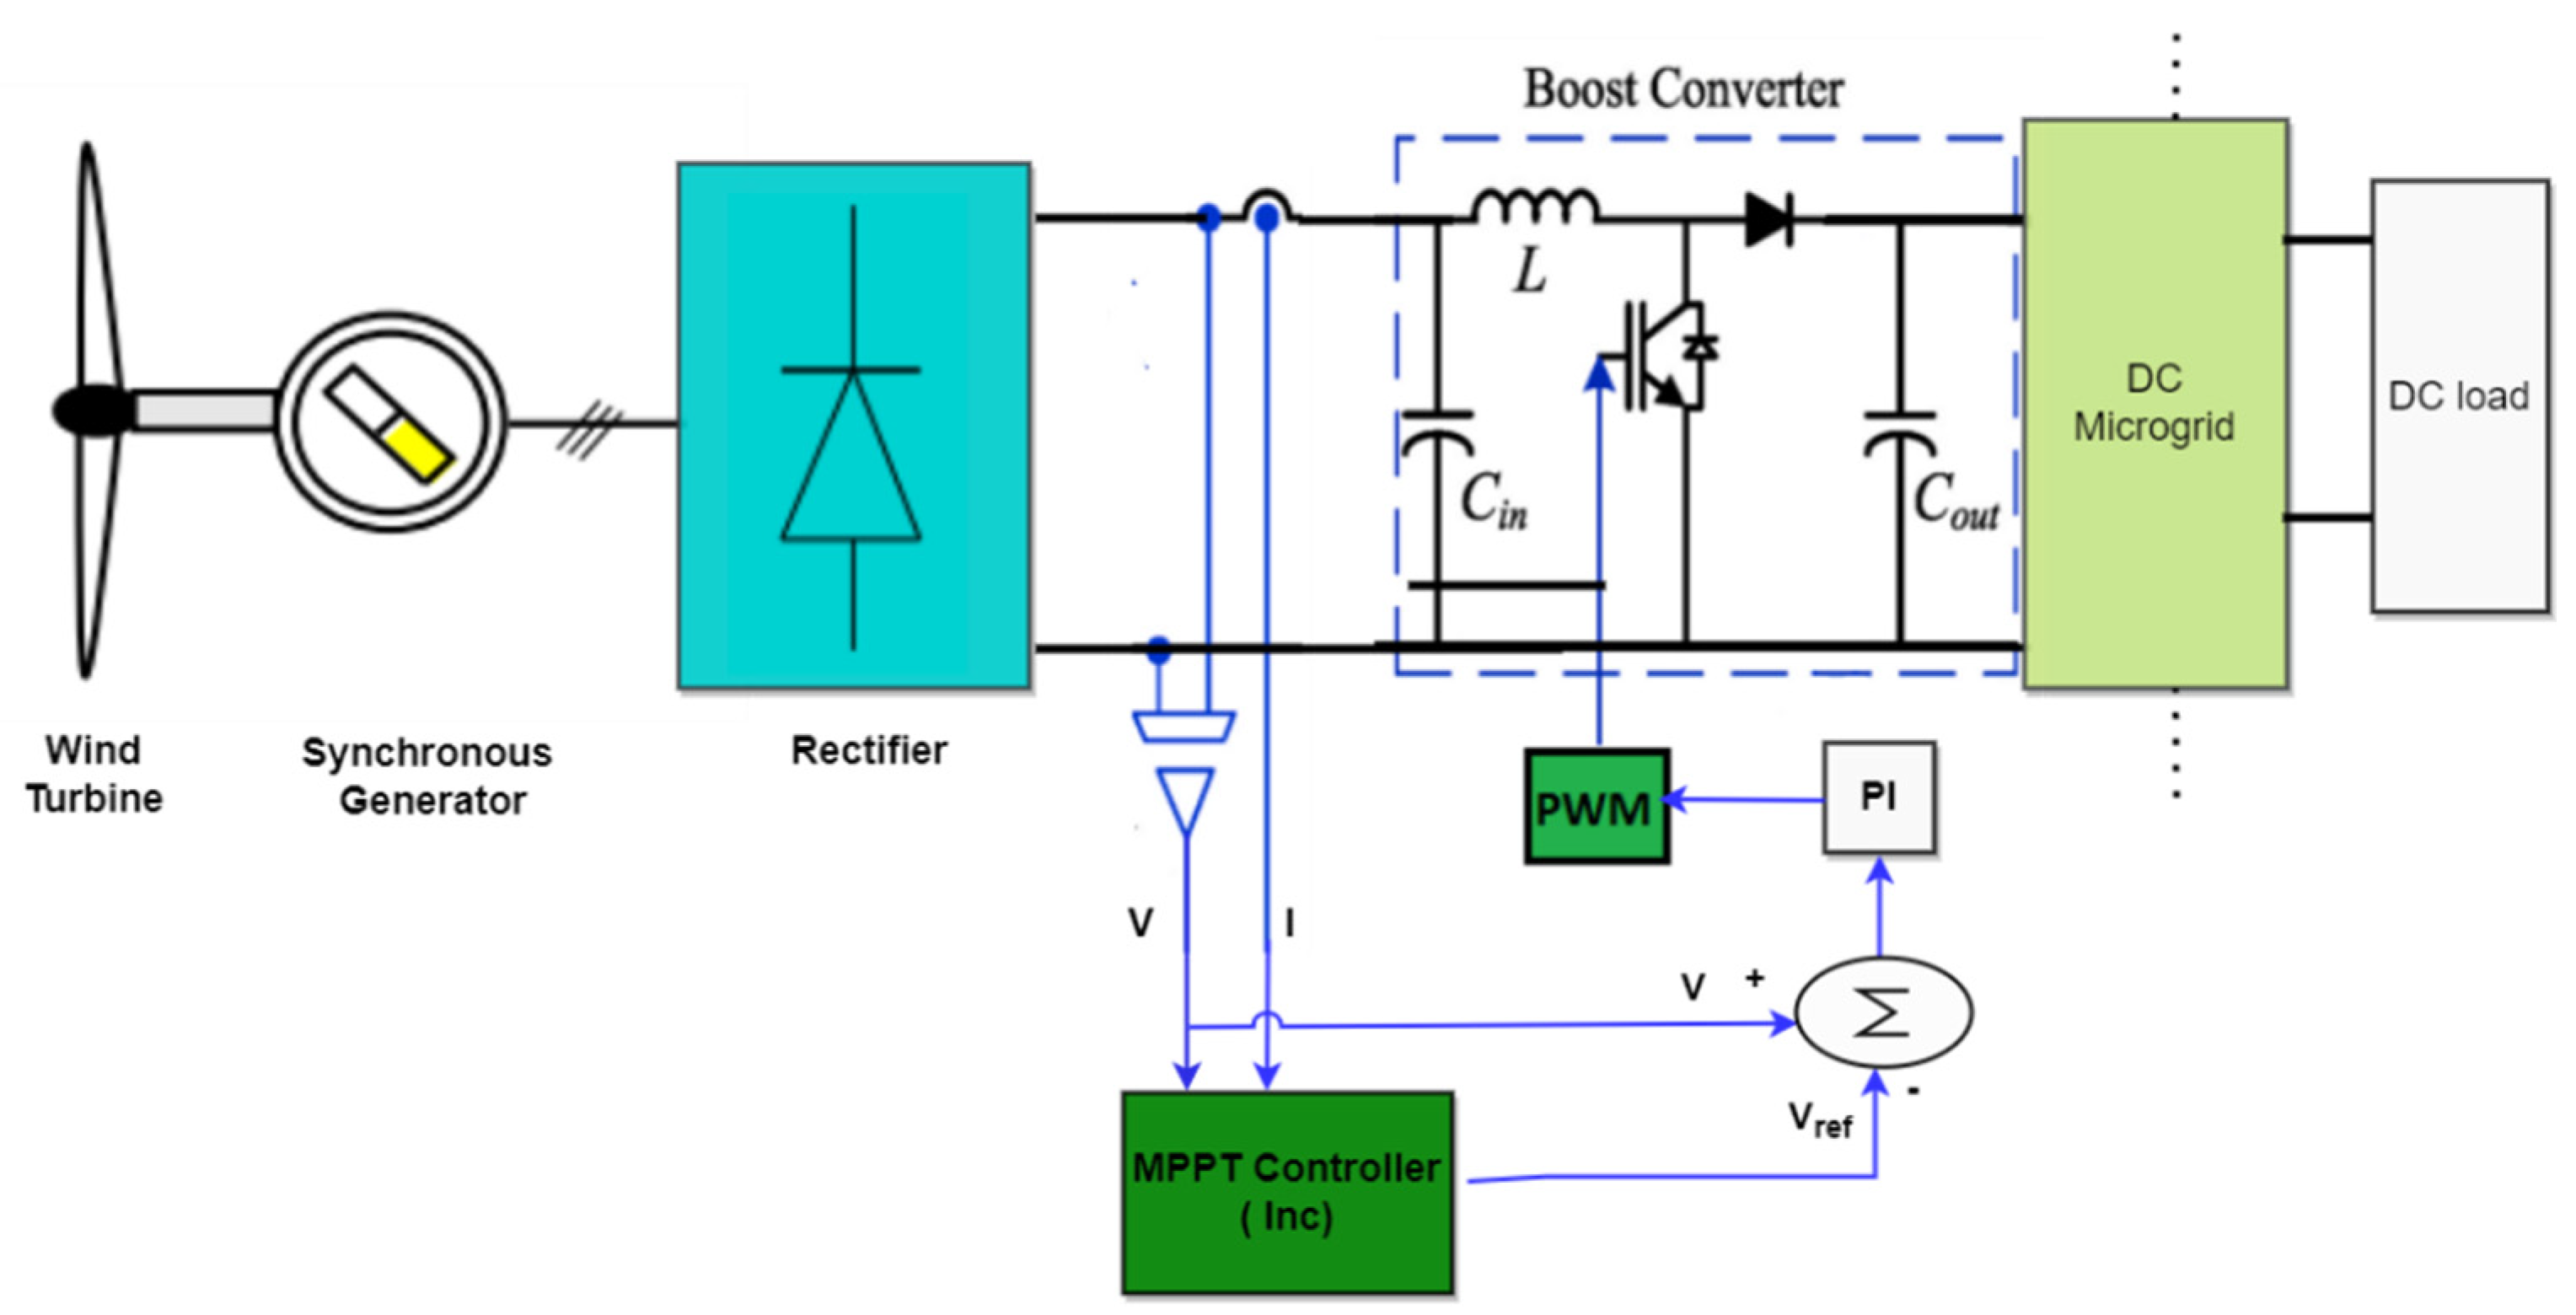
2.3. Wind System
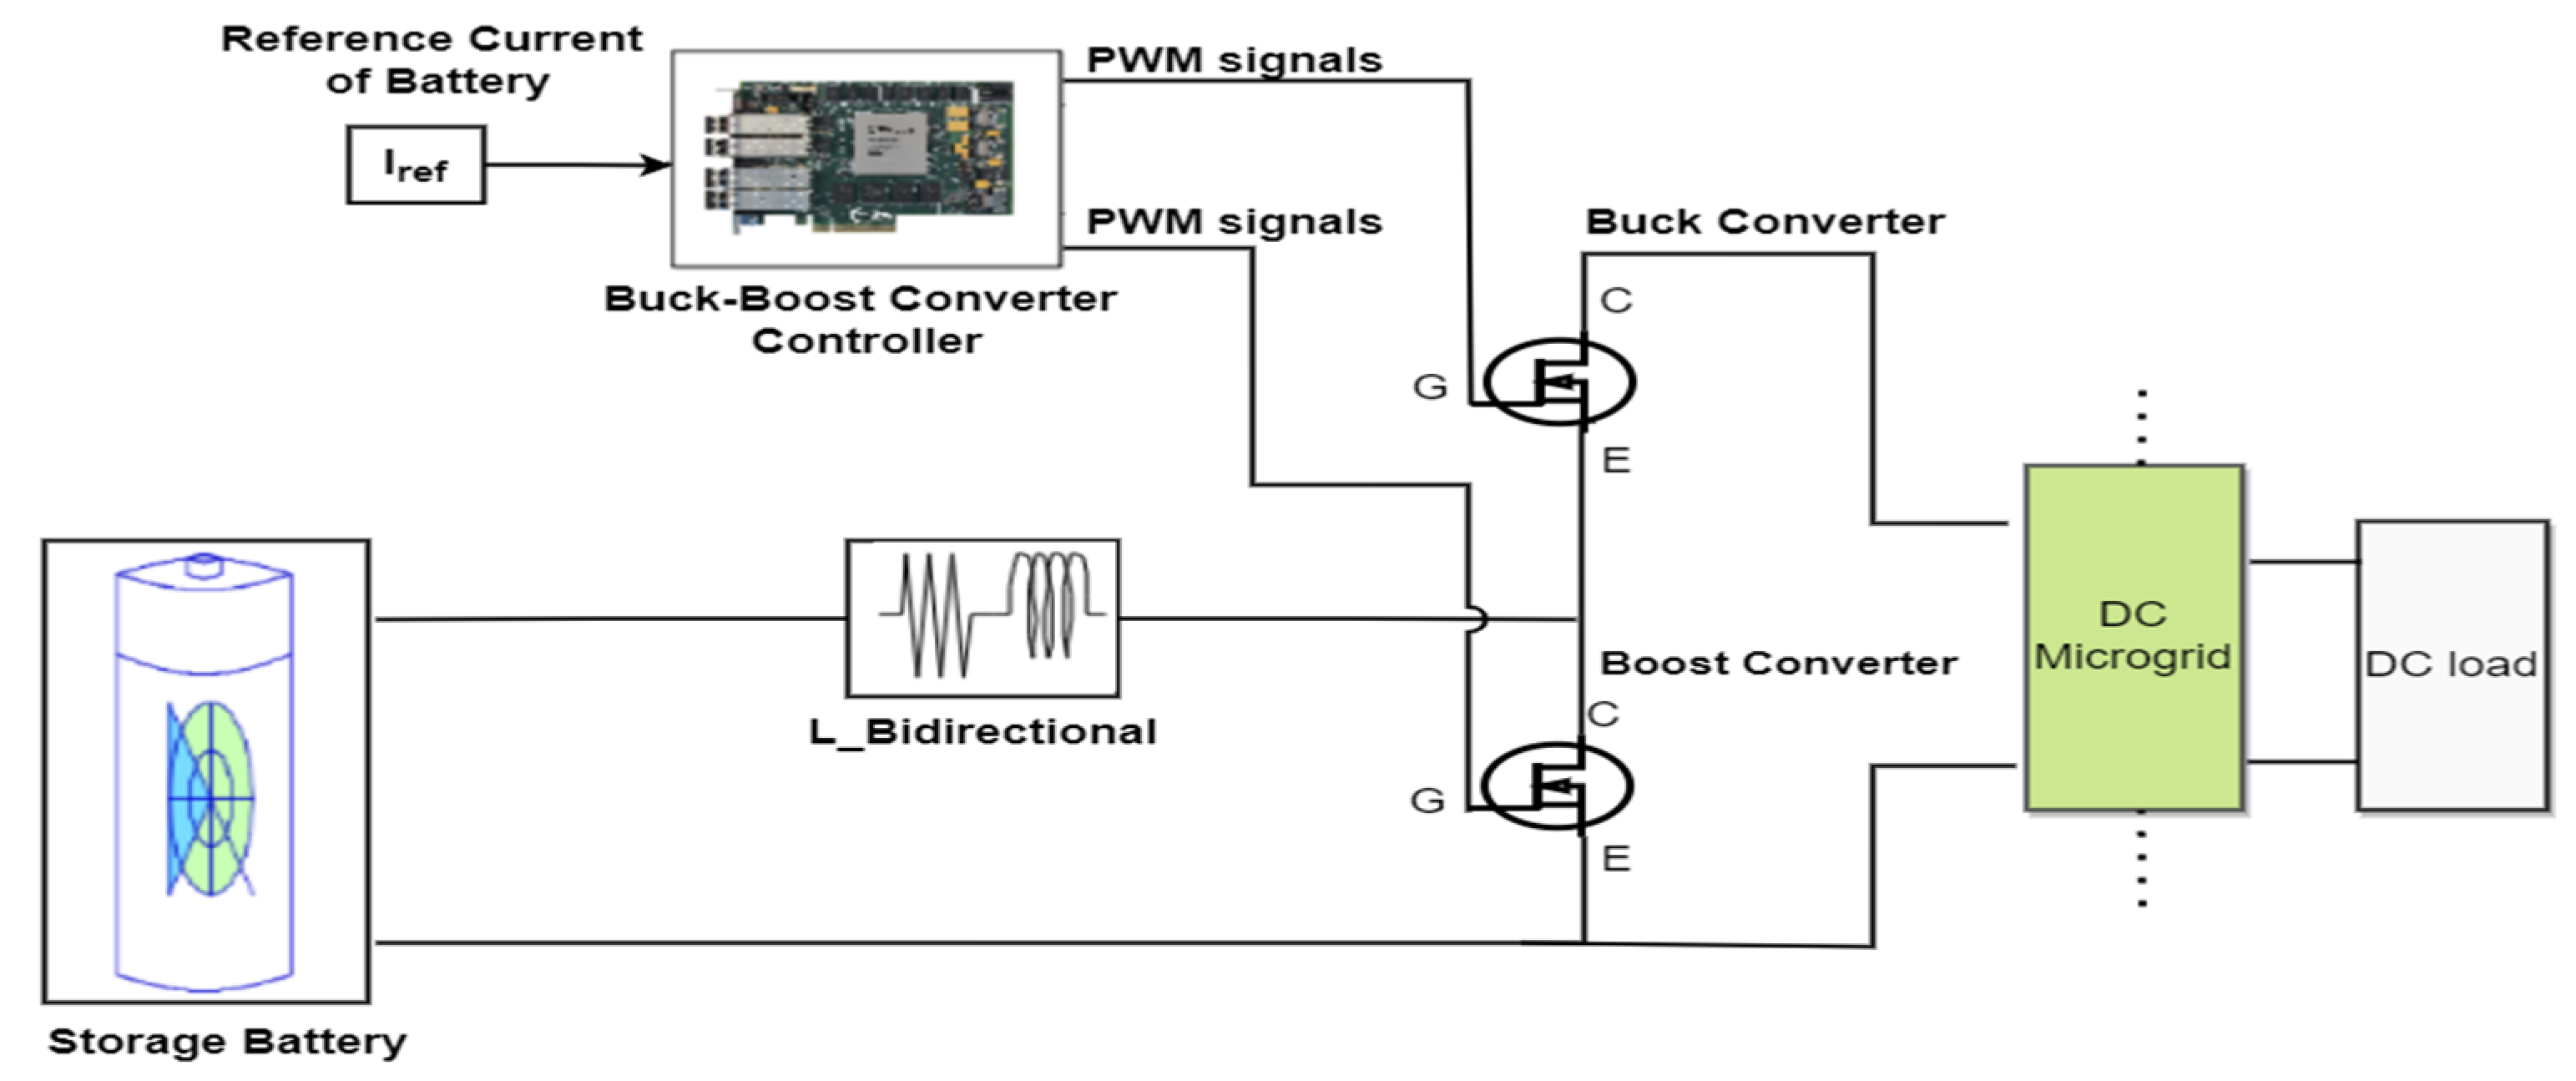
2.4. Storage System
3. Methodology
3.1. Incremental-Conductance Algorithm
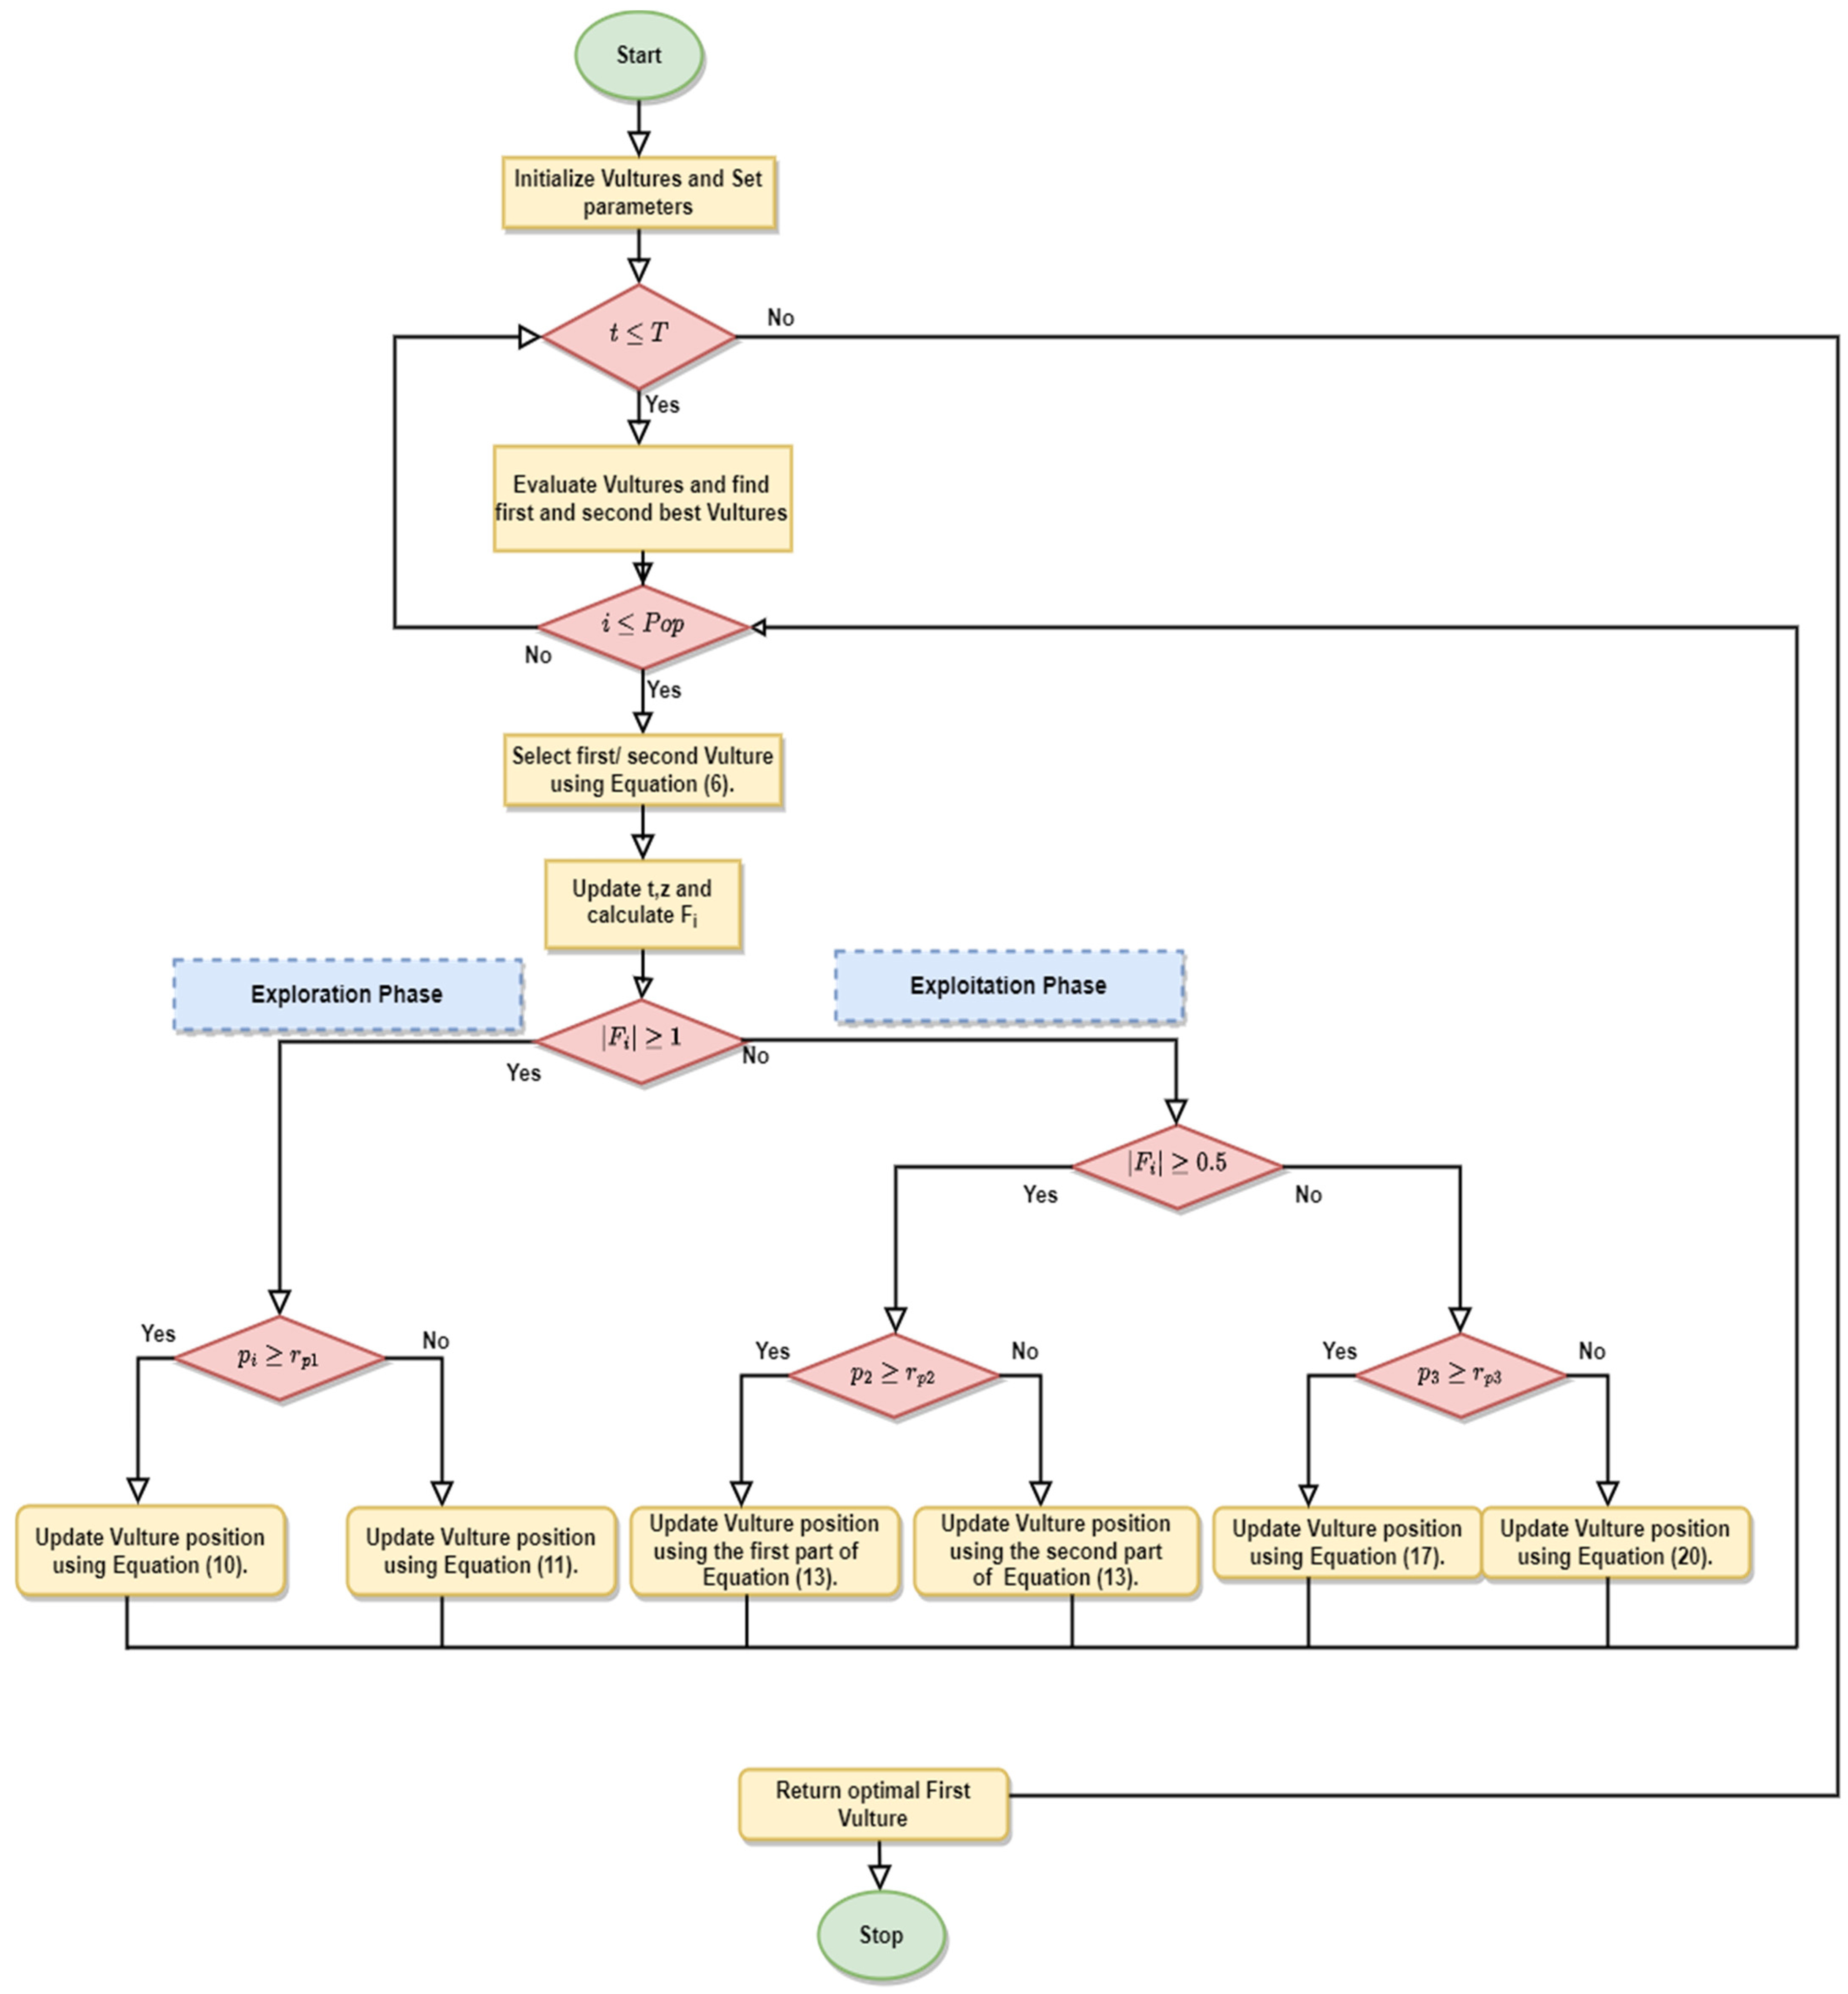
3.2. African Vulture Optimization Algorithm
- The African vulture population has N vultures, and each vulture’s position space is specified in d dimensions.
- The population of vultures is separated into three groups. The vultures’ quality position is determined by the feasible solution’s fitness value; the best solution is recognized as the best and first vulture, the second solution is recognized as the second-best vulture, and the other vultures are assigned to the third group.
- In the population, the three groups are created so that the most important natural role of vultures could be formulated. As a result, various vulture species play distinct roles.
- Also, the fitness value of the possible solution can reflect the benefits and drawbacks of vultures. Therefore, the weakest and most hungry vultures correlate to the worst vultures. The strongest and most numerous vultures, on the other hand, correlate to the best vulture at the time. Generally, all vultures in the AVOA aim to be near the best vultures while avoiding the worst.
- Phase 1: Population Grouping
- b.
- Phase 2: The Rate of Starvation of Vultures
- c.
- Phase 3: Exploration Stage
- d.
- Phase 4: Exploitation (First Stage)
- e.
- Phase 5: Exploitation (Second Stage)
4. Results and Discussion
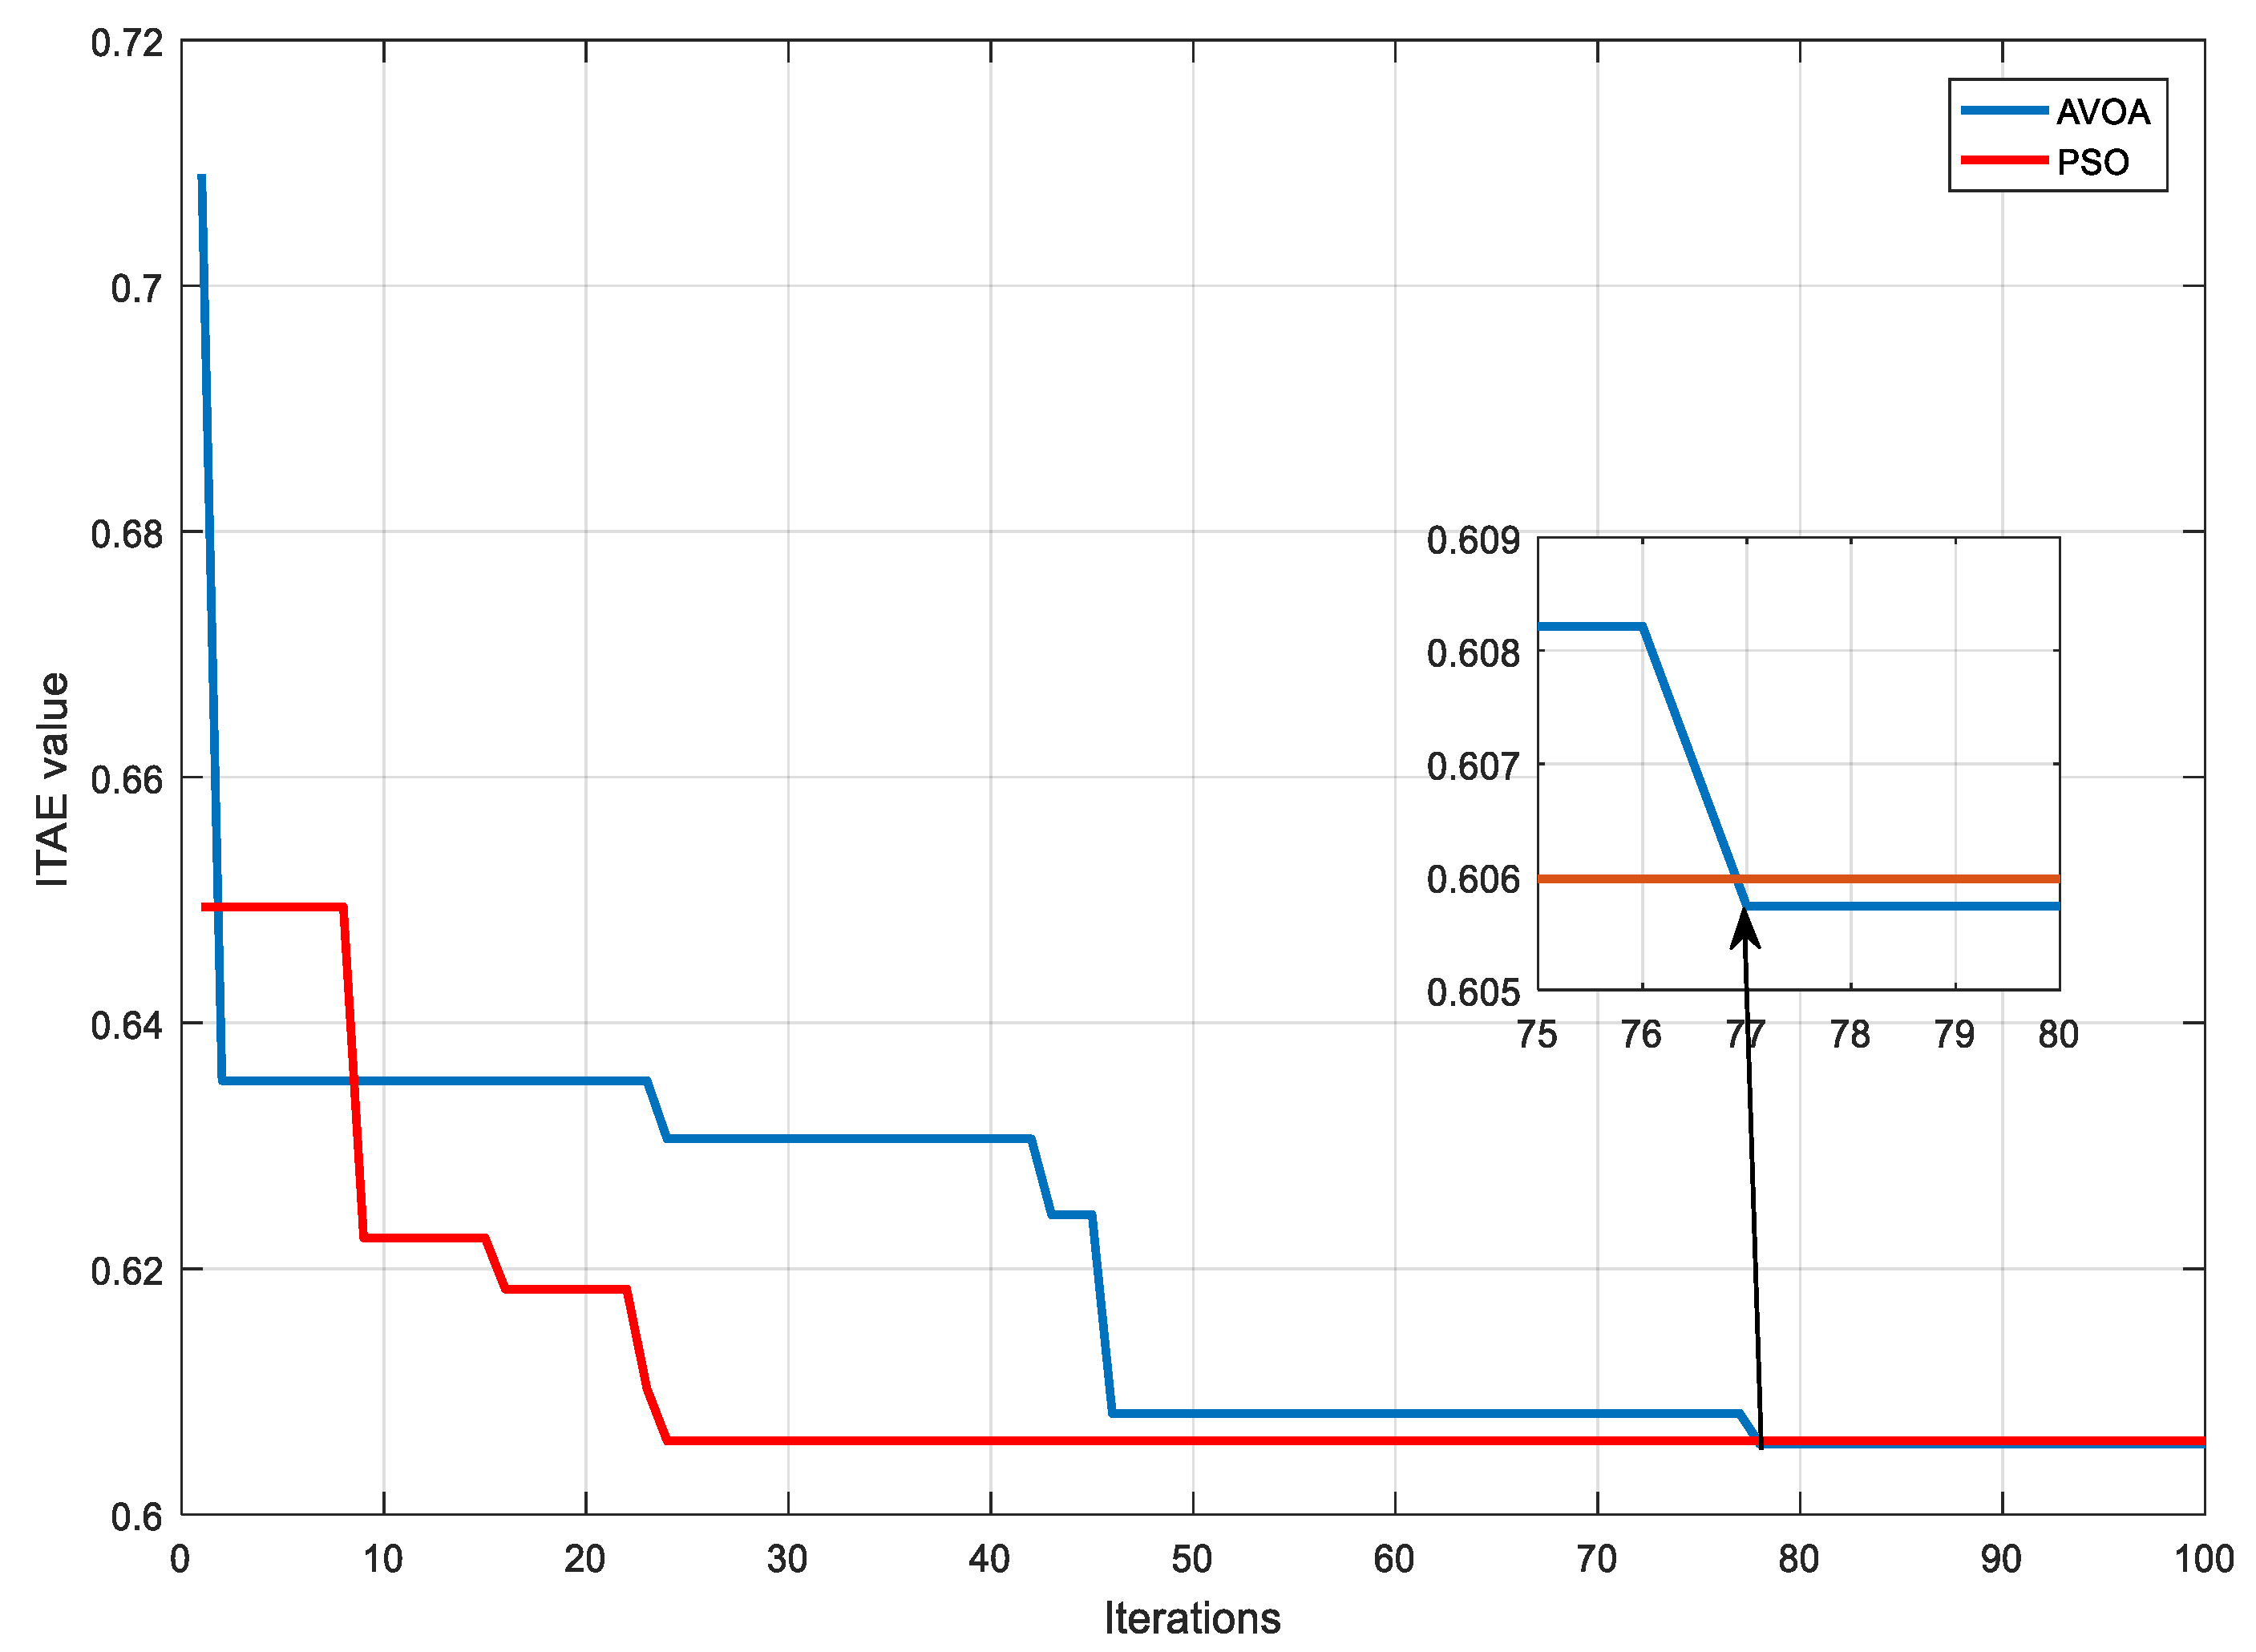
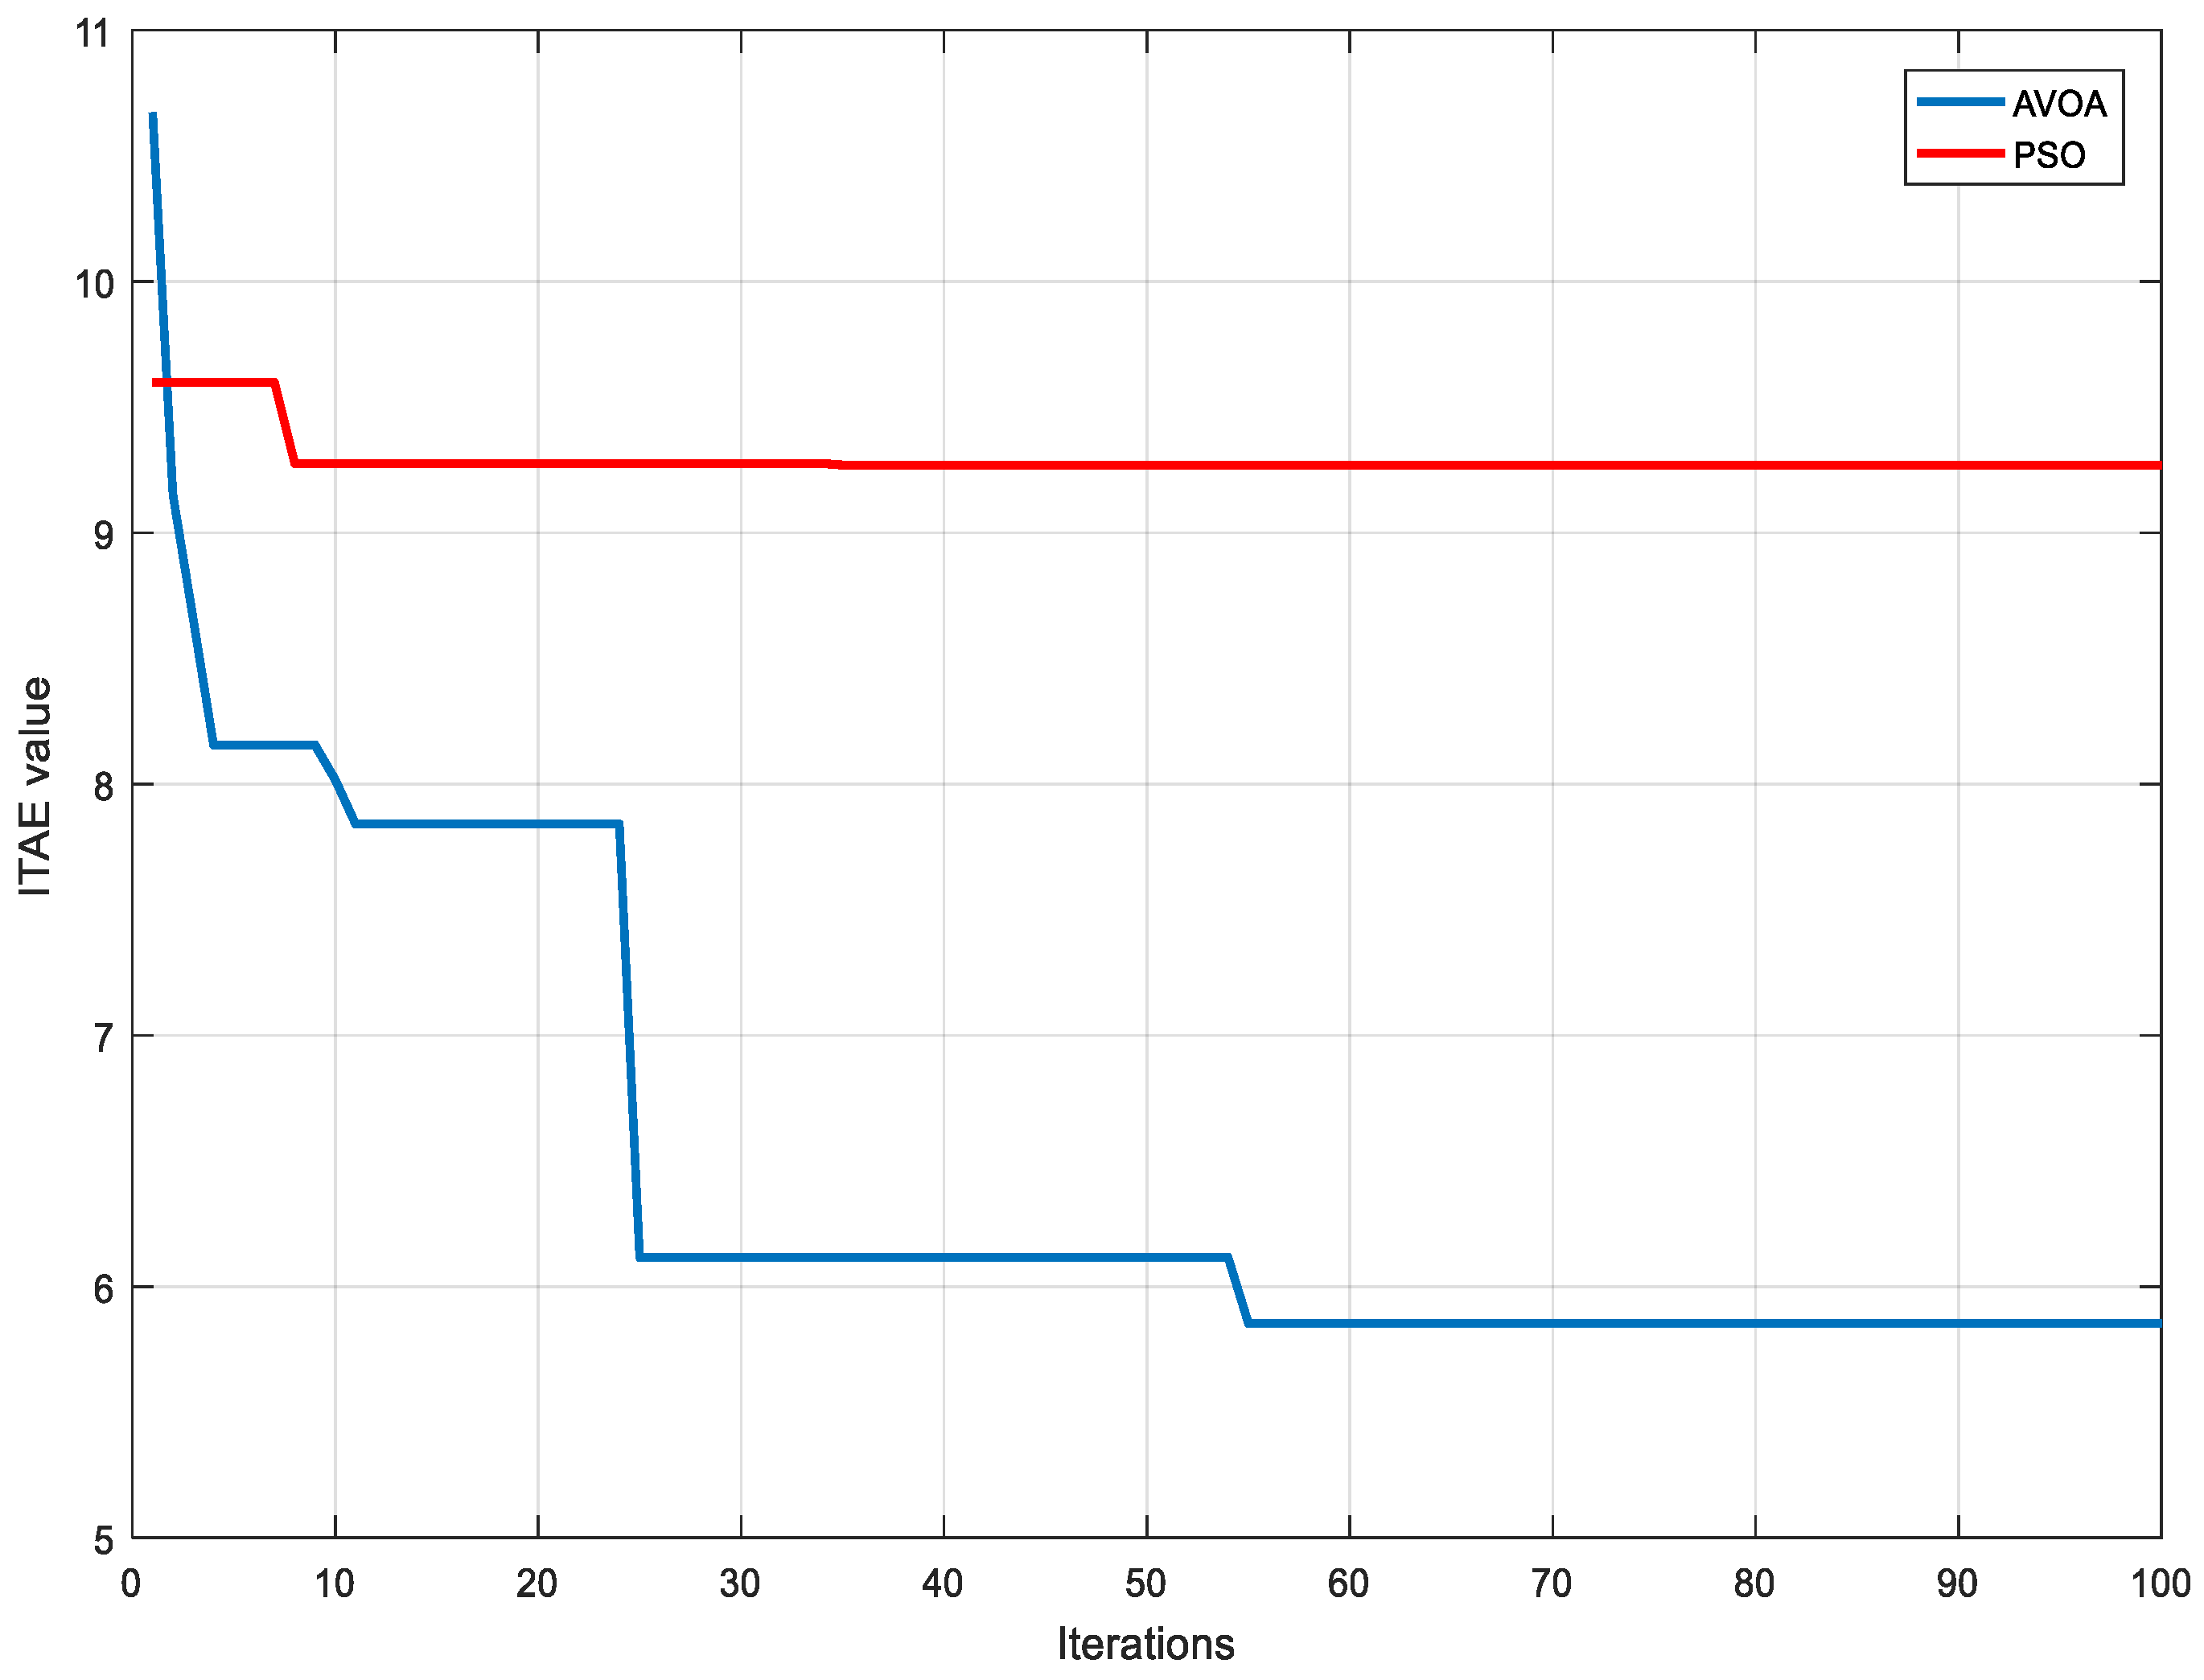
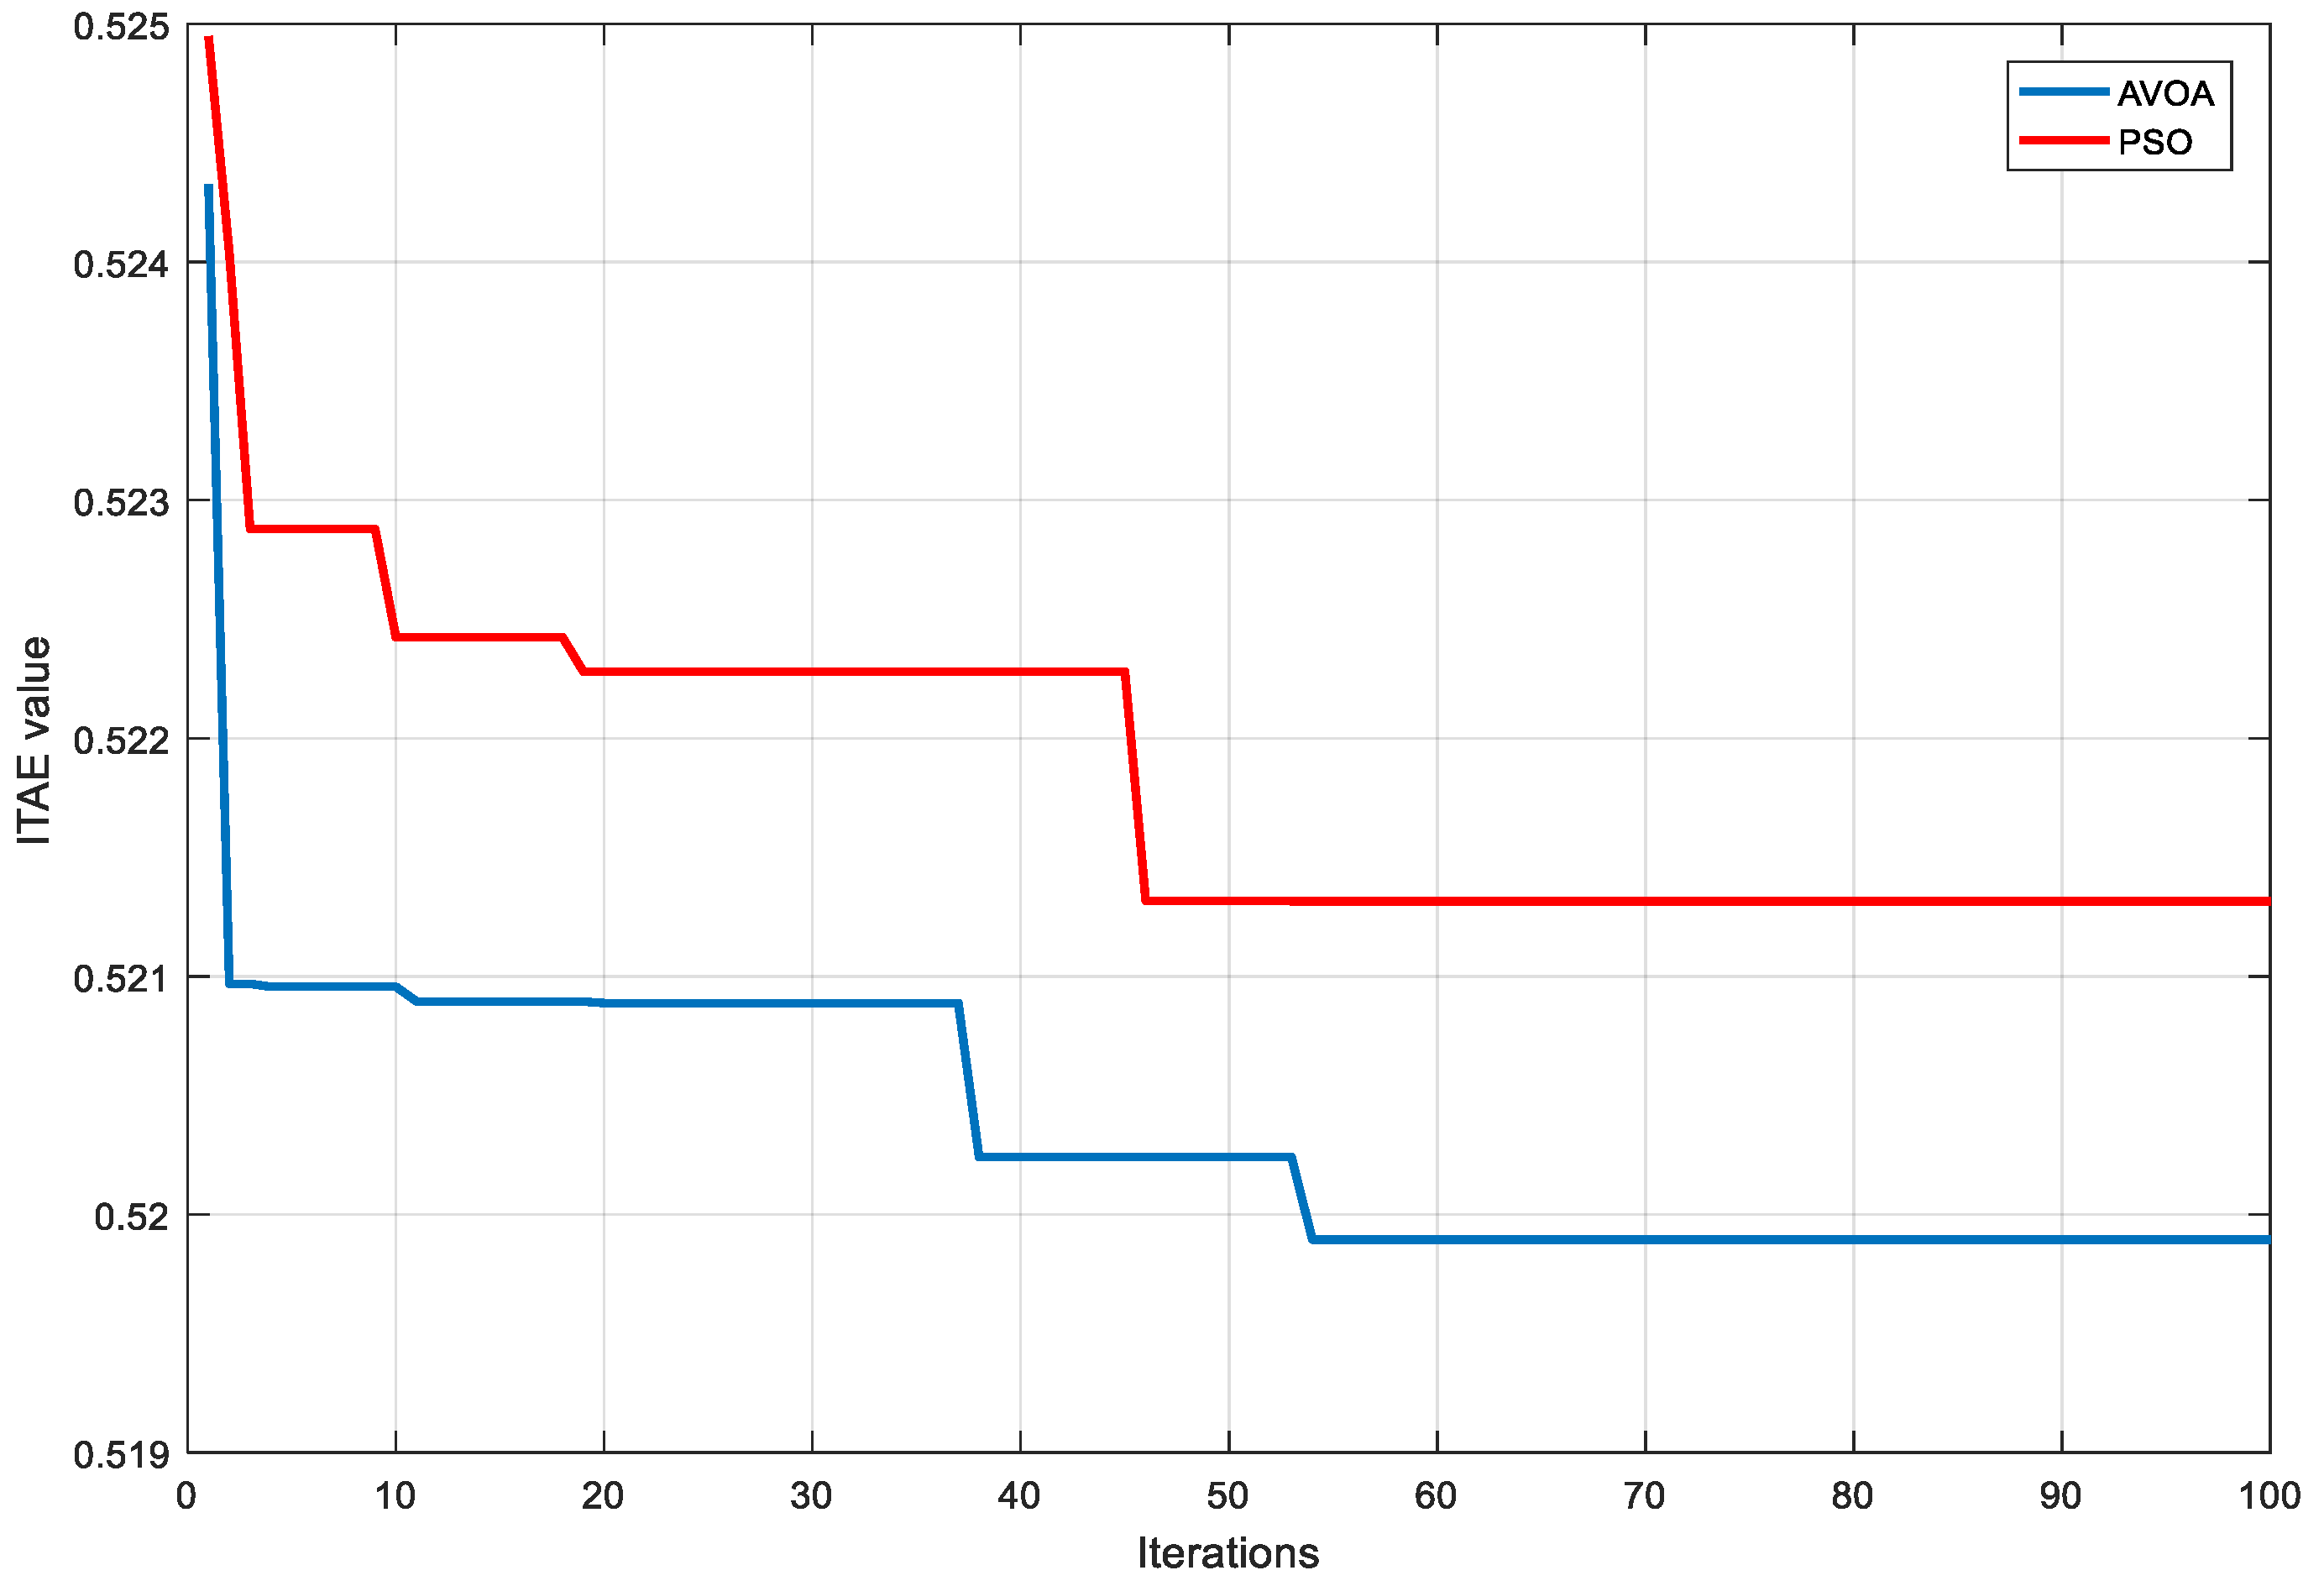
4.1. Optimization Results
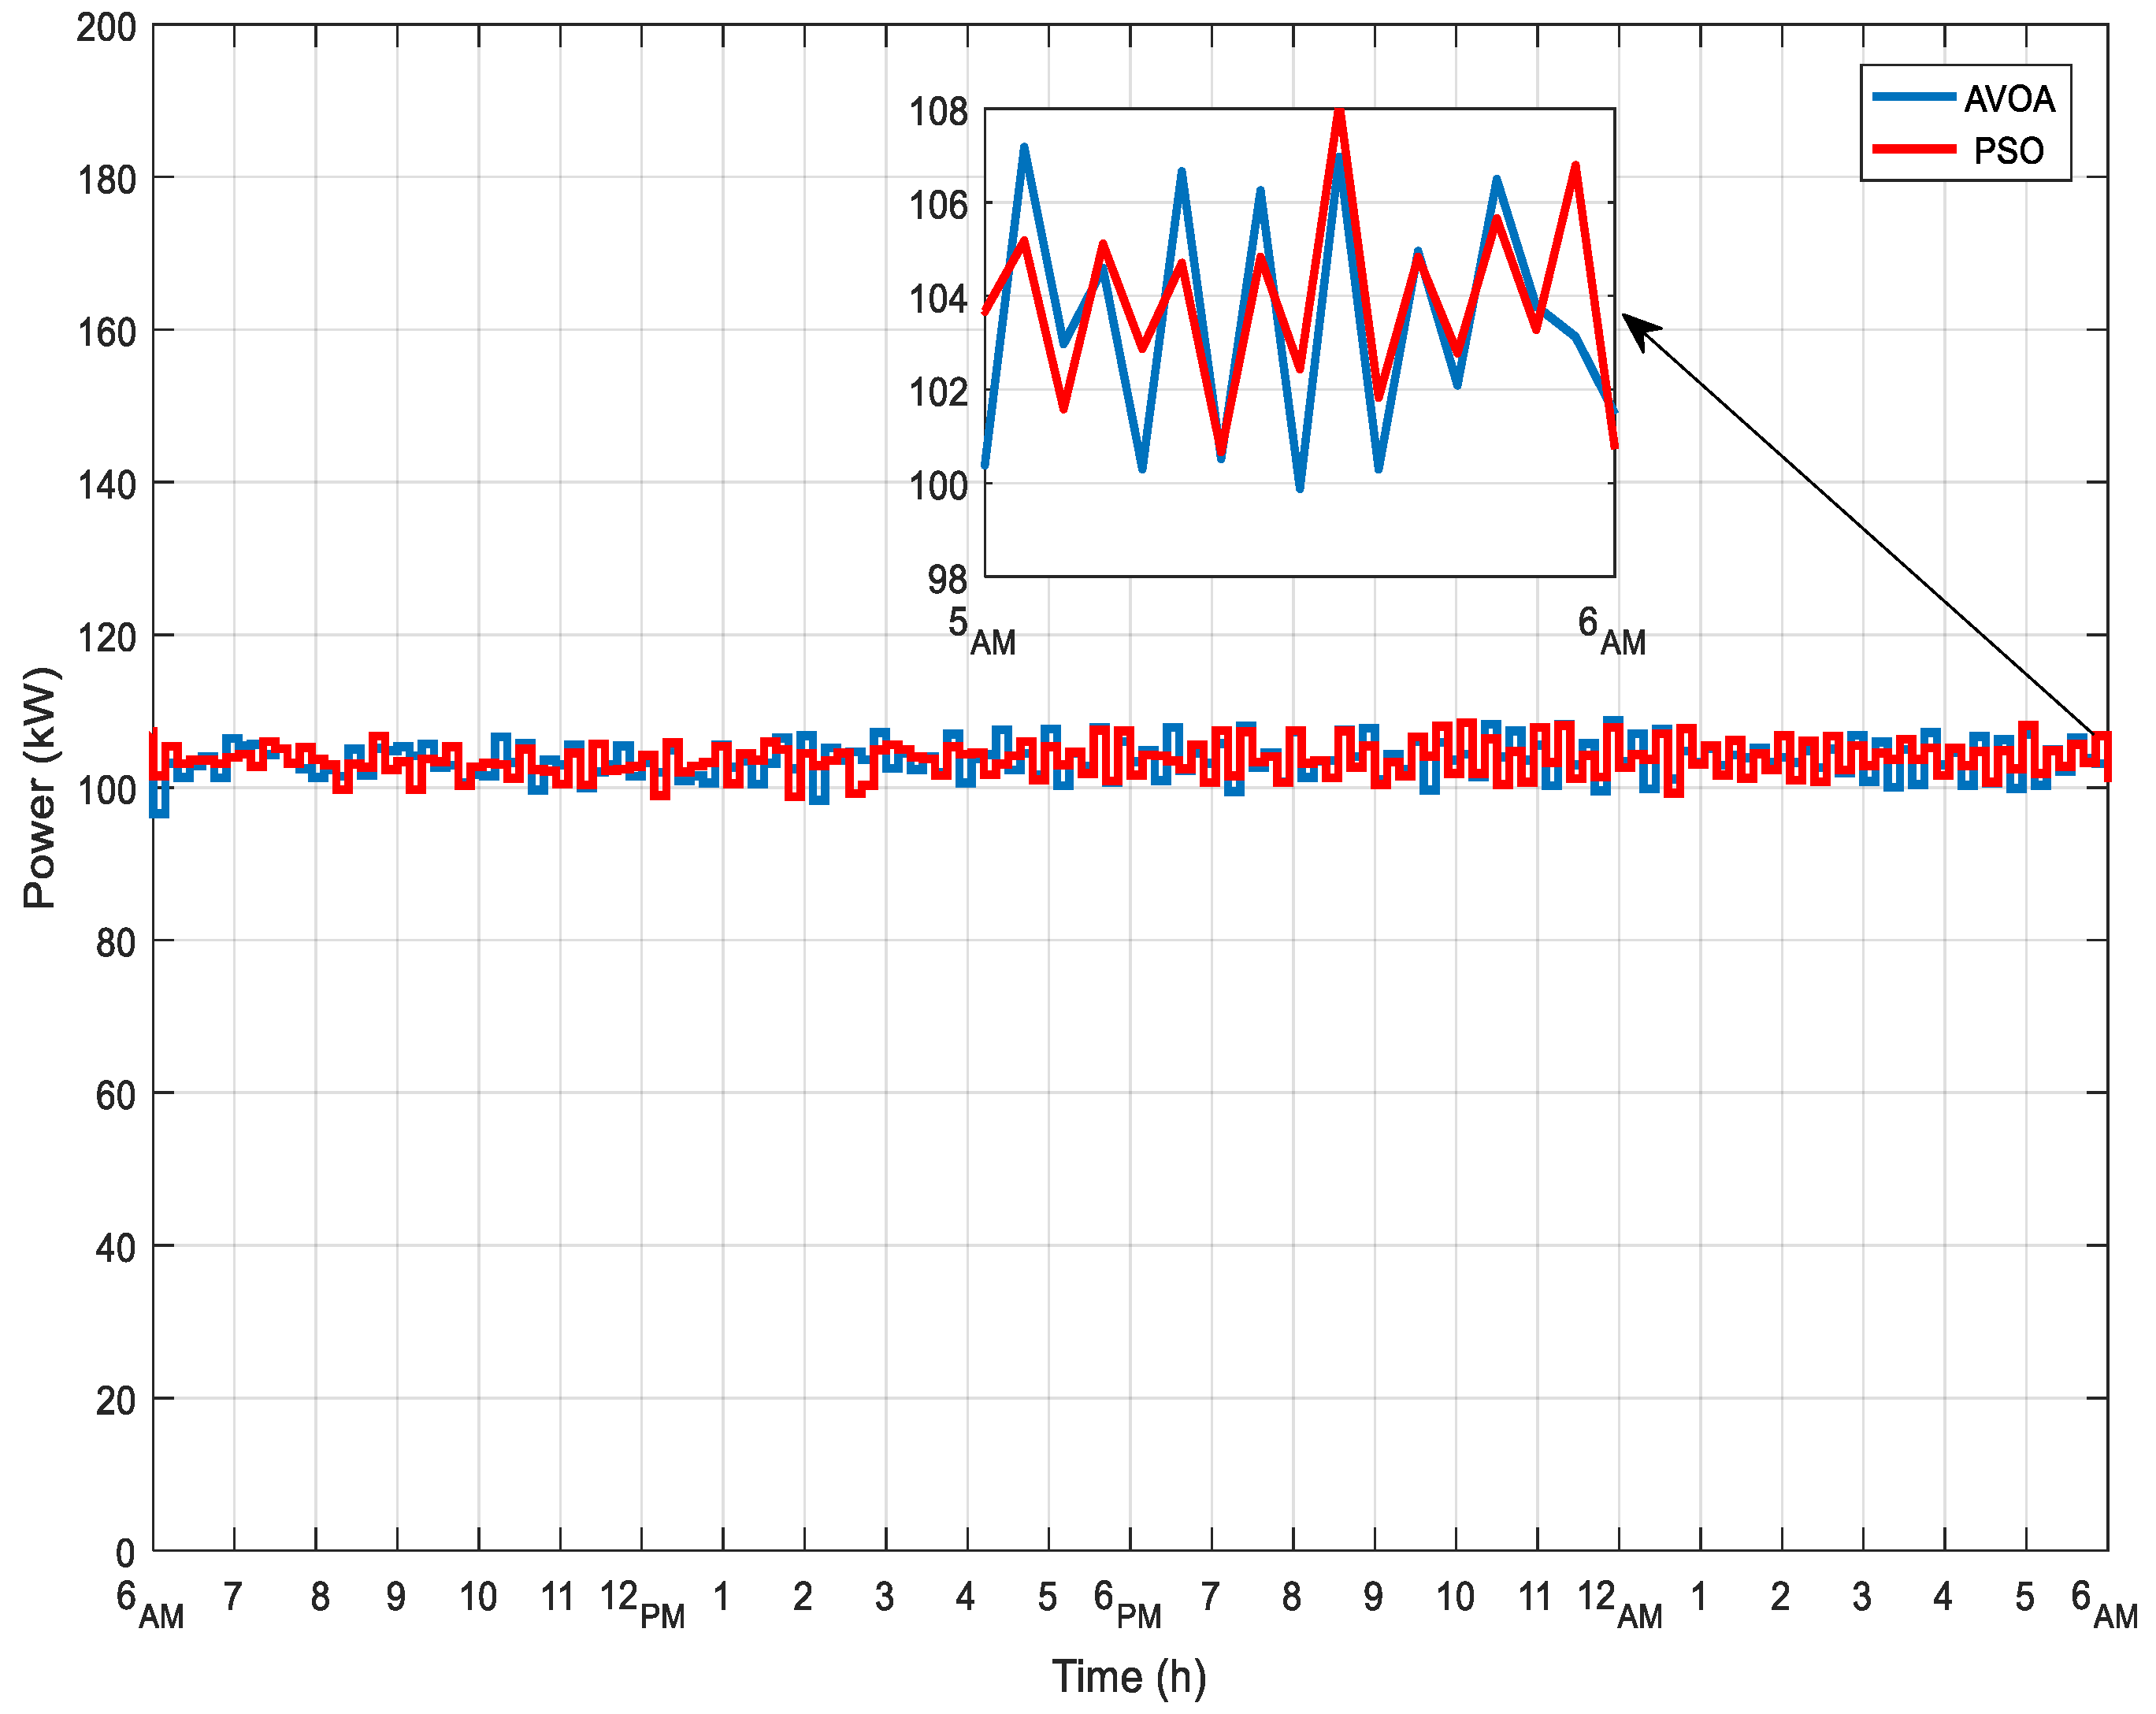
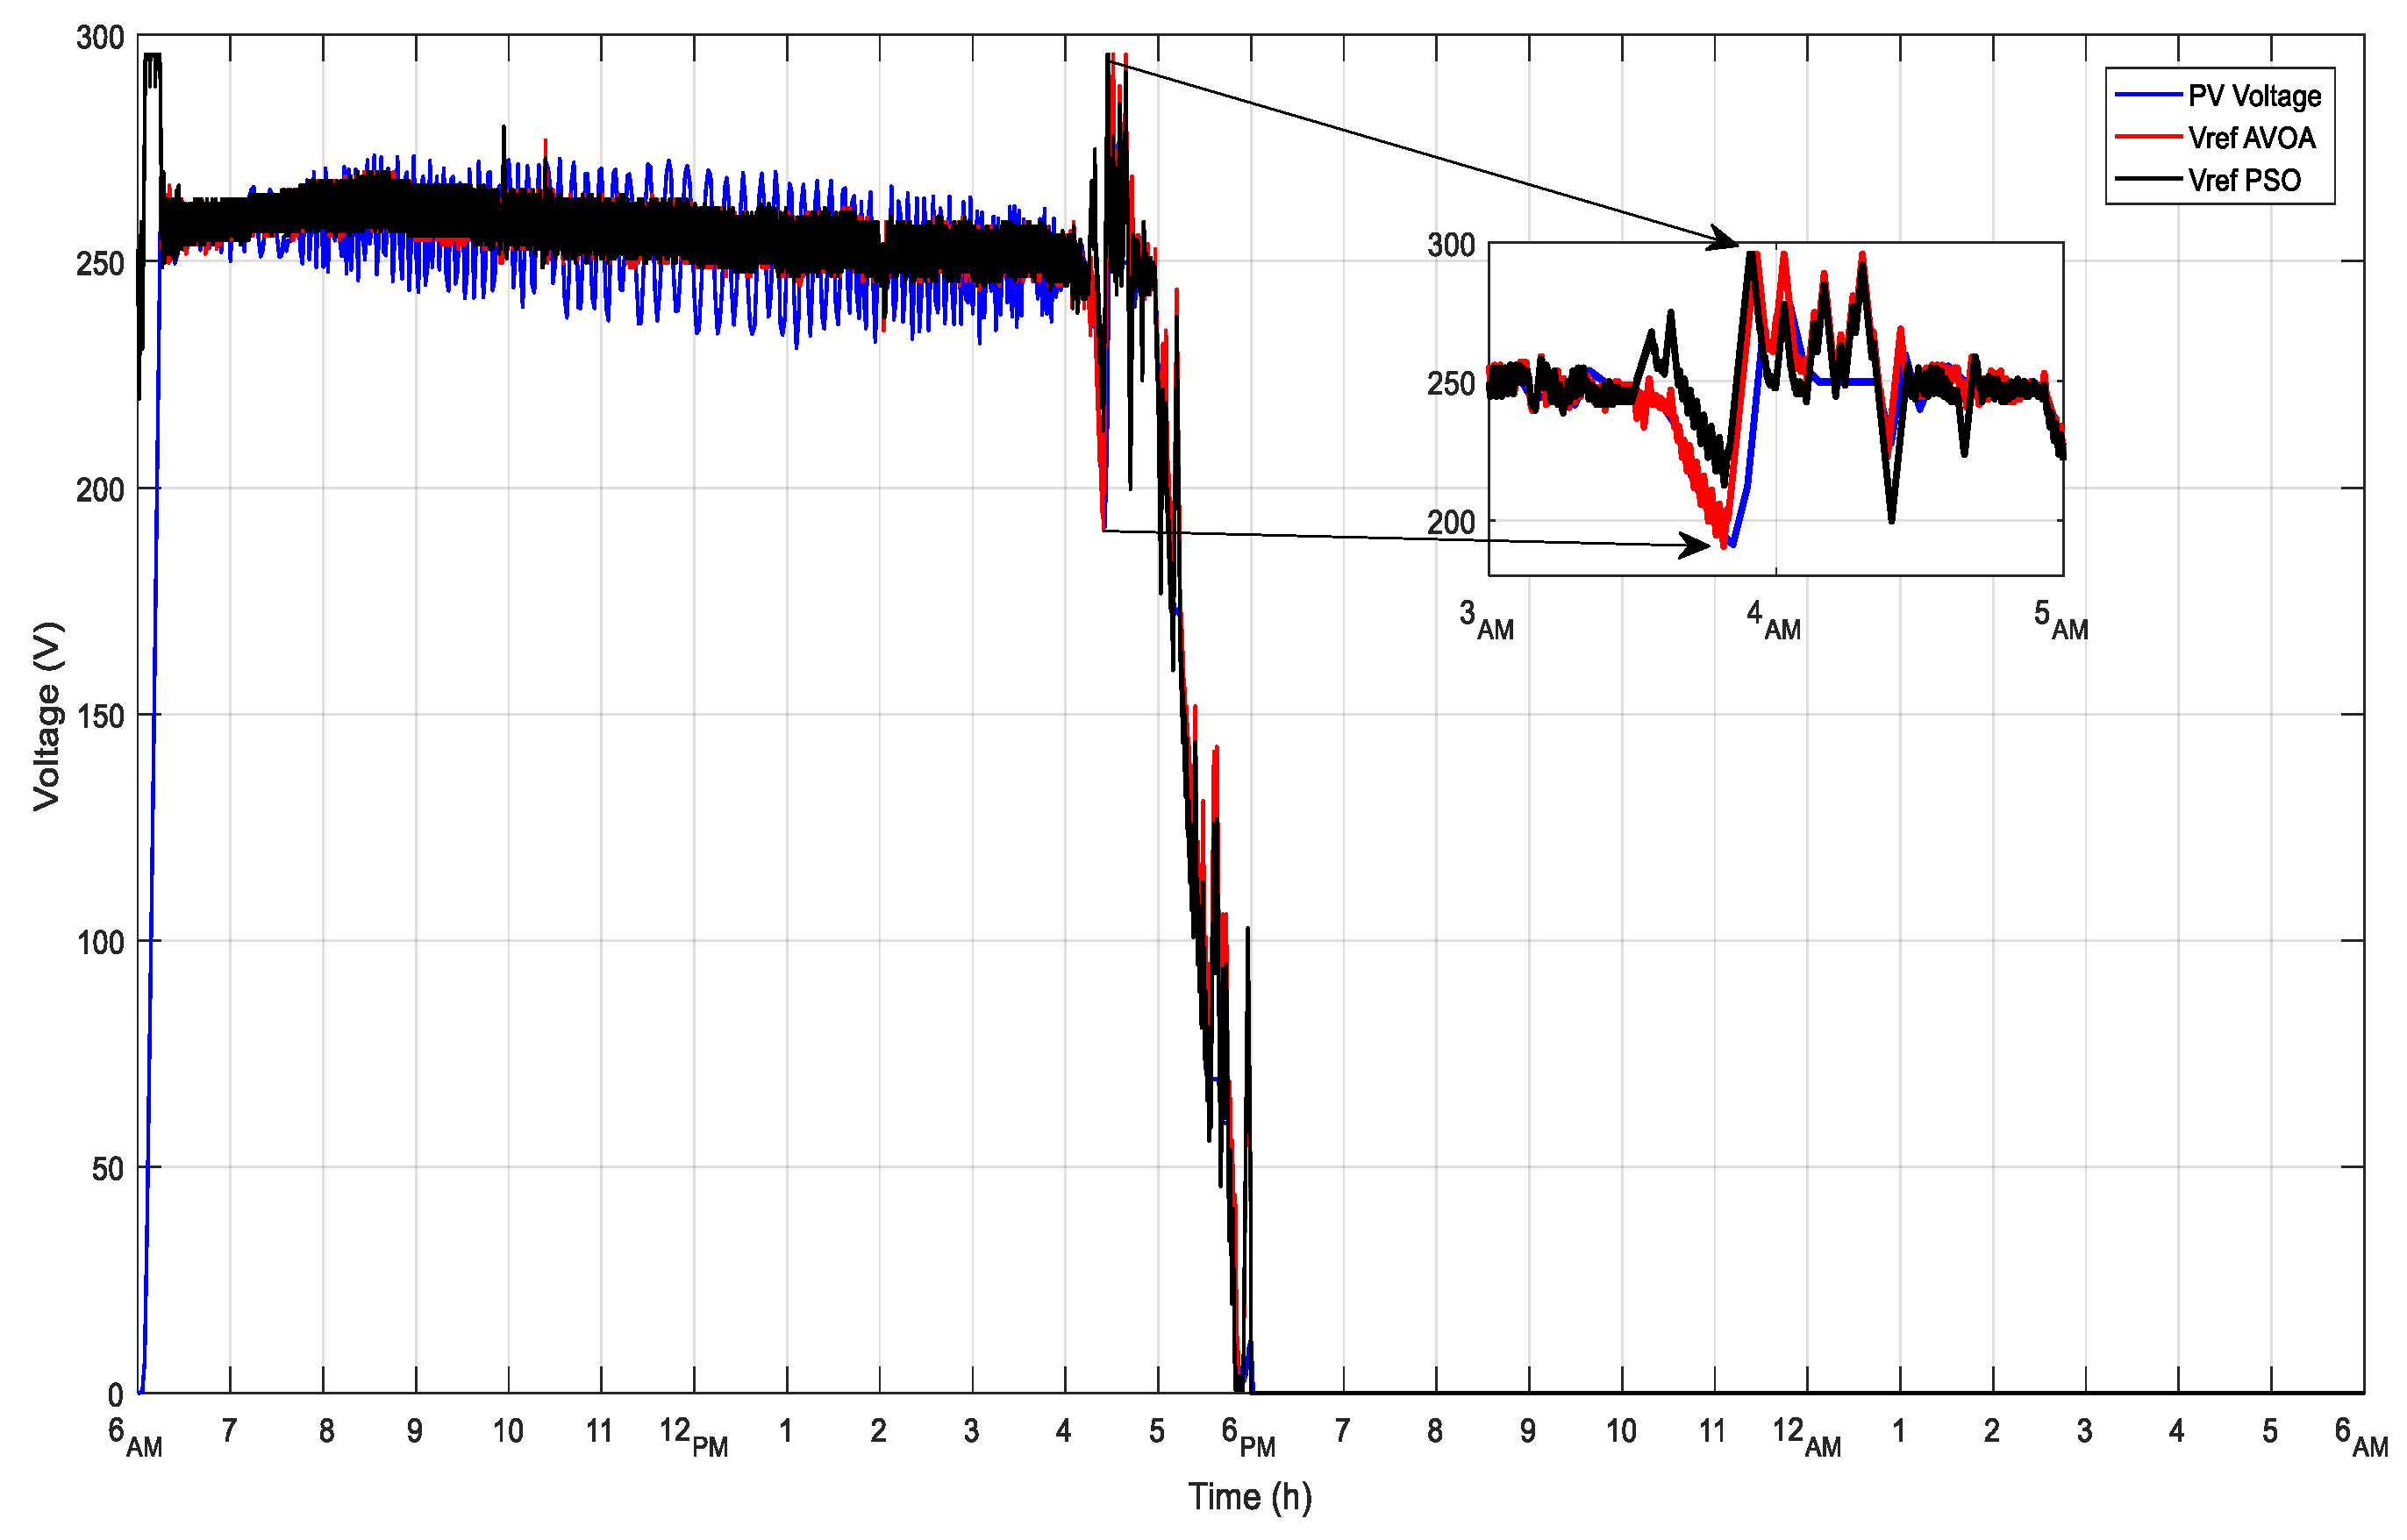
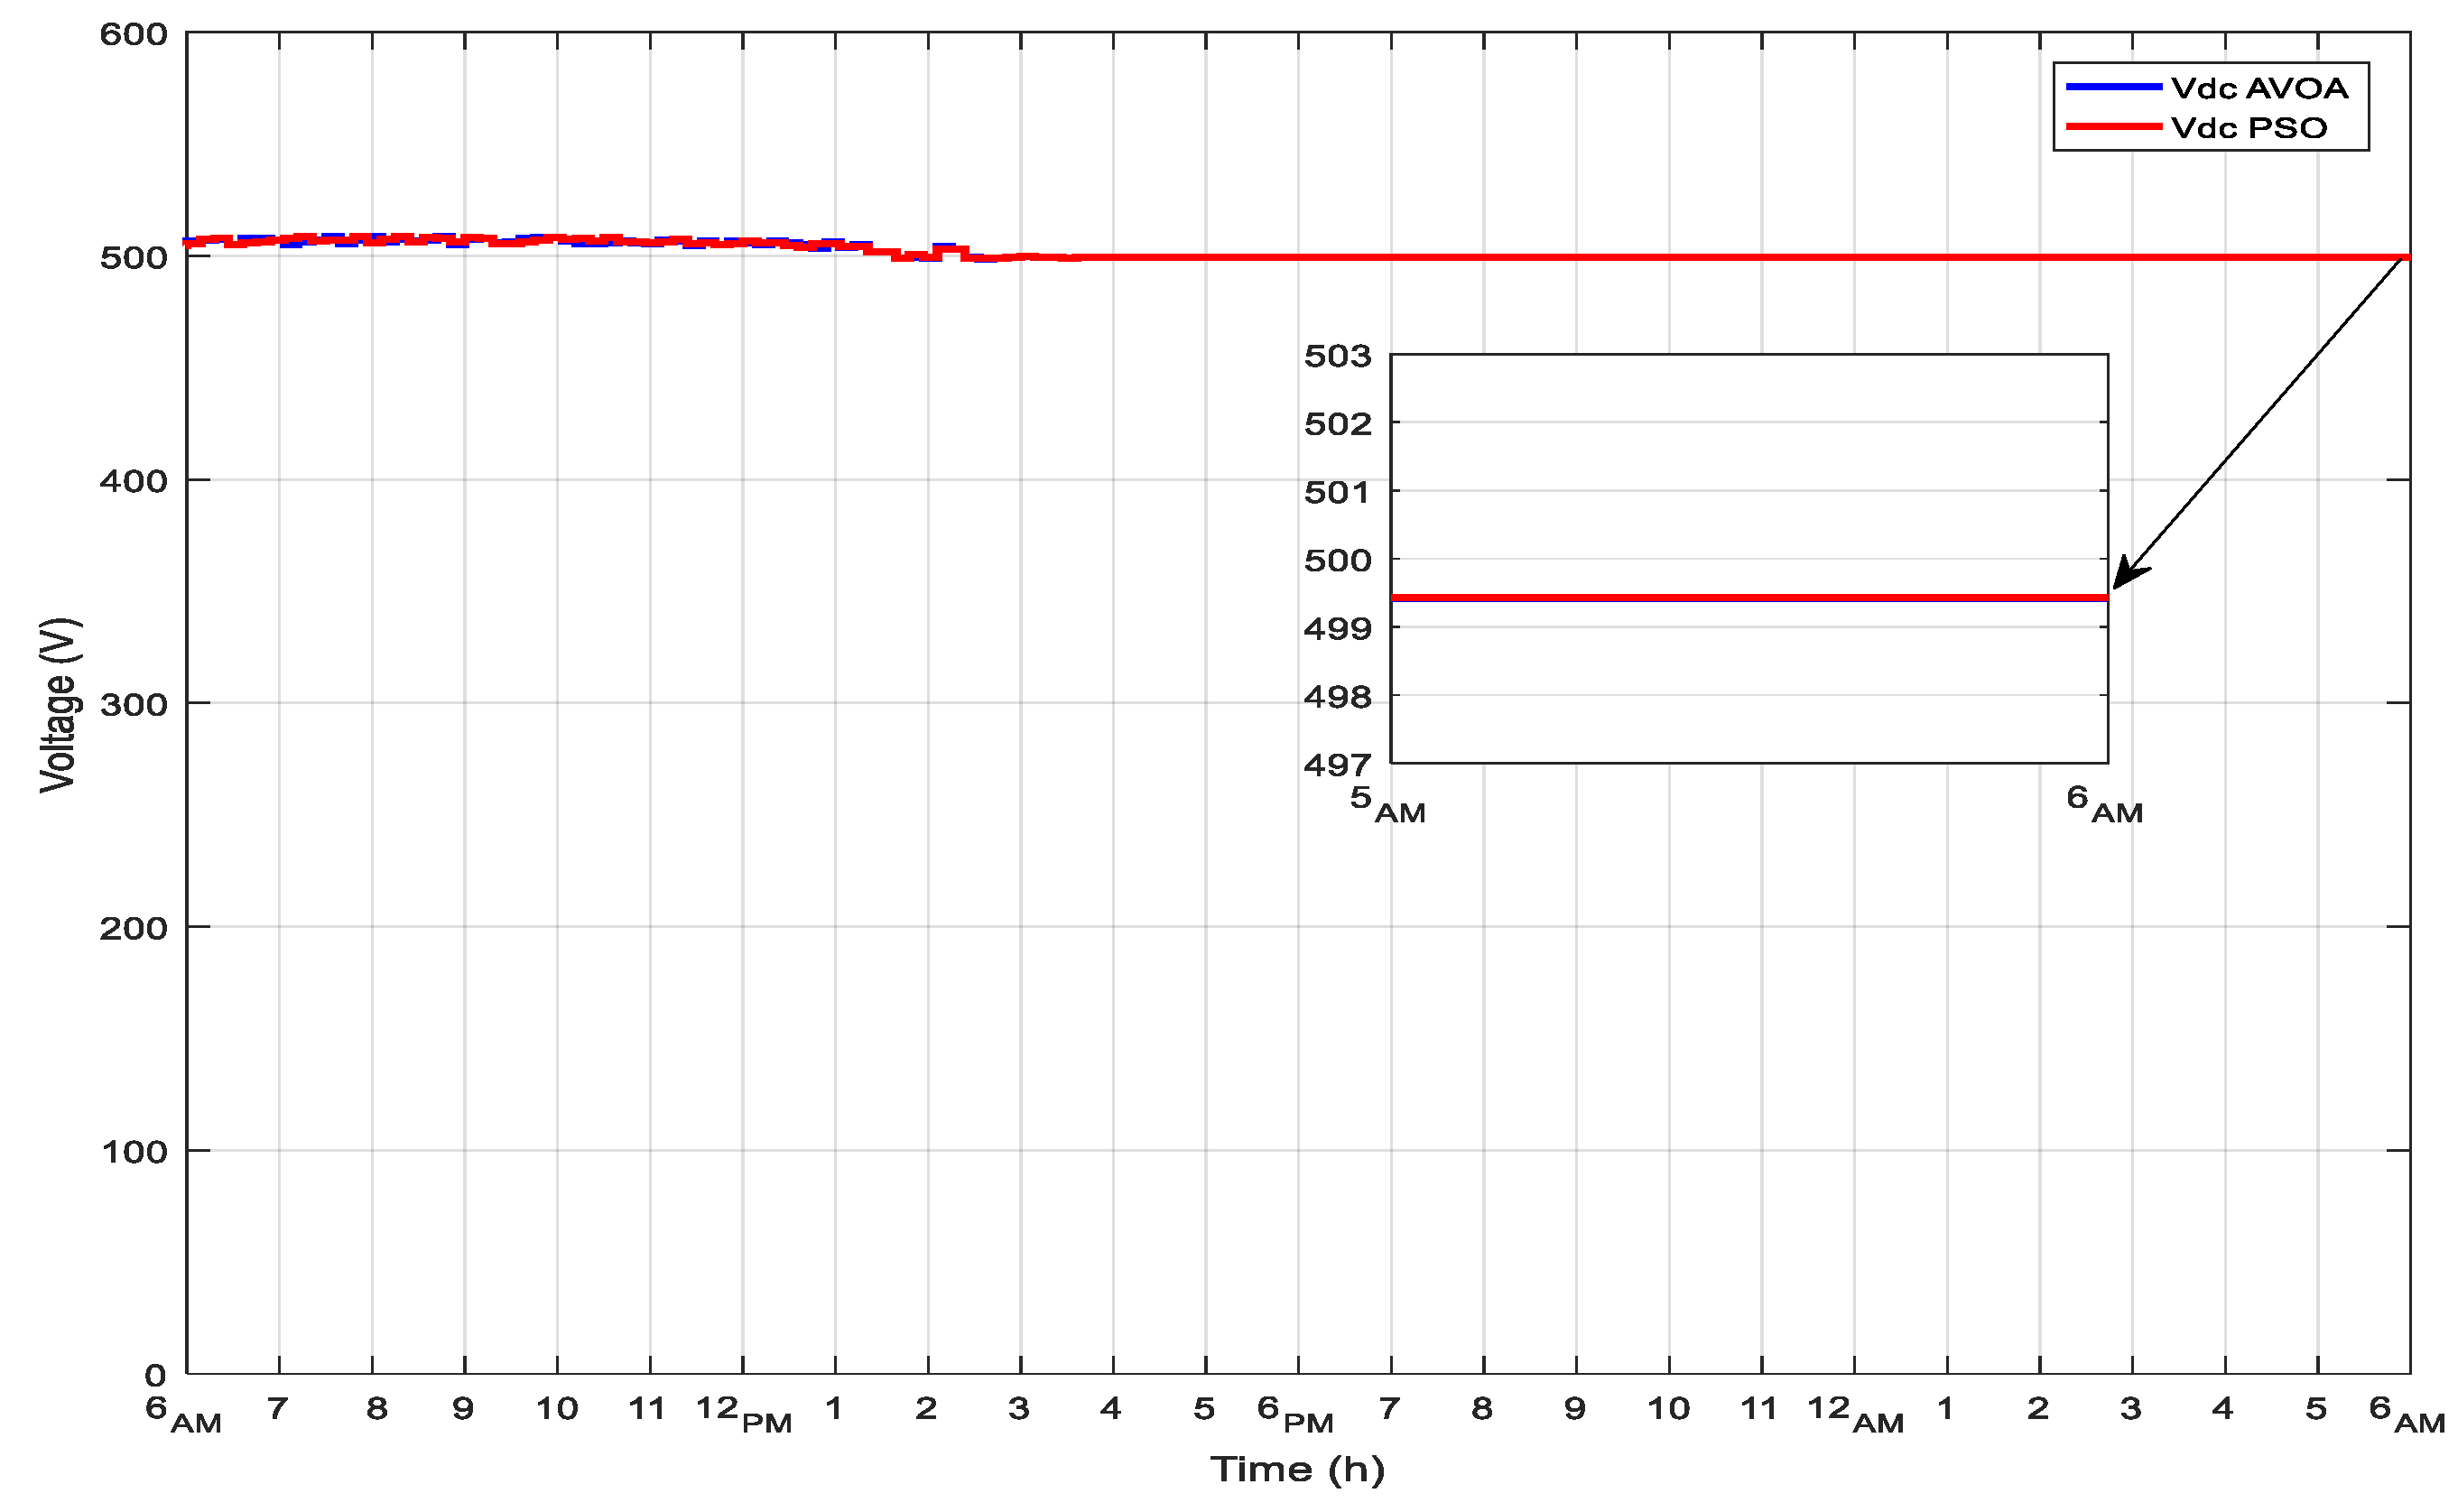
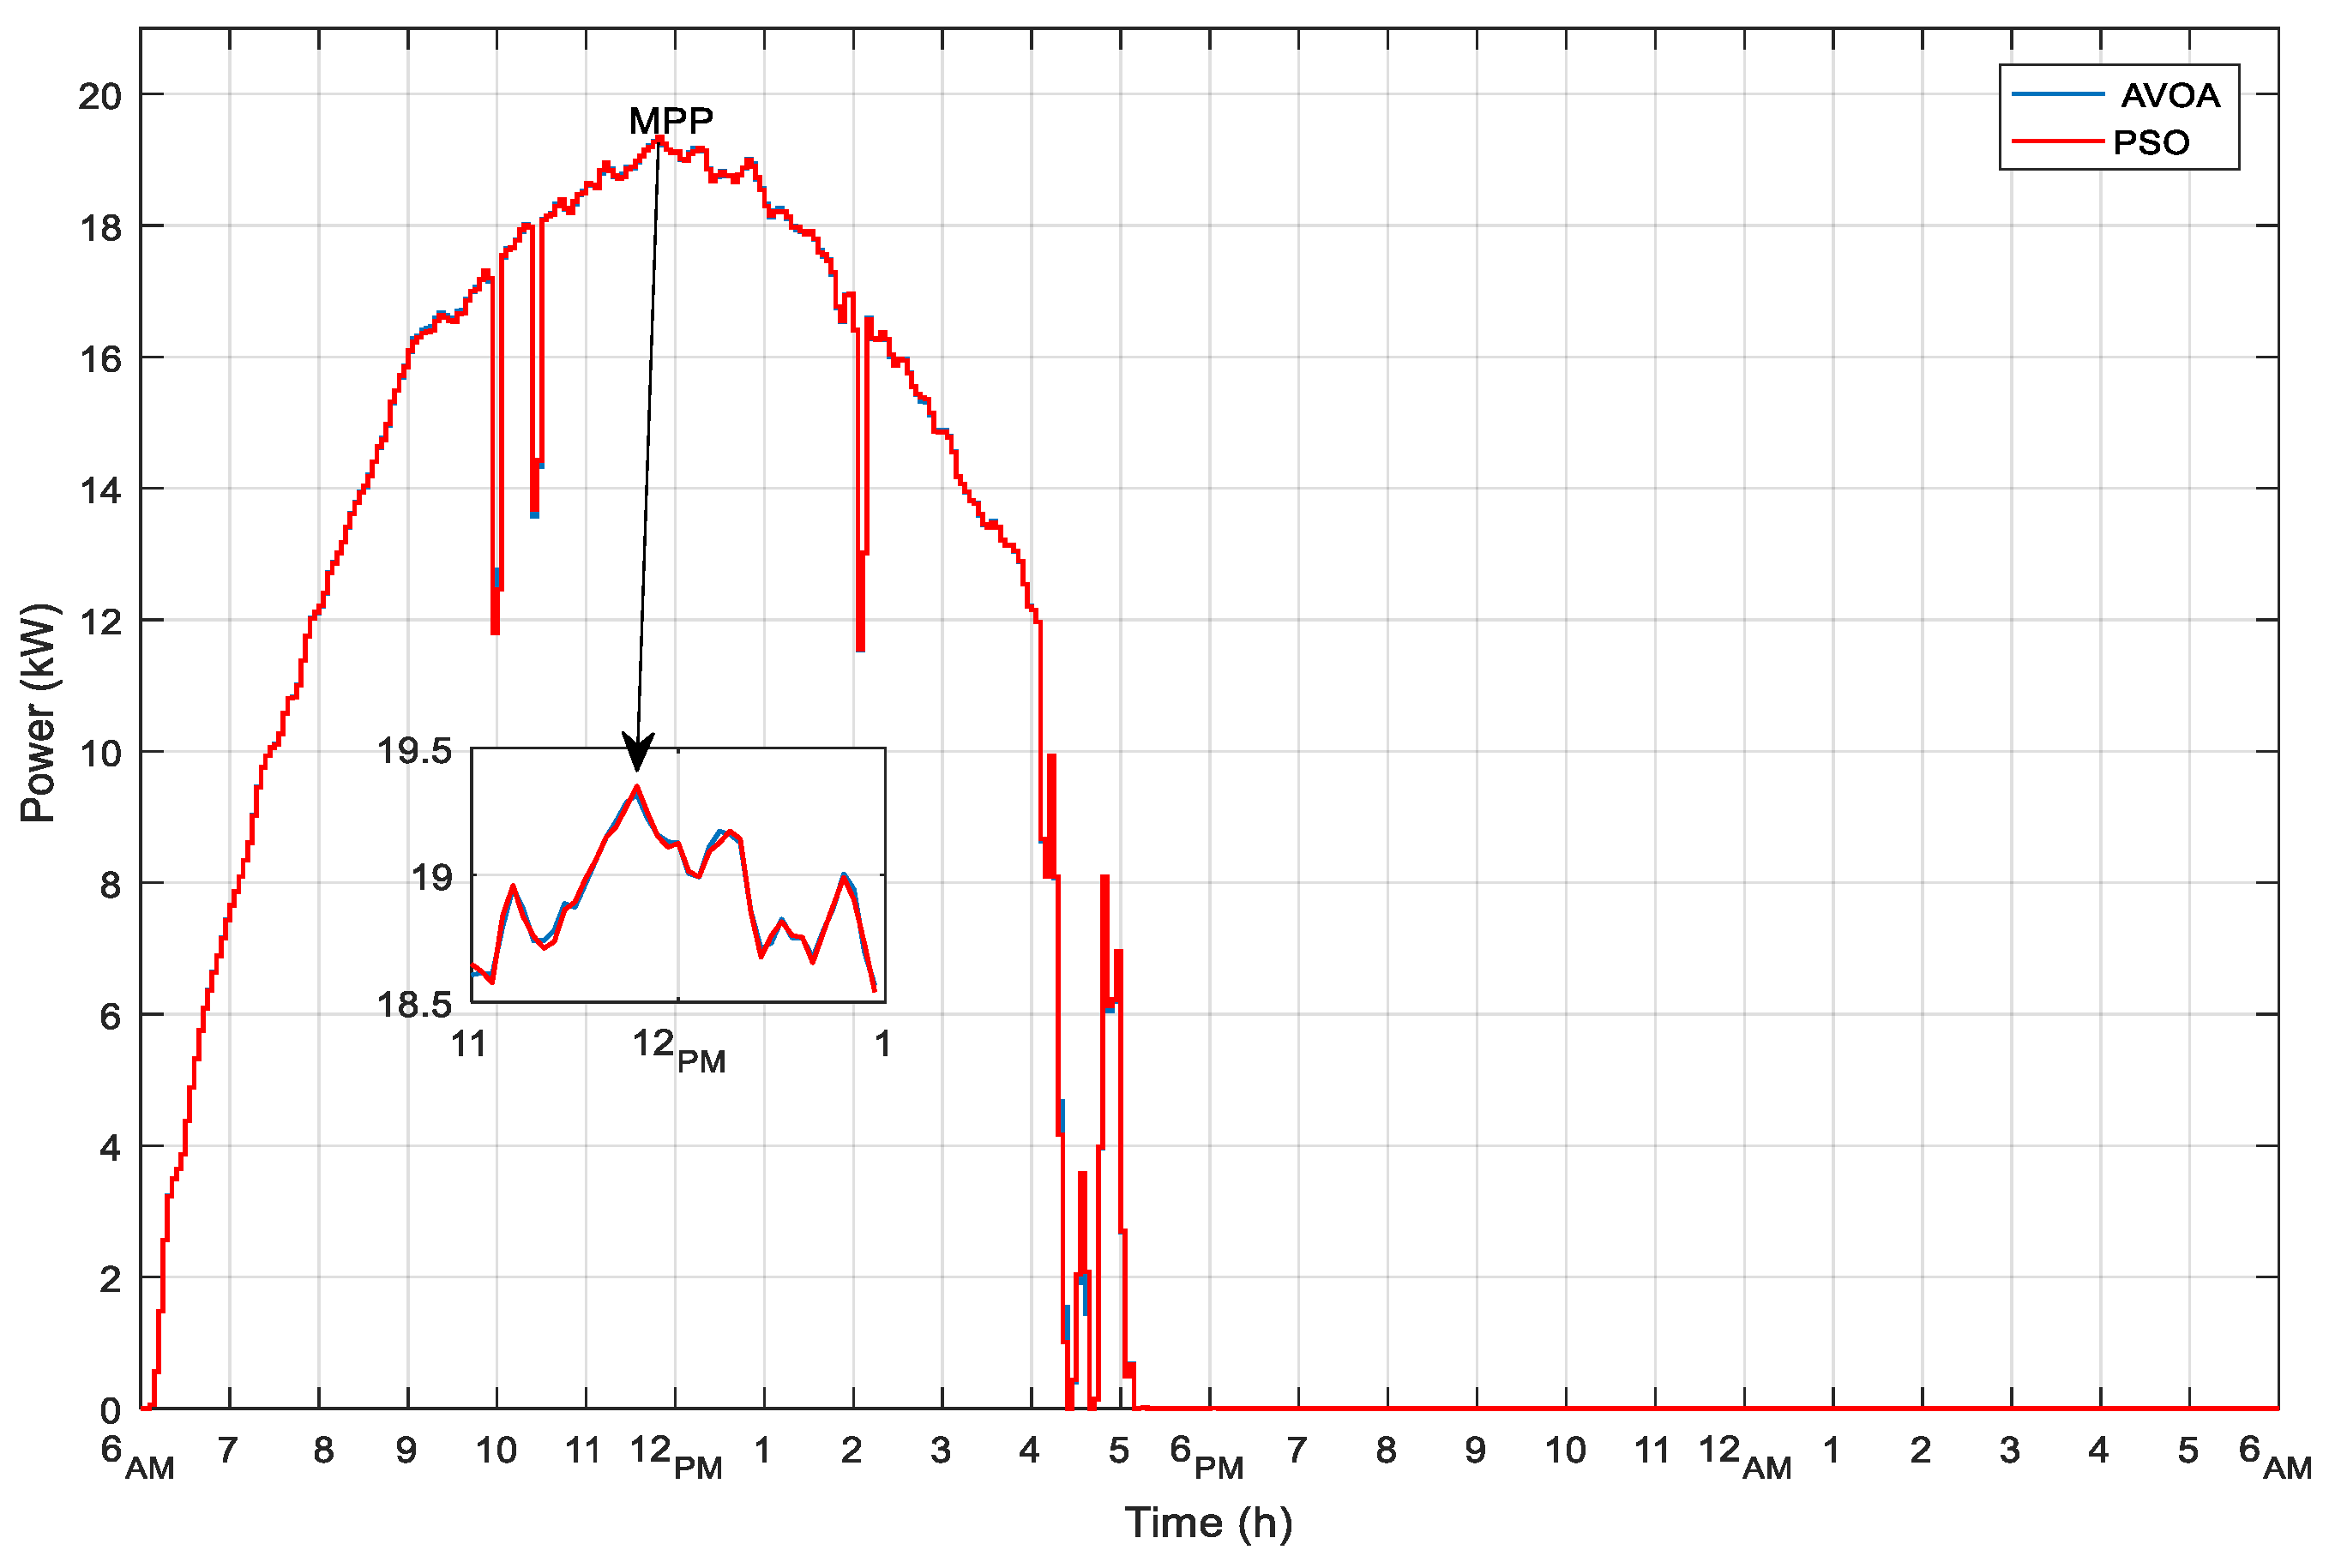
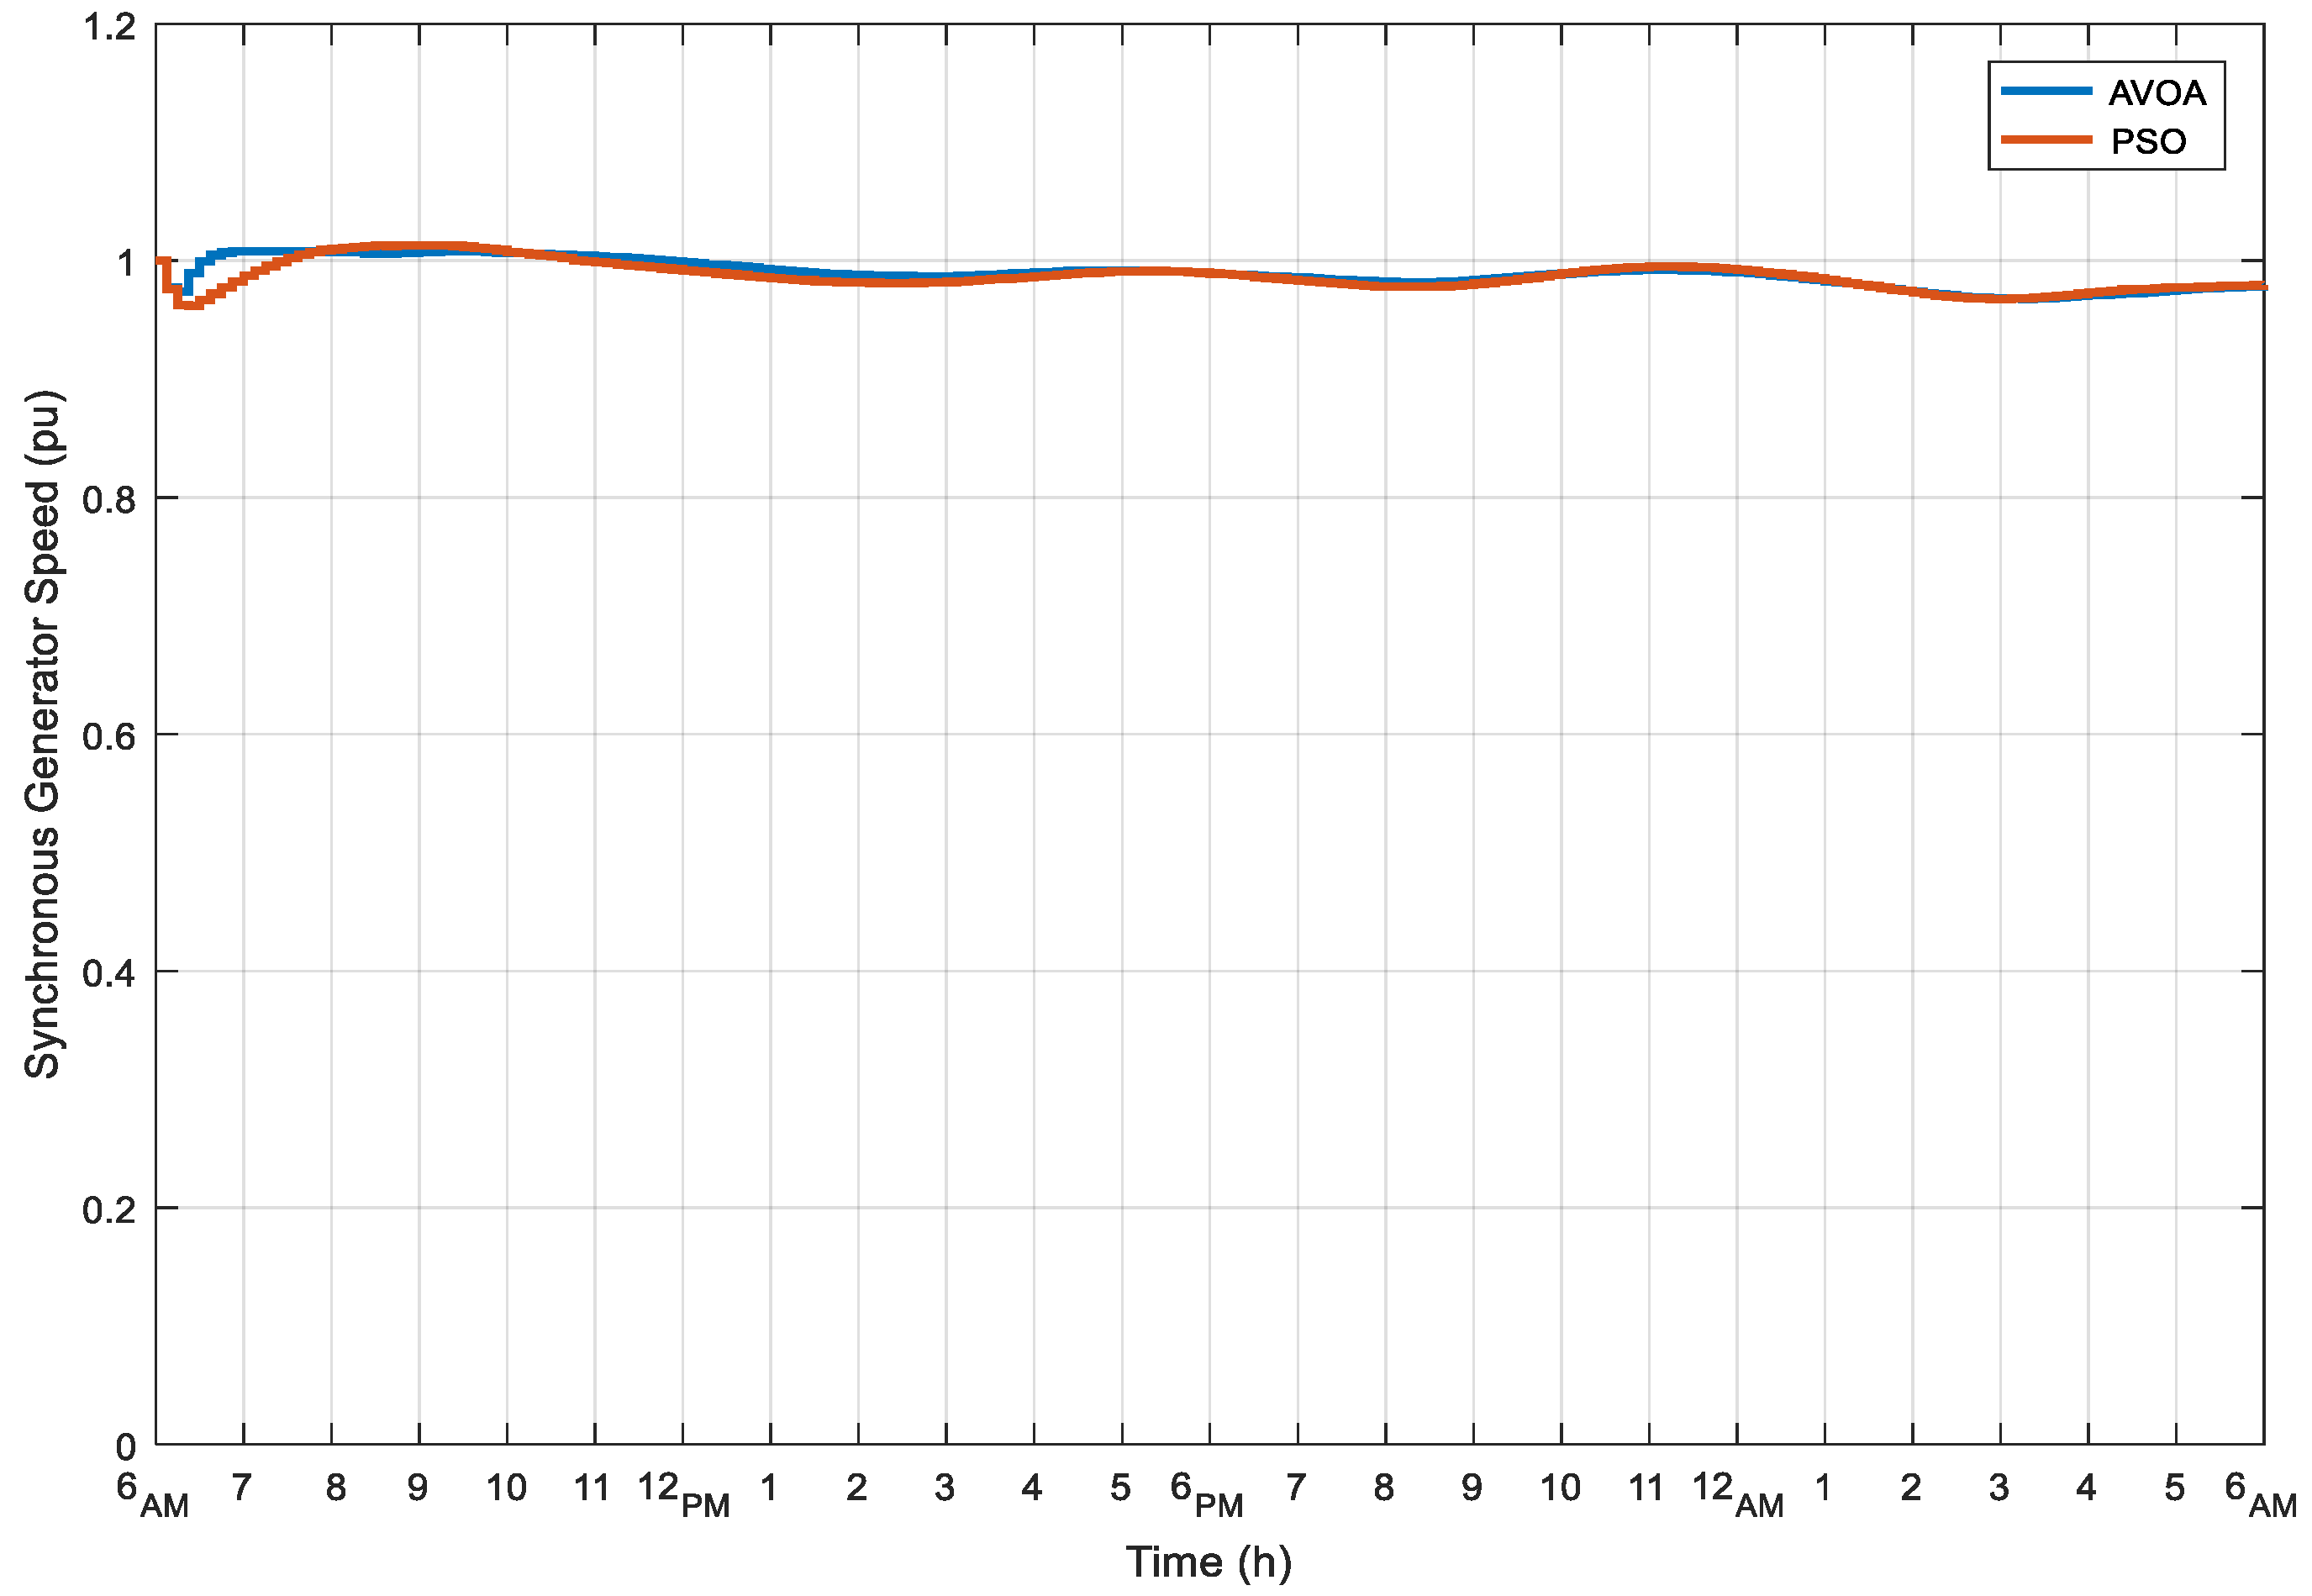
4.2. Simulation Results
5. Conclusions
Author Contributions
Funding
Institutional Review Board Statement
Informed Consent Statement
Data Availability Statement
Acknowledgments
Conflicts of Interest
Appendix A

| AC-Generator Ratings | |
|---|---|
| Line-to-line voltage | 25 kV |
| Frequency | 60 Hz |
| Base power | 50 MVA |
| Base voltage | 25 kV |
| X/R ratio | 7 |
| Transformer ratings | |
| Nominal power | 111.11 kVA |
| Primary voltage | 25 kV |
| Secondary voltage | 380 V |
| Frequency | 60 Hz |
| Universal Bridge (IGBT) ratings | |
| Snubber-resistance Rs | 100 kΩ |
| Snubber-capacitance Cs | inf |
| Ron, Lon | 1 mΩ, 0 H |
| Forward voltage (Vf) | 0 V |
| Parameter | Rating |
|---|---|
| Module type | Tata Power Systems TP240MBZ |
| ) | 238.95 W |
| Number of cells | 60 |
| Open-circuit voltage (Voc) | 36.5 V |
| Max-power voltage (Vmp) | 29.5 V |
| Short-circuit current (Isc) | 8.78 A |
| Max-power current (Imp) | 8.1 A |
| ) | 0.32793 Ω |
| ) | 113.1517 Ω |
| Voltage-temp. coefficient | −0.33 (%V/°C) |
| Current-temp. coefficient | 0.063804 (%/°C) |
| Parameter | Rating |
|---|---|
| Input DC Voltage | 253.7 V |
| Output DC Voltage | 500 V |
| Switching frequency | 5 kHz |
| L | 1.6 mH |
| 1.6 mF | |
| 12 mF |
| Wind Turbine | |
|---|---|
| Nominal mechanical-output power | 10 (kW) |
| Wind speed at nominal speed | 11 (m/s) |
| 2-Mass Drive Train | |
| Wind-turbine inertia constant H | 4.32 (s) |
| Shaft-spring constant | 0.3 (p.u.) |
| Shaft mutual damping | 1.5 (p.u.) |
| Turbine initial speed | 1 (p.u.) |
| Initial output torque | 1 (p.u.) |
| Synchronous generator ratings | |
| Power | 11.11 kVA |
| Frequency | 60 Hz |
| Line to line voltage | 220 V |
| Reactances [Xd, Xd′, Xd″, Xq, Xq″] in p.u. | [1.305, 0.296, 0.252, 0.474, 0.243] |
| Time constants [Td′, Td″, Tq″] in seconds | [4.49, 0.0681, 0.0513] |
| Inertia constant H(s), friction factor F(p.u.), and pairs of poles | [0.62, 0.01, 4] |
| Rectifier (Diodes) | |
| Snubber-resistance Rs | 0.15 Ω |
| Snubber-capacitance Cs | 0.55 µF |
| Ron, Lon | 1 µΩ, 0 H |
| Forward voltage (Vf) | 0 V |
| Parameter | Rating |
|---|---|
| Type | Lithium-Ion |
| Nominal voltage | 120 V |
| Rated capacity | 800 Ah |
| Initial state of charge | 50 % |
| Buck-boost-converter ratings | |
| Cin | 1.6 mF |
| Cout | 12 mF |
| L | 0.3 mH |
| Diodes of buck-boost converter | |
| Internal resistance (Ron) | 1 mΩ |
| Snubber resistance (Rs) | 100 kΩ |
| Snubber capacitance (Cs) | Inf |
| Parameter | Rating |
|---|---|
| DC-bus voltage | 500 V |
| 5 Ω | |
| 6.25 Ω | |
| 8.33 Ω | |
| 25 Ω |
References
- Ahmad, R.; Murtaza, A.F.; Sher, H.A. Power tracking techniques for efficient operation of photovoltaic array in solar applications–A review. Renew. Sustain. Energy Rev. 2019, 101, 82–102. [Google Scholar] [CrossRef]
- Mohamed, M.A.; Diab, A.A.Z.; Rezk, H. Partial shading mitigation of PV systems via different meta-heuristic techniques. Renew. Energy 2019, 130, 1159–1175. [Google Scholar] [CrossRef]
- Lotfi, H.; Khodaei, A. AC versus DC microgrid planning. IEEE Trans. Smart Grid 2017, 8, 296–304. [Google Scholar] [CrossRef]
- Zakir, M.; Sher, H.A.; Arshad, A.; Lehtonen, M. A fault detection, localization, and categorization method for PV fed DC-microgrid with power-sharing management among the nano-grids. Int. J. Electr. Power Energy Syst. 2022, 137, 107858. [Google Scholar] [CrossRef]
- Raiker, G.A.; Loganathan, U. Current control of boost converter for PV interface with momentum-based perturb and observe MPPT. IEEE Trans. Ind. Appl. 2021, 57, 4071–4079. [Google Scholar] [CrossRef]
- Jately, V.; Azzopardi, B.; Joshi, J.; Sharma, A.; Arora, S. Experimental analysis of hill-climbing MPPT algorithms under low irradiance levels. Renew. Sustain. Energy Rev. 2021, 150, 111467. [Google Scholar] [CrossRef]
- Ali, M.N.; Mahmoud, K.; Lehtonen, M.; Darwish, M.M. An efficient fuzzy-logic based variable-step incremental conductance MPPT method for grid-connected PV systems. IEEE Access 2021, 9, 26420–26430. [Google Scholar] [CrossRef]
- Nadeem, A.; Sher, H.A.; Murtaza, A.F. Online fractional open-circuit voltage maximum output power algorithm for photovoltaic modules. IET Renew. Power Gener. 2020, 14, 188–198. [Google Scholar] [CrossRef]
- Nadeem, A.; Sher, H.A.; Murtaza, A.F.; Ahmed, N. Online current-sensorless estimator for PV open circuit voltage and short circuit current. Sol. Energy 2021, 213, 198–210. [Google Scholar] [CrossRef]
- Fathi, M.; Parian, J.A. Intelligent MPPT for photovoltaic panels using a novel fuzzy logic and artificial neural networks based on evolutionary algorithms. Energy Rep. 2021, 7, 1338–1348. [Google Scholar] [CrossRef]
- Dehghani, M.; Taghipour, M.; Gharehpetian, G.B.; Abedi, M. Optimized fuzzy controller for MPPT of grid-connected PV systems in rapidly changing atmospheric conditions. J. Mod. Power Syst. Clean Energy 2020, 9, 376–383. [Google Scholar] [CrossRef]
- Eltamaly, A.M.; Al-Saud, M.S.; Abokhalil, A.G.; Farh, H.M. Simulation and experimental validation of fast adaptive particle swarm optimization strategy for photovoltaic global peak tracker under dynamic partial shading. Renew. Sustain. Energy Rev. 2020, 124, 109719. [Google Scholar] [CrossRef]
- Pilakkat, D.; Kanthalakshmi, S. An improved P&O algorithm integrated with artificial bee colony for photovoltaic systems under partial shading conditions. Sol. Energy 2019, 178, 37–47. [Google Scholar]
- Guo, K.; Cui, L.; Mao, M.; Zhou, L.; Zhang, Q. An improved gray wolf optimizer MPPT algorithm for PV system with BFBIC converter under partial shading. IEEE Access 2020, 8, 103476–103490. [Google Scholar] [CrossRef]
- Huang, Y.P.; Huang, M.Y.; Ye, C.E. A fusion firefly algorithm with simplified propagation for photovoltaic MPPT under partial shading conditions. IEEE Trans. Sustain. Energy 2020, 11, 2641–2652. [Google Scholar] [CrossRef]
- Jamaludin, M.N.I.; Tajuddin, M.F.N.; Ahmed, J.; Azmi, A.; Azmi, S.A.; Ghazali, N.H.; Alhelou, H.H. An effective salp swarm based MPPT for photovoltaic systems under dynamic and partial shading conditions. IEEE Access 2021, 9, 34570–34589. [Google Scholar] [CrossRef]
- Phanden, R.K.; Sharma, L.; Chhabra, J.; Demir, H.İ. A novel modified ant colony optimization based maximum power point tracking controller for photovoltaic systems. Mater. Today Proc. 2021, 38, 89–93. [Google Scholar] [CrossRef]
- Mosaad, M.I.; abed el-Raouf, M.O.; Al-Ahmar, M.A.; Banakher, F.A. Maximum power point tracking of PV system based cuckoo search algorithm; review and comparison. Energy Procedia 2019, 162, 117–126. [Google Scholar] [CrossRef]
- Charin, C.; Ishak, D.; Zainuri, M.A.A.M.; Ismail, B.; Jamil, M.K.M. A hybrid of bio-inspired algorithm based on Levy flight and particle swarm optimizations for photovoltaic system under partial shading conditions. Sol. Energy 2021, 217, 1–14. [Google Scholar] [CrossRef]
- Kumar, R.; Agrawal, H.P.; Shah, A.; Bansal, H.O. Maximum power point tracking in wind energy conversion system using radial basis function based neural network control strategy. Sustain. Energy Technol. Assess. 2019, 36, 100533. [Google Scholar] [CrossRef]
- Fathy, A.; El-baksawi, O. Grasshopper optimization algorithm for extracting maximum power from wind turbine installed in Al-Jouf region. J. Renew. Sustain. Energy 2019, 11, 033303. [Google Scholar] [CrossRef]
- El Yaakoubi, A.; Attari, K.; Asselman, A.; Djebli, A. Novel power capture optimization based sensorless maximum power point tracking strategy and internal model controller for wind turbines systems driven SCIG. Front. Energy 2019, 13, 742–756. [Google Scholar] [CrossRef]
- Karabacak, M. A new perturb and observe based higher order sliding mode MPPT control of wind turbines eliminating the rotor inertial effect. Renew. Energy 2019, 133, 807–827. [Google Scholar] [CrossRef]
- Fathy, A.; Alharbi, A.G.; Alshammari, S.; Hasanien, H.M. Archimedes optimization algorithm based maximum power point tracker for wind energy generation system. Ain Shams Eng. J. 2022, 13, 101548. [Google Scholar] [CrossRef]
- Balbino, A.J.; Nora, B.D.S.; Lazzarin, T.B. An Improved Mechanical Sensorless Maximum Power Point Tracking Method for Permanent-Magnet Synchronous Generator-Based Small Wind Turbines Systems. IEEE Trans. Ind. Electron. 2021, 69, 4765–4775. [Google Scholar] [CrossRef]
- Haq, I.U.; Khan, Q.; Khan, I.; Akmeliawati, R.; Nisar, K.S.; Khan, I. Maximum power extraction strategy for variable speed wind turbine system via neuro-adaptive generalized global sliding mode controller. IEEE Access 2022, 8, 128536–128547. [Google Scholar] [CrossRef]
- Khan, M.J. An AIAPO MPPT controller based real time adaptive maximum power point tracking technique for wind turbine system. ISA Trans. 2022, 123, 492–504. [Google Scholar] [CrossRef]
- Huynh, P.; Tungare, S.; Banerjee, A. Maximum power point tracking for wind turbine using integrated generator–rectifier systems. IEEE Trans. Power Electron. 2020, 36, 504–512. [Google Scholar] [CrossRef]
- Lamsal, D.; Sreeram, V.; Mishra, Y.; Kumar, D. Smoothing control strategy of wind and photovoltaic output power fluctuation by considering the state of health of battery energy storage system. IET Renew. Power Gener. 2019, 13, 578–586. [Google Scholar] [CrossRef]
- Mostafa, M.R.; Saad, N.H.; El-sattar, A.A. Tracking the maximum power point of PV array by sliding mode control method. Ain Shams Eng. J. 2020, 11, 119–131. [Google Scholar] [CrossRef]
- Merchaoui, M.; Hamouda, M.; Sakly, A.; Mimouni, M.F. Fuzzy logic adaptive particle swarm optimisation based MPPT controller for photovoltaic systems. IET Renew. Power Gener. 2020, 14, 2933–2945. [Google Scholar] [CrossRef]
- Awais, M.; Khan, L.; Ahmad, S.; Mumtaz, S.; Badar, R. Nonlinear adaptive Neuro Fuzzy feedback linearization based MPPT control schemes for photovoltaic system in microgrid. PLoS ONE 2020, 15, e0234992. [Google Scholar] [CrossRef] [PubMed]
- Sibtain, D.; Murtaza, A.F.; Ahmed, N.; Sher, H.A.; Gulzar, M.M. Multi control adaptive fractional order PID control approach for PV/wind connected grid system. Int. Trans. Electr. Energy Syst. 2021, 31, e12809. [Google Scholar] [CrossRef]
- Martinez-Lopez, M.; Moreno-Valenzuela, J.; He, W. A robust nonlinear PI-type controller for the DC–DC buck–boost power converter. ISA Trans. 2022. [Google Scholar] [CrossRef]
- Hasanien, H.M.; Muyeen, S.M. Design optimization of controller parameters used in variable speed wind energy conversion system by genetic algorithms. IEEE Trans. Sustain. Energy 2012, 3, 200–208. [Google Scholar] [CrossRef] [Green Version]
- Qais, M.H.; Hasanien, H.M.; Alghuwainem, S. Augmented grey wolf optimizer for grid-connected PMSG-based wind energy conversion systems. Appl. Soft Comput. 2018, 69, 504–515. [Google Scholar] [CrossRef]
- Hasanien, H.M. Performance improvement of photovoltaic power systems using an optimal control strategy based on whale optimization algorithm. Electr. Power Syst. Res. 2018, 157, 168–176. [Google Scholar] [CrossRef]
- Zambrana-Lopez, P.; Fernández-Quijano, J.; Fernandez-Lozano, J.J.; Garcia-Cerezo, A.; Rubio, P.M.M. Fuzzy logic tuning of a PI controller to improve the performance of a wind turbine on a semi-submersible platform under different wind scenarios. IFAC Pap. 2020, 53, 12364–12371. [Google Scholar] [CrossRef]
- Ustun, S.V.; Demirtas, M. Optimal tuning of PI coefficients by using fuzzy-genetic for V/f controlled induction motor. Expert Syst. Appl. 2008, 34, 2714–2720. [Google Scholar] [CrossRef]
- Sahu, R.K.; Panda, S.; Sekhar, G.C. A novel hybrid PSO-PS optimized fuzzy PI controller for AGC in multi area interconnected power systems. Int. J. Electr. Power Energy Syst. 2015, 64, 880–893. [Google Scholar] [CrossRef]
- Abedini, M.; Mahmodi, E.; Mousavi, M.; Chaharmahali, I. A novel Fuzzy PI controller for improving autonomous network by considering uncertainty. Sustain. Energy Grids Netw. 2019, 18, 100200. [Google Scholar] [CrossRef]
- Kalaam, R.N.; Muyeen, S.M.; Al-Durra, A.; Hasanien, H.M.; Al-Wahedi, K. Optimisation of controller parameters for grid-tied photovoltaic system at faulty network using artificial neural network-based cuckoo search algorithm. IET Renew. Power Gener. 2017, 11, 1517–1526. [Google Scholar] [CrossRef]
- Zhao, J.; Lin, M.; Xu, D.; Hao, L.; Zhang, W. Vector control of a hybrid axial field flux-switching permanent magnet machine based on particle swarm optimization. IEEE Trans. Magn. 2015, 51, 1–4. [Google Scholar]
- Costa, B.L.G.; Bacon, V.D.; da Silva, S.A.O.; Angélico, B.A. Tuning of a PI-MR controller based on differential evolution metaheuristic applied to the current control loop of a shunt-APF. IEEE Trans. Ind. Electron. 2017, 64, 4751–4761. [Google Scholar] [CrossRef]
- Wang, Y.; Li, S.; Sun, H.; Huang, C.; Youssefi, N. The utilization of adaptive African vulture optimizer for optimal parameter identification of SOFC. Energy Rep. 2022, 8, 551–560. [Google Scholar] [CrossRef]
- Chen, Y.; Zhang, G. New parameters identification of Proton exchange membrane fuel cell stacks based on an improved version of African vulture optimization algorithm. Energy Rep. 2022, 8, 3030–3040. [Google Scholar] [CrossRef]
- Wang, Y.; Wang, J.; Yang, L.; Ma, B.; Sun, G.; Youssefi, N. Optimal designing of a hybrid renewable energy system connected to an unreliable grid based on enhanced African vulture optimizer. ISA Trans. 2022. [Google Scholar] [CrossRef]
- Fan, J.; Li, Y.; Wang, T. An improved African vultures optimization algorithm based on tent chaotic mapping and time-varying mechanism. PLoS ONE 2021, 16, e0260725. [Google Scholar] [CrossRef]
- Mirza, A.F.; Mansoor, M.; Ling, Q.; Yin, B.; Javed, M.Y. A Salp-Swarm Optimization based MPPT technique for harvesting maximum energy from PV systems under partial shading conditions. Energy Convers. Manag. 2020, 209, 112625. [Google Scholar] [CrossRef]
- Roy, R.B.; Rokonuzzaman, M.; Amin, N.; Mishu, M.K.; Alahakoon, S.; Rahman, S.; Pasupuleti, J. A comparative performance analysis of ANN algorithms for MPPT energy harvesting in solar PV system. IEEE Access 2021, 9, 102137–102152. [Google Scholar] [CrossRef]
- National Renewable Energy Laboratory (NREL). Wind Prospector. 2022. Available online: https://maps.nrel.gov/wind-prospector/?aL=0&bL=groad&cE=0&lR=0&mC=40.21244%2C-91.625976&zL=4%3Fvisible (accessed on 20 May 2022).
- Rao, C.S.; Santosh, S. Tuning optimal PID controllers for open loop unstable first order plus time delay systems by minimizing ITAE criterion. IFAC Pap. 2020, 53, 123–128. [Google Scholar] [CrossRef]
- Bataineh, K. Improved hybrid algorithms-based MPPT algorithm for PV system operating under severe weather conditions. IET Power Electron. 2019, 12, 703–711. [Google Scholar] [CrossRef]
- Duman, S.; Yorukeren, N.; Altas, I.H. A novel MPPT algorithm based on optimized artificial neural network by using FPSOGSA for standalone photovoltaic energy systems. Neural Comput. Appl. 2018, 29, 257–278. [Google Scholar] [CrossRef]
- Abdollahzadeh, B.; Gharehchopogh, F.S.; Mirjalili, S. African vultures optimization algorithm: A new nature-inspired metaheuristic algorithm for global optimization problems. Comput. Ind. Eng. 2021, 158, 107408. [Google Scholar] [CrossRef]
- MathWorks Inc. MATLAB 2016b. 2016. Available online: https://www.mathworks.com/ (accessed on 1 June 2016).


| Parameter | Method | |
|---|---|---|
| AVOA | PSO | |
| No. of particles/populations | 30 | 30 |
| No. of iterations | 100 | 100 |
| Dimension (No. of variables) | 2 | 2 |
| Control parameters p1, p2, p3 | 0.6, 0.4, 0.6 | --- |
| α | 0.8 | --- |
| β | 0.2 | --- |
| γ | 2.5 | --- |
| Inertia weight (w) | --- | 0.9~0.4 |
| Cognitive factor () | --- | 1.5 |
| Social factor () | --- | 1.5 |
Publisher’s Note: MDPI stays neutral with regard to jurisdictional claims in published maps and institutional affiliations. |
© 2022 by the authors. Licensee MDPI, Basel, Switzerland. This article is an open access article distributed under the terms and conditions of the Creative Commons Attribution (CC BY) license (https://creativecommons.org/licenses/by/4.0/).
Share and Cite
Ghazi, G.A.; Hasanien, H.M.; Al-Ammar, E.A.; Turky, R.A.; Ko, W.; Park, S.; Choi, H.-J. African Vulture Optimization Algorithm-Based PI Controllers for Performance Enhancement of Hybrid Renewable-Energy Systems. Sustainability 2022, 14, 8172. https://doi.org/10.3390/su14138172
Ghazi GA, Hasanien HM, Al-Ammar EA, Turky RA, Ko W, Park S, Choi H-J. African Vulture Optimization Algorithm-Based PI Controllers for Performance Enhancement of Hybrid Renewable-Energy Systems. Sustainability. 2022; 14(13):8172. https://doi.org/10.3390/su14138172
Chicago/Turabian StyleGhazi, Ghazi A., Hany M. Hasanien, Essam A. Al-Ammar, Rania A. Turky, Wonsuk Ko, Sisam Park, and Hyeong-Jin Choi. 2022. "African Vulture Optimization Algorithm-Based PI Controllers for Performance Enhancement of Hybrid Renewable-Energy Systems" Sustainability 14, no. 13: 8172. https://doi.org/10.3390/su14138172
APA StyleGhazi, G. A., Hasanien, H. M., Al-Ammar, E. A., Turky, R. A., Ko, W., Park, S., & Choi, H.-J. (2022). African Vulture Optimization Algorithm-Based PI Controllers for Performance Enhancement of Hybrid Renewable-Energy Systems. Sustainability, 14(13), 8172. https://doi.org/10.3390/su14138172