1. Introduction
Computer programming has been one of the fundamental skills for computer engineers and scientists over the years. Today, the demand for programmers is expanding widely, beyond engineering and science fields; many universities now offer introductory programming courses to non-STEM students. Robins et al. [
1] reviewed novice programming education and discussed the difficulties that students experience. Many novice students struggle to write a program because they have to learn many things at the same time, such as complex new concepts, strategies for constructing programs, and debugging skills. These programming difficulties often lower learner motivation, which is an important factor for success in learning computer programming [
2,
3]. Such difficulties can lead to students dropping out of classes. Thus, it is crucial to offer appropriate support to learners.
However, it is not easy for teachers to identify such students during class. Help seeking, defined as an ability to ask for help from various resources including teachers, is known to be a difficult metacognitive skill [
4]. It cannot be always expected that the students who need help will ask the teachers for help. In the past couple of years, more and more programming classes have been taught online due to the COVID-19 pandemic. Traditionally, teachers would go around the classroom to find students who needed assistance and to answer questions. However, such activities are seriously limited in online classes. Therefore, it has become increasingly important to realize sustainable programming education under such drastically changing circumstances, and teachers must be supported by information technologies.
One of the typical approaches for informing teachers of student learning situations is learning-analytics dashboards [
5,
6]. Dashboards provide teachers with an overview of their students’ situations through statistics, performance indicators, visualization, and so on. They are also utilized in the domain of programming education. For example, Fu et al. [
7] proposed a real-time dashboard for C programming courses, which visualizes student situations by focusing mainly on compile errors. Matsuzawa et al. [
8] developed a dashboard with four coding metrics: working time, lines of code, compile-error correction time, and block-editor usage ratio. Aside from the dashboard, López-Pernas et al. [
9] combined data from two different systems to understand students’ programming learning processes by using process and sequence mining techniques. However, the actual contents of students’ source code were not considered; teachers have little or no way of knowing how a students’ source code has changed as exercises progress.
Yin et al. [
10] presented a visual representation of a set of source code for easily exploring and obtaining a comprehensive understanding of the source code variation. However, their representation was not designed for understanding programming processes, and its effectiveness as feedback to teachers was not investigated. Therefore, much is unknown about effective visual representations of programming processes for teachers. For example, it is not clear how much detailed information should be presented and how the information presented is perceived by the teacher.
This study focuses on understanding class-wide programming processes collectively and seeks to answer the following research question:
- RQ:
What are the effective visual representations for feedback to teachers about programming processes?
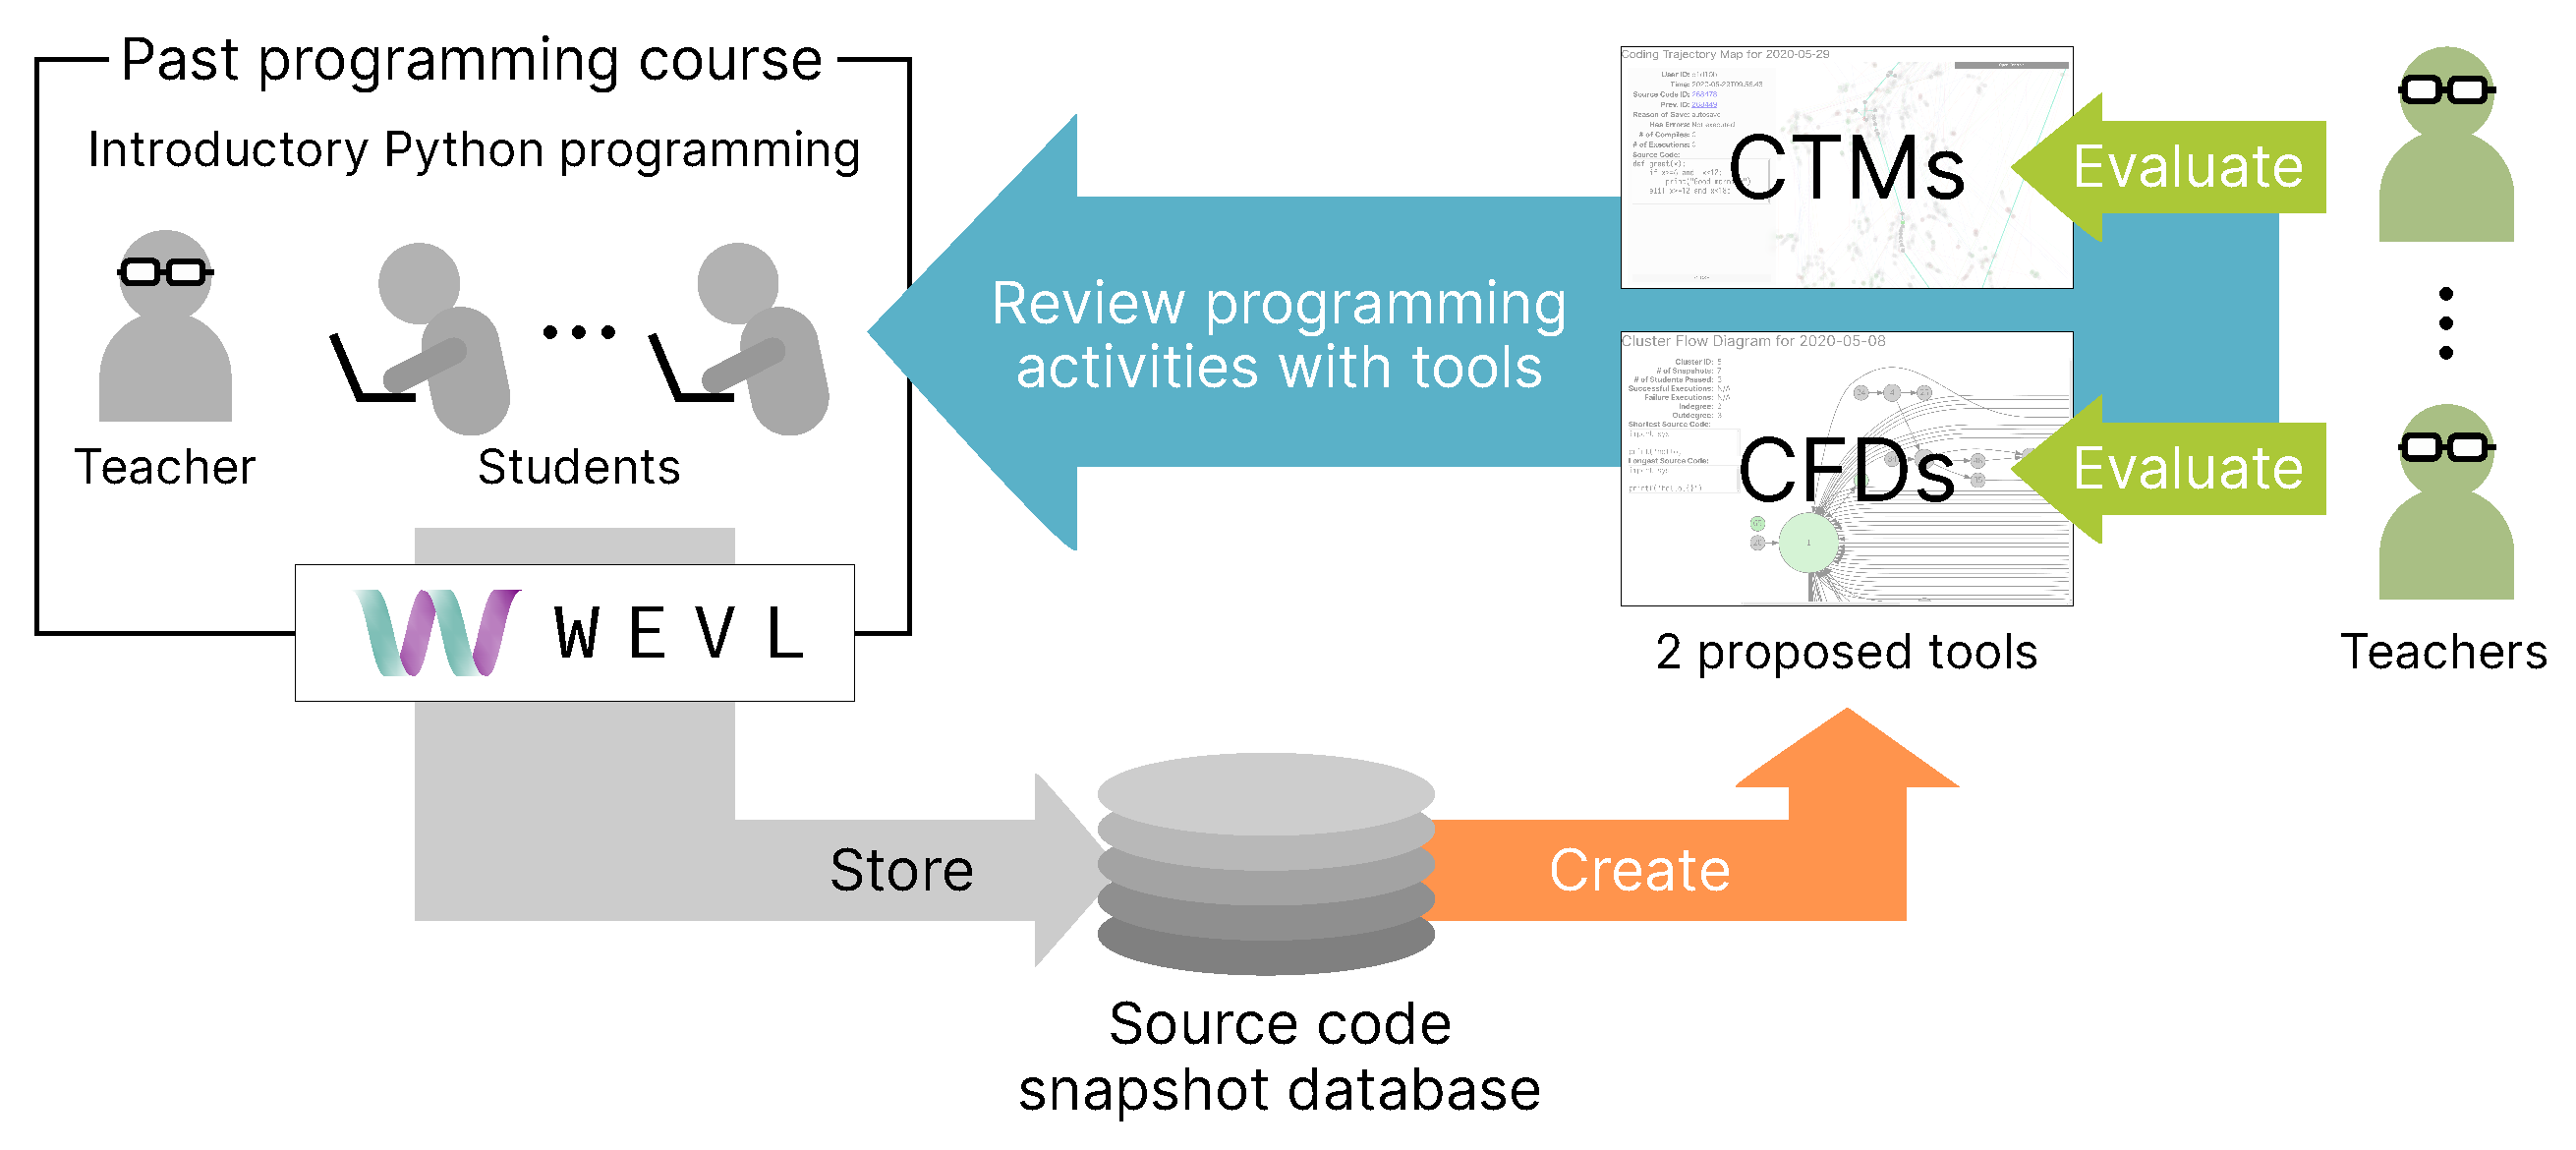
We propose two kinds of visual representations of programming processes with different granularity levels employing a student’s sequence of source-code snapshots to represent an individual programming process. One is coding trajectory maps (CTMs), which provide source-code-snapshot-level views of class-wide programming activities. The other is cluster flow diagrams (CFDs), which offer a rougher view of source-code status transitions as graphs. We made handy web-based tools for reviewing programming processes in a past class, each embedded with one of these representations, and conducted an experiment in which university teachers performed user evaluations of the tools.
2. Materials and Methods
The proposed visual representation was created from a set of source-code snapshots. This study used a dataset previously collected in an introductory programming course, and no new data were collected for the purpose of this study. Therefore, the evaluation of the proposals in this study was performed through a post-evaluation of the classes; i.e., the programming activities in classes that had already been completed were reviewed later through the proposed tools.
Figure 1 illustrates the methodology of the present study.
2.1. Data Collection via an Online Programming Environment
In this study, we rely on the dataset collected through our own online programming environment called WEVL. We developed this system to keep a detailed record of students’ programming activities.
Figure 2 shows the user interface of WEVL. The system takes a snapshot of source code at three different times. The first is an auto-save, which happens three seconds after a user stops typing; if any input is made to the editor within three seconds, it will be postponed to three seconds later, counting again from there. The second is the timing of the execution; if the snapshot of the source code has not been taken yet at the time of execution, it will be taken before the execution. The third is at the time of view switch on the system; users mainly use the editor view, but there are different views for other functions. When the user switches from the editor view, the snapshot of source code is taken if it has not been taken yet at that time.
The granularity of the data collected can vary greatly depending on the delay before auto-save. If the delay is too short, the process of source-code changes will be recorded in detail, but the system will be overloaded. On the other hand, if the delay is too long, the process of source-code changes will be only roughly understood. Therefore, the authors tried several candidates during the system development and subjectively decided on the number of seconds that would be appropriate as a break in typing without overloading the system.
In total, there were 36,355 source-code snapshots in the 14 weeks; 30,464 (83.8%) were auto-saves, and 5891 (16.2%) were from execution. Only 39 snapshots (0.107%) were recorded by switching view. Auto-saved snapshots were dominant in the dataset, and this is also the case for each student per class. We calculated the auto-save ratio per class for each student and made charts: in
Figure 3a we contrast the auto-save ratio with the total number of snapshots, and in
Figure 3b we show the cumulative distribution of auto-save ratios.
Figure 3a shows that the auto-save ratios exceed 60% in most cases, regardless of student or class content. In addition,
Figure 3b shows that the auto-save ratios are higher than 80% in more than half of the cases.
Although the auto-saves only occur when the learner stops typing for three seconds, we can see it is very common for learners to take a break while writing code. Therefore, the auto-saved snapshots would allow for a higher resolution representation of the evolution of source code in a variety of cases.
The collection of our dataset was performed in the introductory Python programming course of our university, which one of the authors taught during the first semester of the 2020 academic year. The course was primarily for first-year undergraduate students and aimed at learning the basics of programming in 14 weeks. It covered fundamental programming concepts, basic Python syntax, and data structures.
Table 1 details the weekly contents of the course.
In each week, some programming assignments were given to students, which were due on the next class day. In a class, the teacher first lectured on the week’s topic, and then students had time to do the exercise. In this study, we ignore source-code snapshots written outside of class, only considering the coding activities carried out within the class period. Additionally, the time length available for exercises differs from week to week depending on the amount of lecture content.
At the beginning of the course, we told the students about the collection of their learning activities through learning systems. They were able to opt out of the research use of their data. The dataset used in this study only includes snapshots from 76 students who agreed to the research use of their data.
2.2. Coding Trajectory Maps
The goal of CTMs is to give a big picture of the overall class-wide programming activities while preserving access to the details of written source code. To this end, we show every source-code snapshot written by students in the representation, which allows teachers to select the source code they are interested in to see its details. At the same time, we want the representation as a whole to depict the class-wide programming progress. We can imagine there might be some common source-code states. For example, there usually exist some expected final states of source code in an assignment; students will ultimately converge on such states if they progress successfully. In fact, source-code clustering has often been used in assessments of submitted source code [
11,
12], and researchers have used experts’ source code as references to measure student progression [
13]. In addition, intermediate states of programming can also be similar or identical [
14].
In this sense, the programming process is considered to have a certain structure. Since this structure is based on the commonality of the source code, it is believed that the structure can be shown through visualizations that reflect similarities among source codes.
2.2.1. Generating Visual Representation
Our visualization method is based on the t-SNE algorithm [
15] and the Levenshtein distance [
16]. We first compute a distance matrix of source-code snapshots using the Levenshtein distance. The Levenshtein distance is often used to measure the distance between strings, which is defined as the minimum number of modification steps required to transform one string into the other through editing operations such as inserting, deleting, and substituting characters. We set all the operation costs to one. We then apply the t-SNE algorithm giving the computed distance matrix. The t-SNE algorithm takes a distance matrix of entities to visualize (source-code snapshots in our case) and outputs low-dimensional coordinates of the entities that optimally preserve the given distances in the low-dimensional space. In our visualization, the t-SNE algorithm arranges source-code snapshots in two-dimensional space. Finally, we visualize a set of source-code snapshots as the distribution of points in the plane with the obtained coordinates. Snapshots are drawn with their attributes in mind; their appearance may differ depending on their characteristics.
In the resultant visualization, the distances between points do not perfectly represent the original distances (Levenshtein distances); however, those that were originally close to and far away from each other will also be positioned close to and far away from each other, respectively, in the low-dimensional space. As we utilize many transient source-code snapshots, there are many data points that bridge the gap between largely different source codes, showing us visual trajectories of programming processes as a result. Therefore, this method of visualization fits our goal very well.
Please note that this usage of t-SNE algorithm is different from the usual and common usage, in which low-dimensional vector representations are calculated for high-dimensional vector datasets. It is certainly possible to represent source code as high-dimensional vectors—for example, with recent neural-network-based methods [
17,
18,
19,
20]. We choose not to adopt such an approach and instead employ Levenshtein distance to directly compute the distance matrix of source code for the following reasons. First, Levenshtein distance does not require source code to be free of errors. Many neural-network-based methods rely on an abstract syntax tree of source code to generate vector representation, which needs source code to be syntactically correct. As we utilize many transient snapshots of source code, such a requirement does not fit well. The second reason is versatility. With the neural-network-based approach, we must train our own model or employ an existing pre-trained model to encode source code into vector representations. This means that the model can be applied only to source code written in those programming languages included in the training data. In contrast, our approach can be applied to any kind of strings including even natural-language texts. The last reason is intuitiveness. The advantage of neural-network-based methods is that they can capture the semantics of source code. However, this would allow source code written in different styles but with equivalent meaning to be visualized as similar. While this can certainly be beneficial in some cases, at the same time, it may limit the teacher’s opportunity to grasp the multiple different writing styles of the source code adopted by a student. Therefore, in this study, we emphasize that more intuitive differences are expressed in the visualization, and we employ Levenshtein distances that represent more superficial differences.
2.2.2. User Interface
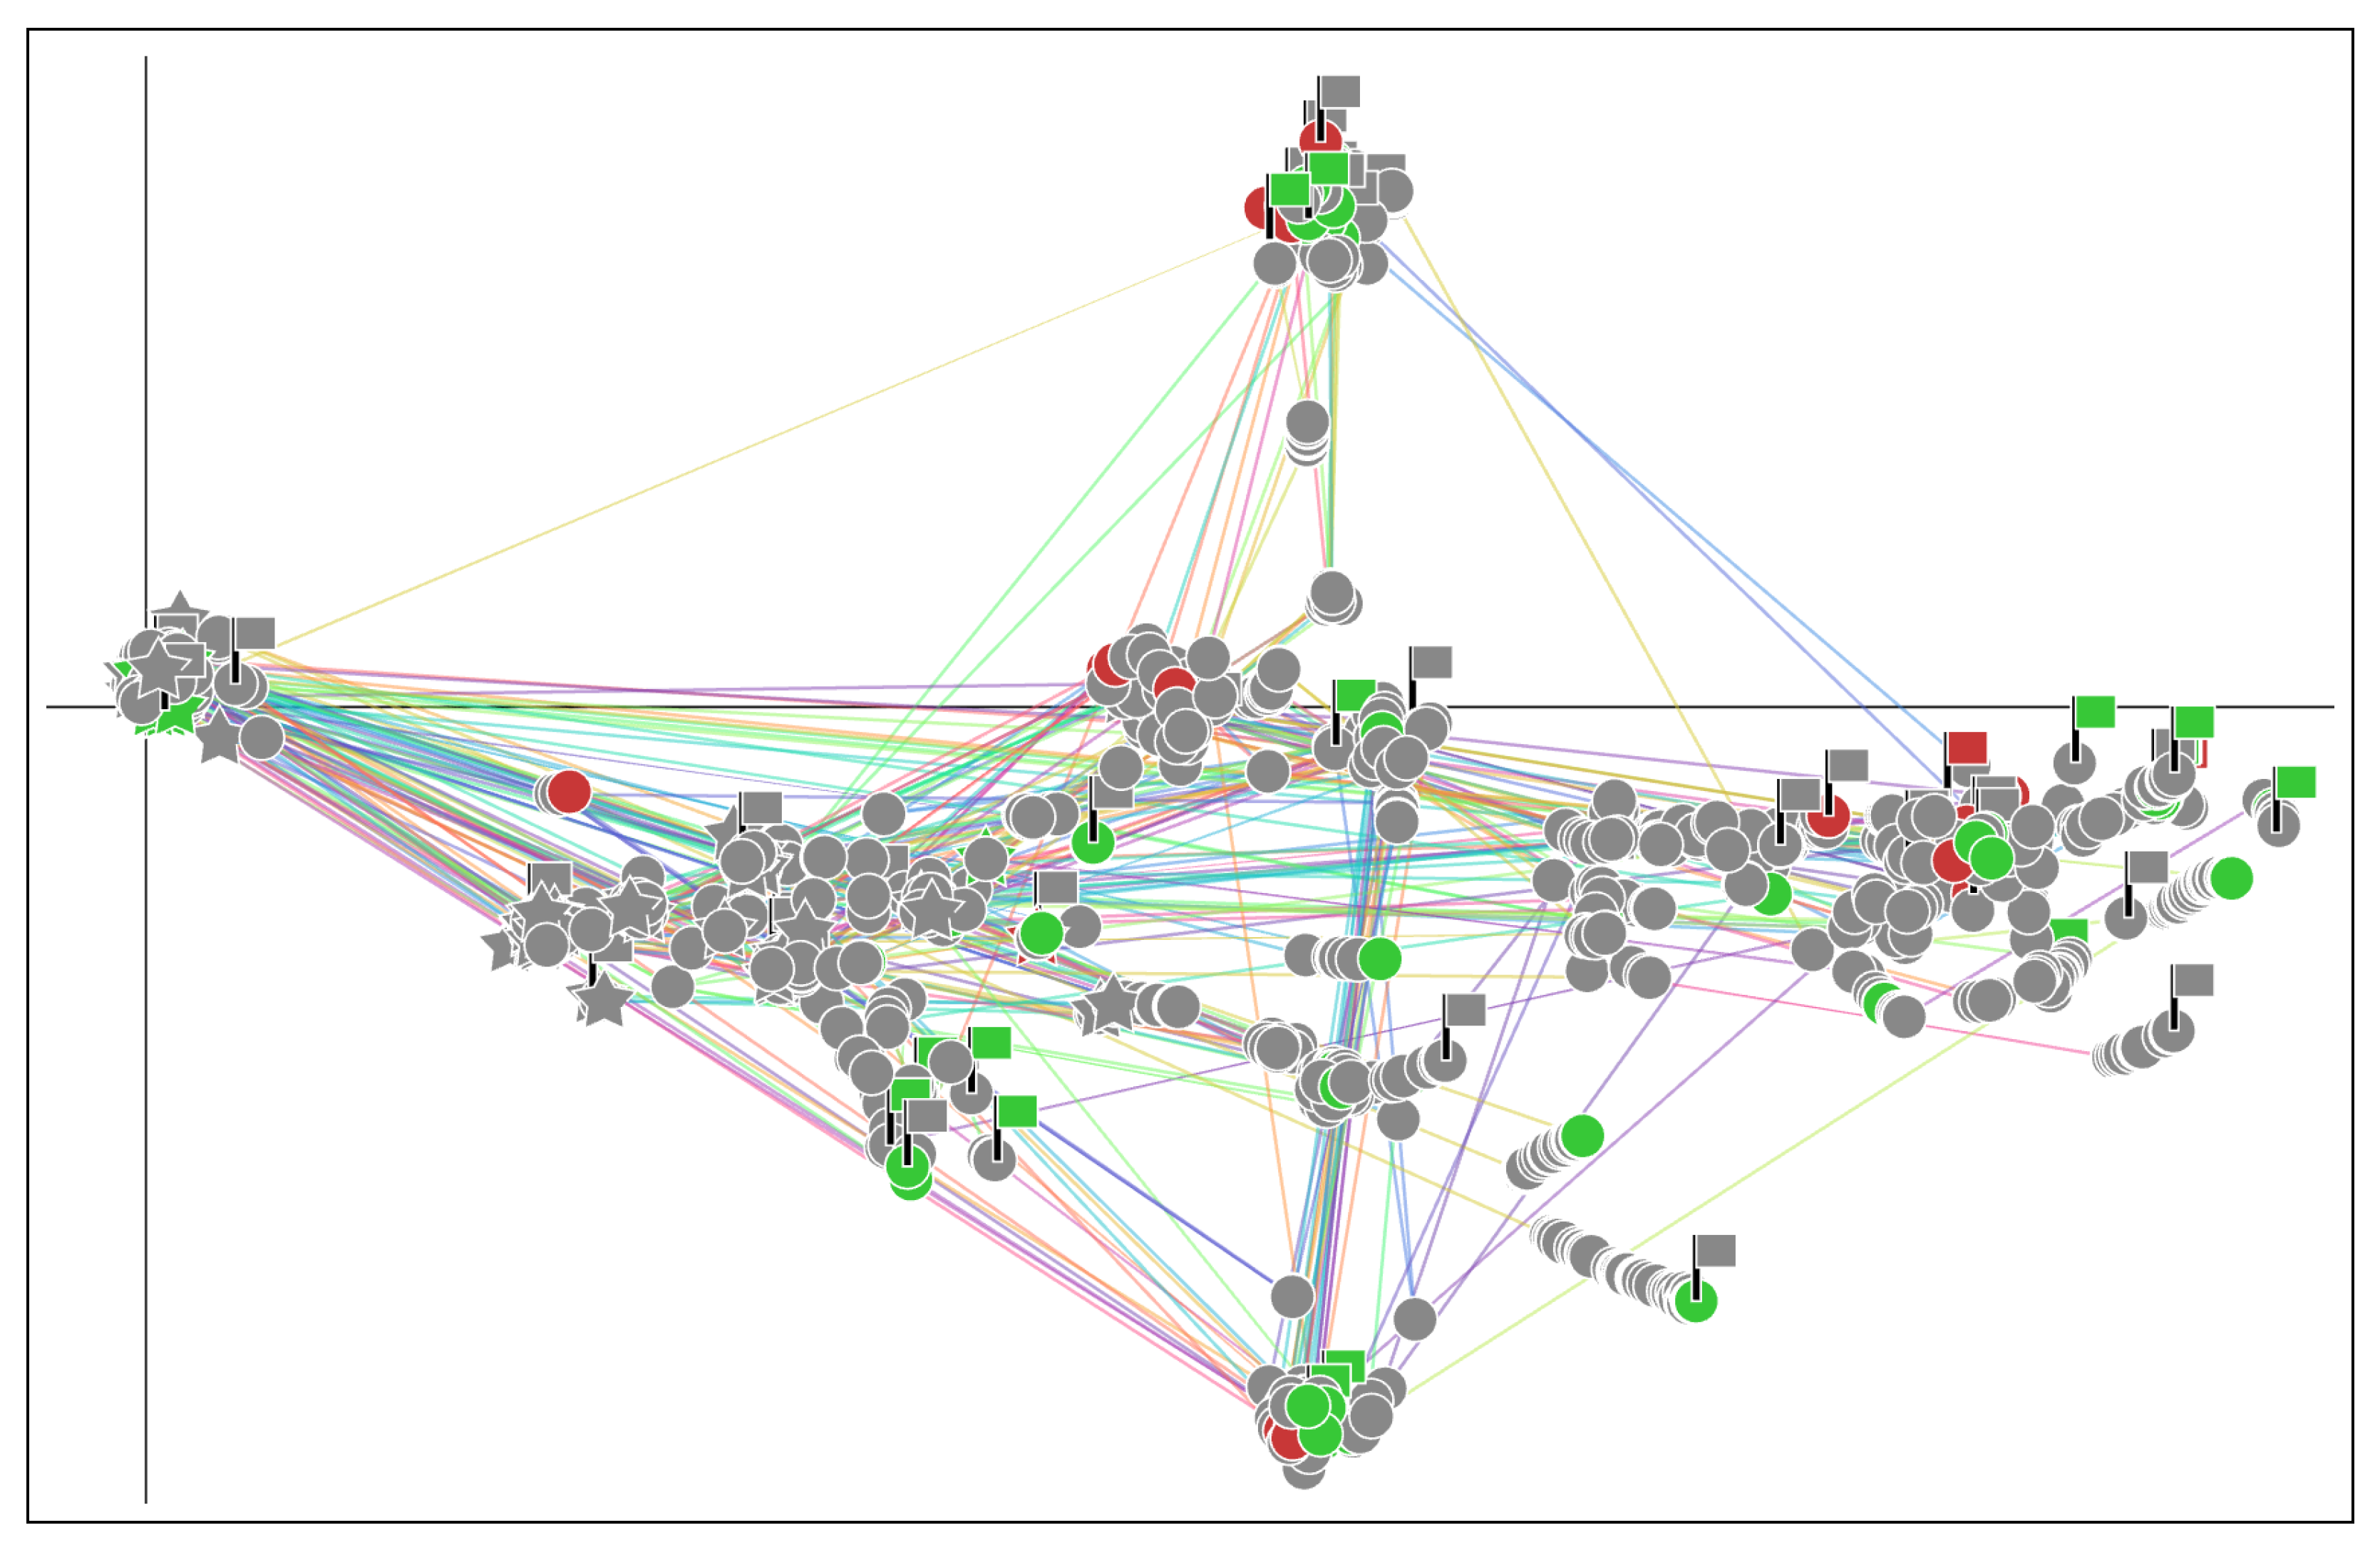
Figure 4 shows an example of CTM. In the figure, source-code snapshots have different shapes; for each student, the first source code written in class is shown as a star, the last code as a flag node, and any others as circles. The meanings of node colors are as follows: gray indicates the code was not executed, green that it was executed without any errors, and red that it was executed with some errors. Please note that even source-code snapshots with exactly the same content will be drawn in slightly different locations. This makes it easy for us to see how much of the same source code is densely populated. The snapshots coming from the same student session are connected by a line in chronological order with different line colors indicating different students. The intersection of the vertical and horizontal lines indicates where the empty source-code snapshots are distributed; we can think of the point as the origin of the source-code space. We should not, however, think of these straight lines as axes with any meaning. These lines exist only to indicate the intersection point.
As shown in
Figure 4, where students start and end writing source code varies from student to student, and even more so when it comes to intermediate source code they pass. We can also see structural patterns in the figure; there are clusters of similar source code and a bunch of lines connecting such clusters. With this visual representation of programming process, teachers can see how students solved exercise problems, what similar source-code groups existed, what popular writing strategies were used, and what individual coding activities students performed. In addition, the use of colors allows teachers to easily identify source code that is prone to errors.
CTM as an interactive reviewing tool consists of two parts: the visualization of source-code distribution and the property panel.
Figure 5 shows the appearance of the tools; the property panel is shown on the left, and the visual representation of programming processes is shown on the right. (The property panel is actually shown over the visualization.) A user can access the detail of source code on the property panel by selecting one in the visualization. The information shown in the panel includes the user ID, date and time, code and parent code IDs, cluster ID, the reason it was saved, whether there was an error or not, number of compiles, number of runs, and content of the source code. Furthermore, selecting a snapshot also affects the visualization; to make the trajectory containing the selected snapshot stand out, the other trajectories will be semi-transparent.
2.3. Cluster Flow Diagrams
CTMs make many details of programming activities available to teachers while maintaining reasonable complexity. Although the structure of progress could be seen in the maps, it is not explicitly represented and requires teachers to spend additional time to understand it. Hence, we also propose that CFDs provide apparent, rougher perspective on the structure of class-wide programming progress. The important point here is to capture the major patterns in the evolution process so that the structure is emphasized. It can be realized by performing some kind of clustering to group similar activities together. To this end, both of the following points must be addressed by the clustering algorithm at the same time:
Similarity in source-code content must be considered, and
Alignment of programming processes is required because writing activities are not synchronized from student to student.
2.3.1. Generating Visual Representation
We propose a clustering algorithm that addresses these points based on the dynamic time warping (DTW) algorithm [
21].
Figure 6 illustrates an example process of clustering by our algorithm. Our algorithm takes as an input a set of sequences of source-code snapshots, each of which represents a programming session of a student. The output of our algorithm is a set of clusters consisting of source-code snapshots. The DTW algorithm is used to address the alignment problem of programming sessions in the first step of the algorithm. The algorithm computes the optimal alignment (matching between source-code snapshots) between different programming sessions (see Step 1 in the figure). The computation of alignment requires a distance measure for sequence elements (source-code snapshots, in our case). We employ the Levenshtein distance for this purpose.
The second step of the algorithm is to group source-code snapshots. This step is performed on each pair of sequences independently. We consider two matching snapshots from different sessions to belong to the same group using the following rules:
When both are non-empty source codes, they are grouped together if the normalized Levenshtein distance (described below) between them is less than a threshold.
Otherwise, they are grouped if both are zero-length regardless of the Levenshtein distance between them.
We repeatedly apply these rules to all the matching pairs from the beginning to the end of the sequences. We retain the same group as much as possible in the repetition until we find a pair that cannot be grouped; a new group would start if we found such a pair. In the figure, color indicates such groups, and thick lines between sequences represent matching pairs with a Levenshtein distance less than a given threshold.
Given strings
, the normalized Levenshtein distance
between them is defined as follows:
where
is the Levenshtein distance function, and
is the length of the string
x. We use the same operation cost values of one in computing the Levenshtein distance as in the case of CTMs.
The last step of the algorithm is merging groups into a cluster. We merge two groups if they share at least one snapshot. This operation is applied to the entire set of groups to compute the final set of clusters. In the figure, snapshots belonging to the same cluster are surrounded together.
2.3.2. Choosing Appropriate Threshold Value
Our algorithm has the threshold of normalized Levenshtein distance as its only parameter, which is responsible for controlling the granularity of the clusters. In this study, we take a data-driven approach to determine the threshold value. The algorithm uses this threshold to determine whether a matching pair should be grouped together or not. Suppose that the threshold value is also used as a criterion to determine if two adjacent snapshots in a single programming session are sufficiently similar. We can think most of such adjacent snapshots are relatively close compared to snapshots from different sessions because of the possible timings of taking snapshots. If the value is too small, many such pairs are incorrectly determined to be dissimilar.
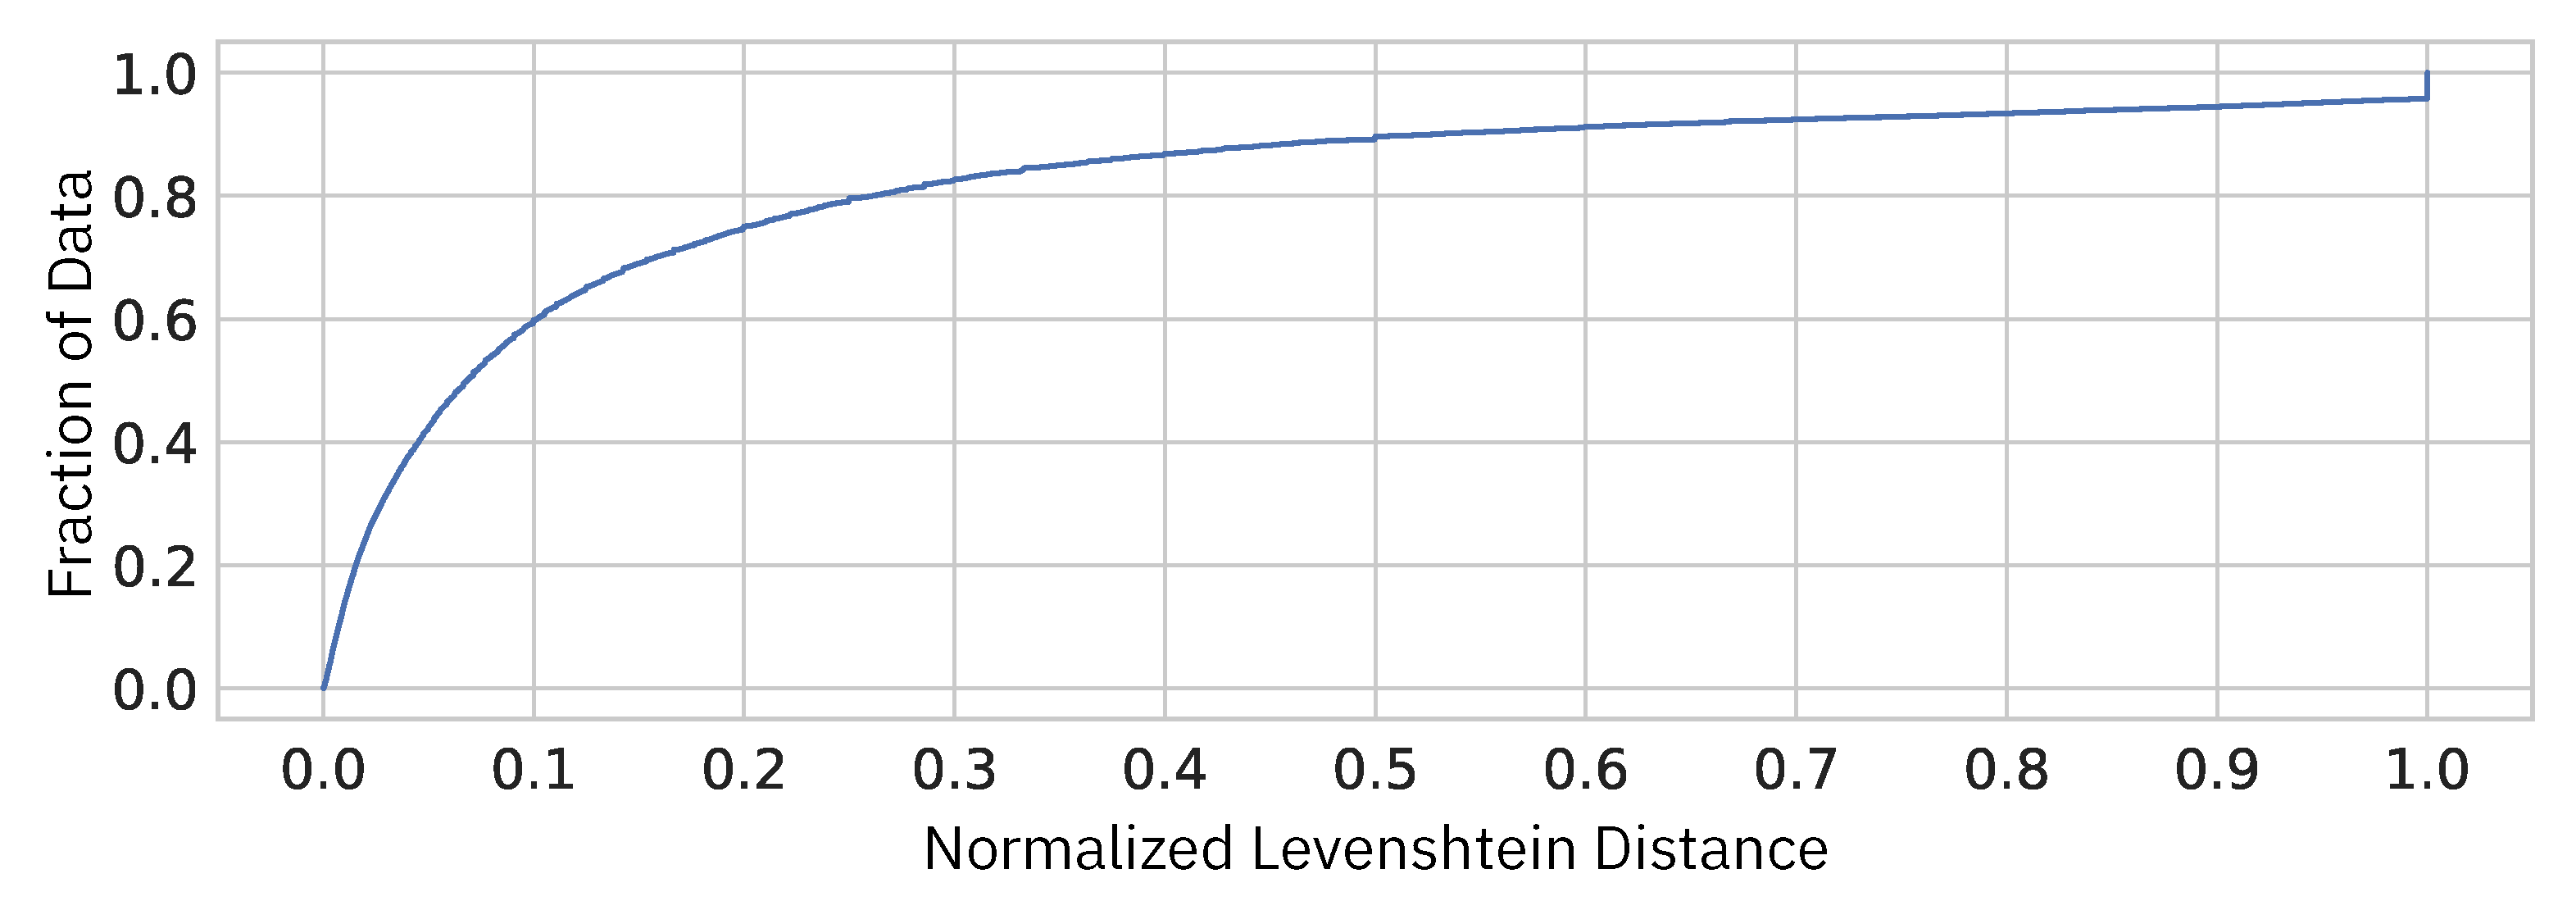
We investigate the distribution of the normalized Levenshtein distances between every pair of adjacent snapshots in our dataset.
Figure 7 shows the cumulative distribution of the normalized Levenshtein distances. The horizontal axis represents the normalized Levenshtein distance, and the vertical axis represents the fraction of adjacent snapshot pairs. As we would like to focus only on how much difference the programming process could make in source code, we exclude the adjacent snapshot pairs of the exact same content.
From this plot, for example, we can see that, if we take 10% of normalized Levenshtein distance as the threshold value, only about 60% of the adjacent snapshot pairs in the same session will be determined as similar pairs, which is too tight. In order for 90% of the pairs to be considered similar, however, we must allow for a normalized Levenshtein distance of about 40%, which seems too loose. Hence, we choose 20% () as the threshold, in which case about 80% of adjacent pairs are considered as similar.
2.3.3. User Interface
Based on the clustering results, we can see a programming process as a sequence of clusters. Simply presenting such cluster sequences would not be helpful because the underlying structure of programming process would not be unveiled. To make such structures apparent, we employ a directed graph representation in which obtained clusters are drawn as nodes, and transitions between clusters are drawn as edges (arrows). Unifying every occurrence of the same cluster into a single node, we obtain a kind of transition graph. Such a representation is commonly used by the literature in the context of sequence mining; however, in such graphs, the transition flows are folded too much to understand how students’ source code diverged and joined.
To address the problem, we propose a slightly different representation that only moderately folds the same clusters into the same node.
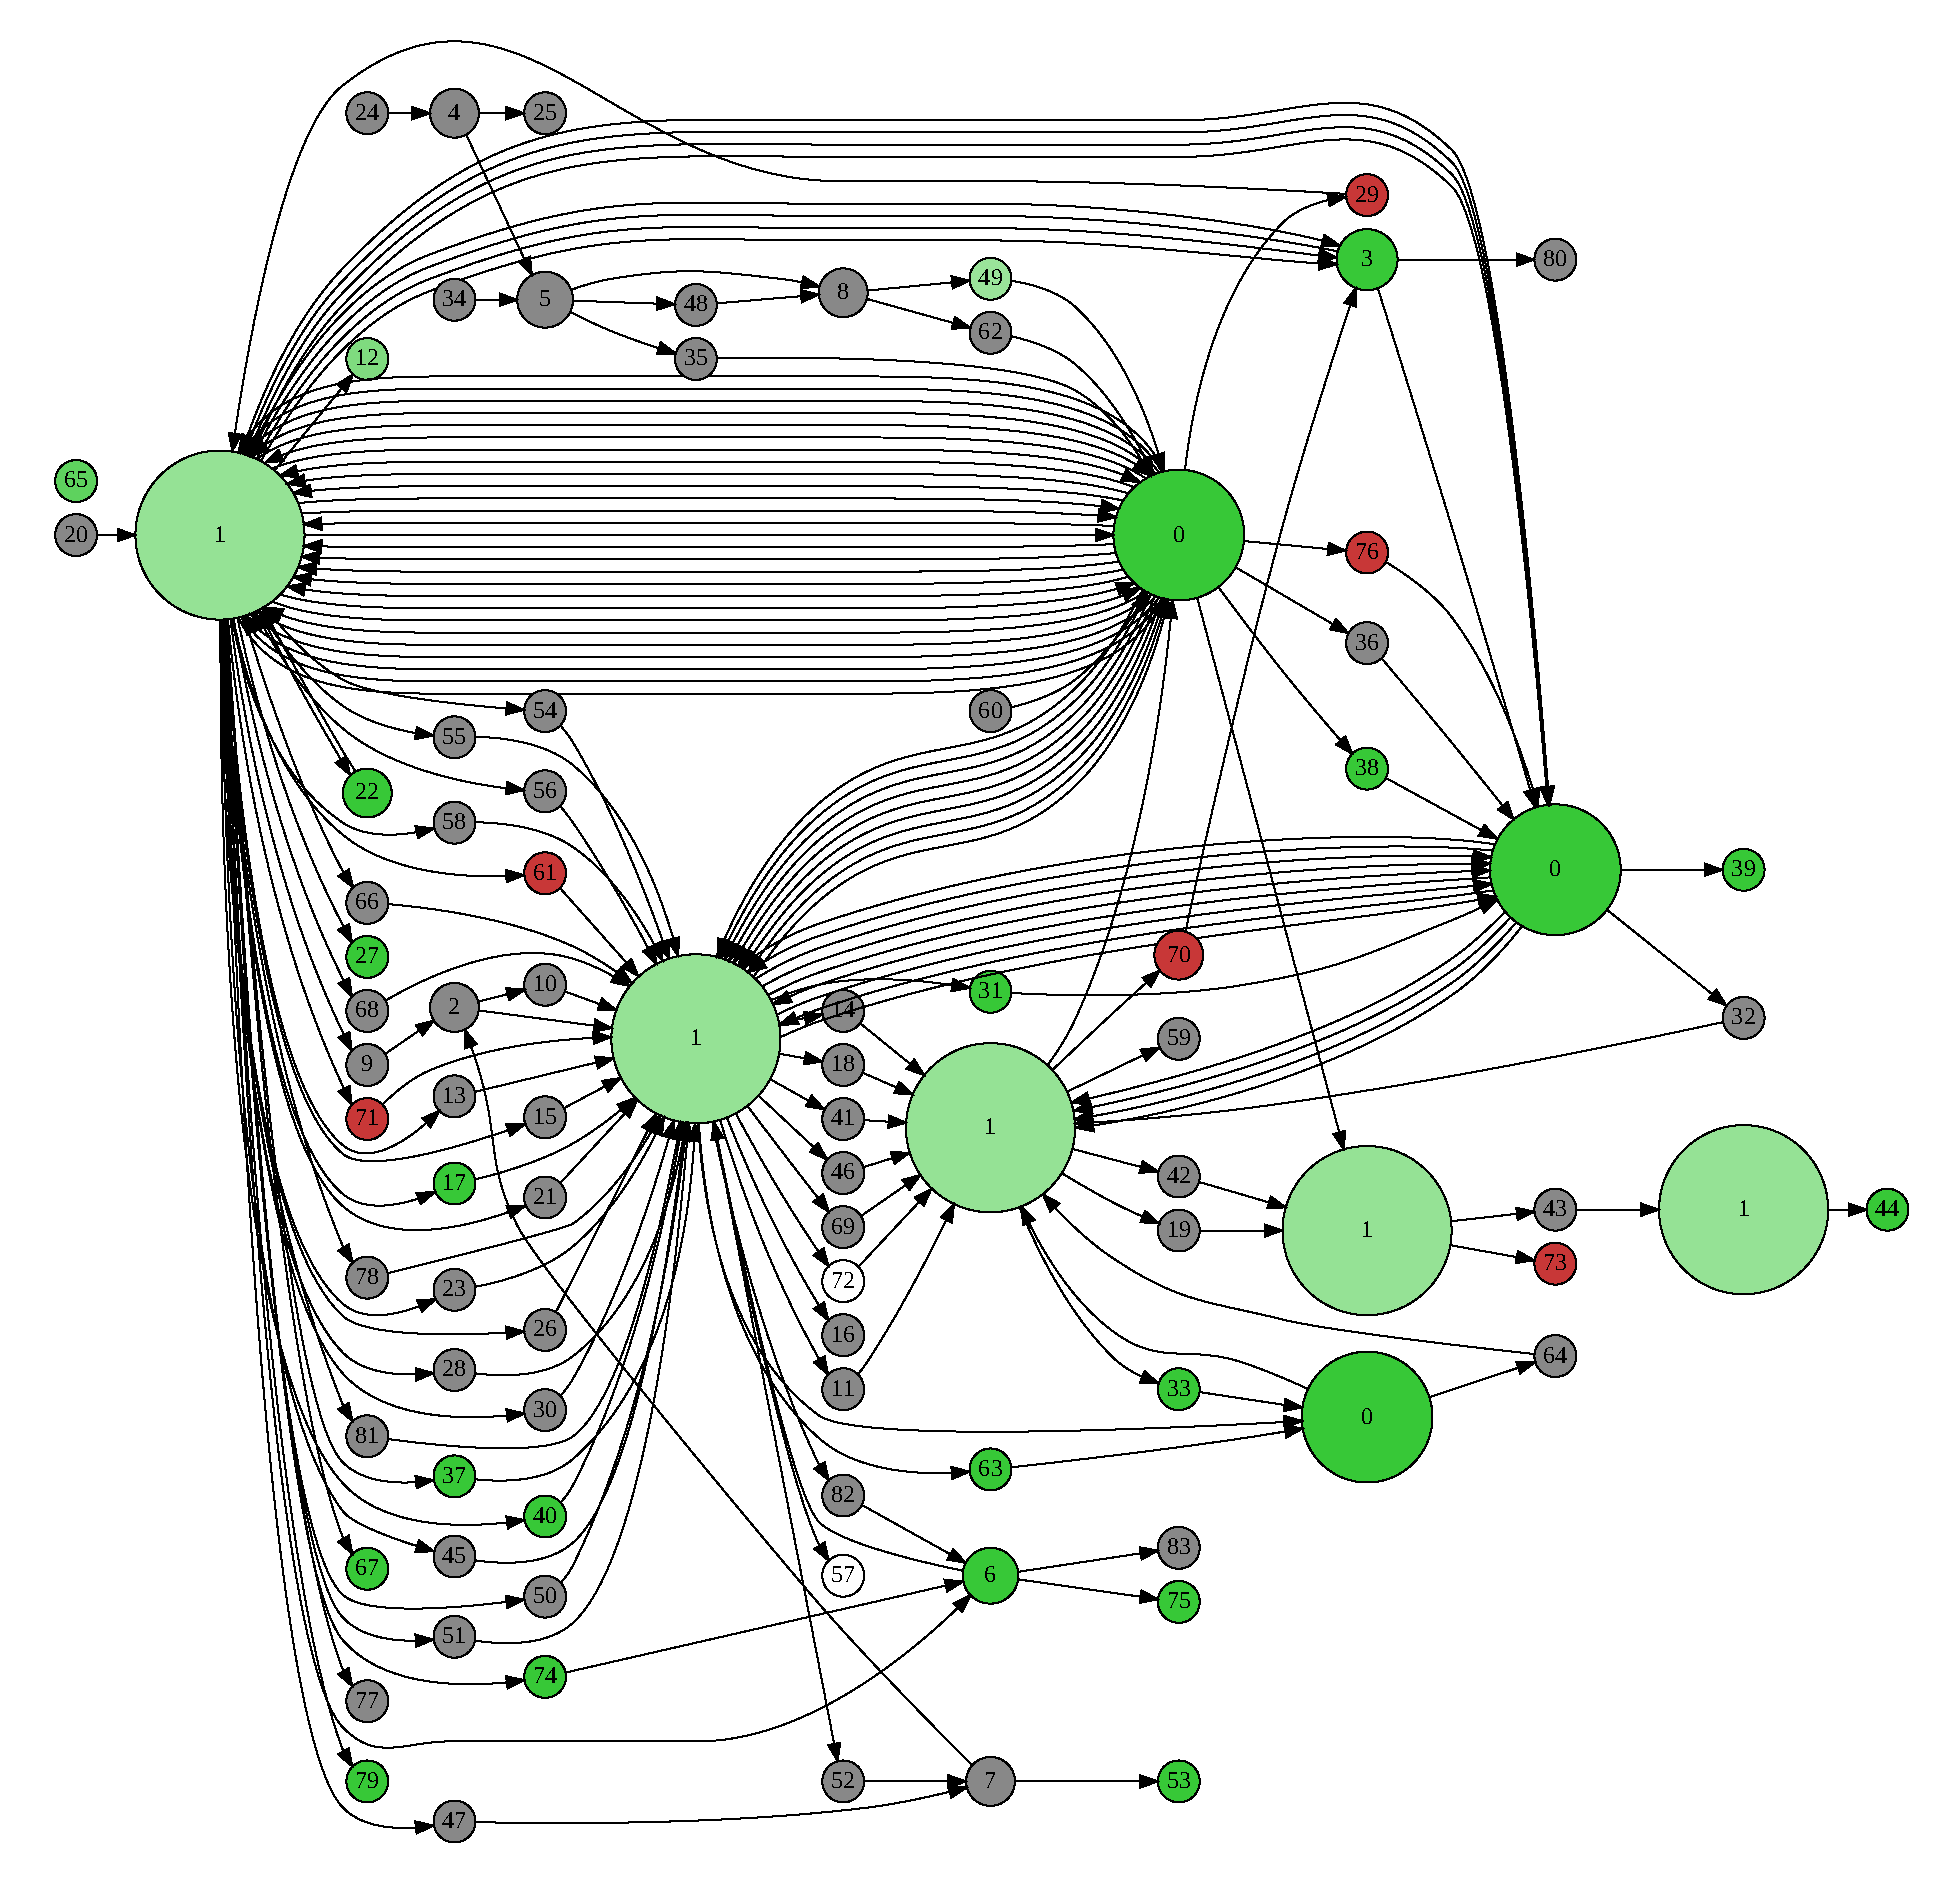
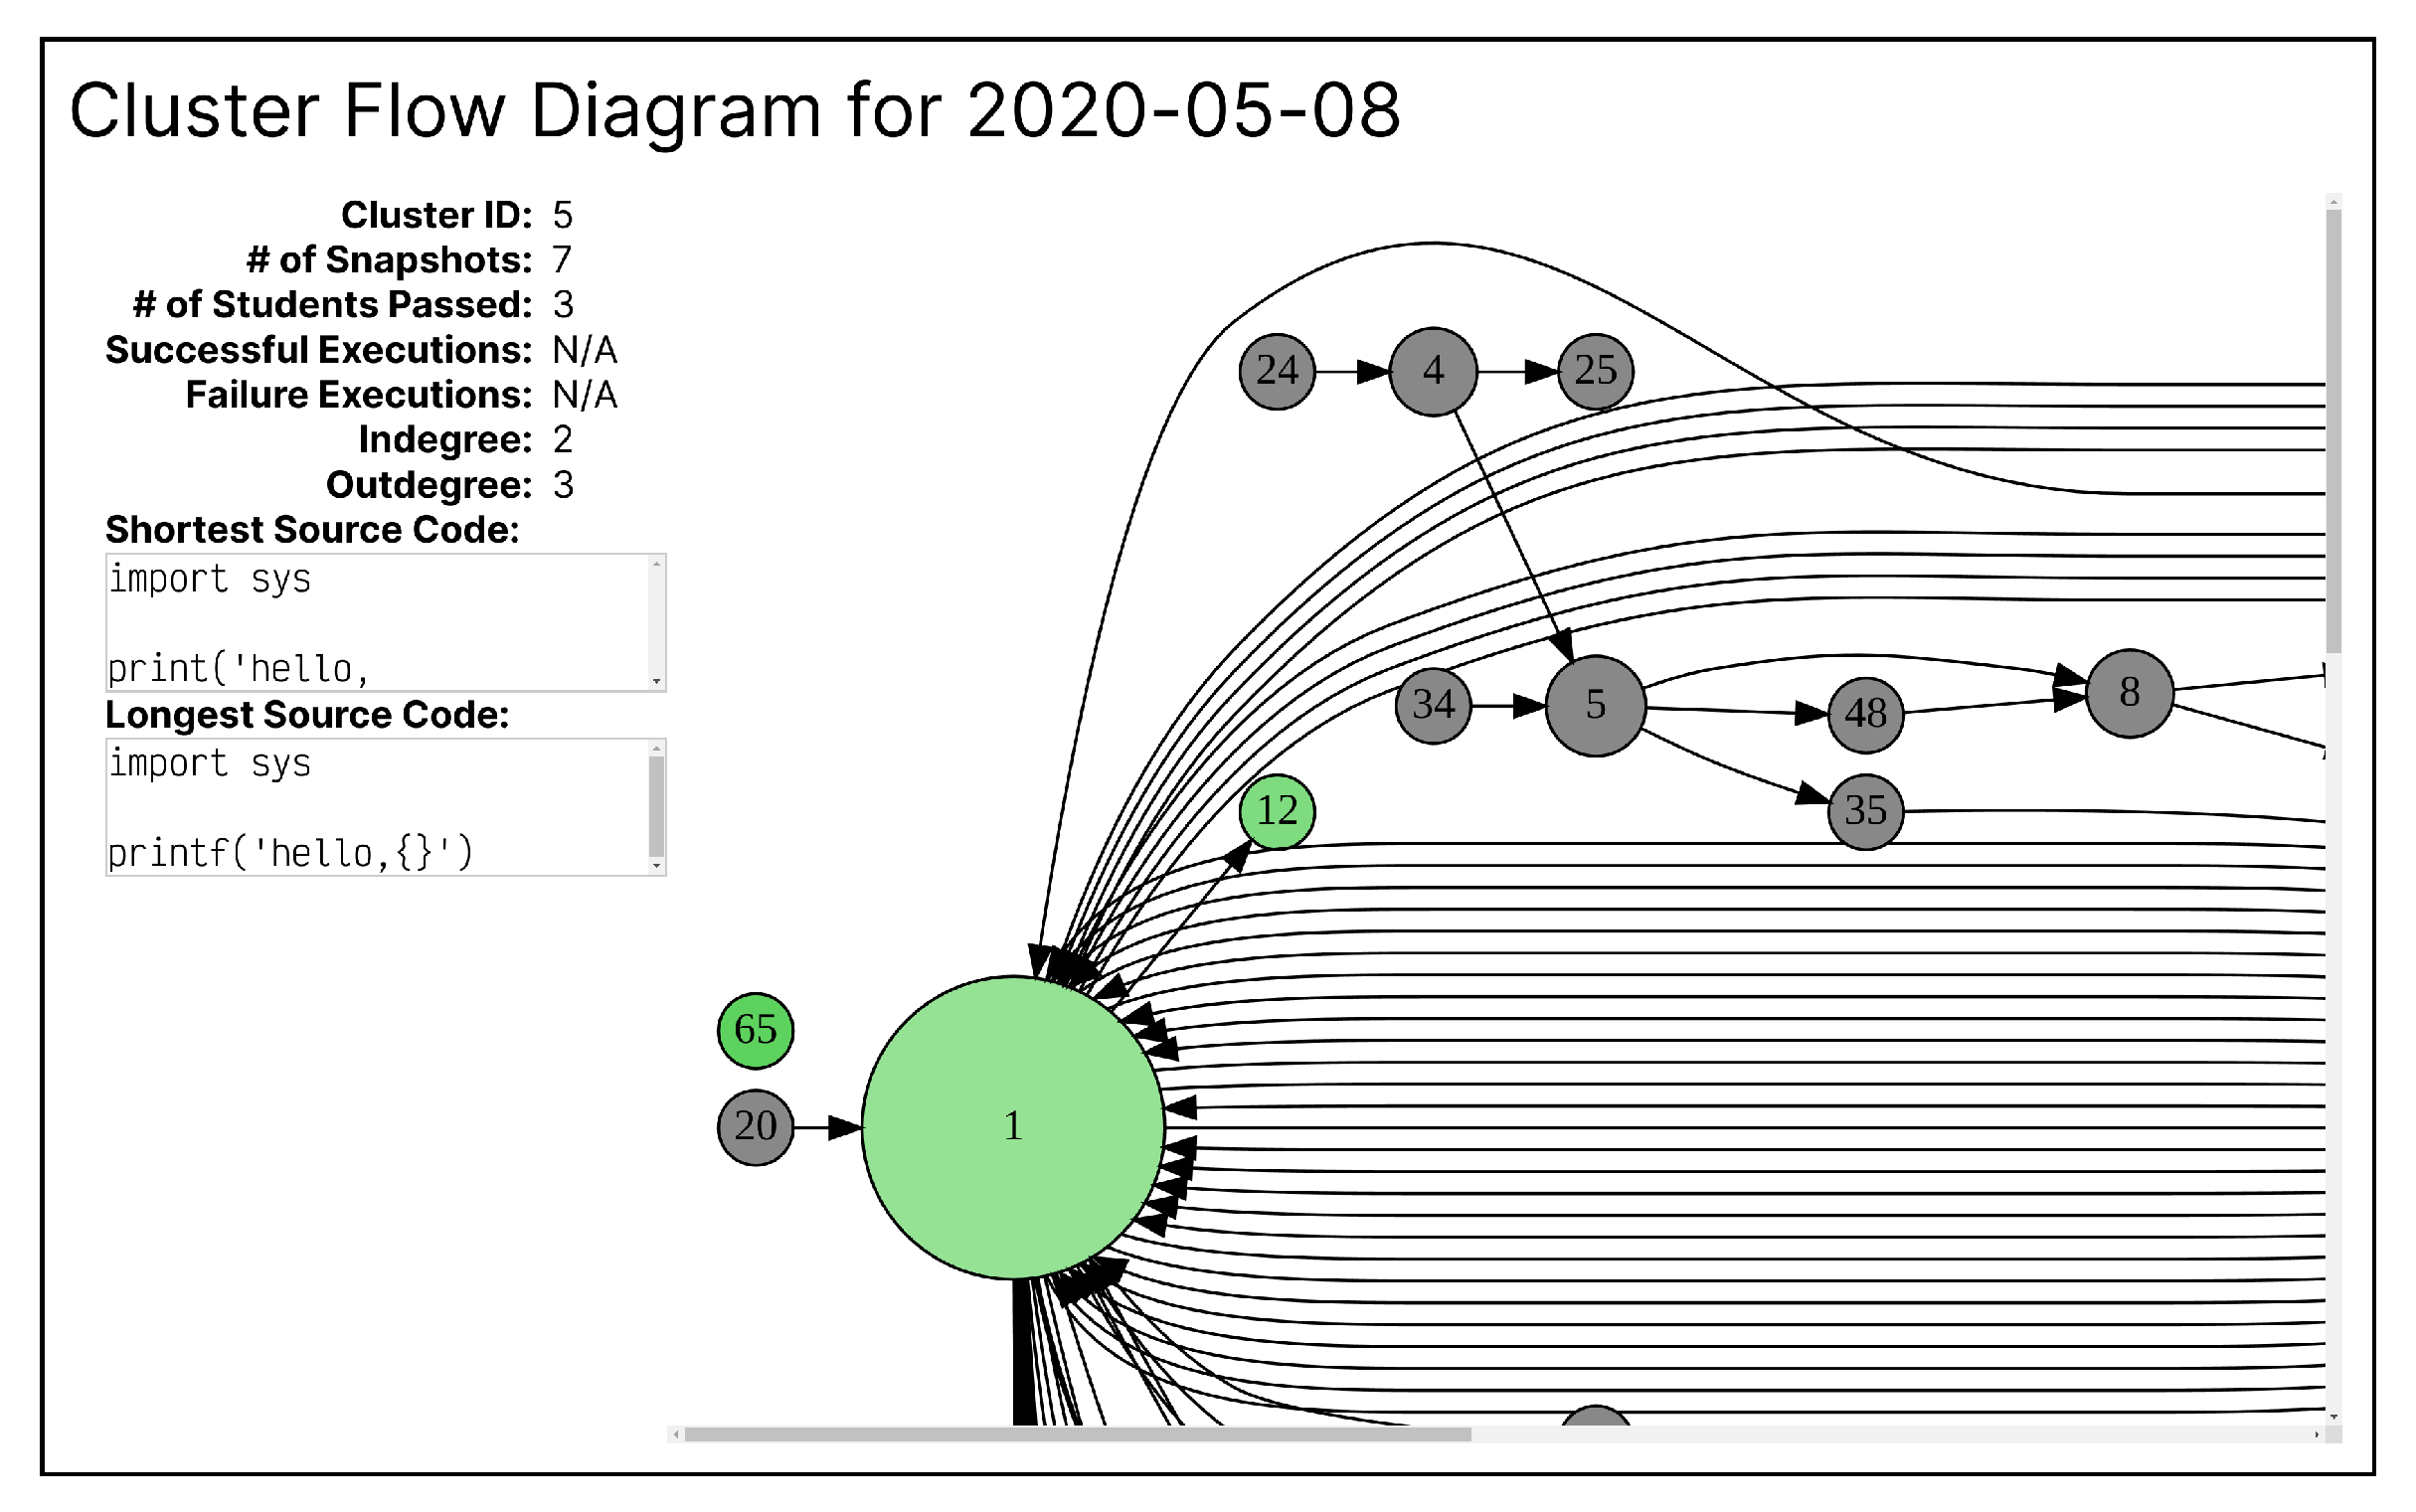
Figure 8 shows an example of such a representation, which we call CFD. Please note that, in the figure, the same cluster appears several times. We distinguish occurrences of the same cluster in a single session by the number of occurrences of each. That is, for example, a session sequence
is considered to be a sequence of indexed clusters
. This ensures that all indexed clusters appear at most once in a single session. We then normally generate a transition matrix from the indexed cluster sequences.
In addition, node size varies in proportion to the number of students who visited the cluster while node color reflects the execution results of the source-code snapshot contained in the cluster. Given the percentage of executed source code in the cluster that terminated with an error, the color is red for 100%, green for 0%, white for 50%, and intermediate between these colors otherwise. If none of the source code was executed, the cluster color is gray. If transitions occur more than once between the same pair of indexed clusters by different students, they are depicted as separate arrows. To render the diagram, we use the software Graphviz [
22] with the “dot” layout engine. We expect this visual representation to make it easier for teachers to understand the structure of class-wide programming processes thanks to the visual patterns found in the graph.
CFD as an interactive reviewing tool consists of the property panel and the visualization part, as in the case of CTMs.
Figure 9 shows the user interface of the tool. When a user clicks on a node, the detailed information of the corresponding cluster is shown on the left of the view, as shown in the figure. The information shown includes the cluster ID, number of source code, number of unique users who contributed to the cluster, ratio of the executed source code that did not have errors, ratio of the executed source code that had errors, indegree and outdegree of the node, and the shortest and longest source code included in the cluster.
2.4. User Evaluation
We conducted an experiment for user evaluation of the reviewing tools based on the proposed visual representations of programming processes. We asked seven university teachers who had previous experience teaching programming to evaluate the tools in the context of reviewing past classes. Those teachers were asked first to learn how to use the tools and then to review three weeks of programming exercises with them. We provided instructions on how to use these tools in both text and video formats. After reviews, they were asked to answer a questionnaire for each tool on a 5-point Likert scale to measure the degree of agreement on each question with 1 standing for strongly disagree and 5 standing for strongly agree. For the first question of each questionnaire, respondents were asked to describe the reasons for their answers. In addition, we also asked respondents for free-description comments on the tools. Those questionnaires are not based on existing ones. The question texts are shown in tables in the next section. These tables also show the questionnaire results: the mean score and the standard deviation for each item.
We provide some additional information about the question texts as follows. Regarding CTM-1 and CFD-1, these questions actually ask whether each tool is as described or not. The descriptions of the tools that the participants read explained what they could do with each tool, and these questions contain those explanation texts almost verbatim. In this sense, these questions are equivalent questions. In questions CTM-4 and CFD-4, we mean source-code editing activities that are common or uncommon among many students by major or minor programming activities, respectively.
The participants reviewed 3 weeks of classes out of 14 weeks in the dataset. While our goal is partly to understand the learning activities of the class as a whole, another important objective is to identify students and cases in need of assistance. For this reason, we chose the early weeks: the first, third, and fourth weeks. It is expected that students are particularly vulnerable to problems in the early weeks.
3. Results and Discussion
In
Table 2, the coding trajectory maps were given a high score of 4.43 on question CTM-1. This suggests the tool successfully provided the details of the individual coding activities. The following lists the reasons for the responses:
I think that it is useful for reflection and improvement after the class, because I can visually grasp the number of similar errors and their number, while grasping the transitions that the target students have made in their source code.
The coding process is detailed, so it is possible to understand it precisely.
Since it is possible to see how the students implemented the program, it is easy to point out efficient implementation methods and follow up on any stumbling blocks.
By using this tool, I can grasp each student’s exercise process in detail, which is very useful as information during instruction. By clicking on a node, the actual source code is displayed, and the coding process of each student can be traced, making it possible to visualize the areas in which they are stumbling. Therefore, it is possible to grasp the contents that require explanation for the class as a whole and the contents that should be taught individually, and I judge that this tool is useful because it enables more detailed instruction.
Because it is possible to check overall trends and specific behaviors at the same time.
Because the location of errors can be grasped immediately, and in addition, it is possible to move to the past/future along the time axis.
It would be easier to analyze if each node could be abstracted and combined into a single node for a macroscopic view.
In summary, it is clear that teachers commonly appreciated the ability to see detailed information and to follow the process of changes in the source code over time. In addition, the comments also indicate that some teachers valued the abilities to identify programming errors, the ways programs were written, common tendencies, and peculiar behaviors. Although it seems that the last comment is not the reason for the response, the comment addressed the need for a coarser visualization, such as CFDs.
In terms of source code, we can say that the teachers considered the tool helpful for finding source code that is problematic to students (CTM-2). In contrast, it is not as helpful for identifying typical code examples (CTM-3). Concerning coding activity patterns, it is suggested that common patterns and abnormal activities could be easily identified by teachers (CTM-4). As for students, we can expect the tool may help notice students we should pay attention to (CTM-5), although the score is not very high. Overall, it is shown that the coding trajectory maps have functions useful to find important code, students, and activities in programming exercise, and teachers agreed that the tool is useful for reflecting on classes (CTM-6).
From
Table 3, we can see the CFD was rated as being useful for checking the progress of the entire class through the cluster-level transition patterns (CFD-1). However, the score is a bit lower than that of CTM’s equivalent question (CTM-1) The reasons for the responses are as follows:
I think it is useful because it allows us to statistically grasp the trend and wrong points of the programs in the whole exercise. On the other hand, there are some difficulties in the visualization method, which will require further improvement.
It is easy to grasp the branches on the path from the start of programming to its completion at the individual or group level.
The size of the circles is intuitive and easy to understand.
While the CTMs show the students’ programming transitions, I think the CFDs allow us to grasp the students’ tendencies thanks to the grouping of students. I would like it to show how I should understand and grasp the trend.
Common source code such as import statements automatically become clusters. When grasping the details of the source code, the number of nodes is expected to increase as the amount of source code increases, and it would be cumbersome to use this information to grasp the progress of the entire class exercise. For example, regarding the writing of if statements, a similar process can be implemented in a grammar using the ternary operator, but in that case, the tool will represent them as different nodes, and therefore, as the source code grows, it will be complicated to grasp the entire process. However, if students write almost the same source code, I believe that using this tool would be beneficial as a countermeasure against the copy-and-paste problem.
Because it allows a rough grasp of the transitions of students’ source code.
Because I can see the size of clusters and the overall picture of transitions between clusters, as well as detailed source code.
As we can see in the comments, the participants appreciated CFD’s ability to see the trend and the big picture of the exercises. Meanwhile, two participants pointed out difficulties related to the complexity of the visualization, and one participant wanted a more specific presentation of trends. These comments suggest that teachers may have difficulties in reading programming trends from CFD’s visualization. Therefore, future studies may need to improve the visualization method and/or to present concrete trend patterns together to assist in reading the visualization.
Regarding source code, even though the mean score of CFD-2 is not low, it is hard to say the tool is suitable for identifying the source code with which students struggled. In contrast, the tool received the high score of 4.29 for CFD-3, which suggests teachers thought the tool was helpful for identifying representative source-code instances. In terms of coding activities, its score for CFD-4 is relatively low compared to other questions but not lower than 3. This might be because the tool aggregates continuous source code into clusters, and actual coding activities are not apparent. Teachers weakly agreed that the tool was useful for reflecting on the classes (CFD-5).
Overall, the CFD received a certain amount of positive feedback although these scores are not as high as CTM’s except for the use case of identifying typical examples of source code (see CFD-3 and CTM-3). This result reflects the advantage and disadvantage of the tools. From the result, we can say CFD is better than CTM at showing representative source code instead of individual source code that, for example, causes errors.
In the free-description comments, one of the most anticipated features was the interoperability function. Teachers wanted to jump from one tool to the other. This suggests that the teachers also considered these tools to be complementary. Another feature requested most was a temporal presentation of the flows. The current versions of the tools are designed to reflect on classes and be statically implemented. It would be a future project to realize real-time feedback with the interoperable versions of the tools.
Our research question was “What are the effective visual representations for feedback to teachers about programming processes?” According to
Table 2 and
Table 3, the teachers valued the effectiveness of both proposed visual representations, especially in reviewing classes. In comparison, the score of CTM (CTM-1) was better than CFD’s (CFD-1); however, the latter score was by no means low. Furthermore, we found the tools are complementary; while CTM fits better in reviewing source-code-level programming activities (CTM-2, CTM-4), CFD works better in identifying representative source code from entire programming sessions (CFD-3).
In addition, the comments from the participants provided helpful insights for future research. Although CTM and CFD were proposed as separate tools in this study, it may be more convenient for teachers to develop them as a single tool and to allow teachers to adjust the granularity of its visualization as needed. Moreover, while this research focused mainly on visualization, we believe that extracting and presenting useful patterns related to programming activities can also support teachers and may be even more effective when used in conjunction with the proposed visualization.
In summary, this study successfully presented two different concrete visual representations for understanding class-wide programming sessions. From the questionnaire result, we can say that CTM is definitely one of the effective visual representations for the purpose. On the other hand, the usefulness of CFD was recognized to some extent, but there is still room for improvement in its visualization method.
Several studies proposed visualization methods to better understand students’ programming processes. For example, Yan et al. [
23] tried to understand programming processes through milestones of graphical output generated from student programs. Simon et al. [
24] proposed a visualization technique to represent the programming process in Scratch. Diana et al. [
14] proposed a dashboard that shows an interaction network representing students’ transitions over code states. However, their methods cannot be directly applied to the goal of visualizing the evolution of textual source code, and research targeting this goal is limited.
Yin et al. [
10] presented a visual representation of a set of source code, which is similar to our CTMs. The most important difference is that it relies on the abstract syntax trees of source code. This makes it impossible to generate their representation from a source-code dataset that includes grammatically incorrect source code because abstract syntax trees cannot be constructed from such source code. This property of the representation is not suitable for programming processes because the source code in the process of being written is almost always incomplete. Of course, we can visualize only correct source code with their method; however, this significantly reduces the resolution of the rendered processes.
Regarding CFDs, clustering of source code is one of the widely used techniques in understanding a large set of source code: for example, plagiarism detection [
25,
26] and analysis of programming assignment solutions [
27]. Clustering usually requires measuring the similarity between source codes. There are two major approaches to measuring similarity based on source-code content: grammar-based [
28] and semantic-based [
10,
17,
29]. The semantic-based approach typically relies on abstract syntax trees and is therefore unsuitable for the reasons discussed above. Our approach could be categorized as one of the grammar-based approaches. In particular, our approach differs from others in that we view source code as a sequence of characters rather than a sequence of tokens. In writing programs, tokens are unstable entities. For example, the number of tokens can easily change if the space separating two identifiers is replaced by an underscore. Further, placing a single double quotation mark anywhere will cause many subsequent tokens to be treated as part of a single string literal. We cannot tolerate such instability because we track changes in the source code over time, and therefore we employ a character-by-character sequence as a robust method. This approach has the additional advantage of being programming language independent, since it does not require a programming language grammar or a language-dependent training dataset or model.
Several clustering methods have been employed to perform source-code clustering: spectral clustering [
27], a graph-based approach [
30], k-means algorithm [
31,
32], and so on [
10,
33]. However, few clustering algorithms consider the persistent evolution of source code over time. For example, Piech et al. [
33] proposed a hidden-Markov-model-based analysis to model student progress. In their study, progress states (corresponding to clusters in our study) were extracted with a k-medioids algorithm without considering source-code evolution. In contrast, our clustering algorithm uses the Levenshtein distance to consider similarity of source-code content and, in addition, uses the DTW algorithm to simultaneously consider temporal ordering.
4. Conclusions
This study addressed the problem that visual feedback to teachers on learners’ programming often fails to consider the temporal evolution of the source-code content. We proposed coding trajectory maps (CTMs) and cluster flow diagrams (CFDs) as visual representations of class-wide programming processes. They can present information to teachers at different granularities, taking into account the content of the source code. The CTMs are built on top of the visualization based on the t-SNE algorithm in conjunction with the Levenshtein distance of source-code contents and designed to show precise programming activities in the processes as well. CFDs, on the other hand, provide a rougher perspective for understanding the programming processes based on the clustering results from the proposed clustering algorithm. The proposed algorithm considers the temporal evolution in source-code contents in sessions employing the dynamic time warping algorithm and Levenshtein distance. We conducted an experiment for user evaluation of the proposed visual representations specifically in the context of reviewing past programming classes. From the results of the questionnaire, it can be said that CTMs were recognized by the teachers as an effective visual representation for understanding programming processes. On the other hand, although the teachers found CFDs useful to a certain extent, there is still room for improvement in its visualization method. The results of this study have the potential to enable teachers to gain a detailed understanding of students’ programming processes even during online classes under special circumstances, such as COVID-19, and will contribute to sustainable programming education in the future.
This study has three main limitations. First, the use of the tools was different from the original intended use. The proposed tools was intended for teachers to check the status of their students’ exercises during or after class and then to intervene in student learning. However, in our experiment, the participants could not intervene because they only reviewed past classes. The reason for this is that it is difficult to match the actual content of classes given by different teachers. In this study, the emphasis was on confirming the usefulness of the tools objectively under identical conditions. It would be an issue for future research to conduct more realistic evaluation in different teachers’ classes.
Second, the efficiency of the tools was not examined. While efficiency is undoubtedly an important factor in actual use, this study placed the highest priority on establishing an effective visualization method. In future studies, we plan to evaluate the efficiency of the proposed tools in classes and develop more efficient methods. For example, comments obtained from participants mentioned the implementation of interoperability between the two tools, which could be one way to increase efficiency.
Third, the participants did not review every week’s programming sessions with the proposed tools. In this study, the evaluation was conducted on programming activities in the early weeks of the course, when students are particularly likely to have problems. As students progress in their learning, their understanding of programming will deepen, and the way they make mistakes may change. Furthermore, since the lesson content differs from week to week, there remains the possibility that individual differences in programming may not be well-represented in some cases. Therefore, the results of this study are only applicable to classes in which students do not have advanced skills and the content is relatively basic.
Future studies should examine how the proposed tools can be used during actual classes and what improvements teachers can make by using them. At the same time, it is also important to improve the tools so that teachers can use them effectively in the limited time they have in class, including integration of the proposed tools.


