Article

Metal Contents and Pollution Indices Assessment of Surface Water, Soil, and Sediment from the Arieș River Basin Mining Area, Romania

1
INCDO-INOE 2000, Research Institute for Analytical Instrumentation, 67 Donath Street, 400293 Cluj-Napoca, Romania
2
Faculty of Materials and Environmental Engineering, Technical University, 103-105 Muncii Boulevard, 400641 Cluj-Napoca, Romania
3
Faculty of Horticulture, University of Agricultural Sciences and Veterinary Medicine, 3-5 Manastur Street, 400372 Cluj-Napoca, Romania
4
Department of Geology and Paleontology, Emil Racovitza Institute of Speleology, Calea 13 Septembrie, 050711 Bucharest, Romania
*
Authors to whom correspondence should be addressed.
Sustainability 2022, 14(13), 8024; https://doi.org/10.3390/su14138024
Submission received: 27 May 2022 / Revised: 27 June 2022 / Accepted: 29 June 2022 / Published: 30 June 2022

Abstract

:
The current study was conducted to assess the level and spatial distribution of metal pollution in surface water, soil, and sediment samples from the Arieș River basin, located in central Romania, an area impacted by various mining and industrial operations. Several pollution indices, spatial distributions, cluster analyses, principal component analyses, and heat maps were applied for evaluating the contamination level with Ni, Cu, Zn, Cd, Pb, Mn, As, and Hg in the area. Based on the results of the Heavy-Metal Pollution Index and of the Heavy-Metal Evaluation Index of the surface-water samples, the middle part of the Arieș River basin, near and downstream of the gold mine impoundment, was characterized by high pollution levels. The metal concentration was higher near the tailing impoundment, with increased levels of Cu, Ni, Zn, and Pb in the soil samples and As, Cd, Pb, Na, K, Ca, Mn, and Al in the sediment samples. Ca (23.7–219 mg/L), Mg (2.55–18.30 mg/L), K (0.64–14.70 mg/L), Al (0.06–22.80 mg/L), and Mn (0.03–22.40 mg/L) had the most remarkable spatial variation among the surface-water samples, while various metal contents fluctuated strongly among the sampling locations. Al varied from 743 to 19.8 mg/kg, Fe from 529 to 11.4 mg/kg, Ca from 2316 to 11.8 mg/kg, and Mg from 967 to 2547 mg/kg in the soil samples, and Al varied from 3106 to 8022 mg/kg, Fe from 314 to 5982 mg/kg, Ca from 1367 to 8308 mg/kg, and Mg from 412 to 1913 mg/kg in the sediment samples. The Potential Ecological Risk Index values for soil and sediments were in the orders Cu > Ni > Pb > Hg > Cr > As > Mn > Zn > Cd and As > Cu > Cr > Cd > Pb > Ni > Hg > Mn > Zn, respectively, and the highest values were found around the gold mine impoundment.

1. Introduction

As a result of increased industrialization across the world, large amounts of harmful pollutants are being discharged into the environment. Mining, a complex industry, has a wide range of environmental consequences, affecting, practically, every element of life on earth [1,2,3]. In this regard, mining activities are considered a major source of metals that can be discharged into the surrounding environment, polluting rivers and accumulating in high concentrations in soils and sediments [4,5,6]. Metals represent a major threat to the environment and to human health, as they can contaminate food chains, due to their environmental persistence as well as toxicity in the case of living organisms and bioaccumulation potential. Therefore, evaluating and monitoring the levels of potentially hazardous metals and metalloids in the exposed environmental areas and local biodiversity is crucial [7,8]. Among the most harmful metals and metalloids are nickel (Ni), chromium (Cr), copper (Cu), zinc (Zn), cadmium (Cd), lead (Pb), and arsenic (As). River water contamination by metals causes increased water quality deterioration, and it is toxic for the living organisms in the aqueous systems, even at low concentrations, causing significant histopathological alterations. Depending on the metal exposure and dose, metals can be carcinogenic, mutagenic, or teratogenic for sensitive species, through complex pathways, while organisms in aquatic ecosystems can be simultaneously exposed to several chemicals, with additive, synergistic, or antagonistic interactions [9]. The vast majority of metals accumulate in sediments by adsorption, depending on the sediment matrix, while many environmental parameters such as rates of discharge, temperature, pH, and organic matter highly influence the variation in pollutants in the water and in the sediment [10,11]. Soil metal contamination leads to the loss of bacteria populations that are necessary for the decomposition of organic matter, the improvement of soil quality, and the management of soil fertility [12,13]. The rhizosphere contains all the key biological functions for plants that can be strongly influenced by the biogeochemical parameters of soil or sediments where plant roots interact and the uptake of nutrients takes place and by the toxic elements and pollutants that can affect the plant’s lifecycle [14].
The determination of various pollution indices is one of the most common methods to evaluate the environmental contamination in surface water, soil, and sediments. In this regard, the Heavy-Metal Pollution Index (HPI) is used to evaluate the total effect of different metals on surface-water quality and the Heavy-Metal Evaluation Index (HEI) to show the overall surface-water quality in terms of metals concentration [15,16]. In terms of soil and sediment evaluation, several individual and complex indices are applied to determine the level and type of metal contamination (natural or anthropogenic), such as the Pollution Load Index (PLI), the Contamination factor (Cf), the contamination degree (Cd), the Ecological risks (Er) and the Potential Ecological Risk Index (PERI) [17,18,19].
The Arieș River basin is an area with a long history of pollution. Ever since the Neolithic age, large extractive centers of Au, Ag, Fe, and Cu ores, porphyry copper, lead–zinc ferrous and gold–silver ferrous deposits have been developed in the area. Moreover, during the socialist period, two important industrial centers were developed. These activities had an increased impact on the quality of the environment in the studied area.
Although there are some studies conducted in the area based on the possible impact of the potential environmental risk of mining [20,21,22,23], no studies have been completed on the integrated assessment of metal pollution in the Arieș River basin. This study’s hypothesis is based on the fact that in the Arieș River basin, the impact of metal pollution is expected to decrease over time as a result of the region’s limited or ceased mining activities, leaving the remaining pollution that could be remediated by natural attenuation or by in situ treatments. In this context, the aim of the study was to assess the metal content from surface water, soil and sediments (Fe, Na, Mg, K, Ca, Ni, Cr, Cu, Zn, Cd, Pb, Mn, Al, and As), to investigate the hydrological influences on their content, and to define the contamination level through the analyzed pollution indices. The surface-water quality was assessed using the HPI and the HEI, while the pollution degree of soil and sediment was characterized through the Cf, Cd, PLI, Er, and PERI. Overall, a comprehensive study on the pollution profiles and spatial distribution of metals in the Arieș region will aid in assessing the ecological risk and providing an acceptable base for the management of pollution problems in water, soil, and sediment in this region.

2. Materials and Methods
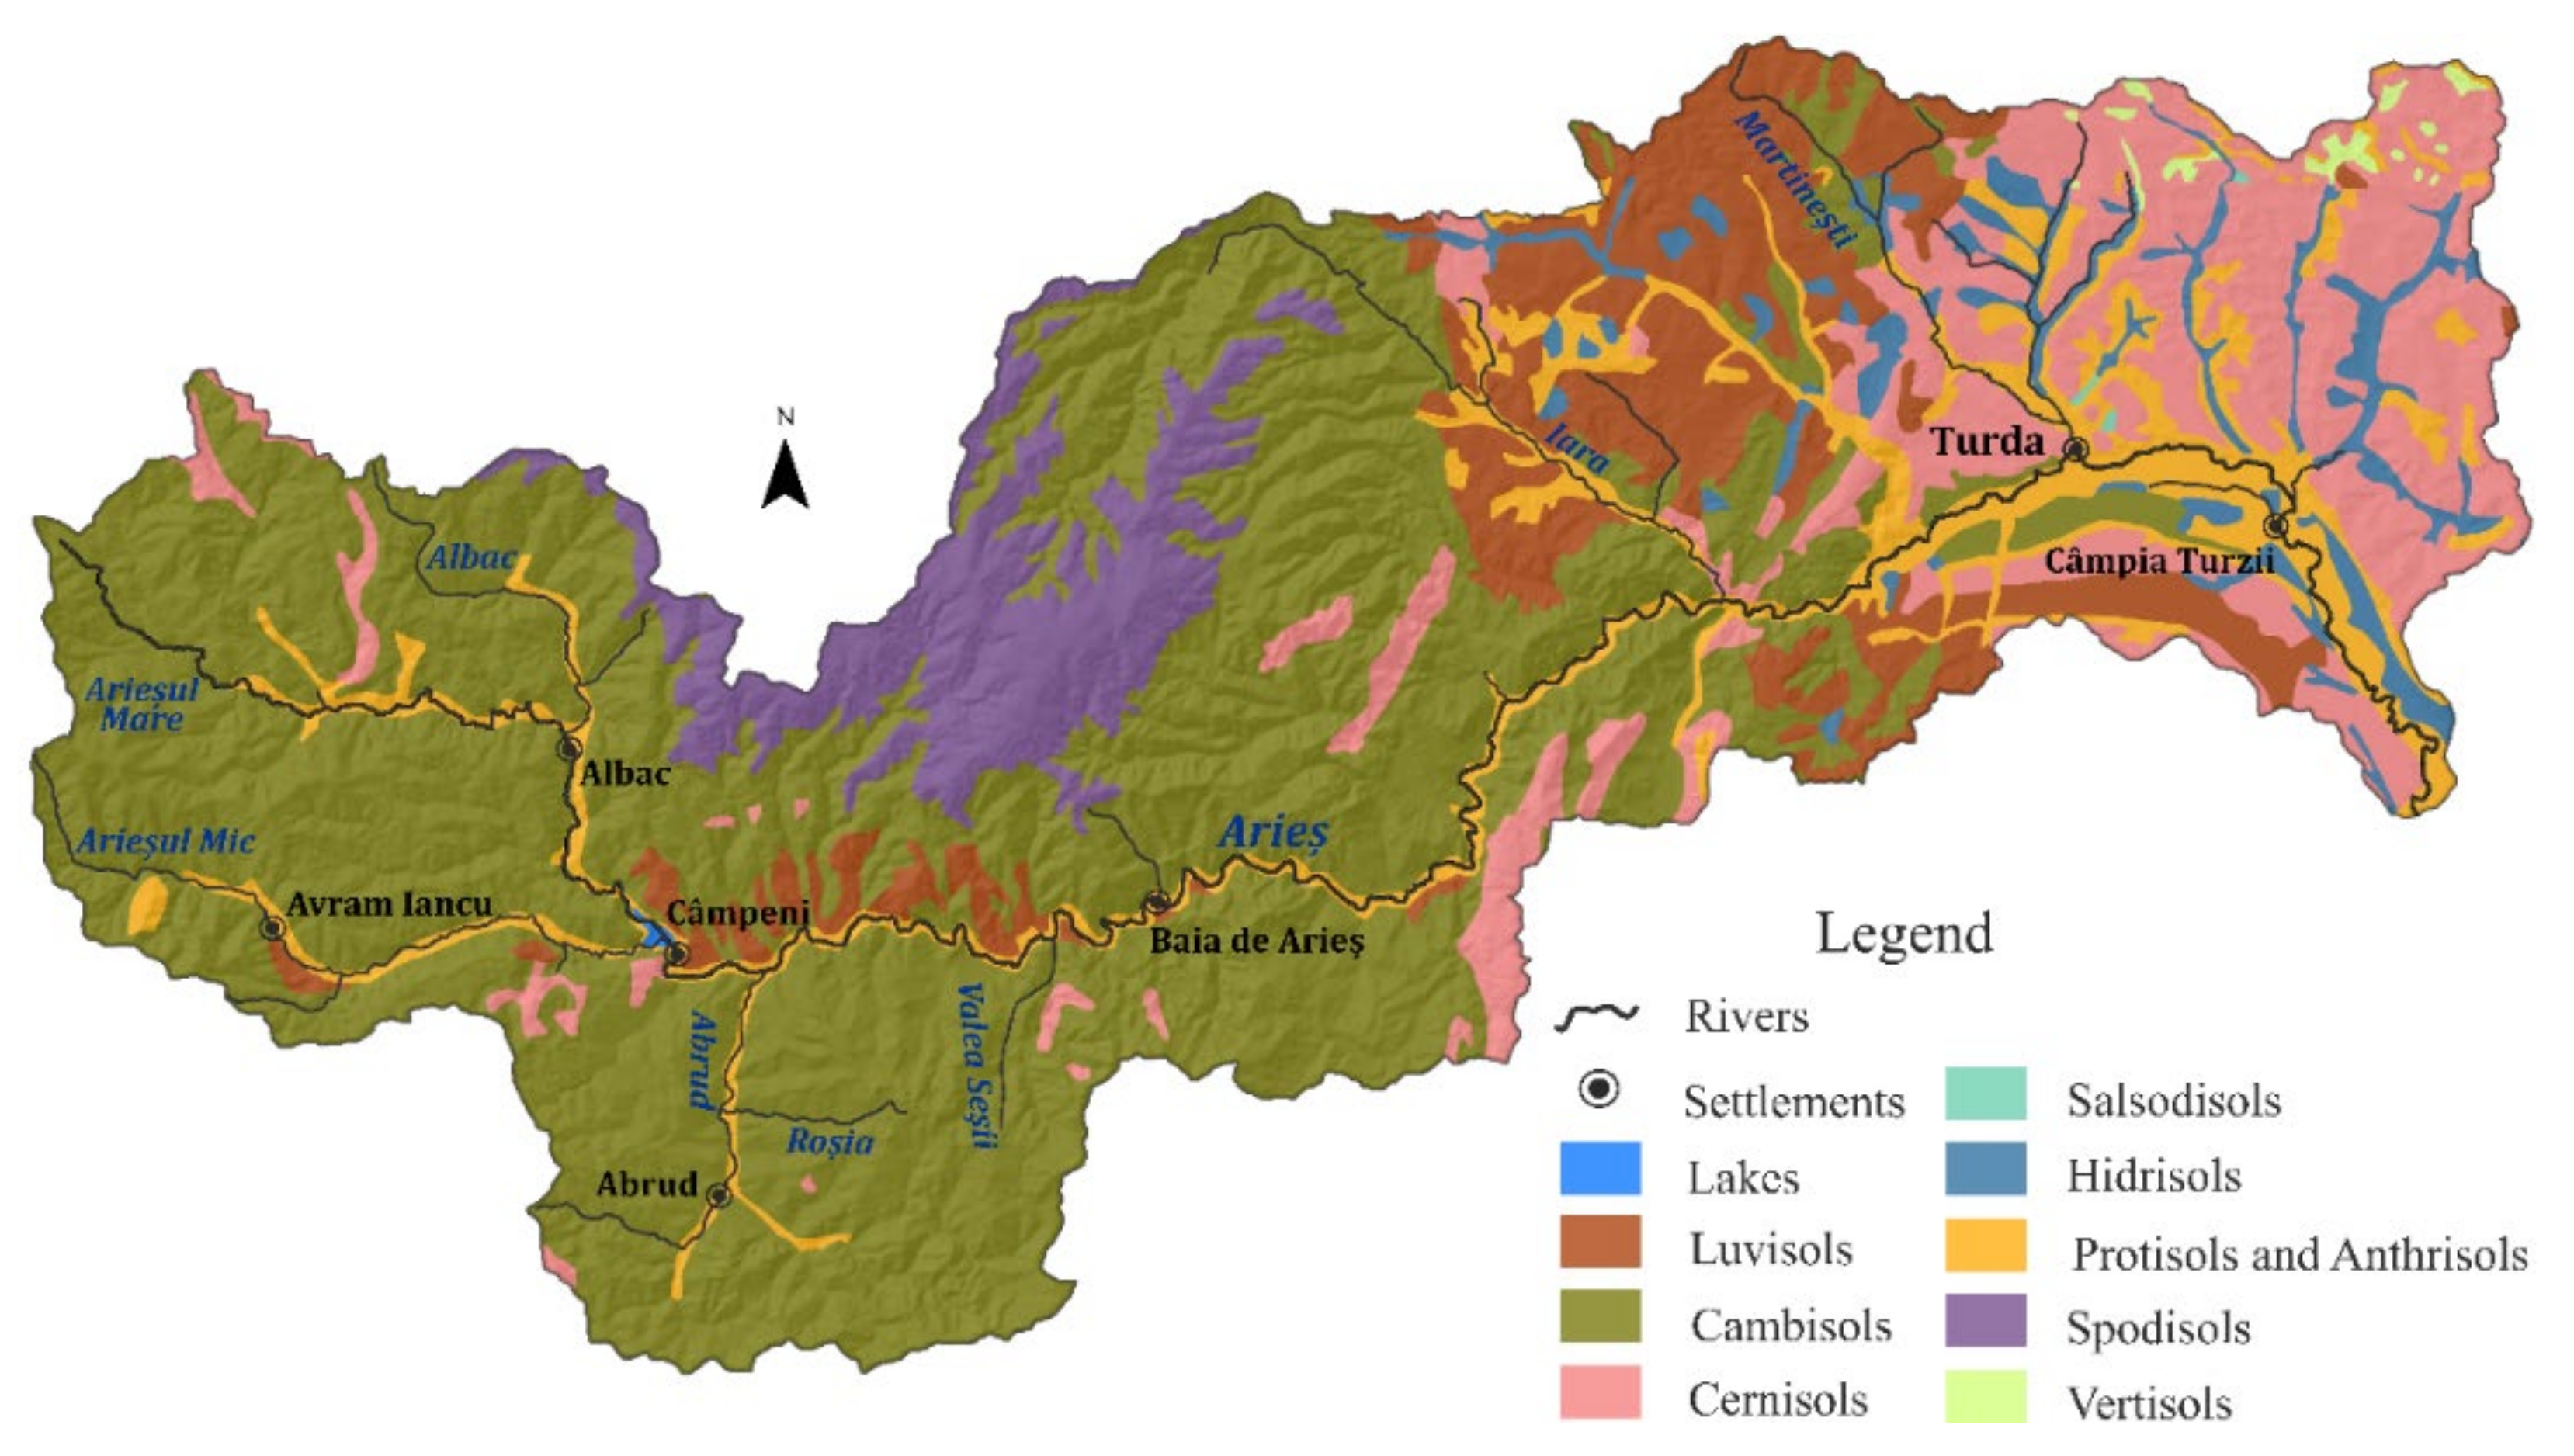
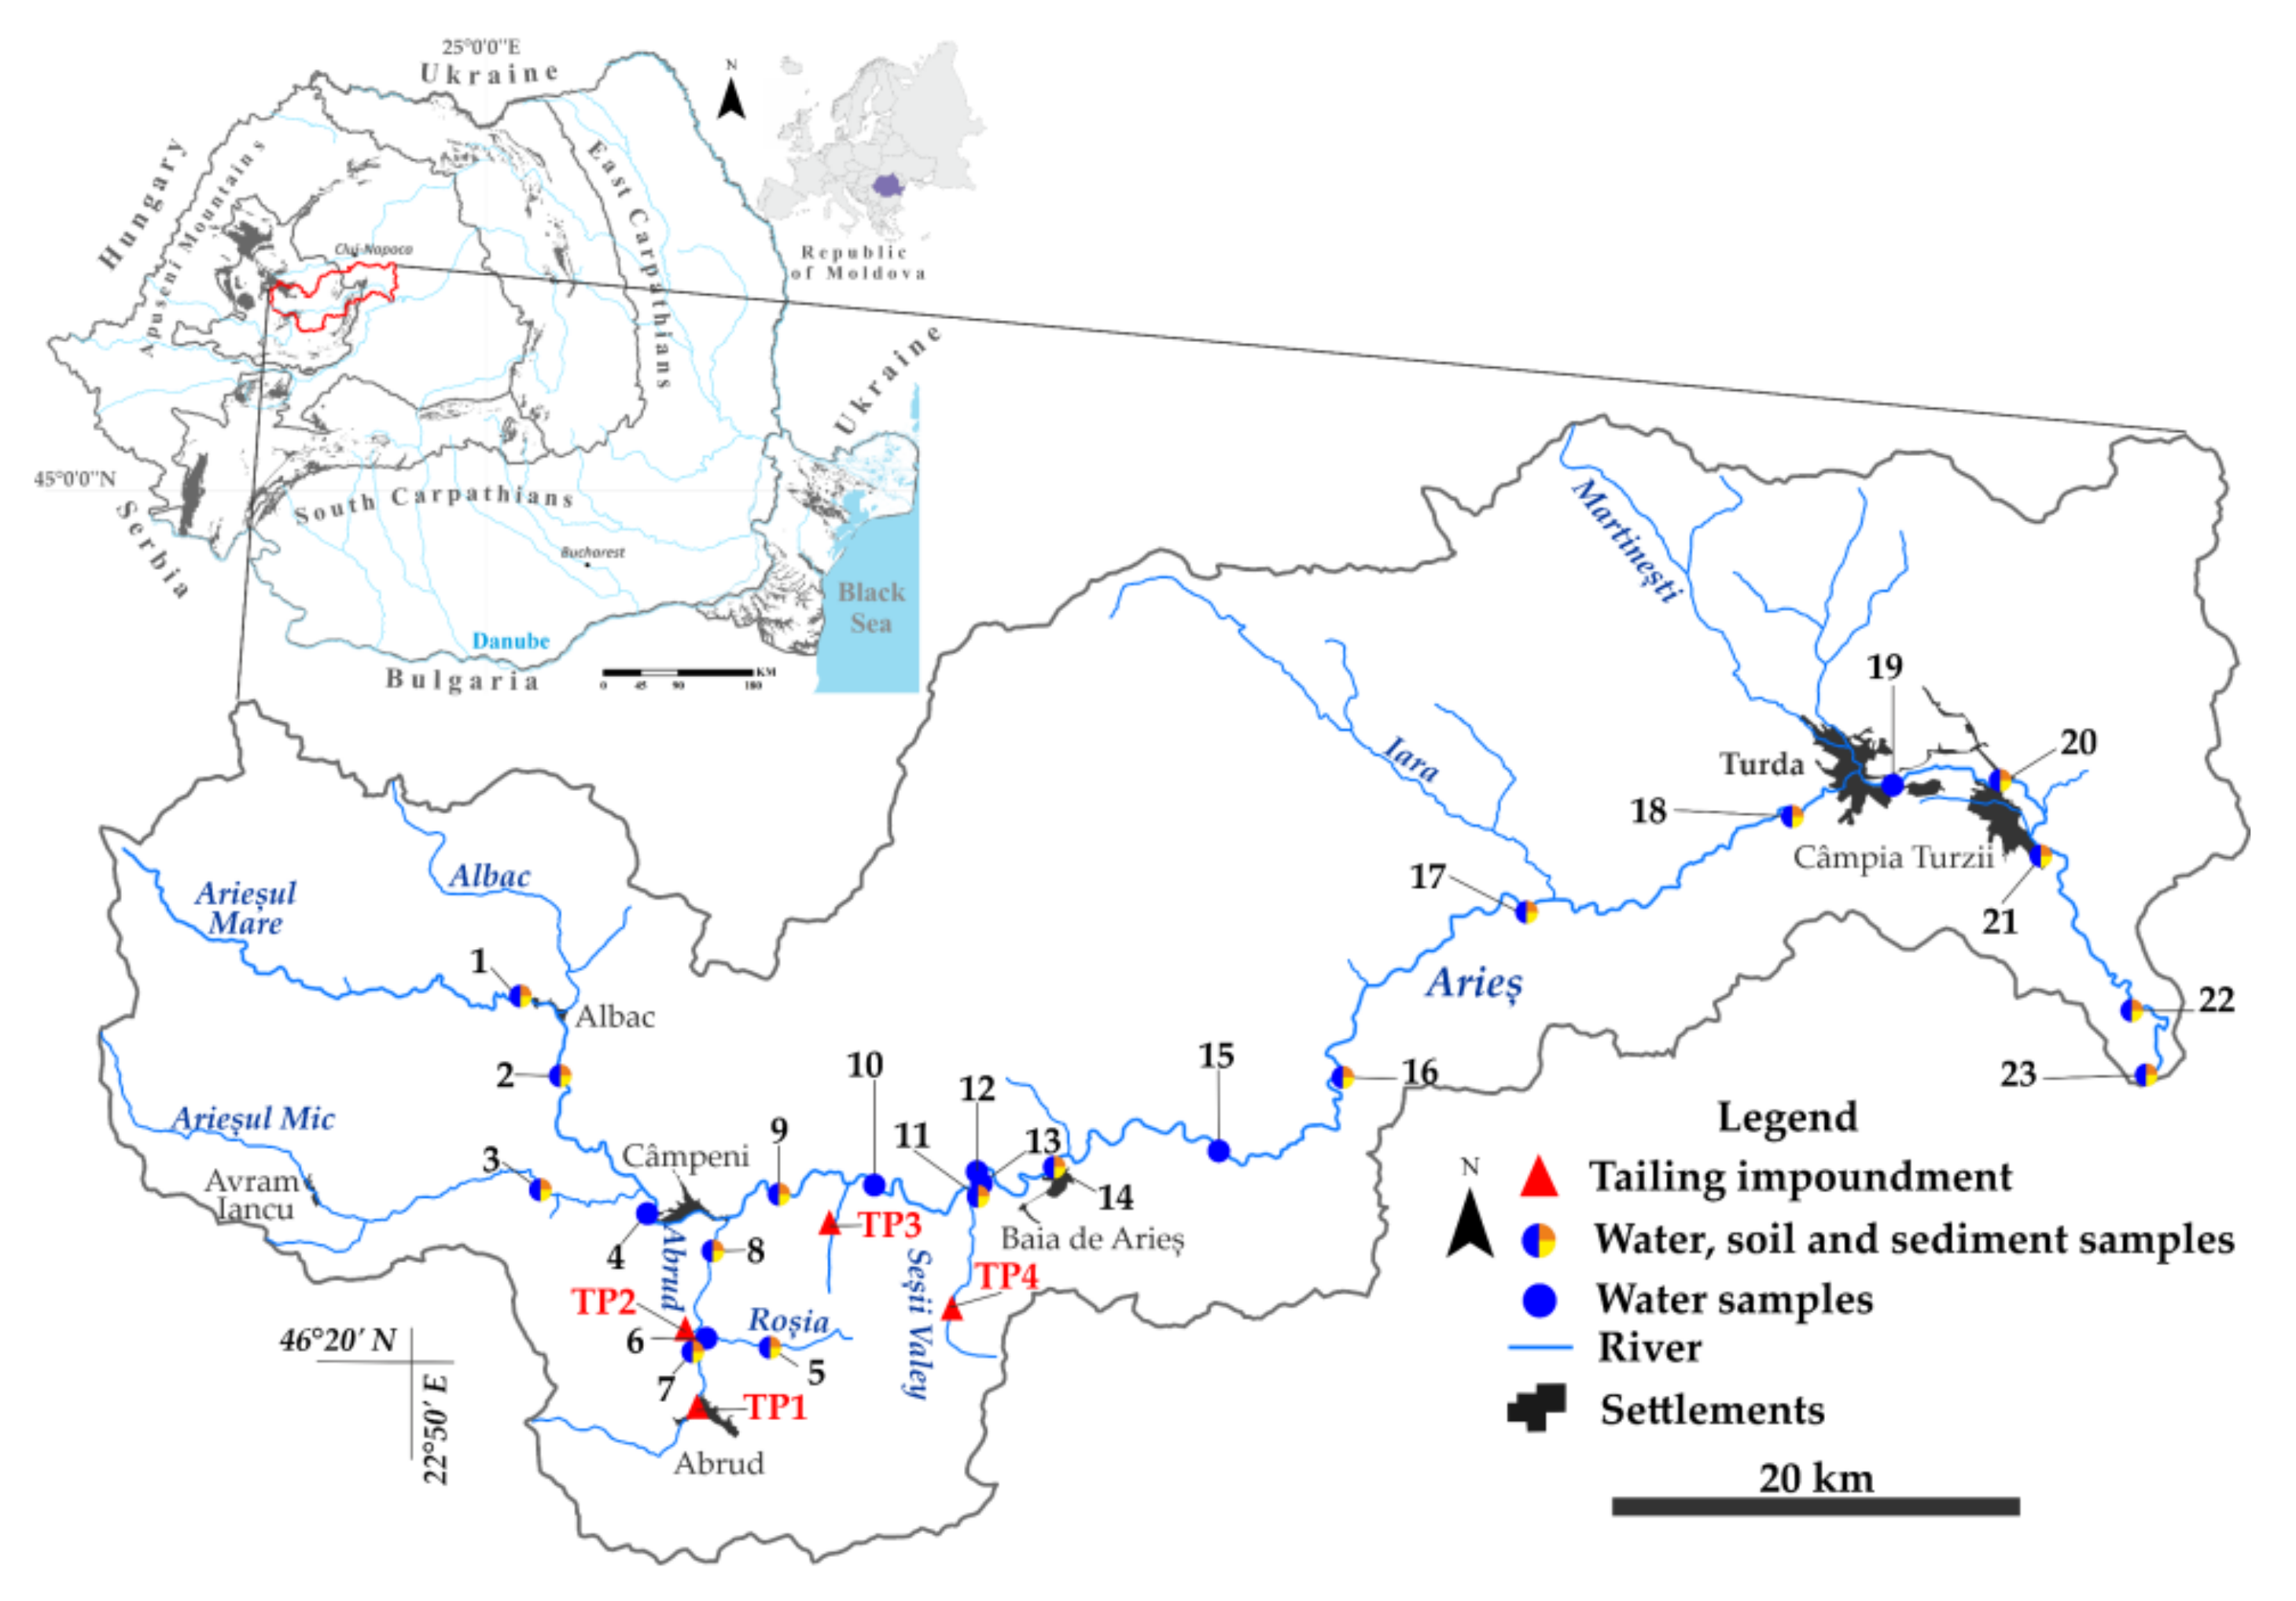
2.1. Study Area

The Arieș River, located in Transylvania, central Romania, is about 168 km long and drains an area of approximatively 3000 km2, being the result of the confluence between the Arieșul Mare and Arieșul Mic rivers (Figure 1). The relief of the Arieș basin is a complex one, the landscape being dominated by mountains, hills, and depressions. Geologically, the Arieș River basin is characterized by a contrasting lithology, consisting of igneous, metamorphic, and sedimentary assemblages, highlighting unique morphological features from North to East [20].
The climate in the region is moderate temperate-continental, with polar and arctic influences in the mountainous area and oceanic influences in the depression area, an annual average precipitation of 810 mm, an annual mean temperature of 8 °C, and a relative humidity of 75–80%. Based on the wide surface of the Arieș basin, it can be stated that the soil classes in the studied area do not present a great variation, the predominant soil class being cambisols, followed by argisols and mollisols (Figure 1).
Within the Arieş River basin, in Romania, mining operations of extraction and processing of manganese (Mn), copper (Cu), lead (Pb), zinc (Zn), cadmium (Cd), magnesium (Mg), silver (Ag), and gold (Au) ores date from the Neolithic age, having continuous negative environmental effects, such as spring capture, pollution of the aquifer by running waters, and leaching or discharge of mining waste [25]. The water quality of the Arieş catchment area is also influenced by other human activities with additive, although less polluting, impacts: urban wastewater, hydro-technical works, and waste deposits [26]. The mixed sources of pollution affect the aquatic communities and implicitly the ecosystem functions, causing chronic pollution [25,27]. Moreover, the extensive lithology in these areas implies complex geochemical processes related to the intensive oxidation of the sulphides and high amounts of pyrite oxidation, resulting in highly acidic waters. The only areas where this process is attenuated are where the host rock is represented by limestones. The geochemical process related to this type of geological context, apart from the chemicals used in the process of mining, is controlled directly by the mineralogical properties of the extracted mineral [20]. Roșia Poieni mine is mostly known for the Cu deposits and Roșia Montană mine for its Au and Ag contents (Table 1); thus, the tailings and deposits from Ștefanca Valley, Șesei Valley, Covina Valley, Lalishei Valley, and Roșia Rivulet are correlated as direct potential sources of solute and sediment-associated metal contaminants [27]. Therefore, the Arieș River catchment area presents a higher vulnerability, and several studies have analyzed the watershed status in order to identify decontamination techniques and to develop environmental strategies [22,23]. A previous study analyzing surface waters next to the tailing impoundments and connected to Roșia Montană and Roșia Poieni mining areas identified a low spatial variation for some metals, such as Cd, Mn, Ni and As, but also a high one for Fe, Cr, Co, Zn, Sr, Ba, and Al, indicating a major impact on the chemical composition of the Arieș River catchment over time, without major improvements of water quality, even after ceasing mining activity [23]. The potential for water diffusing pollution from quarries, mines, blank depositions, and decantation ponds in the Arieș River basin was investigated using GIS simulations. The Șesei Valley, Roșia Rivulet, Buciumanilor Valley sub-basins, and the Abrud River basin were identified as the zones with the highest exposure to pollution with metals [28].
At the present moment, with a surface of 15.7 km2 and a storage of about 100 million m3 of tailings [23], only 2 tailing impoundments out of 11 are still in use for storing waste from the processing of the porphyry copper deposit mined in open pit: Ștefanca and Șesei (Figure 2).
The optimal positioning of the lower basin led to the development of two large industrial centers: Turda and Câmpia Turzii. In Turda, the industry has a long history, dating back to the Roman period, through the exploitation of salt ores. Later, many other industries developed here, such as the chemical industry, the building materials industry, and the metallurgical industry. Over time, most of the industries stopped functioning, but the variety of anthropogenic activities generated many changes in the quality of the environment in the studied area [23].
The presence of abandoned mining waste and industrial facilities in the Arieș basin, combined with a relatively humid climate, facilitates the movement of pollutants through water transport and soil migration, which could expose the population to risks from potential ingestion or inhalation.

2.2. Sampling and Analytical Methods

The fieldwork was conducted on 18 July 2019, at sampling sites located at the mainstream of the Arieș River and its tributaries, and no rainfall events were noticed in the study area. For a spatial analysis, a total of 23 locations for surface-water sampling and 16 locations for soil and surface-sediments sampling were selected (Figure 2). Surface-water samples were collected in 1000 mL polyethylene bottles repeatedly washed with water from each of the sampling sites. For the soil samples, a composite sample was obtained by mixing multiple subsamples collected from an area of 50 m2 in the study location with a stainless-steel shovel (about 10–30 cm). The surface-sediment samples were collected with a clamshell mud picker from the sediment top layer (about 0–20 cm). The solid samples were kept in plastic Ziploc bags, stored in a refrigerator at 4 °C, and analyzed as early as possible. Soil and sediment samples were air-dried, powdered by an agate mortar, passed through a 2 mm sieve, and subjected to chemical analyses.
Samples were digested using a Speedwave XPERT (Berghof, Eningen, Germany) microwave digestion system with HNO3 65% in the case of water samples and aqua regia (HNO3 65%:HCl 37% (v/v) = 1:3) in the case of solid (soil and sediment) samples [29]. Fe, Na, Mg, K, and Ca were determined using a 5300 Optima DV (PerkinElmer, MA, USA) Inductively Coupled Plasma Optical Emission Spectrometer (ICP-OES), while Ni, Cr, Cu, Zn, Cd, Pb, Mn, Al, and As were determined with an ELAN DRC II Inductively Coupled Mass Spectrometer (PerkinElmer, MA, USA). The Hg concentrations in water samples and acid-digested samples of soil and sediments were measured using a Hydra-AF Mercury Analyzer (Teledyne Leeman Labs, Hudson, NY, USA) by cold-vapor atomic fluorescence spectrometry (CV-AFS), under the working conditions previously presented [30].
Quality control techniques, such as the use of standard operating procedures, calibration with standards, analysis of reagent blanks, recovery of spiked samples, and analysis of replicates, were used to ensure the analytical data quality. Certified multielement ICP Standard 3 (with a concentration of 1 µg/mL of Fe, Na, Mg, K, Ca, Ni, Cr, Cu, Zn, Cd, Pb, Mn, Al, and As—PerkinElmer Pure Plus) and Mercury Pure Standard (1 µg/mL Hg —PerkinElmer Pure Plus) were used to prepare the calibration standards. The calibration was linear, with a correlation coefficient (R2) above 0.9996. The accuracy of the metal determinations was tested using the 1643f NIST certified reference material (National Institute of Standards and Technology, Gaithersburg, MD, USA) in the case of Fe, Na, Mg, K, Ca, Ni, Cr, Cu, Zn, Cd, Pb, Mn, Al, and As and QC1132 Trace Metals 1-WP (Sigma Aldrich; St. Louis, MO, USA) for Hg, with meant recoveries ranging between 94% and 105%. The relative standard deviations (RSD) for 5 replicate injections of samples were below 3%.
All of the reagents were of analytical grade and did not require any additional purification. All the dilutions were made with ultrapure deionized water from a water-purification system (Elga Veolia, High Wycombe, UK).
All the analyses were performed in the Environmental Analysis Laboratory within INCDO-INOE 2000, Research Institute for Analytical Instrumentation Subsidiary.

2.3. Evaluation of Heavy-Metal Pollution

2.3.1. Assessment of Metal Water Pollution

The Heavy-Metal Pollution Index (HPI) and the Heavy-Metal Evaluation Index (HEI) were used to assess the combined impact of different metals on the overall quality of surface water. In the present study, seven metals (Fe, Ni, Cu, Zn, Cd, Pb, and Mn) were assessed for the calculation of HPI and HEI.
HPI is an effective tool for determining the quality of water based on heavy-metal concentrations. HPI is described as a rating that reflects the combined impact of various heavy metals on water quality, and it is computed in two steps, according to Equations (1) and (2) [31]. The critical HPI value is 100, and the HPI values above 100 are reported to cause greater damage to health [32,33].
H P I = i = 1 n ( Q i W i ) i = 1 n W i
Q i = M i S i × 100
where Qi is the sub-index of the ith parameter, Wi is the unit weightage of the ith parameter (mg/L), and n is the number of the considered chemical parameters. Mi and Si are the concentrations of the monitored ith parameter and the standard maximum allowable values (mg/L), respectively, according to the Romanian Regulation and to the European Directive concerning water quality [34,35], where the weightage unit (Wi) is inversely proportional to the maximum concentration allowed [34,35].
W i = 1 S i
HEI, as HPI, provides the overall trend in water quality in terms of heavy-metal and metalloid contamination [36]. HEI was calculated by Equation (4):
H E I = i = 1 n H c H m a c
where Hc is the monitored value of the ith parameter (mg/L) and Hmac the maximum admissible concentration of the ith parameter [37,38]. The HEI classifies the water as low (HEI < 10), medium (10 < HEI < 20), and highly polluted (HEI > 20) [39].

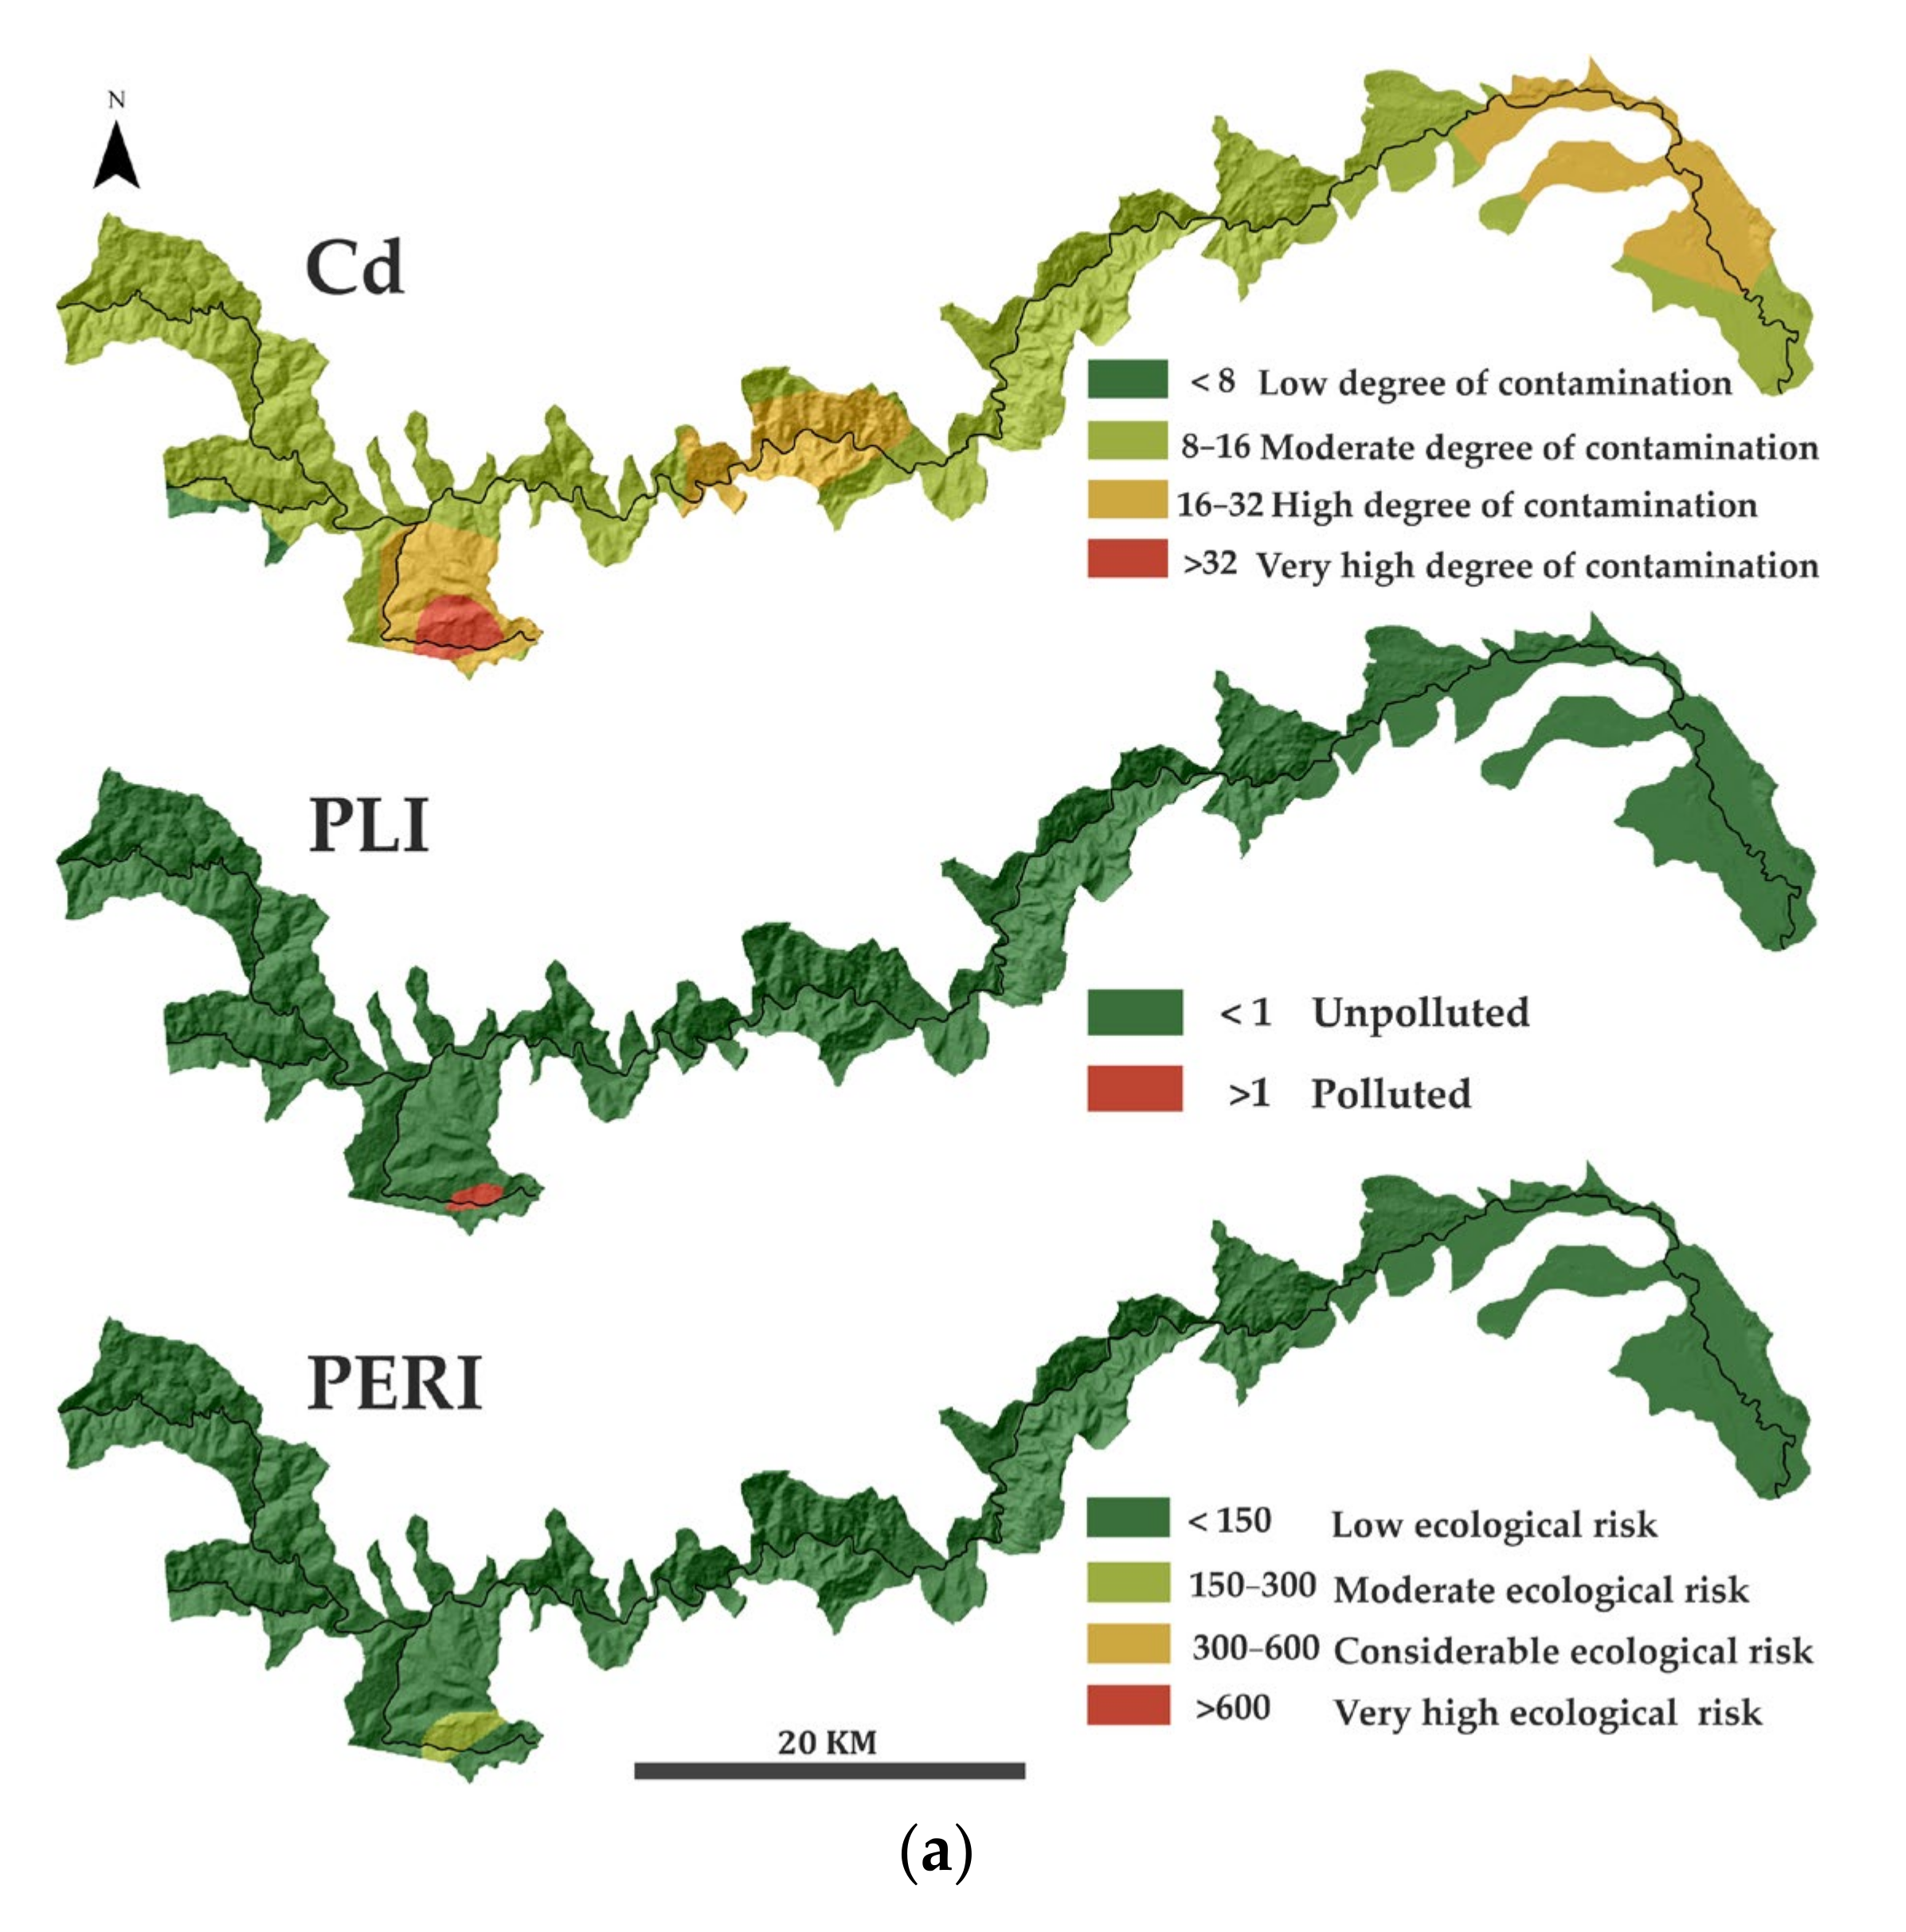
2.3.2. Contamination and Ecological Risk Assessment of Soil and Sediment

Several indicators were computed to measure the metal contamination levels in soil and sediment, as well as their environmental and ecological impacts. The Contamination factor (Cf), the Contamination degree (Cd), and the Pollution Load Index (PLI) were used to evaluate specific heavy metals and the overall pollution level, respectively [40]. Cf, Cd, and PLI can be determined with Equations (5)–(7), respectively:
C f = i = 1 n C i B i 1
C d = i = 1 n C f
P L I = C f 1 C f 2 C f 3 . C f n n
where Ci is the concentration of metal ith (mg/kg) and Bi is the background value of metal ith (mg/kg) proposed by Taylor and McLennan [41] and Hakanson [42].
Based on the Cf computed value, the pollution status of certain metals could be divided into four categories: Cf ≤ 1, 1 < Cf ≤ 3, 3 < Cf ≤ 5, and Cf > 5, indicating noncontaminated conditions and low, moderate, and high contamination levels, respectively [43]. Furthermore, the pollution status of metals, based on the Cd values, could be divided into four categories, namely, Cd < 8, 8 ≤ Cd < 16, 16 ≤ Cd < 32, and Cd > 32, indicating low, moderate, considerable, and very high risk of metal contamination [44]. PLI values could also divide the level of contamination into four classes, PLI ≤ 1, 1 < PLI ≤ 3, 3 < PLI ≤ 6, and PLI > 6, indicating low, moderate, significant, and very high contamination levels, respectively [45].
The Ecological risks (Er) and the Potential Ecological Risks Index (PERI) were calculated according to Hakanson [42], in order to evaluate the ecological risk of the investigated metals, using Equation (8):
P E R I = i = 1 n E r i = i = 1 n C f i T r i
where Tri is the hazardous response factor of a certain metal, which represents the metal’s hazardous levels and the biological system’s sensitivity level. The toxic-response factors of Ni, Cr, Cu, Zn, Cd, Pb, Mn, As, and Hg are 5, 2, 5, 1, 30, 5, 1, 10, and 40, respectively [46]. The PERI integrates the concentration of metals with their own toxicity to determine soil and sediment pollution [47,48], and the assessment and grading standards are showed in Table S6.

2.4. Statistical and Visual Analysis

Multivariate analyses of the data sets were performed using heat map and Principal Component Analysis (PCA) featured apps in Origin (Pro) software, version 2020b, from OriginLab Corporation. All datasets were tested for normality by the Shapiro–Wilk test, using Origin (Pro) software. The mentioned statistical analyses were performed on the data sets in order to classify observations, to identify and interpret complex causal relationships between features, and to show patterns in the inherent properties of the individual components in the study area.
The spatial patterns of pollution indices in surface-water, soil and sediment samples were generated using the Inverse Distance Weighted, Ordinary Kriging, and Empirical Bayesian Kriging (EBK) methods in ArcGIS 10.4. The most appropriate method to generate the interpolations according to the number, distribution, and context of the collected samples for each category (water, soil, and sediment) was EBK [23].

3. Results and Discussion

3.1. Surface-Water Samples

The metal concentrations in water samples are presented in Figure 3 and Table S2. Comparing the metal concentrations among water samples with respect to their highest and lowest concentrations, Cr, Cd, As, and Hg were found in a non-significant or a non-detectable level in the studied surface-water samples (Table 2). Low levels of Fe (≤0.01–0.16 mg/L), Ni (≤0.02–0.14 mg/L), Cu (≤0.02–0.21 mg/L), Zn (≤0.02–0.19 mg/L), and Pb (≤0.01–0.15 mg/L) were detected in the surface-water samples, with non-significant differences between the sampling locations, except the water sampled from A6, where the maximal load of metals was found (8.73 mg/L Fe, 0.15 mg/L Ni, 0.21 mg/L Cu, 4.22 mg/L Zn, and 0.15 mg/L Pb). Oppositely, K, Mg, K, Ca, Mn, and Al concentrations varied considerably across the studied area.
The highest spatial variation was found in the case of Ca, which ranged from 23.7 to 219 mg/L (Table S2). The highest Ca levels were obtained in the case of the A11 and A12 sampling stations, with concentrations of 219 and 173 mg/L, respectively. This could be due to the CaO used as an acid neutralization agent for the acid mine drainage, resulting from the tailing impoundment located nearby the A11 and A12 sampling stations. High Na and Mg concentrations were observed in the cases of sampling points A23, A16, A22, and A21 (only in the case of Na), while K and Mn had their highest concentration in the surface water sampled from A6 (Table S2).
The maximum Pb concentration was found in the sampling location A6, accompanied by other elements in a higher concentration, which indicates the metal pollution of this area and can be easily related to the mining activities. Furthermore, the maximal concentrations of some trace elements, such as Zn (4.22 mg/L) and Mn (22.4 mg/L), were found at sampling point A6. Moreover, in the case of some major elements, such as Fe (8.73 mg/L), Mg (18.3 mg/L), and Al (22.8 mg/L), the concentrations were higher in the surface water from sampling point A6, compared to the other locations within the study area, indicating an uptake of metals.
According to the Romanian Regulation, from a total of 23 surface-water samples, 17% were classified into the 1st quality class, 35% into the 2nd quality class, 39% into the 3rd class of quality, and 4% and 9%, into the 4th and 5th classes of quality, respectively [35].
Thus, it was demonstrated that the most polluted watercourses from the study area were the two tributaries coming from the mining areas: Roșia Rivulet (A6) and Șesii Valley (A11, A12). As Figure 3 shows, these two tributaries affect the quality of the receiving watercourse. In the case of sampling station A8, after the confluence of the Roșia Rivulet with the Abrud River, high concentrations of Fe, Pb, Mn, and Zn were noticed. Regarding the main course’s metal content, Mn and Fe were 500 and 100 times higher in A8 compared to the sampling station A4, while, in the case of sampling station A13, Mn and Al concentrations were almost 300- and 10-fold higher, respectively, compared to the sampling station A10.
Mn is a redox active metal that is widely distributed in soil and in sediment, causing geogenic contamination in groundwater [49]. In water, Mn can be mainly found under +2, +3, and +4 states, which form oxide or hydroxide, as well as carbonate and sulfide compounds, which have a low solubility in some conditions [50]. Mainly, the Mn mobility depends on the oxidation state, adsorption onto minerals, or incorporation into mineral species. It is controlled by the pH and redox conditions, by the climate (precipitation and temperature fluctuations), by water salinity, and by the organic ligands present in the source area, affecting the Mn dissolution [49]. As the pH rises, the oxidation rate increases, with acid mine drainage leading to an accelerated oxidation and accumulation of manganese oxides through Mn-rich flows into the mainstream [51]. Mn is generally less susceptible to sorption, and, if other metals are present, it can be reversible [52]. Mn can enter into water from minerals (such as psilomelane, manganite, and pyrolusite) containing divalent Mn, and it can be described as a combination of reduction and adsorption/co-precipitation processes [49].

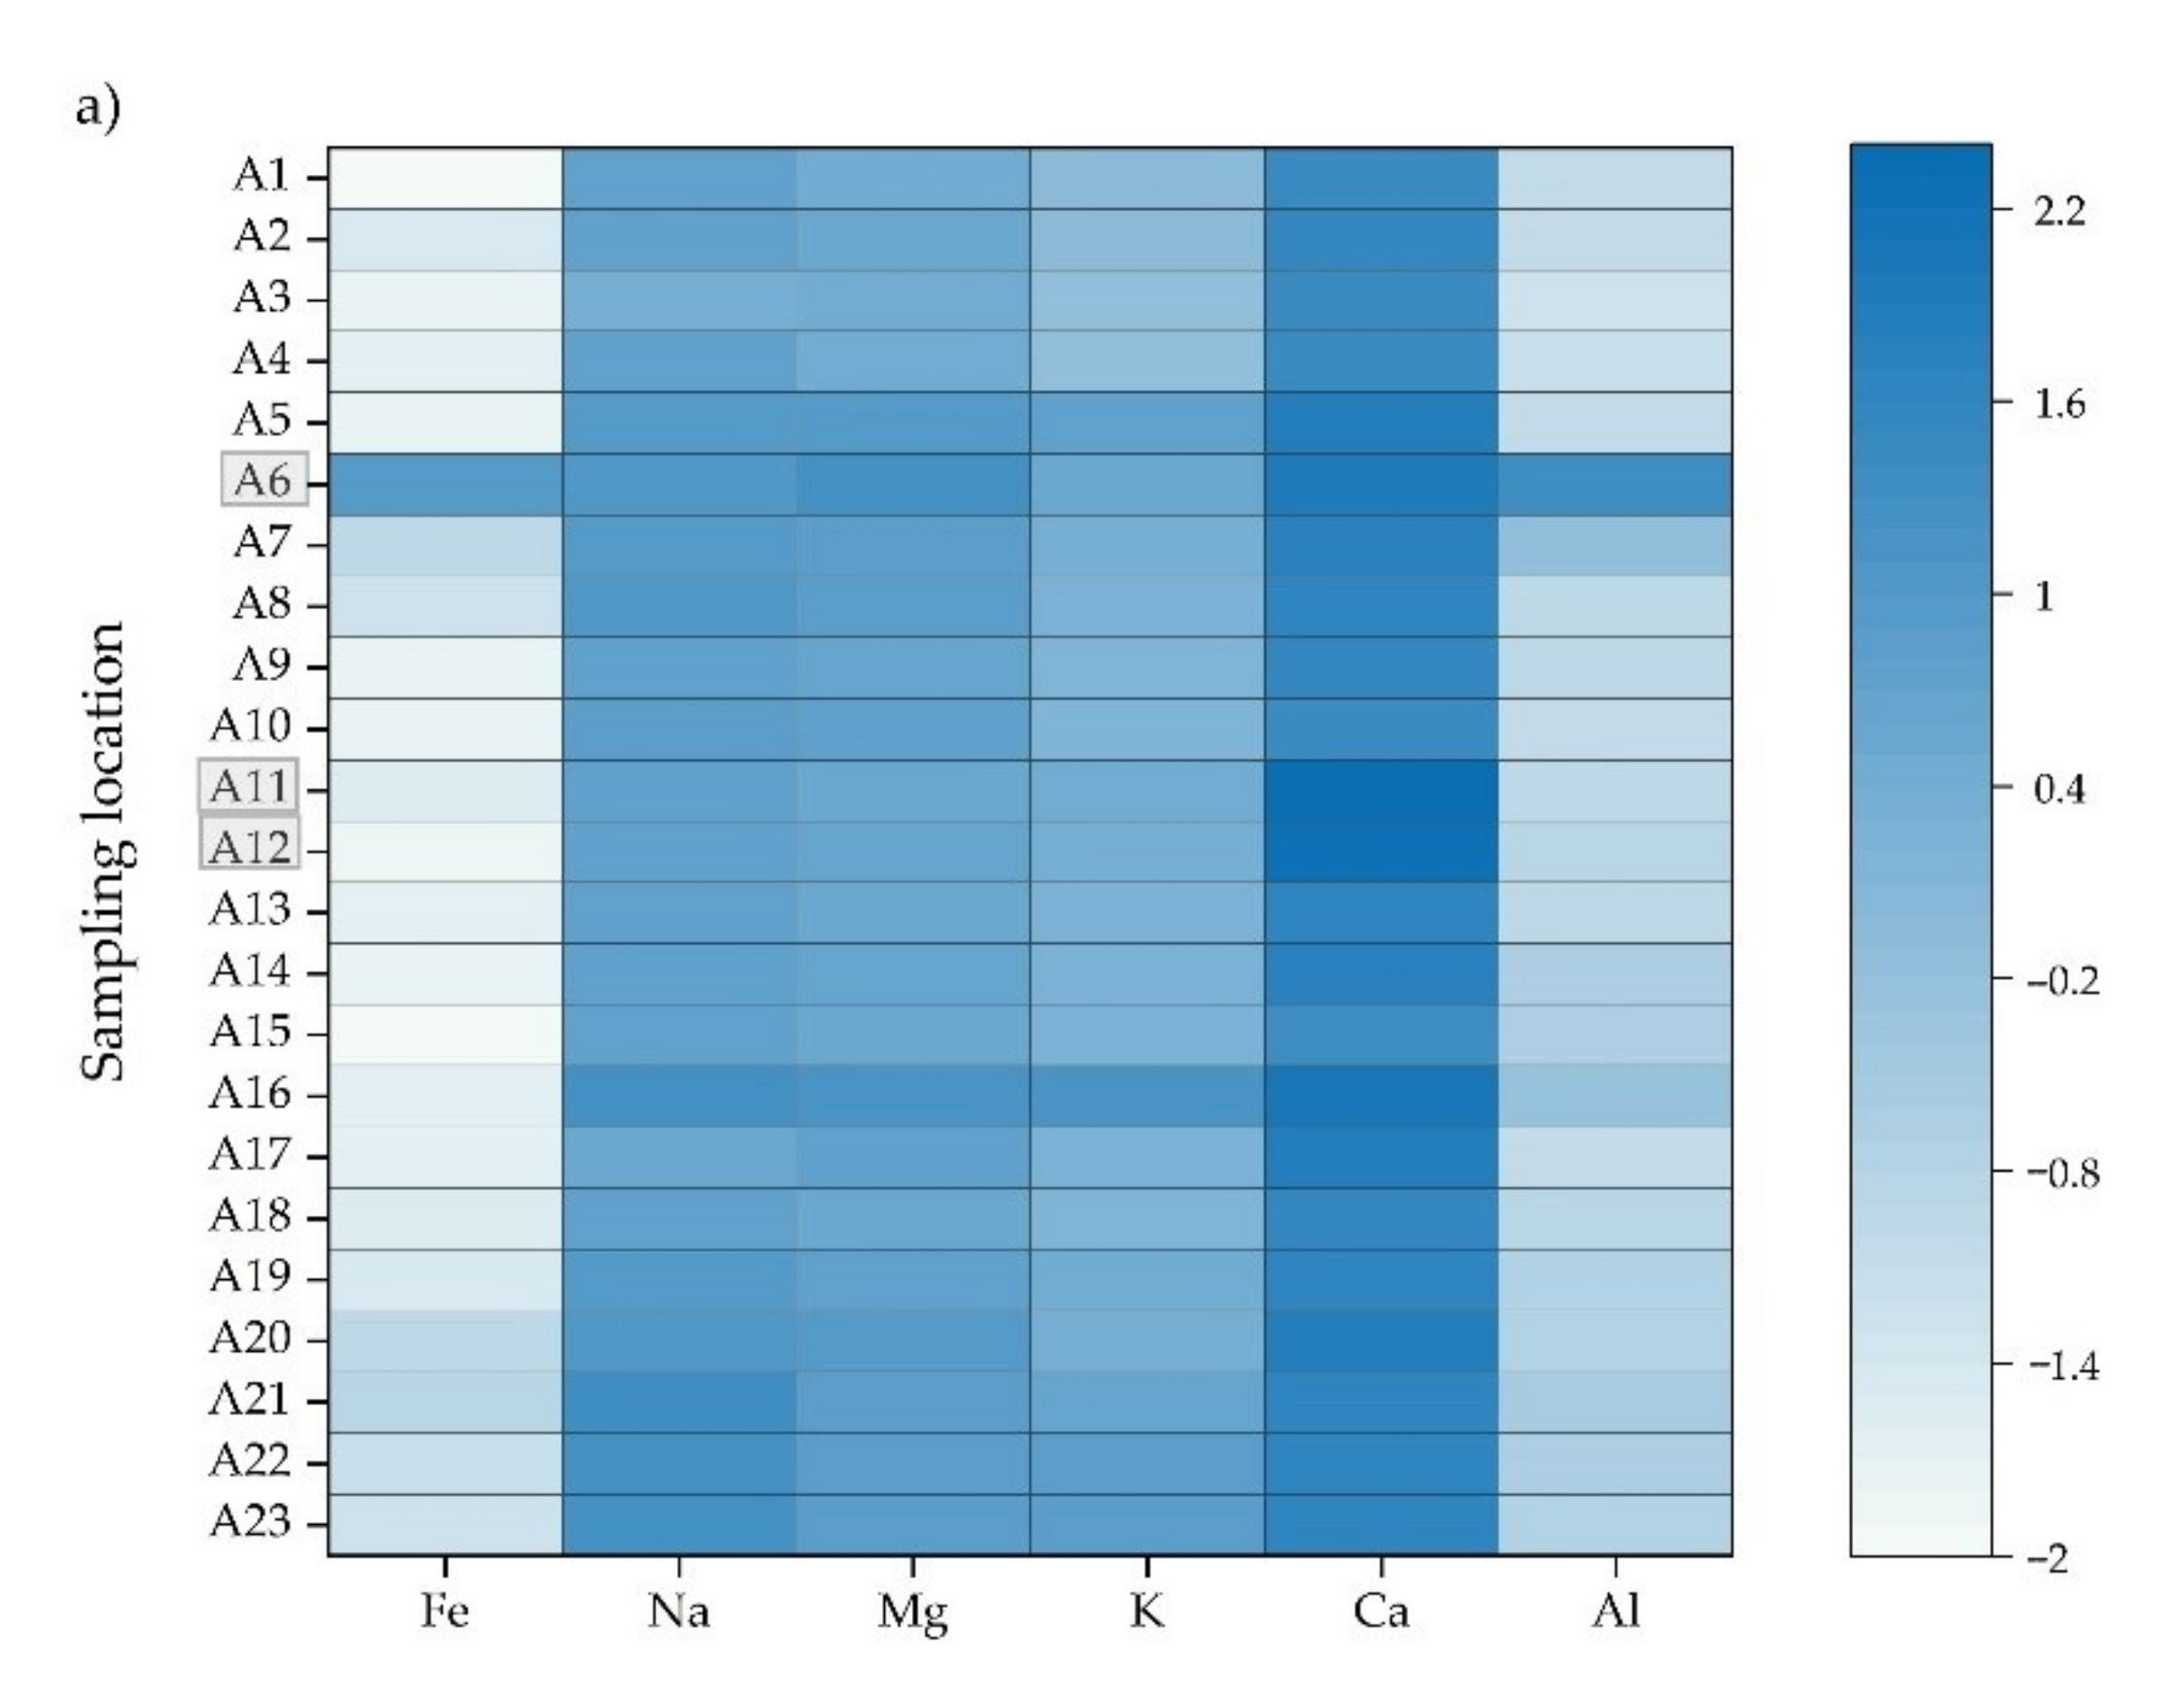
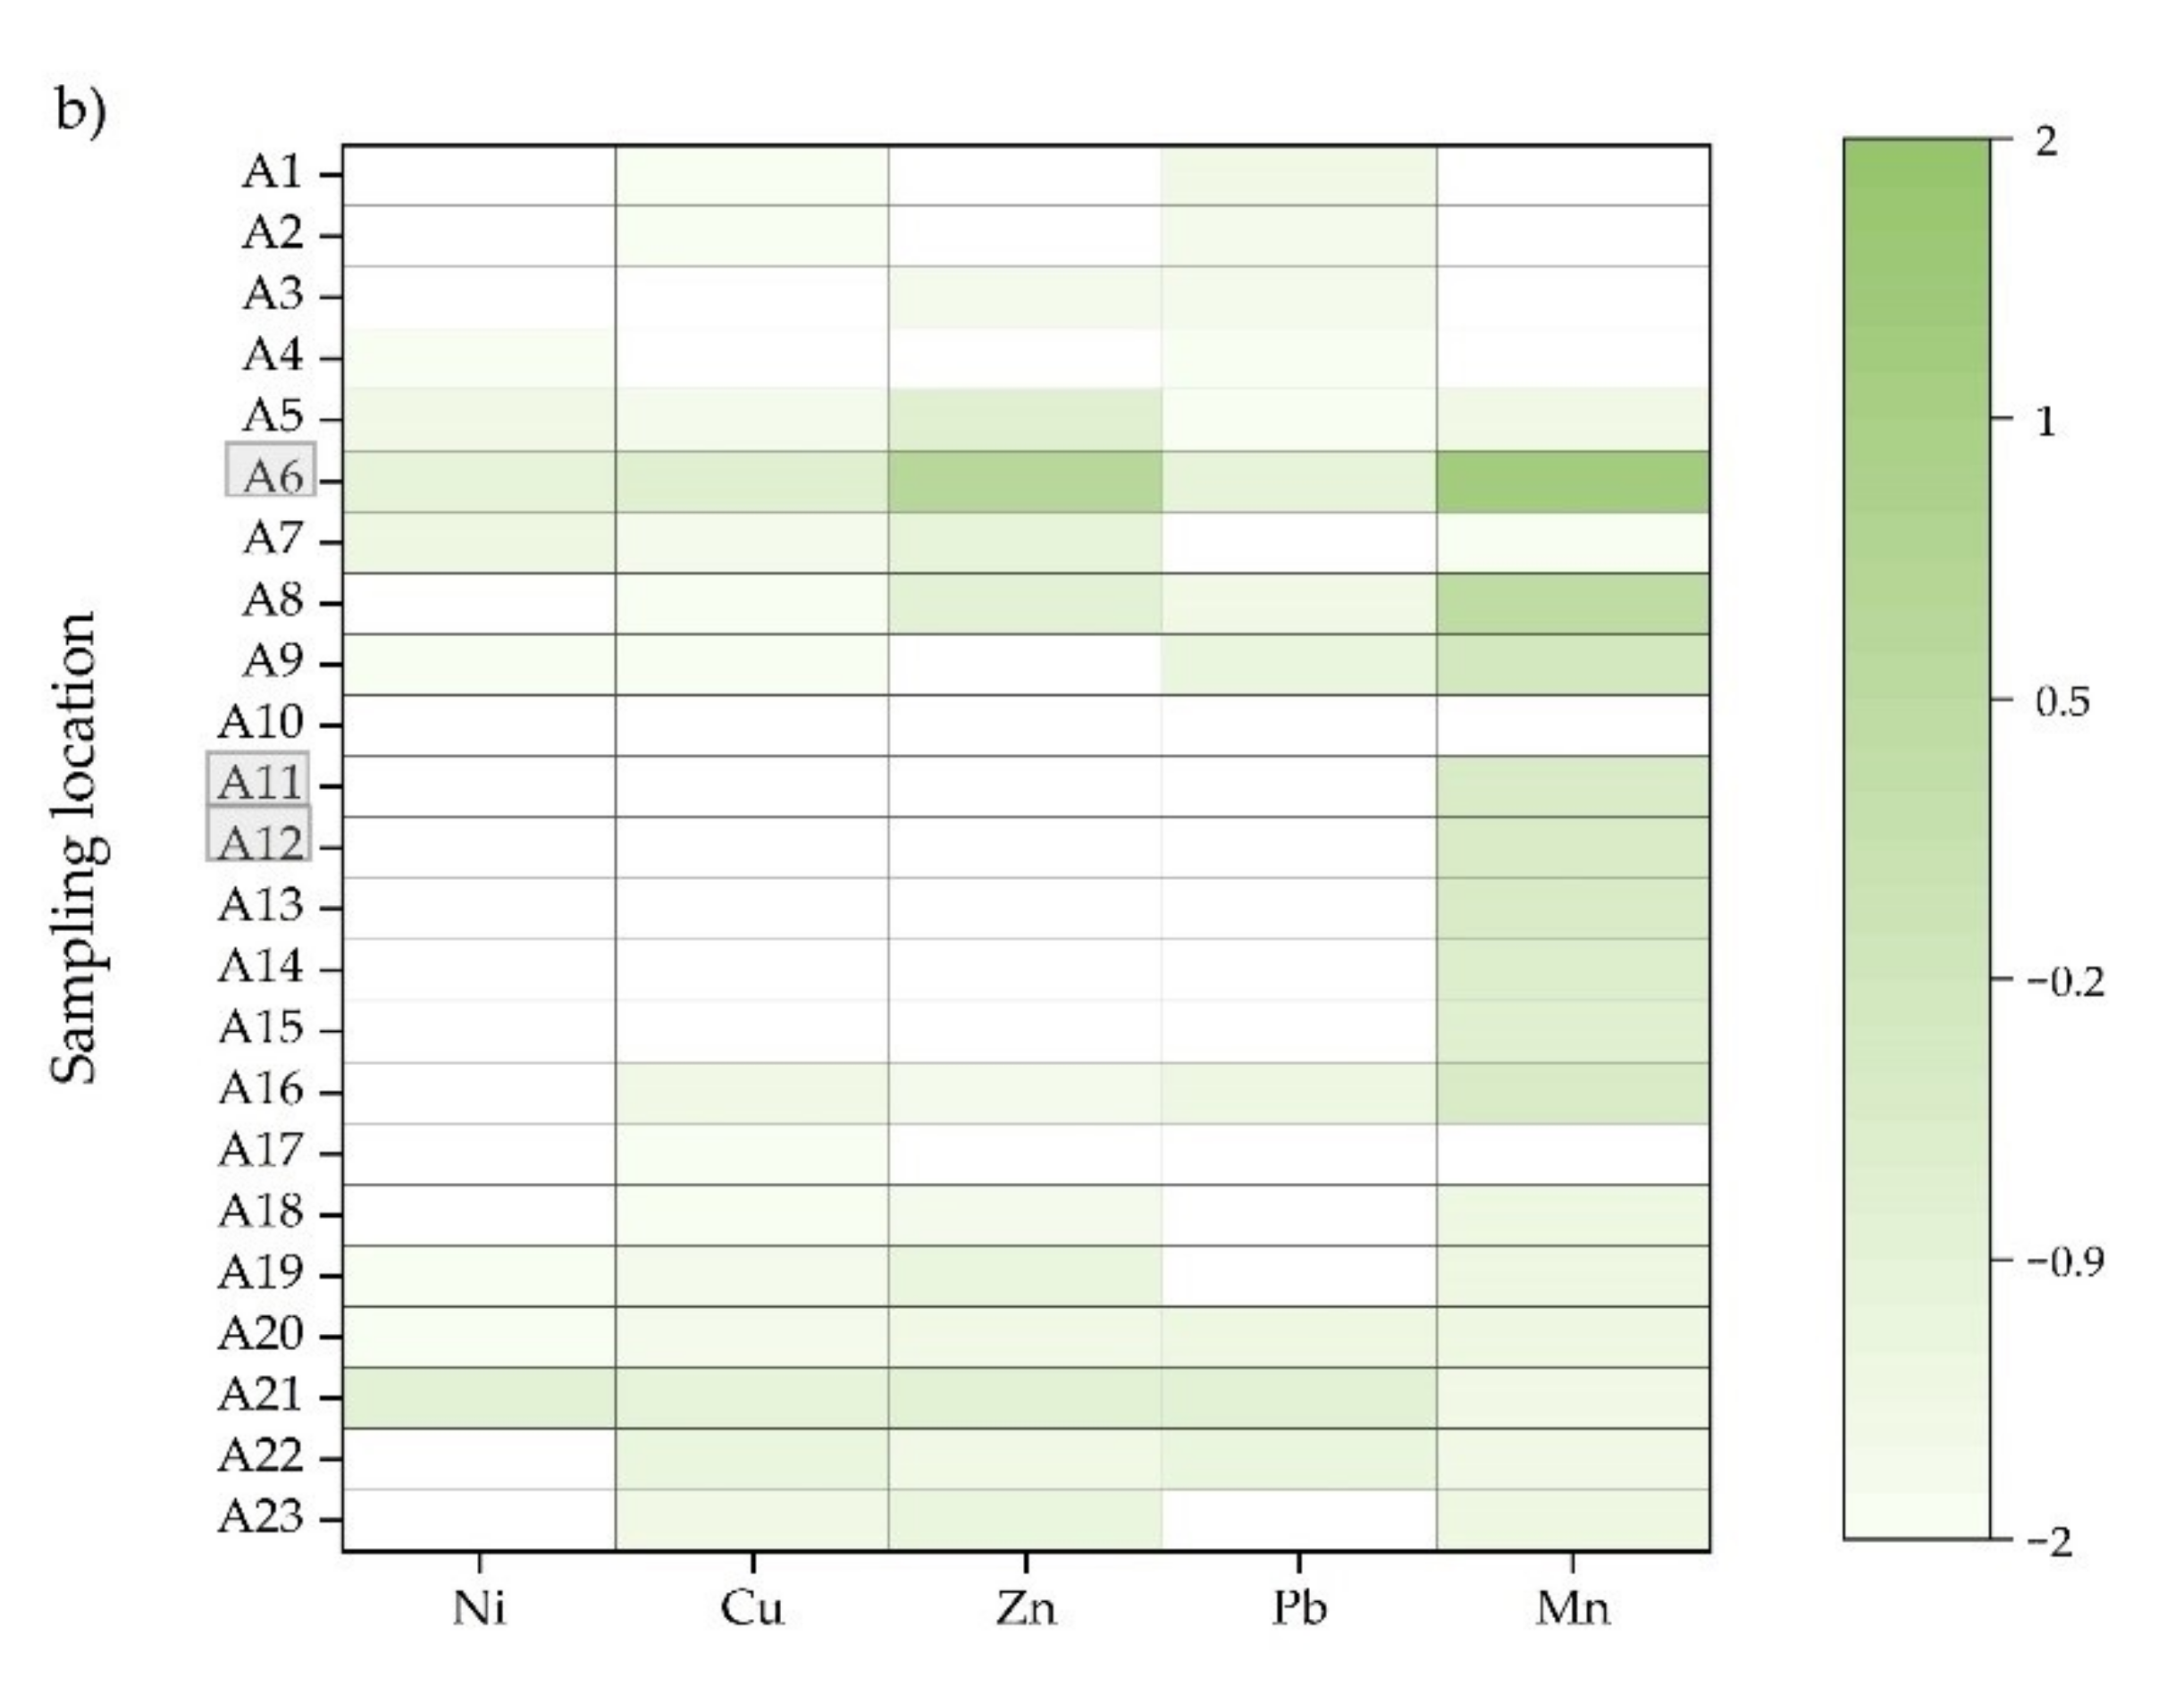
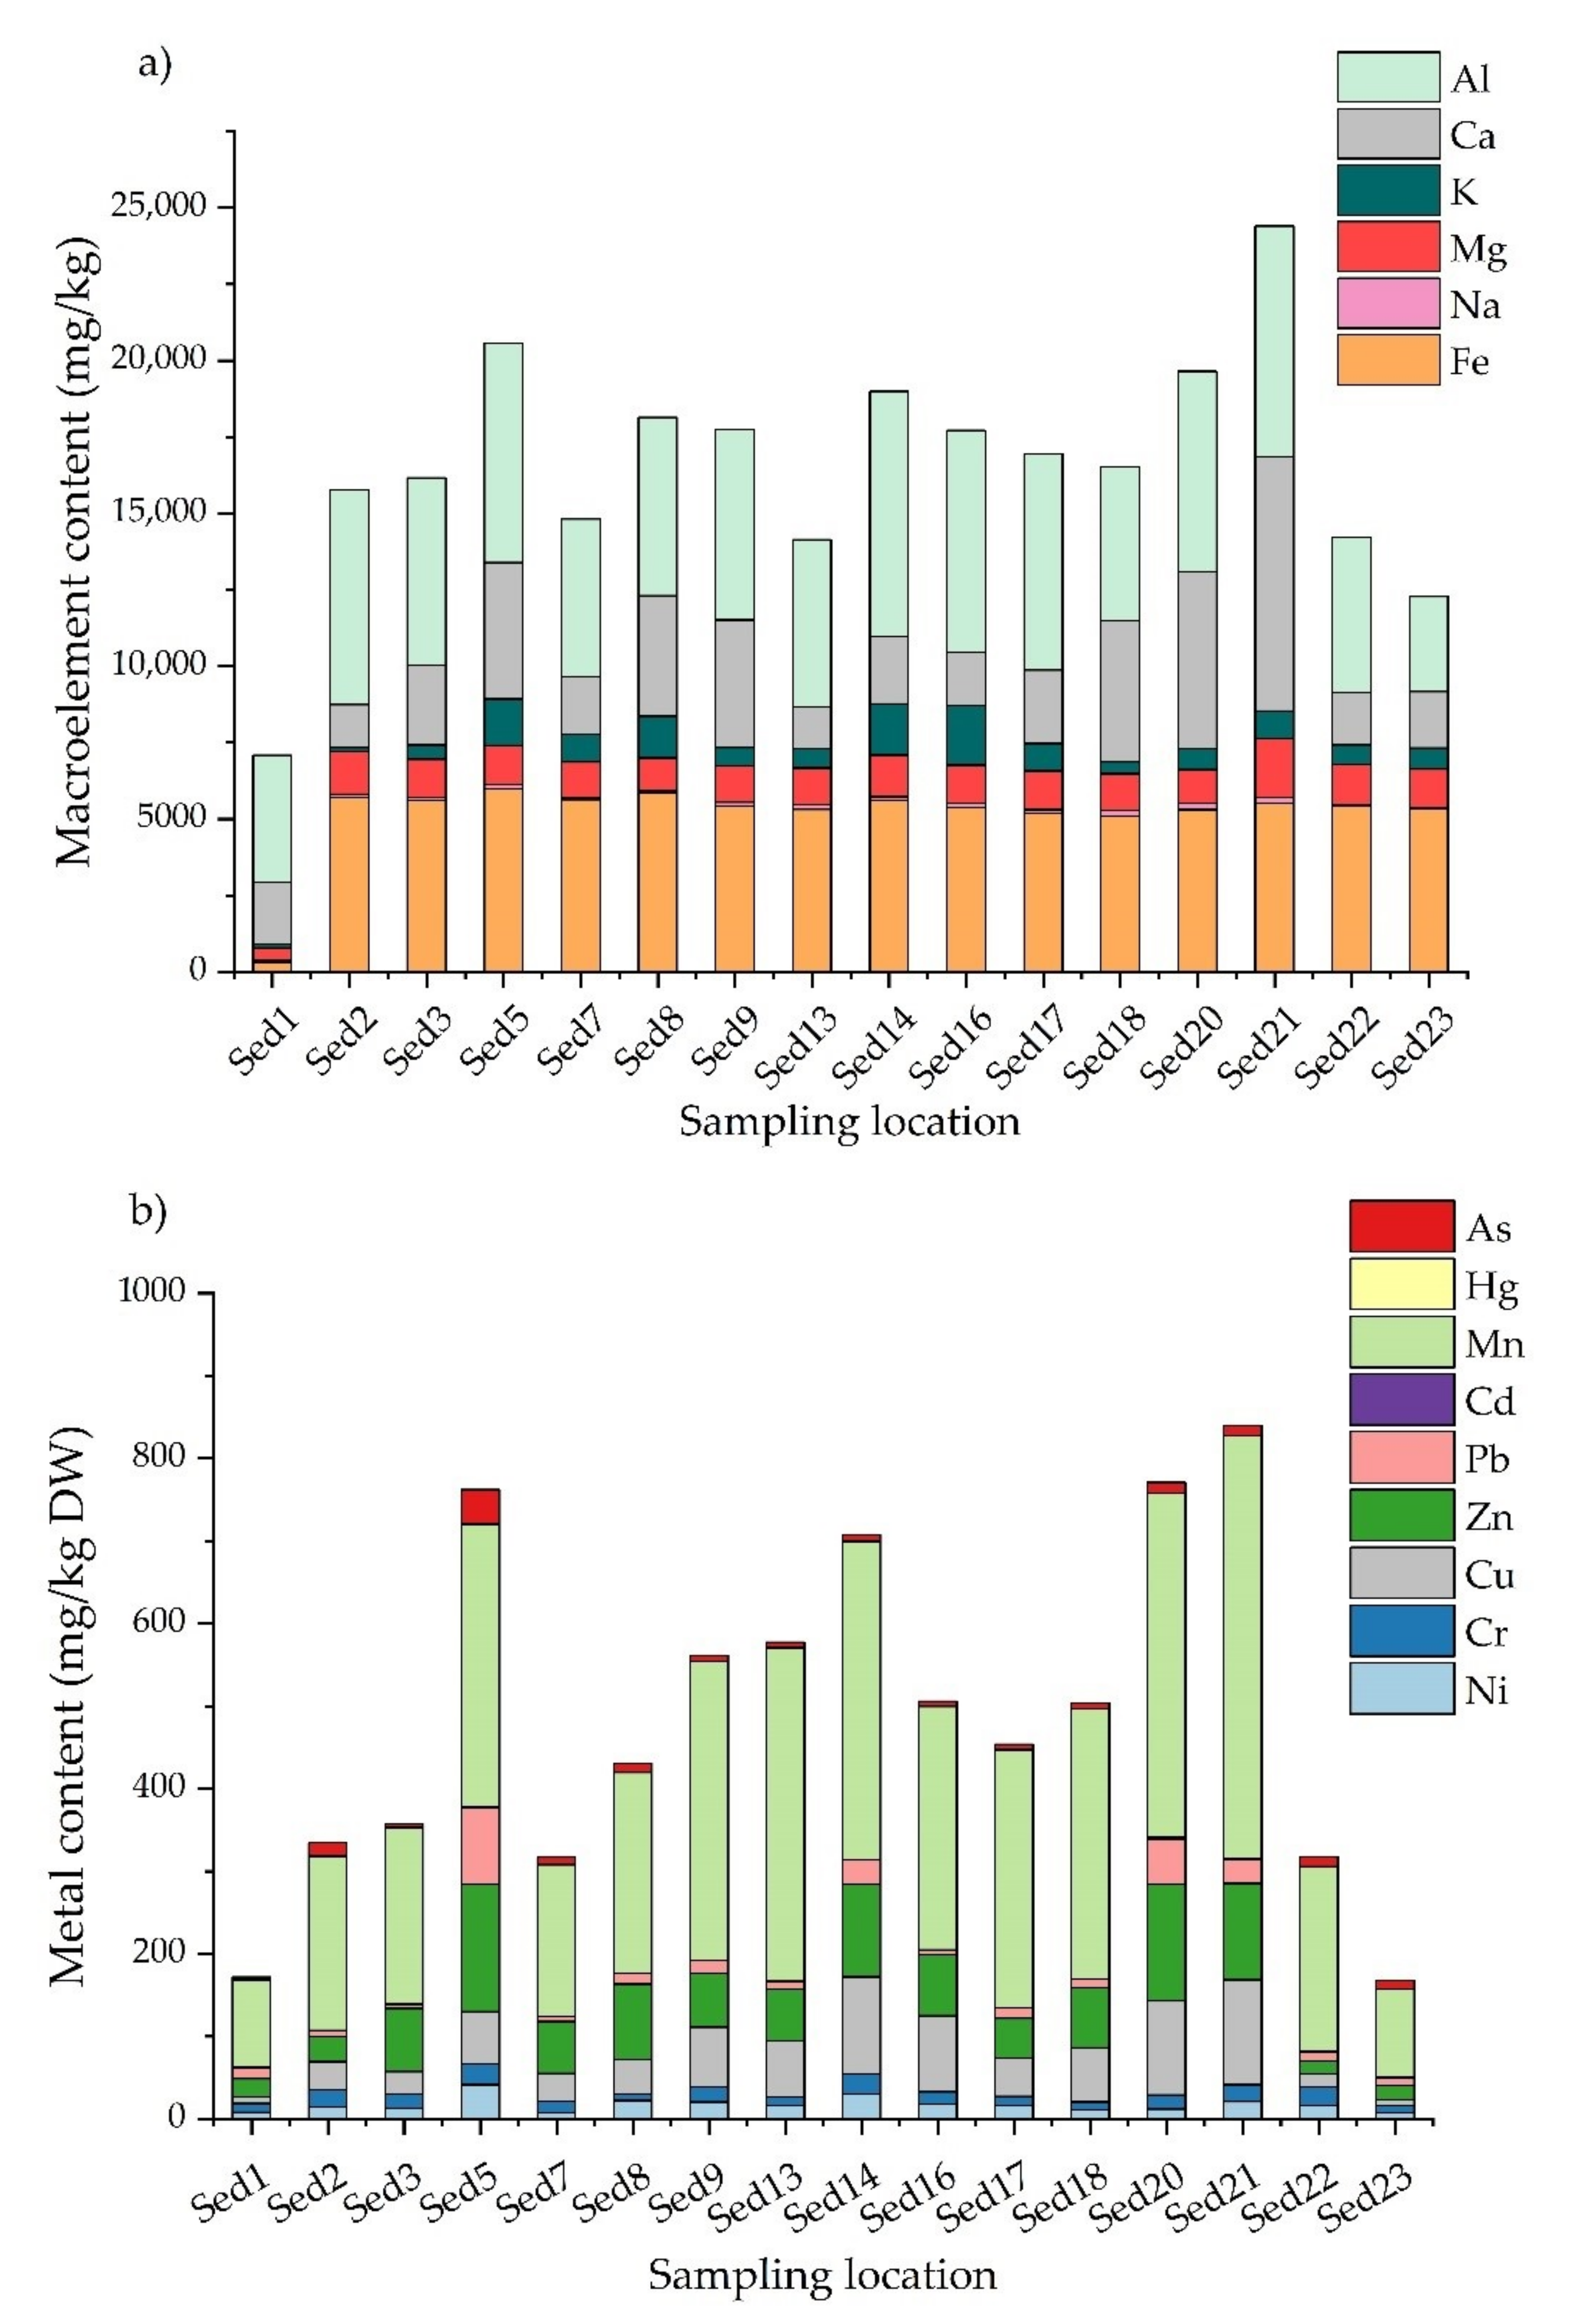
3.2. Surface Soils and Sediments

The spatial distribution of metal pollution in surface soil is directly linked to the diversity and complexity of human activities and mainly influenced by the history of anthropogenic activities [53]. Identifying the source of metals in surface soil is demanding in the process of controlling/reducing the contamination with metals and the risk to human health. Moreover, due to the multiple outputs of metals (mining, fossil-fuels burning, traffic emissions from vehicles, waste burning, pesticide usages, etc.), identifying the specific sources of metals in the soil can pose some difficulties [54].
In surface soil samples, the mean content of metals showed the following trend: Al > Fe > Ca > Mg > K > Mn > Zn > Na > Cu > Pb > Ni > Cr > As > Hg > Cd (Table S3). Ni, Cr, Cu, Zn, Pb, As, and Hg levels had a low variation among the sampling locations, whereas Al, Fe, and Ca varied widely within the Arieș River basin. Fe, Ca, and Al ranged between 11,065 and 529 mg/kg, 9672 and 2341 mg/kg, and 19,609 and 743 mg/kg, respectively, their highest and lowest contents being obtained at sampling locations S6 and S1.
Ni, Zn, and Pb exceeded the alert threshold, and Cu exceeded the intervention threshold set by MO no. 756/1997, compared to the normative values for sensitive soils [55]. These overruns were generally observed at sampling points S6, S20, and S21.
In the case of sediments, Ni, Cr, Cu, Zn, Cd, Pb, and As content exceeded the threshold values for sediments established by the MO no. 161/2006 [35], the highest values being noticed in the case of Sed6 (Table S4). The sediment sampled from Sed6 was characterized by a high content of Na, Pb, and As, while the sediment from sampling station Sed21 recorded the highest values of K, Ca, Mn, and Al content.
Due to their persistent bioaccumulation characteristics, micro- and macroelements from surface waters are eventually adsorbed in sediments and bioaccumulate, causing toxic effects even at locations distant from the source of contamination [56]. Studies have shown that heavy metals, such as Cu, Cd, Pb, and Zn, accumulate in soil and transfer to vegetables cultivated in areas in the proximity of abandoned ore-processing facilities, entering the food chain and exposing the population to potential health risks, such as cancer [57]. The average concentration of metals in sediments showed the following trend: Al > Fe > Ca > Mg > K > Mn > Na > Zn > Cu > Pb > Ni > Cr > As > Cd > Hg (Figure 4).
According to the lithogenic background values proposed by Taylor and McLennan [41], the Arieș River sediment samples indicated that the concentrations of major and minor elements (Fe, Na, Mg, K, Ca, Mn, and Al and Ni, Cr, Cu, Zn, Cd, Pb, and As, respectively) of Sed6, Sed20, and Sed21 were at least one time greater than their lithogenic background values. Sediments from Sed6 were higher in terms of Ni, Cu, Zn, and Pb, while Sed20 and Sed21 were characterized by high content of Cu, Zn, and Cd. In the case of sediment, not only past mining activities but also former industrial activities conducted in the lower basin proved to have an impact on sediment quality.
Previous studies have shown that tailing deposits in the middle basin have a high potential risk of contamination with Cu, Pb, Cd, and As of the Arieș River sediments [58]. Furthermore, the same metals have been identified at extreme levels in sediments in the vicinity of another Cu–Au ore deposit [59]. Another study has shown that high As and Cd contents present a very high ecological risk, indicating the complexity of the restoration process of the ecological environment in a river basin affected by historical mining and industrial exploitation [60]. An overview of the average concentration of metals in the Arieș River basin of the previous studies is presented in Table 3.

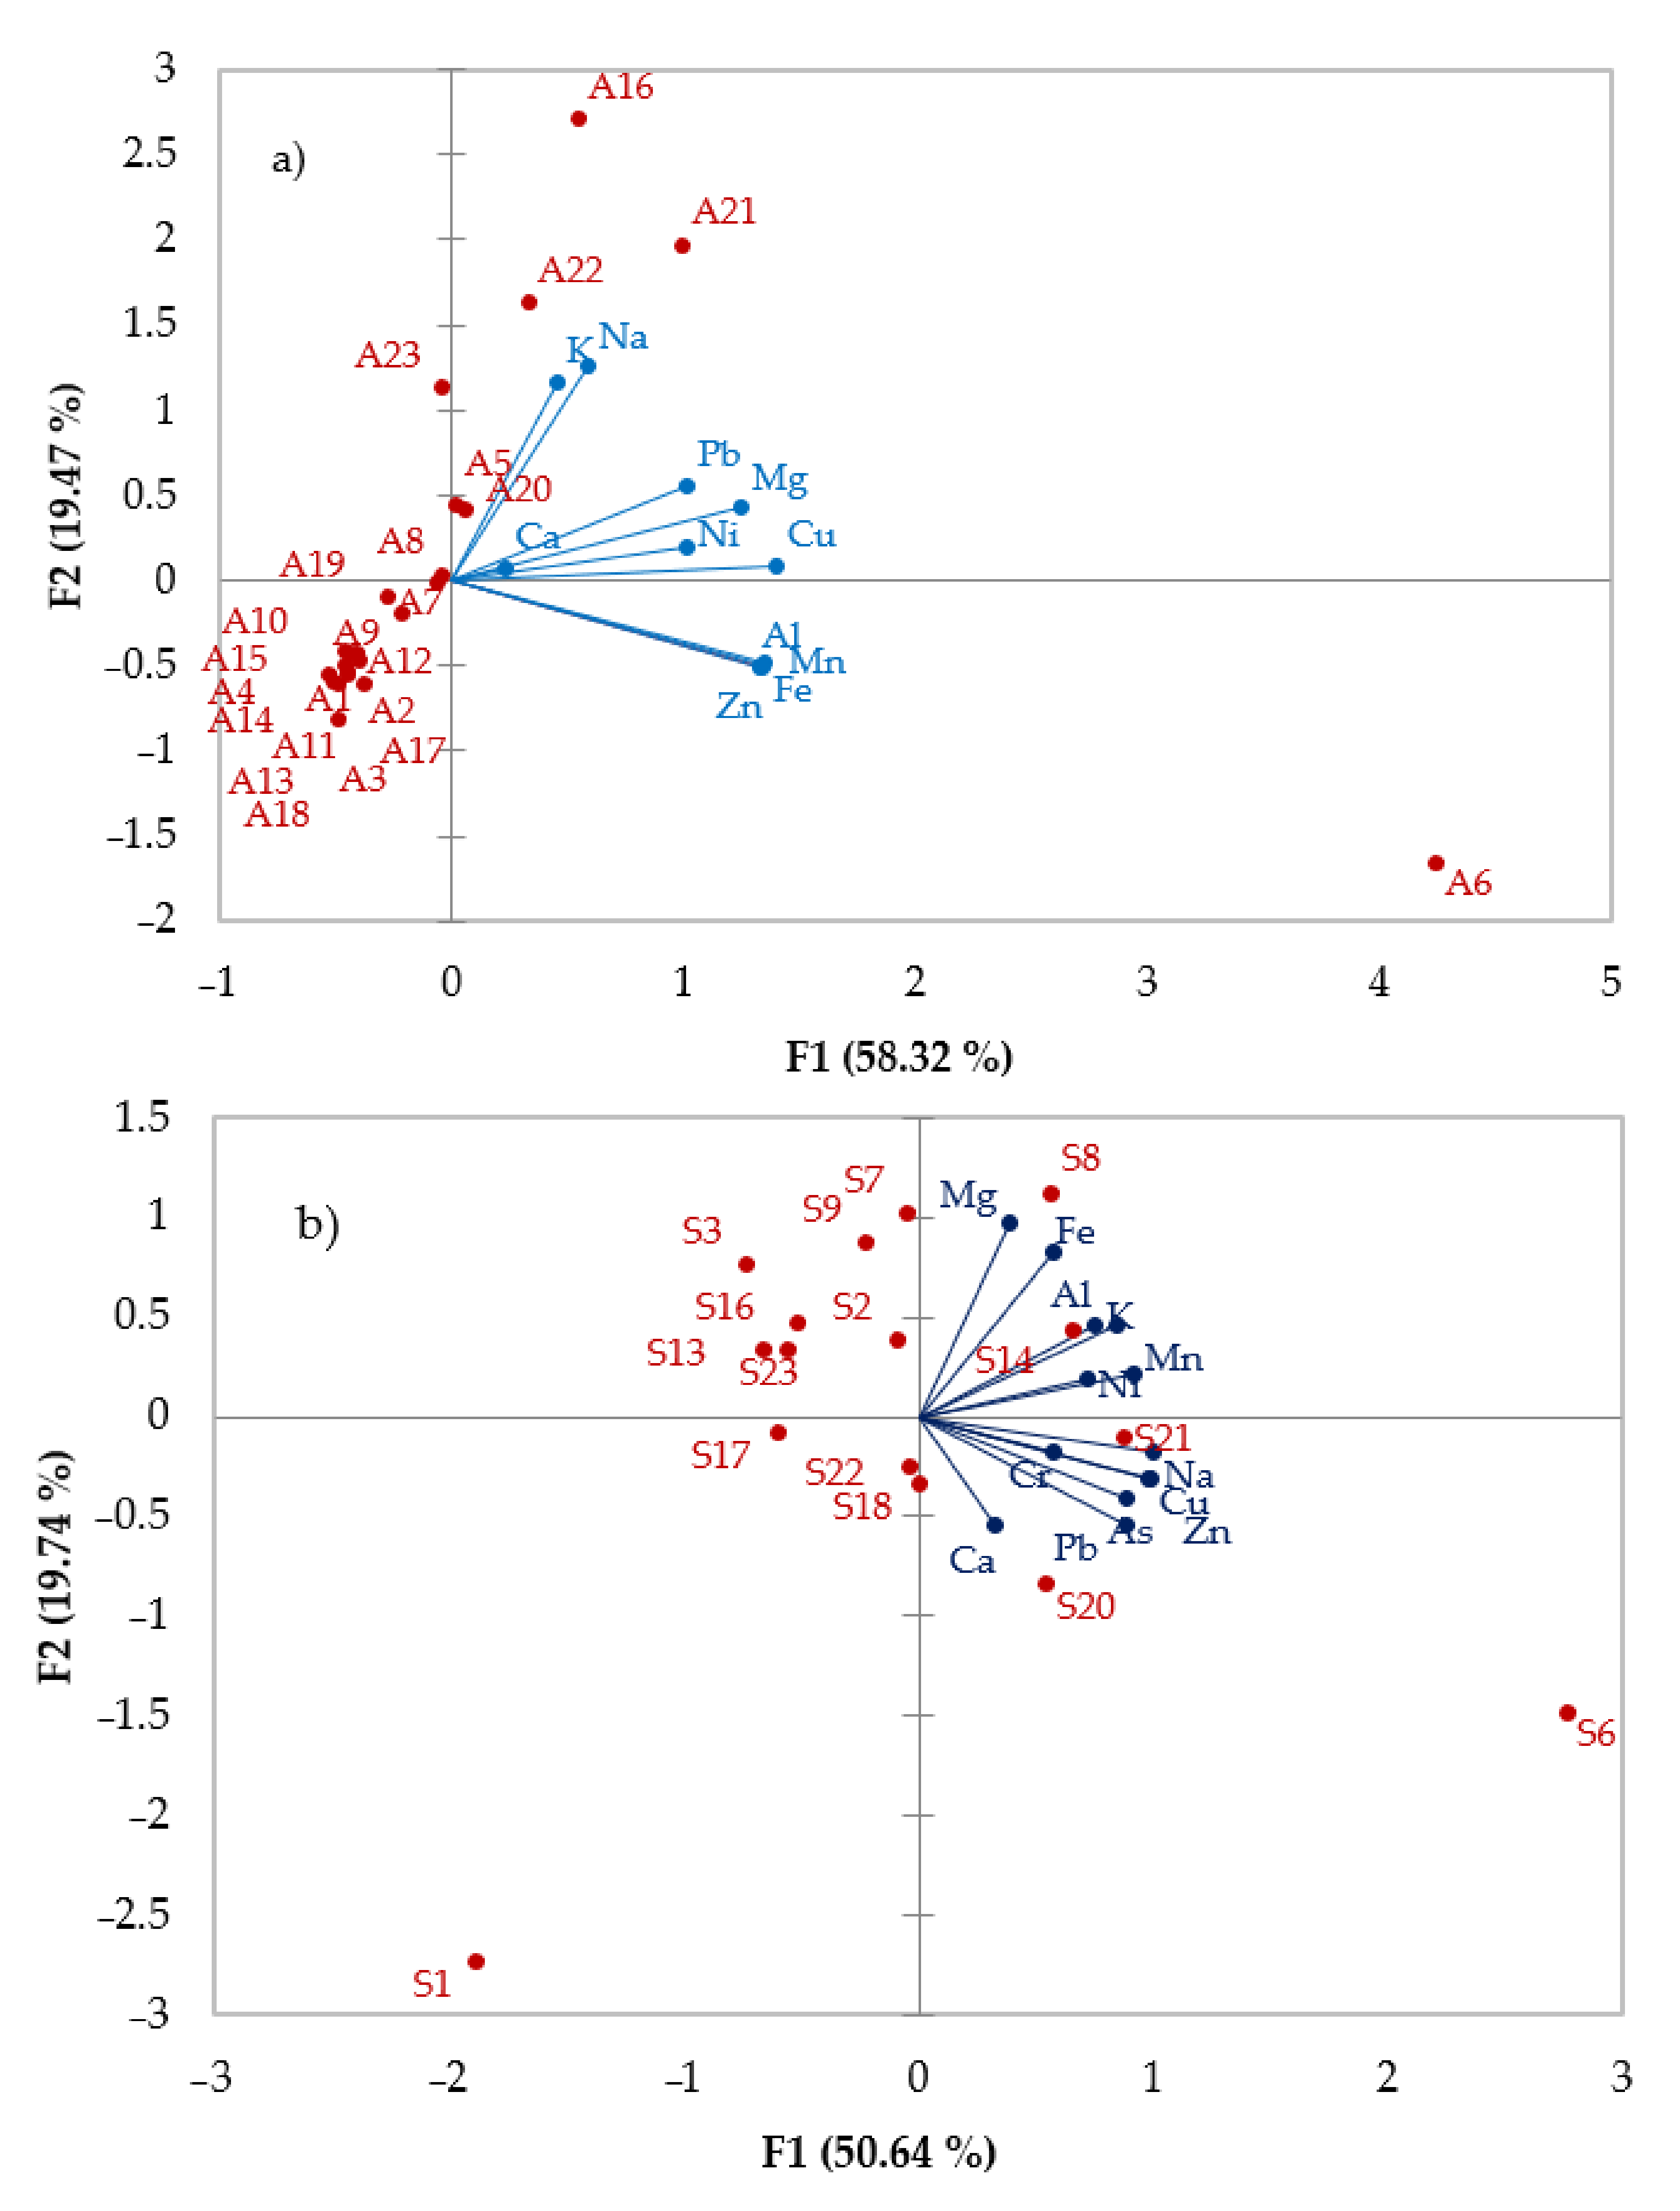
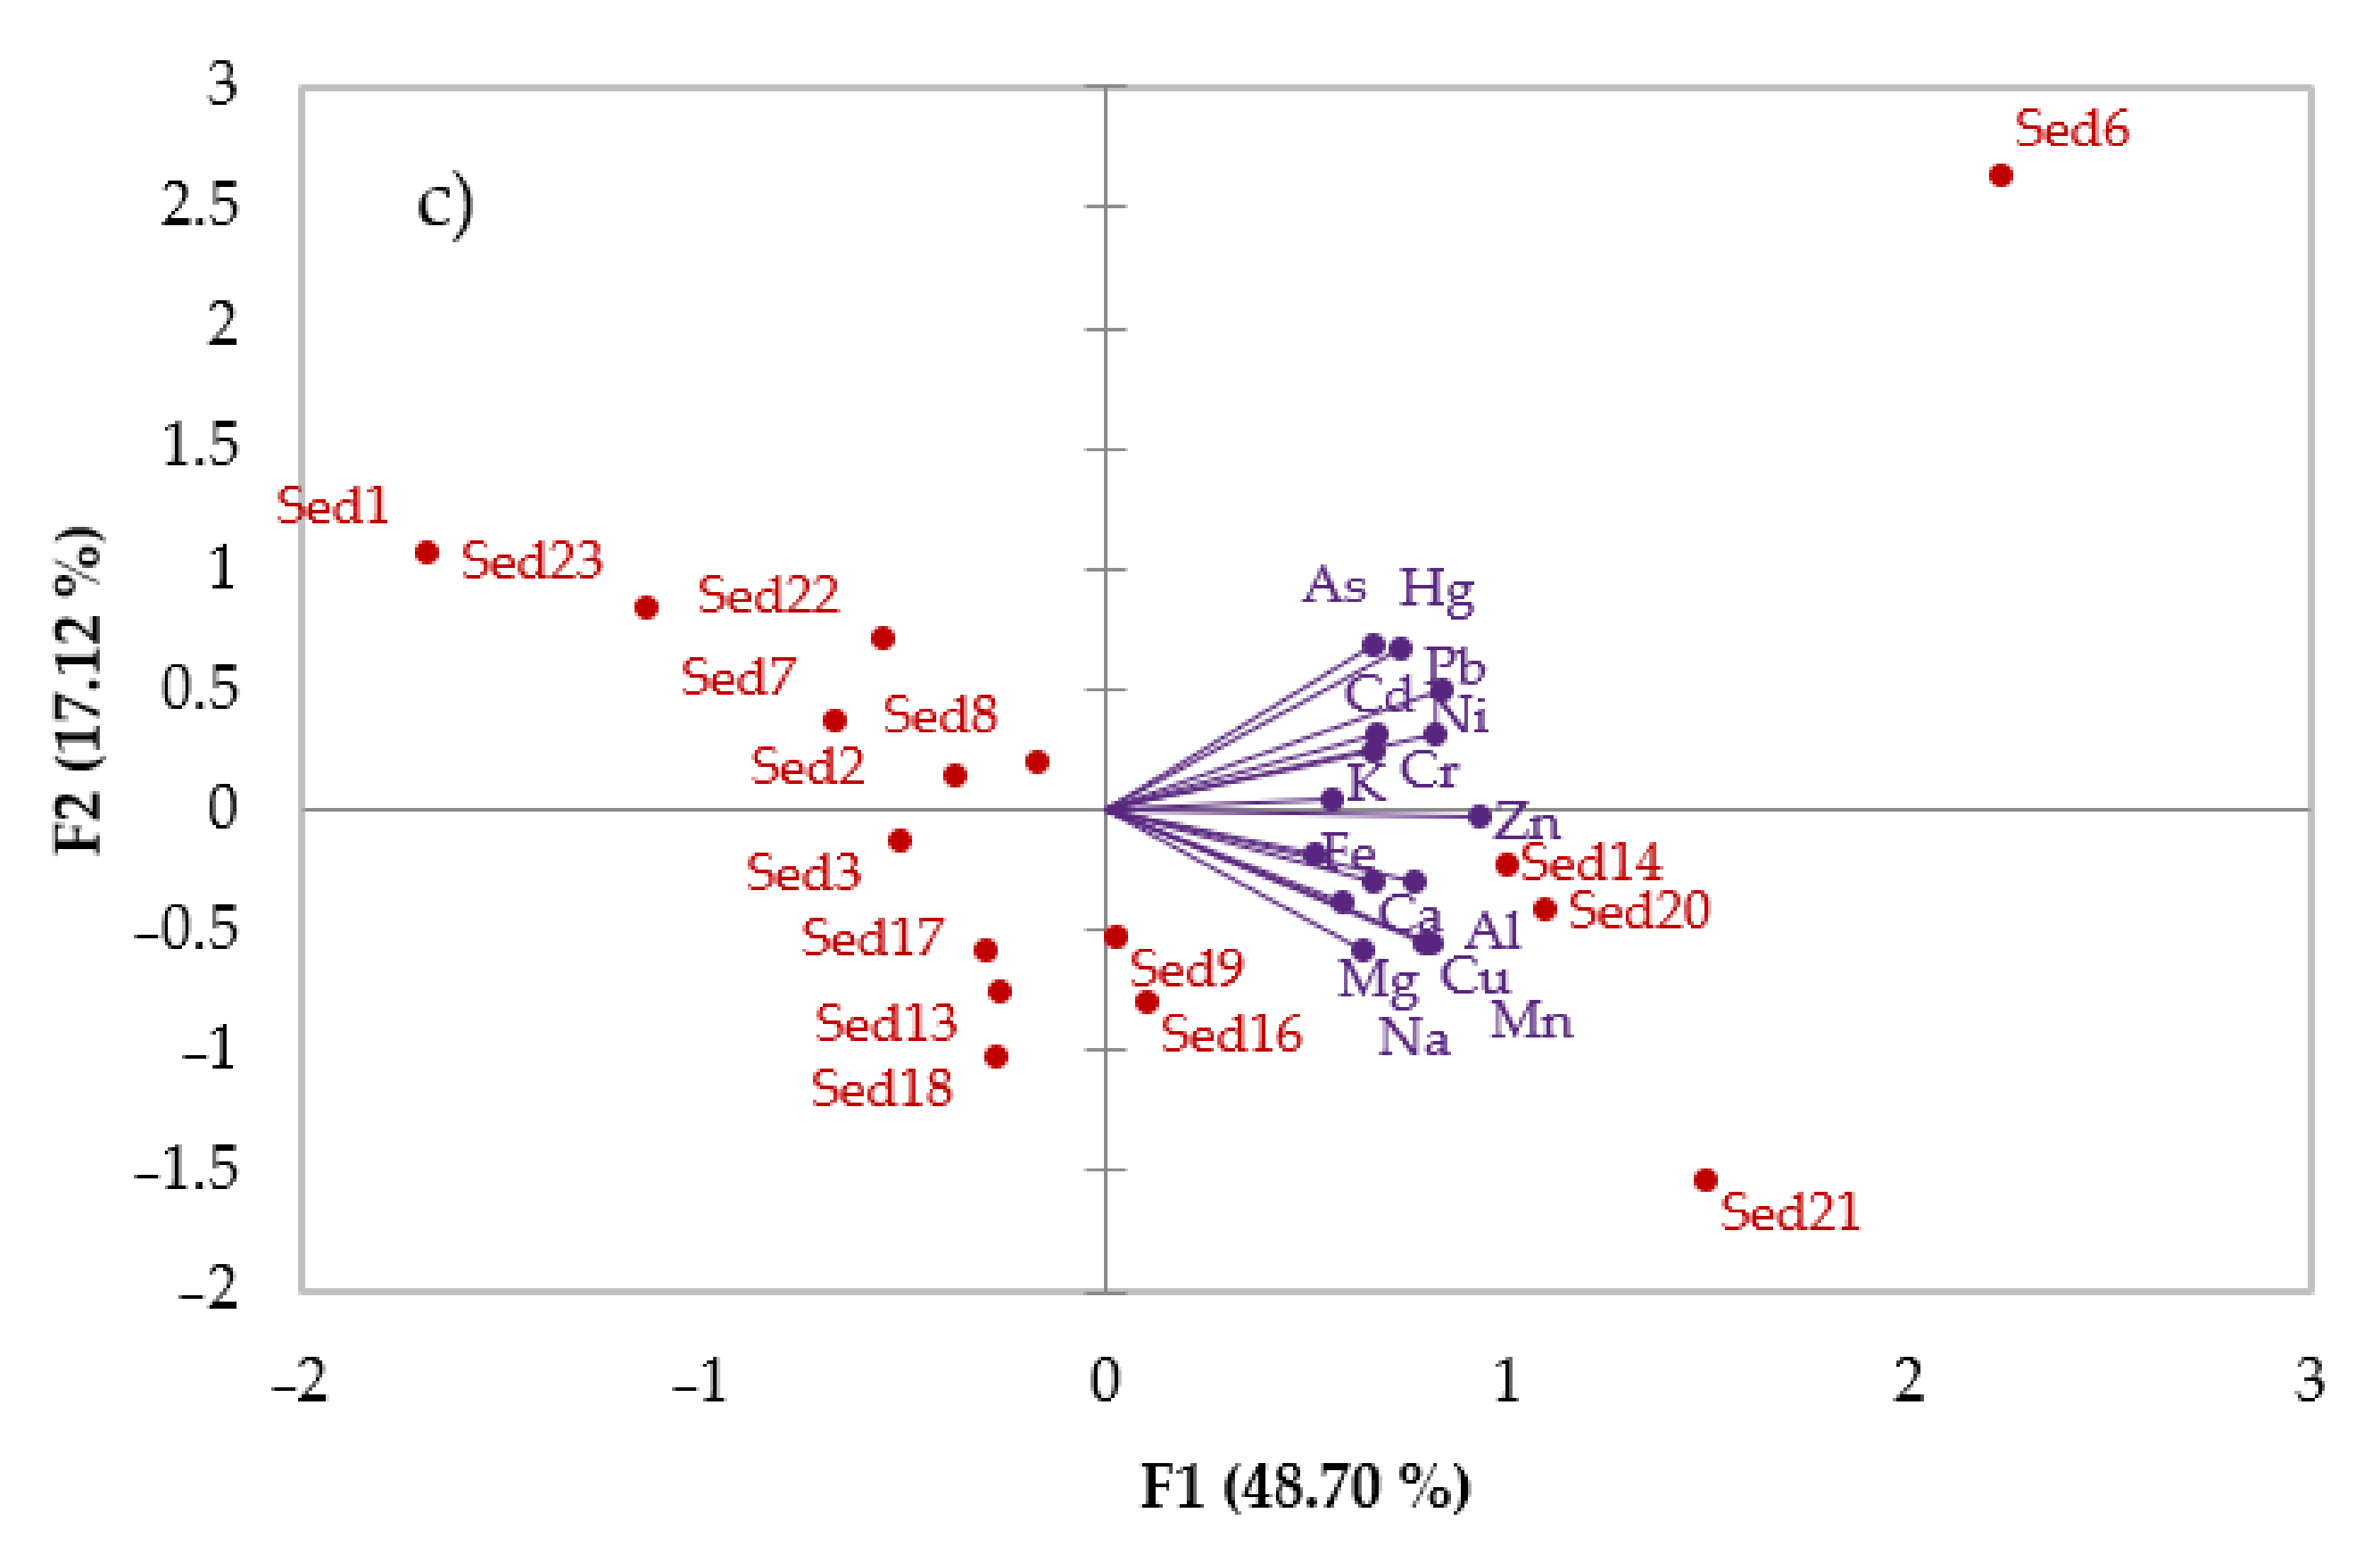
3.3. Statistical Analysis of Surface Water, Soil, and Sediments

The Shapiro–Wilk test was performed to test the normality of the datasets for all measured elements from the Arieș River basin, and the results are shown in Table 2. In the case of the water samples, most of the elements passed the normality test, as the significance level was below the 0.05 value. However, in the case of the soil samples, the results showed that normality cannot be rejected in the case of Na, K, Cr, Mn, and Al, while in the sediment samples, normality cannot be rejected for Na, K, Cr, Cu, Zn, Mn, and Al, as the p-values were higher than 0.05.
The PCA’s loadings and scores of the PC1 and PC2 are plotted in Figure 5 (water, soil, and sediment samples). The PCA analyses were performed in order to present the relationships among metals and to show the correlation among the variables. The metals grouped together indicate that their contents are intercorrelated.
The PC1 explaining 58.32% of the total variance has positive loading on Na and K of the water samples. In the case of soil samples, the PC1 explaining 46.39% of the total variance has moderate positive loading on Mg and Fe. Generally, major elements, such as Na, K, Mg and Fe, reach the affected area through natural processes (hydrothermal, geochemical, or biogeochemical systems and cycles). Therefore, the abundance and distribution of Fe in various locations can be attributed to the dissolution processes from the nearby rocks, which are transported by hydrological fluxes. In the case of the sediment samples, the PC1 explaining 48.70% of the total variance has moderate positive loading on As and Pb.
The water samples from points A16 and A21 are positively associated with the Na, K, Pb, Mg, Ni, Ca, and Cu contents, possibly due to the industrial activities in the area and natural processes, such as weathering. Câmpia Turzii (A21) has been an industrial base for siderurgy, chemical products, and building materials. Therefore, all these industrial activities could have a major impact on the environment, even today.
Pb, Ni, and Cu are present due to the mineral deposits in the area and to the untreated acid mine drainage. The findings of Corches [70] showed that acid mine drainage in the Arieș River area is the main source of water pollution with metals. The samples from S2, S3, S7, S9, S13, S16, and S23 are distributed in the upper left quadrant and showed a negative association according to their Mg, Fe, Al, K, Ni, and Mn content, while S17 and S18 are mainly grouped around Ca, Cr, Hg, Pb, As, Zn, Cu, and Na, indicating a negative association as well.
In the case of the sediment samples, Sed1, Sed22, and Sed23 can be grouped together, as can Sed2, Sed7, and Sed8, which showed a negative association with the As, Hg, Pb, Cd, Ni, Cr, and K contents. Whereas Sed9, Sed16, Sed14, S20, and Sed21 showed a positive association with the Zn, Fe, Ca, Al, Mg, Mn, Cu, and Na contents among the sampling locations. Interestingly, in each case (water, soil, and sediment samples), sampling location no. 6 showed no correlation and could not be grouped with the other samples.
The metal concentration variations can be attributed to natural processes, as water dilutes contaminants from active mine sites, which can be transported and delivered through the river flow, resulting in fluctuating metal accumulations along various parts of the river basin. The higher metal concentrations in the tributaries reflect that the contamination levels between the sampling sites can be attributed directly to the hydrological linkages among the mining and tailings sites and surface drainage network. The metal accumulation is a result of the transported, delivered, and accumulated contents in association with the local physico-chemical environment’s characteristics and with the waste chemistry [21].

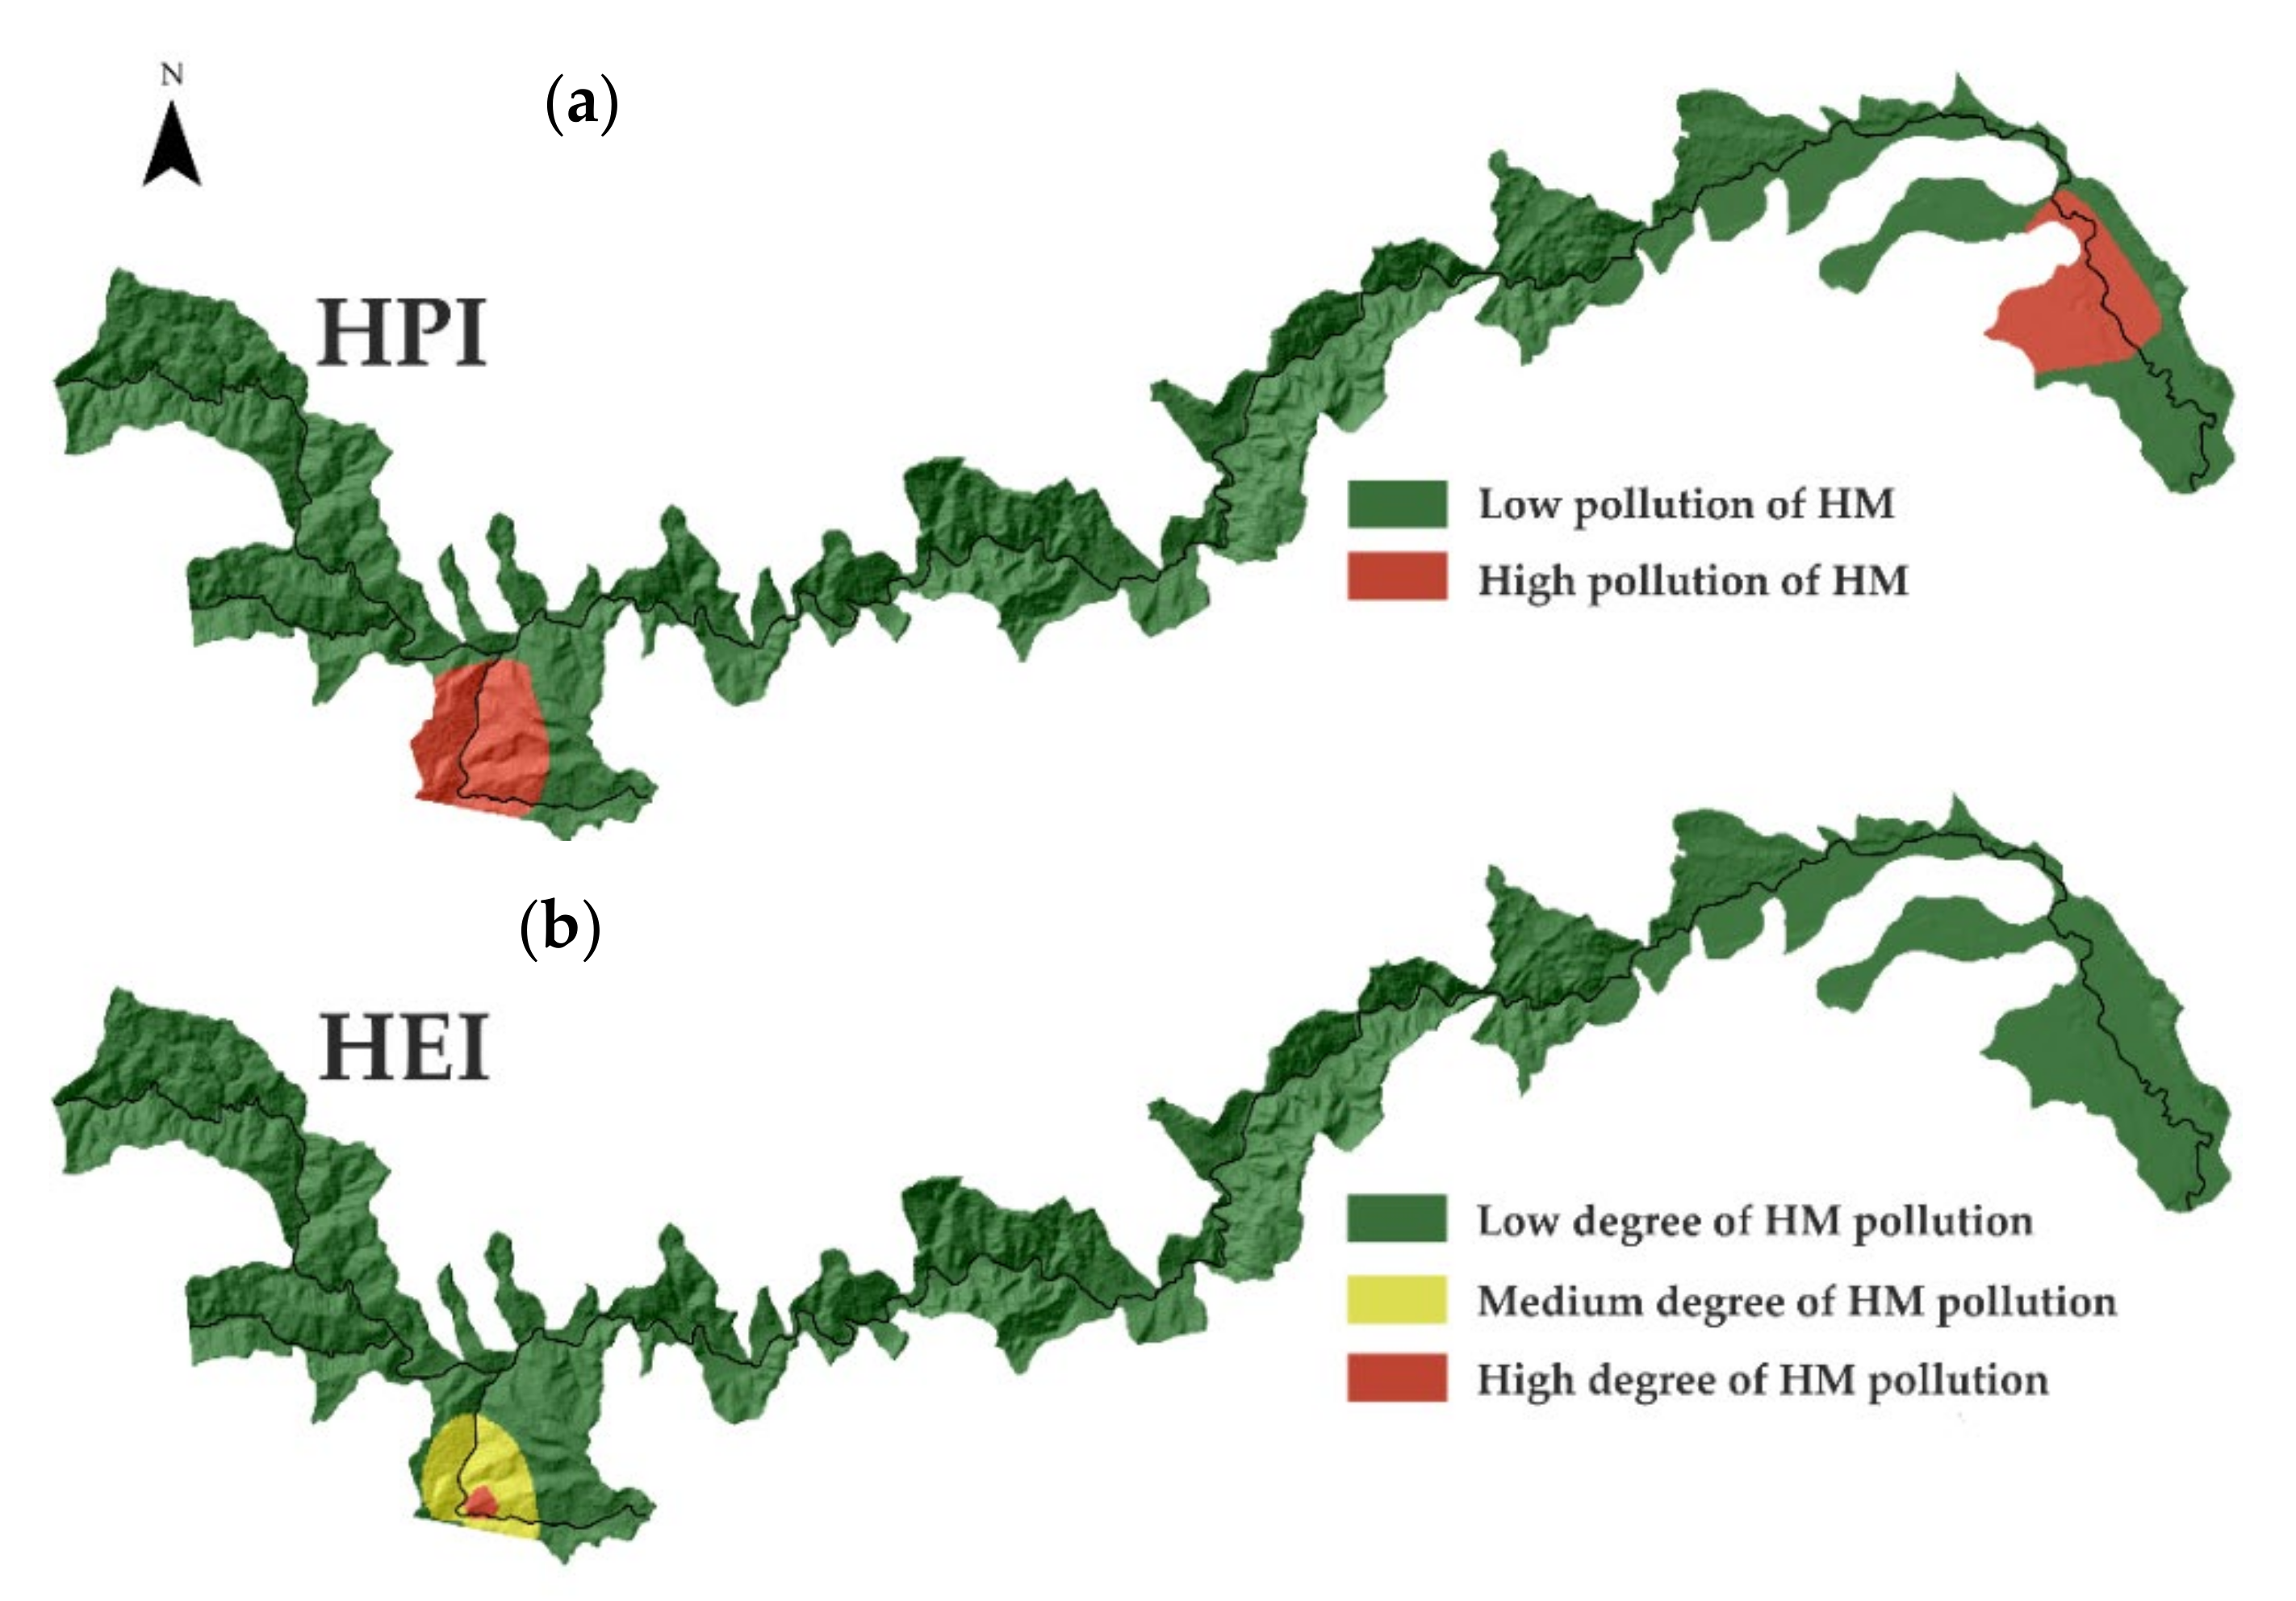
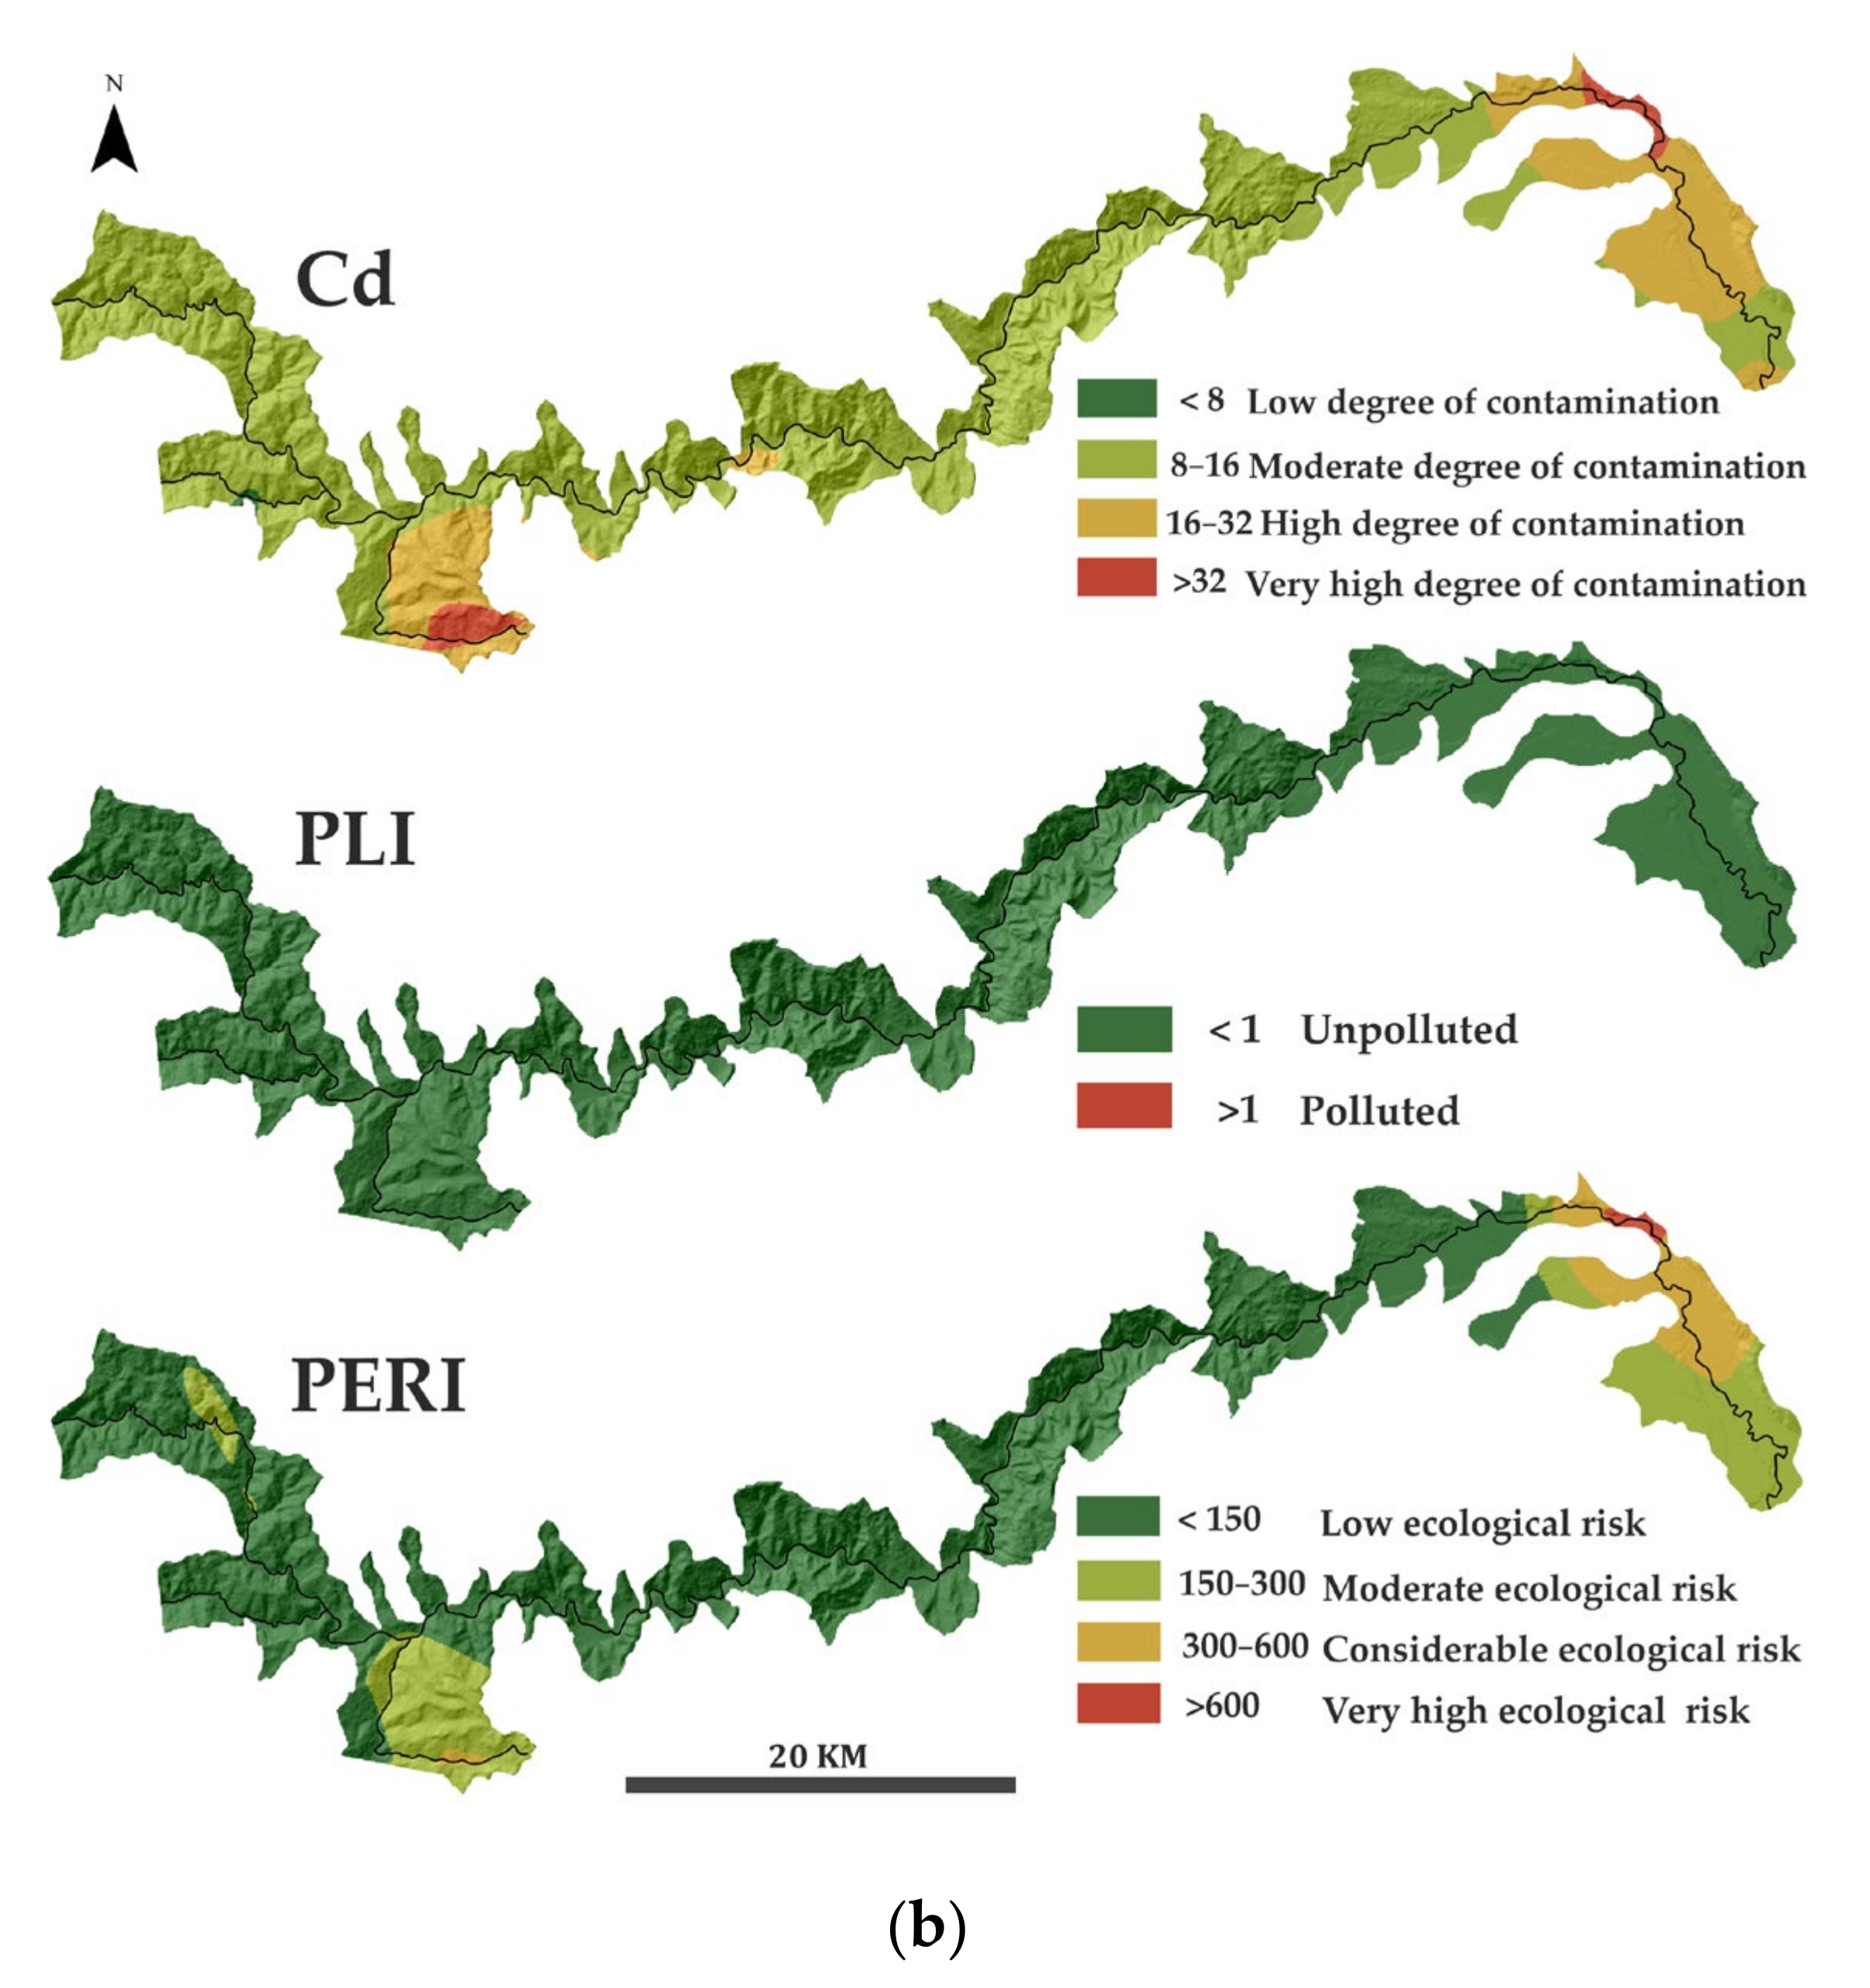
3.4. Pollution Characteristics

Figure 6 and Table S5 show the spatial variation in water pollution indices (HPI, HEI) among sampling stations. HPI and HEI in the study area were calculated using several metals, such as Fe, Ni, Cr, Cu, Zn, Cd, Pb, Mn, and Hg. The ranges and mean values of HPI and HEI were 21.8 to 493 and 66.0 and 3.12 to 446 and 26.3, respectively. High HPI values exceeding the critical pollution index value of 100 were observed for the sampling stations located in the proximity and downstream of the gold mine impoundment (A6 and A8) and around the industrial area in the inferior basin (A21). HEI values indicated a high degree of pollution only in the area of sampling station A6, near the gold mine, and a medium degree of pollution near the sampling station A8, indicating that sampling station A6′s high level of metal contamination had a powerful influence on his tributary stream.
The middle part of the Arieș basin (sampling stations A6, A8, A11, and A12) was characterized by high pollution due to the accumulation of flow water charged with metals from the acid mine drainage. As can be noticed, the poor quality of the two tributaries also affects the quality of the main watercourse; thus, a special attention is required. Many factors could contribute to the potentially high metal concentrations in surface water, such as distribution network leaks, which could lead to contamination; treatment system failure; or aging infrastructure, which might result in poor water quality [5]. The content of metals depends on the technology and processes used in wastewater treatment plants, which can be chemical, biological, or mechanical, influencing their concentration in sewage sludge. It has been observed that the mobility of heavy metals is reduced by anaerobic digestion, dehydration, and hygienization [71,72]. However, the hygienization process does not have an influence on the concentration of metals, with Zn and Cu having the highest content [72,73,74].
The results from the analysis of surface soil and sediment samples were evaluated by the Contamination factor (Cf), Contamination degree (Cd), Pollution Load Index (PLI), and Potential Ecologic Risk Index (PERI) (Table S6) of both major and minor elements of the Arieș River and its tributaries, and the results are shown in Table S7. The Cf, Cd, PLI, and PERI were calculated with the help of values and lithogenic background levels of Ni, Cr, Cu, Zn, Cd, Pb, Mn, As, and Hg.
The Cf results revealed that Cr, Cd, Mn, As, and Hg did not cause contamination in the soil samples collected from the study area, Ni and Pb caused low contamination, and Cu and Zn caused significant contamination. The synergetic pollution of soil samples employed by Cd indicated all contamination degrees: low degree of contamination for sampling stations S1 and S3; a moderate degree of metal contamination for sampling stations S2, S7, S9, S13, S16, S17, S18, S22, and S23; a substantial contamination degree for the soil samples collected from sampling stations S14, S20, and S21; and a very high degree of contamination for the soil samples collected from the sampling station S6 and S8, in the proximity of the Au ores mining complex. In general, based on the Cf values, the quality of the soils was good and the pollution was localized, indicating that, in the case of surface soils, anthropogenic activities have a local and temporal effect on soil quality.
Cf values of the sediments at the Arieș River ranged from 0.45 to 1.79 for Ni, 0.26 to 0.60 for Cr, 0.26 to 5.56 for Cu, 0.51 to 3.75 for Zn, 0.15 to 0.60 for Cd, 0.32 to 0.4.57 for Pb, 0.16 to 0.55 for Mn, 0.38 to 0.21.9 for As, and from 0.019 to 0.456 for Hg. The mean Cf values indicated that the sediments were less contaminated (Cf < 1) regarding metals such as Ni, Cr, Mn, and Hg. The highest Cf values for Cd, Zn, Pb, and As were found in the Sed6 sampling station’s sediments, and the highest Cf values for Cu were found in the case of Sed14.
Although the Cd values of these seven metals mostly reflected moderate levels of contamination for sediments, a few samples corresponded to considerable and very high levels of contamination, with values ranging from 7.12 to 57.5 (average: 19.8). Cd indicated a very high degree of contamination for the sediments from Sed6, Sed20, and Sed21 sampling stations.
The Cf values and Cd content exhibited similar spatial distribution characteristics, and the high-value areas were mainly located in the Roșia Montană area, Roșia Rivulet (S6), Abrud River (S8), and in the eastern region of the study area (S20, S21).
The calculated PLI at each sampling site is presented in Figure 7. The obtained values for the metals under consideration ranged from 0.24 to 1.95 with an average of 0.49 in the soil samples, and they ranged from 0.14 to 1.66 with an average of 0.77 in the sediment samples. Based on the results obtained using the PLI, soil and sediments samples were classified as unpolluted, except for the samples from sampling station S6 (Roșia Montană village), with PLI > 1.
The individual Ecological risk (Er) of each metal and the Potential Ecological Risk Index (PERI) values were employed to assess the potential hazard of the investigated soil and sediments samples. The calculated values of PERI are presented in Figure 7a,b for soil and sediment, respectively, and in Table S7. In the case of soil samples, Ni, Cr, Zn, Cd, Pb, Mn, As, and Hg showed a low potential ecological risk, with Er < 40 in all the studied samples. Conversely, Cu exhibited the highest Er values, indicating a considerable and moderate ecological risk for soil samples from S6 and S8, with Er > 80, and for soils from the sampling station S14 and S21, with Er values > 40. The potential ecological risk of metals ranged from 21.8 to 204 for soil samples and between 83.4 and 929 for sediment samples, as can be seen in Figure 7a,b. For sediment, As and Cd posed an important potential risk, with values between 16.5 and 219 with a mean value of 59.1 for As and values between 30.6 and 646 with a mean value of 214 in the case of Cd, while Ni, Cr, Cu, Zn, Pb, Mn, and Hg showed low ecological risks at all sampling points, revealing lithogenic contributions of heavy metals to surface soils.
Apparently, Cu, in the case of soil, and As and Cd, in the case of sediment, were the primary contributors of PERI due to their abundance in the collected soil and sediments and elevated toxicity. Two samples of soil exhibited moderate risk in the studied area based on the PERI classification (S6 and S8), while, in the case of sediment, the average value of PERI showed a moderate potential ecological risk (Sed6—very high ecological potential risk; Sed21 and Sed23—considerable ecological potential risk; Sed8 and Sed22—moderate ecological potential risk). These results suggest that the enrichment of Cd and As in the studied sediments had an important contribution to the high values of PERI, the mean value being much higher than the value reported by Arisekar et al. [75] in the Thamirabarani River basin, India.
A proportional decrease in metal content was noticed in mining areas and industrial plants situated in the inferior basin. El Fadili [76] classified the risk of soil metal content for different types of land use as follows: villages > agricultural land > vacant land > forest. This classification emphasizes the cumulative effect of anthropogenic activities such as mining, industry, agriculture, and household life.

4. Conclusions

Surface-water, soil, and sediment samples collected from the Arieș River basin, Romania, were investigated for the occurrence and distribution of selected metals. The results presented include the concentration and spatial distribution levels of metals, estimate the contamination level in surface water using the HPI and the HEI and in soil and sediment using the Cf, Cd, PLI, and evaluate the potential ecological risk index of metals for soil and sediment samples. Surface-water samples from sampling station S6, near a major tailing impoundment from the Au ores mine, indicated a significant concentration of major and trace elements, such as Ca, Fe, Mg, and Al, Zn, and Mn, respectively. High contents of metals were also noticed in the soil samples collected from S6, near the tailing impoundment (Cu, Ni, Zn, and Pb), while the sediment samples presented high content of Pb, Mn, Al, and As. According to the PCA results, sampling location number 6 in each case (water, soil, and sediment samples) did not show any association with the variables from the other sampling locations. Regarding the metal pollution level of surface water in the proximity and downstream of the gold mine impoundment, Cu, Zn, and Pb were the main contributors to the high HEI and HPI values.
The highest contamination degree was noticed at sampling station S6, with Cd values of 42.8 for soils and 57.5 for sediments, respectively. The PLI values showed that surface soil and sediments from Roșia Montană and Roșia Rivulet were highly polluted (PLI = 1.58, 1.95) by hazardous metals, causing the deterioration of the site quality. The average potential ecological risk index values for soil and sediments were in the order Cu > Cd > As > Cr > Hg > Mn > Zn. The maximum PERI values of metals were recorded in soils and sediments near the gold mine impoundment.
The hazardous elements from surface waters, soils, and sediments from the tailing impoundment proximity are readily leached under acidic conditions, and some of them are highly bio-available, with potential harmful effects on the people living in the area. Thus, remediation actions such as active and/or passive treatment operations of acid minewater, discharge prevention and control, tailings stabilization, and other innovative approaches and methods are needed in order to reduce the negative effects of mining operations. Various procedures for assessing and categorizing mining sites should be implemented by the competent authorities.
The study brings new and valuable information, which can be used to protect human health, to maintain ecosystems, and to offer appropriate conditions for agriculture and livestock in the area.

Supplementary Materials

The following supporting information can be downloaded at https://www.mdpi.com/article/10.3390/su14138024/s1: Table S1: Sampling location associated with the sampled matrices; Table S2: The total metal and metalloid element content (mg/L) of the surface water samples from the sampling stations (1–23), highlighted with different colors (Excel, Conditional Formatting tool) in order to show the highest, medium and lowest concentration variation in each metal column (from highest, red-orange-yellow-green, to lowest values) between the sampling locations; Table S3: The total metal and metalloid element content (mg/kg DW) of the soil samples from the sampling stations (1–23), highlighted with different colors in order to show the highest and lowest concentration variation (from red to green) between the sampling locations (Excell, Conditional Formatting tool); Table S4: The total metal and metalloid element content (mg/kg DW) of the sediment samples from the sampling stations (1–23), highlighted with different colors in order to show the highest and lowest concentration variation (from red to green) between the sampling locations (Excell, Conditional Formatting tool); Table S5: The pollution indices of the surface water sampled from the Arieș river basin; Table S6: Pollution and metal contamination assessing based on the indices values; Table S7: Comprehensive pollution indices of the analyzed metals in soil and sediment samples.

Author Contributions

Conceptualization, A.M., A.I.T. and O.C.; methodology, A.M., A.I.T. and E.K.; writing—original draft preparation, A.M., A.I.T. and E.K.; writing—review and editing, O.C., E.K. and V.M.; visualization, I.C.M.; supervision, O.C. and V.M. All authors have read and agreed to the published version of the manuscript.

Funding

The APC was funded by the Ministry of Research, Innovation and Digitization through Program 1—Development of the National Research & Development System, Subprogram 1.2—Institutional performance—Projects that finance the RDI excellence, Contract no. 18PFE/30.12.2021.

Institutional Review Board Statement

Not applicable.

Informed Consent Statement

Not applicable.

Data Availability Statement

The data presented in this study are available on request from the corresponding author.

Acknowledgments

This paper was supported by the project “Entrepreneurial competences and excellence research in doctoral and postdoctoral programs—ANTREDOC”, POCU/380/6/13/123927, Contract no. 56437/24.07.2019, and by the Ministry of Research, Innovation and Digitization through Program 1—Development of the National Research & Development System, Subprogram 1.2—Institutional performance—Projects that finance the RDI excellence, Contract no. 18PFE/30.12.2021.

Conflicts of Interest

The authors declare no conflict of interest.

References

  1. Luckeneder, S.; Giljum, S.; Schaffartzik, A.; Maus, V.; Tost, M. Surge in global metal mining threatens vulnerable ecosystems. Glob. Environ. Change 2021, 69, 102303. [Google Scholar] [CrossRef]
  2. Li, G.; Lei, Y.; Ge, J.; Wu, S. The Empirical Relationship between Mining Industry Development and Environmental Pollution in China. Int. J. Environ. Res. Public Health 2017, 14, 254. [Google Scholar] [CrossRef] [PubMed] [Green Version]
  3. Pokhrel, L.R.; Dubey, B. Global Scenarios of Metal Mining, Environmental Repercussions, Public Policies, and Sustainability: A Review. Crit. Rev. Environ. Sci. Technol. 2013, 43, 2352–2388. [Google Scholar] [CrossRef]
  4. Sun, Z.; Xie, X.; Wang, P.; Hu, Y.; Cheng, H. Heavy metal pollution caused by small-scale metal ore mining activities: A case study from a polymetallic mine in South China. Sci. Total Environ. 2018, 639, 217–227. [Google Scholar] [CrossRef]
  5. Abraham, M.R.; Susan, T.B. Water contamination with heavy metals and trace elements from Kilembe copper mine and tailing sites in Western Uganda; implications for domestic water quality. Chemosphere 2017, 169, 281–287. [Google Scholar] [CrossRef] [PubMed]
  6. Li, Z.; Ma, Z.; van der Kuijp, T.J.; Yuan, Z.; Huang, L. A review of soil heavy metal pollution from mines in China: Pollution and health risk assessment. Sci. Total Environ. 2014, 468–469, 843–853. [Google Scholar] [CrossRef] [PubMed]
  7. Jaskuła, J.; Sojka, M. Assessment of spatial distribution of sediment contamination with heavy metals in the two biggest rivers in Poland. Catena 2022, 211, 105959. [Google Scholar] [CrossRef]
  8. Tchounwou, P.B.; Yedjou, C.G.; Patlolla, A.K.; Sutton, D.J. Heavy Metal Toxicity and the Environment. In Molecular, Clinical and Environmental Toxicology: Volume 3: Environmental Toxicology; Luch, A., Ed.; Springer: Basel, Switzerland, 2012; pp. 133–164. [Google Scholar] [CrossRef] [Green Version]
  9. Ali, H.; Khan, E.; Ilahi, I. Environmental Chemistry and Ecotoxicology of Hazardous Heavy Metals: Environmental Persistence, Toxicity, and Bioaccumulation. J. Chem. 2019, 2019, 6730305. [Google Scholar] [CrossRef] [Green Version]
  10. Zhuang, Q.; Li, G.; Liu, Z. Distribution, source and pollution level of heavy metals in river sediments from South China. Catena 2018, 170, 386–396. [Google Scholar] [CrossRef]
  11. Iordache, A.M.; Nechita, C.; Zgavarogea, R.; Voica, C.; Varlam, M.; Ionete, R.E. Accumulation and ecotoxicological risk assessment of heavy metals in surface sediments of the Olt River, Romania. Sci. Rep. 2022, 12, 880. [Google Scholar] [CrossRef]
  12. Xie, Y.; Fan, J.; Zhu, W.; Amombo, E.; Lou, Y.; Chen, L.; Fu, J. Effect of Heavy Metals Pollution on Soil Microbial Diversity and Bermudagrass Genetic Variation. Front. Plant Sci. 2016, 7, 755. [Google Scholar] [CrossRef] [PubMed]
  13. Fazekašová, D.; Fazekaš, J. Soil Quality and Heavy Metal Pollution Assessment of Iron Ore Mines in Nizna Slana (Slovakia). Sustainability 2020, 12, 2549. [Google Scholar] [CrossRef] [Green Version]
  14. Hinsinger, P.; Plassard, C.; Jaillard, B. Rhizosphere: A new frontier for soil biogeochemistry. J. Geochem. Explor. 2006, 88, 210–213. [Google Scholar] [CrossRef]
  15. Kumar, V.; Parihar, R.D.; Sharma, A.; Bakshi, P.; Singh Sidhu, G.P.; Bali, A.S.; Karaouzas, I.; Bhardwaj, R.; Thukral, A.K.; Gyasi-Agyei, Y.; et al. Global evaluation of heavy metal content in surface water bodies: A meta-analysis using heavy metal pollution indices and multivariate statistical analyses. Chemosphere 2019, 236, 124364. [Google Scholar] [CrossRef] [PubMed]
  16. Karaouzas, I.; Kapetanaki, N.; Mentzafou, A.; Kanellopoulos, T.D.; Skoulikidis, N. Heavy metal contamination status in Greek surface waters: A review with application and evaluation of pollution indices. Chemosphere 2021, 263, 128192. [Google Scholar] [CrossRef] [PubMed]
  17. Kowalska, J.B.; Mazurek, R.; Gąsiorek, M.; Zaleski, T. Pollution indices as useful tools for the comprehensive evaluation of the degree of soil contamination—A review. Environ. Geochem. Health 2018, 40, 2395–2420. [Google Scholar] [CrossRef] [Green Version]
  18. Nawrot, N.; Wojciechowska, E.; Mohsin, M.; Kuittinen, S.; Pappinen, A.; Rezania, S. Trace Metal Contamination of Bottom Sediments: A Review of Assessment MeasuRes. and Geochemical Background Determination Methods. Minerals 2021, 11, 872. [Google Scholar] [CrossRef]
  19. Dung, T.T.T.; Cappuyns, V.; Swennen, R.; Phung, N.K. From geochemical background determination to pollution assessment of heavy metals in sediments and soils. Rev. Environ. Sci. Biotechnol. 2013, 12, 335–353. [Google Scholar] [CrossRef]
  20. Forray, F.L.; Hallbauer, D.K. A study of the pollution of the Aries River (Romania) using capillary electrophoresis as analytical technique. Environ. Geol. 2000, 39, 1372–1384. [Google Scholar] [CrossRef]
  21. Bird, G.; Brewer, P.A.; Macklin, M.G.; Serban, M.; Balteanu, D.; Driga, B. Heavy metal contamination in the Arieş river catchment, western Romania: Implications for development of the Roşia Montană gold deposit. J. Geochem. Explor. 2005, 86, 26–48. [Google Scholar] [CrossRef]
  22. Levei, E.; Ponta, M.; Senila, M.; Miclean, M.; Frentiu, T. Assessment of contamination and origin of metals in mining affected river sediments: A case study of the Aries catchment, Romania. J. Serb. Chem. Soc. 2014, 79, 1019–1036. [Google Scholar] [CrossRef]
  23. Moldovan, A.; Hoaghia, M.-A.; Török, A.I.; Roman, M.; Mirea, I.C.; Barabas, R.; Micle, V.; Cadar, O. Spatial Variation of Water Chemistry in Aries River Catchment, Western Romania. Appl. Sci. 2021, 11, 6592. [Google Scholar] [CrossRef]
  24. European Soil Data Centre (ESDAC), European Commission, JoInt. Research Centre. Available online: https://esdac.jrc.ec.europa.eu/ (accessed on 12 April 2022).
  25. Bănăduc, D.; Curtean-Bănăduc, A.; Cianfaglione, K.; Akeroyd, J.R.; Cioca, L.-I. Proposed Environmental Risk Management Elements in a Carpathian Valley Basin, within the Roşia Montană European Historical Mining Area. Int. J. Environ. Res. Public Health 2021, 18, 4565. [Google Scholar] [CrossRef]
  26. Brad, T.; Bizic, M.; Ionescu, D.; Chiriac, C.M.; Kenesz, M.; Roba, C.; Ionescu, A.; Fekete, A.; Mirea, I.C.; Moldovan, O.T. Potential for Natural Attenuation of Domestic and Agricultural Pollution in Karst Groundwater Environments. Water 2022, 14, 1597. [Google Scholar] [CrossRef]
  27. Friedel, M.J.; Tindall, J.A.; Sardan, D.; Fey, D.; Poptua, G.L. Reconnaissance Study of Water Quality in the Mining-Affected Aries River Basin, Romania; U.S. Geological Survey Open-File Report; U.S. Geological Survey: Reston, VA, USA, 2008; p. 40.
  28. Fontanine, I.; Costache, R. The potential for water diffuse pollution with heavy metals in Arieș river basin. An. Stiint. Univ. Alexandru Ioan Cuza Din Iasi-Ser. Geogr. 2013, 59, 59–72. [Google Scholar]
  29. Cadar, O.; Dinca, Z.; Senila, M.; Torok, A.I.; Todor, F.; Levei, E.A. Immobilization of Potentially Toxic Elements in Contaminated Soils Using Thermally Treated Natural Zeolite. Materials 2021, 14, 3777. [Google Scholar] [CrossRef]
  30. Senila, M.; Cadar, O.; Senila, L.; Hoaghia, A.; Miu, I. Mercury Determination in Natural Zeolites by Thermal Decomposition Atomic Absorption Spectrometry: Method Validation in Compliance with Requirements for Use as Dietary Supplements. Molecules 2019, 24, 4023. [Google Scholar] [CrossRef] [Green Version]
  31. Abdel-Satar, A.M.; Ali, M.H.; Goher, M.E. Indices of water quality and metal pollution of Nile River, Egypt. Egypt. J. Aquat. Res. 2017, 43, 21–29. [Google Scholar] [CrossRef]
  32. Setia, R.; Dhaliwal, S.S.; Kumar, V.; Singh, R.; Kukal, S.S.; Pateriya, B. Impact assessment of metal contamination in surface water of SutleJ. River (India) on human health risks. Environ. Pollut. 2020, 265, 114907. [Google Scholar] [CrossRef]
  33. Tokatlı, C.; Varol, M. Impact of the COVID-19 lockdown period on surface water quality in the Meriç-Ergene River Basin, Northwest Turkey. Environ. Res. 2021, 197, 111051. [Google Scholar] [CrossRef]
  34. Directive 2008/32/EC of the European Parliament and of the Council of 11 March 2008 Amending Directive 2000/60/EC Establishing a Framework for Community Action in the Field of Water Policy, as Regards the Implementing Powers Conferred on the Commission. Available online: https://eur-lex.europa.eu/legal-content/EN/ALL/?uri=celex:32008L0032 (accessed on 15 April 2022).
  35. Order No. 161 for the Approval of the Norm Regarding the Classification of Surface Water Quality in Order to Establish the Ecological Status of Water Bodies. Available online: http://www.monitoruljuridic.ro/monitorul-oficial/161/2006-02-21 (accessed on 15 April 2022).
  36. Edet, A.E.; Offiong, O.E. Evaluation of water quality pollution indices for heavy metal contamination monitoring. A study case from Akpabuyo-Odukpani area, Lower Cross River Basin (southeastern Nigeria). GeoJ. 2002, 57, 295–304. [Google Scholar] [CrossRef]
  37. Shil, S.; Singh, U.K. Health risk assessment and spatial variations of dissolved heavy metals and metalloids in a tropical river basin system. Ecol. Indic. 2019, 106, 105455. [Google Scholar] [CrossRef]
  38. Varol, M.; Tokatlı, C. Impact of paddy fields on water quality of Gala Lake (Turkey): An important migratory bird stopover habitat. Environ. Pollut. 2021, 287, 117640. [Google Scholar] [CrossRef] [PubMed]
  39. Rezaei, A.; Hassani, H.; Hassani, S.; Jabbari, N.; Fard Mousavi, S.B.; Rezaei, S. Evaluation of groundwater quality and heavy metal pollution indices in Bazman basin, southeastern Iran. Groundw. Sustain. Dev. 2019, 9, 100245. [Google Scholar] [CrossRef]
  40. Fagbenro, A.A.; Yinusa, T.S.; Ajekiigbe, K.M.; Oke, A.O.; Obiajunwa, E.I. Assessment of heavy metal pollution in soil samples from a gold mining area in Osun State, Nigeria using proton-induced X-ray emission. Sci. Afr. 2021, 14, e01047. [Google Scholar] [CrossRef]
  41. Taylor, S.R.; McLennan, S.M. The geochemical evolution of the continental crust. Rev. Geophys. 1995, 33, 241–265. [Google Scholar] [CrossRef]
  42. Hakanson, L. An ecological risk index for aquatic pollution control.a sedimentological approach. Water Res. 1980, 14, 975–1001. [Google Scholar] [CrossRef]
  43. Varol, M.; Gündüz, K.; Sünbül, M.R. Pollution status, potential sources and health risk assessment of arsenic and trace metals in agricultural soils: A case study in Malatya province, Turkey. Environ. Res. 2021, 202, 111806. [Google Scholar] [CrossRef]
  44. Alharbi, T.; El-Sorogy, A.S. Spatial distribution and risk assessment of heavy metals pollution in soils of marine origin in central Saudi Arabia. Mar. Pollut. Bull 2021, 170, 112605. [Google Scholar] [CrossRef]
  45. Negrin, V.L.; Idaszkin, Y.L.; Domini, C.; Simonetti, P.; Botté, S.E. Soil metal pollution assessment in Sarcocornia salt marshes in a South American estuary. Mar. Pollut. Bull 2021, 166, 112224. [Google Scholar] [CrossRef]
  46. Yan, T.; Zhao, W.; Yu, X.; Li, H.; Gao, Z.; Ding, M.; Yue, J. Evaluating heavy metal pollution and potential risk of soil around a coal mining region of Tai’an City, China. Alex. Eng. J. 2022, 61, 2156–2165. [Google Scholar] [CrossRef]
  47. Kumar, V.; Pandita, S.; Setia, R. A meta-analysis of potential ecological risk evaluation of heavy metals in sediments and soils. Gondwana Res. 2022, 103, 487–501. [Google Scholar] [CrossRef]
  48. Yi, Y.; Yang, Z.; Zhang, S. Ecological risk assessment of heavy metals in sediment and human health risk assessment of heavy metals in fishes in the middle and lower reaches of the Yangtze River basin. Environ. Pollut. 2011, 159, 2575–2585. [Google Scholar] [CrossRef] [PubMed]
  49. Zhai, Y.Z.; Cao, X.Y.; Xia, X.L.; Wang, B.; Teng, Y.G.; Li, X. Elevated Fe and Mn Concentrations in Groundwater in the Songnen Plain, Northeast China, and the Factors and Mechanisms Involved. Agronomy 2021, 11, 2392. [Google Scholar] [CrossRef]
  50. Hem, J.D. Chemical Equilibria Affecting the Behavior of Manganese in Natural Water. Int. Assoc. Sci. Hydrol. Bull. 1963, 8, 30–37. [Google Scholar] [CrossRef]
  51. Howe, P.D.; Mal-Colm, H.M.; Dobson, S. Manganese and Its Compounds: Environmental Aspects; World Health Organization & International Programme on Chemical Safety: Geneva, Switzerland, 2004. [Google Scholar]
  52. Neculita, C.M.; Rosa, E. A review of the implications and challenges of manganese removal from mine drainage. Chemosphere 2019, 214, 491–510. [Google Scholar] [CrossRef] [PubMed]
  53. Zwolak, A.; Sarzyńska, M.; Szpyrka, E.; Stawarczyk, K. Sources of Soil Pollution by Heavy Metals and Their Accumulation in Vegetables: A Review. Water Air. Soil. Pollut. 2019, 230, 164. [Google Scholar] [CrossRef] [Green Version]
  54. Lu, J.; Lu, H.; Wang, W.; Feng, S.; Lei, K. Ecological risk assessment of heavy metal contamination of mining area soil based on land type changes: An information network environ analysis. Ecol. Model. 2021, 455, 109633. [Google Scholar] [CrossRef]
  55. Ministry of Water, Forest and Environmental Protection. Order, no. 184 of 21 1997 for the Approval of the Procedure for Performing Environmental Calculations. Official Publication no. 303-bis of November 6. Available online: https://legislatie.just.ro/Public/DetaliiDocument/13572 (accessed on 12 April 2022).
  56. Liu, H.; Liu, E.; Yu, Z.; Lin, Q.; Zhang, E.; Shen, J. Spatio-temporal accumulation patterns of trace metals in sediments of a large plateau lake (Erhai) in Southwest China and their relationship with human activities over the past century. J. Geochem. Explor. 2022, 234, 106943. [Google Scholar] [CrossRef]
  57. Hoaghia, M.A.; Cadar, O.; Moisa, C.; Roman, C.; Kovacs, E. Heavy metals and health risk assessment in vegetables grown in the vicinity of a former non-metallic facility located in Romania. Environ. Sci. Pollut. Res. Int. 2022, 29, 40079–40093. [Google Scholar] [CrossRef]
  58. Levei, E.; Frentiu, T.; Ponta, M.; Tanaselia, C.; Borodi, G. Characterization and assessment of potential environmental risk of tailings stored in seven impoundments in the Aries river basin, Western Romania. Chem. Cent. J. 2013, 7, 5. [Google Scholar] [CrossRef] [PubMed] [Green Version]
  59. Wu, W.; Qu, S.; Nel, W.; Ji, J. The impact of natural weathering and mining on heavy metal accumulation in the karst areas of the Pearl River Basin, China. Sci. Total Environ. 2020, 734, 139480. [Google Scholar] [CrossRef] [PubMed]
  60. Liu, W.S.; Guo, M.N.; Liu, C.; Yuan, M.; Chen, X.T.; Huot, H.; Zhao, C.M.; Tang, Y.T.; Morel, J.L.; Qiu, R.L. Water, sediment and agricultural soil contamination from an ion-adsorption rare earth mining area. Chemosphere 2019, 216, 75–83. [Google Scholar] [CrossRef] [PubMed]
  61. Butiuc-Keul, A.; Momeu, L.; Craciunas, C.; Dobrota, C.; Cuna, S.; Balas, G. Physico-chemical and biological studies on water from Aries River (Romania). J. Environ. Manag. 2012, 95, S3–S8. [Google Scholar] [CrossRef]
  62. Levei, E.; Senila, M.; Miclean, M.; Abraham, B.; Roman, C.; Stefanescu, L.; Moldovan, O.T. Influence of Rosia Poieni and Rosia Montana Mining Areas on the Water Quality of the Aries River. Environ. Eng. Manag. J. 2011, 10, 23–29. [Google Scholar] [CrossRef]
  63. Senila, M.; Levei, E.A.; Senila, L.R.; Roman, M. Preliminary Investigation concerning Metals Bioavailability in Waters of Aries River Catchment by Using the Diffusive Gradients in Thin Films Technique. J. Chem. 2015, 2015, 762121. [Google Scholar] [CrossRef]
  64. Whitehead, P.G.; Butterfield, D.; Wade, A.J. Simulating metals and mine discharges in river basins using a new integrated catchment model for metals: Pollution impacts and restoration strategies in the Aries-MuRes. river system in Transylvania, Romania. Hydrol. Res. 2009, 40, 323–346. [Google Scholar] [CrossRef]
  65. Bodoczi, A.; Carpa, R. The quantitative variation of some ecophysiological group of bacteria from Arieş River sediments affected by pollution. Carpathian J. Earth Environ. Sci. 2010, 5, 145–152. [Google Scholar]
  66. Moldovan, O.T.; Meleg, I.N.; Levei, E.; Terente, M. A simple method for assessing biotic indicators and predicting biodiversity in the hyporheic zone of a river polluted with metals. Ecol. Indic. 2013, 24, 412–420. [Google Scholar] [CrossRef]
  67. Neamtiu, I.A.; Al-Abed, S.R.; McKernan, J.L.; Baciu, C.L.; Gurzau, E.S.; Pogacean, A.O.; Bessler, S.M. Metal contamination in environmental media in residential areas around Romanian mining sites. Rev. Environ. Health 2017, 32, 215–220. [Google Scholar] [CrossRef]
  68. Suciu, I.; Cosma, C.; Todica, M.; Bolboaca, S.D.; Jantschi, L. Analysis of soil heavy metal pollution and pattern in central transylvania. Int. J. Mol. Sci. 2008, 9, 434–453. [Google Scholar] [CrossRef] [PubMed] [Green Version]
  69. Moldovan, A.; Török, A.I.; Cadar, O.; Roman, M.; Roman, C.; Micle, V. Assessment of toxic elements contamination in surface water and sediments in a mining affected area. Stud. Univ. Babeş-Bolyai Chem. 2021, 66, 189–196. [Google Scholar] [CrossRef]
  70. Corcheş, M.T. A study of the natural pollution of the Aries River. J. Agroaliment. Process. Technol. 2011, 17, 330–334. [Google Scholar]
  71. Tytla, M. Assessment of Heavy Metal Pollution and Potential Ecological Risk in Sewage Sludge from Municipal Wastewater Treatment Plant Located in the Most Industrialized Region in Poland-Case Study. Int. J. Environ. Res. Public Health 2019, 16, 2430. [Google Scholar] [CrossRef] [PubMed] [Green Version]
  72. Tytla, M. Identification of the Chemical Forms of Heavy Metals in Municipal Sewage Sludge as a Critical Element of Ecological Risk Assessment in Terms of Its Agricultural or Natural Use. Int. J. Environ. Res. Public Health 2020, 17, 4640. [Google Scholar] [CrossRef]
  73. Tytla, M.; Widziewicz, K.; Zielewicz, E. Heavy metals and its chemical speciation in sewage sludge at different stages of processing. Environ. Technol. 2016, 37, 899–908. [Google Scholar] [CrossRef]
  74. Wang, C.; Hu, X.; Chen, M.L.; Wu, Y.H. Total concentrations and fractions of Cd, Cr, Pb, Cu, Ni and Zn in sewage sludge from municipal and industrial wastewater treatment plants. J. Hazard. Mater 2005, 119, 245–249. [Google Scholar] [CrossRef]
  75. Arisekar, U.; Shakila, R.J.; Shalini, R.; Jeyasekaran, G.; Keerthana, M.; Arumugam, N.; Almansour, A.I.; Perumal, K. Distribution and ecological risk assessment of heavy metals using geochemical normalization factors in the aquatic sediments. Chemosphere 2022, 294, 133708. [Google Scholar] [CrossRef]
  76. El Fadili, H.; Ben Ali, M.; Touach, N.; El Mahi, M.; Mostapha Lotfi, E. Ecotoxicological and pre-remedial risk assessment of heavy metals in municipal solid wastes dumpsite impacted soil in morocco. Environ. Nanotechnol. Monit. Manag. 2022, 17, 100640. [Google Scholar] [CrossRef]
Figure 1. Arieș River basin. Soil classes map based on the European Soil Database (ESDAC) [24].
Sustainability 14 08024 g001
Figure 2. Location of the study area; representative tailing impoundments and urban areas. Surface-water, soil, and sediment sampling locations (Table S1).
Sustainability 14 08024 g002
Figure 3. The logarithmic distribution showing the relevant association among the studied parameters in the surface waters of the study area from the main watercourse and tributaries (A6, A11, A12): (a) major elements; (b) trace elements (without Cr, Cd, As, and Hg).
Sustainability 14 08024 g003aSustainability 14 08024 g003b
Figure 4. Total metal content distribution in surface sediments of different sampling sites in the Arieș River basin: (a) macroelements; (b) microelements.
Sustainability 14 08024 g004
Figure 5. Principal component analysis (PCA) of the surface water (a), soil (b), and sediment (c) of total metal variables in association with the sampling locations.
Sustainability 14 08024 g005aSustainability 14 08024 g005b
Figure 6. Spatial variation in the heavy-metal pollution index HPI (a) and in the heavy-metal evaluation index HEI (b).
Sustainability 14 08024 g006
Figure 7. Spatial distribution of the contamination degree (Cd), the pollution load index (PLI), and the potential ecological risk index (PERI): (a) for soil samples; (b) for sediment samples.
Sustainability 14 08024 g007aSustainability 14 08024 g007b
Table 1. The main tailing impoundments located in the Arieș River catchment and the water courses associated with the main mining sites.
Mining SitesDeposit TypeTailing
Pond
Associated Water Course
Roșia MontanăAu, Ag and Cu oresSeliște (TP1)Abrud River
Gura Roșie (TP2)Roșia Rivulet
Roșia PoieniPorphyritic CuȘtefanca (TP3)Ștefanca Valley
Șesei (TP4)Șesei Valley
Table 2. Summary statistics (minimum—Min, maximum—Max, mean values—Mean, standard deviation—SD, coefficient of variation—CV, and normality test—NT) of metal concentrations in the water samples (mg/L) of the Arieș River.
Surface WaterFeNaMgKCaNiCrCuZnCdPbMnAlAsHg
mg/L
Min0.012.472.550.6423.70.02-0.020.02-0.010.030.060.001-
Max8.7321.418.314.72190.14-0.214.220.050.1522.422.80.003-
Mean0.449.106.003.0863.660.04-0.040.370.020.051.621.160.002-
SD1.855.333.763.1048.040.03-0.041.110.020.045.384.720.001-
CV4.240.590.631.010.750.91-0.992.971.070.703.324.060.42-
NTRN *RNRNRNRNRN-RNRNRNRNRNRNRN-
SoilFeNaMgKCaNiCrCuZnCdPbMnAlAsHg
mg/kg
Min5296.9967205231622.516.522.492.4-19.561.17430.0720.10
Max11,3625782547316411,84210564.4512612-308122819,7970.8241.51
Mean947521621351912674943.136.7127242-6277912,5900.240.30
SD248413336472736622213124145-7429455200.170.37
CV0.260.620.170.380.540.520.350.970.60-1.190.380.440.701.23
NTRN CRN *RNCRNRNRN CRNRNRN-RNCRNCRNRNRN
SedimentFeNaMgKCaNiCrCuZnCdPbMnAlAsHg
mg/kg
Min31448.341211213677.088.227.2215.60.035.2210631063.110.02
Max598220719131950830841.625.51271542.092.6512802240.70.91
Mean51651171229848315517.315.858.372.70.4720.3290.4605410.70.16
SD13165528853419288.945.739420.692311413328.700.22
CV0.250.470.230.630.610.520.360.660.581.471.140.390.220.811.39
NTRN *CRNRNCRNRNRNCRNCRNCRNRNRNCRNCRNRNRN
RN *—reject normality, p-value ≥ 0.05; CRN *—cannot reject normality, p-value ≤ 0.05.
Table 3. Average metal content in water, soil, and sediment in the Arieș River basin, based on previous studies.
MatrixElementReference
FeAlMnNiCuPbAsCdCrZnCaKMgNa
Water
(mg/L)
--7.67-0.28-----46.92.266.767.16[20]
0.298---0.0001---------[61]
0.1240.0910.1430.0620.0930.1020.0030.0260.036 0.04456.02.966.997.77[23]
1.311-0.1330.0130.0630.028-0.014-0.03820.11.02.62.8[62]
0.751-1.54-0.352----0.145----[63]
----0.4720.002-0.0590.1555.33----[64]
----0.0130.001---0.154----[65]
1.390.65--0.040.02---0.23----[66]
Soil
(mg/kg)
-----104114<0.000822.1-----[67]
----44.1116--42.2-----[68]
Sediment
(mg/kg)
17,630 15,708 84225.416025.914.60.82720.8224573822147491175[22]
----33865.941.91.71-366----[27]
---15551.245.712.90.61051.733.20----[69]
Publisher’s Note: MDPI stays neutral with regard to jurisdictional claims in published maps and institutional affiliations.

