Article

A Real-Time Control Strategy for Bus Operation to Alleviate Bus Bunching

1
School of Transportation Engineering, East China Jiaotong University, Nanchang 330013, China
2
School of Transportation, Southeast University, Nanjing 210096, China
3
Jiangxi Institute of Transportation Sciences, Nanchang 330200, China
4
College of Architecture and Civil Engineering, Beijing University of Technology, Beijing 100124, China
*
Author to whom correspondence should be addressed.
Sustainability 2022, 14(13), 7870; https://doi.org/10.3390/su14137870
Submission received: 21 May 2022 / Revised: 22 June 2022 / Accepted: 25 June 2022 / Published: 28 June 2022

Abstract

:
In order to alleviate bus bunching and improve the balance and punctuality rate of bus operation, a single-line real-time control strategy based on Intelligent Transportation System (ITS) was proposed. The strategy took three measures: controlling the cruising speed, dwell time, and the bus load rate to improve the stability of bus operations and to ensure its running speed. At the same time, the proposed strategy was compared with the literature on the traditional single-point control strategy based on timetable (S1 for short) and the multi-point control strategy based on time headway (S2 for short). Finally, the No. 245 bus line in Nanchang City, China, was selected as a case. It was modeled and simulated by Python programming software, and the control effects of the three control strategies were analyzed. Compared with the uncontrolled bus operations, the simulation results show that: under the control of S1, the bus operation stability is improved, but the bus operation efficiency is reduced; under the control of S2, the problem of S1 operation efficiency reduction can be solved, and the operation stability can be improved at the same time to achieve the effect of preventing bunching. For the real-time control strategy (S3 for short), the average bus travel time is the smallest, the distance between the buses is maintained the best, and the running stability is also the best, which avoids the bus bunching to the greatest extent. Among them, the average travel time is reduced by about 34% compared with the second strategy. This study provides a theoretical basis and strategy reference for bus operators to ensure balanced bus operation.

1. Introduction

As a large-capacity, low-energy, low-emission, and high-efficiency mode of transport, public transport plays an extremely important role in urban sustainable transport systems [1]. The regular urban bus is an important part of public transport, and its service level largely influences the travel choices of residents. However, the current pace of development and service levels of urban public transport systems do not yet well meet the demand for large-scale urban travel needs. Bus delay and unpunctuality occur frequently, especially during peak traffic hours, which reduces the willingness of travelers to choose bus travel and is not conducive to the sustainable development of public transport.
The failure of the bus system operating plan is mainly reflected in the occurrence of bus bunching [2]. Improving the stability of bus operation and ensuring its punctuality rate can reduce bus travel time, thereby improving the attractiveness of bus [3]. How to reduce the delay of bus travel and effectively prevent the occurrence of bus bunching, so as to ensure the attractiveness of bus trips, is an important issue that has always been of concern in the field of bus operation management and control.
In the 1960s and 1970s, some scholars began to realize that if the regular bus could not run on time according to the timetable, the instability of the bus would further increase due to the change in number of passengers at the stops. Newell et al. [4] were the first to analyze the internal mechanism of bus bunching. Since then, many researchers have studied a variety of control strategies for the problem of bus bunching. The early control strategies were based on the static bus holding control with timetable or time headway, and Osuna and Newell [5], Barnett [6], and Abkowitz [7] are the representative researchers. There are also bus timetable studies based on the passenger arrival rate [8]. These studies only analyze single-point control and are not effective in preventing bunching control on long routes and high-frequency departure routes. In order to solve such problems, the bus control strategies have also shifted from single-point control to multi-point control based on time headway, or combined control methods. He [2], from the front headway, as well as Daganzo et al. [9,10], analyzed the stability of headway by adjusting the speed or setting the dwell time from the perspective of rear headway and bi-directional headway. Nesheli et al. [11] established a “library” of bus scheduling strategies. Through the combined application of multiple scheduling strategies, the probability of collaborative transfer was increased while reducing bus bunching. In China, research on bus bunching started late, but has been extended and further explored based on existing research. Zhang et al. [12] compared six typical formation processes of bunching, summed up the three main causes of bunching, and built a predictive model. Zhang et al. [13] established an integrated optimization model of vehicle speed guidance and bus signal timing to achieve dynamic scheduling of bus vehicles. Huang et al. [14] used a dynamic scheduling strategy combining bus holding control and flow restriction strategies to reduce the occurrence of bus bunching.
The above bus holding control strategies can avoid bus bunching, but often at the cost of lost passengers’ time. With the development of intelligent transportation and the widespread use of real-time data, dynamic control strategies based on real-time information research have attracted more and more attention. Vehicle speed control is one of the research hotspots. Chandrasekar et al. [15] first studied the impact of speed control on public transport systems and built a bus operation model on the simulation software Parallel Microscopic Simulator (PARAMICS). They analyzed the variation in indicators such as the variance of bus headway and the waiting time of passengers when travelling at different speeds under different headways and different road congestion levels. Teng et al. [16] designed a dynamic control method of interval speed guidance based on the headway deviation threshold of bus vehicles. In addition, the real-time control models based on the ITS environment in different situations have also been systematically studied, including fixed lines, bus rapid transit (BRT) lines, and bus hubs [17,18,19]. When the road is congested, under the influence of the complex traffic environment, the bus driver may not be able to accelerate to catch up with the recommended required or optimal speed. Hu et al. [20] developed an integrated dynamic simulation-assignment model, DynaTAIWAN, under mixed traffic flow conditions, and studied the effect of real-time information on mixed traffic flows including cars, buses, motorcycles, and trucks. Ismail et al. [21] considered mixed traffic lanes, dedicated traffic lanes, and a mixture of both for bus delay analysis. Bhattacharyya et al. [22] proposed to implement bus priority with a queue jump lane and pre-signal in mixed traffic flows, especially near intersections.
With the application of Internet of Vehicles (IV) technology in ITS, the real-time control of public transport has been further improved, which is also a current research hotspot. In order to reduce the waiting time of passengers, Asgharzadeh et al. [23] proposed a mathematical model to determine the optimal holding time and established a real-time control strategy for the optimal station time. Holds are applied at one or several control points to minimize passenger waiting time while maintaining the highest possible frequency, i.e., using no buffer time. Berrebi et al. [24] proposed a real-time holding mechanism to dispatch buses on a loop-shaped route using real-time information. Later, Berrebi et al. [25] evaluated the performance of each holding method in terms of headway instability and mean holding time. In other respects, Guler et al. [26] used IV technology to obtain information such as vehicle position and speed and applied them to signal intersection control, which significantly reduced the average delay at the intersection. Wang et al. [27] proposed a bus adaptive priority (ABP) model based on IV technology, where a virtual dedicated lane was set up for ordinary buses, a phase was inserted, and bus signal priority control was established to enable buses to pass through the intersection in a short time, thus achieving bus priority.
Empirical validation is necessary before the real-time control strategies described above can be implemented, but many researchers and developers in the field cannot afford real cars and corresponding sensors. Therefore, some autonomous driving software and matching simulators have been researched and developed one after another. Feng et al. [28] investigated control strategies of intersections in the context of IV and autonomous driving, and signal optimization was modeled as a dynamic programming (DP) problem to minimize vehicle delays. Dosovitskiy et al. [29] introduced CARLA, an open-source simulator for autonomous driving research that supports development, training, and validation of urban autonomous driving systems, and also provides open digital assets (urban layouts, buildings, vehicles). Since there is no modern bus model in the CARLA simulator, it is not possible to simulate autonomous driving on a bus or the scenarios interacting with buses. Thus, Xiang et al. [30] built a bus model in 3ds Max software and imported it into CARLA to fill this gap. Rong et al. [31] introduced the LGSVL simulator, a high-fidelity autonomous driving simulator. The simulator engine provides an end-to-end, full-stack simulation that can be connected to the free and open-source autonomous driving software Autoware and Apollo.
From the literature research above, it can be seen that the existing research results on prevention and control of bus bunching are all to improve bus service level, they mainly aim at punctuality and running stability of buses, and most of them only consider bus cruising speed or dwell time. While considering both, the impact of bus load rate on bus bunching is rarely analyzed. Therefore, this paper proposes a real-time dynamic control strategy that considers the three aspects of bus cruising time, dwell time, and bus load rate at the same time. The purpose of this strategy is to ensure the balanced operation of buses on the route, thereby preventing the occurrence of bus bunching, and reducing bus delays. In order to show the control effect of the control strategy, the proposed strategy was simulated and compared with the traditional control strategies of Daganzo’s [9] control theory (single-point control based on timetable and multi-point control based on headway). The three control strategies are simulated and analyzed based on the actual survey data by Python programming software. The control effects of the three strategies are compared from the point of view of the moment when the bus on route first appears in bunching, the average travel time, and the instability parameter (headway deviation).
The research structure is arranged as follows: Section 2 models the bus operation status without taking control measures and describes the time status of bus operation; three anti-bunching control strategies are established in Section 3; Section 4 is a case study, in which the No. 245 bus line with high-frequency departures in Nanchang City, China, is taken as an example. At the same time, the operation stability, space-time distribution of buses, and the shortest distance between buses are compared and analyzed. Finally, Section 5 summarizes the research results and proposes future research prospects.

2. Bus Operation Model without Control Strategy

Bus lines with high-frequency departure and large passenger flow have attracted the attention of many researchers. This type of bus line is not stable, and bus bunching occurs frequently. Newell et al. [4] were the first to analyze the mechanism of bunching. When the bus in front falls behind the plan and is delayed at the stations, it will shorten the headway between the bus and the bus behind. At the same time, the delayed time will inevitably accumulate more passengers at the latter station, so that the service time of the next station will increase and continue to shorten the time headway between the bus and the latter bus, which will eventually lead to the phenomenon of bus bunching.

2.1. Bus Operating Rules

This study discusses a single bus route that operates on a regular timetable. According to the theory of Daganzo’s [9] research, the bus timetable is defined by the arrival moment of the bus at the control point. The expression of the timetable is as follows:
t n , s + 1   =   t 0 , 0   +   n H   +   0 s p i n , s   =   0 , 1 , 2 ,
where t n , s + 1 is the planned arrival time of bus n at stop s + 1; H is the service headway of the bus; and p i is the expected travel time of the bus from stop i to i + 1.
When in a stable environment, irrespective of random variables, the planned travel time p i can be equated to the average travel time c i (including stopping time). Therefore, the bus operating schedule can be simplified as follows:
t n , s + 1   =   t n , s   +   c s
Since the real traffic environment is unstable, it is influenced by the demand and number of passengers and internal and external factors of traffic. These factors can cause random disturbances to the bus line, it generates random disturbances to the bus line. The random noise parameters generated by the disturbances are labelled as v n , s , and denoted as noise from stop s to s + 1; the errors generated by the disturbances are noted as ε n , s :
ε n , s   =   a n , s     t n , s
where a n , s refers to the moment when the nth bus actually arrives at stop s. When the headway changes, passengers’ demand for service also varies, so the uncontrolled average travel time of the bus from stop s to s + 1 is noted as μ n , s . We assume that the average travel time is approximately linear in time headway, then the expression for μ n , s is
μ n , s     c s   +   β s h n , s     H
where h n , s is the time headway between bus n and n − 1 arriving at stop s, and at this time h n , s   =   a n , s     a n 1 , s ; β s is a dimensionless parameter that represents the value-added factor of the bus delay due to an increase in headway per unit, and β s     0 . In general, passengers get off the bus more quickly, so the increased bus delay depends mainly on the time of boarding passengers. The parameter β s can be estimated empirically from bus driving records and usually takes a value between 10−2 and 1, the size of which depends on passenger demand and the length of the road segment interval.
The actual travel time from stop s to s + 1 is assumed to be U n , s ; the noise term v n , s has a mean value of 0 and a variance of σ s 2 , which are independent of the time headway. Combined with Equation (4), the actual travel time of the uncontrolled bus is expressed as follows:
a n , s     a n , s 1 + U n , s 1   =   a n , s 1   +   c s 1   +   β n , s 1 h n , s 1     H   +   v n , s

2.2. Bus Operation Evaluation

At the line level, bus operation evaluation mainly focuses on bus operation efficiency and stability. In terms of bus operation efficiency, Kong et al. [32] summed up the measurable evaluation indicators of bus line operation efficiency; in terms of bus operation stability, the classic analysis method is to use the variance of vehicle running time to reflect the overall line operation fluctuation degree. Yan et al. [33] used the mean absolute error of the headway of the bus and the departure interval to evaluate the reliability of the whole bus. Zhang [34] proposed three evaluation methods for the stability of conventional bus operation from the two evaluation levels of line and station, punctuality and stability, and carried out demonstrations in multiple cities.
This study focuses on evaluating the stability of bus line operation in terms of the deviation between the actual headway and the service headway between vehicles on the bus line. The headway deviation is σ h 2 , and the formula is shown below.
σ h 2   =   1 N     1 n = 1 N s = 1 M ( h n , s     H H ) 2
where N is the total number of departures of a bus line; M is the total number of bus line stops. The right-hand side of the formula divided by H is to eliminate the influence of the scale in different evaluation systems.

3. Control Strategies of Preventing Bus Bunching

The purpose of this study is to alleviate the occurrence of bus bunching, improve the stability of bus operation, and achieve the effect of balanced bus operation.

3.1. Single-Point Control Based on Timetable

In order to solve the problem of bus bunching, bus establishments generally add slack variables to the timetable and require each bus to depart at the control point on time. The slack variables can compensate for the loss of time due to random disturbances between control points. In order to ensure that the bus can reach the control point at the scheduled time, the standard deviation of at least four noise terms is added as delay compensation, that is, p s     c i   +   4 σ i . Traditional control strategies hold that the fewer control points, the less delay will be generated. The bus schedule can be expressed as follows:
t n , s + 1   =   t 0 , 0   +   n H   +   0 s p i n , s   =   0 , 1 , 2 ,
where p i is expressed as the expected travel time from stop i to i + 1. When the four noise standard deviations σ are added as delay compensation, the bus travel timetable is expressed as
t n , s + 1   =   t 0 , 0   +   n H   +   0 s c i   +   4 σ i n , s   =   0 , 1 , 2 ,
It is easy to conclude that even if this control strategy can ensure that the bus runs according to the schedule, the operating efficiency of the bus will be greatly reduced, especially when the passenger flow is high and there are many intersections. When these situations occur, the standard deviation σ of noise will become very large, seriously affecting the bus running efficiency.

3.2. Multi-Point Control Based on Time Headway

The single-point bus schedule control prevents bus bunching by increasing the slack time at control points, which increases the total delay in bus operations and loses the travel time of passengers. In order to improve the efficiency of bus operations and reduce the increased delays to compensate for bunching, S2 is established by adjusting the vehicle operating speeds between control points. This strategy considers only the running situation of two adjacent vehicles, and when the rear vehicle is delayed, makes the bus speed up, and otherwise slow down. The bus n of S2 adds a delay parameter D n , s of headway in the timetable. At this time, the actual arrival time of the uncontrolled vehicle is expressed as:
a n , s + 1   =   a n , s   +   U n , s   +   D n , s
To counteract the attraction between adjacent buses, we define the delay term as follows:
D n , s   =   d s   +   g s ( H     h n , s )
where d s represents the average delay of the bus in the balanced operation state, d s     0 , and g s represents the control sensitivity, g s     β s . It should be noted that in the equilibrium operation state, the bus arrival time should satisfy p s   =   c s   +   d s . At this time, g s     1   +   β s , that is, g s     ( β s , 1   +   β s ) .
Introducing the parameter α such that α     ( 0 , 1 ) , the delay based on headway can be expressed as
D n , s   =   d s   +   ( α   +   β s ) ( H     h n , s )
It is important to be clear: all the above constants are non-negative. When using σ h s 2 to represent the variance of the headway of the bus, the constants should satisfy that d s     3 ( α   +   β s ) σ h s .
Combining Equations (5), (9) and (11), the dynamic formula for the deviation of the actual bus operation from the bus schedule is deduced, and the following is obtained:
a n , s + 1   =   a n , s   +   c s   +   d s   +   α ( H     a n , s   +   a n 1 , s )   +   v n , s + 1
The planned equilibrium running time of the bus satisfies the following formula: t n , s + 1   =   t n , s   +   c s   +   d s , H     t n , s   +   t n 1 , s   =   0 . Recording the actual bus arrival time as a n , s and the deviation of the planned equilibrium running time t n , s as ε n , s , and combined with Equation (12), the following formula is obtained:
ε n , s + 1   =   ( 1     α ) ε n , s   +   α ε n 1 , s   +   v n , s + 1 n   =   1 , 2 , ; s   =   0 , 1 , 2 ,
where ε 0 , s   =   0 ; at this time s = 0, 1, 2, …, and ε n , 0   =   0 .
The variable f j is introduced, where j     ( , ) , f 0   =   1     α and f 1   =   α , all others are 0, and when n   <   0 , then ε n , s   =   0 ;   v n , s   =   0 , so that deviation Equation (13) can be reduced to
ε n , s + 1   =   j = f n j ε j , s   +   v n , s + 1 n   =   1 , 2 , ; s   =   0 , 1 , 2 ,
The first item on the right side of the equal sign in Equation (14) is the convolution form, and the convolution operator is represented by “*”; then, the deviation can be written as:
ε s + 1   =   f     ε s + v s + 1 s   =   0 , 1 , 2 ,
where f and εs denote the convolution variable functions, and f belongs to the probability density function of Bernoulli random variables, which has the mean μ   >   0 and variance σ 2     ( 0 , ) of the probability mass function of non-negative random variables.
Denoting the original function of f by F, the formula for the delay term is:
D n , s   =   d s   +   ( F 0   +   β s ) ( H     h n , s )   +   j = 1 F j ( H     h n j , s )
of which h n , s   =   H   +   ε n , s     ε n 1 , s ,   n     Z + .

3.3. Real-Time Control

With the rapid development of ITS, real-time control of buses has become a reality and also offers new possibilities for real-time controlling of bus line operations. In this paper, S3 improves the stability of bus operations and guarantees the speed of bus journeys by three aspects.
First, it controls the normal cruising speed of the bus. In general, the instantaneous speed of the bus is more related to the road conditions and the driver. When the traffic density on the road is high, the speed of the bus is mainly affected by the speed limit of the surrounding traffic. When the traffic density on the road is low, the speed of the bus is mainly related to the control of the driver. Usually, drivers are at the higher speed that they can achieve, unaffected by the operating status of other buses. If the instantaneous speed of a bus in its normal state is restricted by appropriate restrictions, buses that are lagging behind can catch up in time to reduce the occurrence of bunching.
Secondly, it controls the bus dwell time. When the bus is unable to reach the control requirement at maximum speed, the possibility of bunching is reduced by slowing down or stopping other buses.
Finally, it controls the load rate of the bus to reduce bus passenger boarding time and reduce passenger boarding delay.

3.3.1. Model Assumptions

In order to simplify the complex environment of the bus operating process, the following assumptions were made for the specific implementation of the model:
  • The bus route is a continuous idealized closed loop. The number of closed-loop bus vehicles running is N and the number of stops is M.
  • Negligible vehicles stopping time at stations to open and close doors.
  • Buses and drivers receiving and transmitting information and their performance are effectively synchronized during the bus operations process.
  • The departure interval between the bus and the preceding vehicle is the optimum headway of the bus to be controlled.
  • The information required for real-time bus control is obtained in real time through the Bus Information Management System (BIMS). The driver is able to control the operation of the bus at the desired travel speed.
Among them, the three information platforms of the BIMS in S3 are applied to collect, process, and release information, respectively. The information processing of each platform is shown in Figure 1.

3.3.2. Model and Solution

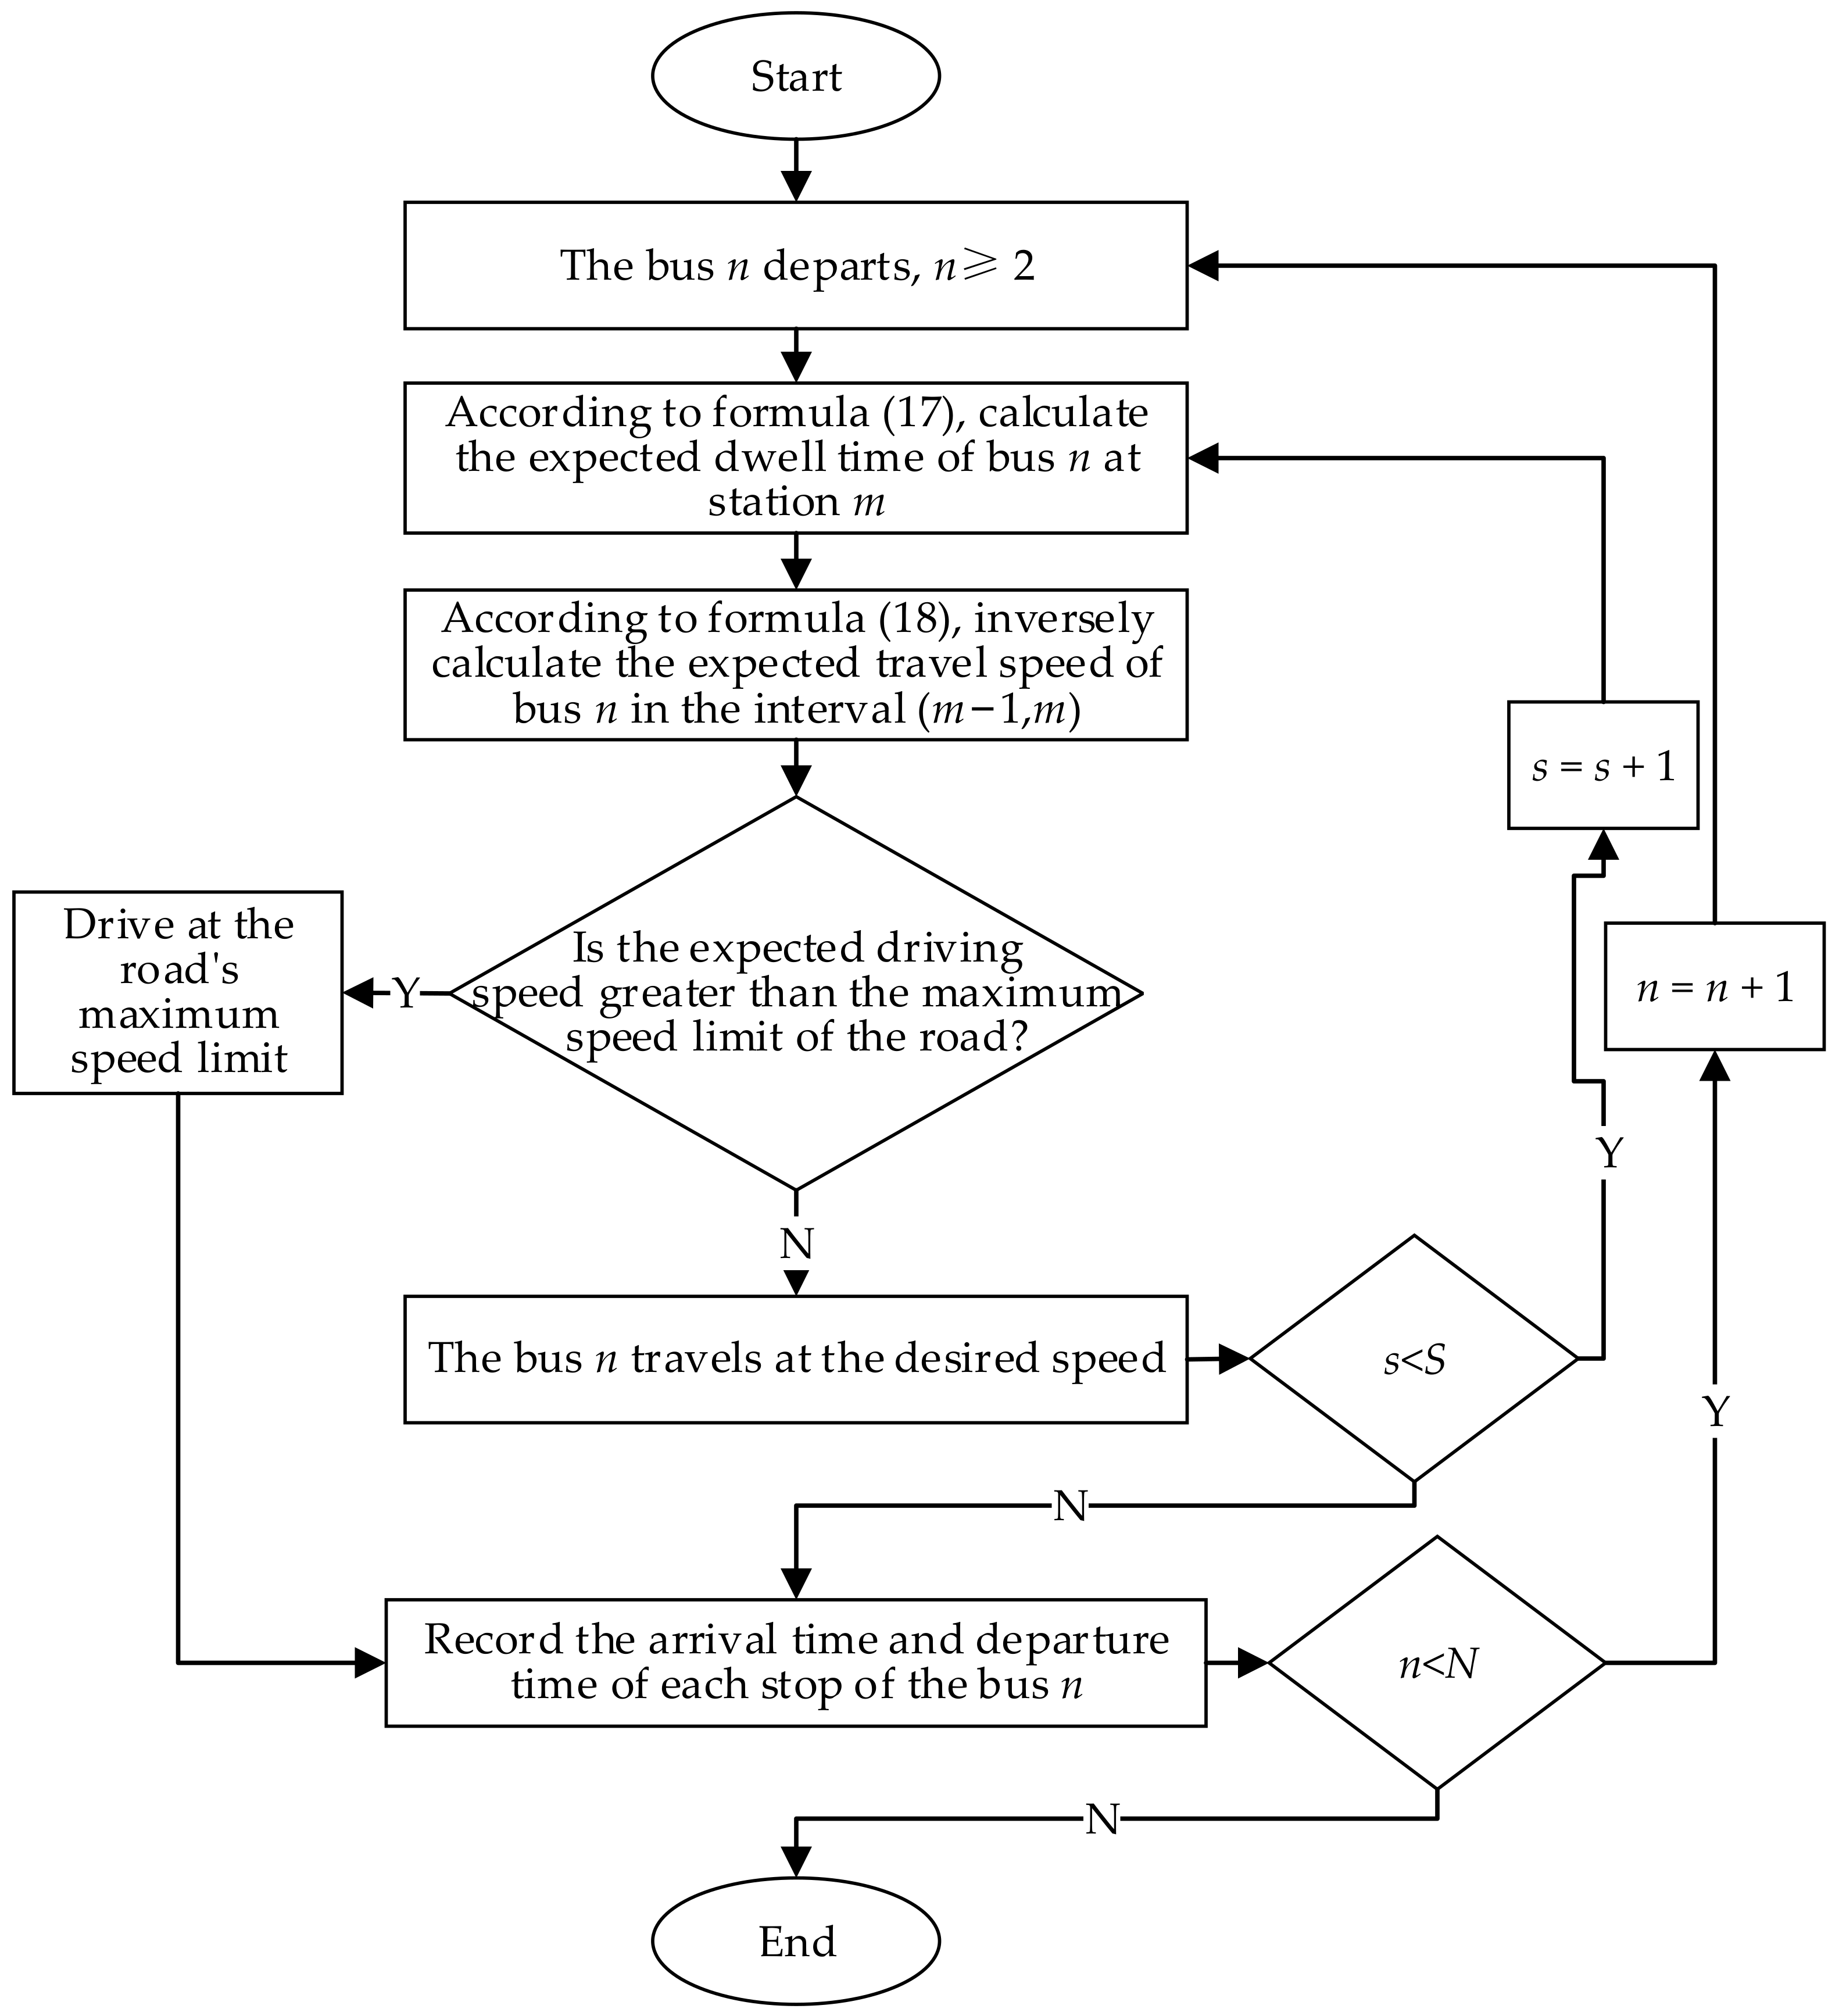
In S3, traffic information is collected in real time and uploaded to the BIMS. After the information is processed, the ideal operating speed of the bus vehicle is back-calculated and sent to the driver for execution simultaneously. The model is established as follows.
Due to the passengers at the stops being restricted, the boarding time is much greater than the alighting time; therefore, only the boarding time is considered in the continuous equation of S3. This control defines the stopping time of bus n at stop s as the sum of the passengers’ boarding time and the ticket purchasing time.
T n , s   =   H λ s n r a
where T n , s is the dwell time of bus n at stop s; λ s n denotes the arrival rate of bus n passengers at stop s; r a is the average boarding time of unit passenger taking bus n at stop s, corresponding to the following Equation (22). According to the relationship between the bus dwell time and passengers getting on and off the bus in [35], the simulation result is fitted, then r a conforms to the following relationships: when the bus load rate q/Q is less than 0.65, the passenger unit boarding time is 2 s; when the load rate is greater than 0.65, the passenger unit boarding time is 2.7 tan(q/Q) s. Among them, q represents the number of passengers in the bus, and Q refers to the rated passenger capacity of the bus.
The distance from bus stop s − 1 to s is denoted as L s 1 , s . Based on the optimal headway and the bus dwell time at the stop, the desired travel speed of the bus between stops can be calculated.
V s 1 , s   =   L s 1 , s T n , s   +   H
Based on Equation (18), the bus travel time between stops can be calculated. The travel time T s 1 , s n of bus n between bus stop s − 1 and s can be expressed as:
T s 1 , s n   =   L s 1 , s V s 1 , s
By analyzing the operation process of the bus line, the bus starts from the first station, travels between bus stations, stops for boarding and alighting passengers at bus stations and departs again until it reaches the end. At this time, the departure time of bus n at stop s is recorded as T n , s o , and the calculation formula is as follows:
T n , s o   =   T n , s 1 o   +   T s 1 , s n   +   T n , s
Therefore, the predicted time headway between bus n and the preceding bus at stop s is:
h n , s   =   T n , s o     T n 1 , s o
Substituting Equations (17)–(20) into (21), we obtain:
h n , s   =   h n , s 1   +   2 ( λ s n r n , s a     λ s n 1 r n 1 , s a )
where r n , s a is the boarding time of the unit passenger taking bus n at stop s, corresponding to r a in the previous Equation (17).
Based on the above modeling process, the specific simulation algorithm flow is shown in Figure 2.
  • Controlling model parameters
The parameters of the control strategy model were compared and analyzed, and the results are shown in Table 1. Among them, “√” represents the parameters that are in the models; if the parameter symbols are the same and the meanings are different, notes are given in the Table 1.

4. Case Study

4.1. Simulation Bus Route

Due to the frequent occurrence of bunching on urban bus lines, the reliability of bus operations is reduced, which is detrimental to the sustainable development of public transport. Therefore, it is necessary and significant to control the balanced operation of buses, ensure bus punctuality, and improve operational efficiency. In this study, the No. 245 bus route in Nanchang City, China, is used as a simulation experimental route to compare and analyze the effectiveness and applicability of control strategies for preventing bunching.
By consulting the information released by the Nanchang Public Transportation Company, it can be seen that the selected No. 245 bus route starts at the Wenjiao intersection on East Yangming Road in Nanchang and ends at Honggu New Town. The total length of the route is approximately 15 km, passing through 24 bus stops, with a general trend of east-west direction. The bus route and stop numbers are shown in Figure 3. The experimental line is a suburban line (a public transportation line located in the urban area and the suburbs close to the city) and operates in three administrative districts, namely Xinjian, Honggutan, and Donghu, Nanchang City, Jiangxi Province, China. It passes through Jiangxi Science & Technology Normal University (Hongjiaozhou Campus), Jiangxi Library, Nanchang No. 3 Middle School, and other places with large traffic flow, and connects with Metro Line 1 and Metro Line 2. The operation time of the experimental line is from 06:30 to 22:00 at the first and last shifts at the Wenjiao intersection of East Yangming Road. The No. 245 bus implements a one-ticket system. The peak hour flow of passengers on this line is about 2000 pax/h. The distances and drop-off rates between bus stops are shown in Table 2.
Due to the impact of the new coronavirus epidemic, the regular buses in 2020–2022 have been greatly affected. In this case, the travel demand of residents is not representative. Therefore, this study is based on the analysis and research of the follow-up survey and station survey data during the week from 12–18 April 2019. Through the investigation, it can be seen that the average travel time of buses on the experimental line is about 40 min during the off-peak hours, 50–70 min during the peak hours, and the buses were rated to carry 80 passengers. The survey method is based on the relevant operations of the textbook Traffic Survey and Analysis by Ma et al. [36]. The details of the investigation are as follows.
  • Survey method
The follow-up survey mainly collects the door opening and closing time of vehicle stops and the number of passengers getting on and off at the station. Two investigators took the No. 245 bus from the departure station (North Wenjiao Road) for investigation. One investigator recorded the door opening time and the number of people getting on the bus at the front door; the other one recorded the number of people who got off the bus and the departure time at the back door.
The station survey mainly collected the number of passengers getting on and off at the station, the number of people in the bus, and the number of people staying at the station. Key survey sites were several major sites found in the station survey. Two people surveyed at each site: one person recorded the number of passengers picking up and dropping off and staying at the station, and the other person recorded the number of passengers in the car; for the rest of the sites, one person conducted the above investigation and records.
During the evening peak period, the unit stationing survey was conducted at 15 min intervals, and the survey yielded partial passenger arrival rates, λs (pax/min), for each station, as shown in Table 3.

4.2. Simulation Analysis

  • No control
According to the survey, the running interval of the No. 245 bus route is 5 min during peak hours, so the optimal headway of the bus is 300 s. The maximum speed of the bus is v max   =   40   km / h and the average speed of the bus is v mean   =   25   km / h .
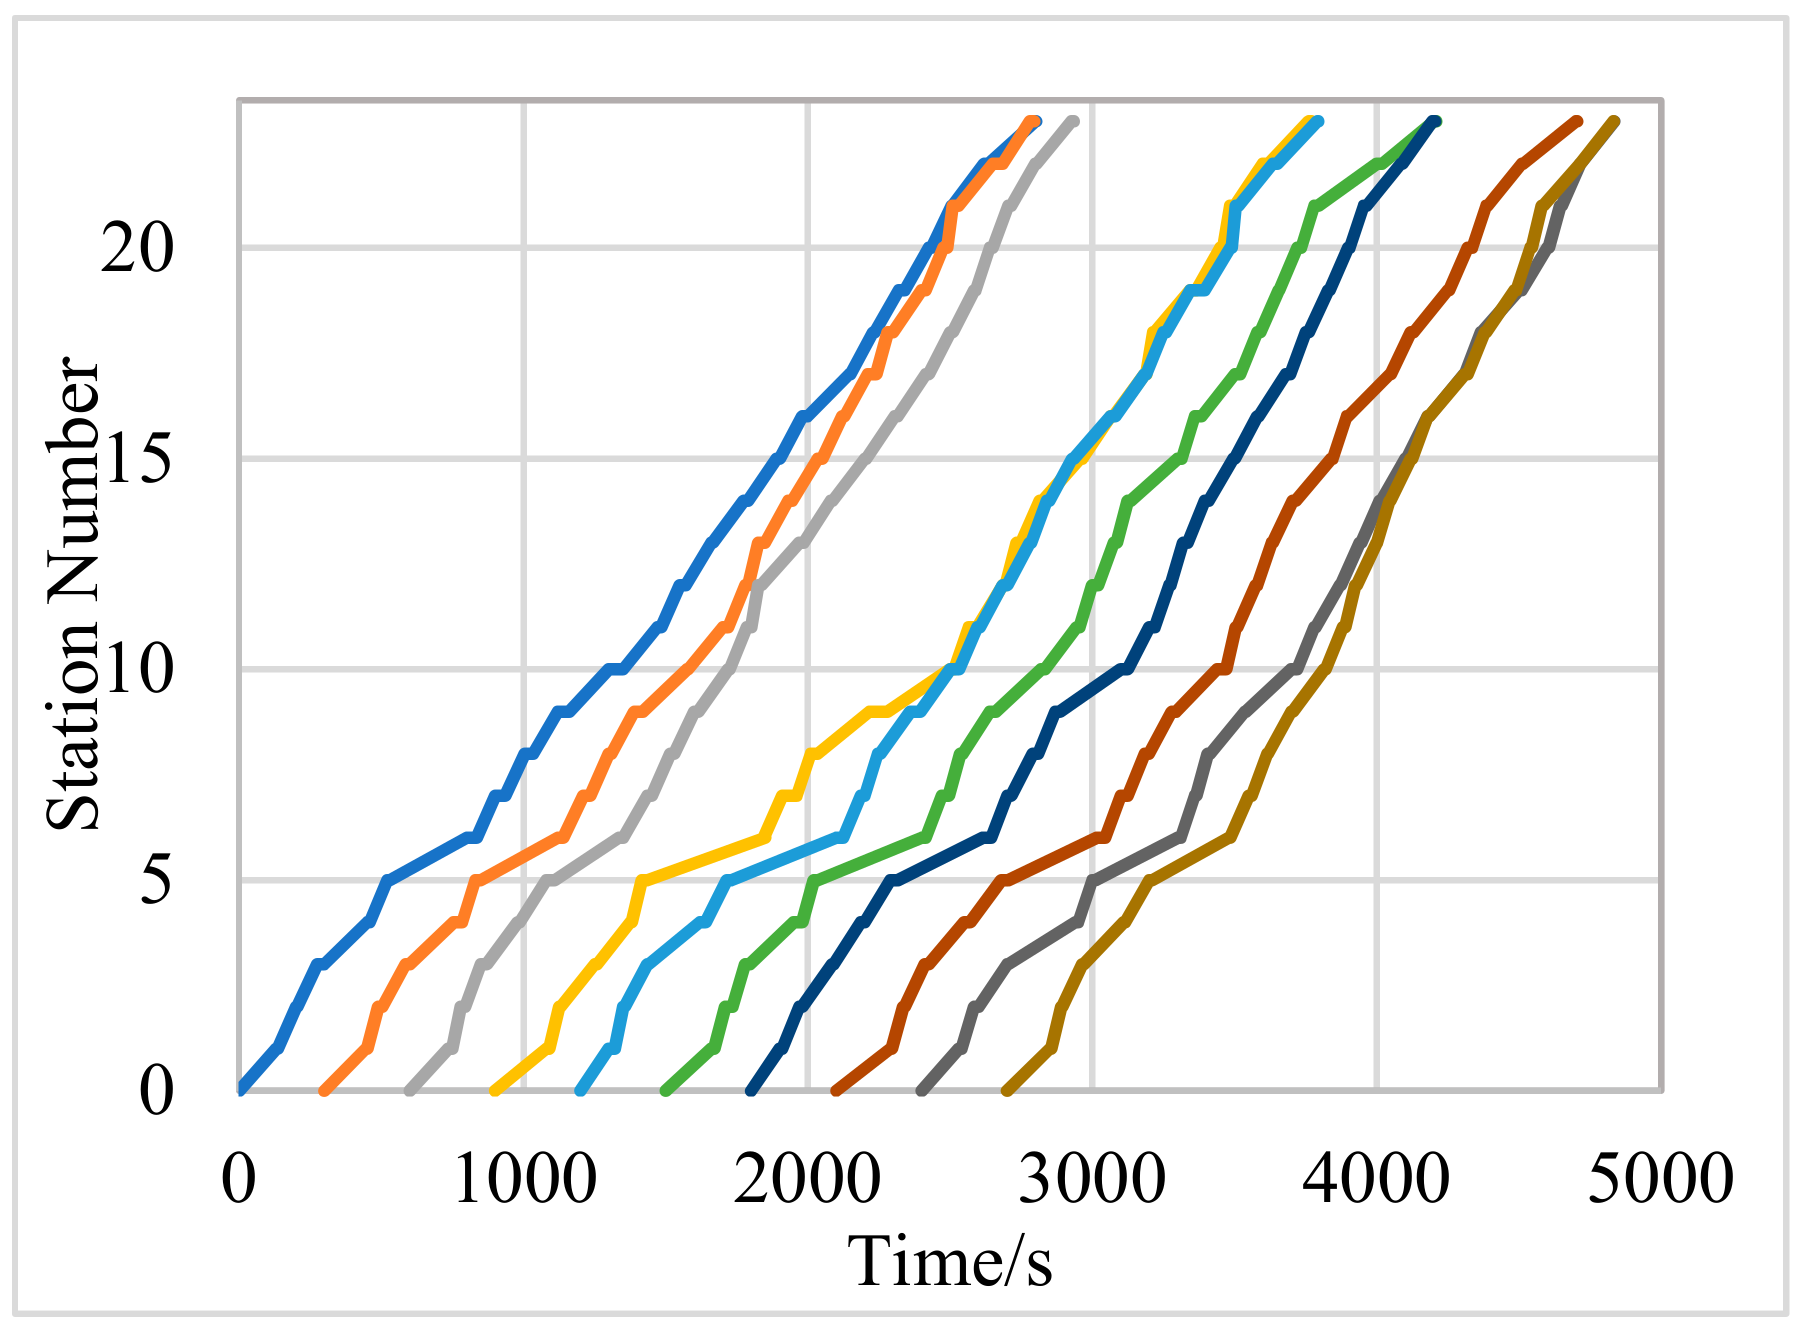
If there is no other vehicle interference on the route except the No. 245 bus, and the traffic lights at the crossings are always green, then v n , s   =   0 ,   σ n , s   =   0 . Through Python modeling and simulation, when the line is not controlled, the space-time diagram of bus operation is shown in Figure 4.
As can be seen from Figure 4, the first five stops of the No. 245 bus line vehicles run relatively evenly, and the latter stops have varying degrees of bunching. In the case of no control, the bus operation is unstable, and the instability parameter σ h   =   4.08 . The average bus travel time is 47 min, and the time for the first occurrence of bus bunching is the 27th minute.
  • S1
S1 adopts traditional schedule control and adds slack variables (four noise terms σ i ) to the schedule. The Python simulation results show that when the number of control points is 1, the bus bunching phenomenon is alleviated, but at this time the standard deviation of the noise parameter is σ s 2   =   98.5 . Therefore, the bus operation is still unstable. At this time, the bus instability parameter can be calculated to obtain σ h   =   2.58 . Under the control of S1, the space-time diagram of bus operation is shown in Figure 5. It can be seen from Figure 5 that the bus bunching phenomenon has been reduced, but the bus travel time has increased, so that the average travel time has increased by about 3 min compared to no control. When the number of control points is three, the instability parameter σ h   =   8.87 is obtained and the bus’s first bunching time is the 28th minute. However, due to the addition of the compensation term at the control points, the bus dwell time at the control point has increased. Therefore, the bus travel time of the experimental line increases, and the average travel time is 56 min. When the number of control points is five, the bus bunching does not occur and the average travel time is 64 min, which is an increase of 17 min compared with the single-point control based on the timetable, and the average travel time increases by 36%.
  • S2
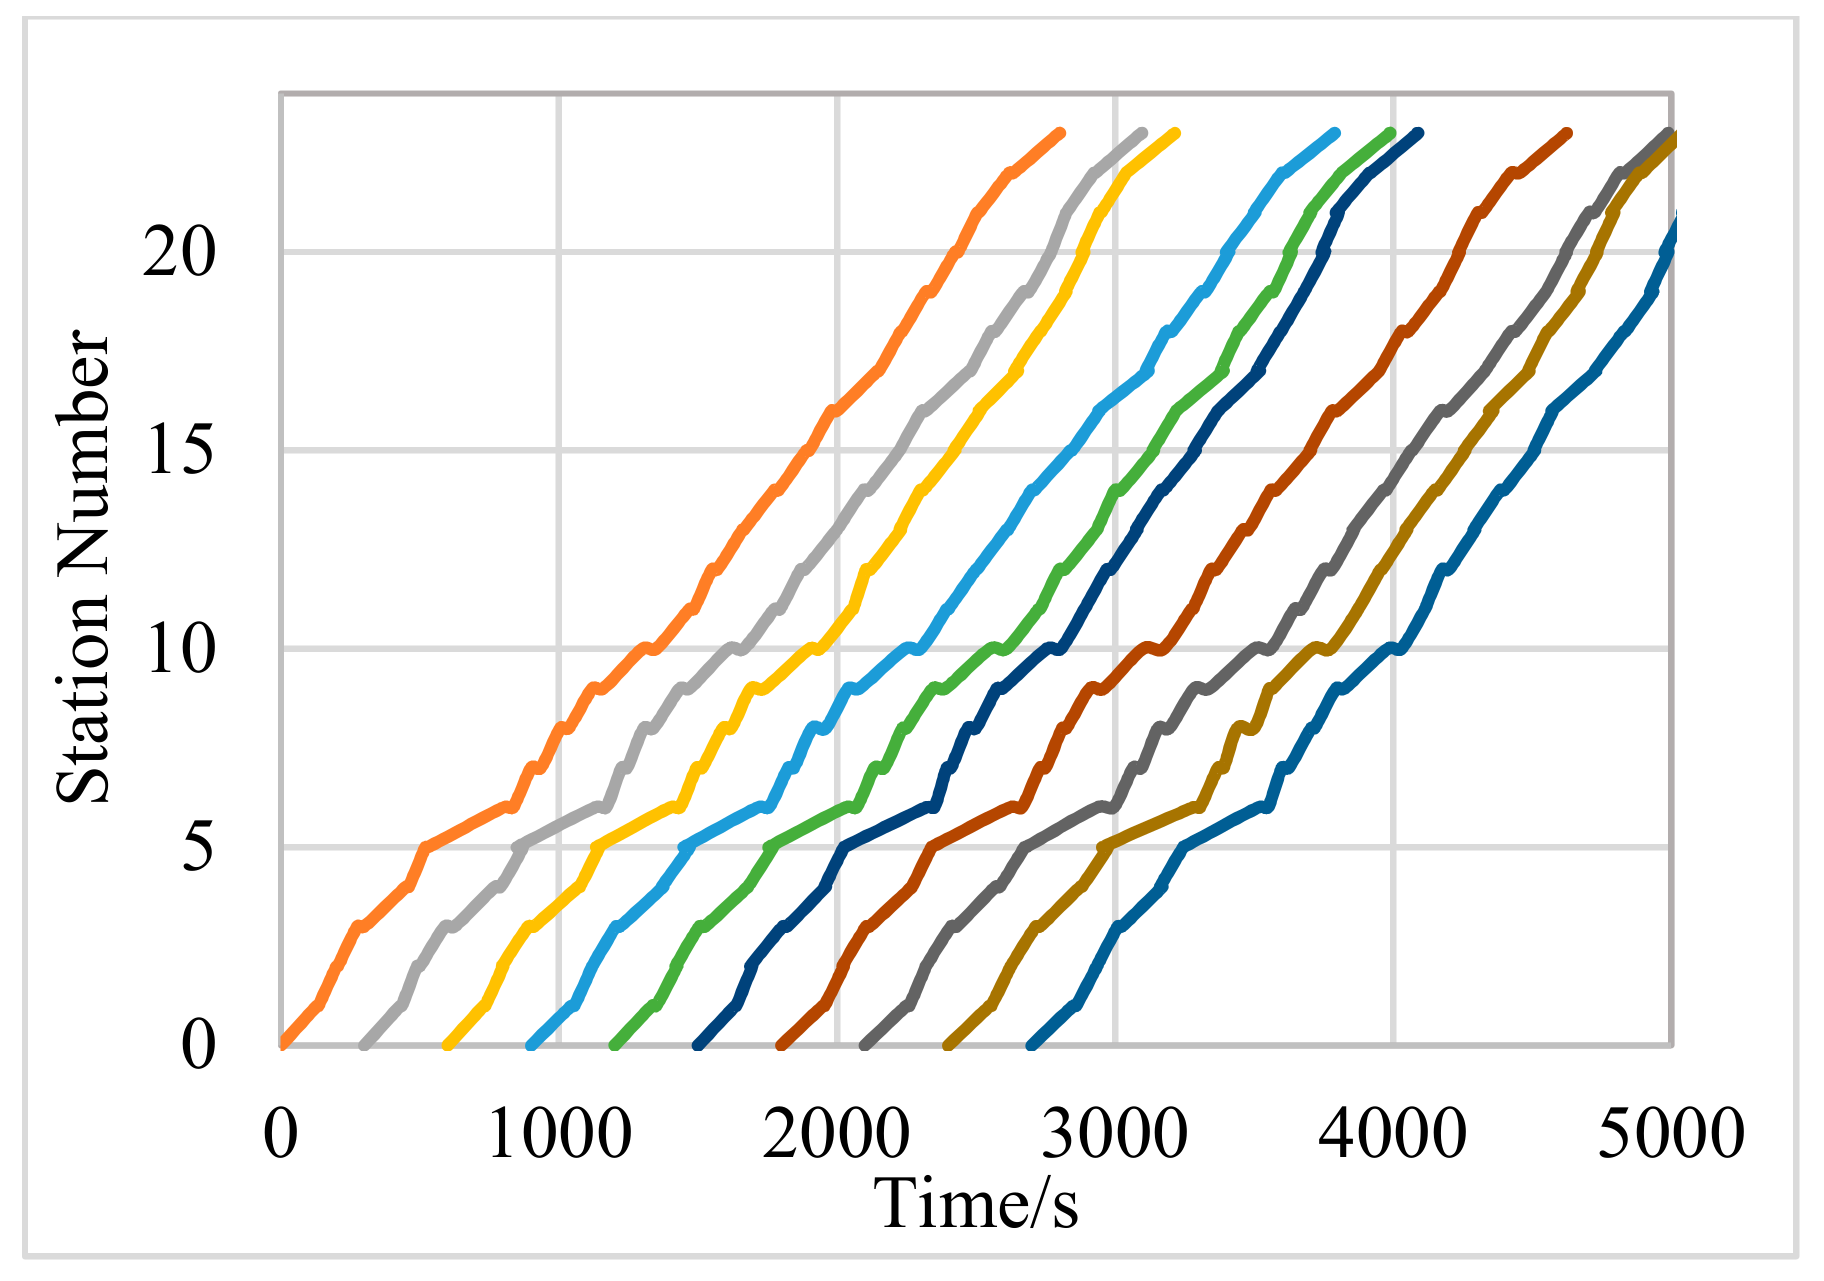
Based on the multi-point control of time headway, five control points were set for the whole route, and the compensation term based on time headway was added. The simulation obtained the running space-time diagram of the buses, as shown in Figure 6. From Figure 6 and the calculation, it can be seen that the average stability of bus operation is improved under the control of S2, and the parameter value is σ h   =   0.47 . At the same time, there is no bunching in the buses in operation, and the average travel time is 53 min. Compared with S1, S2 reduces the average travel time of buses by 11 min, which solves the problem that the operating efficiency of buses decreases when the number of control points is increased under the timetable control.
  • S3
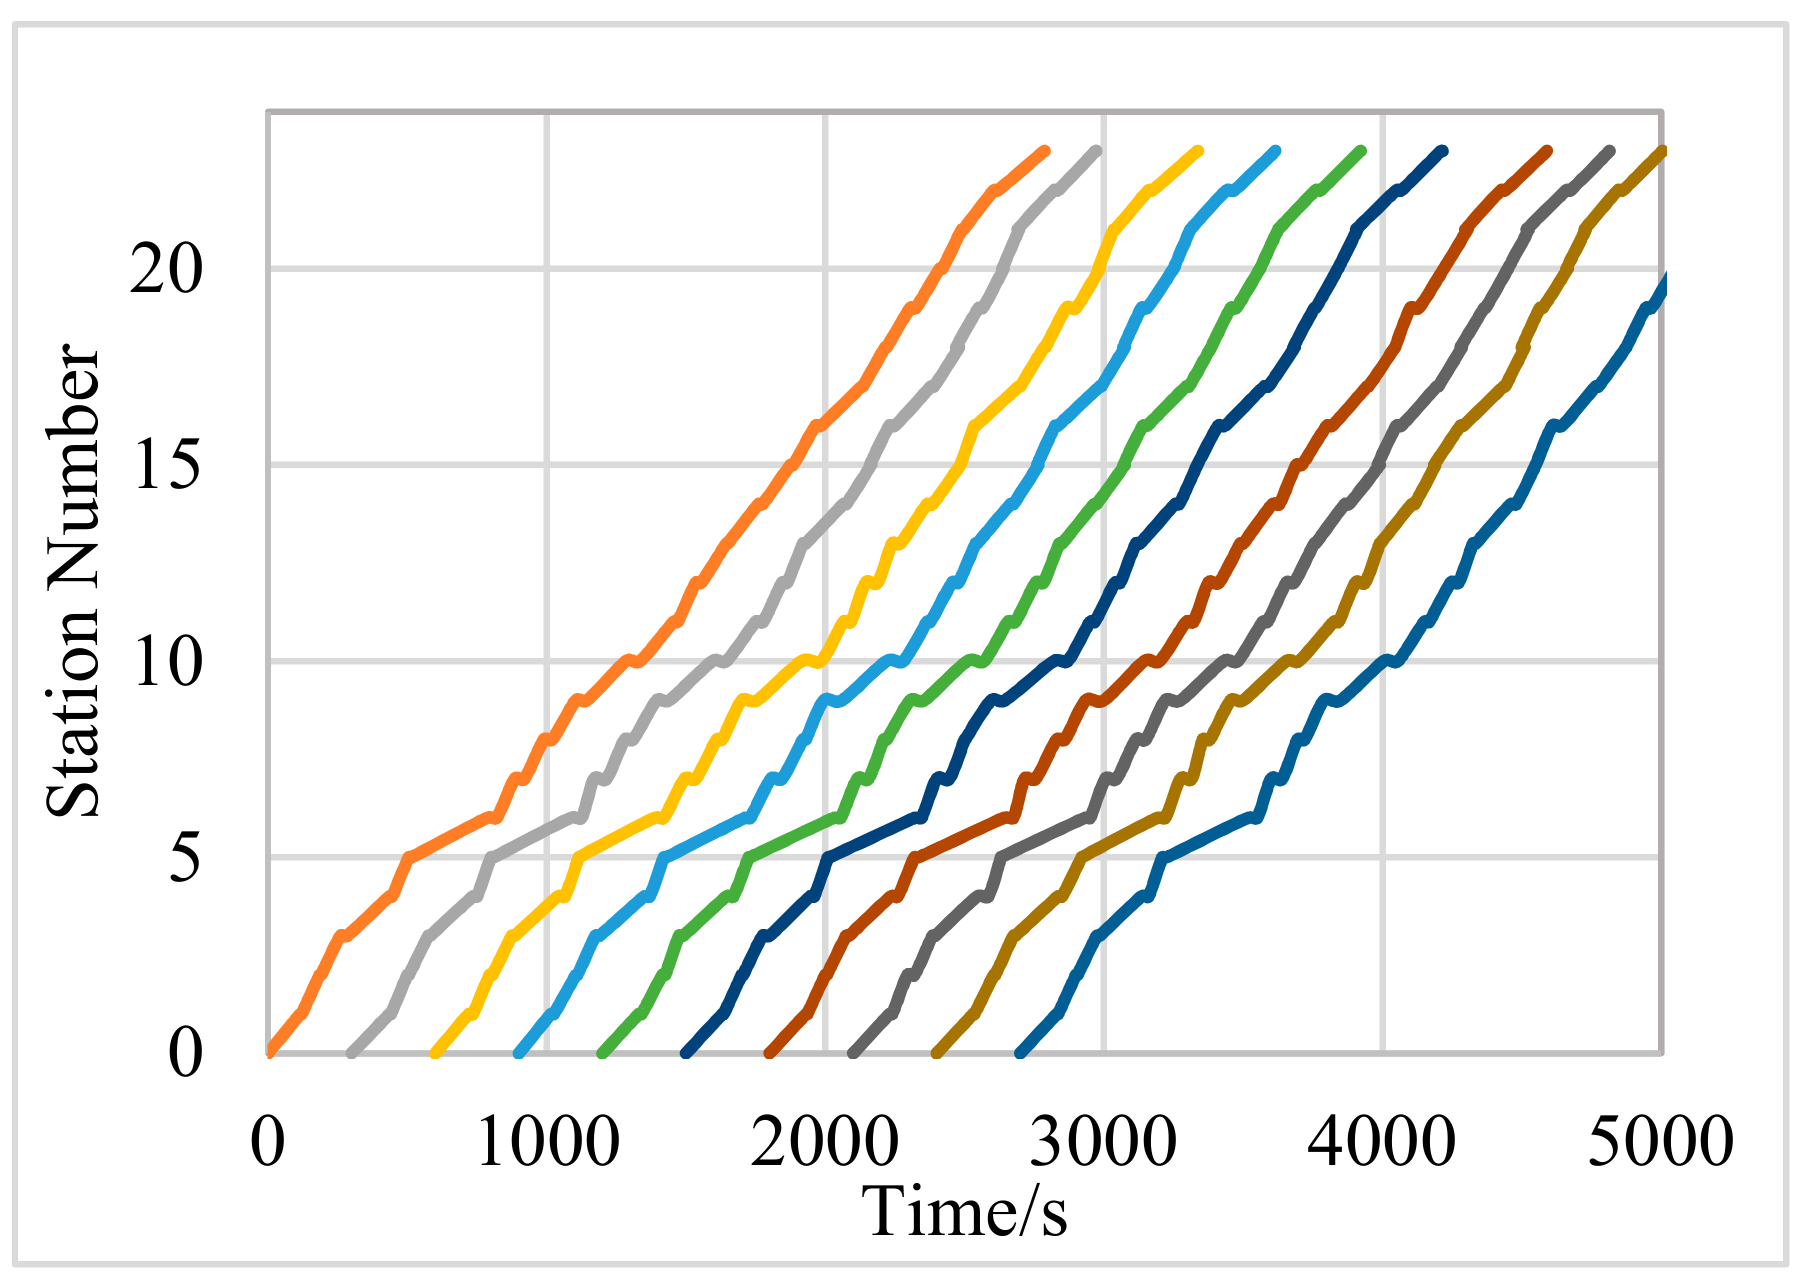
S3 denotes real-time control of bus running speed and dwell time and considers the impact of bus load rate on passenger boarding time. The simulation obtained the space-time diagram of the bus operation, as shown in Figure 6. It can be seen from Figure 7 that under the control of S3, the buses run stably without the phenomenon of bunching. The bus stability parameter is σ h   =   0.05 , the average travel time is 35 min, and compared with the control of strategy two, it is reduced by about 34%. To sum up, it can be seen that S3 can improve the stability and efficiency of bus line operation.
In summary, the control effects of the three strategies were compared from the point of view of the moment when the bus on route first appears in bunching, the average travel time, and the instability parameter (headway deviation). The comparison result is shown in Table 4.
From the above simulation results of different control strategies in Table 4, it can be seen that compared to S1, S2 cannot only reduce the travel time of the buses, but also effectively ensure the operation efficiency of the buses. S2 can give the bus a suggested speed at control points. When the time headway between the bus and the ahead bus increases, the bus is accelerated; otherwise, the bus is decelerated. This method makes up for the problem of low vehicle operation efficiency in S1 and is a better control strategy for conventional public transport. S3 obtains the real-time passenger arrival rate, headway, and other data through ITS, and feeds back the suggested speed of the bus in real time, so as to control the cruising speed and dwell time of the bus in real time, and also take into account the influence of bus load rate. In this way, the distance between buses can be better adjusted, the stability of bus operation can be improved, and the punctuality rate of buses can be ensured. Comparing the three control strategies shows that under S3, the buses run with the best stability, the shortest average travel time, and the best maintenance of headway.
Finally, the shortest distance between buses under the three control strategies was compared. The simulation obtained Figure 8 (where the horizontal coordinate represents the bus running time and the vertical coordinate represents the distance between buses). In Figure 8, S1 represents strategy one, the single-point control based on timetable; S2 represents strategy two, the multi-point control based on time headway; and S3 represents strategy three, real-time control.
From Figure 8, it can be seen that the optimal headway of the No. 245 bus is about 2 km. Under the three strategies, the shortest headway between buses on the first five stops of the bus route is similar, and the side reflects that under the short distance, the bus is less affected by the outside environments, and the operation is relatively stable. In the following journey, under the control of S1, the shortest distance between buses shows a significant downward trend. When running for about 30 min, the distance between buses is reduced to 0, and the bus bunching occurs. Under the control of S2, the shortest distance between buses is relatively reduced, but it is still relatively stable at around 1 km. Under the control of S3, the buses are operated in a balanced manner, and the shortest distance between buses is close to the optimal distance.

5. Conclusions

In this paper, a real-time control model of single-line buses under the environment of ITS was established. The model controlled the cruising speed and dwell time of the vehicles, while also considered the influence of the load rate of a bus on passengers’ boarding time. In order to show the effect of the control strategy, this paper took the Nanchang No. 245 bus line as a case, and the proposed real-time control strategy and two traditional control strategies researched by Daganzo [9] were simulated and compared for analysis. By comparing the anti-bunching effect of the three control strategies, the following conclusions are drawn:
  • Based on the timetable control strategy, for bus lines with long routes and many stops, it is difficult to avoid the bunching between control points. If the control points are added, the bus bunching can be reduced, but the dwell time in which the bus stays at the control point will be greatly increased. In this case, the average bus travel time increased by about 36%, and the operating efficiency of the bus was significantly reduced.
  • The multi-point control strategy based on headway can solve the problem of when the control points increase, the bus operation efficiency drops sharply in the timetable-based control strategy, and at the same time improves the bus operation stability. This strategy is able to reduce operational delay by adjusting the speed of each vehicle between control points, thus reducing the additional stopping delays caused by additional boarding passengers.
  • The real-time control strategy considers the impact of the bus load rate on the passengers’ boarding time, controls the stopping time of the vehicle at the station, and controls the cruising speed of the buses in real time, so that the headway of the buses is kept close to the optimal headway in real time. Through the above control measures, this control strategy achieves the effect of balanced operation of a bus line and can effectively prevent bus bunching from occurring.
  • S1 adds slack time in the timetable to alleviate bus bunching, but it cannot prevent the spread of large local interruptions in the system. S2 adds a delay term at the control points based on the headway, and prevents the bus from colliding by controlling the running speed between the control points, which is more stable and faster than S1. The effect of S3 is equivalent to the combined version of S1 and S2. On the one hand, it ensures the planned operation timetable of the bus, and on the other, it maintains a better time headway of the bus. While following these two goals, the operating efficiency of the bus is indirectly improved.
  • The three control strategies are based on the circumstance that buses do not overtake, to prevent buses from bunching, and to achieve a balanced and stable operation of buses. In real-time control, buses are controlled to travel at the desired speed in real time. However, in the actual operation process, there are delays caused by signal crossings and other traffic flows. How to smooth the speed curve of buses and achieve the feasibility of S3 is the focus of future study. In future research, it is necessary to analyze the details of buses traveling between stops, and consider a variety of bus scheduling methods, including bus overtaking and stop jumping, so as to improve the efficiency and attractiveness of bus operation and achieve sustainable development of public transport.

Author Contributions

The individual contribution and responsibilities of the authors are listed as follows: Y.X. designed the research and developed the model; M.Z. analyzed the data and wrote the manuscript; L.X. collected survey data, constructed the model, and conducted model validation; H.T., C.T. and Q.K. edited the manuscript; H.G. provided some comments on the case study and edited the manuscript. All authors have read and agreed to the published version of the manuscript.

Funding

This research was funded by the National Natural Science Foundation of China (Grant No. 71961006, 71971005, 52162042), Key Project of Jiangxi Provincial Social Science Foundation (21YJ03), and Graduate Student Innovation Special Fund Project of Jiangxi Province, China (YC2021-S456).

Informed Consent Statement

Informed consent was obtained from all subjects involved in the study.

Data Availability Statement

The survey data used to support the findings of this study are available from the corresponding author upon request.

Acknowledgments

The authors give thanks to the Nanchang Public Traffic Company for operational data. The authors are also very grateful for the comments from the editor and the anonymous reviewers.

Conflicts of Interest

The authors declare no conflict of interest.

References

  1. Xu, L. Research on the policy guarantee mechanism of the sustainable and priority development of urban public transport. Urban Transp. China 2013, 13, 29–34. [Google Scholar] [CrossRef]
  2. He, S. An anti-bunching strategy to improve bus schedule and headway reliability by making use of the available accurate information. Comput. Ind. Eng. 2015, 85, 17–32. [Google Scholar] [CrossRef]
  3. Yao, D.; Xu, L.; Li, J. Public transport service level, traffic demand management and public transport attractiveness—A dual test based on objective choice and subjective intention. J. Syst. Manag. 2020, 29, 31–40. [Google Scholar]
  4. Newell, G.F.; Potts, R.B. Maintaining a bus schedule. In Proceedings of the 2nd Australian Road Research Board (ARRB), Melbourne, Australia, 1 January 1964. [Google Scholar]
  5. Osuna, E.E.; Newell, G.F. Control strategies for an idealized public transportation system. Transp. Sci. 1972, 6, 52–72. [Google Scholar] [CrossRef]
  6. Barnett, A. On controlling randomness in transit operations. Transp. Sci. 1974, 8, 102–116. [Google Scholar] [CrossRef]
  7. Abkowitz, M.; Eiger, A.; Engelstein, I. Optimal control of head-way variation on transit routes. J. Adv. Transp. 1986, 20, 73–88. [Google Scholar] [CrossRef]
  8. Li, Y.; Yang, H.; Zheng, C. Optimization of bus departure frequency based on passenger arrival rate. J. East China Jiaotong Univ. 2021, 38, 54–60. [Google Scholar]
  9. Daganzo, C.F. A headway-based approach to eliminate bus bunching: Systematic analysis and comparisons. Transp. Res. Part B Methodol. 2009, 43, 913–921. [Google Scholar] [CrossRef]
  10. Daganzo, C.F.; Pilachowski, J. Reducing bunching with bus-to-bus cooperation. Transp. Res. Part B Methodol. 2011, 45, 267–277. [Google Scholar] [CrossRef] [Green Version]
  11. Nesheli, M.M.; Ceder, A.A.; Gonzalez, V.A. Real-time public-transport operational tactics using synchronized transfers to eliminate vehicle bunching. IEEE Trans. Intell. Transp. Syst. 2016, 17, 3220–3229. [Google Scholar] [CrossRef]
  12. Zhang, J.; Li, M.; Ran, B.; Li, W. Causes and forecast modeling of conventional bus bunching. J. Southeast Univ. (Nat. Sci.) 2017, 47, 1269–1273. [Google Scholar]
  13. Zhang, P.; Li, W.; Chang, Y.; Xie, J. A multi-application optimal control model for intersection bus priority based on vehicle speed guidance. China J. Highw. Transp. 2017, 30, 109–115. [Google Scholar]
  14. Huang, Q.; Jia, B.; Qiang, S.; Xiao, Y. Research on combined bus control strategy based on stationing and flow restriction. J. Transp. Syst. Eng. Inf. Technol. 2018, 18, 103–109. [Google Scholar]
  15. Chandrasekar, P.; Cheu, R.L.; Chin, H.C. Simulation evaluation of route-based control of bus operations. J. Transp. Eng. 2002, 128, 519–527. [Google Scholar] [CrossRef]
  16. Teng, J.; Jin, W. A bus operation control method based on interval speed guidance. J. Tongji Univ. (Nat. Sci.) 2015, 43, 1194–1199. [Google Scholar]
  17. Teng, J.; Yang, X. A real-time control method for bus single line under APTS. J. Tongji Univ. (Nat. Sci.) 2006, 34, 744–747. [Google Scholar]
  18. Teng, J.; Yang, X. Research on real-time control-dispatch method for rapid transit under APTS. Syst. Eng.-Theory Pract. 2006, 2, 138–143. Available online: http://www.cqvip.com/QK/95538X/2006002/21308700.html (accessed on 20 May 2022).
  19. Teng, J.; Yang, X. A practical optimization method for urban bus hub scheduling problem under APTS. Syst. Eng. 2004, 22, 78–82. [Google Scholar] [CrossRef]
  20. Hu, T.; Chen, L. Impact of real-time information on dynamic vehicular flows under mixed traffic conditions. J. East. Asia Soc. Transp. 2007, 6, 1338–1353. [Google Scholar]
  21. Ismail, R.; Hafezi, M.H.; Ismail, A. Implementing specific lane length on bus route for operation delays reduction. J. Appl. Sci. 2012, 12, 2077–2081. [Google Scholar] [CrossRef] [Green Version]
  22. Bhattacharyya, K.; Maitra, B.; Boltze, M. Implementation of bus priority with queue jump lane and pre-signal at urban intersections with mixed traffic operations: Lessons learned? Transp. Res. Rec. J. Transp. Res. Board 2019, 2673, 646–657. [Google Scholar] [CrossRef] [Green Version]
  23. Asgharzadeh, M.; Shafahi, Y. Real-time bus-holding control strategy to reduce passenger waiting time. Transp. Res. Rec. 2017, 2647, 9–16. [Google Scholar] [CrossRef]
  24. Berrebi, S.J.; Watkins, K.E.; Laval, J.A. A real-time bus dispatching policy to minimize passenger wait on a high frequency route. Transp. Res. Part B Methodol. 2015, 81, 377–389. [Google Scholar] [CrossRef]
  25. Berrebi, S.J.; Hans, E.; Chiabaut, N.; Laval, J.A.; Leclercq, L.; Watkins, K.E. Comparing bus holding methods with and without real-time predictions. Transp. Res. Part C Emerg. Technol. 2018, 87, 197–211. [Google Scholar] [CrossRef] [Green Version]
  26. Guler, S.I.; Menendez, M.; Meier, L. Using connected vehicle technology to improve the efficiency of intersections. Transp. Part C 2014, 46, 121–131. [Google Scholar] [CrossRef]
  27. Wang, Y.; Tan, G.; Liu, M.; Din, N. An adaptive priority approach for public transportation in a connected vehicle environment. J. Comput. Appl. 2016, 36, 2181–2186. [Google Scholar]
  28. Feng, Y.; Yu, C.; Henry, X. Spatiotemporal intersection control in a connected and automated vehicle environment. Transp. Res. Part C 2018, 89, 364–383. [Google Scholar] [CrossRef]
  29. Dosovitskiy, A.; Ros, G.; Codevilla, F.; Lopez, A.; Koltun, V. CARLA: An open urban driving simulator. arXiv 2017, arXiv:1711.03938. [Google Scholar]
  30. Xiang, Y.; Wang, S.; Su, T.; Li, J.; Mao, S.S.; Geimer, M. KIT bus: A shuttle model for CARLA simulator. In Proceedings of the IEEE Industrial Electronics and Applications Conference, Singapore, 24–26 May 2021; pp. 7–12. [Google Scholar] [CrossRef]
  31. Rong, G.; Shin, B.H.; Tabatabaee, H.; Lu, Q.; Lemke, S.; Moeiko, M.; Boise, E.; Uhm, G.; Gerow, M.; Mehta, S. LGSVL Simulator: A high-fidelity simulator for autonomous driving. arXiv 2020, arXiv:2005.03778. [Google Scholar]
  32. Kong, X.; Ren, C.; Gao, G.; Huon, Y. Evaluation on operation efficiency of urban transport system considering rail transit planning. Sci. Technol. Eng. 2020, 20, 5390–5395. [Google Scholar]
  33. Yan, H.; Liu, R. Short-tum vehicles departure strategy considering reliability of bus operation. J. South China Univ. Technol. (Nat. Sci. Ed.) 2019, 47, 25–32 + 43. [Google Scholar]
  34. Zhang, Y. Research and Case Evaluation of Operation Reliability of Conventional Public Transportation in Big Cities; Beijing Jiaotong University: Beijing, China, 2008. [Google Scholar]
  35. Xue, Y.; Zhong, M.; Xue, L.; Zhang, B.; Tu, H.; Tan, C.; Kong, Q.; Guan, H. Simulation analysis of bus passenger boarding and alighting behavior based on cellular automata. Sustainability 2022, 14, 2429. [Google Scholar] [CrossRef]
  36. Ma, C.; Wang, J. Traffic Survey and Analysis; China Communications Press: Beijing, China, 2016. [Google Scholar]
Figure 1. Data processing flow of BIMS chart.
Sustainability 14 07870 g001
Figure 2. Real-time control simulation flow chart.
Sustainability 14 07870 g002
Figure 3. No. 245 bus route and station number diagram.
Sustainability 14 07870 g003
Figure 4. Space-time diagram of No. 245 bus route without control. (Note: the lines of different colors in the figure are only to distinguish different buses on the line. The same below.)
Sustainability 14 07870 g004
Figure 5. Space-time diagram of No. 245 bus route using S1.
Sustainability 14 07870 g005
Figure 6. Space-time diagram of No. 245 bus route using S2.
Sustainability 14 07870 g006
Figure 7. Space-time diagram of No. 245 bus route using S3.
Sustainability 14 07870 g007
Figure 8. Shortest distance between buses of three strategies.
Sustainability 14 07870 g008
Table 1. Comparative analysis of control strategy models.
Model ParametersParameter MeaningNo ControlS1S2S3
H Service headway
p i Expected travel time of the bus from stop i to i + 1
t 0 , 0 Departure time of the bus
t n , s + 1 Planned arrival time of bus n at stop s + 1
c s Average travel time of the bus from stop s to s + 1
v n , s Random noise parameters
ε n , s Errors generated by the disturbances
a n , s Moment when the bus n actually arrives at stop s
μ n , s Uncontrolled average travel time of the bus from stop s to s + 1
β s A dimensionless parameter β s     [ 1 0 2   ~   1 ]
h n , s Time headway between bus n and n − 1 arriving at stop s h n , s   =   a n , s     a n 1 , s h n , s   =   a n , s     a n 1 , s h n , s   =   T n , s o     T n 1 , s o
U n , s Actual travel time from stop s to s + 1
σ i Standard deviation of noise terms v n , s
D n , s Delay parameter of time headway
d s Average delay d s     0
g s Control sensitivity, g s     ( β s , 1   +   β s )
T n , s Dwell time of bus n at stop s
λ s n Arrival rate of bus n passengers at stop s
r a / r n , s a Average boarding time of unit passenger taking bus n at stop s
L s 1 , s Distance from bus stop s − 1 to s
V s 1 , s Desired travel speed of the bus between bus stop s − 1 and s
T s 1 , s n Travel time of bus n between bus stop s − 1 and s
T n , s o Departure time of bus n at stop s
Table 2. Stop information of No. 245 bus.
Stop NumberBus Stop NameDistance (km)Drop-Off Rate (%)Stop NumberBus Stop NameDistance (km)Drop-Off Rate (%)
0North Wenjiao Road0012Lijing Road0.44.46
1North Xianshi Road II1.080.8913North Cuiyuan Station0.535.36
2North Gate of the First Affiliated Hospital of Nanchang University0.341.7914North Fenghe Interchange0.382.68
3Qingshan Road0.50.8915South Fenghe Avenue0.663.57
4Children’s Hospital0.921.7916Qianhu Branch of Nanchang University Affiliated Primary School0.51.79
5Provincial People’s Hospital0.432.6817Hong Jiaozhou Management Committee0.855.36
6North Road of Honggu Central Avenue2.3110.7118Changgeng Road Lingkou Road Intersection0.344.46
7Chunhui Road0.336.2519Xuefu Avenue Keyuan Road Intersection0.786.25
8West Road of Guangdian Branch0.484.4620Jiangxi University of Science and Technology Hong Jiaozhou Campus0.24.46
9The Central at Dinfung0.555.3621Xuefu Road0.343.57
10Shimao Road0.979.8222North Gate, Qianhu Campus, Nanchang University0.913.57
11Yiyuan Road0.438.0423Honggu New Town0.991.79
Table 3. Passenger arrival rates by station at different moments, λs (pax/min).
Station Number17:00–17:1517:15–17:3017:30–17:4517:45–18:0018:00–18:1518:15–18:3018:30–18:4518:45–19:00
01.21.31.41.41.31.310.9
11.61.92.42.32.521.71.2
21.81.61.71.71.41.41.31
32.721.61.91.81.61.71.7
200.40.50.51.40.90.80.50.2
210.30.250.50.90.10.150.10.05
220.20.150.40.20.150.10.050.08
2300000000
Note: 17:00–19:00 is the evening peak hour of No. 245 bus.
Table 4. Simulation results of different control strategies.
Control TypeThe Moment of First Bunching (min)Average Travel Time (min)Difference Value of Average Travel Time Compared to No Control Headway   Deviation   σ h
no control2747 4.08
S11 control point (starting point)27.45032.58
3 control points285698.87
5 control points64179.42
S25360.47
S335−120.05
Publisher’s Note: MDPI stays neutral with regard to jurisdictional claims in published maps and institutional affiliations.