Article

Drip Fertigation with Relatively Low Water and N Input Achieved Higher Grain Yield of Maize by Improving Pre- and Post-Silking Dry Matter Accumulation

1
College of Agriculture, Northeast Agricultural University, Harbin 150030, China
2
Key Laboratory of Crop Physiology and Ecology, Ministry of Agriculture and Rural Affairs, Institute of Crop Sciences, Chinese Academy of Agricultural Sciences, Beijing 100081, China
3
Maize Research Center, Beijing Academy of Agriculture & Forestry Sciences, Beijing 100097, China
4
Biosystems Engineering Department, Auburn University, Auburn, AL 36849, USA
5
Business School, East Tennessee State University, Johnson City, TN 37614, USA
*
Authors to whom correspondence should be addressed.
These authors contributed equally to this work.
Sustainability 2022, 14(13), 7850; https://doi.org/10.3390/su14137850
Submission received: 20 April 2022 / Revised: 27 May 2022 / Accepted: 3 June 2022 / Published: 28 June 2022
(This article belongs to the Section Sustainable Agriculture)

Abstract

:
Appropriate irrigation and nitrogen (N) management strategies are necessary to achieve a sustainable yield of maize with relatively low water and N inputs. Here, a 2-year field experiment with two irrigation methods (drip irrigation and flood irrigation) and five N application rates (0, 225, 300, 375, and 450 kg N ha−1) was conducted to evaluate maize yield and water and N use efficiency in the North China Plain (NCP). Compared with flood fertigation (FF), drip fertigation (DF) improved the soil water content (SWC) in the 0 to 40 cm soil layer and maintained a greater soil mineral N content (Nmin) of that soil layer. This resulted in increased soil Nmin in the 0 to 40 cm soil layer for the 375 kg ha−1 (N3) under DF compared with the 450 kg N ha−1 (N4) treatment under FF during both pre- and post-silking of maize. The maize crop accumulated greater N at both pre- and post-silking compared using N3 under DF compared to N4 under FF. Greater pre-silking N accumulation increased both leaf area and plant growth rate, leading to more dry matter (DM) accumulation and develop more kernels, while sufficient post-silking N accumulation maintained high leaf area to produce more DM post-silking and promote maize ability to support grain filling. As a result, maximum maize yield (10.4 Mg ha−1) was achieved due to increased kernel number and kernel weight for N3 (375 kg N ha−1) under DF with a 20% reduction in N fertilizer input compared with the N4 (450 kg N ha−1) treatment under FF. Due to greater grain yield and N uptake and less water consumption, the agronomic N efficiency (AEN), N partial factor productivity (PFPN), water use efficiency (WUE) and net income for the N3 treatment under DF increased by 30.4%, 28.6%, 58.3% and 11.0% averaged over two years, respectively, compared to the N4 treatment under FF. Therefore, drip fertilization could improve maize grain yield with a relatively lower water consumption and N application rate compared with flood irrigation with higher N fertilization, as well as increase the economic benefits.

1. Introduction

Maize (Zea mays L.) is the most widely grown cereal crop in the world, which is critical for increasing the overall crop production worldwide [1]. The North China Plain (NCP) is one of China’s most significant agricultural areas, where 35% of the nation’s maize is produced [2]. Nitrogen (N) is an important nutrient to maximize crop production [3], and maize grain yield has been markedly improved by increasing N fertilization during recent decades in the NCP. However, excess N fertilizer inputs combined with improper application methods has decreased the NUE and negatively impacted the environment by polluting groundwater through NO3 leaching [4] and N2O release into the atmosphere [5,6]. Therefore, new ways of managing N application in maize production are needed that meet the twin goals of maintaining high yields and high N use efficiency.
In the NCP, farmers with inadequate knowledge and limited access to appropriate technologies typically apply a large amount of chemical N fertilizer to increase crop yield [7], and nearly 60% of the annual N fertilizer dose is applied once prior to maize sowing, or during early growth stages [8]. N rates typically exceed the early growth requirements of maize, resulting in N loss by ammonia volatilization, denitrification, and leaching. In addition, N fertilizers as urea are often applied by broadcast over the soil surface or side-dressed with flood irrigation or rainfall during the maize production season in the NCP. Large amounts of groundwater flood irrigation (50–75 mm in each application) [9] and rainfall leads to N loss through leaching via water infiltration [10,11], which pollutes the groundwater [12], causes acidification of soil [13] and pollutes the troposphere with NOx and NH3 gases [14,15,16]. Moreover, long-term exploitation of the groundwater for irrigation has led to groundwater levels persistently declining in this area [17]. Subsequently, extensive N losses have resulted in decreased available N needed for the later maize growth stages. Without sufficient N, leaf senescence accelerates, which limits maize yield [18]. Therefore, irrigation and N management practices need to be improved to minimize N loss and water consumption, as well as satisfy plant nitrogen requirements to maintain high yields.
Flood fertigation, which is a conventional way of fertilization, is easy for the farmer to operate. However, flood fertilization requires a lot of water and has high water losses, which leads to fertilizer leaching, which is not conducive to the uptake of water and nitrogen by crops, resulting in a waste of water and nitrogen resources [19]. Drip fertigation, an integrated drip irrigation and N application system, provides an efficient way to use water and N fertilizer as well as obtain relatively high grain yields [20,21,22,23]. Under drip irrigation, water and N fertilizer are typically dripped in smaller quantities and most of them remain in the surface soil layers [24], enabling uniformity and efficiency in the resource utilization. Numerous literature reports, including our own [22,23], have shown that drip fertigation is more advantageous than traditional farming techniques such as flood/furrow irrigation and N broadcasting [25,26]. These advantages include less water and N fertilizer input [27], reduced N2O and NO emissions [28], decreased NO3 and dissolved organics leaching [29], and higher crop yields [30]. However, it is not clear whether drip irrigation can achieve higher yield and economic benefits by reducing the amount of water and nitrogen while improving the efficiency of water and nitrogen use. We hypothesized that drip irrigation can improve the growth and development of maize by improving the distribution of water and nitrogen in soil, leading to increased yield and economic benefits. The objectives of this study were to (i) evaluate drip fertigation influence on maize grain yield, water and N use efficiency and economic benefits under different N application rates; (ii) determine the physiological mechanisms for yield formation, associated N and dry matter accumulation, soil mineral N and water contents. Understanding these questions will lead to improved use of drip fertigation and provide a theoretical basis to increase utilization of water and fertilizer and enhance technical support for maize production in the NCP and similar areas throughout the world.

2. Materials and Methods

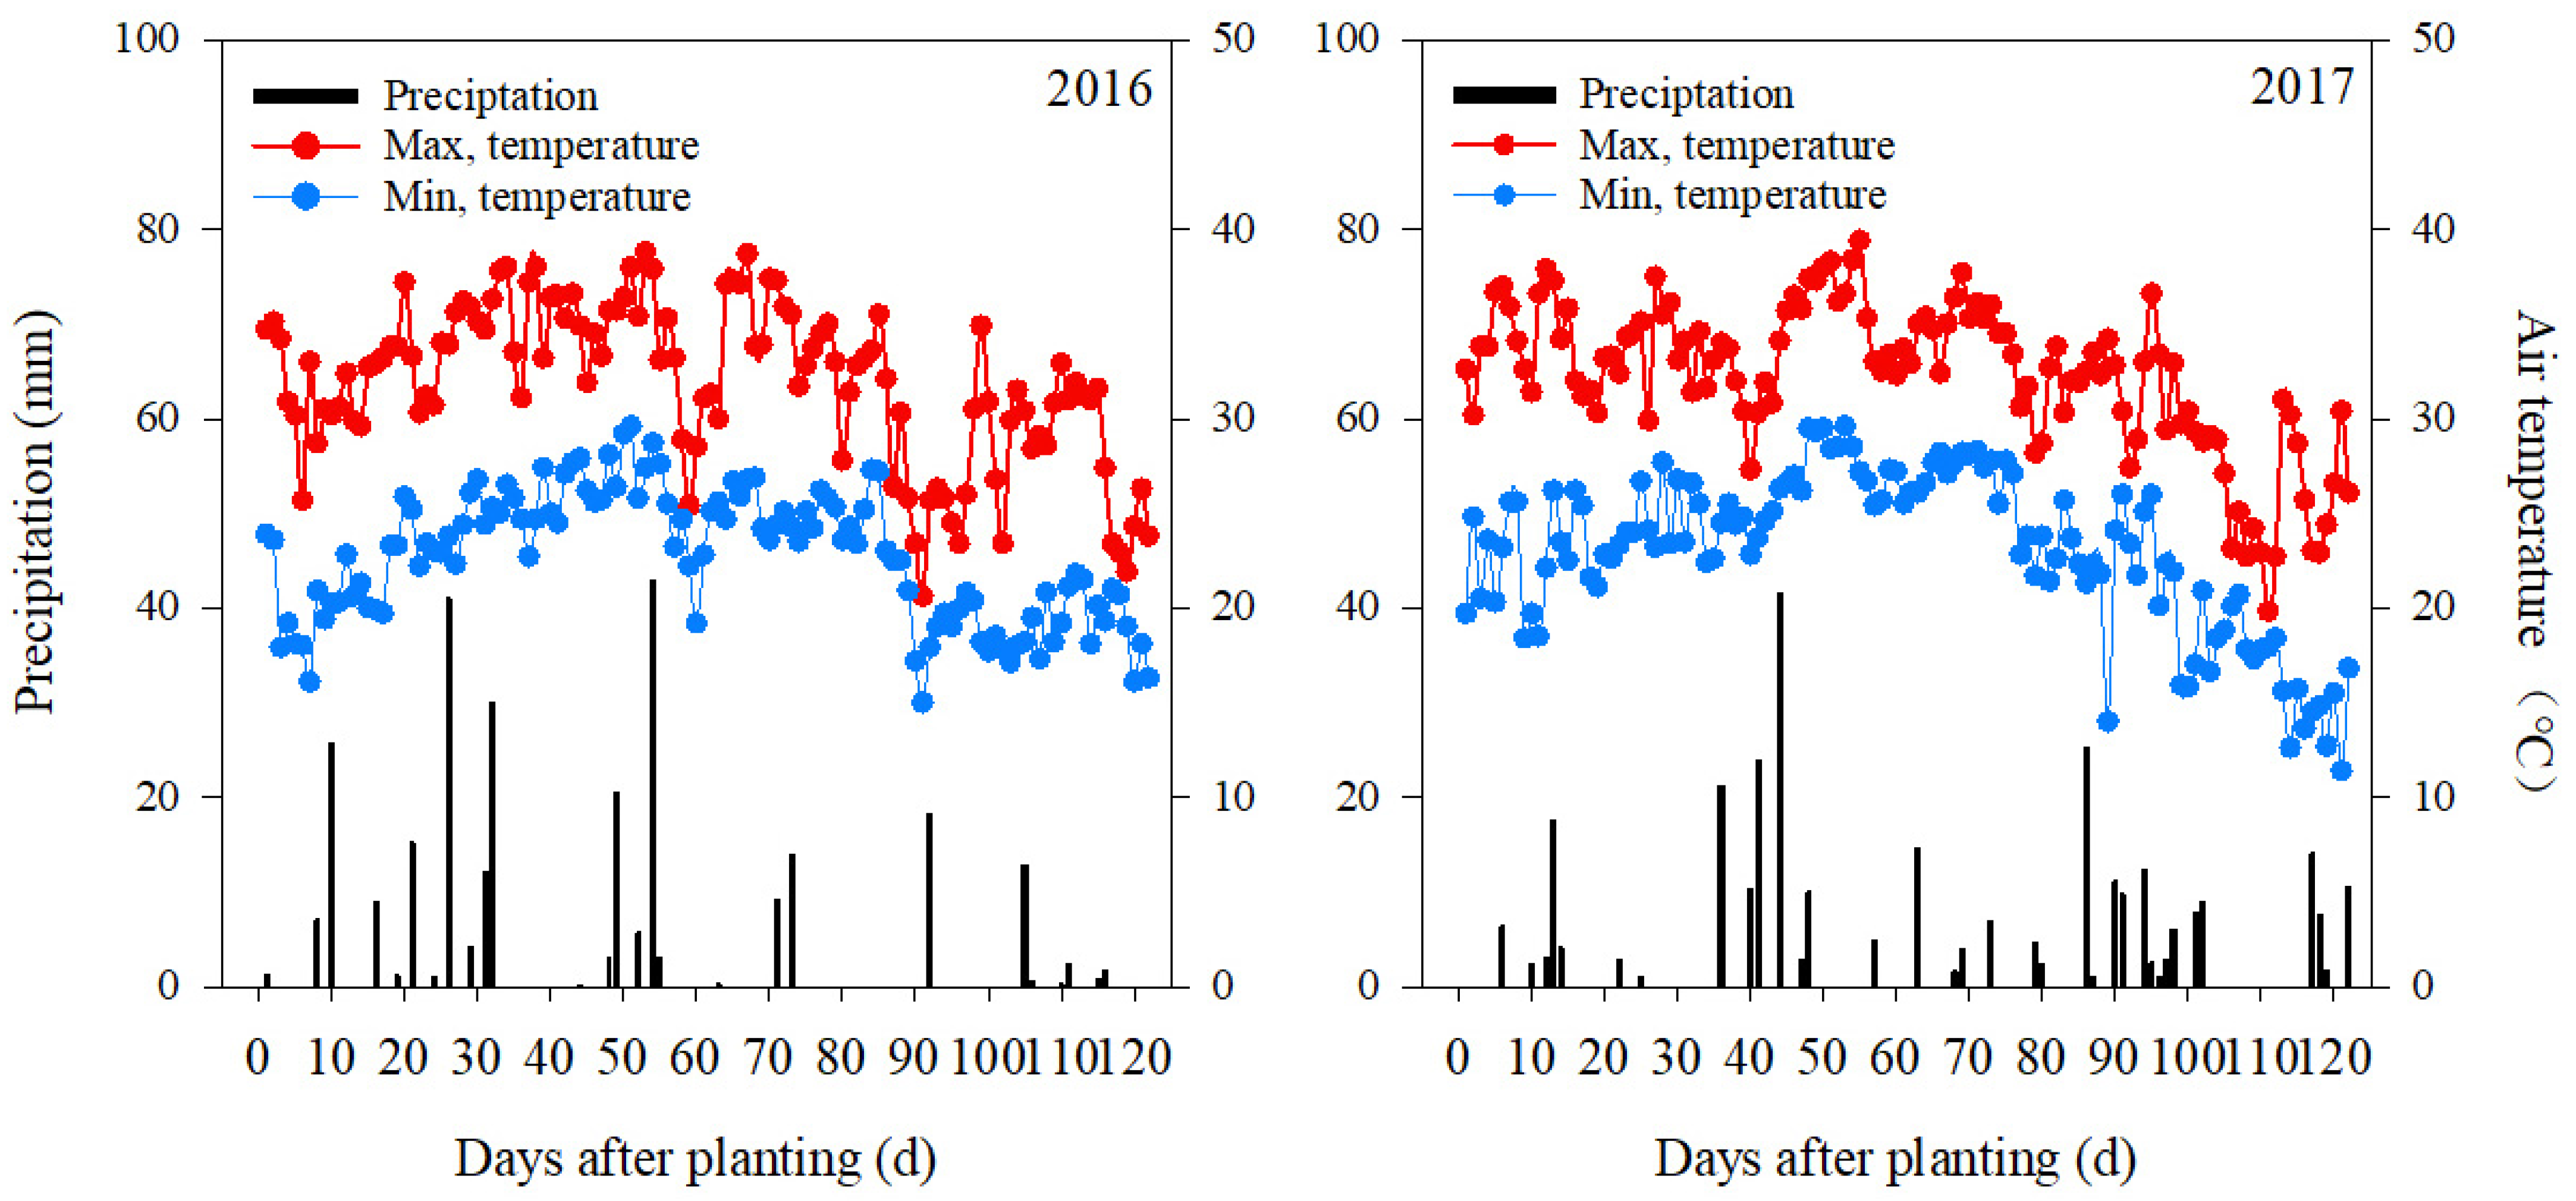
2.1. Experimental Site

A field experiment was conducted in 2016–2017 at the Xinxiang Experimental Station of the Chinese Academy of Agricultural Sciences (35°11′30” N, 113°48′ E) in Xinxiang County, which is representative of the NCP area with extensive farming of mostly winter wheat (Triticum aestivum L.) and summer maize in rotation. The air temperatures and precipitations for this period are shown in Figure 1. The soil was a sandy loam, containing 7.8 g kg−1, 0.14 g kg−1, 34.5 mg kg−1, 14.3 mg kg−1 and 101.8 mg kg−1 of organic matter, total and alkali-hydrolyzable N, extractable Olsen-P, and ammonium acetate extractable K, respectively. Prior to the maize planting in 2016, the pH value of this soil was 8.3 in the top 30 cm. These conditions indicated the soil fertility at experimental site was low-to-medium.

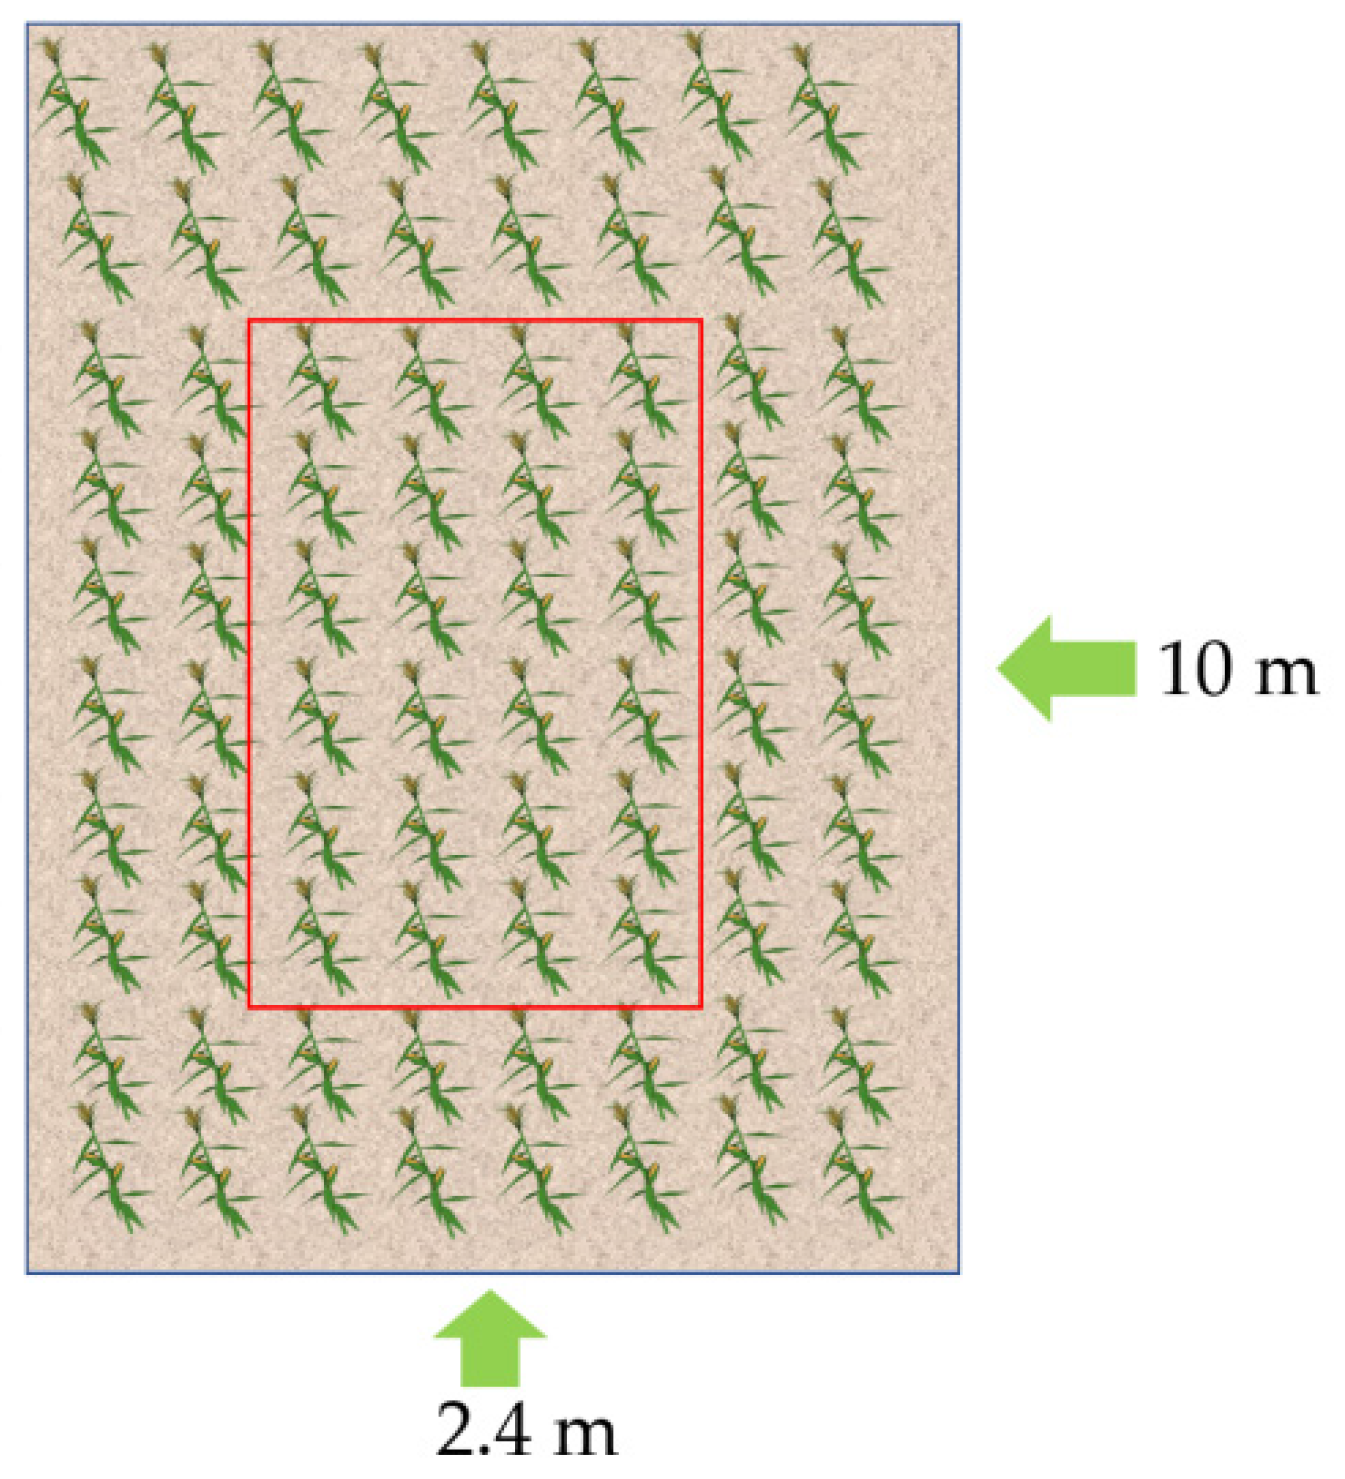
2.2. Experimental Design

A two-factor split-plot experimental design was used in this study. The main plots included two water and fertilizer application methods (DF, drip fertigation; FF, flood fertigation), while the subplots consisted of five N application rate: N0 (0 kg N ha−1), N1 (225 kg N ha−1), N2 (300 kg N ha−1), N3 (375 kg N ha−1), and N4 (450 kg N ha−1). For the drip irrigation, drip tapes spaced 20 cm apart (Hehuinong Agricultural Machinery Company) were buried at a depth of 5 cm between two maize rows, and the overall flow rate was 0.78 L h−1. A total of 10–20 mm of irrigation water, estimated by the Penman–Monteith equation and the crop coefficients for maize [31], was applied at the beginning of each growth stage (Table 1), and the operation pressure was 0.01 MPa above the normal flow. For the flood irrigation, a plastic hose 15 cm in diameter was used for flood irrigation and was equipped with a flow meter to measure the amount of irrigation water applied. Each application used 40–50 mm of water, which was calculated based on soil water monitoring and conventional farmers’ practices. Irrigation was carried out under dry weather conditions when the water potential exceeded −25 to −30 kPa, or together with fertilization. The water potential was monitored by a tensiometer installed at a depth of 35 cm. The corresponding irrigation schedules are shown in Table 1. For the N fertilization (except for N0), urea was used as an N fertilizer at planting, 6-leaf (V6), 12-leaf (V12), and silking (R1) stages with 20%, 25%, 30%, and 25% of the total amount of N fertilizer applied at each stage, respectively. For DF, water-soluble urea (46% N) was put into fertilizer tanks and applied with irrigation events. For FF, common urea (46% N) was applied by broadcast over the soil surface with precipitation or irrigation. At each fertilization time, the date and amount of N fertilization for DF was consistent with that of FF. In each plot and year, 150 kg P2O5 ha−1 as Ca (H2PO4)2 and 120 kg K2O ha−1 as KCl were broadcast over the soil surface before sowing and incorporated into the upper layer with rotary tillage (Table 2).
The experiments consisted of three replicates and each subplot had an area of 48 m2 (4.8 × 15 m). All plots were isolated by a 20-cm-high ridge and a waterproof plastic sheet was placed vertically to the soil surface in the soil profile to a depth of 120-cm to minimize lateral water movement from adjacent plots. The maize hybrid ZD958, which is a primary maize cultivar in the NCP was planted by hand in early June and harvested in early October. The planting density was 75,000 plants ha−1 with wide (80 cm) and narrow (40 cm) row spacing. Weeds, insect pests, and diseases were controlled using chemical herbicides, pesticides, and bactericides (Table 3). No obvious water, weed, pest, or disease stresses were observed during the experiment.

2.3. Sampling and Measurements

2.3.1. Soil Analysis

Soil samples were collected in the top 30 cm before planting in 2016 and 2017. Samples were analyzed for organic matter [32], pH (1:2.5) [33], soil water content, total N [34], ammonium acetate-extractable K [35], and extractable Olsen-P [36].

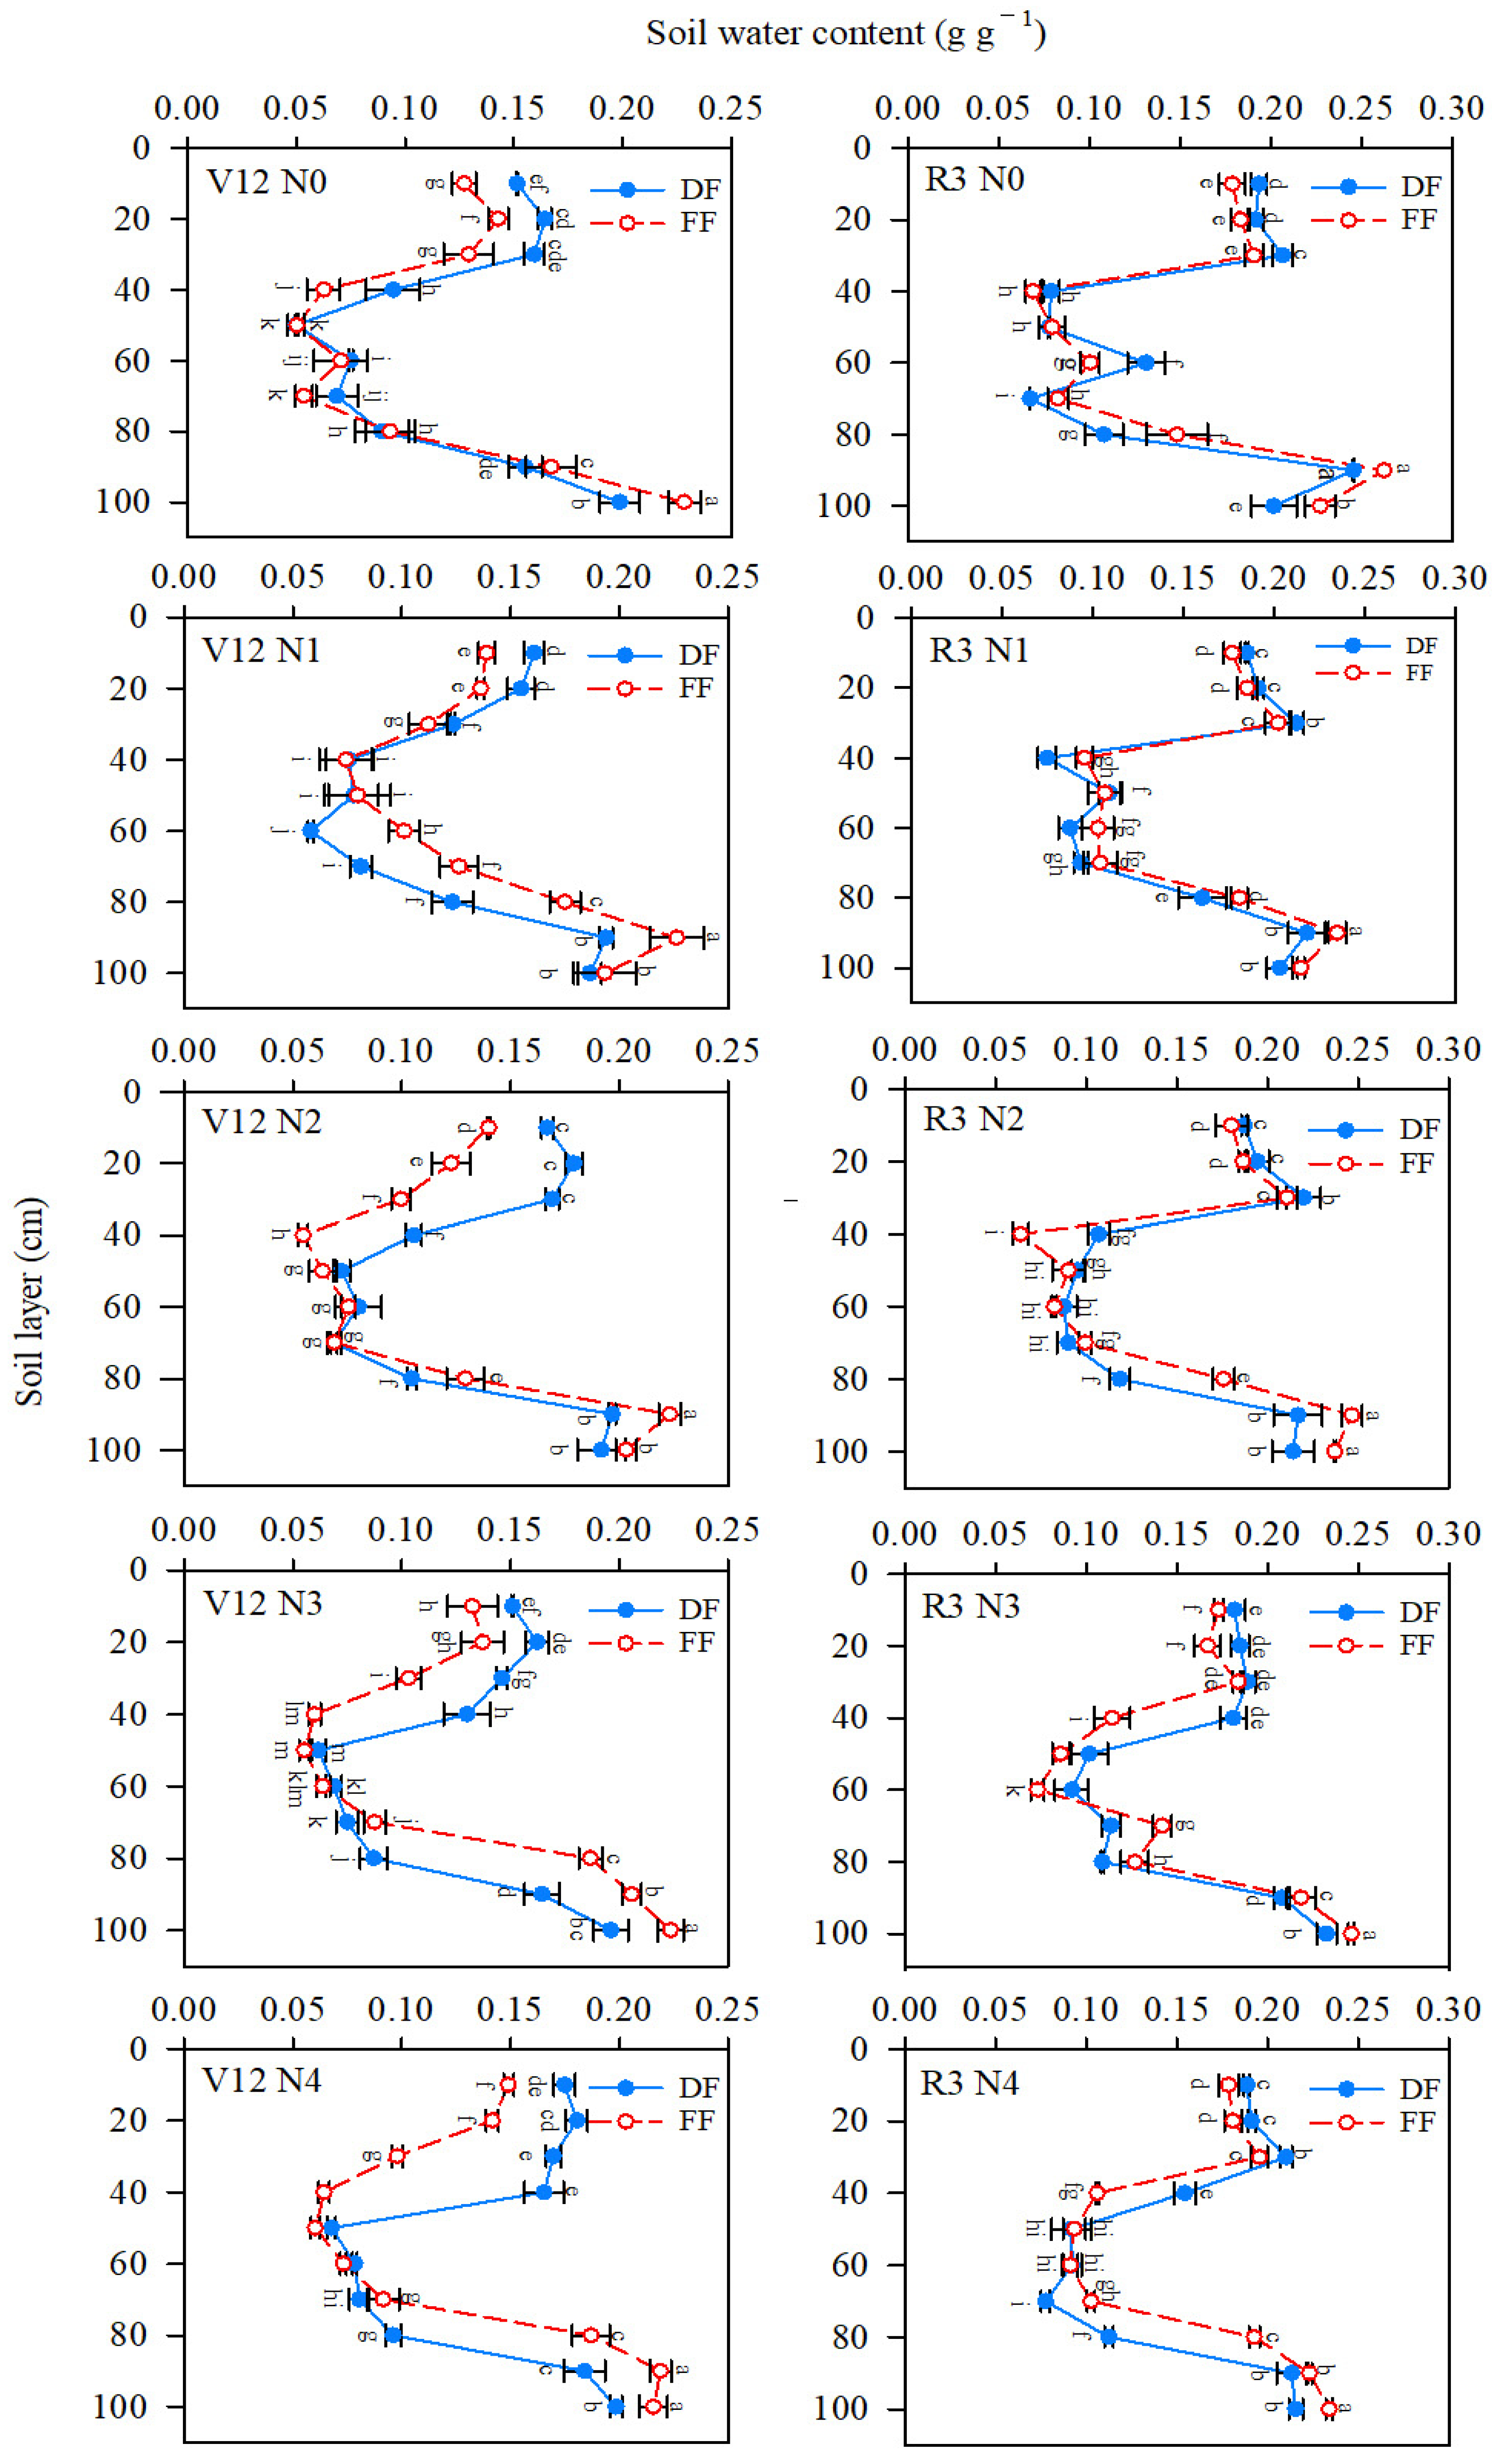
2.3.2. Soil Water Contents

Soil water contents (SWCs) were measured at sowing, V12, R3, and harvest stages in 2016 using the oven-drying method [37]. Soil samples were measured at 10-cm increments from 0 to 100 cm depth using an auger (4.5 cm in diameter). Collections were performed in triplicate in each plot. Soil moisture content was measured 36 h after each irrigation. SWC (g g–1) was calculated by subtracting the dry soil weights (DW, g) from the fresh weight (FW, g) as follows [22,38]:
SWC = F W D W F W

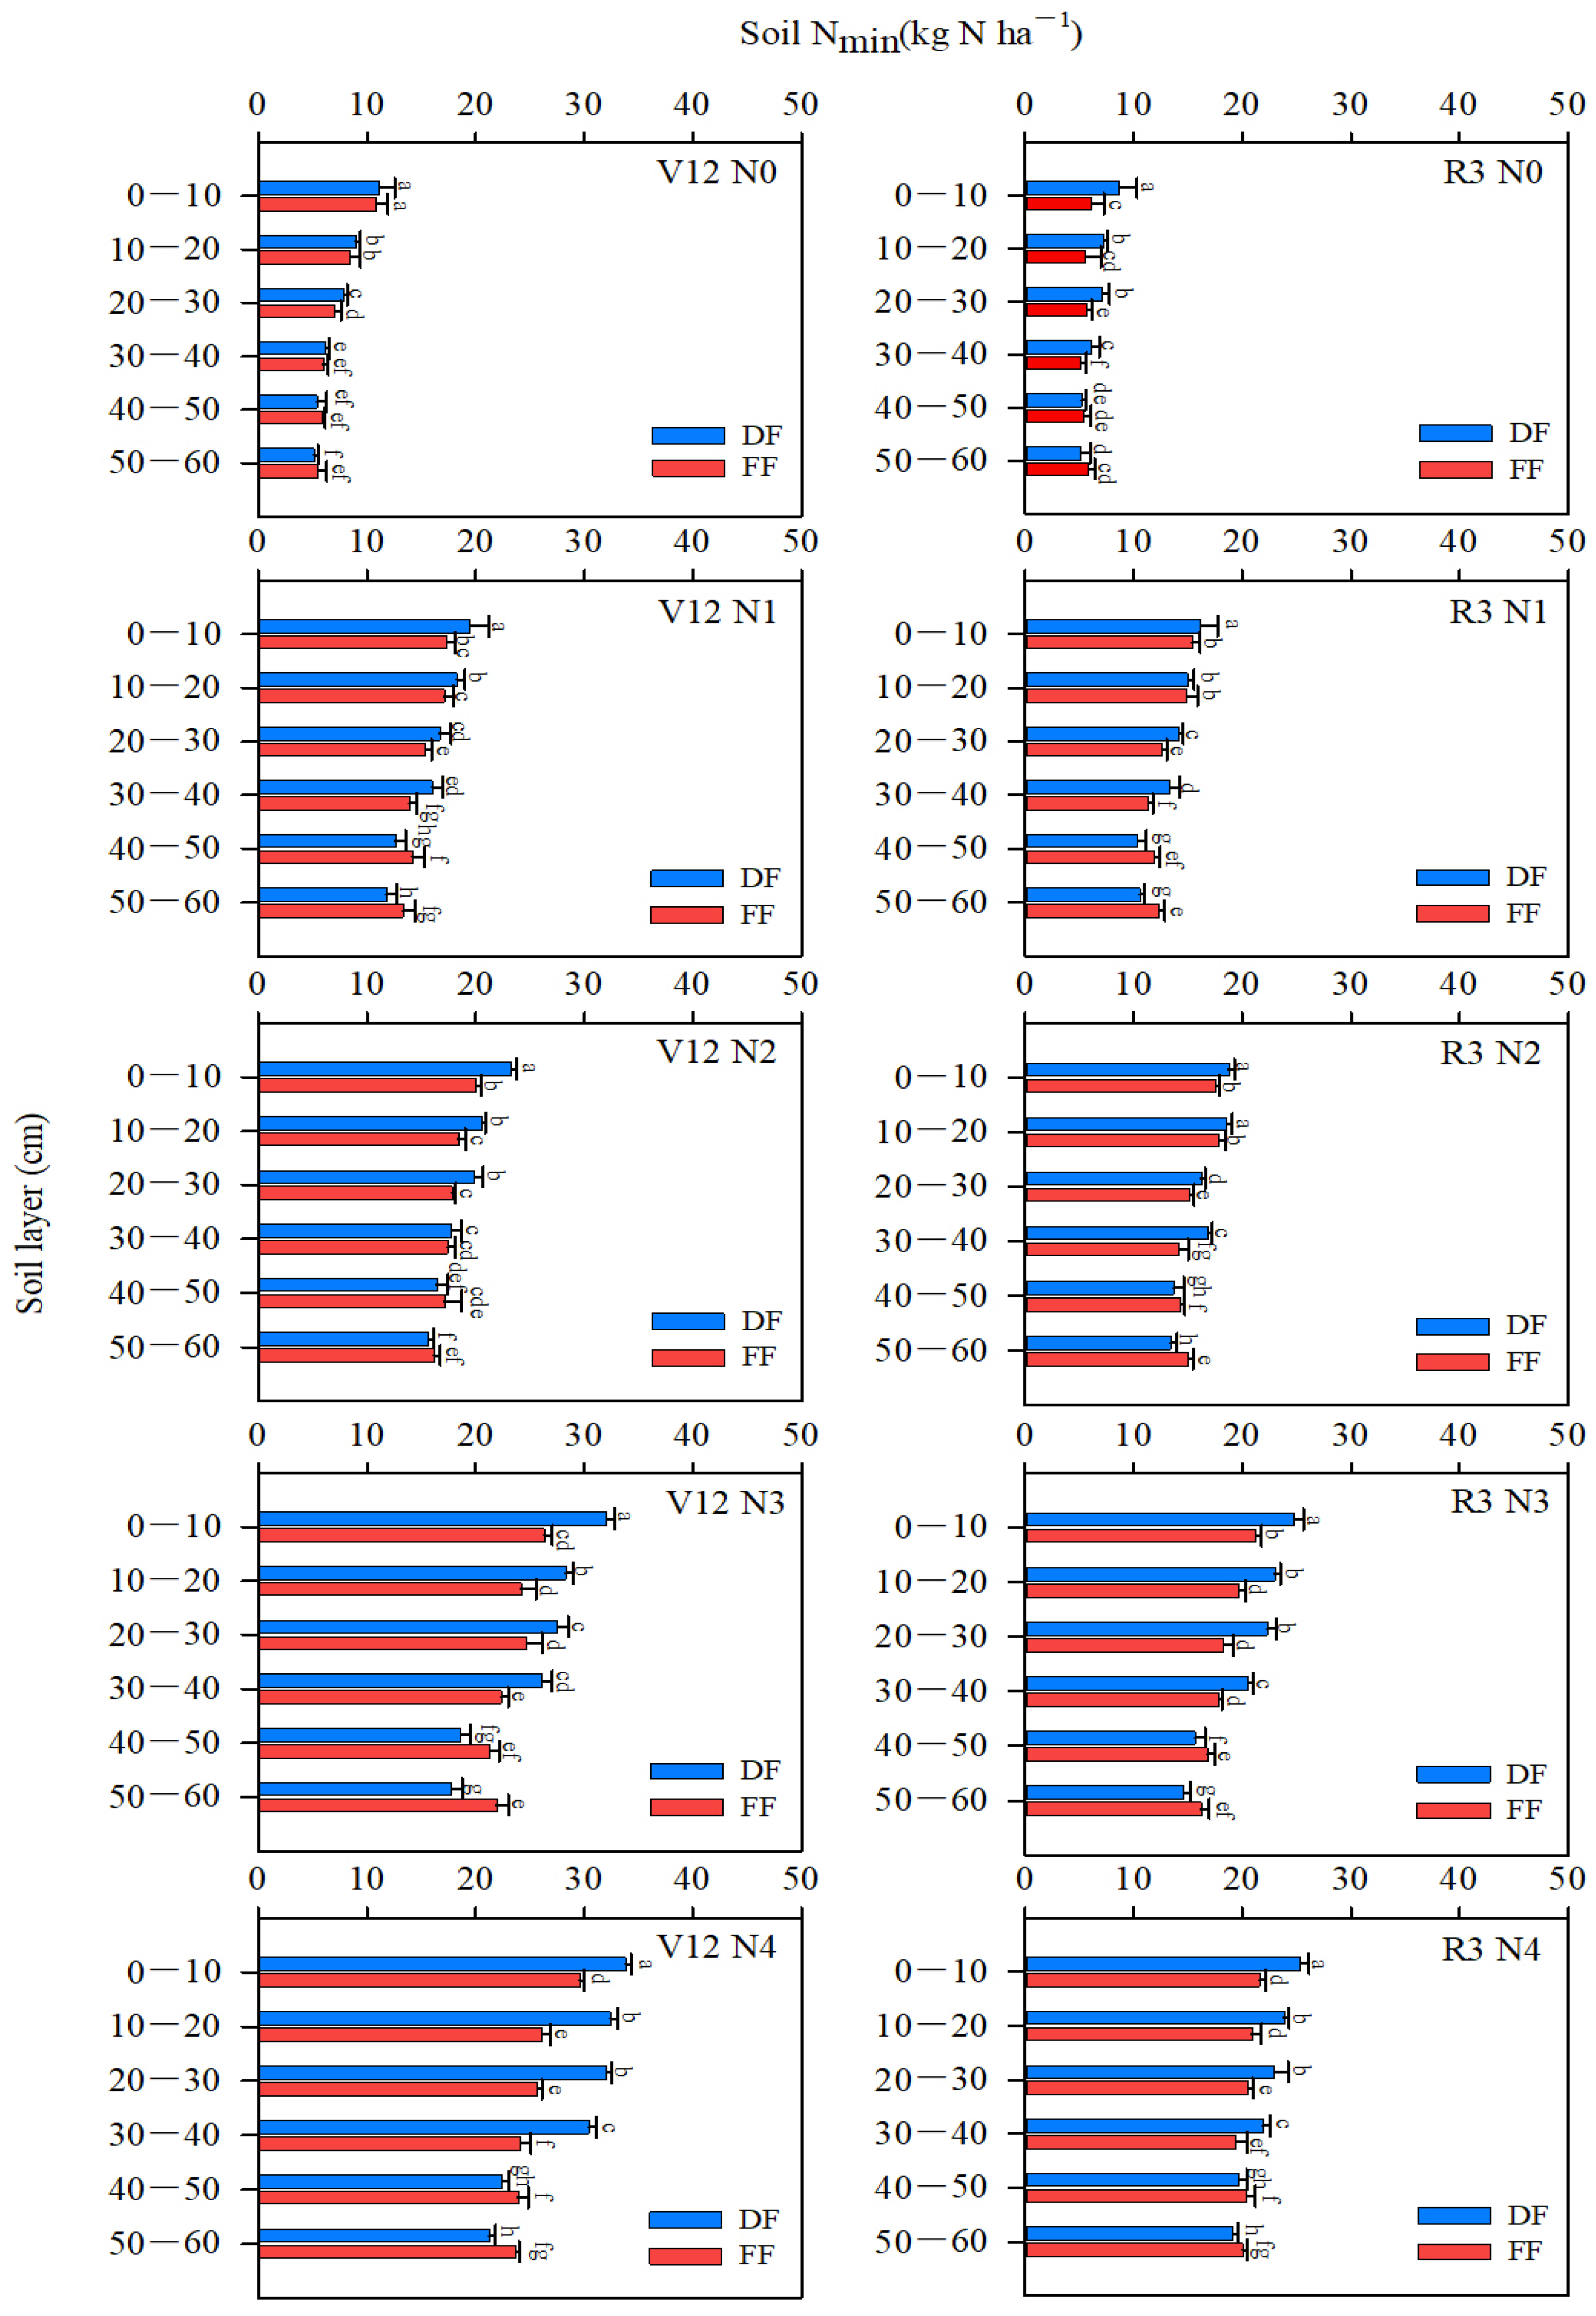
2.3.3. Soil Mineral N Content (Nmin)

Nmin (including ammonium N and nitrate N) was measured in 10-cm increments to a depth of 60 cm at the V12 and R3 maize growth stages in 2016. Soil samples were obtained at equidistant points between pairs of plants. 2 mol L−1 KCI was used to extract the soil samples for subsequent determination of ammonium and nitrate nitrogen by a continuous flow auto-analyzer.

2.3.4. Leaf Area Index

Plant samples were collected to determine all leaf areas of harvest plants at developmental stages of V6, V12, R1, R3 and R6. Five plants were selected from the center rows in each sub-plot, and the length and widest parts of the green leaves were measured to calculate the area as follows [39]: leaf   area = length × width × 0.75 , which was then used to calculate the leaf area index (LAI):
LAI = leaf   area ( m 2   plant 1 ) × plant   density ( plants   ha 1 ) 10,000 ( m 2   ha 1 )

2.3.5. Dry Matter Accumulation

DM accumulation in plants was measured at the V6, V12, R1, R3 and R6 periods. Three plants were selected from the center rows in each sub-plot and dried at 105 °C for 30 min, then at 85 °C to a constant water content before being weighed. The daily DM accumulation rate was calculated based on Equation (3) using Origin 8.0 software, which is the first-order derivative of the logistic equation [22].
d y d x = a b c e c x ( 1 + b e c x ) 2
where a is the final DM, b is the initial DM, c is the parameter representing growth rate, e is a natural constant, d is derivation operation, x is the days for DM accumulation, and y is the total DM accumulation.

2.3.6. N Accumulation

The N concentration in plants was measured for each DM sample using the Kjeldahl procedure. The N contents were calculated using N concentration and the weight of DM in each organ. The total N accumulation in plants was computed as the sum of N contents in the leaves, stalks, and ears [22].

2.3.7. Grain Yield

At harvest, about 24 m2 (central four rows (2.4 m) of each plot, 10 m long) of each plot were harvested to measure grain yield (Figure 2), which was calculated after adjusting the grain moisture content to 14%. Ears in the four center rows were counted to calculate the ear number per unit area. The 1000-kernel weight was calculated from the average weight of three random samples of 500 grains, while kernel number per ear was recorded as the number of kernels averaged across 20 ears for each replicate. The kernel weight was measured after oven drying at 70 °C until constant weight [38].

2.3.8. N Use Efficiency

N partial factor productivity (PFPN) and the agronomic N efficiency (AEN) were calculated as shown below [40]:
PFP N = grain   yield N   application   amount
AE N = grain   yield   with   applied   N grain   yield   without   N N   application   amount

2.3.9. Water Use Efficiency

Soil water content was measured at planting and just before harvest in 2016 and 2017. Soil samples were collected at 10 cm increments down to 1 m using an auger (4.5 cm in diameter). Seasonal evapotranspiration (ET) was calculated by the formula below [40]:
ET = P + I + W D
where P and I are precipitation and irrigation (mm), W is the difference between soil water contents at sowing and harvesting (mm), and D is drainage below the crop roots (mm). Surface runoff was not considered because the vertical barriers and dikes contained runoff within each plot. Drainage was assessed by a recharge coefficient (a) multiplied by irrigation (I) [40]:
D = a I
The recharge coefficient (a) depends on soil texture and irrigation or precipitation. In this experiment, when the depth of irrigation or precipitation is ≤90 mm, the recharge coefficient (a) is 0.15; when irrigation or precipitation is ≤90–120 mm, the recharge coefficient (a) is 0.2.
The WUE values for the grain yields were obtained as shown below [36]:
WUE = GY / ET
where GY is grain yield (kg ha−1), and ET is the maize ET (mm), which was calculated by Equation (6).

2.3.10. Economic Benefits

An economic analysis was conducted to compare the returns of the various drip irrigation and fertigation levels [41].
Gross   income = Grain   yield × Price   per   kilogram
Net   income = gross   income total   cos ts
Total   cos ts = Fertilizer + Irrigation   equipment + Water , electricity + labor + Machinery + seed + pesticide
Fertilizer (common urea, P2O5 as Ca (H2PO4), K2O as KCl, and water-soluble urea), labor (land preparation, sowing, irrigation, fertilizer application, spraying and harvesting), and the drip irrigation system (pipe for mains, sub-mains, and laterals, fertilizer unit, filters, pressure gauges, control valves, water meter, and other accessories) were computed on the basis of depreciation cost of the whole drip system.

2.4. Statistics

Analysis of variance (ANOVA) was performed using the SPSS version 20.0 software (SPSS Inc., Chicago, IL, USA) Grain yield, yield components, WUE, and NUE were subjected to a three-way ANOVA test using the general linear model, with year, irrigation, and N fertilization treatments as fixed effects. Dry matter, DM accumulation rate, LAI, and N accumulation were subjected to repeated measure analyses with irrigation, N fertilization, with year, irrigation and sampling stage (repeated measurement) as fixed effects [42]. Soil water and mineral N contents were subjected to repeated measures analysis with irrigation, N fertilization, and soil layers (repeated measurement) as fixed effects. Mauchly’s test was used to validate the assumption of sphericity. When the variances of the differences between all pairs of repeated measures are not equal, the univariate analysis was replaced with a multivariate analysis involving Wilks’ Lambda. Residual normality was tested using quantile–quantile plots while the variance homogeneity was obtained by the Levene’s test. Means were compared using the Fisher’s LSD at α = 0.05.

3. Results

3.1. Soil Water Content

Soil water content (SWC) in the 0–100 cm layers at 10-cm increments were measured at maize developmental stages V12 and R3 in 2016, and varied by irrigation practice, soil layer, and their interaction (Figure 3). Across N fertilization treatments, the SWC in shallow soil layers were higher in the DF treatment compared to the FF treatment at V12 (0–10 cm, 14.6%; 10–20 cm, 19.1%; 20–30 cm, 29.4%; 30–40 cm, 44.9 cm) and R3 (0–10 cm, 5.3%; 10–20 cm, 5.2%; 20–30 cm, 5.3%; 30–40 cm, 25.4 cm). For deeper layers, the FF treatment had higher soil water contents than the DF treatment at V12 (60–70 cm, 12.5%; 70–80 cm, 35.1%; 80–90 cm, 13.9%; 90–100 cm, 8.9 cm) and R3 (60–70 cm, 19.9%; 70–80 cm, 36.4%; 80–90 cm, 7.6%; 90–100 cm, 8.3 cm). There was no significant difference in the SWC of the DF and FF treatments for the 40–50 and 50–60 cm soil layers at both V12 and R3 stages.

3.2. Mineral N Contents in Soils
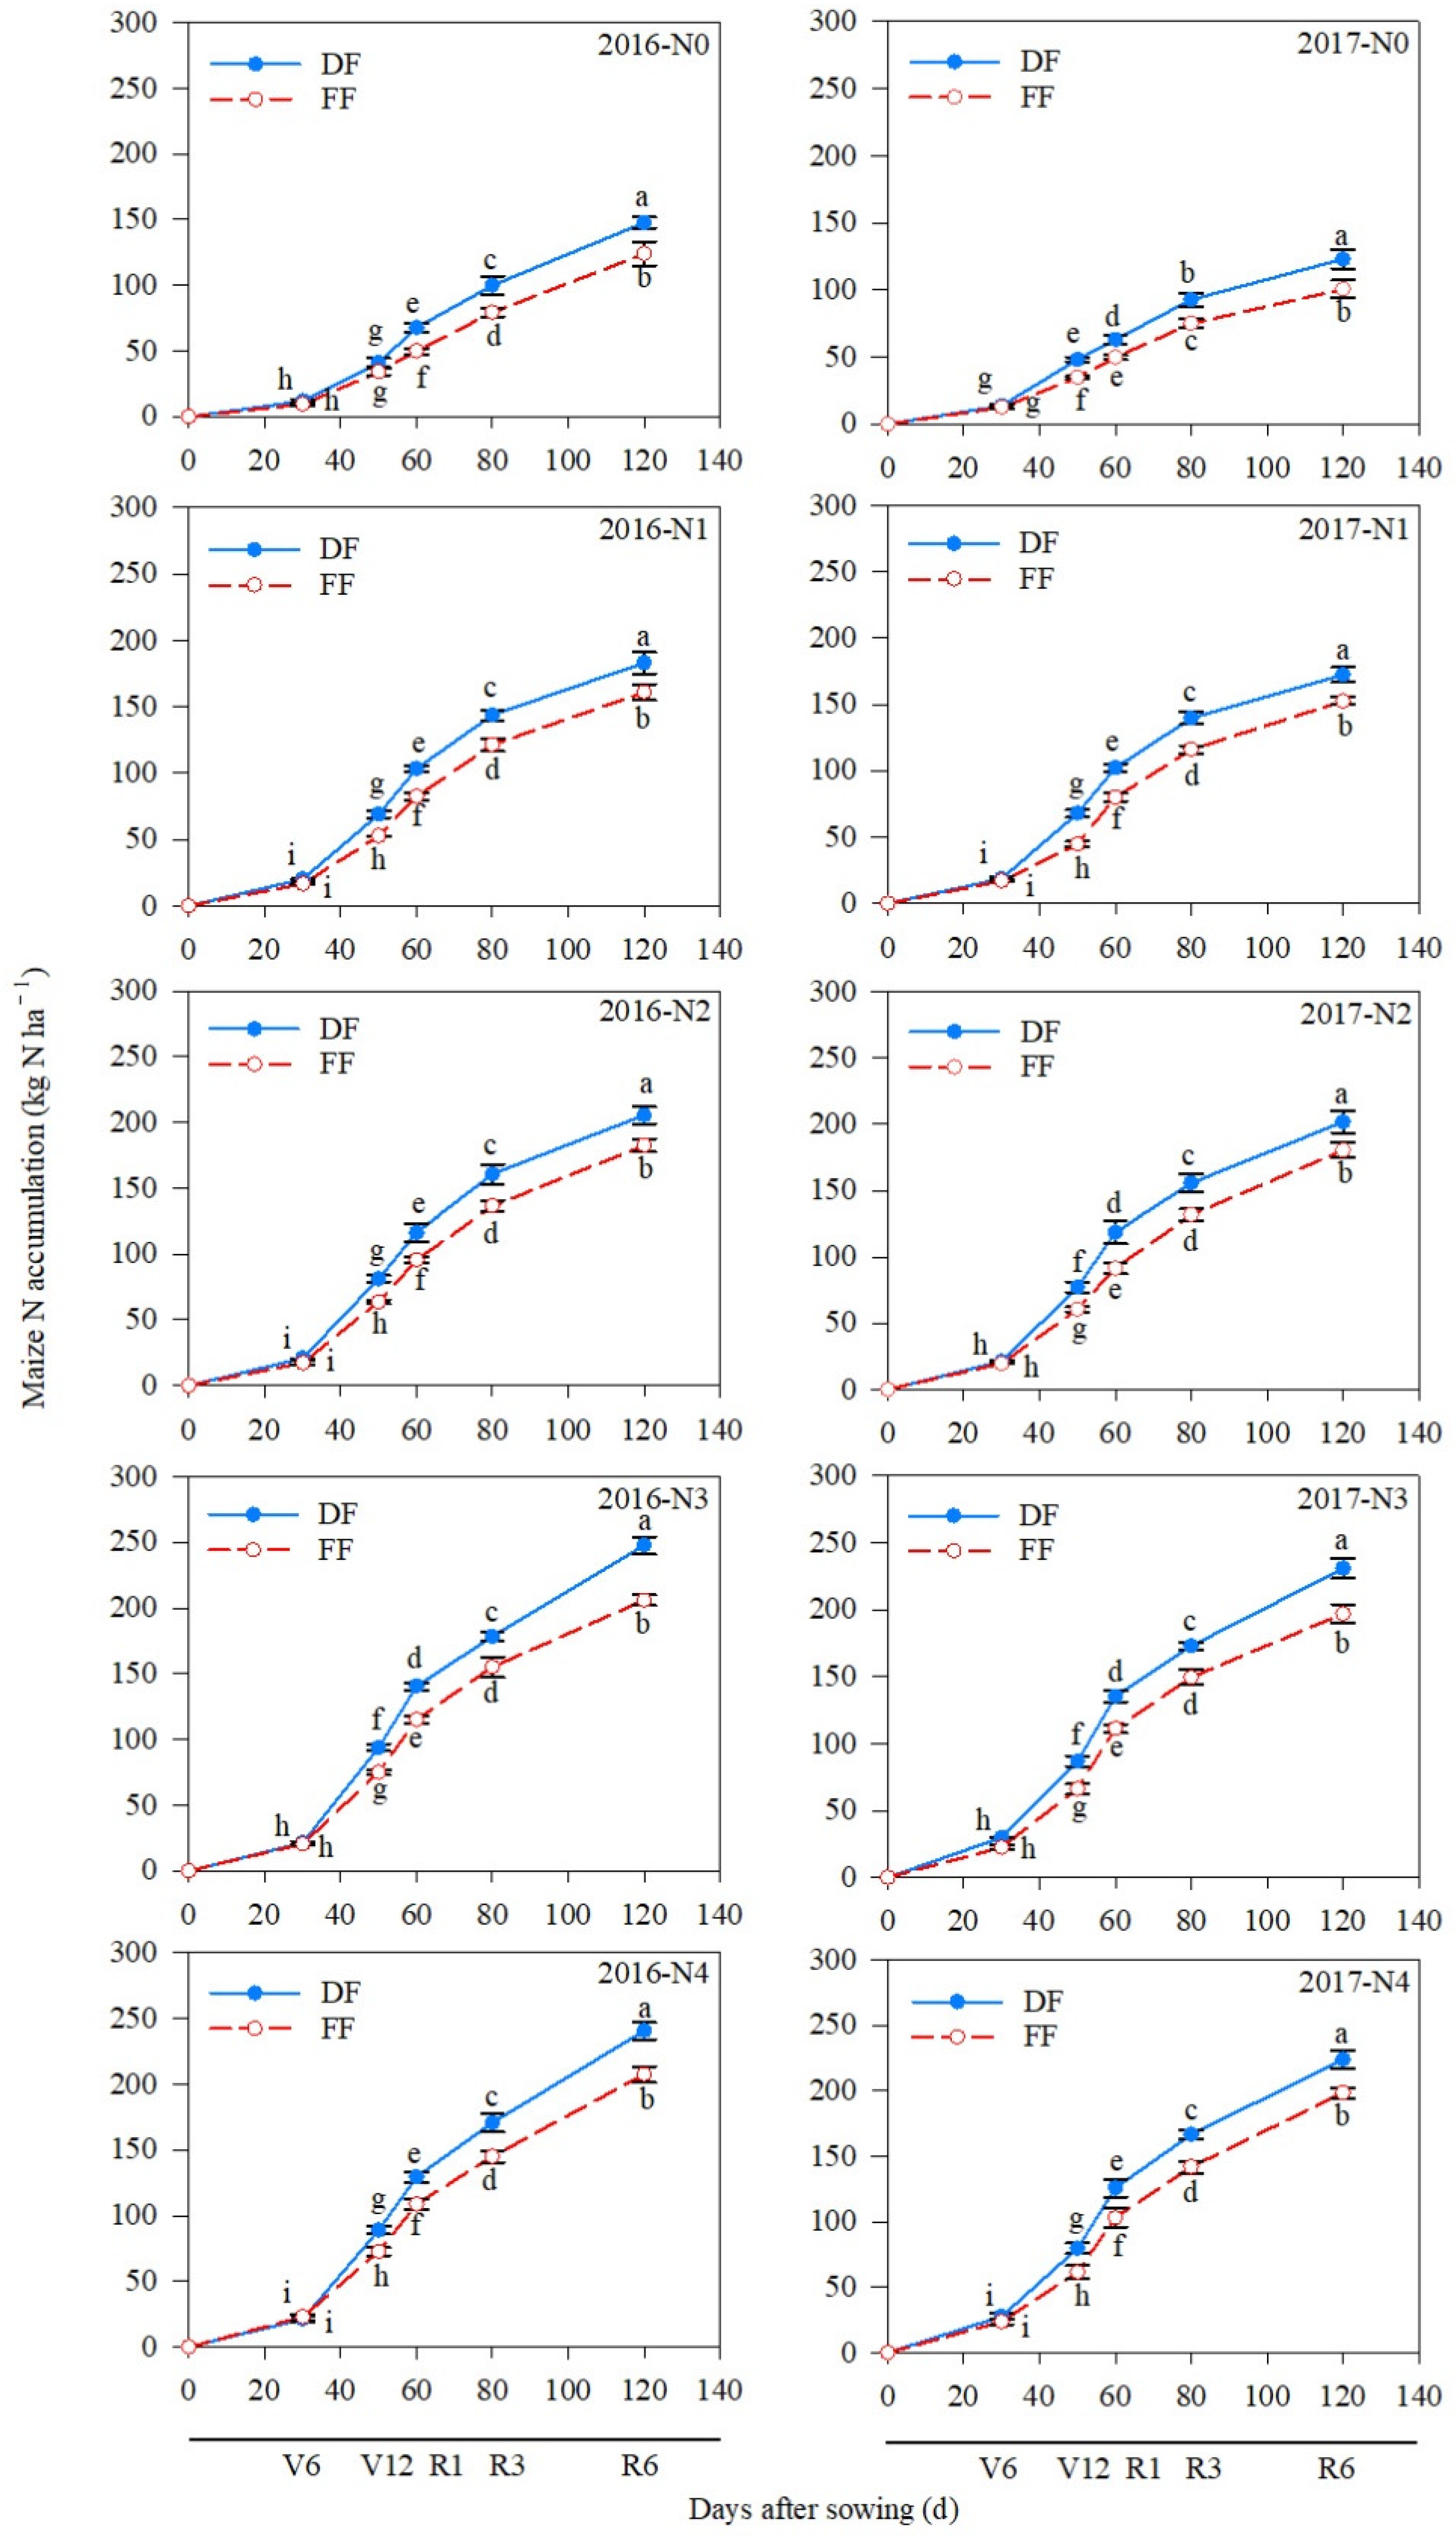
Soil Nmin in the 0–60 cm layer at 10-cm increments was measured at the V12 and R3 stages in 2016, and varied by growth stage, irrigation practice, N fertilization treatment, soil layer, and their interaction (Figure 4). At both V12 and R3 stages, for each N fertilization treatment, the soil Nmin values in the 0–10, 10–20, 20–30, and 30–40 cm layer for DF were greater than that of FF. However, the soil Nmin in the 40–50 and 50–60 cm layer for DF was lower than that of FF. For each irrigation practice (DF and FF), as the application rate of N fertilizer increased from 225 (N1) to 450 kg N ha−1 (N4), the soil Nmin in the 0–10, 10–20, 20–30, 30–40, 40–50, and 50–60 cm layer at the V12 and R3 stages was significantly increased, with a ranking order of N4 > N3 > N2 > N1 (Figure 4). At V12, the soil Nmin values in the 0–10, 10–20, 20–30, and 30–40 cm soil layer for N3 under DF were 32.0, 28.3, 27.5, and 26.1 kg N ha−1, which were 8.1%, 8.4%, 7.0%, and 8.3% greater than that of N4 under FF, respectively. At R3, the soil Nmin in the 0–10, 10–20, 20–30, and 30–40 cm soil layer for the N3 treatment under DF were 24.8, 23.0, 22.3, and 20.6 kg N ha−1, which were 14.7%, 10.0%, 8.6%, and 5.8% greater than that of the N4 treatment under FF, respectively.

3.3. N Accumulation

N accumulation varied by year, irrigation practice, N fertilization treatment, growth stages, and their interaction (Figure 5). In both years, maize plants in each N treatment under DF had significantly higher N accumulation from V12 to maturity (R6) compared to that under FF, with the exception of the N0 treatment in 2016 at the V12 stage. Under DF, N accumulation from V12 to R6 for the N3 and N4 treatments was greater than all other N rate treatments for each year. Under FF, N accumulation in both years from V12 to R6 (maturity) increased as the application rate of N increased, with a ranking order of N4 >N3 > N2 > N1. At V12, the N accumulation for the N3 treatment under DF was 93.8 and 86.8 kg N ha−1 in 2016 and 2017, respectively, which was 13.7% and 21.5% greater than that of the N4 treatment under FF. At maturity (R6), the total N accumulation for the N3 treatment under DF was 247.5 and 230.8 kg N ha−1 in 2016 and 2017, respectively, which was 13.9% and 10.8% greater than that of the N4 treatment under FF.

3.4. Leaf Area Index

The maize LAI varied by irrigation practice, N level, growth stages, and their interaction (Figure 6). In both years, maize for each N treatment under DF had significantly higher LAI values at the V12, R1, and R3 stages compared to that under FF. In both years under DF, the LAI for both the N3 and N4 treatments at the V12, R1, and R3 stages was significantly higher than all other treatments. In both years under FF, the LAI at the V12, R1, and R3 stage increased as the N rate increased, with a ranking order of N4 > N3 > N2 > N1. At V12, the LAI of the N3 treatment under DF was 3.60 and 3.75 m2 m−2 in 2016 and 2017, respectively, which was 8.8% and 14.0% greater than that of the N4 treatment under FF. At R3, the LAI of N3 under DF was 4.20 and 4.13 m2 m−2 in 2016 and 2017, respectively, which was 4.2% and 5.7% greater than that of the N4 treatment under FF.

3.5. DM and DM Accumulation Rates

Maize DM accumulation was affected by year, irrigation practice, N level, growth stages, or their interaction (Figure 7). In both years, maize for each N treatment under DF had significantly higher DM accumulation from R1 to maturity (R6) compared to that under FF. In each year under DF, the DM from R1 to R6 for the N3 and N4 treatments was greater than all other N treatments. In each year under FF, the DM accumulation from R1 to R6 increased as N rate increased, with a ranking order of N4 > N3 > N2 > N1. At R1, the DM accumulation of the N3 treatment under DF was 9.63 and 9.21 Mg ha−1 in 2016 and 2017, respectively, which was 21.1% and 26.0% higher than that of the N4 treatment under FF. At maturity (R6), the DM of the N3 treatment under DF was 21.0 and 19.8 Mg ha−1 in 2016 and 2017, respectively, which was 13.1% and 14.3% higher than that of the N4 treatment under FF.
The DM accumulation rate (DMR) was affected by year, irrigation practice, N level, growth stages, and their interaction (Figure 6). In both years, maize for each N level treatment under DF had significantly higher DMR from V12 to maturity compared to that under FF. In each year under DF, the DMR for the N3 and N4 treatments from V12 to R6 was greater than all other N treatments. In both years under FF, the DMR was significantly different among all N treatments in the order of N4 > N3 > N2 > N1. From V12 to R1, the DMR of the N3 treatment under DF was 1.05 and 0.98 Mg ha−1 d−1 in 2016 and 2017, respectively, which was 18.2% and 13.3% higher than that of the N4 treatment under FF. From R3 to R6, the DMR of the N3 treatment under DF was 0.51 and 0.50 Mg ha−1 d−1 in 2016 and 2017, respectively, which was 20.6% and 20.3% higher than that of the N4 treatment under FF.

3.6. Grain Yield and Yield Components

Irrigation and N treatments and their interactions significantly affected grain yields (Table 4). In both years, maize grain yield for each N level (except for the N0 treatment in 2016) under DF was greater than that under FF. Under DF, the maize grain yield for the N3 and N4 treatments was greater than all other N treatments in both years. Under FF, the maize grain yield increased as N rate increased in each year, with a ranking order of N4 > N3 > N2 > N1. Moreover, the grain yield of the N3 treatment under DF was 10.4 and 10.2 Mg ha−1 in 2016 and 2017, respectively, which was 7.2% and 7.4% greater than that of the N4 treatment under FF. Kernel number and kernel weight varied by irrigation, N rate, and their interaction (Table 4). In both years, the kernel number per ear and 1000-kernel weight for each N treatment (except for the N0 treatment in 2017) under DF were greater than that under FF. Under DF, the kernel number per ear and 1000-kernel weight of the N3 and N4 treatments were greater than all other N treatments in each year. Under FF, the kernel number per ear and 1000-kernel weight of the N4 treatment were greater than that of other treatments in both years. Moreover, the kernel number per ear and 1000-kernel weight of the N3 treatment under DF were 7.1% and 7.5%, 5.3% and 5.6% greater than that of the N4 treatment under FF in 2016 and 2017, respectively.

3.7. Water and Nitrogen Use Efficiency

ET and WUE were affected by year, irrigation practice, N treatment, and their interaction (Table 5). In both years, the ET for each N fertilization treatment under DF was lower than that under FF, while the WUE for each N treatment under DF was greater than that under FF. Within each year, the WUE of the N3 treatment under DF was greater than all other N rate and irrigation treatment combinations. Moreover, the WUE of the N3 treatment under DF was 2.53 and 2.71 kg m−3 in 2016 and 2017, respectively, which was 68.7% and 49.7% greater than that of the N4 treatment under FF.
The AEN and PFPN varied by irrigation practice, N treatment and their interaction (Table 5). In both years, the AEN and PFPN for each N treatment under DF were greater than those under FF. In both years under each irrigation practice, both AEN and PFPN decreased as N rate increased, with a ranking order of N1 > N2 > N3 > N4. The AEN and PFPN of the N3 treatment under DF were 18.1 and 27.7 kg kg−1, 18.4 and 27.2 kg kg−1 in 2016 and 2017, respectively, which was 31.2% and 28.2%, 29.6% and 28.9% greater than that of the N4 treatment under FF.

3.8. Economic Benefits

The analysis of economic benefits is shown in Table 6. The maize gross income and net income of DF increased by 244.4 $/hm2 and 212.1 $/hm2, 150.1 $/hm2 and 132.1 $/hm2, by 13.6% and 12.1%, 15.9% and 14.5%, compared with FF, in 2016 and 2017, respectively. In both years, the gross income and net income of the N3 treatment for DF was higher than that of other treatments under DF. For FF, the N4 treatment gave a higher gross and net income than other FF treatments. The gross income and net income of the N3 treatment under DF was higher than that of the N4 treatment under FF. Gross income for the N3 treatment of DF was 237.8 $/hm2 and 136.4 $/hm2 higher in 2016 and 2017, respectively, compared to the N4 treatment under FF. Net income for the N3 treatment under DF was 214.0 $/hm2 and 136.4 $/hm2 higher in 2016 and 2017, respectively, compared with the N4 treatment under FF.

4. Discussion

Finding ways of simultaneously increasing grain yield and nitrogen use efficiency as well as reduce environmental impact has been a major challenge in maize production in the NCP. Irrigation practice and N management, and their interaction, are important parameters influencing maize productivity [8,43,44,45,46,47]. Previous studies have shown that drip fertigation, which integrates drip irrigation and N management, can improve maize grain yields and nitrogen use efficiency concurrently [48]. In our study, the grain yield of maize under DF was greater than that under FF across years and N treatments, and the greatest yields across N treatments were obtained for the N3 treatment under DF and the N4 treatment under FF. Moreover, the grain yield of the N3 treatment under DF was 7.2% and 7.4% greater than that of the N4 treatment under FF in both 2016 and 2017. This agrees with previously published data. Thus, under drip irrigation, a similar or higher grain yield can be obtained at a relatively lower N rate compared with flood irrigation with a higher N rate [23,49]. Yield increases by using DF or increasing N rate were mainly the result of greater kernel number per ear and 1000-kernel weight, which is consistent with the findings from other studies that show that drip fertigation [22] or N application [50] can affect crop yields through its influence on the yield components.
Other works also reported that maize grain yields are positively correlated with DM accumulation [51,52]. We demonstrated that the increased grain yield of maize under DF or increasing N rates was mainly due to increased DM accumulation both pre- and post-silking, and DM accumulation pre- and post-silking for the N3 treatment under DF was the greatest across irrigation and N treatments. Furthermore, maize DM accumulation was mainly driven by N uptake, which influenced both LAI and plant N content [53,54]. In this study, The N accumulation of DF from V12 to R6 stage was significantly higher than that of FF, and the nitrogen accumulation of the N3 treatment was the highest under DF. Under FF, the N4 treatment had the highest nitrogen accumulation. N accumulation for the N3 treatment under DF from V12 to silking and post-silking was higher than that for the N4 treatment under FF. Greater N accumulation during pre-silking increases leaf area and interception of solar radiation and increases the photo assimilate capacity and DM production [55,56]. Thus, the LAI of DF from the V12 to R3 stage was significantly higher than that of FF. Compared with the N4 treatment under FF, the N3 treatment under DF significantly increased LAI from V12 to silking stage, which resulted in a greater DM accumulation of the N3 treatment under DF at R1 compared to that for the N4 treatment under FF. Moreover, sufficient N accumulation during post-silking can maintain high leaf area and photosynthesis [51,56,57] leading to more DM post-silking [58,59]. As a result, the DM of DF from the R1 to R6 stage was significantly higher than that of FF, and the DM of the N3 treatment was the highest under DF. Under FF, the N4 treatment had the highest DM. The increased post-silking LAI of the N3 treatment under DF promoted greater DM accumulation from R1 to R6 compared with the N4 treatment under FF. Previous studies also demonstrated that enhanced N accumulation during maize pre-silking exerts a positive effect on the C and N metabolism for developing kernels [49,60], while sufficient post-silking N supply can promote maize ability to support grain filling. Consequently, the N3 treatment under DF could significantly increase the kernel number per ear and 1000-kernel weight compared to the N4 treatment under FF.
The results showed that drip irrigation could affect the distribution of soil water and nitrogen, increase the content of soil water and nitrogen, allowing the root system to uptake more water and nitrogen [24,47]. In this study, the SWC of DF in the 0–40 cm soil depth at V12 and R3 was greater than that of FF, which maintained a greater soil mineral N content (Nmin) in each soil layer. Moreover, the soil Nmin in the 0–40 cm soil layer for the N3 treatment under DF was 30.4% and 11.5% greater than that of the N4 treatment under FF at the V12 and R3 stages, respectively. As a result, greater N accumulated in maize from V12 to silking and post-silking for the N3 treatment under DF compared with the N4 treatment under FF. It may be that the experiment was conducted in a medium to low yielding field with high permeability and low water and nutrient retention capacities [61]. However, drip irrigation enables the water and N fertilizer typically applied in smaller quantities to largely remain in the upper soil layers [24]. Thus, the optimum nitrogen application rate under DF was lower than that under FF. Due to increased N accumulation and grain yield for the N3 treatment under DF compared with the N4 treatment under FF, the use of DF improved the AEN and PFPN. However, the AEN, PFPN, and WUE in our study was less than that in other studies [9,62] due to medium to the low yielding field conditions the experiment was conducted in. Numerous studies have suggested that drip fertigation has the great potential to enhance water use efficiency by synchronizing the water supply with crop demand [22,23]. Our result showed that because of the increased grain yield and reduced ET for DF compared to FF, the use of DF resulted in significant improvements in WUE. The WUE of the N3 treatment under DF was greater than that for the N4 treatment under FF. This result is consistent with other studies that showed an increase in water use efficiency was observed under drip fertigation [53,63,64,65].
Economic benefit is the ultimate embodiment of the advantages and disadvantages of different water and fertilizer technologies, and it is also an important index to measure its sustainable development [41]. The cost of equipment and water-soluble fertilizer for drip irrigation is higher, but better economic benefit and profitability can be obtained if it is applied properly in areas with frequent drought and large-scale operation [66]. Although drip irrigation increases the costs of maize production including material inputs and mounting cost due to the installation of a drip irrigation system, but it could reduce the consumption of water and fertilizer, while reducing labor costs. In this study, the gross income and net income of drip irrigation were higher than those of flood irrigation. These findings are in agreement with Sadarunnisa et al. [67]. Under the condition of drip irrigation, the appropriate amount of nitrogen application can increase the yield of maize and increase the net income of maize. Therefore, the net income of the N3 treatment under drip irrigation was higher than that of the N4 treatment under FF. Therefore, drip fertilization can not only increase the income, but also reduce the input of nitrogen fertilizer and reduce the environmental cost.

5. Conclusions

Our results demonstrated that drip irrigation (DF) improved the soil water content in the 0–40 cm layer and maintained a greater soil Nmin of those soil layers. This resulted in a greater soil Nmin in the 0–40 cm soil layer for the N3 treatment under DF compared to the N4 treatment under FF. This allowed maize to accumulate more N at both pre- and post-silking in the N3 treatment under DF compared to the N4 treatment under furrow irrigation (FF). As a result, maximum maize yield (10.4 Mg ha−1) was achieved under the N3 treatment (375 kg N ha−1) using DF with a 20% reduction in N fertilizer input compared with the N4 (450 kg N ha−1) treatment using FF. The AEN, PFPN, WUE and net income for the N3 treatment using DF were the highest. The results of this experiment showed that drip fertilization can improve maize grain yield and increase economic metrics using a relatively lower water consumption and N application rate compared with flood irrigation.

Author Contributions

Data curation, D.G., C.C. and Z.D.; Formal analysis, B.Z., D.M. and W.M.; Funding acquisition, D.G. and B.Z.; Investigation, D.G. and C.C.; Project administration, W.D.B.; Software, D.M. and M.Z.; Writing—original draft, X.H. and M.D.; Writing—review & editing, M.L. and W.M. All authors have read and agreed to the published version of the manuscript.

Funding

This work was supported by the National Key Research and Development Project (2017YFD0301307 and 2018YFD0200601), the National Natural Science Foundation of China (31971851), and the Key Research and Development Project of Hebei Province (21326409D).

Conflicts of Interest

The authors declare no conflict of interest.

References

  1. Li, S.K.; Zhao, J.R.; Dong, S.T.; Zhao, M.; Li, C.H.; Cui, Y.H.; Liu, Y.H.; Gao, J.L.; Xue, J.Q.; Wang, L.C.; et al. Advances and prospects of maize cultivation in China. Acta Agron. Sin. 2017, 50, 1941–1959. [Google Scholar]
  2. Editorial Committee of China Agricultural Yearbook. China Agricultural Yearbook; China Agricultural Publishing House: Beijing, China, 2018. [Google Scholar]
  3. White, C.M.; Finney, D.M.; Kemanian, A.R.; Kaye, J.P. Modeling the contributions of nitrogen mineralization to yield of corn. Agron. J. 2021, 113, 4523. [Google Scholar] [CrossRef]
  4. Zhu, Z.L.; Chen, D.L. Nitrogen fertilizer use in China–Contributions to food production, impacts on the environment and best management strategies. Nutr. Cycl. Agroecosyst. 2002, 63, 117–127. [Google Scholar] [CrossRef]
  5. Burney, J.A.; Davis, S.J.; Lobell, D.B. Greenhouse gas mitigation by agricultural intensification. Proc. Natl. Acad. Sci. USA 2010, 107, 12052–12057. [Google Scholar] [CrossRef] [Green Version]
  6. Sylvester-Bradley, R.; Kindred, D.R. Analysing nitrogen responses of cereals to prioritize routes to the improvement of nitrogen use efficiency. J. Exp. Bot. 2009, 60, 1939–1951. [Google Scholar] [CrossRef] [Green Version]
  7. Cui, Z.L.; Chen, X.P.; Zhang, F.S. Current nitrogen management status and measures to improve the intensive wheat-maize system in China. Ambio 2010, 39, 376–384. [Google Scholar] [CrossRef] [Green Version]
  8. Meng, Q.F.; Chen, X.P.; Zhang, F.S.; Cao, M.H.; Cui, Z.L.; Bai, J.S.; Yue, S.C.; Chen, S.Y.; Müller, T. In-season root-zone nitrogen management strategies for improving nitrogen use efficiency in high-yielding maize production in China. Pedosphere 2012, 22, 294–303. [Google Scholar] [CrossRef]
  9. Meng, Q.F.; Sun, Q.P.; Chen, X.P.; Cui, Z.L.; Yue, S.C.; Zhang, F.S.; Romheld, V. Alternative cropping systems for sustainable water and nitrogen use in the North China Plain. Agric. Ecosyst. Environ. 2012, 146, 93–102. [Google Scholar] [CrossRef]
  10. He, P.; Li, S.; Jin, L.Y.; Wang, H.T.; Li, C.J.; Wang, Y.L. Performance of an optimized nutrient management system for double-cropped wheat–maize rotations in North-central China. Agron. J. 2009, 101, 1489–1496. [Google Scholar] [CrossRef]
  11. Ju, X.T.; Xing, G.X.; Chen, X.P.; Zhang, S.L.; Zhang, L.J.; Liu, X.J.; Cui, Z.L.; Yin, B.; Christie, P.; Zhu, Z.L.; et al. Reducing environmental risk by improving N management in intensive Chinese agricultural systems. Proc. Natl. Acad. Sci. USA 2009, 106, 3041–3046. [Google Scholar] [CrossRef] [Green Version]
  12. Ju, X.T.; Kou, C.L.; Zhang, F.S.; Christie, P. Nitrogen balance and groundwater nitrate contamination: Comparison among three intensive cropping systems on the North China Plain. Environ. Pollut. 2006, 143, 117–125. [Google Scholar] [CrossRef] [PubMed] [Green Version]
  13. Guo, J.H.; Liu, X.J.; Zhang, Y.; Shen, J.L.; Han, W.X.; Zhang, W.F. Significant acidification in major Chinese crop lands. Science 2010, 327, 1008–1010. [Google Scholar] [CrossRef] [PubMed] [Green Version]
  14. Zhang, Z.; Tao, F.L.; Du, J.A.; Shi, P.J.; Yu, D.Y.; Meng, Y.B.; Sun, Y. Surface water quality and its control in a river with intensive human impacts-a case study of the Xiangjiang River, China. J. Environ. Manag. 2010, 91, 2483–2490. [Google Scholar] [CrossRef] [PubMed]
  15. Liu, X.B.; Zhang, X.Y.; Wang, Y.X.; Sui, Y.Y.; Zhang, S.L.; Herbert, S.J.; Ding, G. Soil degradation: A problem threatening the sustainable development of agriculture in Northeast China. Plant Soil Environ. 2010, 56, 87–97. [Google Scholar] [CrossRef] [Green Version]
  16. Steffen, W.; Richardson, K.; Rockstrom, J.; Cornell, S.E.; Fetzer, I.; Bennett, E.M.; Biggs, R. Planetary boundaries: Guiding human development on a changing planet. Science 2015, 347, 6223. [Google Scholar] [CrossRef] [PubMed] [Green Version]
  17. Wang, H.X.; Liu, C.M.; Zhang, L. Water-saving agriculture in China: An overview. Adv. Agron. 2002, 75, 135–171. [Google Scholar] [CrossRef]
  18. Ding, L.; Wang, K.J.; Jiang, G.M.; Liu, M.Z.; Niu, S.L.; Gao, L.M. Post-anthesis changes in photosynthetic traits of maize hybrids released in different years. Field Crops Res. 2005, 93, 108–115. [Google Scholar] [CrossRef]
  19. Kumar, D.S.; Sharma, R.; Brar, A.S. Optimising drip irrigation and fertigation schedules for higher crop and water productivity of oilseed rape (Brassica napus L.). Irrig. Sci. 2021, 5, 452. [Google Scholar] [CrossRef]
  20. Silber, A.; Xu, G.; Levkovitch, I.; Soriano, S.; Bilu, A.; Wallach, R. High fertigation frequency: The effects on uptake of nutrients, water and plant growth. Plant Soil. 2003, 253, 467–477. [Google Scholar] [CrossRef]
  21. Farneselli, M.; Benincasa, P.; Tosti, G.; Simonne, E.; Guiducci, M.; Tei, F. High fertigation frequency improves nitrogen uptake and crop performance in processing tomato grown with high nitrogen and water supply. Agric. Water Manag. 2015, 154, 52–58. [Google Scholar] [CrossRef]
  22. Zhou, B.Y.; Sun, X.F.; Ding, Z.S.; Ma, W.; Zhao, M. Multisplit nitrogen application via drip irrigation improves maize grain yield and nitrogen use efficiency. Crop Sci. 2017, 57, 1687–1703. [Google Scholar] [CrossRef] [Green Version]
  23. Zhou, B.Y.; Ma, D.; Sun, X.F.; Ding, Z.S.; Li, C.F.; Ma, W.; Zhao, M. Straw mulching under a drip irrigation system improves maize grain yield and water use efficiency. Crop Sci. 2019, 59, 2806–2819. [Google Scholar] [CrossRef]
  24. Bar-Yosef, B. Advances in fertigation. Adv. Agron. 1999, 65, 1–75. [Google Scholar]
  25. Wang, H.D.; Li, J.; Cheng, M.H.; Zhang, F.C.; Wang, X.K.; Fan, J.L.; Wu, L.F.; Fang, D.P. Optimal drip fertigation management improves yield, quality, water and nitrogen use efficiency of greenhouse cucumber. Sci. Hortic. 2019, 243, 357–366. [Google Scholar] [CrossRef]
  26. Si, Z.Y.; Zain, M.; Mehmood, F.; Wang, G.S.; Gao, Y.; Duan, A.W. Effects of nitrogen application rate and irrigation regime on growth, yield, and water-nitrogen use efficiency of drip-irrigated winter wheat in the North China Plain. Agric. Water Manag. 2020, 231, 106002. [Google Scholar] [CrossRef]
  27. Wang, D.; Li, G.Y.; Mo, Y.; Cai, M.K.; Bian, X.Y. Evaluation of optimal nitrogen rate for corn production under mulched drip fertigation and economic benefits. Field Crop Res. 2018, 216, 225–233. [Google Scholar] [CrossRef]
  28. Zhang, X.; Meng, F.Q.; Li, H.; Wang, L.G.; Wu, S.X.; Xiao, G.M.; Wu, W.L. Optimized fertigation maintains high yield and mitigates N2O and NO emissions in an intensified wheat–maize cropping system. Agric. Water Manag. 2019, 211, 26–36. [Google Scholar] [CrossRef]
  29. Lv, H.F.; Lin, S.; Wang, Y.F.; Lian, X.J.; Zhao, Y.M.; Li, Y.J.; Du, J.Y.; Wang, Z.X.; Wang, J.G.; Butterbach-Bahl, K. Drip fertigation significantly reduces nitrogen leaching in solar greenhouse vegetable production system. Environ Pollut. 2019, 245, 694–701. [Google Scholar] [CrossRef]
  30. Li, H.R.; Hao, W.P.; Liu, Q.; Mao, L.L.; Nangia, V.; Guo, R.; Mei, X.R. Developing nitrogen management strategies under drip fertigation for wheat and maize production in the North China Plain based on a 3–year field experiment. J. Plant Nutr. Soil Sci. 2019, 182, 335–346. [Google Scholar] [CrossRef]
  31. Shao, G.Q.; Li, Z.J.; Ning, T.Y.; Zheng, Y.H. Responses of photosynthesis, chlorophyll fluorescence, and grain yield of maize to controlled-release urea and irrigation after anthesis. J. Plant Nutr. Soil Sci. 2013, 176, 595–602. [Google Scholar] [CrossRef]
  32. Yeomans, J.C.; Bremner, J.M. A rapid and precise method for routine determination of organic carbon in soil. Commun. Soil Sci. Plant Anal. 1988, 19, 1467–1476. [Google Scholar] [CrossRef]
  33. Bi, L.D.; Li, F.S. Physical and Chemical Analysis of Soil; Shanghai Science and Technology Press: Shanghai, China, 1978. [Google Scholar]
  34. Bremner, J.M. Nitrogen-total. In Methods of Soil Analysis, Part 3, Chemical Method; Sparks, D.L., Ed.; SSSA Book Series No. 5; Soil Science Society of America: Madison, WI, USA, 1996; pp. 1085–1121. [Google Scholar]
  35. Haby, V.A.; Russelle, M.P.; Skogley, E.O. Testing soils for potassium, calcium, and magnesium. In Soil Testing and Plant Analysis, 3rd ed.; Westerman, R.L., Ed.; SSSA Book Series No. 3; Soil Science Society of America: Madison, WI, USA, 1990; pp. 181–227. [Google Scholar]
  36. Fixen, P.E.; Grove, J.H. Testing soils for phosphorus. In Soil Testing and Plant Analysis, 3rd ed.; Westerman, R.L., Ed.; SSSA Book Series No. 3; Soil Science Society of America: Madison, WI, USA, 1990; pp. 141–180. [Google Scholar]
  37. Ma, S.Y.; Yu, Z.W.; Shi, Y.; Gao, Z.Q.; Luo, L.P.; Chu, P.F.; Guo, Z.J. Soil water use, grain yield and water use efficiency of winter wheat in a long-term study of tillage practices and supplemental irrigation on the North China Plain. Agric. Water Manag. 2015, 150, 9–17. [Google Scholar] [CrossRef]
  38. Mckee, G.W. A coefficient for computing leaf area in hybrid maize. Agron. J. 1964, 56, 240–241. [Google Scholar] [CrossRef]
  39. Zhou, B.Y.; Sun, X.F.; Wang, D.; Ding, Z.S.; Li, C.F.; Ma, W.; Zhao, M. Integrated agronomic practice increases maize grain yield and nitrogen use efficiency under various soil fertility conditions. Crop J. 2019, 7, 527–538. [Google Scholar] [CrossRef]
  40. Zhang, H.P.; Oweis, T. Water-yield relations and optimal irrigation scheduling of wheat in the Mediterranean region. Agric. Water Manag. 1999, 38, 195–211. [Google Scholar] [CrossRef]
  41. Li, Q.; Qin, Y.B.; Yin, C.X.; Kong, L.L.; Wang, M.; Hou, Y.P.; Sun, B.; Zhao, Y.K.; Xu, C.; Liu, Z.Q. Effects of drip irrigation on yield, nutrient absorption and economic benefit of maize. Sci. Agric. Sin. 2022, 55, 1604–1616, (In Chinese, with English abstract). [Google Scholar]
  42. Li, C. Implementation of variance analysis of repeated measurement data in SPSS16.0 software. Stat. Decis. 2011, 11, 34–36, (In Chinese, with English abstract). [Google Scholar] [CrossRef]
  43. Janovicek, K.; Banger, K.; Sulik, J.; Nasielski, J.; Deen, B. Delta yield based optimal nitrogen rate estimates for corn are often economically sound. Agron. J. 2020, 2, 521. [Google Scholar] [CrossRef]
  44. Diaz-Zorita, M. Effect of deep-tillage and nitrogen fertilization interactions on dryland corn (Zea mays L.) productivity. Soil Till. Res. 2000, 54, 11–19. [Google Scholar] [CrossRef]
  45. Miriti, J.M.; Kironchi, G.; Esilaba, A.O.; Heng, L.K.; Gachene, C.K.K.; Mwangi, D.M. Yield and water use efficiencies of maize and cowpea as affected by tillage and cropping systems in semi-arid Eastern Kenya. Agric. Water Manag. 2012, 115, 148–155. [Google Scholar] [CrossRef]
  46. Guan, D.H.; Al-Kaisi, M.M.; Zhang, Y.S.; Duan, L.S.; Tan, W.M.; Zhang, M.C.; Li, Z.H. Tillage practices affect biomass and grain yield through regulating root growth, root bleeding sap and nutrients uptake in summer maize. Field Crops Res. 2014, 157, 89–97. [Google Scholar] [CrossRef]
  47. Xu, J.; Han, H.F.; Ning, T.Y.; Li, Z.J.; Lal, R. Long-term effects of tillage and straw management on soil organic carbon, crop yield, and yield stability in a wheat-maize system. Field Crops Res. 2019, 233, 33–40. [Google Scholar] [CrossRef]
  48. Tarkalson, D.D.; Donk, S.V.; Petersen, J.L. Effect of nitrogen application timing on corn production using subsurface drip irrigation. Soil Sci. 2019, 174, 8514. [Google Scholar] [CrossRef] [Green Version]
  49. Nafziger, E.D.; Rapp, D. Corn yield response to late-split nitrogen fertilizer. Agron. J. 2020, 20, 472. [Google Scholar] [CrossRef]
  50. Xu, C.L.; Huang, S.B.; Tian, B.J.; Ren, J.H.; Meng, Q.F.; Wang, P. Manipulating Planting Density and Nitrogen Fertilizer Application to Improve Yield and Reduce Environmental Impact in Chinese Maize Production. Front Plant Sci. 2017, 12, 1234. [Google Scholar] [CrossRef] [PubMed]
  51. Ning, P.; Li, S.; Yu, P.; Zhang, Y.; Li, C.J. Post-silking accumulation and partitioning of dry matter, nitrogen, phosphorus and potassium in maize varieties differing in leaf longevity. Field Crops Res. 2013, 144, 19–27. [Google Scholar] [CrossRef]
  52. Yin, M.H.; Li, Y.N.; Xu, Y.B.; Zhou, C.M. Effects of mulches on water use in a winter wheat/summer maize rotation system in Loess Plateau, China. J. Arid Land. 2018, 2, 277–291. [Google Scholar] [CrossRef] [Green Version]
  53. Pommel, B.; Gallais, A.; Coque, M.; Quillere, I.; Hirel, B.; Prioul, J.L.; Andrieu, B.; Floriot, M. Carbon and nitrogen allocation and grain filling in three maize hybrids differing in leaf senescence. Eur. J. Agron. 2006, 24, 203–211. [Google Scholar] [CrossRef]
  54. Hirel, B.; Le Gouis, J.; Ney, B.; Gallais, A. The challenge of improving nitrogen use efficiency in crop plants: Towards a more central role for genetic variability and quantitative genetics within integrated approaches. J. Exp. Bot. 2007, 58, 2369–2387. [Google Scholar] [CrossRef] [PubMed]
  55. Echarte, L.S.; Rothstein, G.; Tollenaar, M. The response of leaf photosynthesis and dry matter accumulation to nitrogen supply in an older and a newer maize hybrid. Crop Sci. 2008, 48, 656–665. [Google Scholar] [CrossRef]
  56. Ciampitti, I.A.; Vyn, T.J. A comprehensive study of plant density consequences on nitrogen uptake dynamics of maize plants from vegetative to reproductive stages. Field Crops Res. 2011, 121, 2–18. [Google Scholar] [CrossRef]
  57. Ta, C.T.; Weiland, R.T. Nitrogen partitioning in maize during ear development. Crop Sci. 1992, 32, 443–451. [Google Scholar] [CrossRef]
  58. Rajcan, I.; Tollenaar, M. Source: Sink ratio and leaf senescence in maize. II. Nitrogen metabolism during grain filling. Field Crops Res. 1999, 60, 255–265. [Google Scholar] [CrossRef]
  59. Lee, E.A.; Tollenaar, M. Physiological basis of successful breeding strategies for maize grain yield. Crop Sci. 2007, 47, S202–S215. [Google Scholar] [CrossRef]
  60. Yan, P.; Yue, S.C.; Qiu, M.L.; Chen, X.P.; Cui, Z.L.; Chen, F.J. Using maize hybrids and in-season nitrogen management to improve grain yield and grain nitrogen concentrations. Field Crops Res. 2014, 166, 38–45. [Google Scholar] [CrossRef]
  61. Shi, Q.; Wang, H.; Chen, F. The spatial-temporal distribution characteristics and yield potential of medium-low yielded farmland in China. Chin. Agric. Sci. Bull. 2010, 26, 369–373, (In Chinese, with English abstract). [Google Scholar]
  62. Jin, L.B.; Cui, H.Y.; Li, B.; Zhang, J.W.; Dong, S.T.; Liu, P. Effects of integrated agronomic management practices on yield and nitrogen efficiency of summer maize in North China. Field Crops Res. 2012, 134, 30–35. [Google Scholar] [CrossRef]
  63. Dong, Q.G.; Yang, Y.; Yu, K.; Feng, H. Effects of straw mulching and plastic film mulching on improving soil organic carbon and nitrogen fractions, crop yield and water use efficiency in the Loess Plateau, China. Agric. Water Manag. 2018, 201, 133–143. [Google Scholar] [CrossRef]
  64. Robertson, G.P.; Vitousek, P.M. Nitrogen in agriculture: Balancing the cost of an essential resource. Annu. Rev. Environ. Resour. 2009, 34, 97–125. [Google Scholar] [CrossRef] [Green Version]
  65. El-Hendawy, S.E.; El-Lattief, E.A.; Ahmed, M.S.; Schmidhalter, U. Irrigation rate and plant density effects on yield and water use efficiency of drip-irrigated corn. Agric. Water Manag. 2008, 95, 836–844. [Google Scholar] [CrossRef]
  66. Lamm, F.; Trooien, T. Subsurface Drip Irrigation for Corn Production: A Review of 10 Years of Research in Kansas. Irrig. Sci. 2003, 22, 195–200. [Google Scholar] [CrossRef]
  67. Sadarunnisa, S.; Madhumathi, C.; Rao, G.S.; Sreenivasulu, B. Effect of fertigation on growth and yield of turmeric cv. Mydukur. J. Hortic. Sci. 2010, 5, 78–80. [Google Scholar]
Figure 1. Daily precipitation and air temperature during maize growth periods in 2016 and 2017.
Sustainability 14 07850 g001
Figure 2. Sampling area of maize yield measurement in the field.
Sustainability 14 07850 g002
Figure 3. Soil water content in the 0–100 cm soil layer for each soil depth and treatment in 2016. DF, drip fertigation; FF, flood fertigation; N0 (0), N1 (225 kg N ha−1), N2 (300 kg N ha−1), N3 (375 kg N ha−1), and N4 (450 kg N ha−1); V12, 12-leaf stage; R3, milk stage. Letters around the error bars indicate significant differences at the 0.05 probability level.
Sustainability 14 07850 g003
Figure 4. Soil mineral N content (Nmin, representing ammonium N plus nitrate N) in the 0 to 60 cm soil layer for each soil depth and treatment in 2016. DF, drip fertigation; FF, flood fertigation; N0 (0), N1 (225 kg N ha−1), N2 (300 kg N ha−1), N3 (375 kg N ha−1), and N4 (450 kg N ha−1); V12, 12-leaf stage; R3, milk stage. Letters around the error bars indicate significant differences at the 0.05 probability level.
Sustainability 14 07850 g004
Figure 5. Maize N accumulation for each treatment in 2016 and 2017. DF, drip fertigation; FF, flood fertigation; N0 (0), N1 (225 kg N ha−1), N2 (300 kg N ha−1), N3 (375 kg N ha−1), and N4 (450 kg N ha−1); V6, 6-leaf stage; V12, 12-leaf stage; R1, silking stage; R3, milk stage; R6, physiological maturity. Letters around the error bars indicate significant differences at the 0.05 probability level.
Sustainability 14 07850 g005
Figure 6. Maize leaf area index for different treatments in 2016 and 2017. DF, drip fertigation; FF, flood fertigation; N0 (0), N1 (225 kg N ha−1), N2 (300 kg N ha−1), N3 (375 kg N ha−1), and N4 (450 kg N ha−1); V6, 6-leaf stage; V12, 12-leaf stage; R1, silking stage; R3, milk stage; R6, physiological maturity. Letters around the error bars indicate significant differences at the 0.05 probability level.
Sustainability 14 07850 g006
Figure 7. Dry matter accumulation (DM) and dry matter accumulation rate (DMR) of maize for different treatments in 2016 and 2017. DF, drip fertigation; FF, flood fertigation; N0 (0), N1 (225 kg N ha−1), N2 (300 kg N ha−1), N3 (375 kg N ha−1), and N4 (450 kg N ha−1); V6, 6-leaf stage; V12, 12-leaf stage; R1, silking stage; R3, milk stage; R6, physiological maturity. Letters around the error bars indicate significant differences at the 0.05 probability level.
Sustainability 14 07850 g007
Table 1. Irrigation (mm) amounts applied at each maize growth stage for different treatments in 2016 and 2017.
Irrigation System20162017
Planting (mm)V6 (mm)V12 (mm)Total (mm)Planting (mm)V6 (mm)V12 (mm)Total (mm)
DF2015104520201555
FF504540135505040140
DF, drip fertigation; FF, flood fertigation. V6, 6-leaf stage; V12, 12-leaf stage.
Table 2. N fertilizer application rates (kg N ha−1) at each maize growth stage for different treatments in each experimental year.
IrrigationTreatmentN
Before Sowing
kg ha−1
V6
kg ha−1
V12
kg ha−1
R1
kg ha−1
Total
kg ha−1
DFN000000
N14567.54567.5225
N260906090300
N375112.575112.5375
N49013590135450
FFN000000
N14567.54567.5225
N260906090300
N375112.575112.5375
N49013590135450
DF, drip fertigation; FF, flood fertigation; N0 (0), N1 (225 kg N ha−1), N2 (300 kg N ha−1), N3 (375 kg N ha−1), and N4 (450 kg N ha−1). V6, 6-leaf stage; V12, 12-leaf stage; R1, silking stage.
Table 3. Abbreviations and product names.
AbbreviationFull Name/Products Name
DFFlood fertigation
FFDrip fertigation
NNitrogen
V66-leaf stage
V1212-leaf stage
R1Silking stage
R3Milk stage
R6Physiological maturity
ETEvapotranspiration
WUEWater use efficiency
AENAgronomic nitrogen efficiency
PFPNNitrogen partial factor productivity
SWCSoil water content
NminAmmonium nitrogen and nitrate nitrogen
LAILeaf area index
DMDry matter accumulation
DM+RDry matter accumulation rates
Chemical herbicidesAtrazine; Shandong Dacheng Pesticide Co., Ltd.
InsecticidesPhoxim; Sichuan Guoguang Agricultural Chemical Co., Ltd.
FungicidesKresoxim-methyl; Zhengda Nantong crop Protection Co., Ltd.
Table 4. Grain yield and yield components of maize by irrigation and N treatment in 2016 and 2017.
YearIrrigationNitrogenGrain YieldEar No.Kernel No.1000-Kernel
(Mg ha–1)(104 ha–1)per EarWeight (g)
2016DFN03.6 g6.7157 g334.1 g
N18.8 d6.9364 c358.3 e
N29.7 b6.9371 b373.2 d
N310.4 a6.9390 a389.8 a
N410.2 a6.9387 a382.7 b
FFN03.5 g6.7150 h326.5 h
N17.3 f6.8312 f333.8 g
N28.3 e6.8347 e348.9 f
N39.2 c6.8359 d364.8 d
N49.7 b6.8364 c370.1 c
2017DFN03.3 g6.7154 g332.3 f
N18.3 e6.8352 d348.2 e
N29.5 c6.8370 b366.9 d
N310.2 a6.9387 a388.6 a
N410.0 b6.9385 a382.4 b
FFN03.1 h6.7145 h310.7 g
N17.2 f6.8304 f332.3 f
N28.2 e6.8345 e345.6 e
N38.8 d6.8354 d362.0 d
N49.5 c6.8360 c368.1 c
Source of variation
Nitrogen(N)**NS****
Irrigation (I)**NS****
Year (Y)NSNSNSNS
Y × INSNSNSNS
Y × NNSNSNSNS
I × N**NS***
Y × I × NNSNSNSNS
Means followed by a common letter in a column are statistically the same at α = 0.05. DF, drip fertigation; FF, flood fertigation; N0 (0), N1 (225 kg N ha−1), N2 (300 kg N ha−1), N3 (375 kg N ha−1), and N4 (450 kg N ha−1). NS, no significant (p > 0.05). * Significant at p < 0.05. ** Significant at p < 0.01.
Table 5. Water use efficiency and N use efficiency in 2016 and 2017.
YearIrrigationNitrogenET
(mm)
WUE
(kg m−3)
AEN
(kg kg−1)
PFPN
(kg kg−1)
2016DFN0426.6 d0.83 f
N1421.3 d2.09 c23.1 a39.1 a
N2423.4 d2.10 c20.3 b32.3 b
N3431.1 d2.53 a18.1 c27.7 c
N4431.6 d2.37 b14.7 fg22.7 de
FFN0559.5 c0.63 g
N1576.3 b1.25 e16.9 d32.4 b
N2578.6 b1.47 d16.0 de27.7 c
N3587.8 b1.48 d15.2 ef24.5 d
N4614.7 a1.50 d13.8 g21.6 e
2017DFN0356.4 f0.92 f
N1349.1 g2.39 c22.2 a36.9 a
N2352.3 fg2.49 b20.7 b31.7 b
N3367.4 e2.71 a18.4 c27.2 c
N4377.4 d2.54 b14.9 ef22.2 de
FFN0502.4 a0.59 g
N1496.0 ab1.47 e18.2 c32.0 b
N2476.3 c1.75 d17.0 d27.3 c
N3491.9 d1.75 d15.2 e23.5 d
N4498.4 ab1.81 d14.2 f21.1 e
Source of variation
Irrigation (I)********
Nitrogen(N)********
Year (Y)****NSNS
Y × INS****
Y × N****NSNS
I × N********
Y × I × N****NSNS
Means followed by a common letter in a column are statistically the same at α = 0.05. DF, drip fertigation; FF, flood fertigation; N0 (0), N1 (225 kg N ha−1), N2 (300 kg N ha−1), N3 (375 kg N ha−1), and N4 (450 kg N ha−1). NS, no significant (p > 0.05). * Significant at p < 0.05. ** Significant at p < 0.01.
Table 6. Economic efficiency analysis ($/hm2).
YearIrrigationNitrogenTotal InputGross IncomeNet Income
FertilizerIrrigation EquipmentWater,
Electricity and Labor
Machinery,
Seed and Pesticide
2016DFN010314979542856 g0
N1163149795422092 d1159 e
N2183149795422306 b1353 cd
N3203149795422496 a1523 a
N4223149795422435 a1442 b
FFN01030130542808 h33 g
N116301305421736 f900 f
N218301305421973 e1118 e
N320301305422187 c1312 d
N422301305422259 bc1363 c
2017DFN010314979542785 f0
N1163149795421973 d1040 f
N2183149795422259 b1306 c
N3203149795422449 a1476 a
N4223149795422378 a1385 b
FFN01030130542794 f19 h
N116301305421712 e877 g
N218301305421950 d1094 e
N320301305422092 c1217 d
N422301305422235 b1339 bc
Source of variation
Irrigation (I)----****
Nitrogen(N)----****
Year (Y)----****
Y × I----NSNS
Y × N----NSNS
I × N----****
Y × I × N----NSNS
Means followed by a common letter in a column are statistically the same at α = 0.05. DF, drip fertigation; FF, flood fertigation; N0 (0), N1 (225 kg N ha−1), N2 (300 kg N ha−1), N3 (375 kg N ha−1), and N4 (450 kg N ha−1). NS, no significant (p > 0.05). ** Significant at p < 0.01. Price of fertilizer: 267.5 $/Mg for urea, 386.4 $/Mg for P2O5 as Ca (H2PO4), 371.5 $/Mg for K2O as KCl, 0.234 $/kg for maize.
Publisher’s Note: MDPI stays neutral with regard to jurisdictional claims in published maps and institutional affiliations.

