Abstract
This study established power-related efficiency measures from the perspective of reliability, namely, power system availability, expected power deficiency, accumulated power deficiency, instantaneous power capacity, and accumulated power capacity for a hybrid power system (HPS) in a generic smart grid. Methodologically, a power supply–demand stochastic model that simultaneously considers the inherently stochastic nature of power supply and demand was developed to quantify their interrelationship and characterize the dynamic behavior of an HPS in a continuous-time Markov chain. Preventive maintenance (PM) models were also constructed to determine the optimal PM strategy in alignment with specific scenarios that reflect the power performance requirements and resource limitations. A sensitivity analysis was conducted using the design of experiments (DOE) scheme that simulated climate change and revealed that extreme climate worsens power-related efficiency measures. This analysis provides further insight into the extent to which extreme climate conditions diminish the engineers and designers of smart grid systems’ power-related efficiency measures. The proposed approach will potentially contribute to sustainability and maintainability in the clean energy industry.
1. Introduction
The primary aims of the COP26 agenda are to secure global net zero by mid-century, adapt to protect communities and natural habitats, and simultaneously mobilize finance and work to accelerate the activities to tackle the climate crisis through collaboration between governments, businesses, and civil society. To achieve these stretching targets, countries will need to accelerate the phase-out of fossil fuels, curtail deforestation, speed up the transition to electric vehicles, and most importantly, encourage investment in renewables. Accordingly, establishing an approach to prevent the global temperature from rising 1.5 °C above the pre-industrial level, or at minimum, to ensure that it is maintained within a controllable limit, is an urgent issue facing humankind. As estimated by scientists, to improve the probability of achieving these aims, global emissions should be halved by 2030. The climate crisis has had various catastrophic impacts, such as hurricanes, floods, and droughts, which will persist until the use of fossil fuels is appropriately managed. Without collaboration between governments, businesses, and civil society, low carbon emission energy cannot be realized, which is critical for the transformation of the climate and life on earth.
The clean energy economy is one of the fastest growing industries in the world, with low-carbon emission energy commonly referred to as renewable energy resources (RESs), which is a major driving force. The RESs exhibit unstable characteristics that influence the sustainability of power demand. This is mainly due to their susceptibility to uncertainties due to environmental changes, which causes fluctuations in natural resources; thus rendering the power capacity uncertain and random, as indicated by Lisnianski et al. [1]. Furthermore, the development of smart grids has been exponentially conceived worldwide. There are two reasons for this. First, the highly developed technology in the cost-effective green industry; and second, growing concerns over greenhouse effects that lead to catastrophic disasters. These disasters range from devastating floods that destroy homelands to overheating, which causes wildfire; thus requiring people to flee their homes. Hence, a smart grid in the form of a hybrid power system (HPS) that consists of an energy storage system (ESS) with fossil fuels and RESs may be less influenced by fluctuations in the power capacity and power demand, which plays a critical role in the design of green power apparatuses for the investigation of RESs.
Electric storage systems (ESSs) are integrated into RESs to sustain the safe operation of the power system and to balance the power capacity and power demand, thereby stabilizing the flow of electricity, e.g., cases involving the power transition of ships from the conventional single energy (mechanical power only) type to the multi-energy type with RESs [2,3]. Li et al. [4] proposed a novel hybrid AC/DC multi-energy ship microgrid with a flexible range and thermal load. This microgrid reduces power losses in the conversion between high and low powers, to improve the system efficiency. A method for the coordination of the navigation and energy scheduling of multi-energy ship microgrids was proposed to address the load uncertainty from airborne power services, outdoor temperature, and solar energy. Hou et al. [5] proposed a solution to power fluctuations in an electric ship propulsion system for a hybrid ESS that can alleviate the impact of power uncertainty. The proposed approach allows for a hybrid ESS to control power fluctuations and improve the operational efficiency, reliability, and flexibility of voyages.
Many relevant studies have addressed the HPS issues; however, studies from the reliability perspective are limited, particularly, the multi-state system (MSS) reliability model, which is significantly appropriate for measuring the nature of power continuity, let alone the formulation of MSS preventive models (PMs) regarding the HPS in a smart grid system. More importantly, most MSS studies have only addressed the power supply randomness; the stochastic nature of power demand with various interference factors has not yet been considered. To meticulously address this research gap and provide a significant insight into the MSS reliability models of HPS, aiming at a generic smart grid system, we propose the power efficiency-related measures from the reliability perspective to evaluate the main power system in a smart grid that overrides the additional power supply from the redundant solar energy system during power shortages. Accordingly, four types of PM models are illustrated and optimized to determine the appropriate PM strategy, given resources limitations and mission requirements. The main contributions of this study can, therefore, be summarized as follows:
- Development of MSS reliability model for the generic smart grid system with HPS.
- Establishment of the power grid measures that simultaneously account for the stochastic behavior of the power supply and power demand.
- Formulation of PM models for the generic smart-grid system with HPS using the MSS reliability models.
- Design of a DOE scheme to simulate the normal/extreme settings related to climate changes, thereby evaluating its impact on the established power grid measurements.
- Although a generic smart grid with an HPS was considered, the ramifications of this study are adaptable and expandable to the specific smart grid structures with appropriate modifications, thereby extending the practicability.
2. Related Work
Conteh et al. [6] verified, by optimizing a two-objective model using genetic algorithm (GA), that mixed renewable generation is more cost-effective than the traditional power generation. In their study, the considered objectives comprised cost of energy and power-loss probability. Shahzad et al. [7] proposed an approach to optimize the RES related to a hybrid power generation system that comprised photovoltaic, wind, and hydro-generation. Their study significantly reduced energy costs, net present values, initial costs, and greenhouse gas emissions. Kharrich et al. [8] proposed a platform to design an HRES microgrid system based on two configurations, PV/diesel/battery and PV/wind/diesel/battery. The platform is based on modeling, power management, and a cost optimization study using an improved IHBO algorithm. The above study also proposed an improved heap-based optimizer algorithm, which outperformed algorithms such as AEFA, GWO, HHO, and the original HBO, to determine an optimal solution. Their results demonstrate that the net present cost is highly reduced when the use of diesel is small. Zahraoui et al. [9] proposed an optimal control approach in a system that integrates renewable energy into microgrids (MGs) to promote the MG operation. The energy management system in an MG can operate controllable distributed energy resources and loads in real-time to generate a suitable short-term schedule for achieving various objectives, including efficiency, reliability, and quality of the delivered power. Choi et al. [10] presented a floating photovoltaic system configured as an islanded microgrid combined with a hybrid power system, which compensates for the renewable energy sources’ intermittent power output. They evaluated the optimal power flow of the setup using a reliability index to ensure a stable power supply within the standalone microgrid and maximize the supply power range in line with the power demand.
Shang et al. [11] added an ESS to the dispatching of ship power generation and management of propulsion loads with respect to the cruising speed, to optimize the operation of diesel generators by a multi-objective optimization model using the non-dominated sorting genetic algorithm II (NSGA-II); thus resulting in an economical and environmentally friendly ship power generation function. Boveri et al. [12] proposed an approach to optimize the ESS size to promote the flexibility of ship microgrids, given the optimal management and aging factors regarding ESSs in improving the flexibility of ship microgrids. Fang et al. [13] proposed a multi-objective hybrid ESS (HESS) management model to significantly increase the battery life, in addition to economic and environmental indicators, using hybrid batteries and high-power density ESS. A multi-objective HESS management model was proposed to significantly improve the battery life, in addition to the economic and environmental indicators. Wang et al. [14] considered three different power sources, namely, diesel engines, batteries, and fuel cells, to design and optimize a hybrid propulsion system based on the power consumption of different types of ships with designed indexes to achieve significant carbon emission reduction targets.
In the electrical industry, measuring the system performance of a multi-state system (MSS) in terms of the power capacity is more accurate than using the conventional binary reliability theory [15,16], as the performance continuity and advanced technology allow for effective functionality, especially at a lower/deteriorated performance due to aging factors. Therefore, MSSs are increasingly and extensively employed to quantify the HPS performance, to evaluate smart grids consisting of redundant RESs with ESSs beyond fossil fuel. Lisnianski et al. [1] suggested that the MSS reliability methodology is more appropriate for analyzing the output of the power generating capacity than the conventional binary reliability theory. A case study involving a coal-fired power-generating unit was investigated using a continuous-time Markov chain (CTMC), to evaluate short-term power reliability indices. Relatively few studies have been conducted on smart grids in the form of HPSs consisting of redundant RESs and ESSs (besides fossil fuels) with MSSs when compared with typical parallel systems of multi-state components with respect to reliability assessments and optimization. The general ESS configuration involves the delivery of excess power resources from the RES in the storage system to the main power system, which is a fossil fuel apparatus, via an interconnection system that may be an MSS. This type of redundant RES with an ESS furthers the investigation of clean energy for the power generation from natural sources, to stochastically balance the power capacity and power demand.
For preventive maintenance (PM) strategy optimization, Shadmand [17] established a two-objective optimization model for the photovoltaic (PV)–wind hybrid power system, with the objectives of ensuring a suitable equipment cost and overall power system availability. Huang et al. [18] established a condition-based multi-objective MSS preventive maintenance model using CTMC to evaluate the MSS performance in terms of the mean system unavailability and total maintenance cost, which considers a human reliability factor associated with maintenance personnel. Chen et al. [19] pioneered a novel fuzzy MSS availability using probability theory and uncertainty theory to define the MSS features of random uncertainty, where the state probability and performance of system components are non-probabilistic uncertain variables.
The CTMC methodology has been widely used to evaluate the dynamic performance with respect to time in an MSS reliability configuration and was further substituted into a tailored mathematical optimization model to address the PM strategy and redundancy allocation issues, among others, according to previous studies [20,21,22,23]. Significantly limited studies were conducted on HPSs consisting of redundant RESs with ESSs featuring multi-state performances; and the power demand, which exhibits stochastic uncertainty due to seasonal factors, was not considered to accurately reflect practical scenarios. Therefore, for a smart grid with an HPS that comprises fossil fuel apparatus and redundant RESs with an ESS in green industry, in addition to a stochastically varying power demand, in this study, power-related efficiency measures, such as the power system availability, expected power deficiency, accumulated power deficiency, instantaneous power capacity, and accumulated power capacity, were first established. Based on the four types of PM models that include single- and bi-objective models with and without the constraint, PM strategies in the green industry were extensively investigated. For the bi-objective PM optimization, NSGA-III [24,25,26,27,28] was employed, which was previously adopted to solve various multi-objective optimization problems, with modifications made for specific problems [29,30,31,32,33]. The algorithm was further developed to optimize the competitive PM alternatives in the Pareto front in the form of maintenance activities in the degradation states of components. Finally, a sensitive analysis of relevant parameters was conducted to gain further insight into the PM models in terms of solutions and their power-related efficiency measures. Accordingly, the most appropriate alternative was selected based on the preference, limitations of maintenance resources, or power system performance.
The remainder of this paper is organized as follows. Section 2 presents the simulation of a smart grid case, including the main power system, to validate the proposed method for the evaluation of power efficiency-related measures, in addition to the construction and optimization of single- and multi-objective PM models. Section 3 presents the sensitivity analysis results to further verify the accuracy and effectiveness of the proposed method; followed by the conclusions in Section 4.
3. Materials and Methods
3.1. Simulation of the Smart Grid
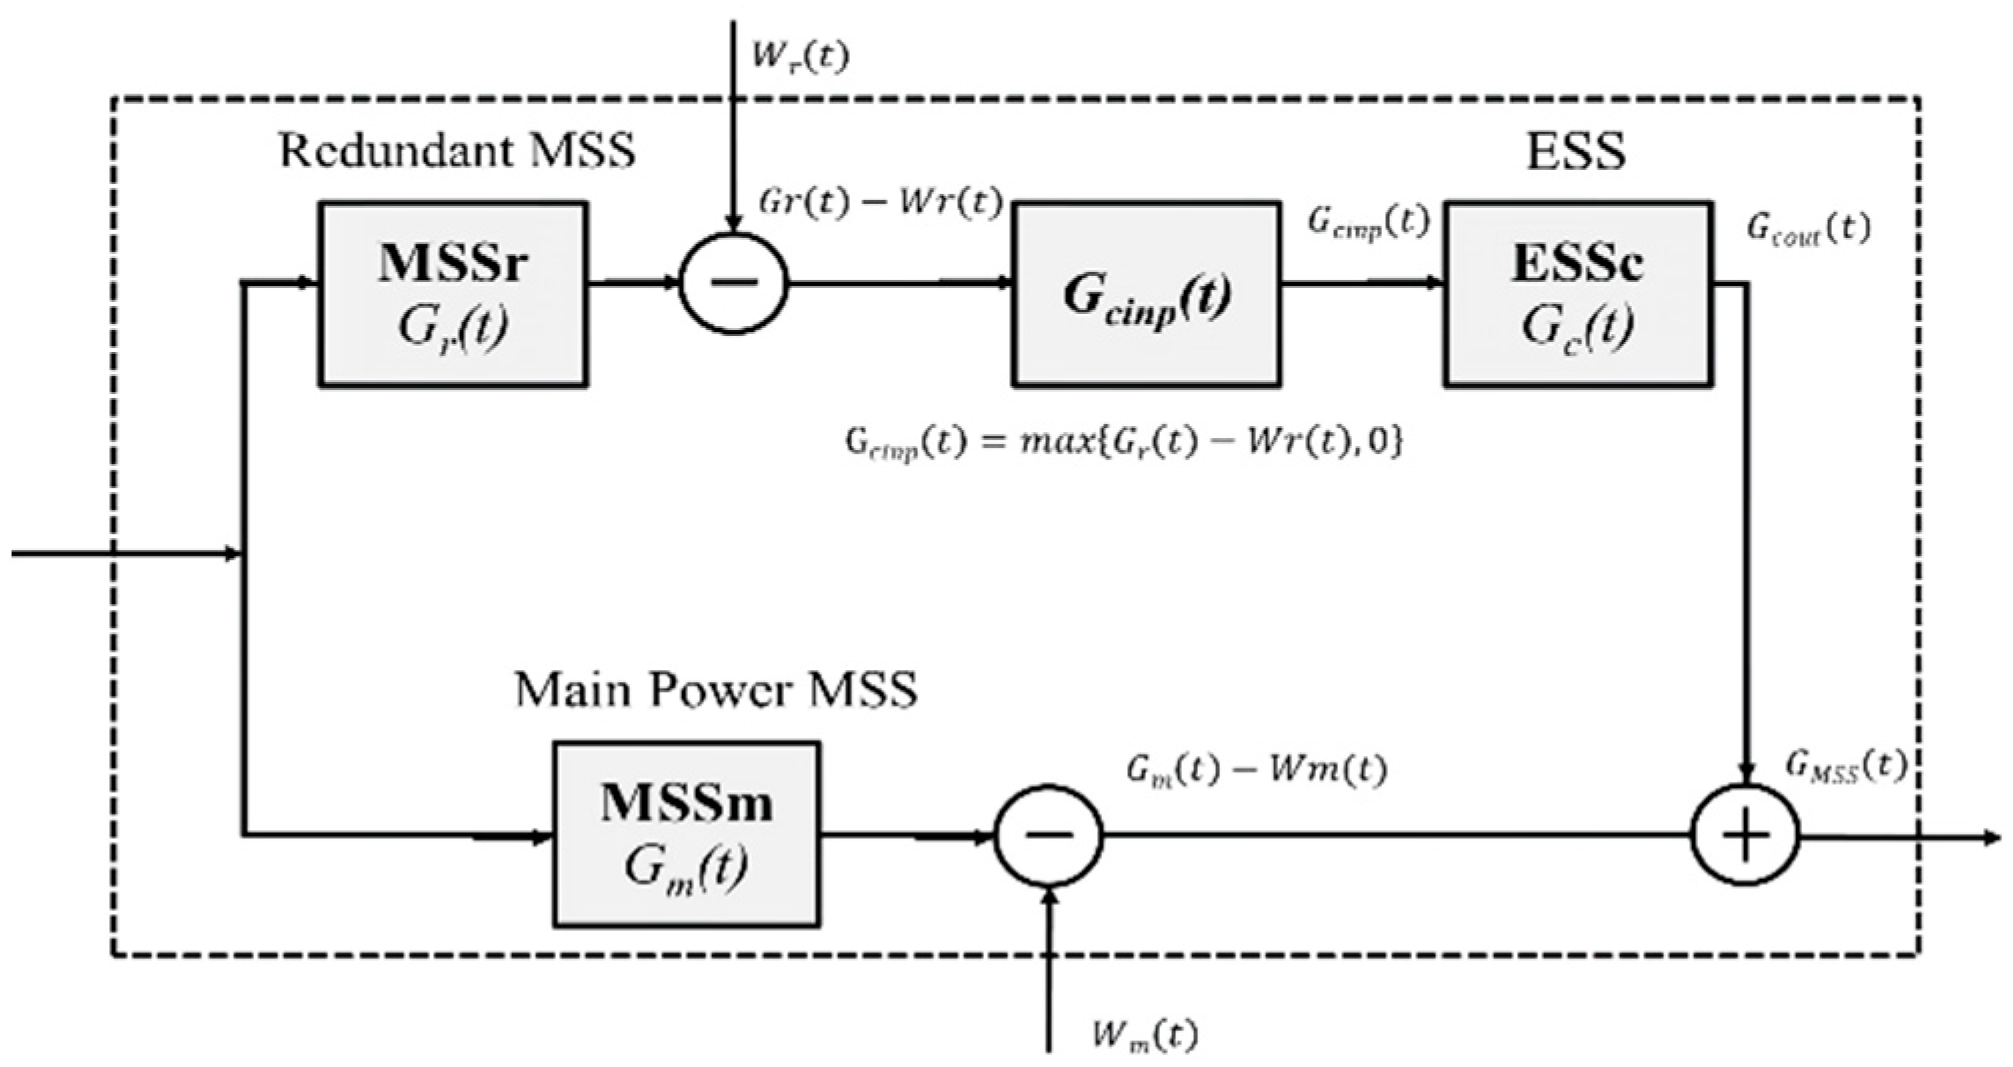
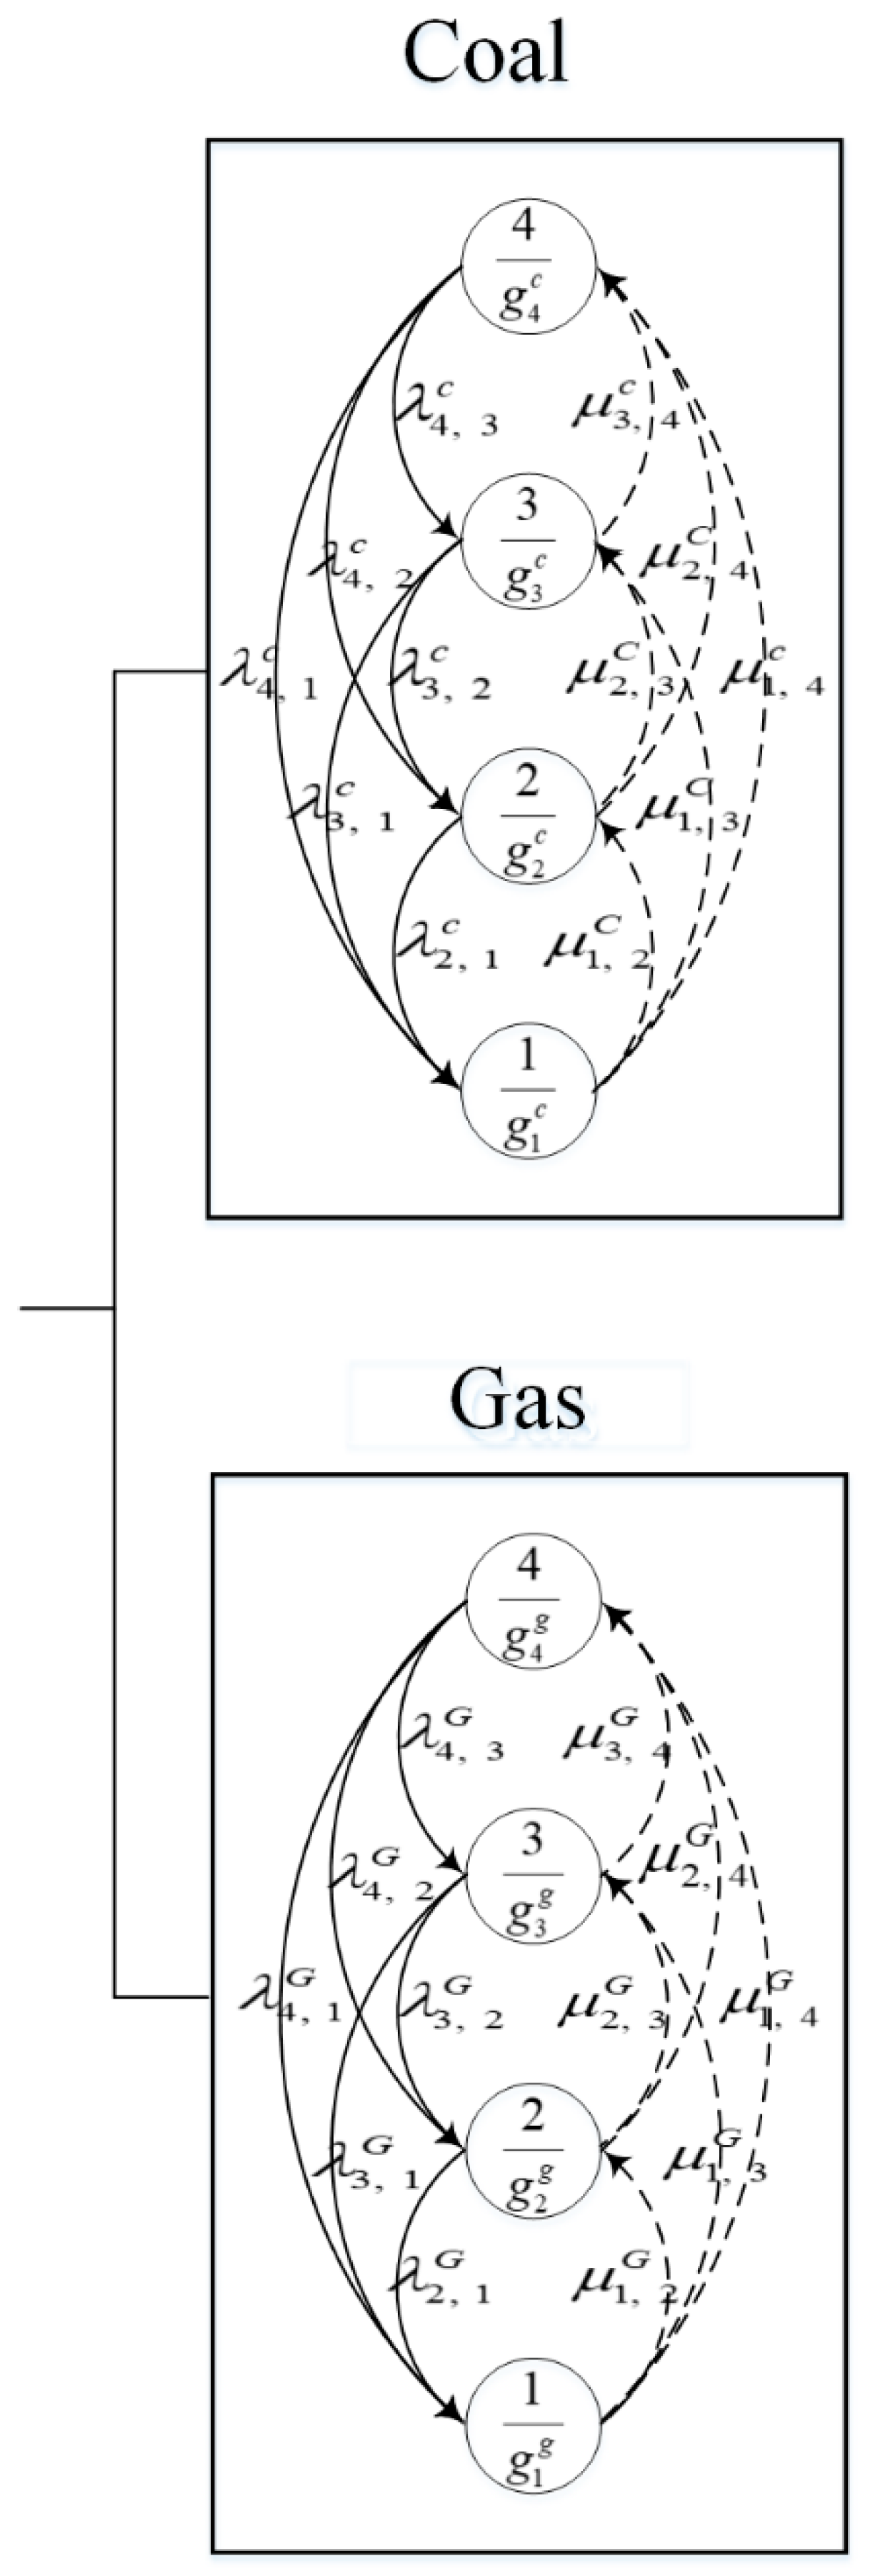
Referring to Lisnianski et al. [33], a simulated case of a generic smart grid comprising a main power system (with coal and natural gas as the energy sources) and redundant solar power system in an HPS with an ESS, where an interconnection apparatus connects the redundant solar power system and ESS, was considered to verify the proposed approach with respect to the evaluation of the power efficiency-related measures. The redundant solar power system delivers surplus power to the ESS and supplements the main power system in cases of shortage, to improve the power system availability via the interconnection apparatus. The developed power measures for the smart grid include the power system availability, expected power deficiency, accumulated power deficiency, instantaneous power capacity, and accumulated power capacity. Figure 1 presents the smart grid structure; Figure 2 and Figure 3 present the transition diagram of the main power system and power demand, respectively; and Figure 4 and Figure 5 present the transition diagram of the redundant solar system related to the power supply and demand, respectively.
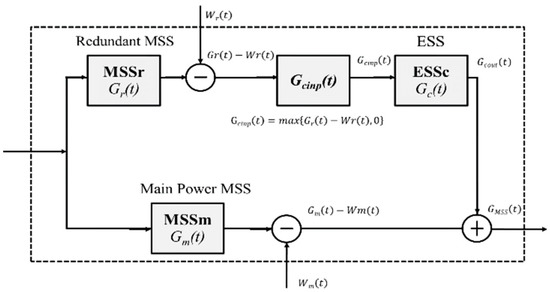
Figure 1.
Block diagram of smart grid with HPS [33].
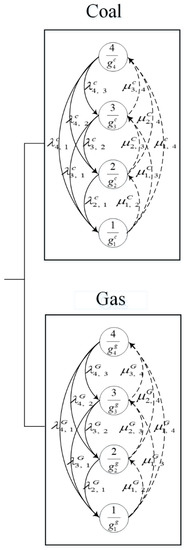
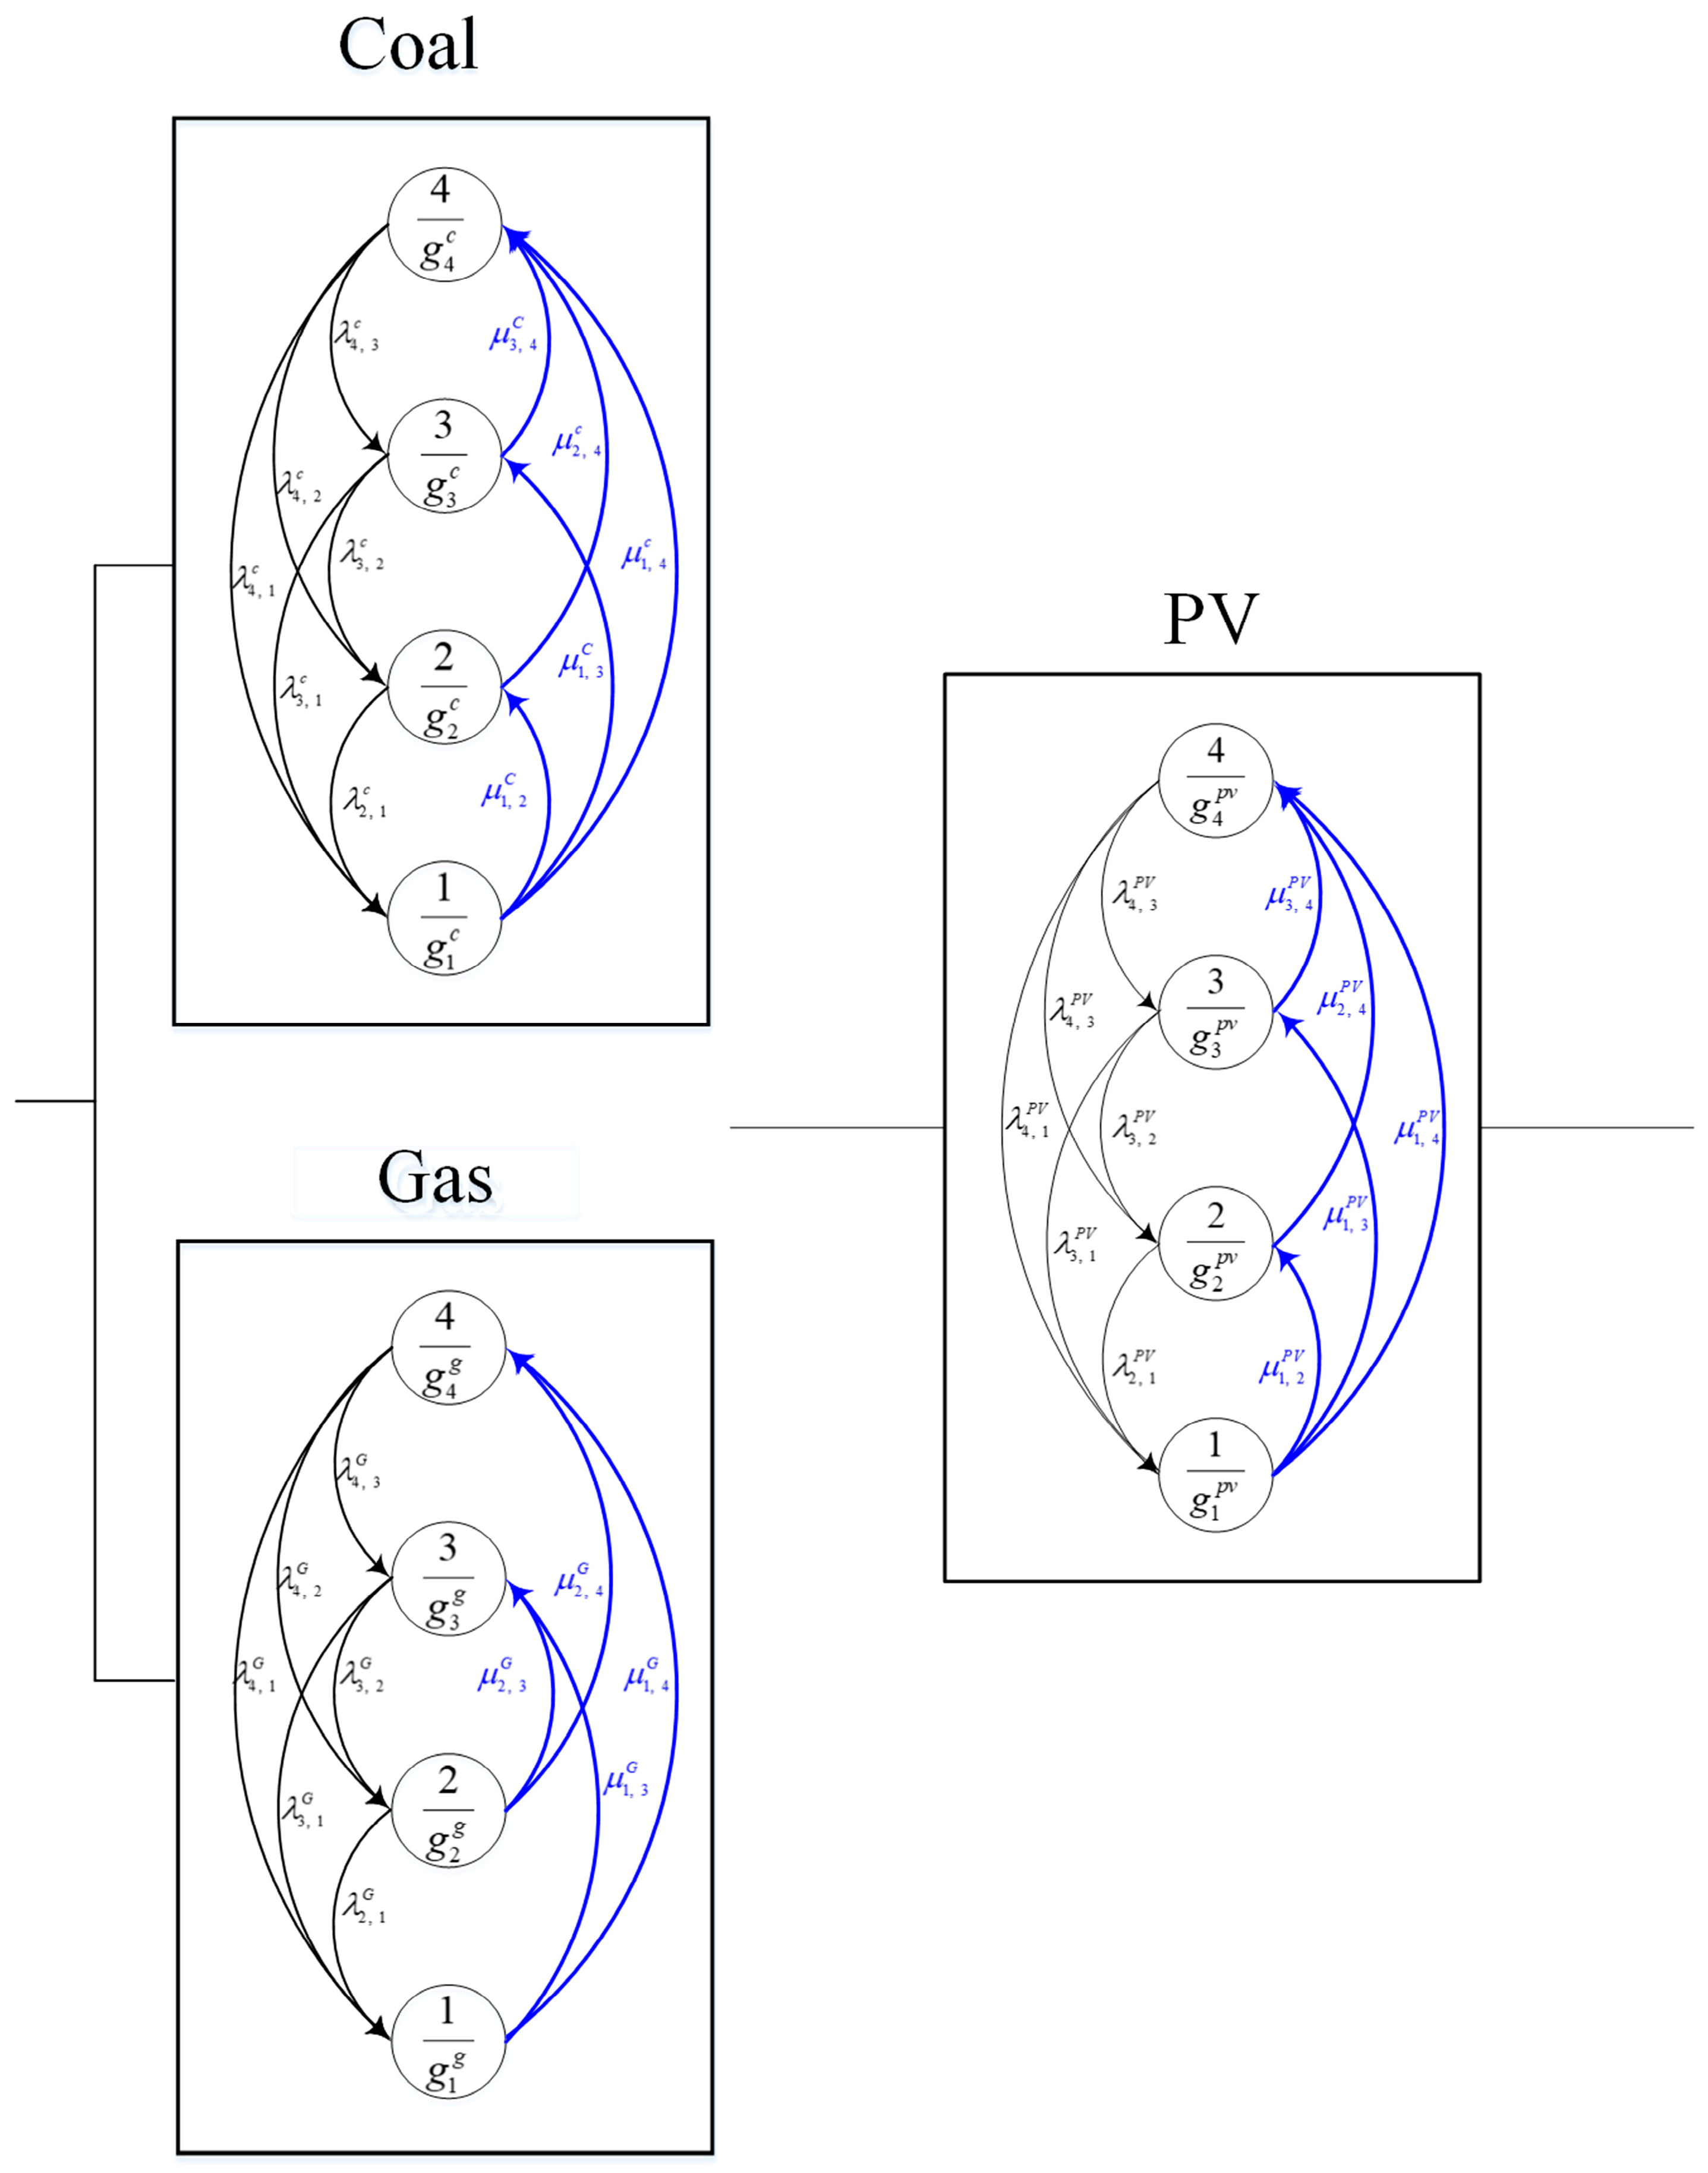
Figure 2.
Transition diagram of the main power system.
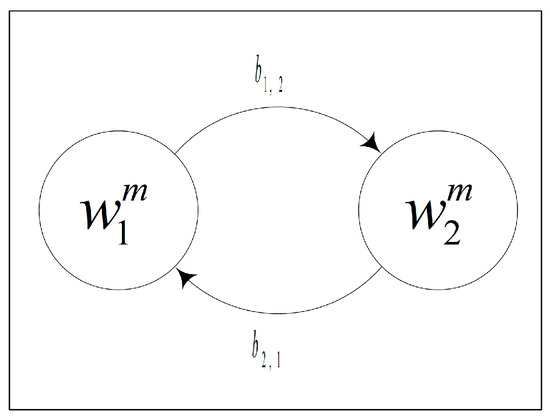
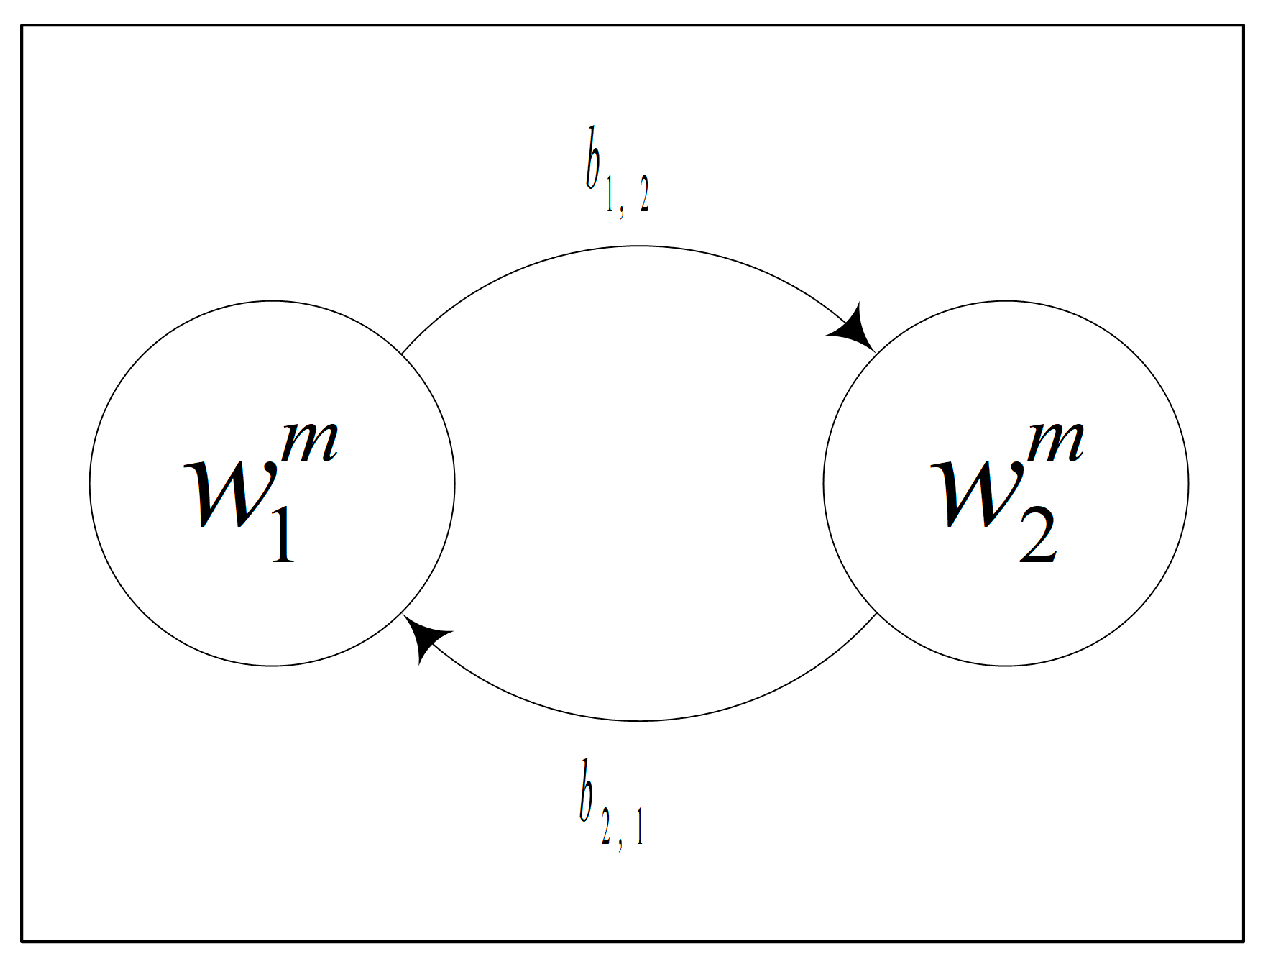
Figure 3.
Transition demand diagram for the main power system.

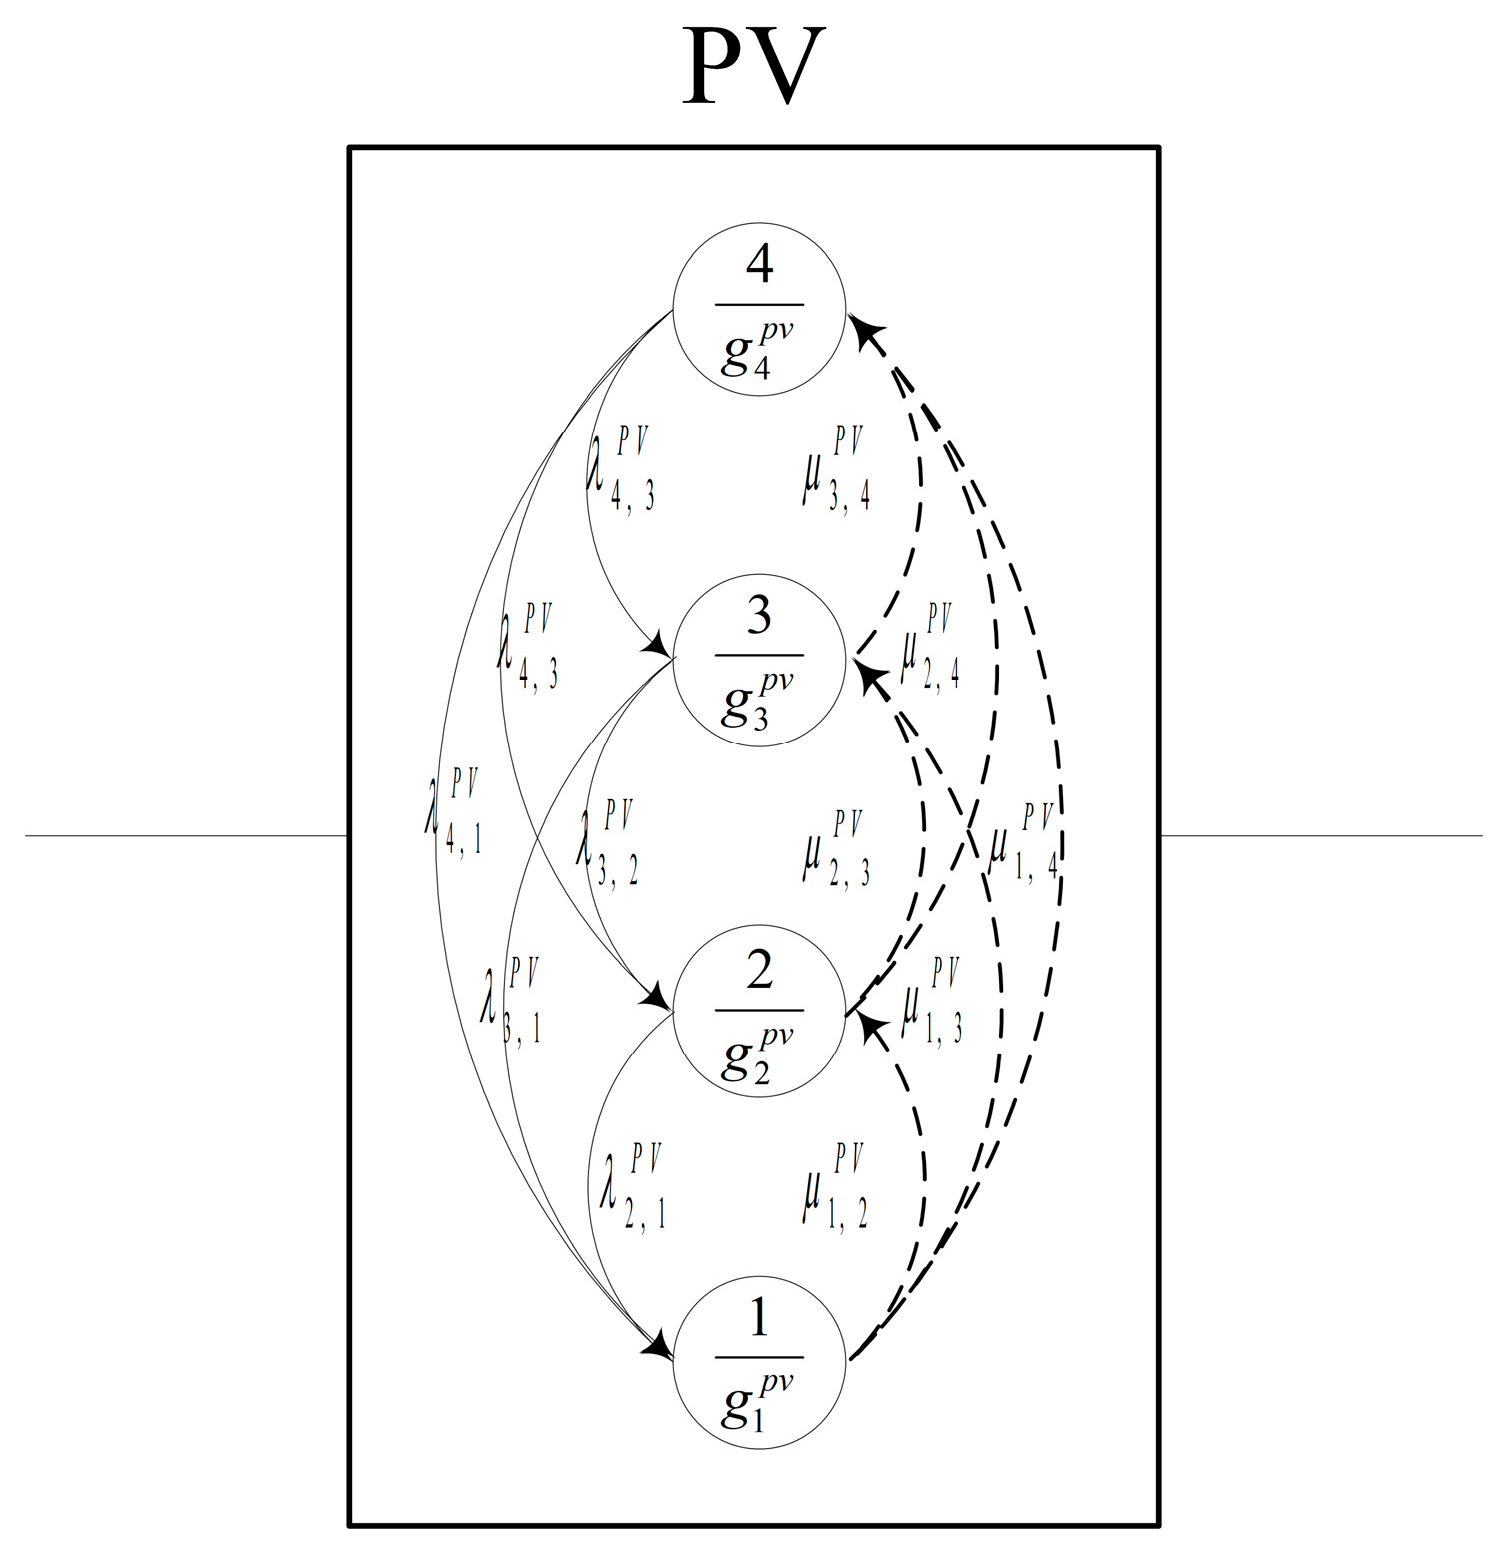
Figure 4.
Transition diagram of the redundant solar system.
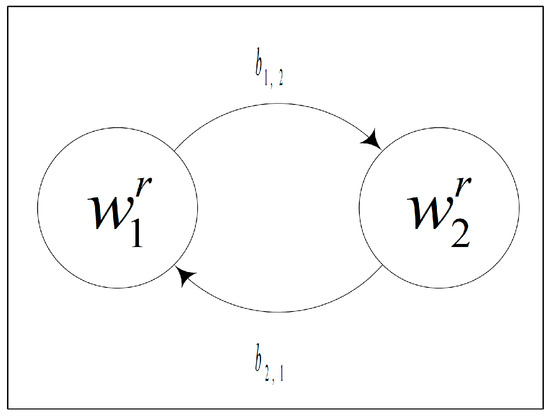
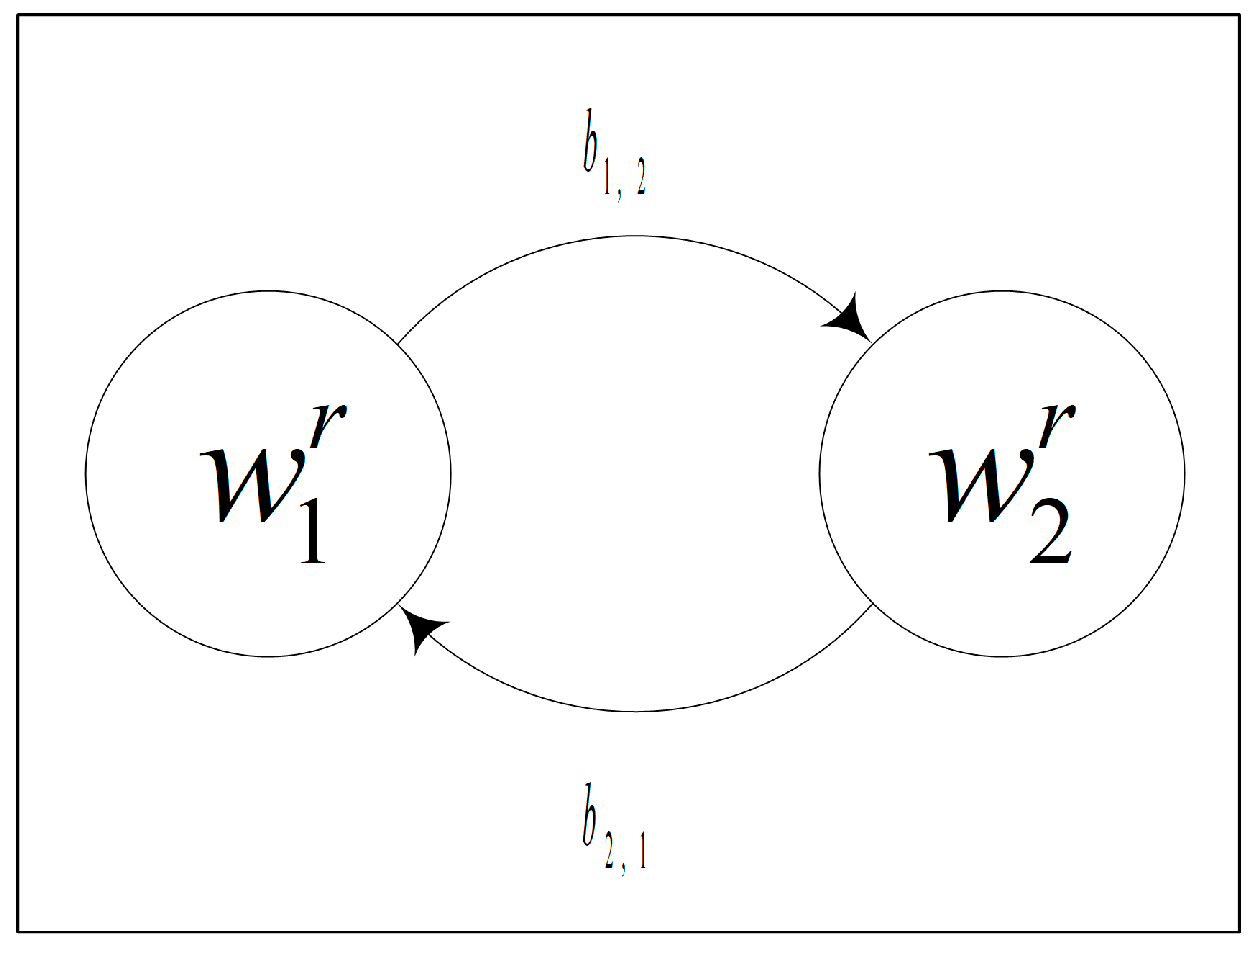
Figure 5.
Transition demand diagram for the redundant solar energy system.
The established power efficiency-related measures are summarized by the following steps.
Step 1: Establishment of the power supply–demand stochastic models.
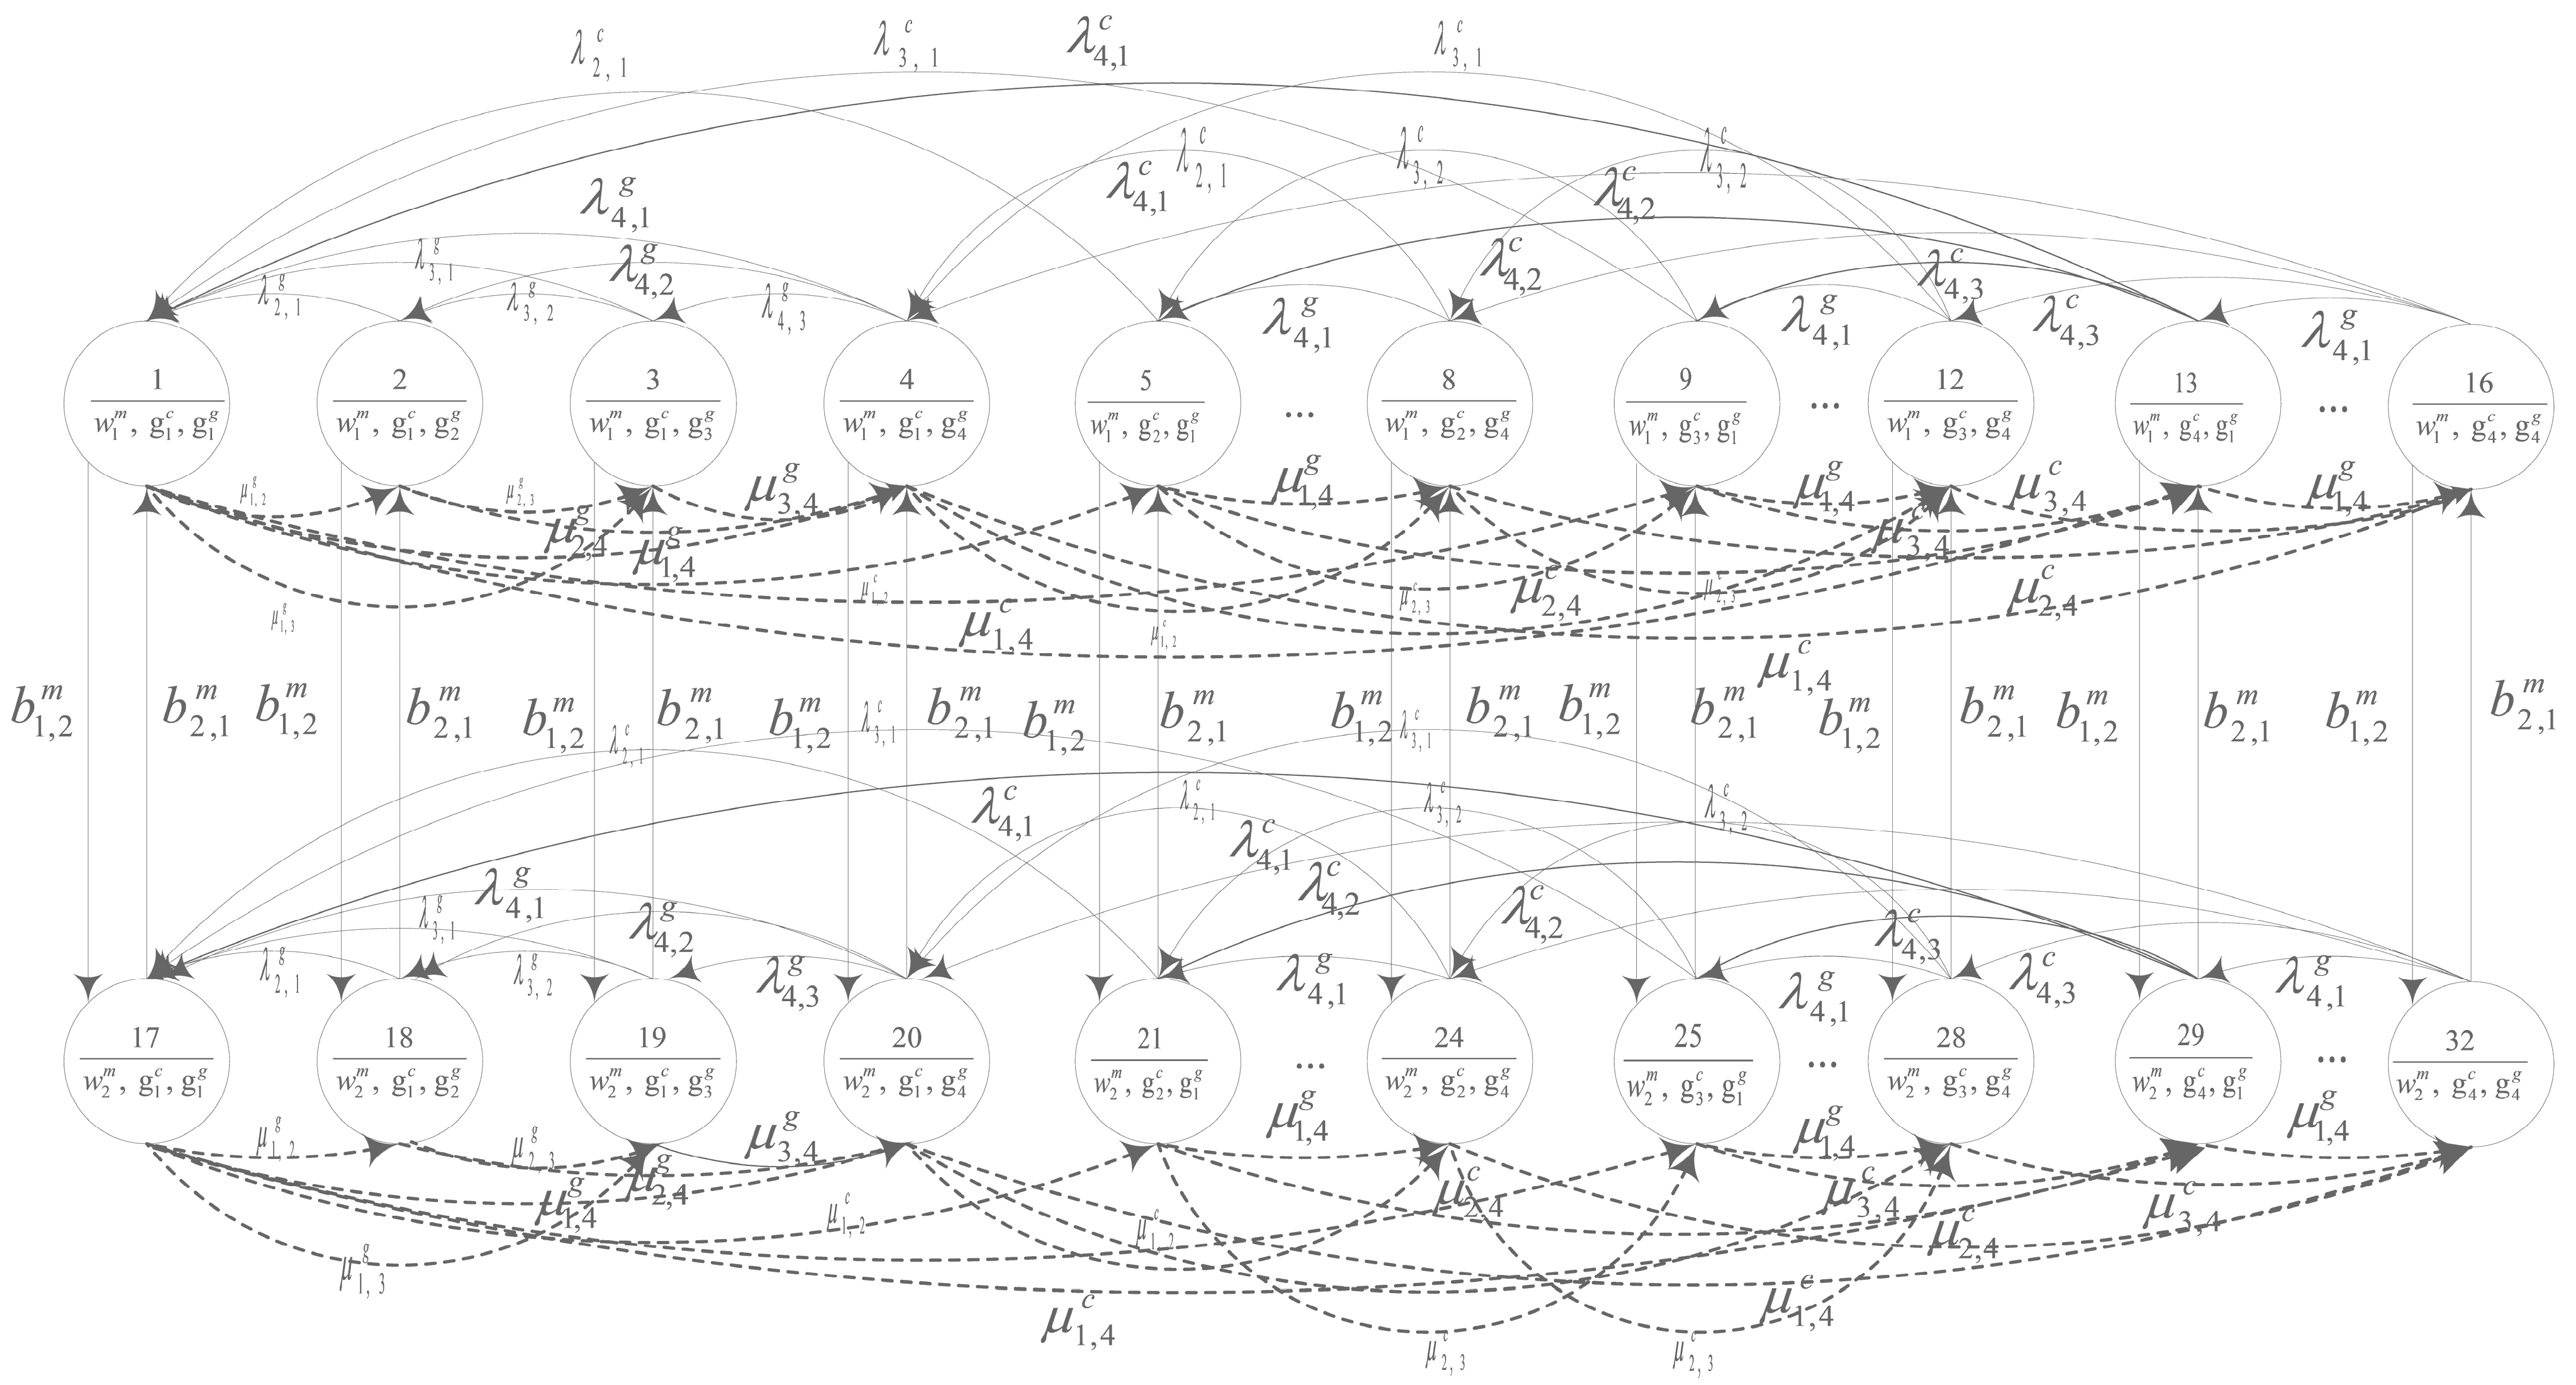
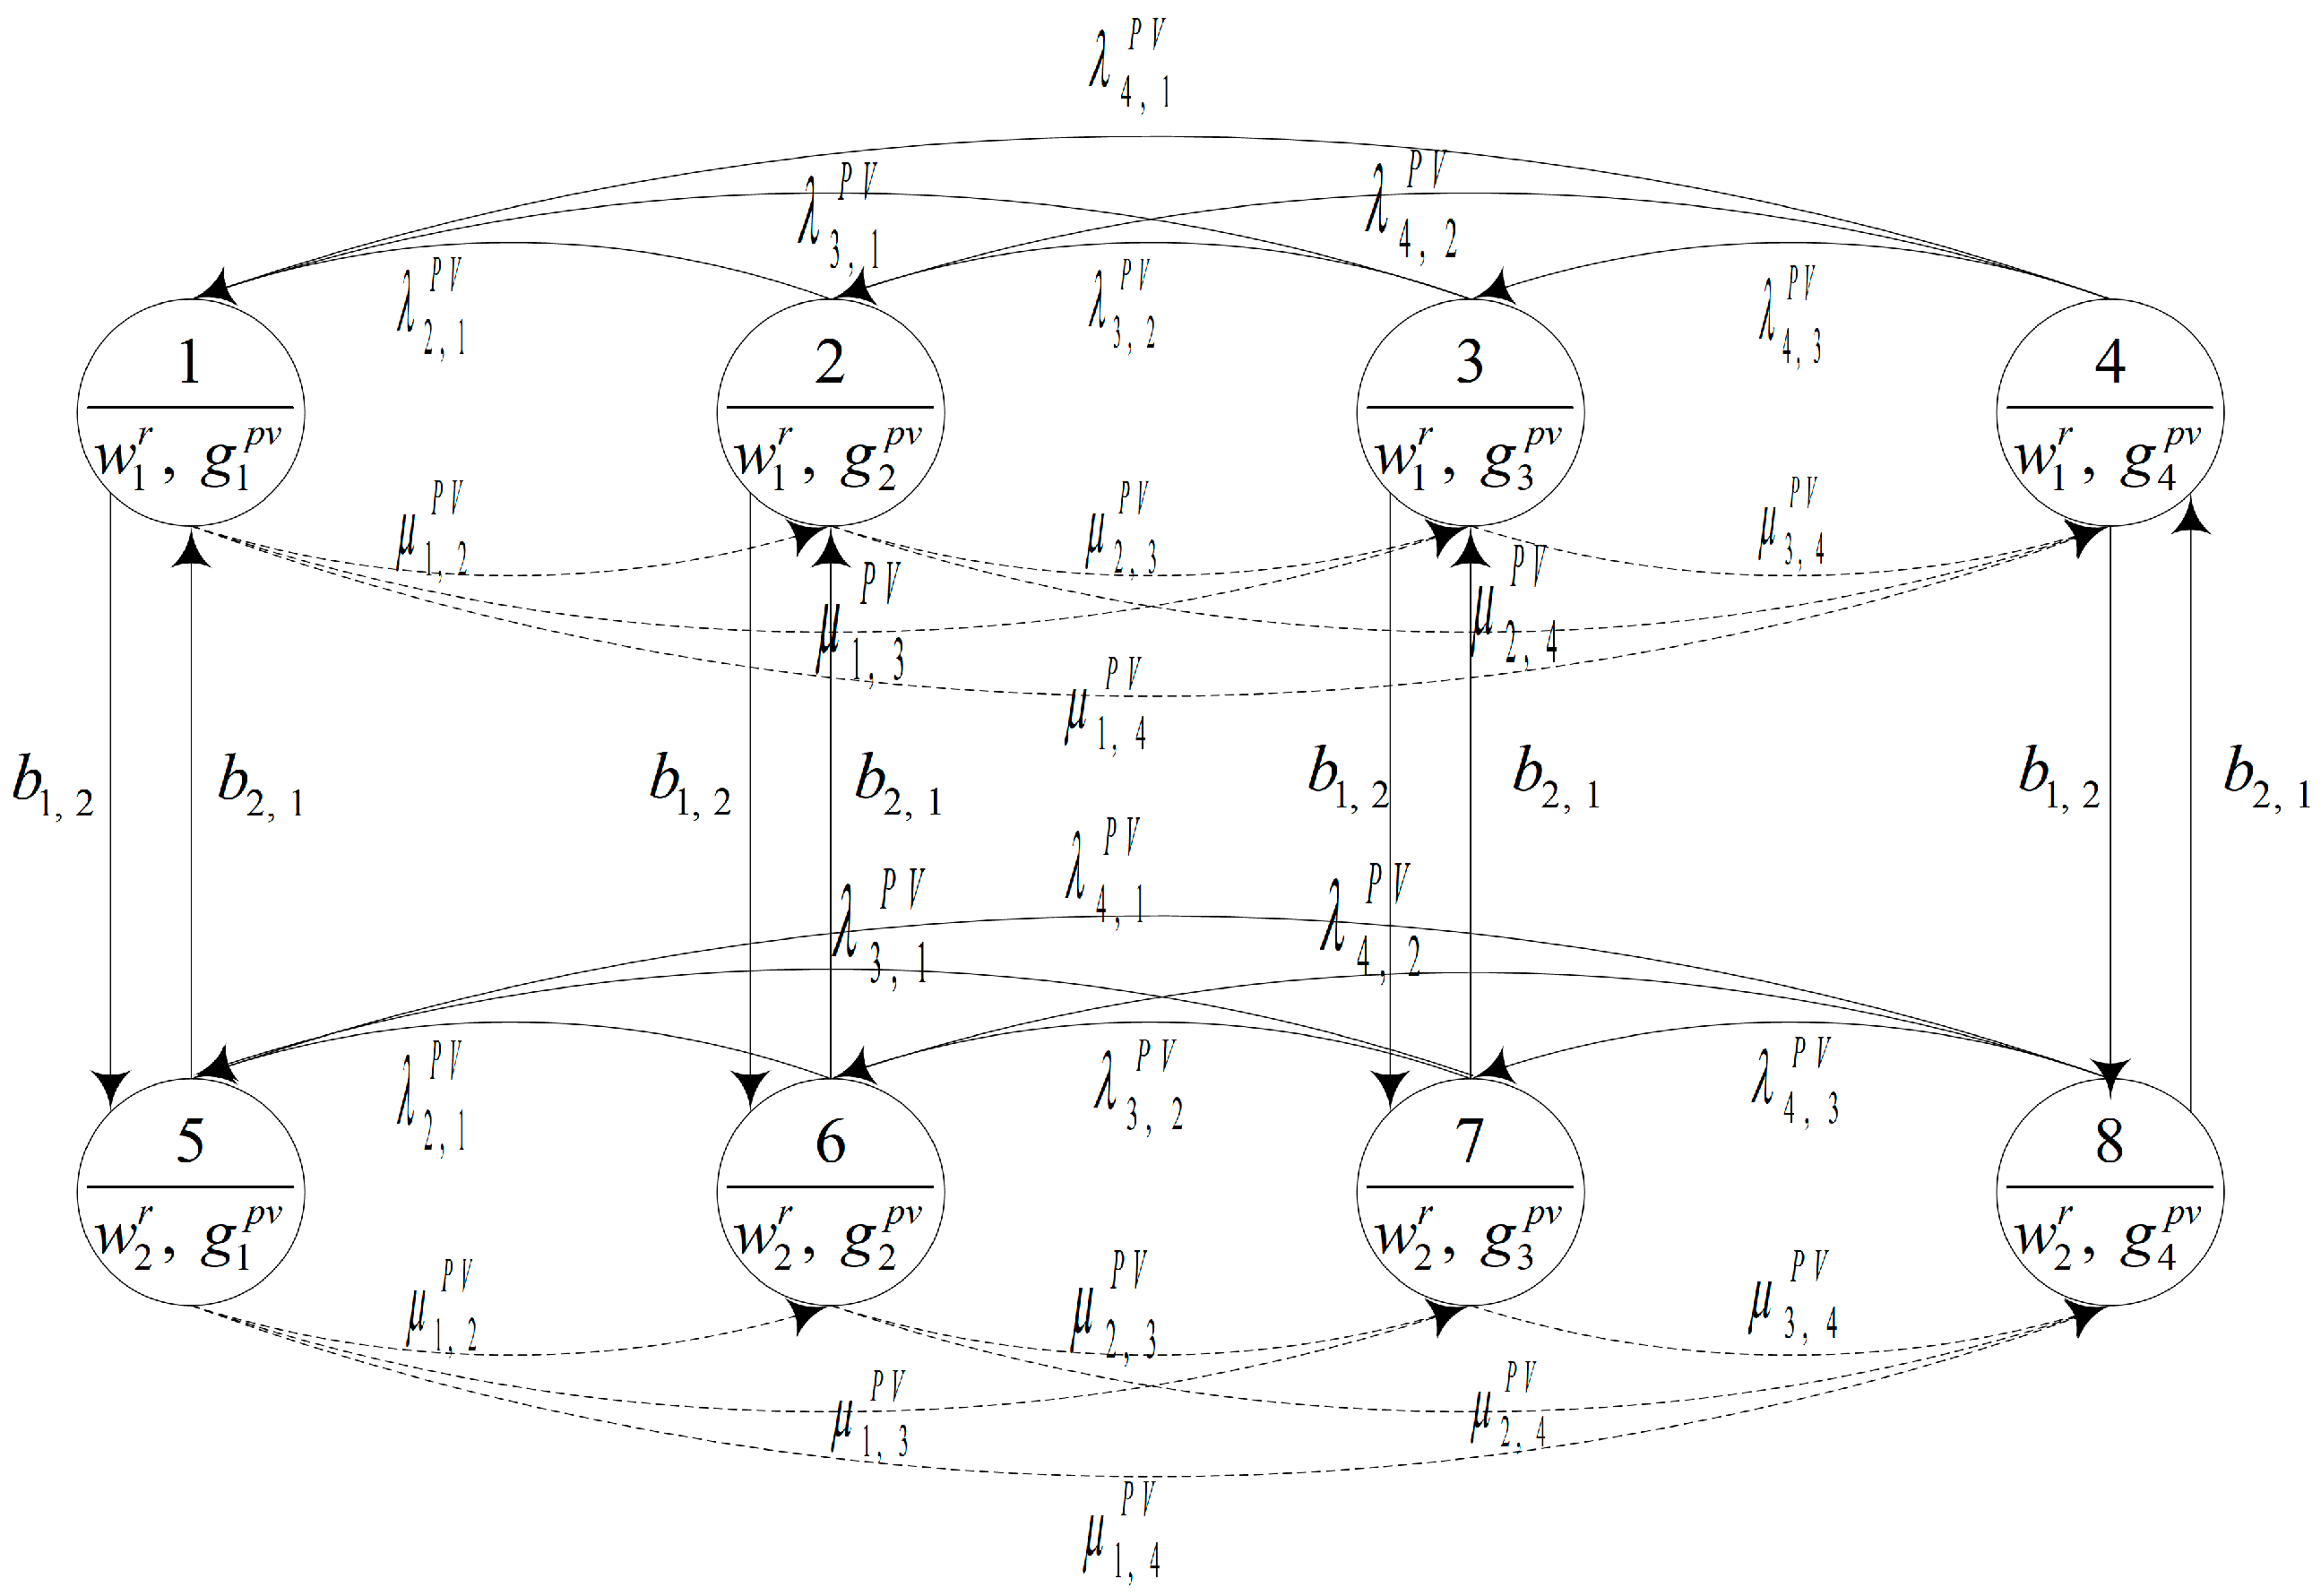
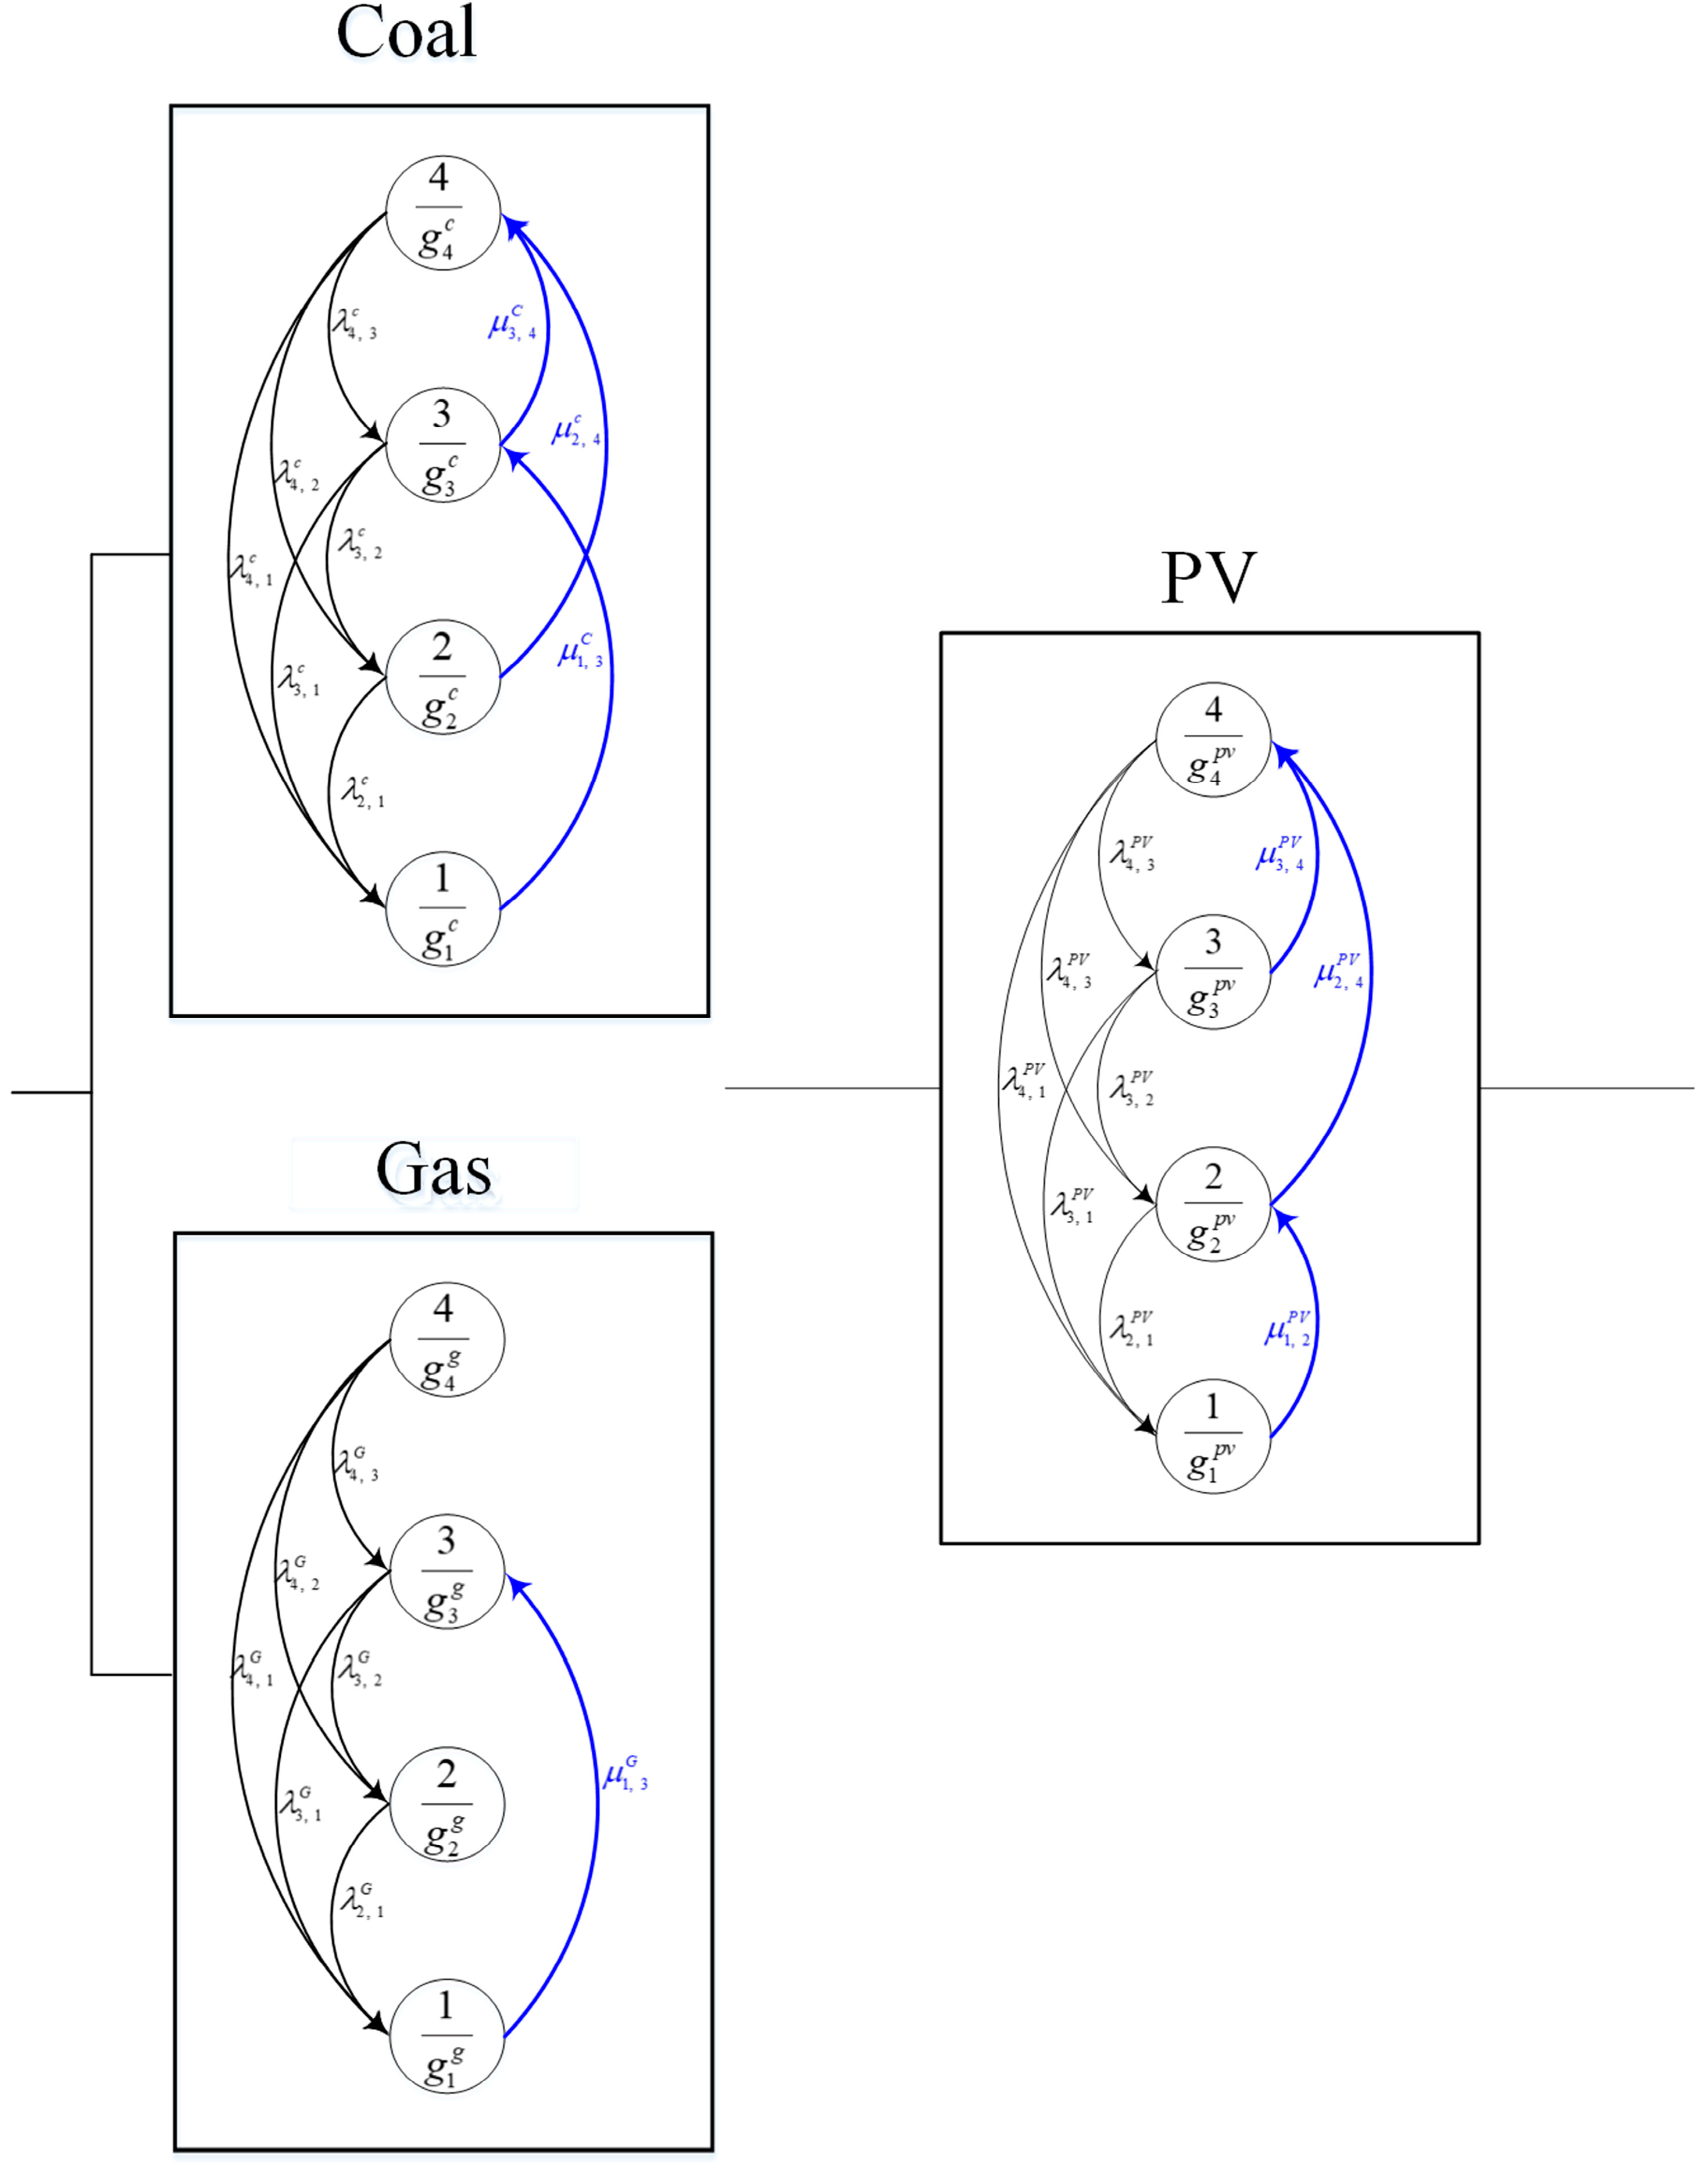
First, by combining the stochastic nature of the power supply with the power demand as a power supply–demand stochastic model (PSDSM) for the HPS configuration in a smart grid, the interrelation can be quantified, which characterizes the PSDSM dynamic behavior in a CTMC, given a specific PM strategy. Figure 6 presents the PSDSM as a result of integrating the state transition diagram of the power demand (as shown in Figure 3) into that of the power supply (as shown in Figure 2) in the main power system. Similarly, for the redundant solar power system, Figure 7 presents the established PSDSM resulting from the integration of the state transition diagram of power demand (as shown in Figure 5) into that of the power supply (as shown in Figure 4).
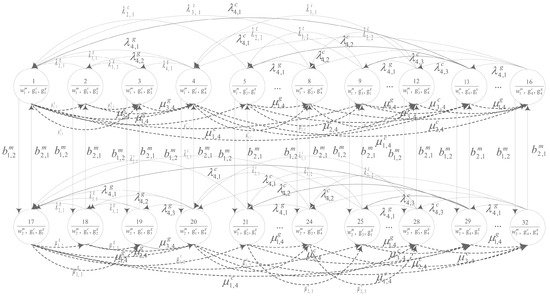
Figure 6.
Transition diagram of the PSDSM for the main power system.
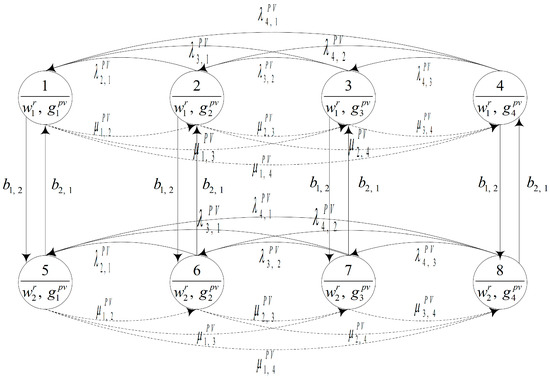
Figure 7.
Transition diagram of the PSDSM for the redundant solar energy system.
Step 2: Calculations of the power efficiency-related measures
- Power efficiency-related measures
(a) Construction of the PSDSM transition intensity matrices
A 32 × 32 PSDSM transition intensity matrix (TIM) pertaining to the main power system was principally constructed behind a CTMC establishment, as it contained 32 states, as shown in Figure 6. According to Figure 7, an 8 × 8 PSDSM TIM related to the redundant solar energy system was determined, corresponding to its eight stochastic states. Mathematically, the behavior of stochastic models can be completely attributed to these two TIMs.
(b) Establishment of the CTMC of the PSDSM
The PSDSM TIMs were further utilized to establish the CTMCs in the form of Chapman–Kolmogorov equations and simultaneous differential equations related to the main power system and redundant solar energy system, respectively. The power system availabilities in a smart grid can be determined by separately solving these two PSDSM simultaneous differential equations by summing up the state instantaneous probabilities at a specific time, with the power supply exceeding the power demand. With respect to the simulated smart grid for this community, the main power system is responsible for supporting the inside household demand, whereas the redundant solar energy system is dedicated to public utilities, such as park lamps and watering systems.
- 2.
- Total maintenance cost
A preventive maintenance strategy necessitates the appropriate sustainability of system functions over time. Nonetheless, the PM strategy leads to considerable maintenance costs with respect to the maintenance resources and component costs. Based on Figure 2 and Figure 4, where the dashed lines indicate probable maintenance activities, Markov reward models [34] were established with reward matrices accounting for the cost-induced maintenance activities conducted on the main power system and redundant solar system in a smart grid, to calculate the total maintenance cost with different PM strategies. The summation over these two rewards then determines the total maintenance cost.
3.2. Construction and Optimization of Four PM Models
Four distinct PM models with two single-objectives and two bi-objectives were established to provide further insight into the established PM model for smart grid.
3.2.1. Construction of Two Single-Objective PM Models
First, considering the scenario that mean power system availability takes precedence over total maintenance cost, we established a PM model to maximize the mean power system availability while satisfying the allowance of total maintenance cost for the smart grid as follows:
Objective: maximize mean power system availability subject to
where is the mean power system availability at time in a community smart grid; is the total maintenance cost for the HPS; and a summation over corresponds to the PM cost of the component among the components in HPS, and is determined by .
Second, in contrast, considering the scenario that total maintenance cost takes precedence over mean power system availability, we established a PM model to minimize the total maintenance cost while satisfying the minimum requirement of mean power system availability for smart grid as follows:
Objective: minimize the total maintenance cost subject to
where is a constraint that represents the minimum requirement of the mean power system availability in a community smart grid.
3.2.2. Construction of Two Bi-Objective PM Models
Considering the scenario that mean power system availability and total maintenance cost are considered of equal importance for smart grid, we successively established two bi-objective PM models with the minimization of the mean power system unavailability and total maintenance cost in parallel with and without optional functional constraint, respectively. The added constraint requires each degradation state of the component to a maximum of one maintenance activity to simplify the implementation of the PM strategy, particularly, if human reliability is considered a concern [18]. Accordingly, two bi-objective PM models can be established using the optional functional constraint as follows:
Minimize the mean power system unavailability:
Minimize the total maintenance cost:
Optional functional constraint:
where and represent the mean power system unavailability with respect to time, and total maintenance cost, respectively. Moreover, indicates a binary decision variable that corresponds to a specific maintenance activity for the component in the degraded state to State ; and is the total number of states of the component.
3.3. Single-Objective PM Optimization
A total of combinations constitute 2,602,144 possible PMs in the form of distinctive chromosomes with coded binary genes from a combinatorial optimization problem. This inferred result is based on the following. There were six possible maintenance activities for the separate apparatuses of coal-fired power and natural gas in the main power system, and six possible maintenance activities in the redundant solar power system for the simulated community smart grid. Hence, there was a total of 18 possible maintenance activities with respect to the HPS for the complete optimization of the established PM models. These formed the basis of the chromosome coding and subsequent GA optimization, as presented below.
Step 1: Performance of chromosome coding
A total of 18 distinct binary code genes produced a distinguished chromosome corresponding to 18 possible PM actions, which constitutes a PM strategy for the smart grid system.
Step 2: Generation of chromosome population
The scale of the chromosome population was set at n = 40, with each representing a PM strategy with different genes generated based on a random mechanism. The chromosome evolution mechanism was executed to determine and approximate the best solution in the domain.
Step 3: Performance of GA crossover and mutation
Step 4: Calculation of the fitness values of chromosomes
The fitness value function f (to be minimized) was constructed for the first PM model with the total maintenance cost as a constraint, and is expressed by Equation (10). Moreover, Equation (11) expresses the second PM model with the mean power system availability as a constraint:
where is an extreme penalty that prevents from exceeding the feasible region in GA evolution mechanisms for a constrained mathematical optimization model, e.g., 99,999. In the simulated cases, the constraint of the total maintenance cost was set as , whereas the constraint of the mean power system availability was set as with a mission time of 100 days for both PM models.
Step 5: Termination conditions
The GA stopped the searching mechanism when the maximum iterations reached 20, or when five successive iterations of the solution were not improved. Thereafter, it outputted the optimizing PM strategy and its corresponding objective value.
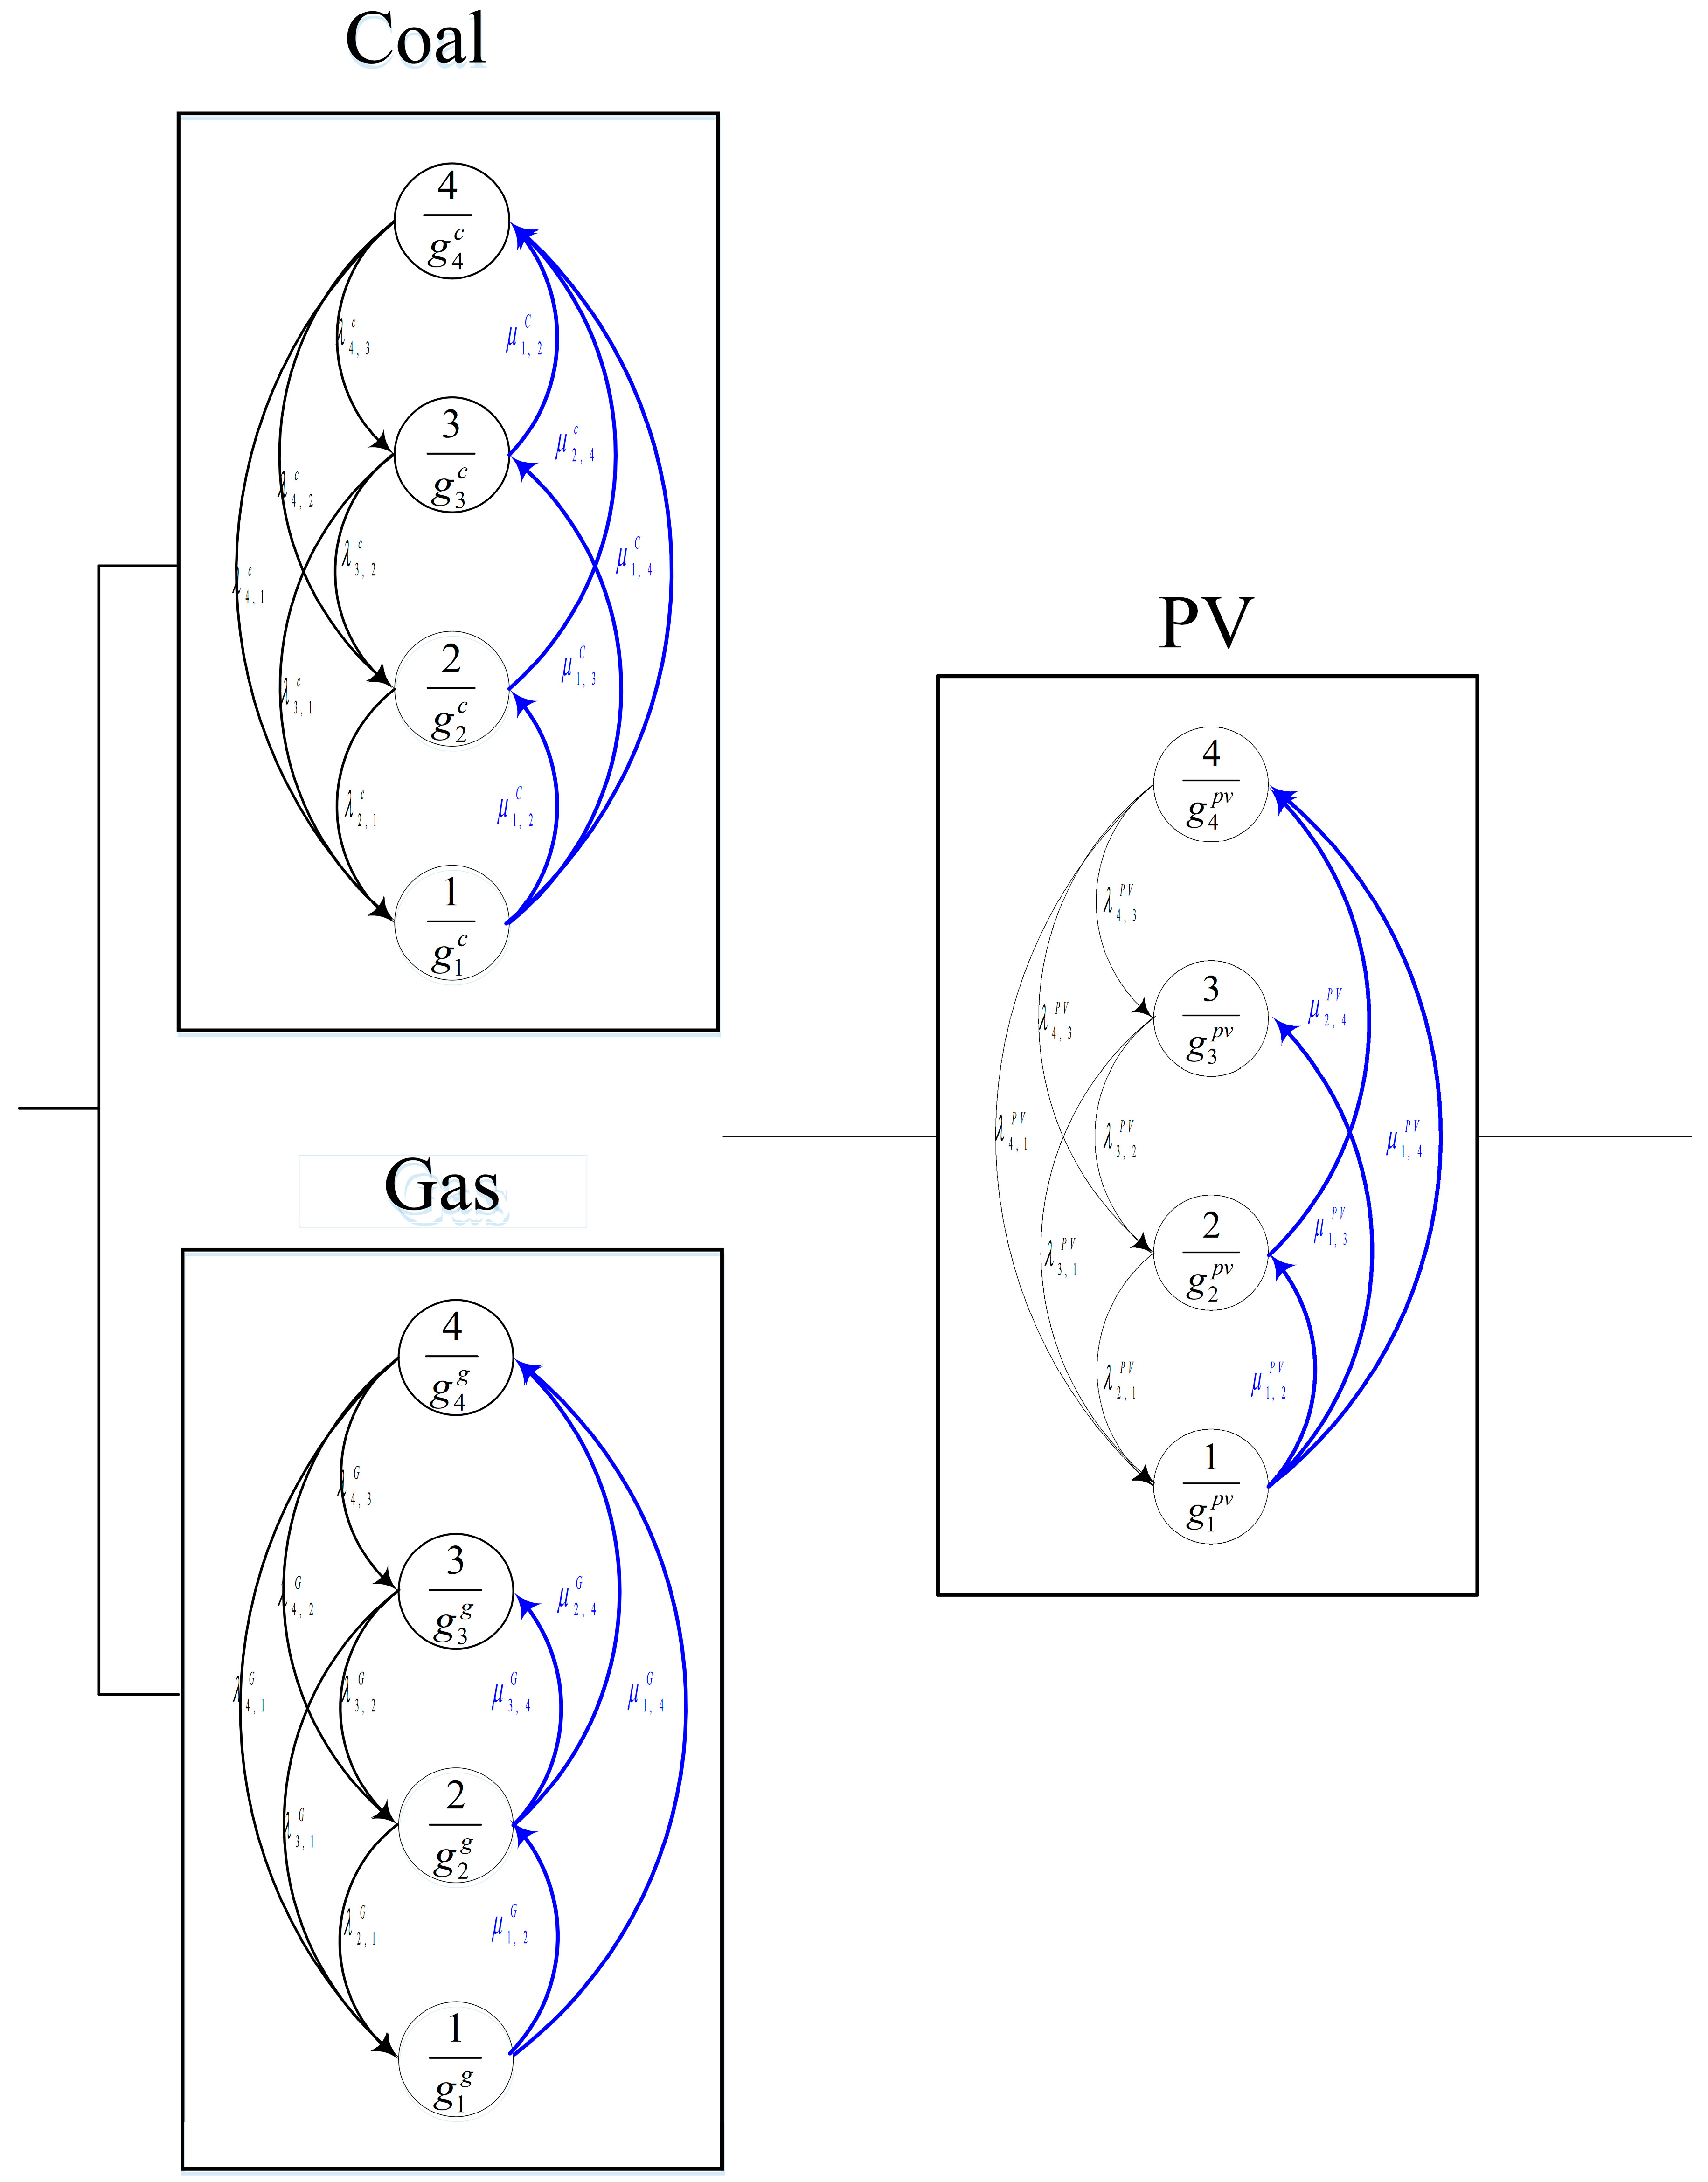
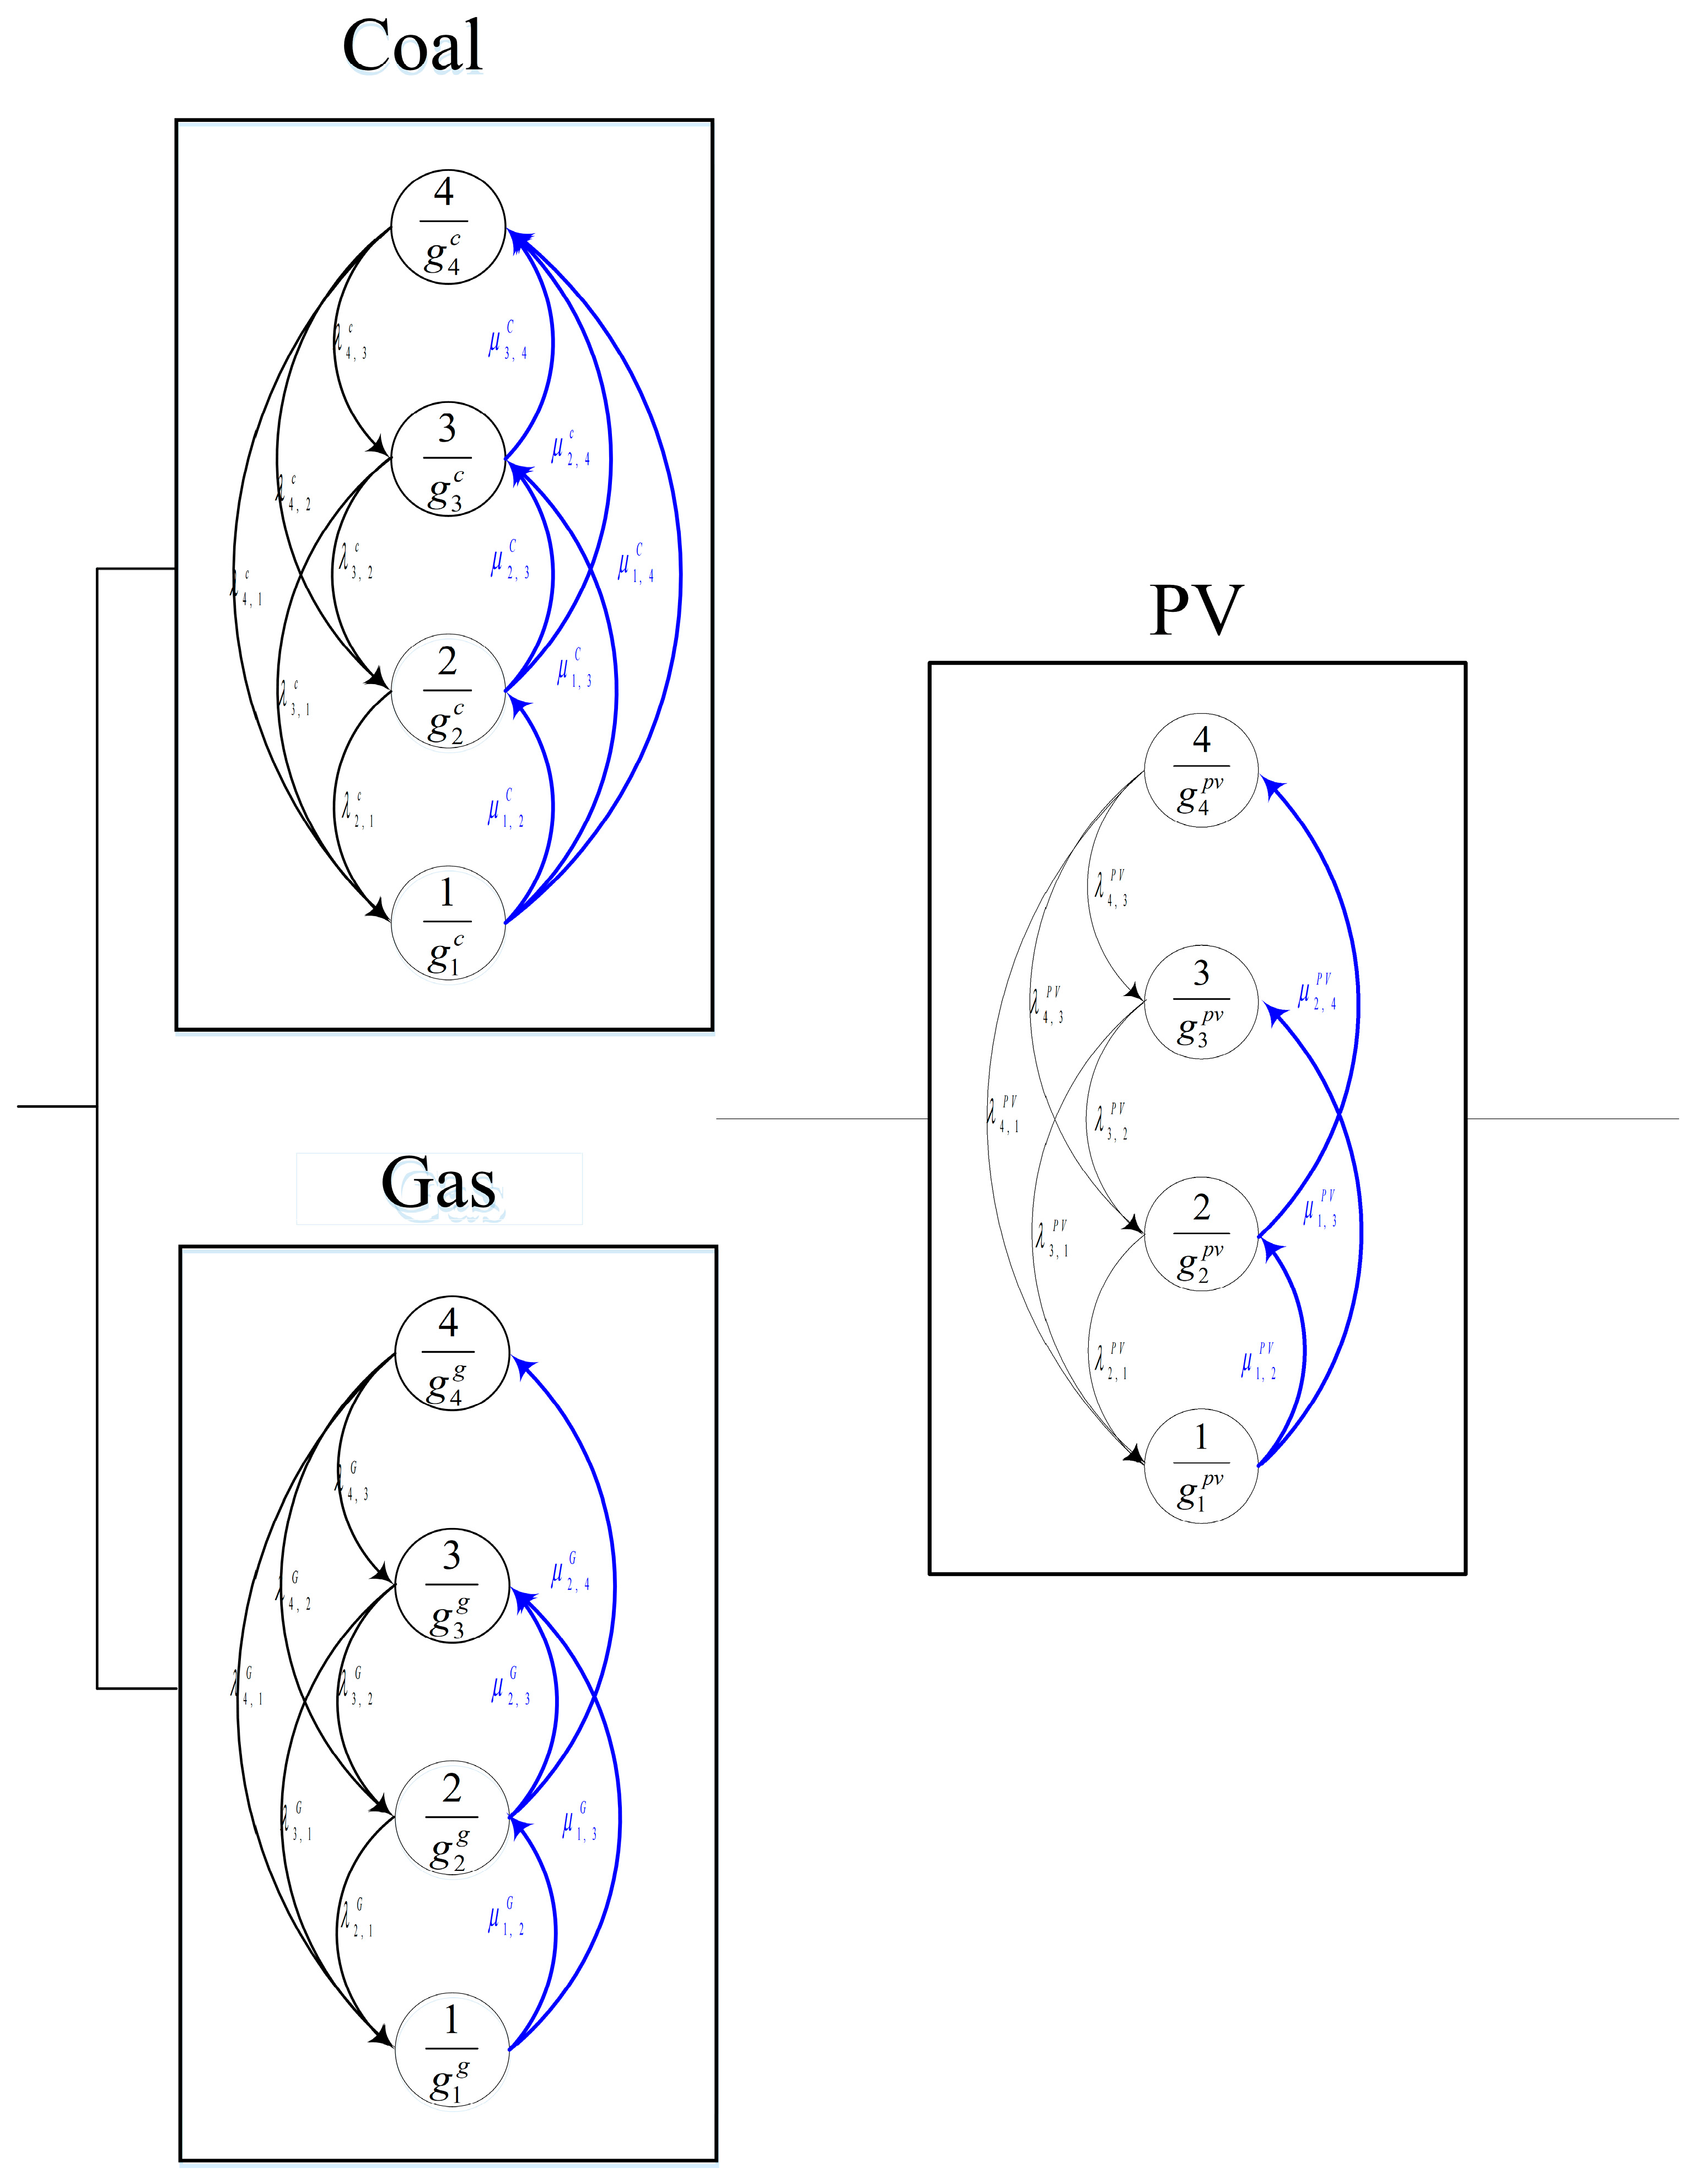
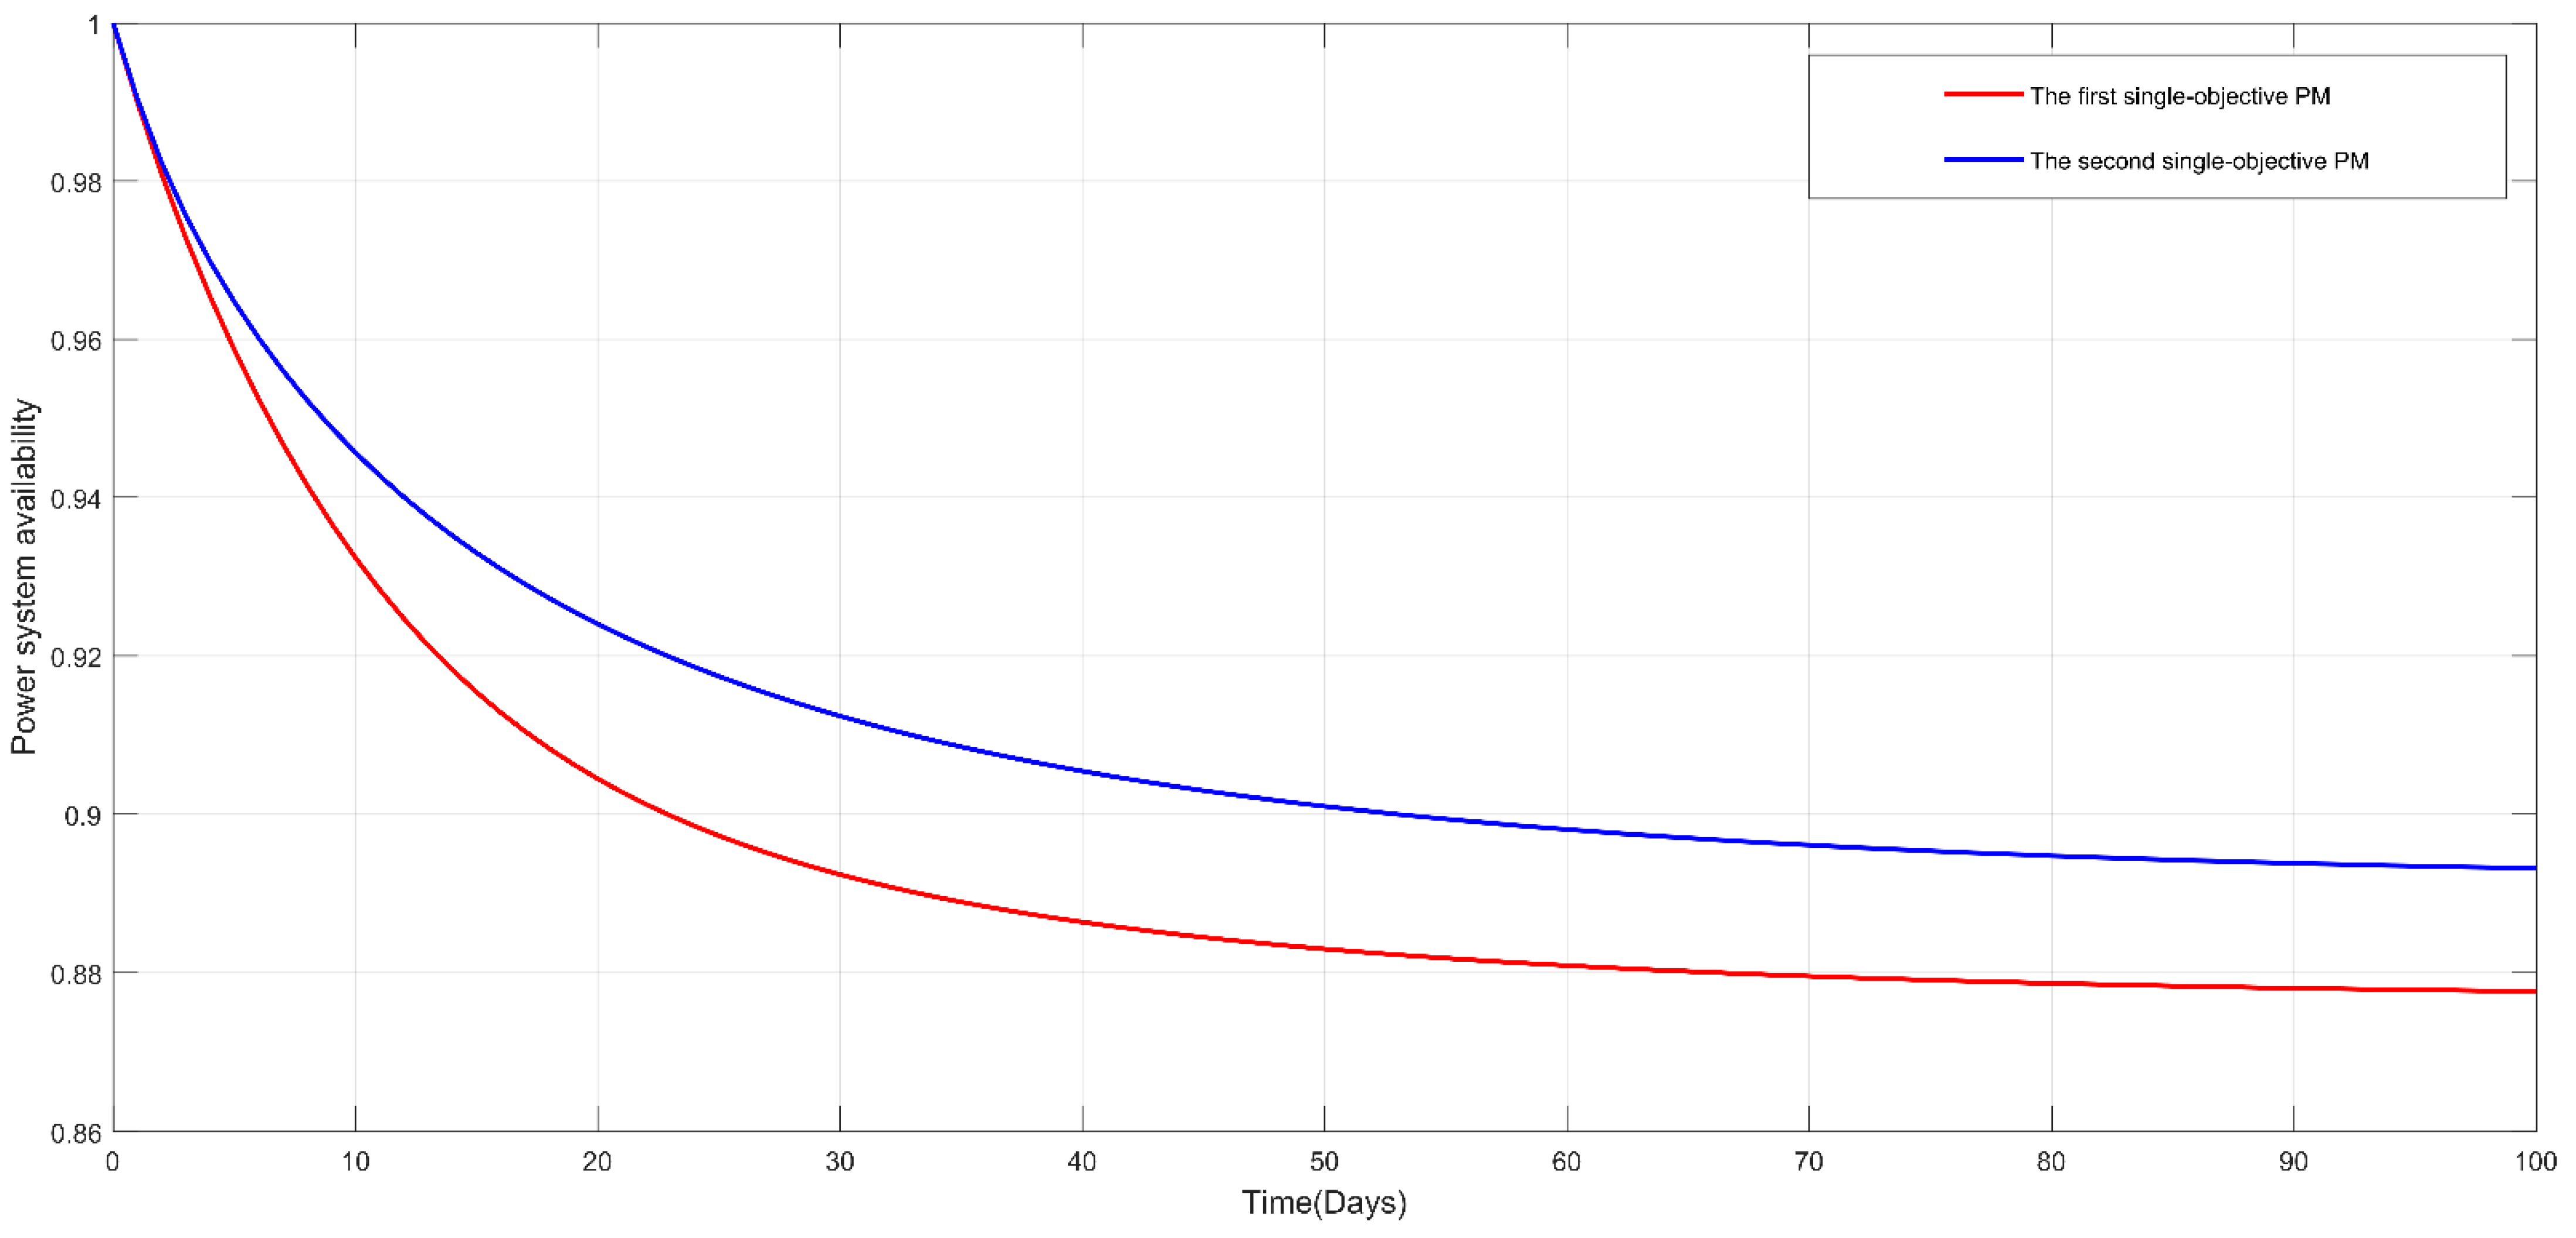
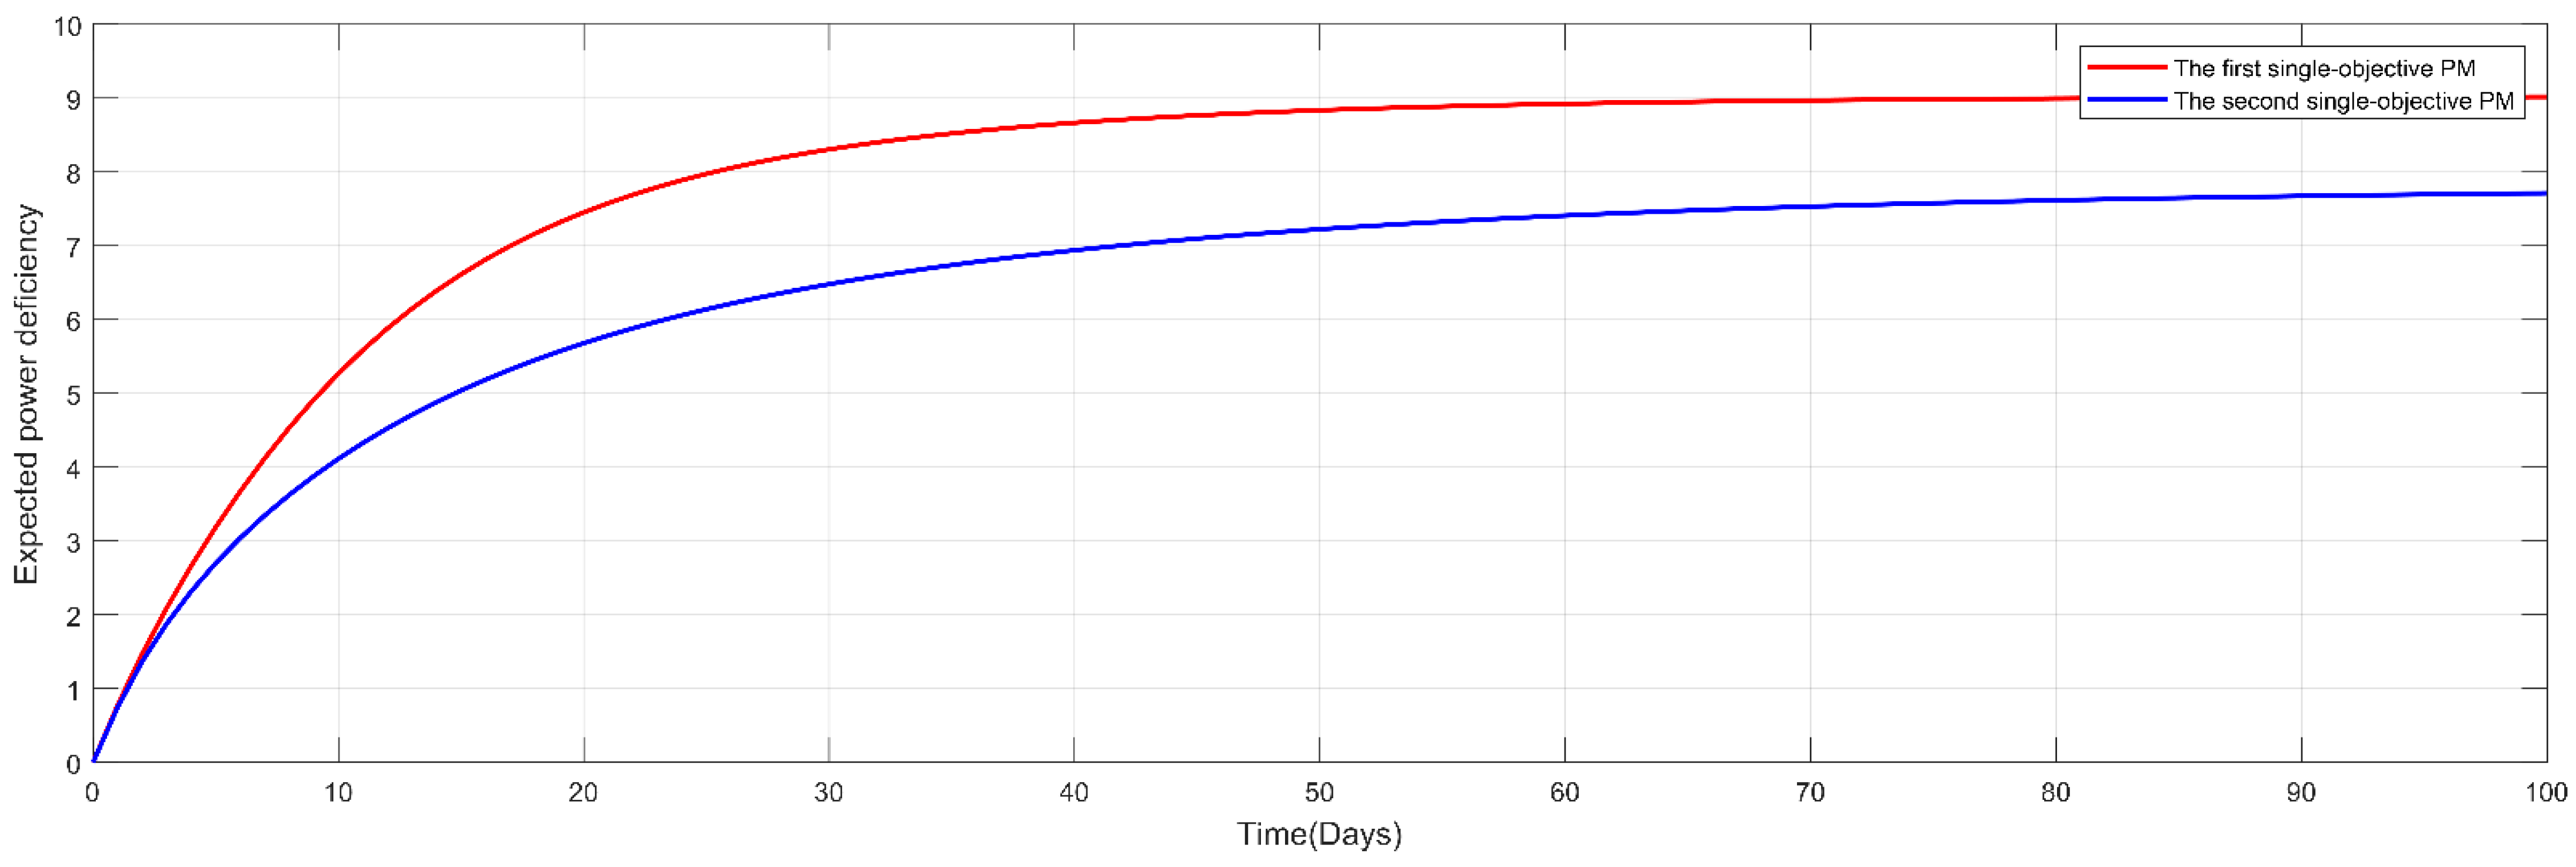
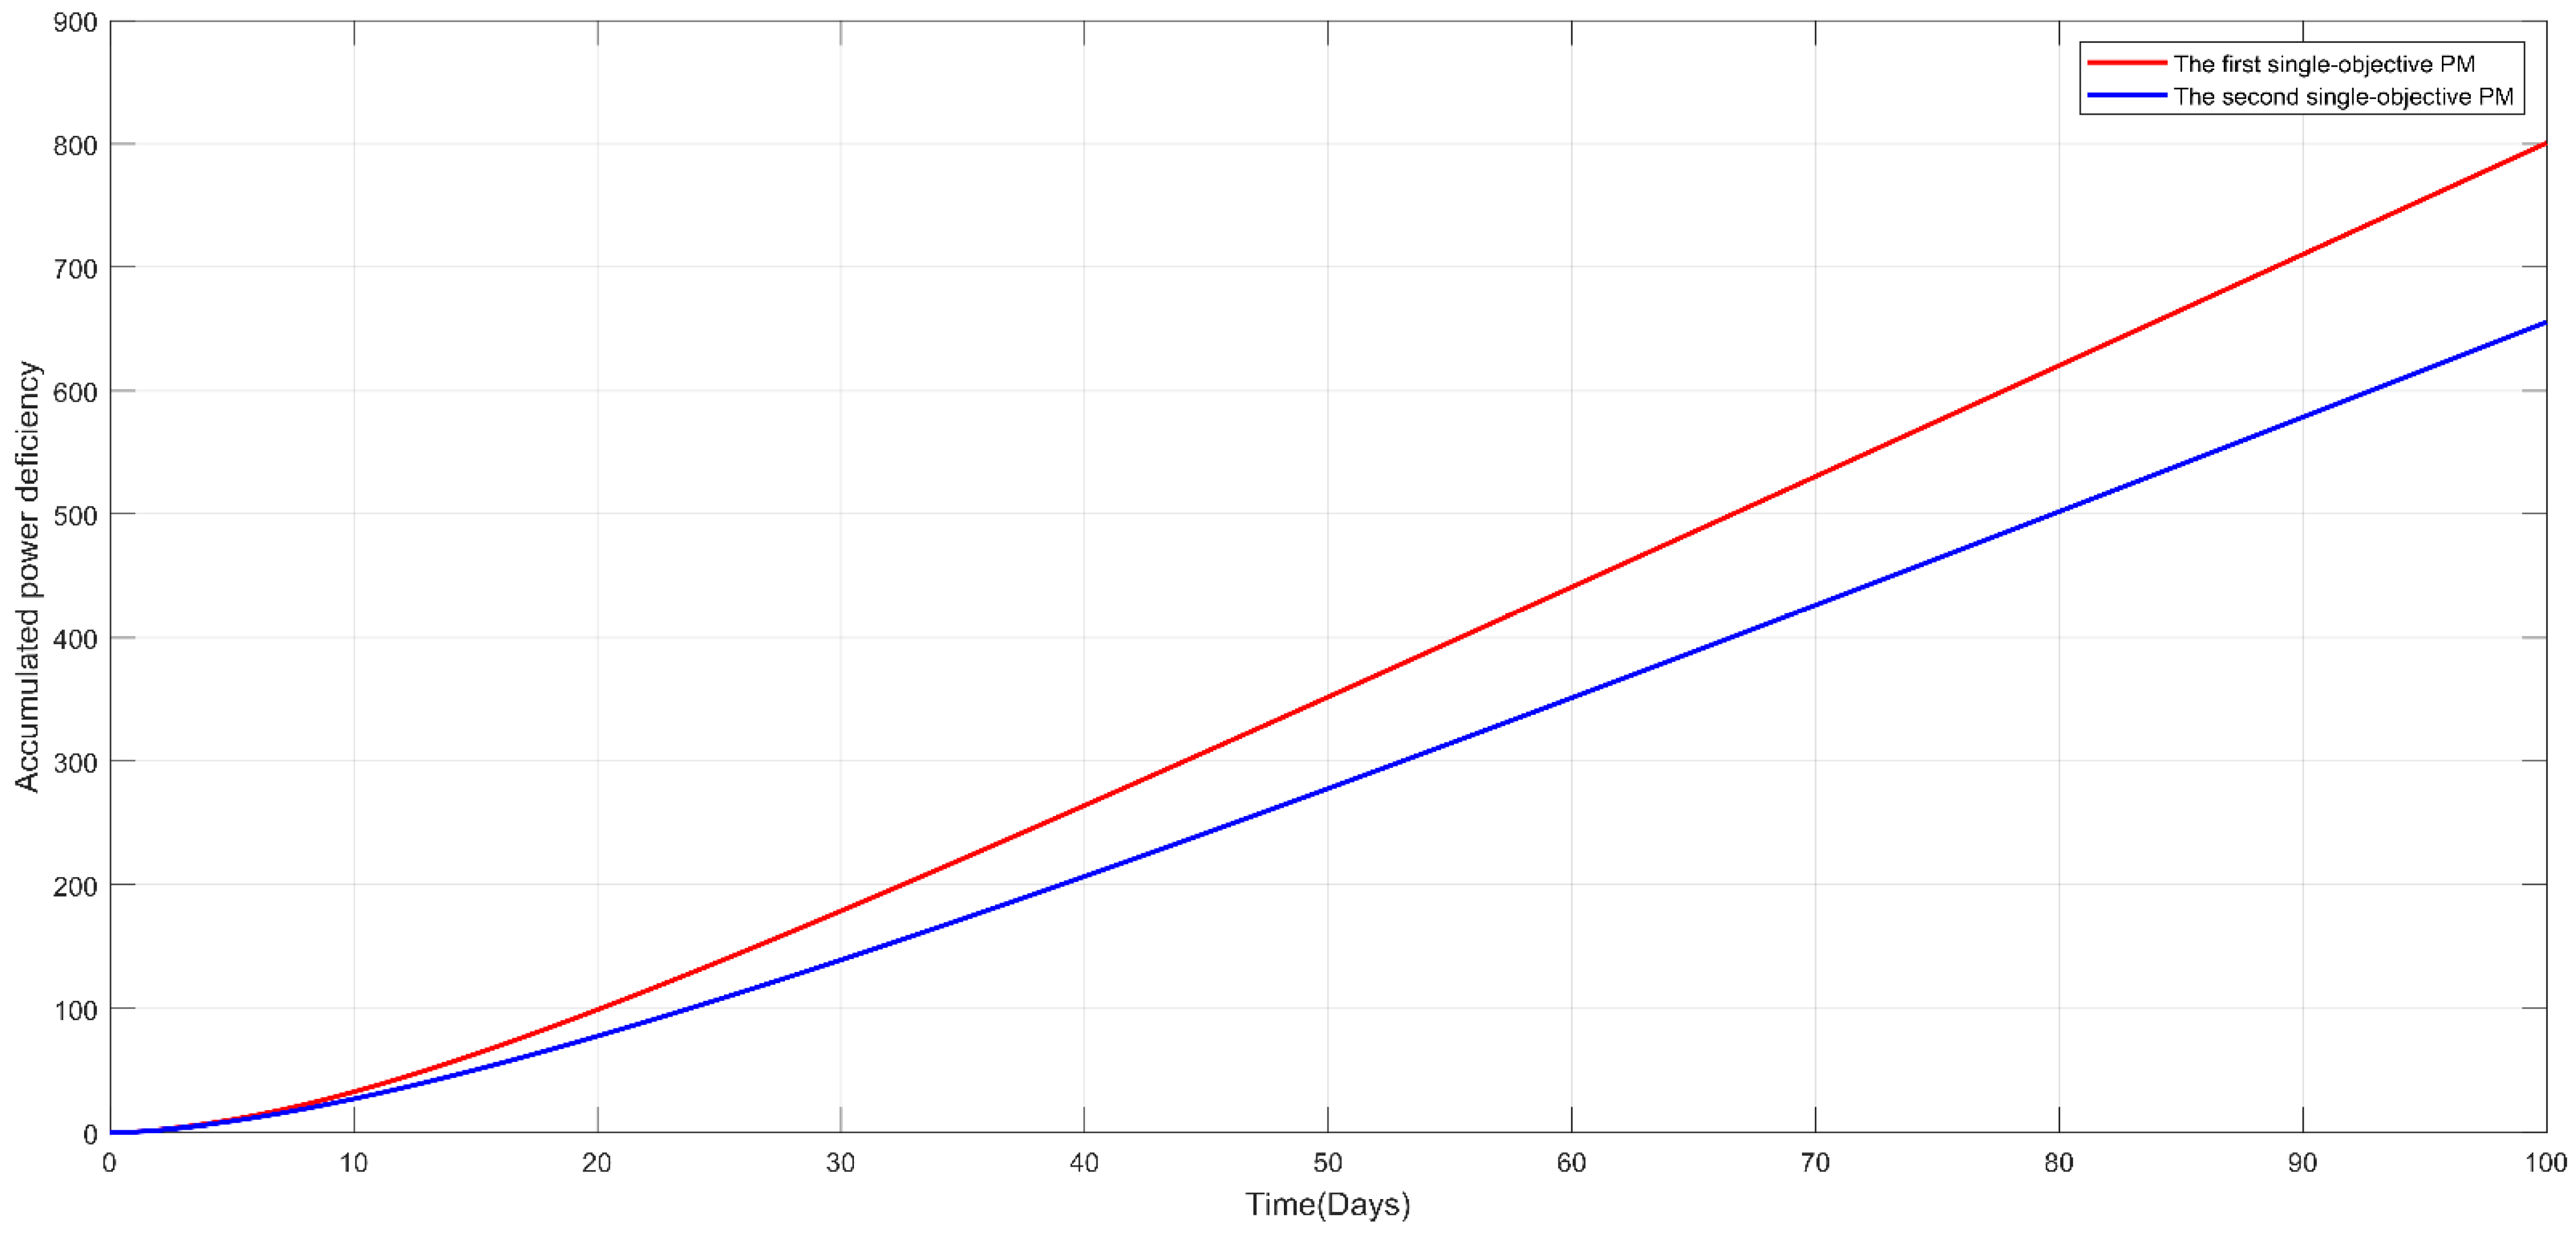
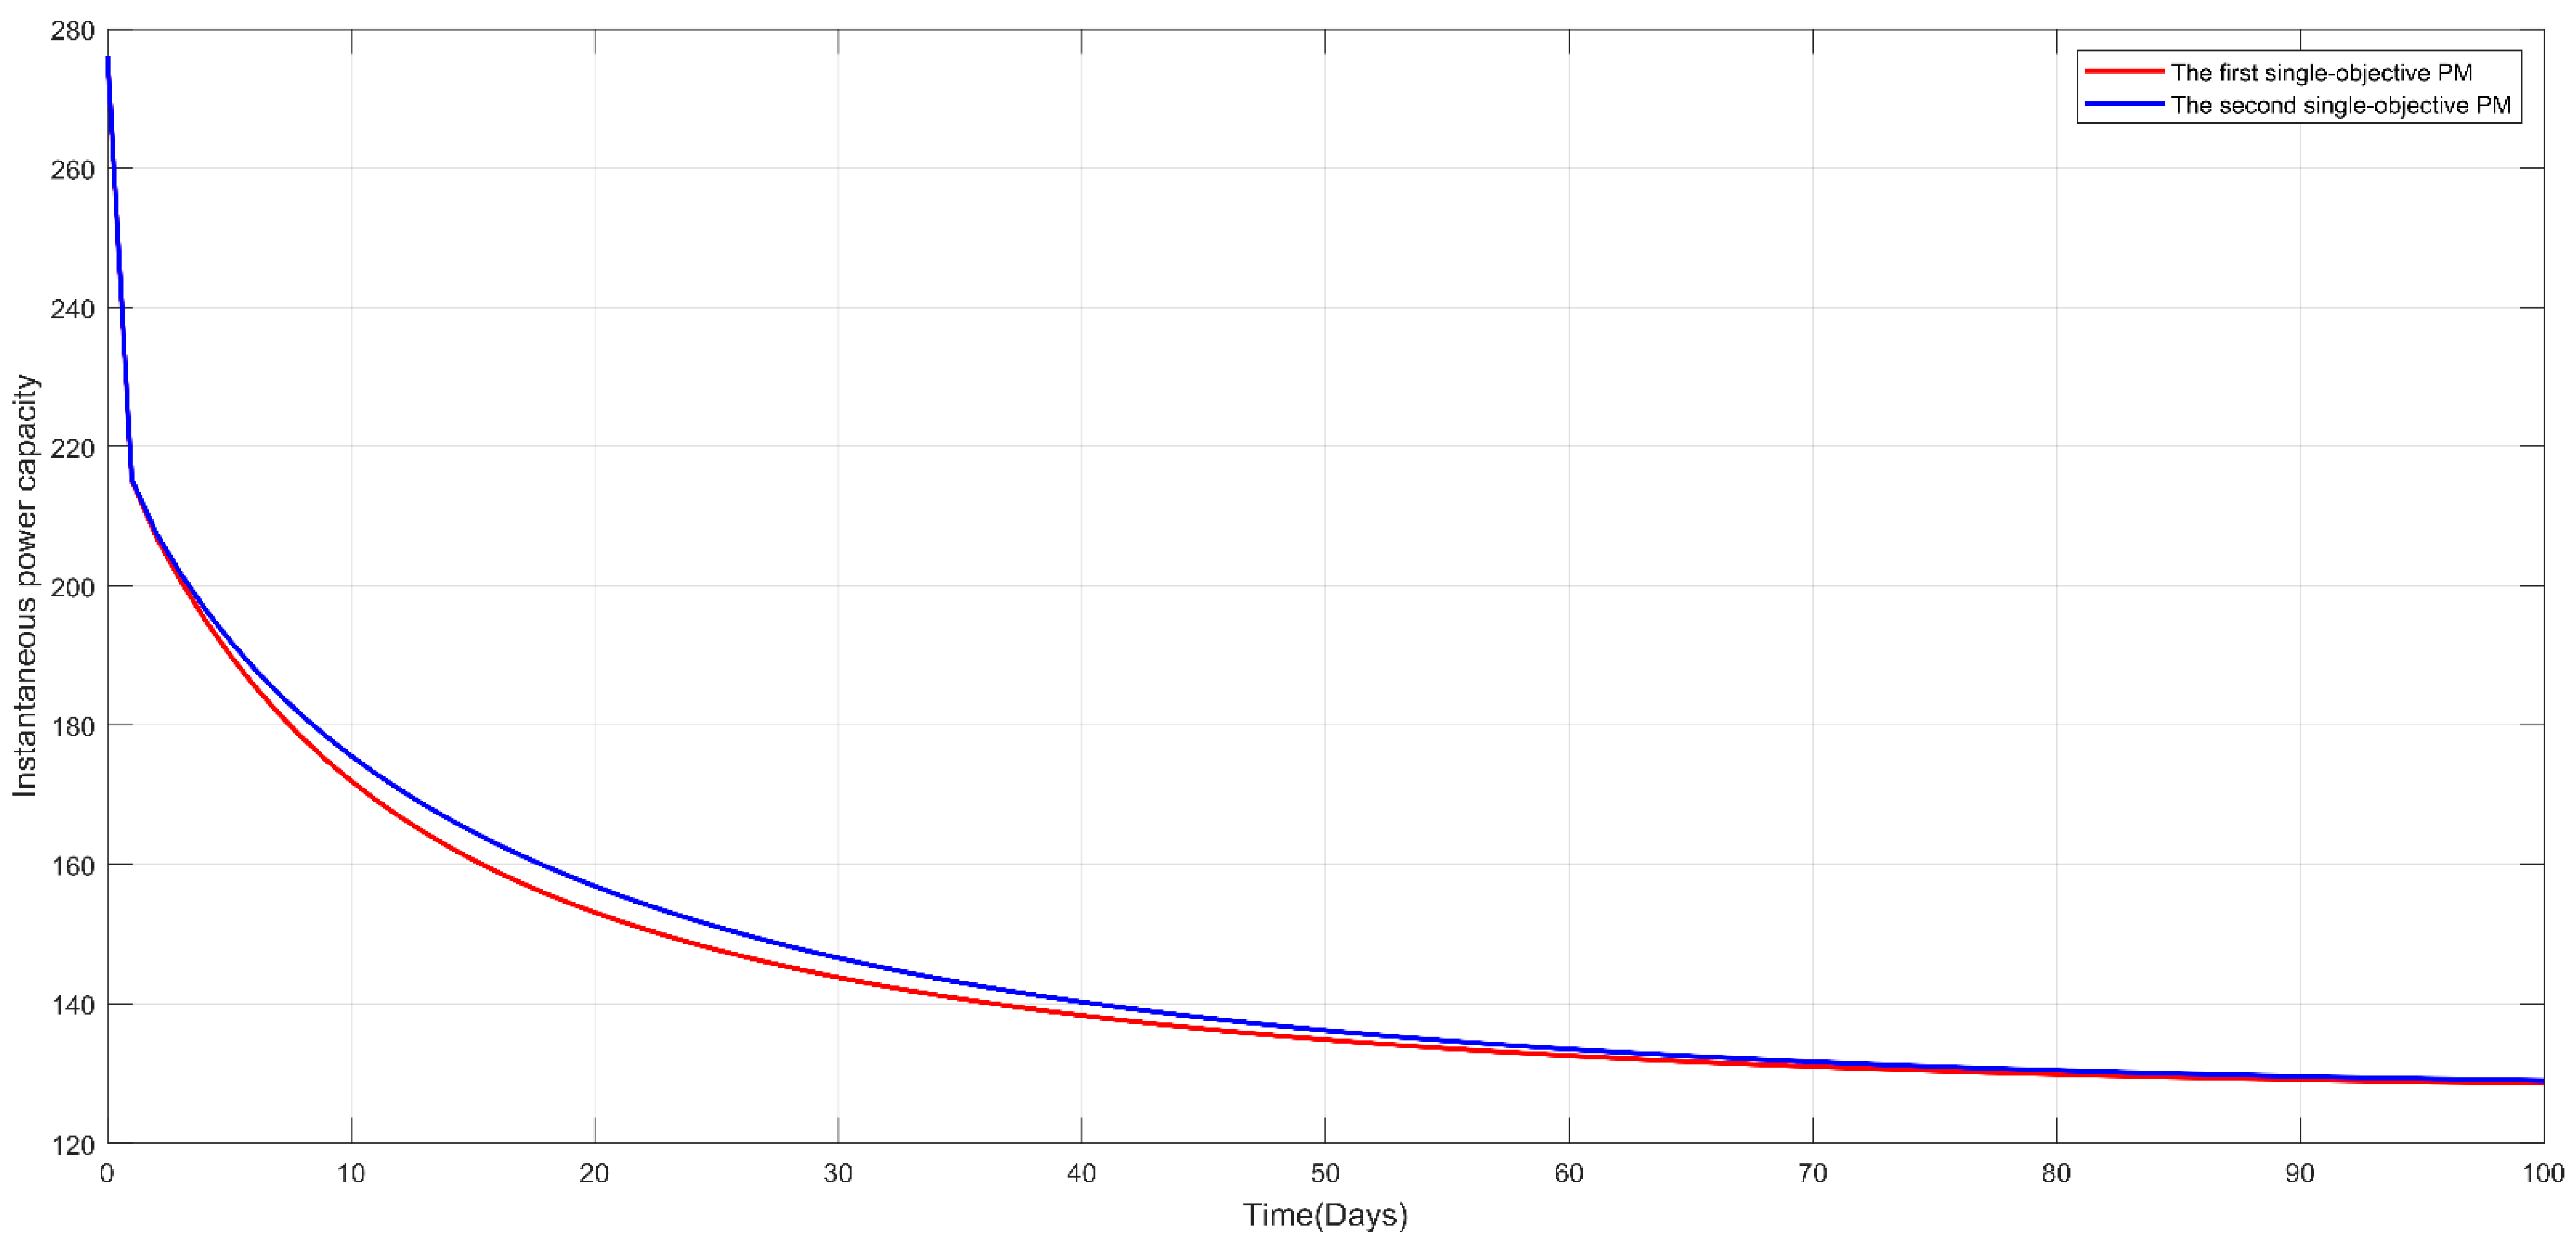
Table 1 summarizes the obtained mean power system availability and total maintenance cost under the optimized PM strategies in the form of a transition diagram for each apparatus (Figure 8 and Figure 9), after the completion of the GA optimization procedure for the first and second PM models. Moreover, Figure 10 presents the corresponding trajectory of the power system availability with a time horizon of 100 days; and Figure 11, Figure 12, Figure 13 and Figure 14 present the other power-related efficiency measures mostly related to the electrical industry, which include the expected power deficiency and accumulated power deficiency, in addition to the instantaneous power capacity and accumulated power capacity. With the investigation of the nuanced differences, the apparatuses of coal and gas were found to exhibit the same PM strategies in both PM models. The photovoltaic (PV) apparatuses had different PM strategies; thus leading to discrepancies between the five power performance measures. This can be primarily attributed to its inherent objective of mean power system availability when compared with the total maintenance cost as an objective in the second PM model. However, the extent to which the constraint allows for the optimization of the PM model may play an essential role. As can be seen from Table 1, the first PM model exhibited an optimized mean power system availability and total maintenance cost of 0.9113 and 2173, respectively, which was higher than those of the second PM model (0.8951 and 2000, respectively). This was verified by the superiority of the first PM model over the second model with respect to the other four power-related efficiency measures, namely, the expected power deficiency and accumulated power deficiency, in addition to the instantaneous power capacity and accumulated power capacity, as shown in Figure 11, Figure 12, Figure 13 and Figure 14. In summary, the nuanced differences in the optimized single-objective PM strategy led to discrepancies in electricity measures. Therefore, the degree of the discrepancies is directly related to the established PM strategy. In practical applications, these two single-objective PMs can be used to determine the most appropriate PM strategy. Principally, a selection between these two PM models can be made based on the dominant response as the optimization objective, and the other minor responses as constraints, in accordance with resource limitations and system performance requirements, among other practical considerations. Adaptation to these two PM models can ensure practicality by utilizing the developed power-related efficiency measures in a smart grid.

Table 1.
Results of GA optimization for single-objective PM models.
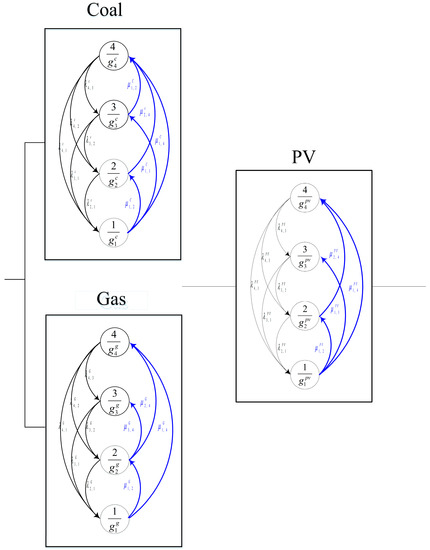
Figure 8.
Transition diagram of the first single-objective optimal PM strategy for the apparatuses.
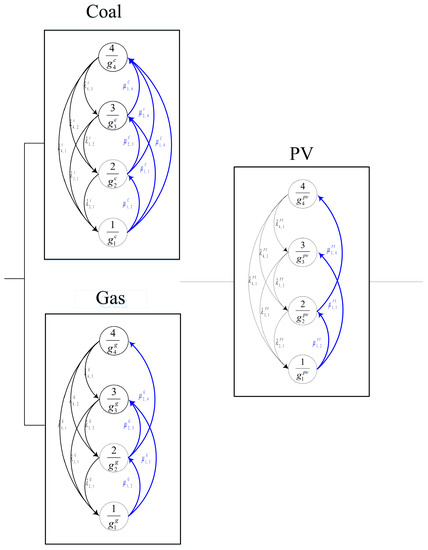
Figure 9.
Transition diagram of the second single-objective optimal PM strategy for the apparatuses.
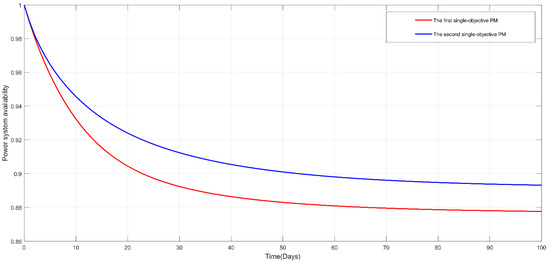
Figure 10.
Power system availability with respect to time for the first and second single-objective PM models.
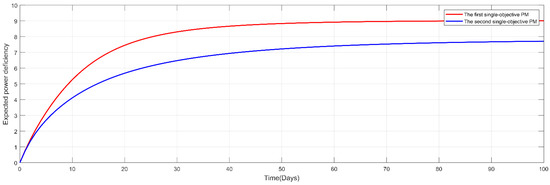
Figure 11.
Expected power deficiency with respect to time for the first and second single-objective PM models.
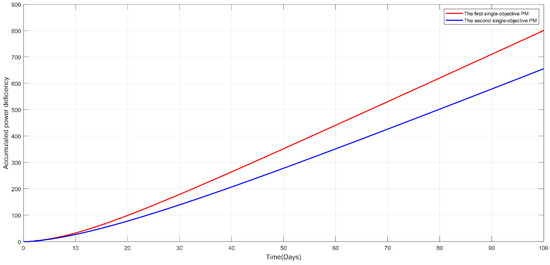
Figure 12.
Accumulated power deficiency with respect to time for the first and second single-objective PM models.
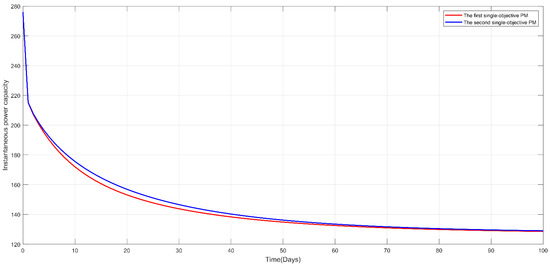
Figure 13.
Instantaneous power capacity with respect to time for the first and second single-objective PM models.
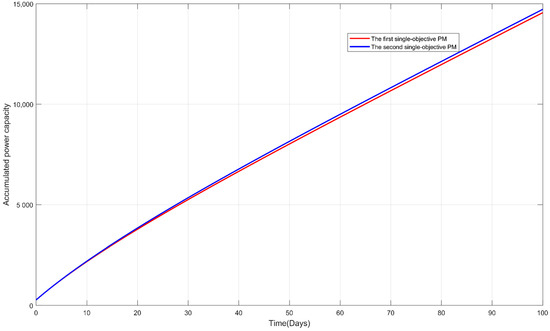
Figure 14.
Accumulated power capacity with respect to time for the first and second single-objective PM models.
3.4. Multi-Objective PM Optimization
In this study, the NSGA-III was modified to allow for the resolution of the established bi-objective PM models, in which the binary decision variables constitute a combinatorial optimization problem. The steps involved in the customized NSGA-III are presented below.
Step 1: Implementation of chromosome coding
The chromosome structure coded for multi-objective optimization was equivalent to that of single-objective optimization (with reference to the previous sub-section). Moreover, based on the schemed NSGA-III searching mechanism, it was further investigated and utilized to optimize the mean power system unavailability and total maintenance cost in parallel toward the minimum for the two established bi-objective PM models.
Step 2: Generation of chromosome population
In this case, the scale of the chromosome population was set as n = 40. Accordingly, 40 chromosomes coded by different binary genes were generated based on a random mechanism, where each chromosome corresponded to a PM strategy solution. Thereafter, the chromosome evolution mechanism was executed to approximate the optimal objective set in the form of a Pareto front behind the optimal combinatorial codes in the domain.
Step 3: Construction of reference points
Reference points were evenly distributed between the two objectives to facilitate the evolution of the chromosome population toward the Pareto front, and a niche preservation technique was used in the GA screening mechanism to maintain the diversity of the chromosome population in each iteration.
Step 4: Propagation of offspring chromosome
Offspring with identical sizes of chromosome population n, as generated by a random binary crossover and mutation mechanisms, emerged into the chromosome population n, wherein the evolutionary pool constituted 2n chromosomes for the subsequent non-dominated sorting procedures.
Step 5: Construction of a constraint-tied chromosome-ridding mechanism
When running NSGA-III with the constraint of Equation (9), ; and by satisfying this constraint, chromosomes against the limitation induce a fitness penalty in terms of the mean power system unavailability and total maintenance cost and are excluded from the GA evolutionary mechanism. To conduct the constraint-tied chromosome-ridding mechanism, 18 distinct binary-code genes were re-grouped into a three-gene-subset vector of maintenance activities, where each entry in the vector represents the number of maintenance activities in compliance with the functional constraint, as outlined below.
A three-gene-subset vector of maintenance activity was constructed with reference to [1,2,3], where each element in the gene subset represents the totality of maintenance activities in the degraded states of each apparatus. The PM candidates in the form of genetic code combinations with a total of more than one violate the following constraint: .
The gene subset in chromosomes that conforms to the constraint entered the tailored NSGA-III algorithm evolution mechanism to propagate offspring, whereas an extreme penalty in terms of mean power system unavailability and total maintenance cost led to exclusion from the subsequent GA evolution.
Step 6: Performance of non-dominated sorting
The solution sets of chromosomes in the evolutionary pool were ranked in the order of Pareto dominance. Solutions that were not dominated by other solutions were denoted as Rank 1 (the highest rank). Moreover, solutions that were dominated only by Rank 1 solutions were denoted as Rank 2, and those dominated only by Ranks 1 and 2 were denoted as Rank 3. Thus, a lower rank of the non-dominated solution set of chromosomes was preferable. According to the rank, the number of transcending chromosomes determined based on the crossover rate was added to the crossover pool for subsequent genetic evolution.
Step 7: Generation of offspring
Response surface methodology was utilized instead of the trial-and-error approach, to determine the optimal settings of the related parameters, including the crossover and mutation rates [35,36]. This increased the solution searching capacity. Using crossover and mutation genetic mechanisms, offspring were generated randomly with the crossover rate, mutation rate, and degree of mutation set as 0.8, 0.2, and 0.8, respectively. The genetic evolution procedure that includes the rank and selection, crossover, and mutation mechanisms was conducted repeatedly. Step 5 was then repeated until the customized NSGA-III satisfied the termination condition of 40 generations.
Step 8: Output of non-dominated solutions
The optimal ramification of the established bi-objective PM model in the Pareto front comprises the non-dominated solution sets. Figure 15. presents the flowchart of tailored NSGA-III by steps.
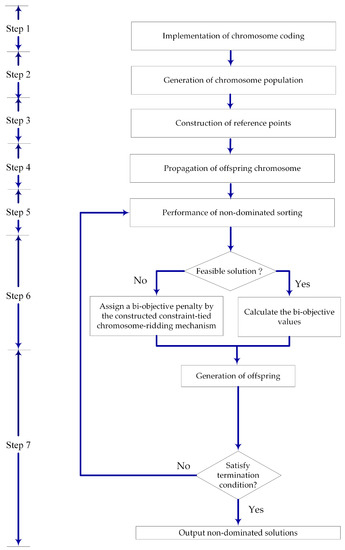
Figure 15.
Flowchart of tailored NSGA-III.
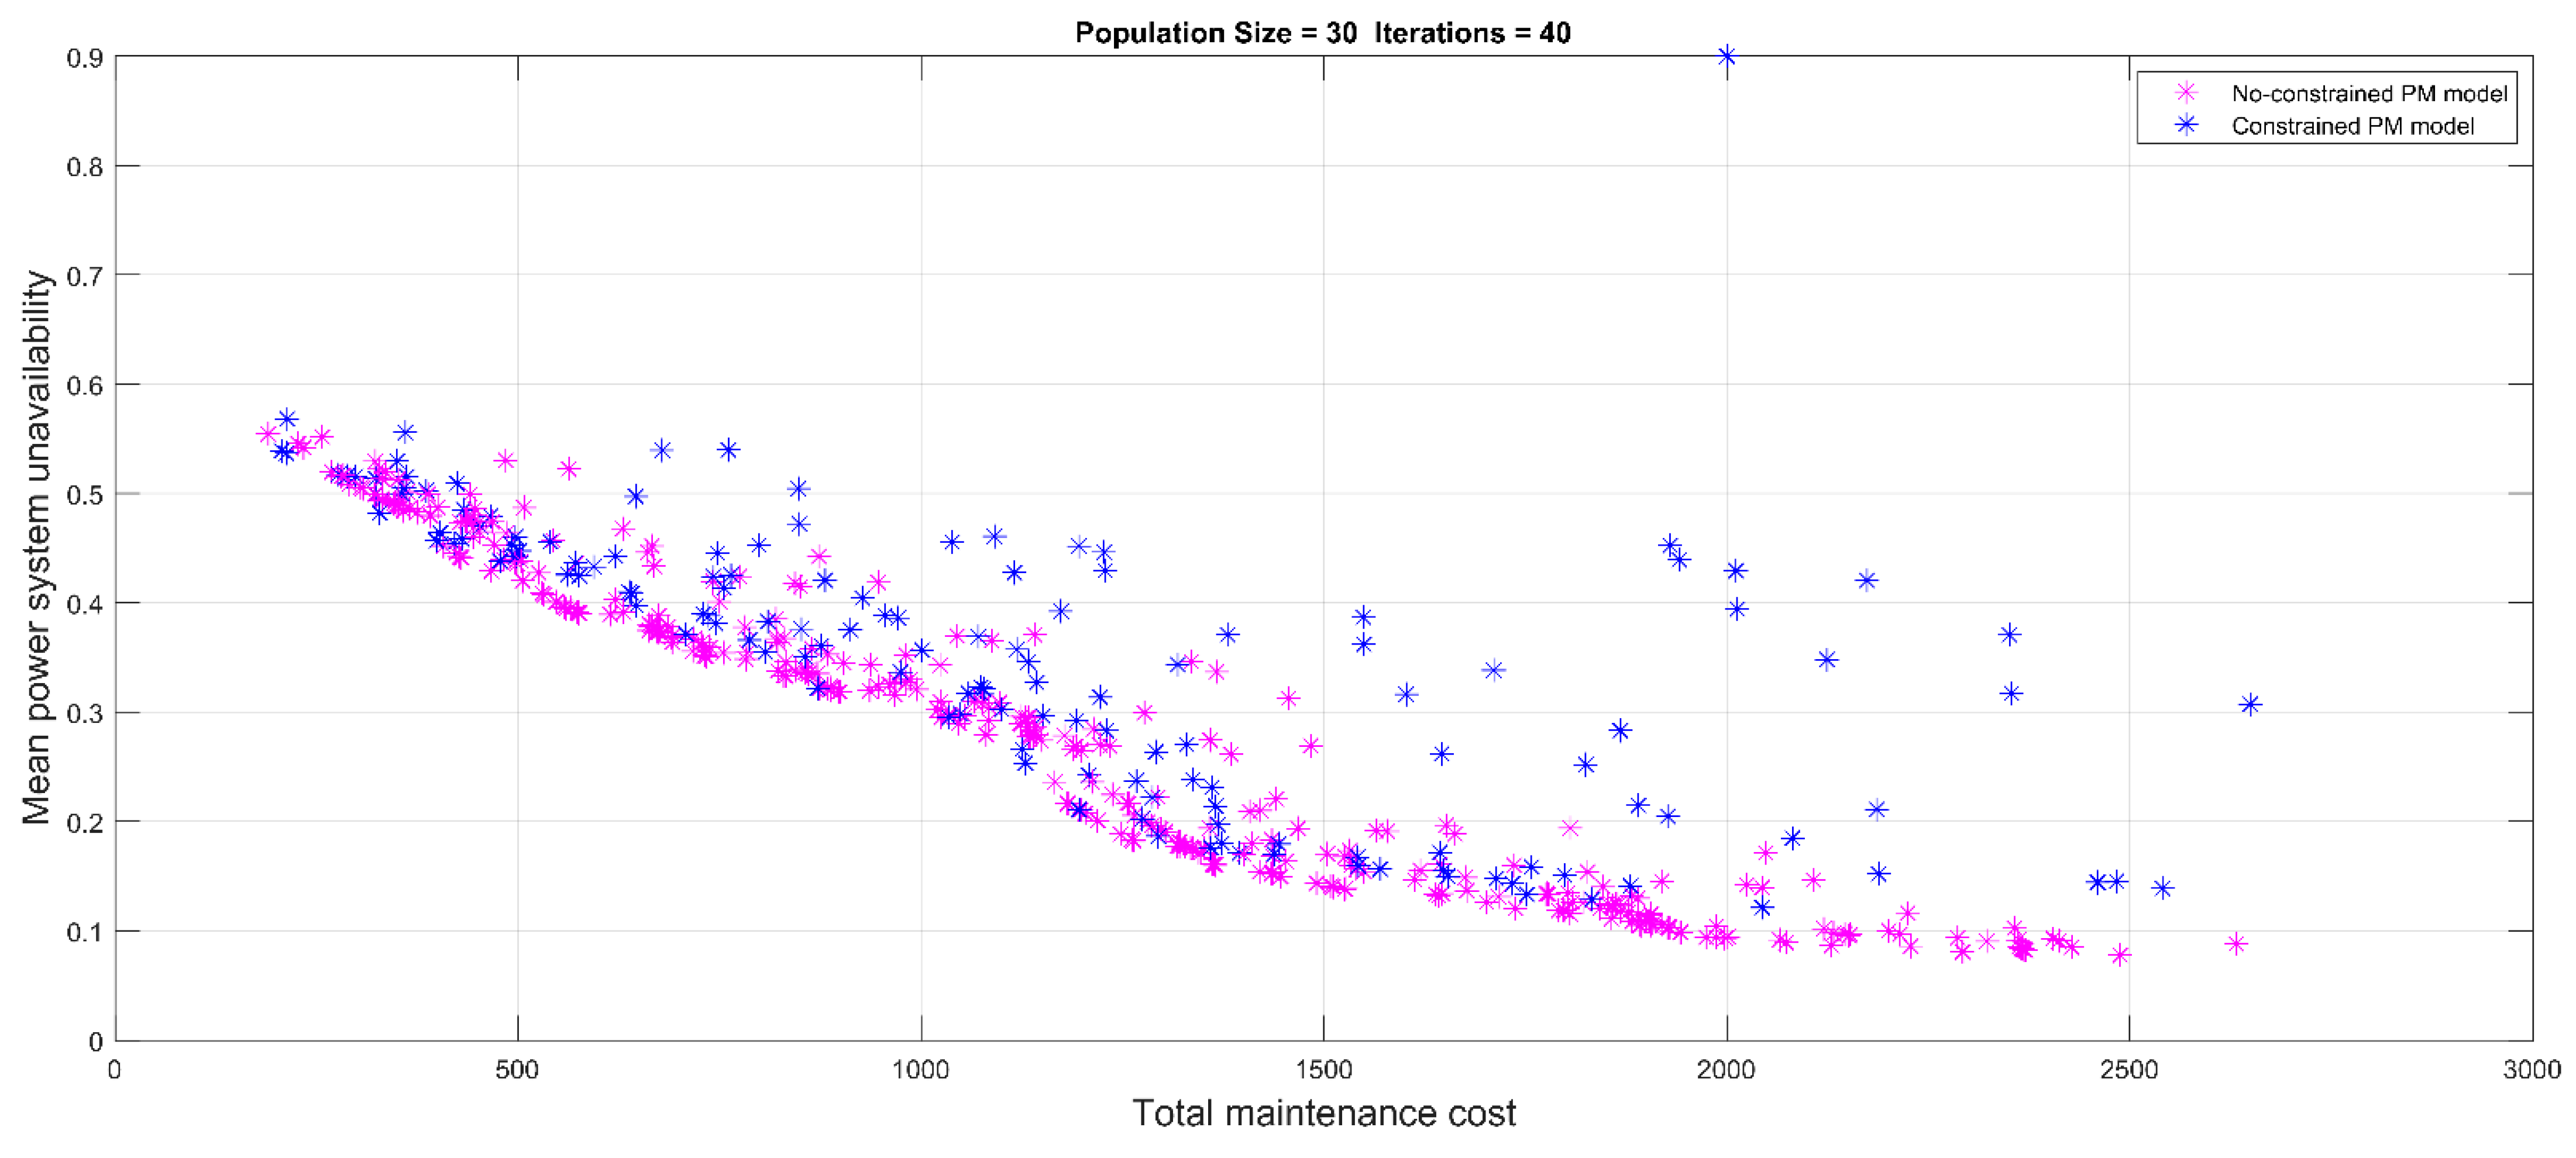
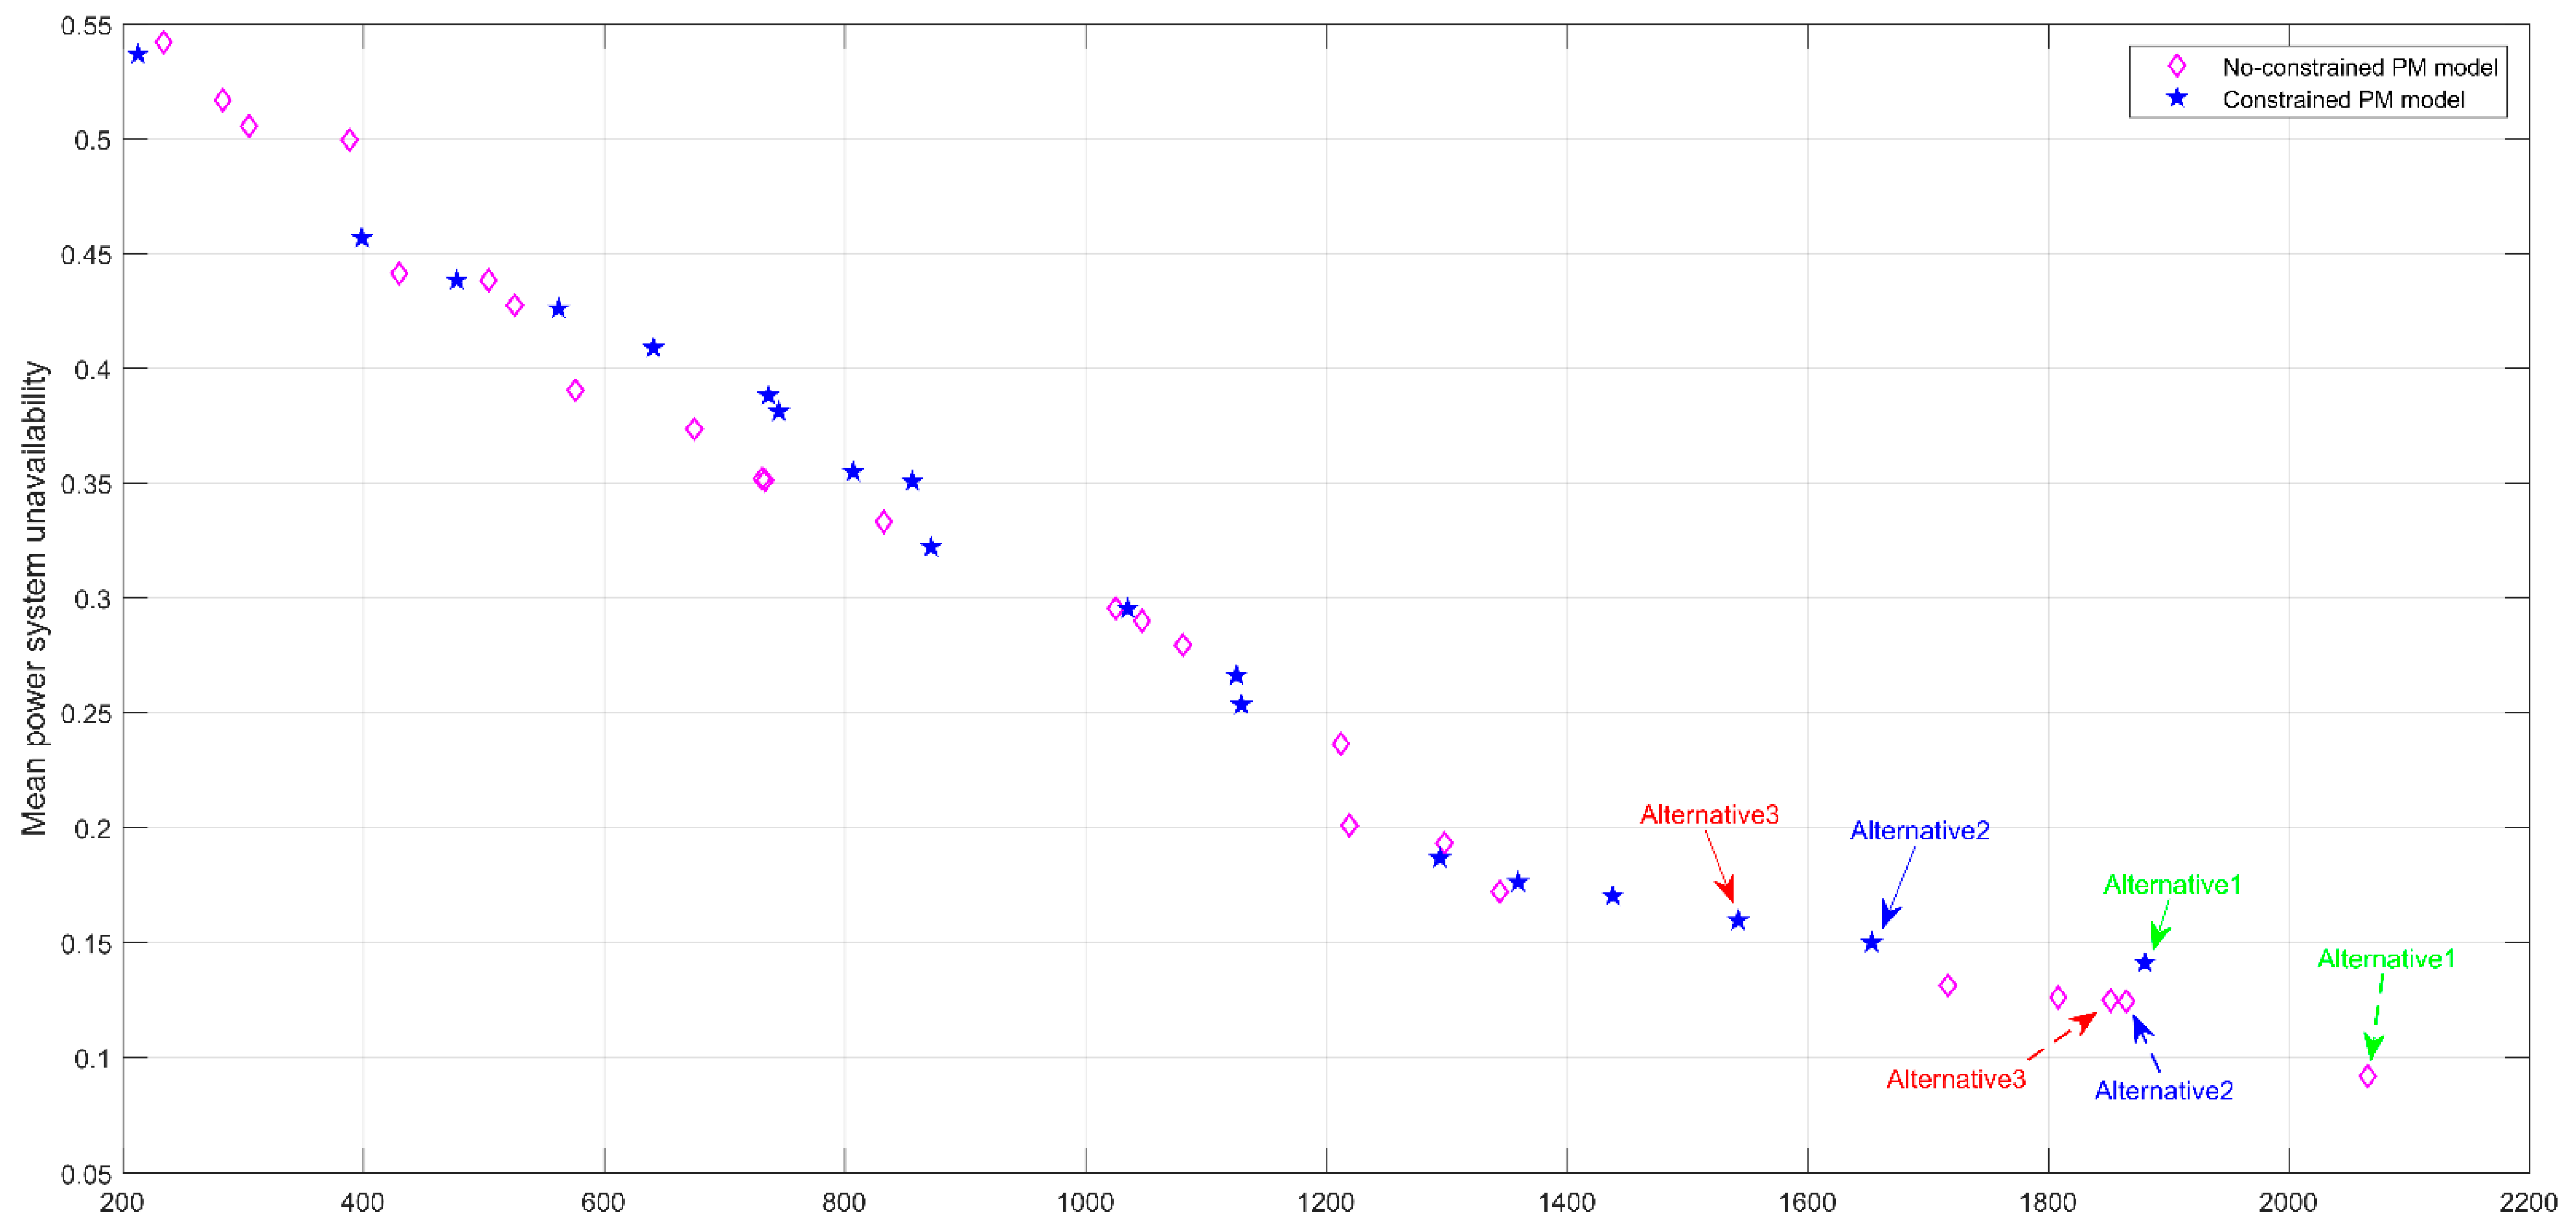
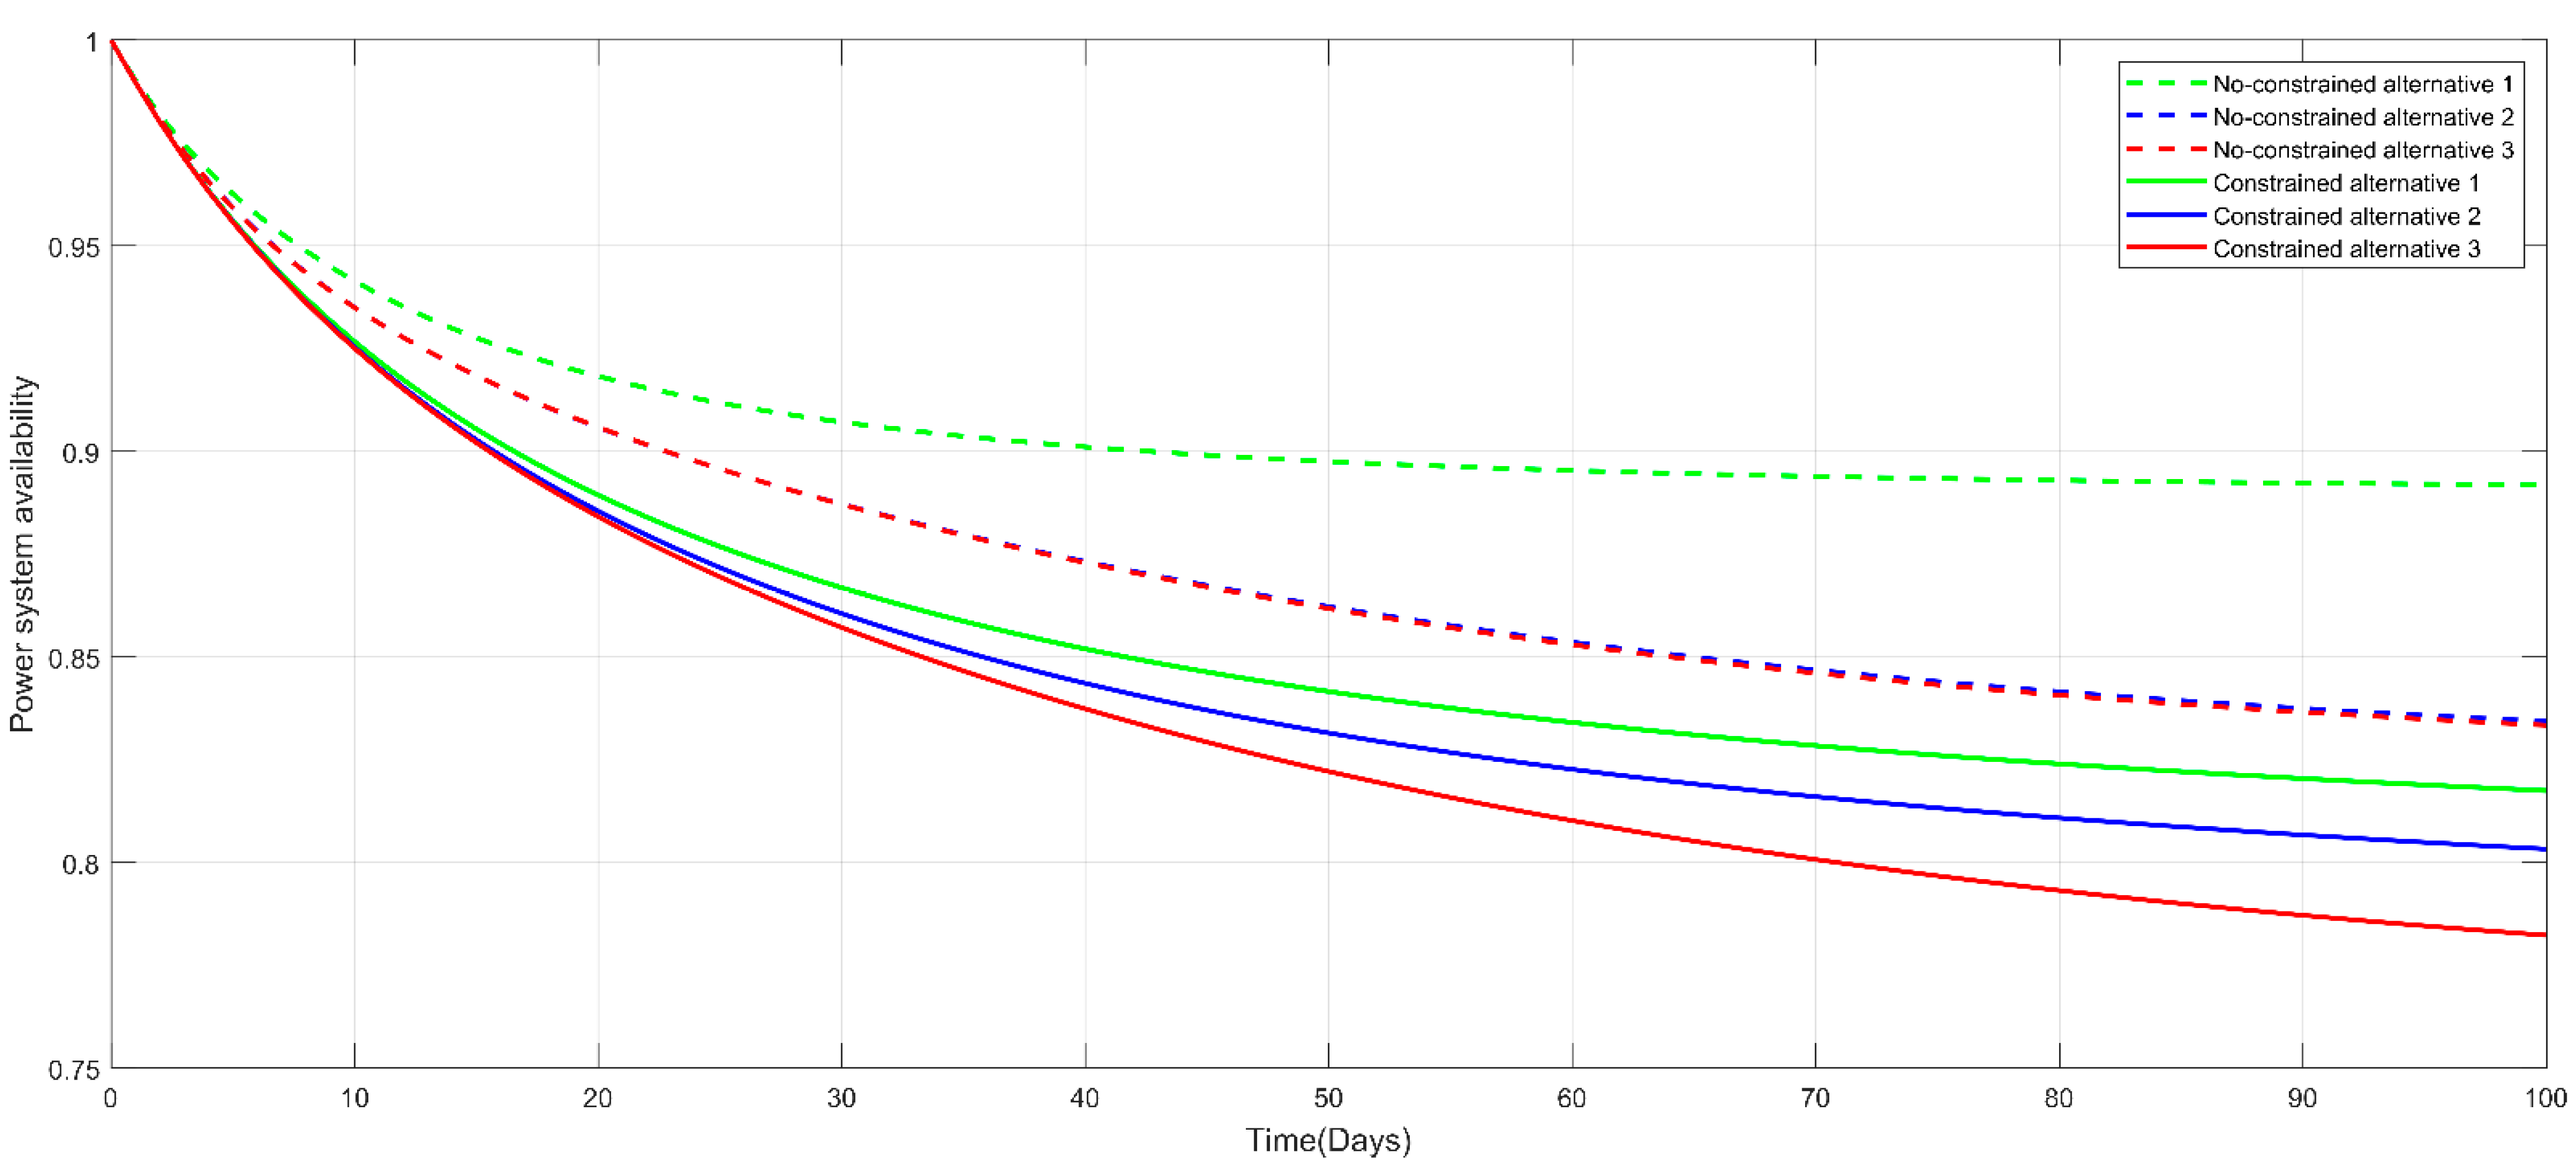
Figure 16 reveals the course of optimization of the non-dominated sets in each generation. In particular, their trajectories ideally approached the Pareto front. The approach of the Pareto front by both PM models with/without the constraint after the specialized NSGA-III optimization are shown in Figure 17, where the first three PM alternatives with the lower mean power system unavailability are indicated. Table 2 presents these three PM alternatives with the mean power system unavailability and total maintenance cost, where the constrained PM model generated a larger mean power system unavailability than the non-constrained model, in addition to a lower total maintenance cost. For illustration, considering the example of the first PM alternative, the minimum mean power system unavailability was 0.0918 with a total maintenance cost of 2066 for the non-constrained PM model, whereas the minimum mean power system unavailability was 0.1411 with a total maintenance cost of 1880 for the constrained model. Figure 18 presents the power system availability with respect to time for the indicated PM alternatives, in accordance with Table 2. This demonstrates the superiority of the unconstrained system availability (dashed lines) over the constrained system availability (solid lines). Figure 19 and Figure 20 present the first PM alternatives for both PM models in terms of transition diagrams. The figures indicate that more maintenance activities were conducted for the non-constrained PM model than for the constrained model; thus leading to a higher total maintenance cost than that of the constrained model. The constraint requirement is a maximum of one PM activity due to concerns over human reliability with respect to the application of the PM strategy [18]. For the constrained PM model, with a smart grid with an HPS that requires a mean power system unavailability of less than 0.15, two distinct PM alternatives met the requirement. By further restricting the total maintenance cost to less than 1700, the second PM alternative was selected to outperform the first PM alternative. In other cases surrounding a smart grid of electricity performance, such as the limitations of workforces and budgets, among other issues, the appropriate PM alternatives can be determined from 19 solutions based on the approached Pareto front obtained by the specialized NSGA-III. For the parameters, with respect to the illustrated smart grid with an HPS, Table 3 presents the transition intensity in the form of degradation rates, minimum repair rates, and the rates of the low–high/high–low power demand with an exponential time distribution for the coal, gas, and PV apparatuses. Table 4 presents the power performance in multiple states of the three apparatuses, the power demands are at a season high of 600 and season low of 500 for the main power system, while for redundant solar power system, the power demands are at a season high of 80 and season low of 40. The parameters shown in Table 3 and Table 4 related to the simulated smart grid system are in reference to Lisnianski et al. [33], with slight modifications. Table 5 presents the cost-related parameters.
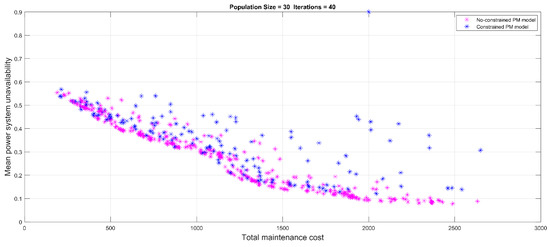
Figure 16.
Non-dominated solutions in the course of optimization.
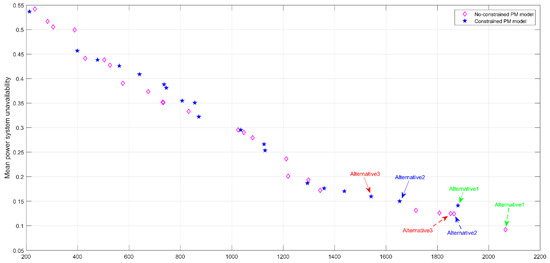
Figure 17.
Approached Pareto fronts.
Table 2.
Three PM alternatives with the mean power system unavailability and total maintenance cost.
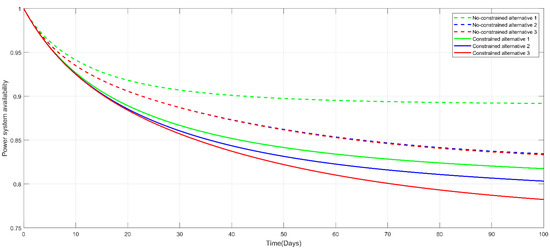
Figure 18.
Power system availability with time for the three alternatives.
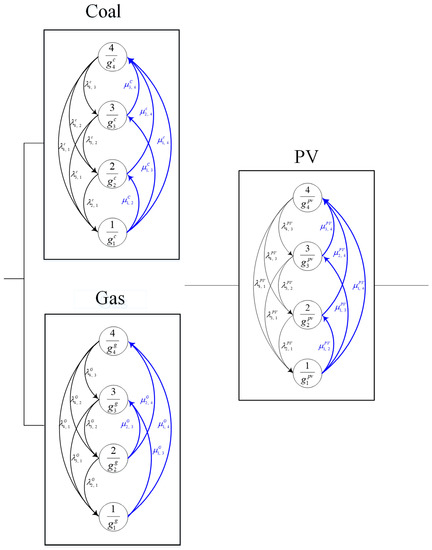
Figure 19.
Optimized PM strategy of the first alternative without constraint.
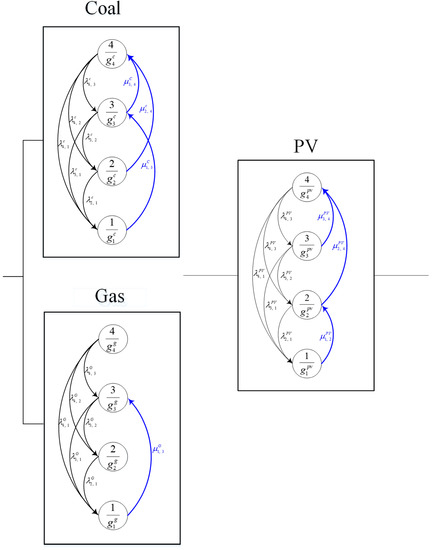
Figure 20.
Optimized PM strategy of the first alternative with constraint.
Table 3.
Transition intensities of assemblies with exponential time distributions.
Table 4.
Power performance of apparatuses.
Table 5.
Minimum repair costs and PM costs of apparatuses.
4. Results and Discussion
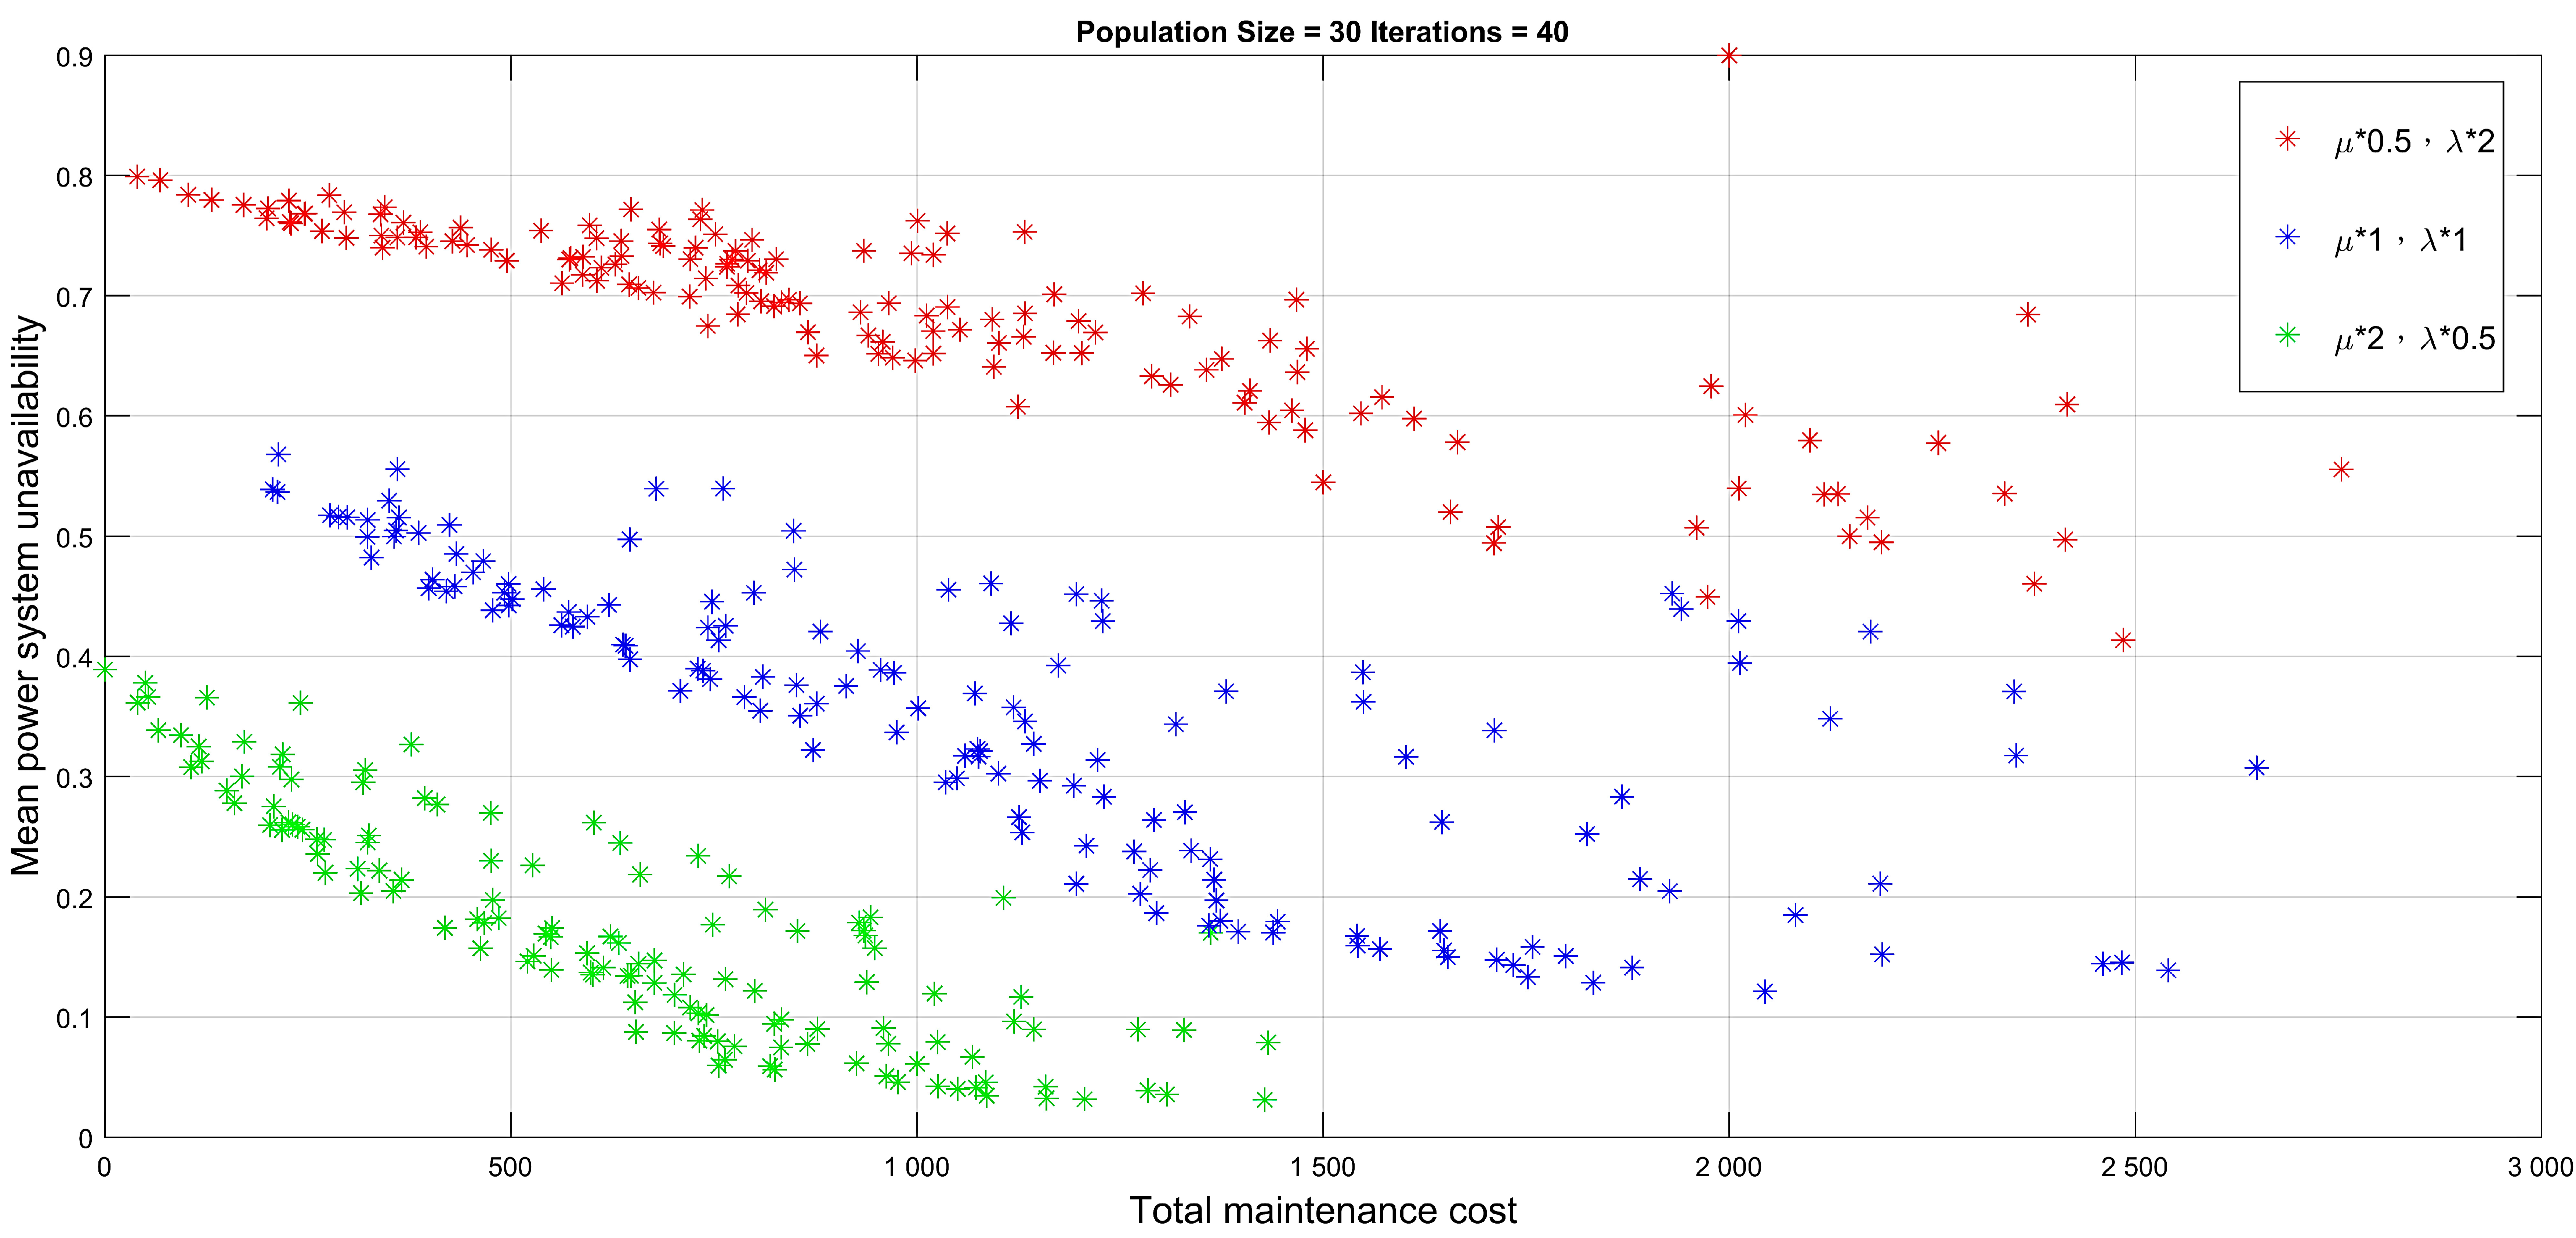
The constrained bi-objective PM model primarily addresses the issue of human reliability in implementing the PM strategy, wherein the constraint requirement is a maximum of one PM activity [18] for simple implementation. In this manner, the practicality of the PM strategy is enhanced. Accordingly, in this study, the PM model was further investigated using a design of experiments (DOE) scheme, as shown in Table 6. This was achieved to determine whether the impact of climate change emulated normal/extreme circumstances in terms of power demand (high and low), and the influence on the transition rates on the overall power-related efficiencies in the smart grid, in addition to the cost incurred. An extreme climate exhibited a higher power demand of 600 in low season (700 in high season) for the main power system compared to those of the normal climate in the DOE configuration. For the redundant system, an extreme climate exhibited a higher power demand of 50 in the low season and of 90 in the high season, with the higher transition rates of the low–high power demand and high–low power demand set as 3 and 1.2, respectively. Table 6 presents the six experimental conditions and their corresponding power efficiency measures after the optimization of the mean power system unavailability, mean power system availability, and total maintenance costs resulting from the application of the specialized NSGA-III. Accordingly, the non-dominated solutions graphed in the course of approaching the Pareto fronts are shown in Figure 21 and Figure 22 for climates under normal and extreme conditions, respectively, whereas Figure 23 presents the approached Pareto fronts in terms of the mean power system unavailability and total maintenance cost. The PM alternatives with the lowest mean power system unavailability under the six experimental conditions were indicated as summarized in Table 6. To further clarify the influence of climate change mainly due to greenhouse gas emissions on power-related efficiencies, using the pattern graphed in Figure 21, Figure 22 and Figure 23, we summarized the experimental observations below.
Table 6.
The DOE scheme and experimental results.
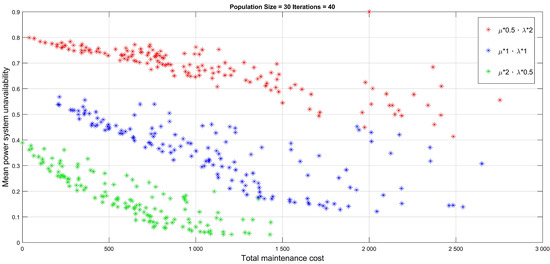
Figure 21.
Pareto front under normal climate conditions during the course of optimization.
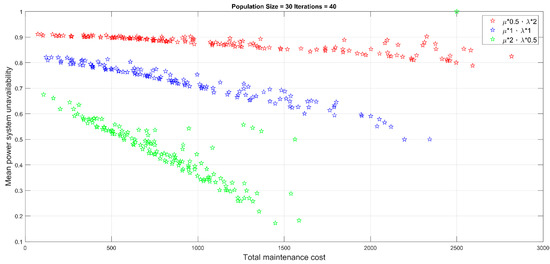
Figure 22.
Pareto front under extreme climate conditions during the course of optimization.
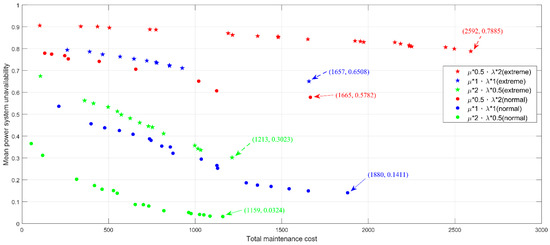
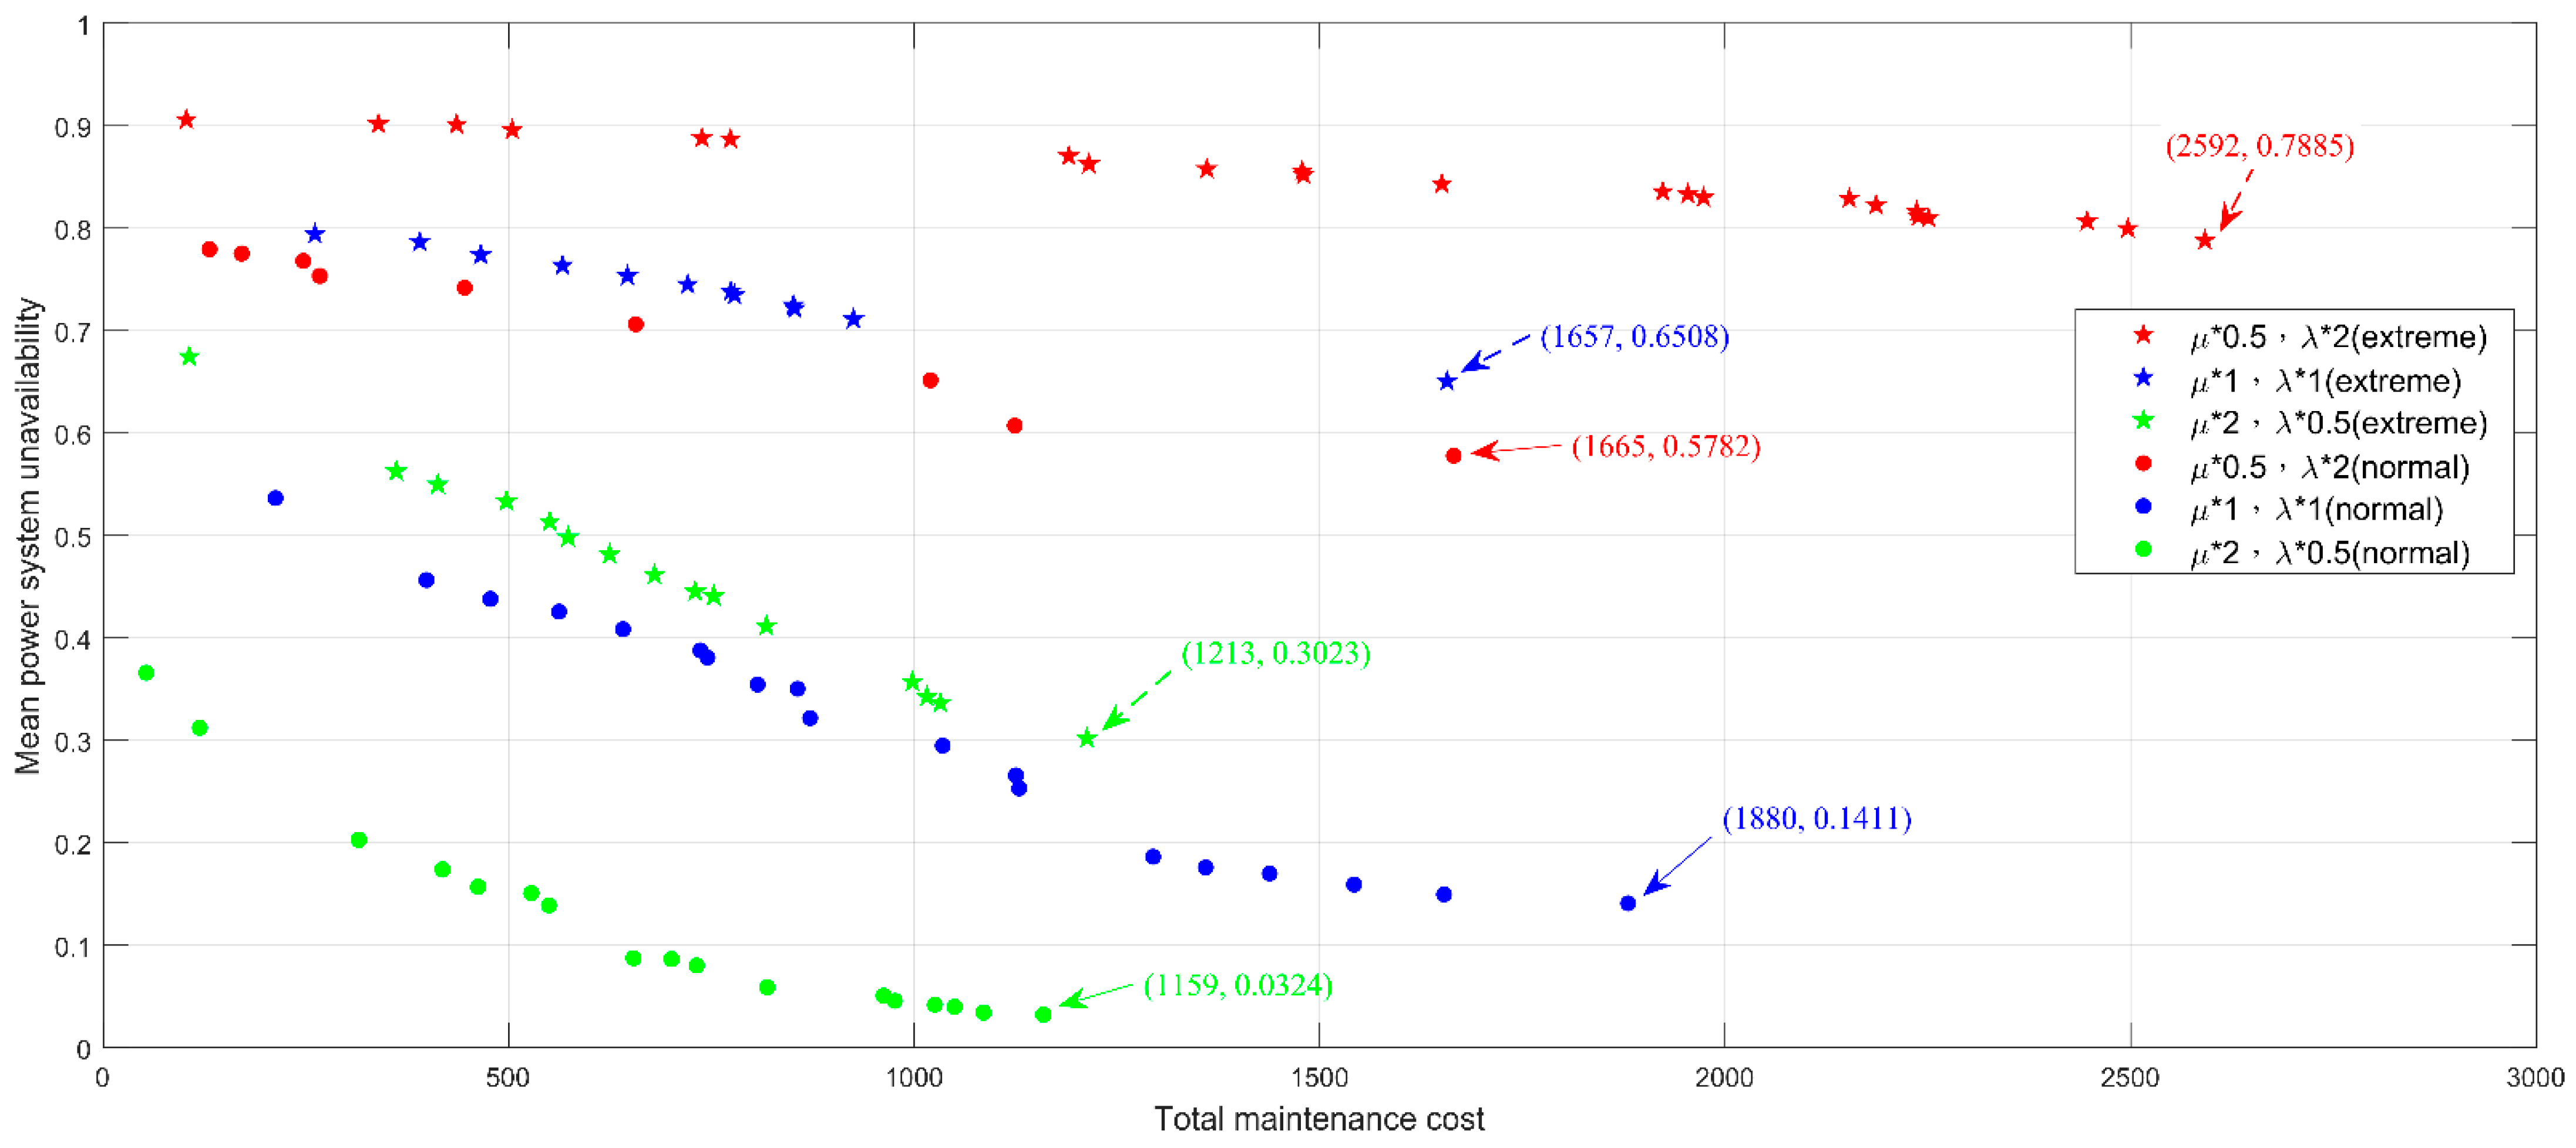
Figure 23.
Approached Pareto front under six experimental conditions.
- As can be seen from Figure 21 and Figure 22, a high degradation rate combined with low repair rates, (corresponding to 1 and 4 in Table 6 for the experiments with the normal and climates, respectively, and both colored red) led to a lower measured performance in terms of the mean power system unavailability and total PM cost. This is in contrast to the case of the inverse combination, which corresponds to 3 and 6, both colored green. The comparison results were mathematically and practically appropriate, given that a high degradation rate with a low repair rate decreases the reliability of the smart grid, whereas a lacking workforce and limited maintenance resources contribute to inefficient repair. In comparison, the alternative, with a low degradation combined with high repair rates, provided a robust and stable system that demonstrated a superior power measurement performance with a low PM cost in a smart grid.
- As shown in Figure 23, the simulated normal climate (corresponding to 1, 2, and 3 in Table 6, as indicated by circle dots) outperformed the simulated extreme climate (corresponding to 4, 5, and 6, as indicated by stellular dots) in terms of the power system unavailability and PM cost, regardless of the different combinations of degradation rates and repair rates. For example, given the combination of degradation rate and repair rate at 0.5 and 2 under normal climates, the power system unavailability and PM cost are determined at 0.0324 and 1159, which is lower than that of 0.3023 and 1213 under extreme climates. This highlights the extent to which climate change influences the power grid performance, and in turn, poses a safety risk to humans amidst hurricanes, flash floods, droughts, and extreme high temperatures, among other natural disasters. Moreover, these disasters presently occur at an abnormally high frequency. Hence, research has been conducted to curb green gas emissions; thus preventing the planet temperature from rising to 1.5 °C above the preindustrial level, which leads to most catastrophic disasters.
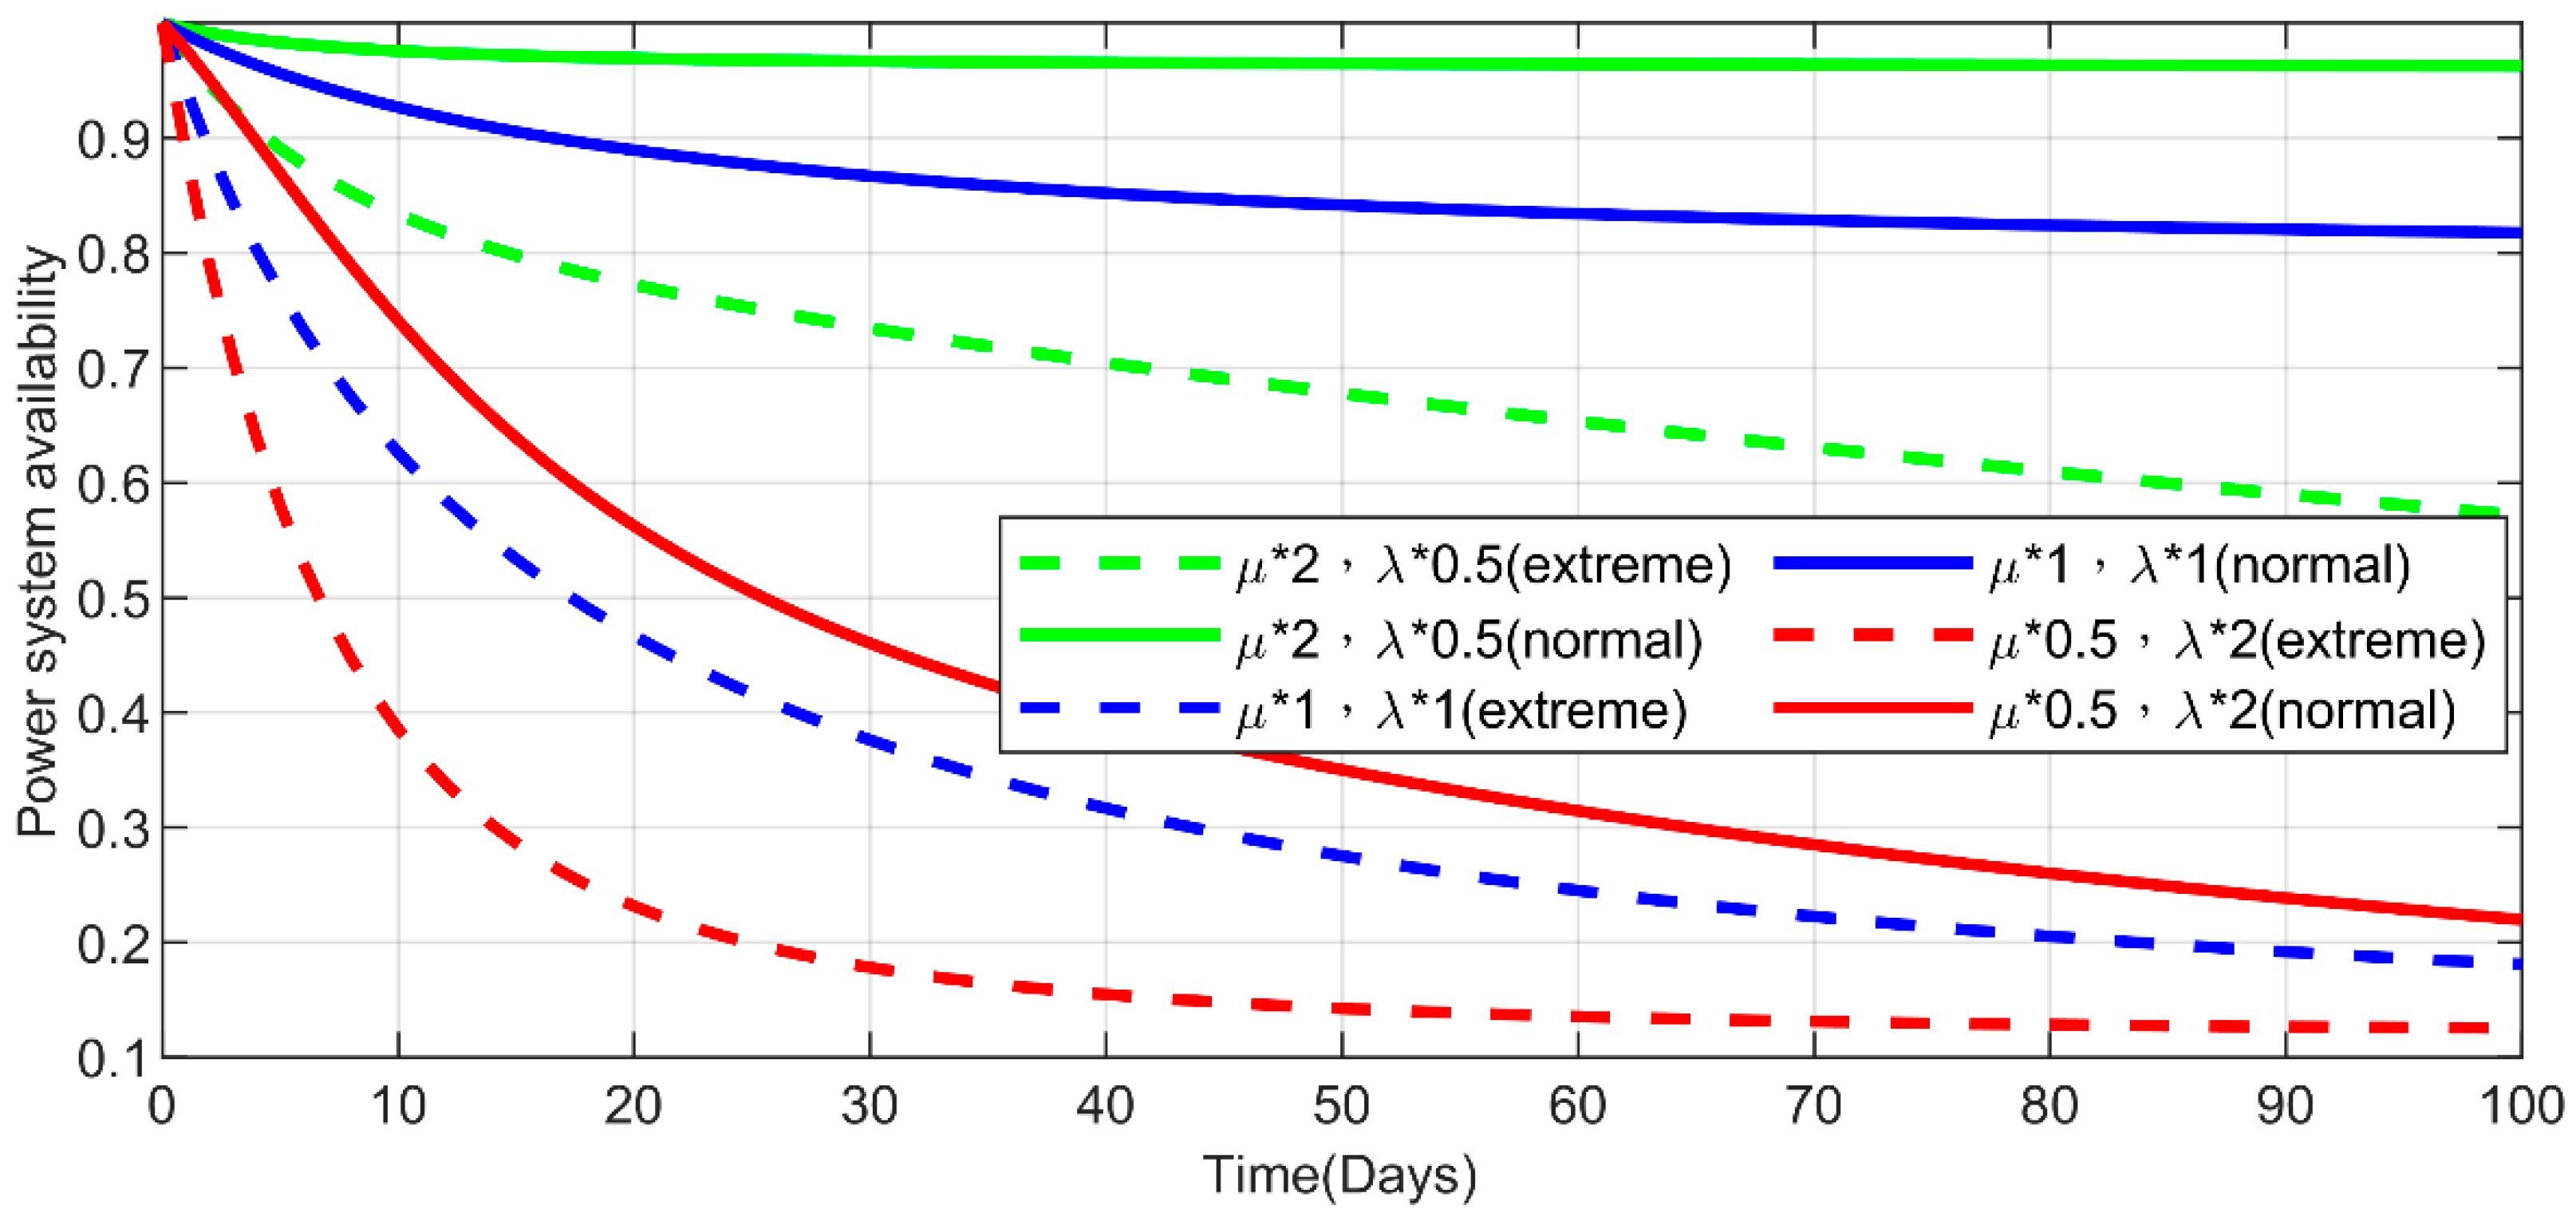
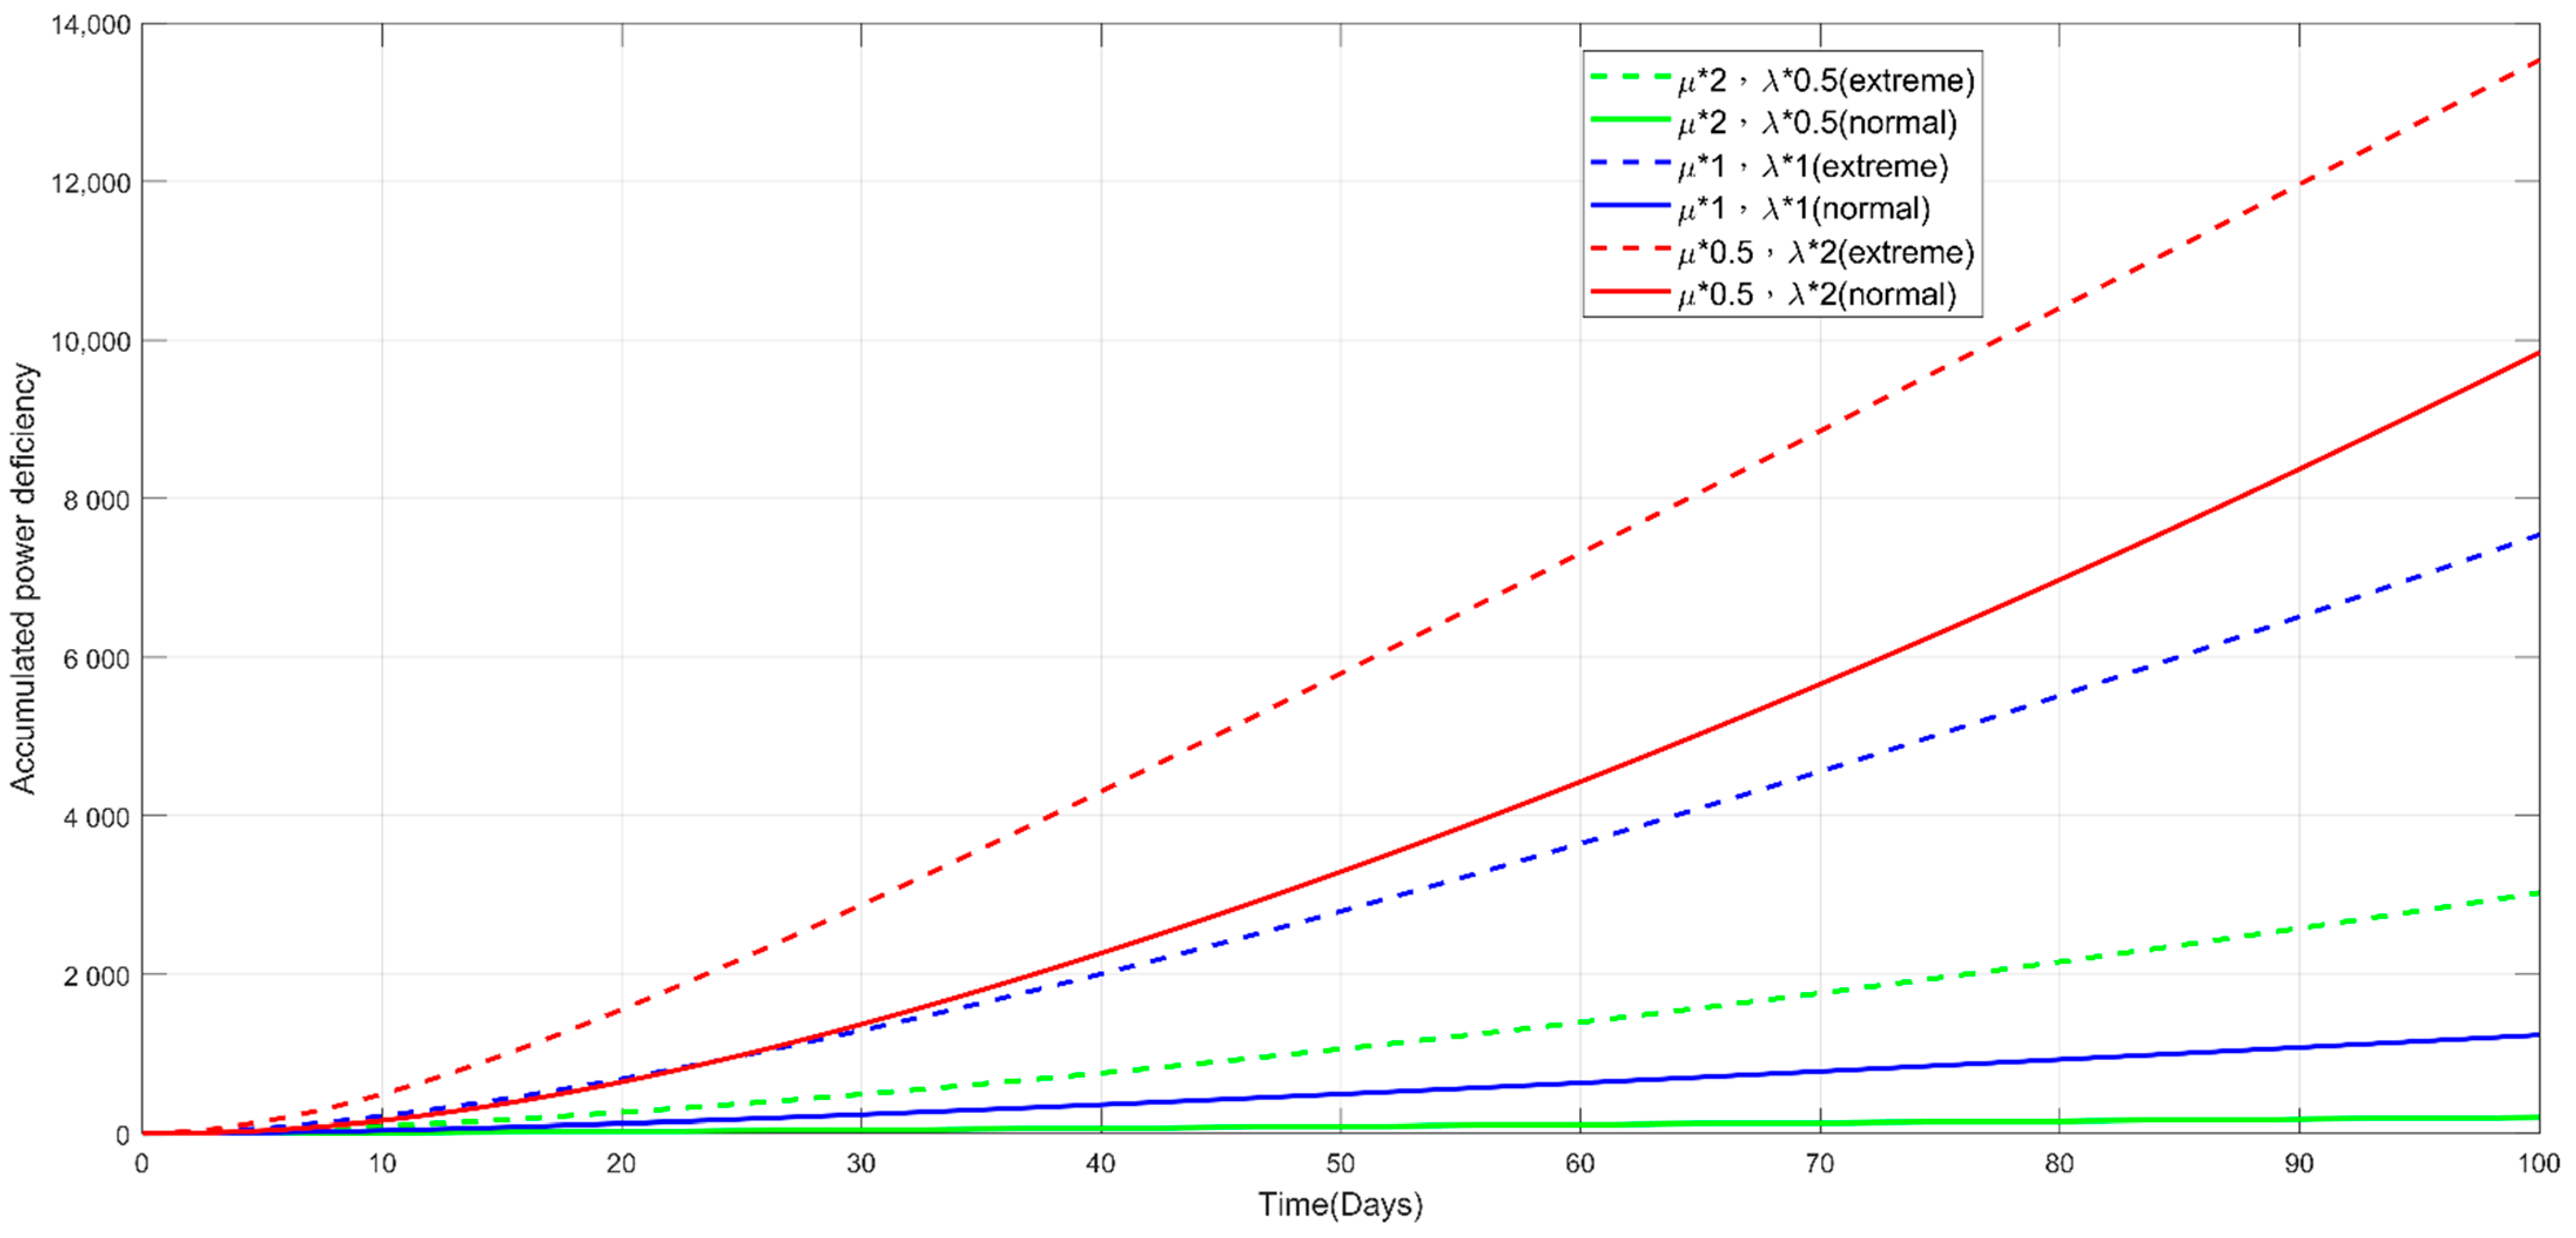
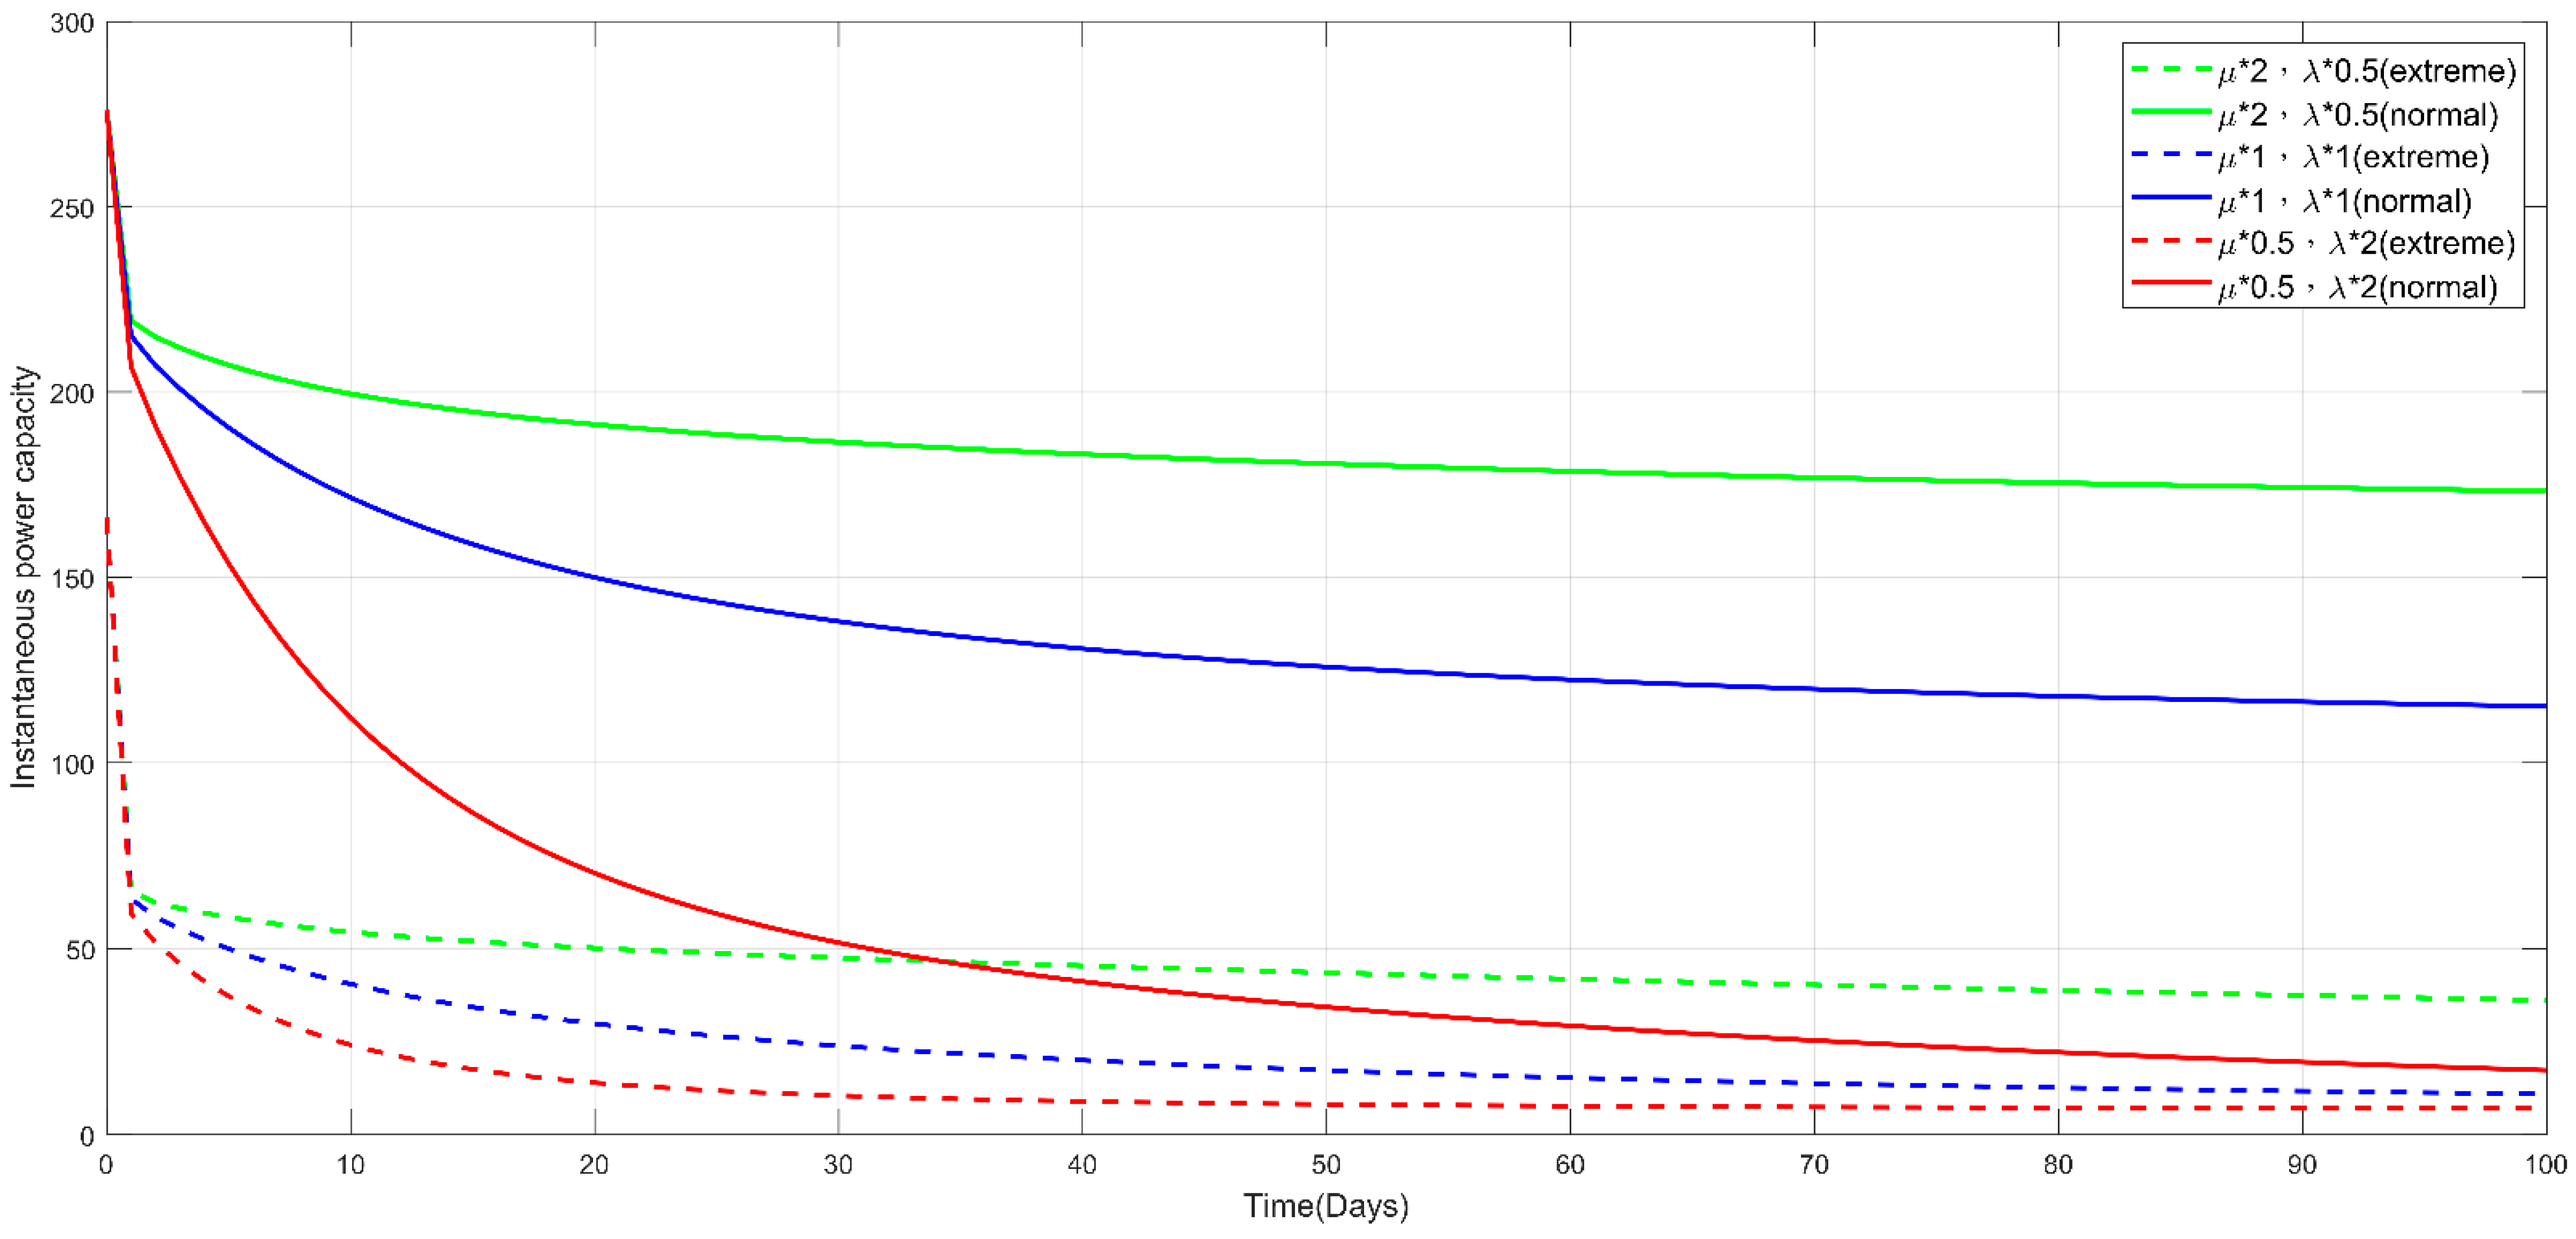
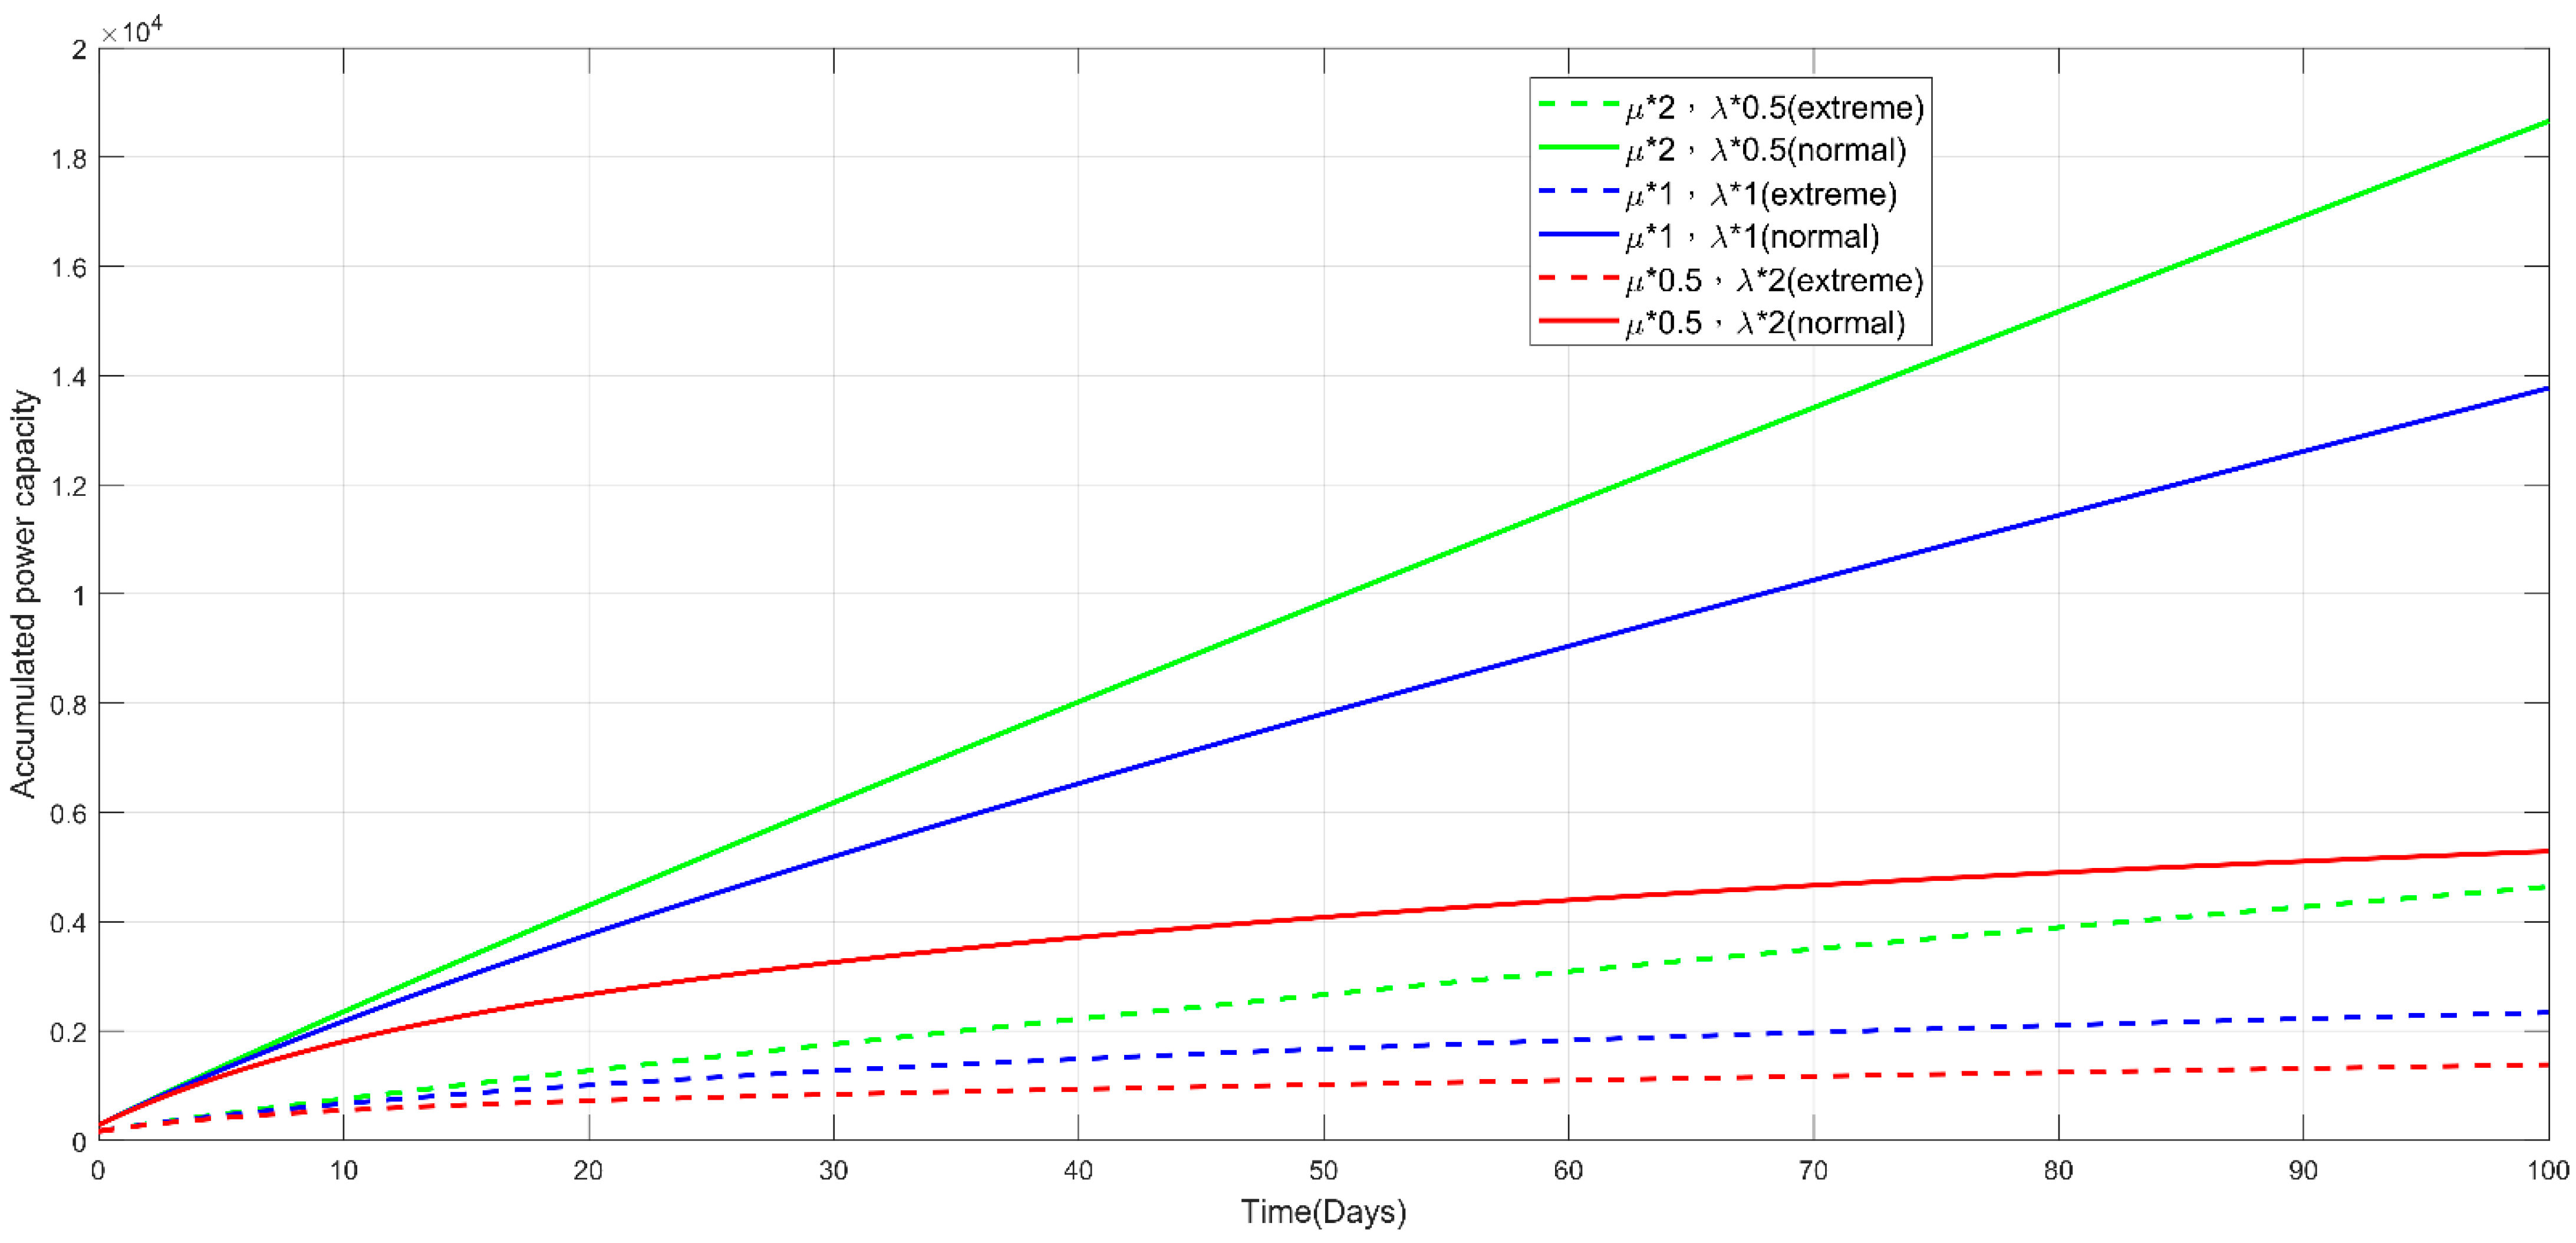
- Figure 24, Figure 25, Figure 26, Figure 27 and Figure 28 present the other power measures from different perspectives, namely, the power system availability, expected power deficiency, accumulated power deficiency, instantaneous power capacity, and accumulated power capacity. All present the same conclusion, as depicted in the second point, through differentiated diagrams reflecting the power-grid performances across various measures.
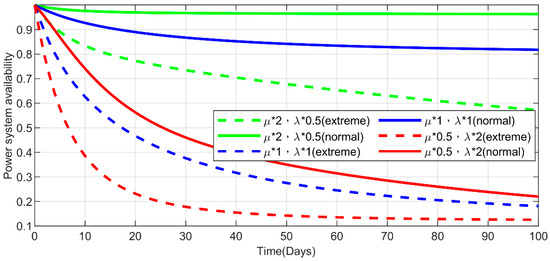 Figure 24. Power system availability under six experimental conditions.
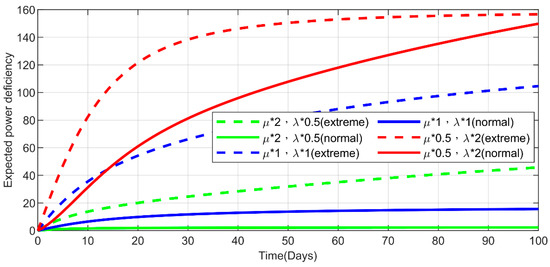 Figure 25. Expected power deficiency under six experimental conditions.
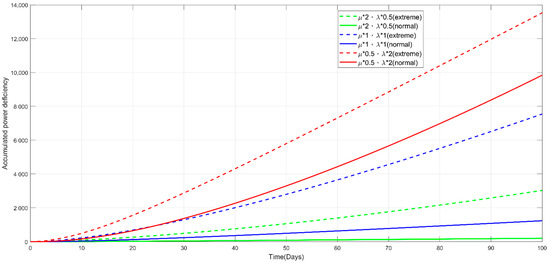 Figure 26. Accumulated power deficiency under six experimental conditions.
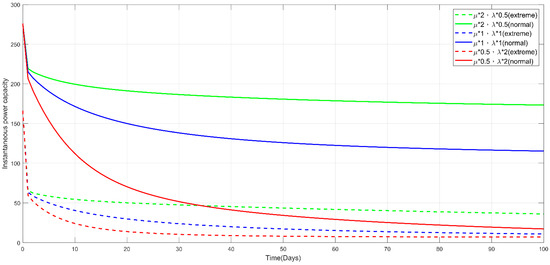 Figure 27. Instantaneous power capacity under six experimental conditions.
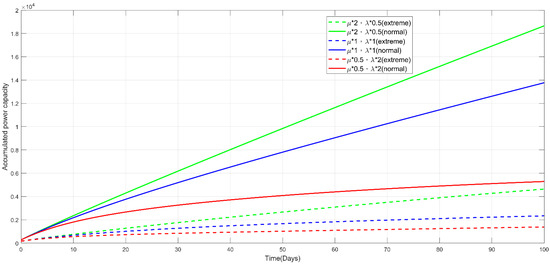 Figure 28. Accumulated power capacity of six experimental conditions.
5. Conclusions
This study aimed to establish the power grid measures in a generic smart grid from the reliability perspective using stochastic process in MSS reliability models. The proposed power grid measures account for the stochastic behavior of the power supply and power demand in parallel, which is more practical than the studies that only addressed the power supply in the green energy industry. Further, we formulated four distinct PM models for the generic smart grid that correspond to the specific simulated scenarios. Subsequently, we tailored NSGA-III to solve the established constrained bi-objective PM model. The constraint restricts a maximum of one maintenance activity in the degradation state to allow for a simple implementation of the PM strategy owing to the concern of human reliability. Finally, we schemed a DOE to simulate normal/extreme climate to conduct sensitivity analysis to provide further insight into the extent to which climate change influences all power-grid measures. The extreme climate led to power-grid performance degradation across all the measures. For the established bi-objective PM models, the no-constrained PM model obtained a lower mean power system unavailability of 0.0918 with higher PM cost of 2066 compared with the constrained PM model with mean power system unavailability of 0.1411 and PM cost of 2066. This phenomenon explains that the added constraint shrinks the feasible space for optimizing the PM model, and therefore leads to inferior solutions. In this study, we illustrated a generic smart grid with an HPS; however, the ramifications of this study lay the groundwork for the specific smart grid structures with appropriate modifications.
Author Contributions
Conceptualization, C.-H.W.; methodology, C.-H.W.; software, C.-H.H.; validation, C.-H.H. and D.-G.Y.; formal analysis, D.-G.Y.; investigation, D.-G.Y.; resources, D.-G.Y.; data curation, D.-G.Y.; writing—original draft preparation, C.-H.W.; writing—review and editing, C.-H.W. and C.-H.H.; visualization, D.-G.Y.; supervision, C.-H.W.; project administration, D.-G.Y. All authors have read and agreed to the published version of the manuscript.
Funding
This study was supported by the Ministry of Science and Technology of Taiwan [MOST 110-2221-E-606-016].
Institutional Review Board Statement
Not applicable.
Informed Consent Statement
Not applicable.
Data Availability Statement
Not applicable.
Conflicts of Interest
The funders had no role in the design of the study; in the collection, analyses, or interpretation of data; in the writing of the manuscript; or in the decision to publish the results.
References
- Lisnianski, A.; Elmakias, D.; Laredo, D.; Ben Haim, H. A multi-state Markov model for a short-term reliability analysis of a power generating unit. Reliab. Eng. Syst. Saf. 2012, 98, 1–6. [Google Scholar] [CrossRef]
- Howlader, A.M.; Izumi, Y.; Uehara, A.; Urasaki, N.; Senjyu, T.; Saber, A.Y. A robust H∞ controller based frequency control approach using the wind-battery coordination strategy in a small power system. Int. J. Electr. Power Energy Syst. 2014, 58, 190–198. [Google Scholar] [CrossRef]
- Pan, I.; Das, S. Kriging based surrogate modeling for fractional order control of microgrids. IEEE Trans. Smart Grid 2015, 6, 36–44. [Google Scholar] [CrossRef] [Green Version]
- Li, Z.; Xu, Y.; Fang, S.; Zheng, X.; Feng, X. Robust coordination of a hybrid AC/DC multi-energy ship microgrid with flexible voyage and thermal loads. IEEE Trans. Smart Grid 2020, 11, 2782–2793. [Google Scholar] [CrossRef]
- Hou, J.; Sun, J.; Hofmann, H.F. Mitigating power fluctuations in electric ship propulsion with hybrid energy storage system: Design and analysis. IEEE J. Ocean. Eng. 2018, 43, 93–107. [Google Scholar] [CrossRef]
- Conteh, F.; Takahashi, H.; Hemeida, A.; Krishnan, N.; Mikhaylov, A.; Senjyu, T. Analysis of hybrid grid-connected renewable power generation for sustainable electricity supply in Sierra Leone. Sustainability 2021, 13, 11435. [Google Scholar] [CrossRef]
- Shahzad, M.; Qadir, A.; Ullah, N.; Mahmood, Z.; Saad, N.M.; Ali, S.S. Optimization of on-grid hybrid renewable energy system: A case study on Azad Jammu and Kashmir. Sustainability 2022, 14, 5757. [Google Scholar] [CrossRef]
- Kharrich, M.; Kamel, S.; Hassan, M.H.; ElSayed, S.K.; Taha, I.B.M. An improved heap-based optimizer for optimal design of a hybrid microgrid considering reliability and availability constraints. Sustainability 2021, 13, 10419. [Google Scholar] [CrossRef]
- Zahraoui, Y.; Alhamrouni, I.; Mekhilef, S.; Basir Khan, M.R.; Seyedmahmoudian, M.; Stojcevski, A.; Horan, B. Energy management system in microgrids: A comprehensive review. Sustainability 2021, 13, 10492. [Google Scholar] [CrossRef]
- Choi, Y.-J.; Oh, B.-C.; Acquah, M.A.; Kim, D.-M.; Kim, S.-Y. Optimal operation of a hybrid power system as an island microgrid insouth-Korea. Sustainability 2021, 13, 5022. [Google Scholar] [CrossRef]
- Shang, C.; Srinivasan, D.; Reindl, T. Economic and environmental generation and voyage scheduling of all-electric ships. IEEE Trans. Power Syst. 2016, 31, 4087–4096. [Google Scholar] [CrossRef]
- Boveri, A.; Silvestro, F.; Molinas, M.; Skjong, E. Optimal sizing of energy storage systems for shipboard applications. IEEE Trans. Energy Convers. 2019, 34, 801–811. [Google Scholar] [CrossRef] [Green Version]
- Fang, S.; Xu, Y.; Li, Z.; Zhao, T.; Wang, H. Two-step multi-objective management of hybrid energy storage system in all-electric ship microgrids. IEEE Trans. Veh. Technol. 2019, 68, 3361–3373. [Google Scholar] [CrossRef]
- Wang, X.; Shipurkar, U.; Haseltalab, A.; Polinder, H.; Claeys, F.; Negenborn, R.R. Sizing and control of a hybrid ship propulsion system using multi-objective double-layer optimization. IEEE Access 2021, 9, 72587–72601. [Google Scholar] [CrossRef]
- Bao, M.; Ding, Y.; Singh, C.; Shao, C. A multi-state model for reliability assessment of integrated gas and power systems utilizing universal generating function techniques. IEEE Trans. Smart Grid 2019, 10, 6271–6283. [Google Scholar] [CrossRef]
- Karngala, A.K.; Singh, C. Reliability assessment framework for the distribution system including distributed energy resources. IEEE Trans. Sustain. Energy 2021, 12, 1539–1548. [Google Scholar] [CrossRef]
- Shadmand, M.B.; Balog, R.S. Multi-objective optimization and design of Photovoltaic-wind hybrid system for community Smart DC microgrid. IEEE Trans. Smart Grid 2014, 5, 2635–2643. [Google Scholar] [CrossRef]
- Huang, C.H.; Wang, C.; Chen, G. Multiobjective multistate system preventive maintenance model with human reliability. Int. J. Aerosp. Eng. 2021, 2021, 6623810. [Google Scholar] [CrossRef]
- Chen, G.L.; Wang, C.; Huang, C. Improved availability index for repairable fuzzy multi-state systems. IEEE Access 2020, 8, 212927–212938. [Google Scholar] [CrossRef]
- Caballé, N.C.; Castro, I.T.; Pérez, C.J.; Lanza-Gutiérrez, J.M. A condition-based maintenance of a dependent degradation-threshold-shock model in a system with multiple degradation processes. Reliab. Eng. Syst. Saf. 2015, 134, 98–109. [Google Scholar] [CrossRef]
- Castro, I.T.; Caballé, N.C.; Pérez, C.J. A condition-based maintenance for a system subject to multiple degradation processes and external shocks. Int. J. Syst. Sci. 2015, 46, 1692–1704. [Google Scholar] [CrossRef]
- Zhai, Q.; Ye, Z.; Yang, J.; Zhao, Y. Measurement errors in degradation-based burn-in. Reliab. Eng. Syst. Saf. 2016, 150, 126–135. [Google Scholar] [CrossRef]
- Manoharan, M.; Nair, V.G. Evaluation of system performance measures of multi state degraded system with minimal repair. Reliab. Theory Appl. 2017, 12, 76–83. [Google Scholar]
- Bhesdadiya, R.H.; Trivedi, I.N.; Jangir, P.; Jangir, N.; Kumar, A. An NSGA-III algorithm for solving multi-objective economic/environmental dispatch problem. Cogent Eng. 2016, 3, 1269383. [Google Scholar] [CrossRef]
- Guo, C.; Ye, C.; Ding, Y.; Lin, Z.; Wang, P. Risk-based many-objective configuration of power system fault current limiters utilising NSGA-III. IET Gener. Transm. Distrib. 2020, 14, 5646–5654. [Google Scholar] [CrossRef]
- Yang, X.; Zhang, Y. Optimal transmission line assignment considering reliabilities and assignment cost in the multi-state network. IEEE Access 2020, 8, 105690–105700. [Google Scholar] [CrossRef]
- Alizadeh Afrouzy, Z.; Paydar, M.M.; Nasseri, S.H.; Mahdavi, I. A meta-heuristic approach supported by NSGA-II for the design and plan of supply chain networks considering new product development. J. Ind. Eng. Int. 2018, 14, 95–109. [Google Scholar] [CrossRef] [Green Version]
- Behmanesh, R.; Rahimi, I.; Gandomi, A.H. Evolutionary many-objective algorithms for combinatorial optimization problems: A comparative study. Arch. Comput. Methods Eng. 2021, 28, 673–688. [Google Scholar] [CrossRef]
- Li, Y.; Kou, Y.; Li, Z. An improved nondominated sorting genetic algorithm III method for solving multiobjective weapon-target assignment part I: The value of fighter combat. Int. J. Aerosp. Eng. 2018, 2018, 8302324. [Google Scholar] [CrossRef] [Green Version]
- Ni, X.; Dong, Z.; Xie, W.; Jia, W.; Duan, C.; Yao, H. Research on the multi-objective cooperative competition mechanism of Jinsha river downstream cascade reservoirs during the flood season based on optimized NSGA-III. Water 2019, 11, 849. [Google Scholar] [CrossRef] [Green Version]
- Bi, X.; Wang, C. An improved NSGA-III algorithm based on objective space decomposition for many-objective optimization. Soft Comput. 2017, 21, 4269–4296. [Google Scholar] [CrossRef]
- Liu, Q.; Liu, X.; Wu, J.; Li, Y. An improved NSGA-III algorithm using genetic K-means clustering algorithm. IEEE Access 2019, 7, 185239–185249. [Google Scholar] [CrossRef]
- Lisnianski, A.; Fennkel, I.; Ding, Y. Multi-State System Reliability Analysis and Optimization for Engineers and Industrial Managers; Springer: Berlin/Heidelberg, Germany, 2010; pp. 273–281. [Google Scholar]
- Zheng, J.H.; Wu, C.Q.; Huang, J.; Liu, Y.; Wu, Q.H. Multi-objective optimization for coordinated day-ahead scheduling problem of integrated electricity-natural gas system with microgrid. IEEE Access 2020, 8, 86788–86796. [Google Scholar] [CrossRef]
- Wang, C.H.; Tsai, S.W. Optimizing bi-objective imperfect preventive maintenance model for series-parallel system using established hybrid genetic algorithm. J. Intell. Manuf. 2014, 25, 603–616. [Google Scholar] [CrossRef]
- Montgomery, D.C. Design and Analysis of Experiments, 6th ed.; Wiley: New York, NY, USA, 2005. [Google Scholar]


Publisher’s Note: MDPI stays neutral with regard to jurisdictional claims in published maps and institutional affiliations. |
© 2022 by the authors. Licensee MDPI, Basel, Switzerland. This article is an open access article distributed under the terms and conditions of the Creative Commons Attribution (CC BY) license (https://creativecommons.org/licenses/by/4.0/).