Article

Influence of Steel Fibers on the Interfacial Shear Strength of Ternary Blend Geopolymer Concrete Composite

by
Mohan Gopika
1,*,
Namasivayam Ganesan
1,
Pookattu Vattarambath Indira
1,
Veerappan Sathish Kumar
1,2,*,
Gunasekaran Murali
3 and
Nikolai Ivanovich Vatin
3
1
Department of Civil Engineering, National Institute of Technology Calicut, Kozhikode 673601, India
2
Faculty of Civil Engineering, Architecture and Geodesy, University of Split, 21000 Split, Croatia
3
Peter the Great St. Petersburg Polytechnic University, 195251 St. Petersburg, Russia
*
Authors to whom correspondence should be addressed.
Sustainability 2022, 14(13), 7724; https://doi.org/10.3390/su14137724
Submission received: 12 May 2022 / Revised: 17 June 2022 / Accepted: 21 June 2022 / Published: 24 June 2022

Abstract

:
Sustainable development is a major issue confronting society today. Cement, a major constituent of concrete, is a key component of any infrastructure development. The major drawback of cement production is that it involves the emission of CO2, the predominant greenhouse gas causing global warming. The development of geopolymers has resulted in a decrease in cement production, as well as a reduction in CO2 emissions. During mass concrete production in the construction of very large structures, interfaces/joints are formed, which are potential failure sites of crack formation. Concrete may interface with other concrete of different strengths, or other construction materials, such as steel. To ensure the monolithic behavior of composite concrete structures, bond strength at the interface should be established. The monolithic behavior can be ensured by the usage of shear ties across the interface. However, an increase in the number of shear ties at the interface may reduce the construction efficiency. The present study aims to determine the interfacial shear strength of geopolymer concrete as a substrate, and high-strength concrete as an overlay, by adding 0.50%, 0.75%, and 1% crimped steel fibers, and two and three shear ties, at the interface of push-off specimens. It was found that three shear ties at the interface can be replaced by two shear ties and 0.75% crimped steel fibers. In addition, a method was proposed to predict the interface shear strength of the concrete composite, which was found to be comparable to the test results.

1. Introduction

The need for infrastructure development rises in lockstep with the world’s population expansion. This has a significant impact on the demand for cement, the main constituent in concrete, and the most extensively used construction material in the world [1]. However, an enormous amount of natural resources, such as limestone, fossil fuels, electricity, and natural gas is required for cement production, which involves high temperatures, resulting in even more significant carbon dioxide (CO2) emissions into the atmosphere [2]. The global cement industry emits over 1.65 billion tonnes of greenhouse gases annually, majorly contributing to global warming [3]. According to reports, one tonne of Portland cement (PC) releases about one tonne of CO2 into the environment during manufacture [4,5]. The cement industry accounts for 5–8% of global CO2 emissions [6]. To reduce CO2 emissions from this industry, a technology shift is required. Geopolymer binders have been proven to be environmentally friendly building materials capable of completely replacing ordinary Portland cement (OPC) in concrete. Many industrial by-product materials, including fly ash (FA), ground-granulated blast furnace slag (GGBS), palm oil fuel ash, rice husk ash, and mining wastes, can be used in geopolymer technology. As a recent development in geopolymer concrete (GPC), numerical modeling and cross-validation techniques were used to predict the design criteria of geopolymer composites [7,8].
Ternary blend geopolymer concrete (TGPC) is a recent development of GPC in which three different industrial by-products are used as a binder to optimize the local waste [9]. The effect of the curing method on the compressive strength of TGPC using FA, GGBS, and metakaolin as source materials was evaluated, and it was found that the addition of GGBS beyond 25% decreased the compressive strength [10]. The incorporation of hybrid fibers into TGPC was studied previously, and it was stated that the mechanical and durability properties were significantly improved due to the densely packed concrete structure [11,12]. The flexural and shear strengths of TGPC beams were investigated, and it was reported that adding fibers in mono and hybrid forms improved the ductility properties, and altered the failure mode from shear to flexure [13,14,15]. The structural behavior of hybrid fiber-reinforced TGPC beam-column joints were reported, and it was concluded that TGPC is a superior alternative to conventional cement concrete. Adding fibers into a hybrid form can help the structure withstand unforeseen conditions, such as seismic and wind loads [16]. All these experimental investigations were limited to the mechanical and durability properties of fiber-reinforced TGPC. Studies on direct shear and the effect of interfacial bonding on the fiber-reinforced TGPC are yet to be conducted.
Composite concrete units often cover precast constructions, such as bridge deck overlay, or in repairing and retrofitting existing concrete elements in buildings and bridges, bearing zones in precast girders, corbels, and horizontal construction joints in walls [17]. An interface between two layers of the concrete cast at different times is inevitable for concrete composite units [18]. Unfortunately, these joints or interfaces represent potential failure sites of crack formation, which leads to weakening mechanical strength [19]. The interface bond strength between concrete layers cast at different ages is essential to ensure the monolithic behavior of reinforced concrete composite members. The design codes account for several factors, such as surface preparation method, concrete compressive strength, and reinforcement crossing the interface that affects the shear strength [20]. However, these design codes ignore the effect of differential shrinkage of the substrate and overlay concrete. Later studies proved that differential shrinkage significantly impacts the bond strength of concrete layers [21]. The interface shear strength between ultra-high-performance concrete (UHPC) and normal strength concrete (NSC) was tested with varying interface types (i.e., bubble groove interface, flat surface interface, and a water jet surface interface) and casting sequences. It was found that NSC is the factor that determined the shear performance between the interfaces of UHPC and NSC [22]. An effective joint between NSC substrate and UHPC overlay was obtained with a water jet surface interface and 10 mm bubble groove interface. Kovach et al. [23] conducted a study to find the horizontal shear capacity of composite concrete beams without interface ties, and found that the interface roughness had a pronounced effect on the horizontal shear capacity of the composite section. There was also differential shrinkage, which caused premature cracking when there was a delay between the concrete slab placement and the precast web. The interface shear strength for normal self-compacting concrete (SCC) and self-compacting geopolymer concrete (SCGC) was compared by varying interface concrete age, monolithic behavior, cold joint, and cast-in-situ, with the precast condition. It was observed that the bonding of SCGC to old concrete was superior to normal SCC when shear reinforcement was provided across the interface [24]. Horizontal shear and interface slip characteristics of composite decks with precast concrete panels at ultimate load were evaluated by Kumar and Ramirez [25]. They concluded that stay-in-place precast, pre-stressed deck panels with a broom-finished surface, do not require horizontal shear connectors if the average horizontal shear stress at the interface is less than 0.8 MPa. Horizontal shear strength was evaluated to assess the effect of normal stress over the interface, and the results revealed that the roughness of the surface and cohesion coefficients had a profound impact on the shear capacity [26,27,28]. The effect of surface texture and steel reinforcement at the interface of the interfacial shear strength was studied on three different base surfaces; smooth, roughened, and steel projecting from the base concrete surface. An increase in the roughness degree was proven to contribute to higher friction and cohesion coefficients, producing higher shear strength at the interface [29]. The direct shear strength of ternary blend geopolymer concrete with varying volume fractions of crimped steel fibers, i.e., 0.25, 0.50, 0.75, and 1%, showed that the addition of steel fibers up to 1% delayed crack propagation and improved the shear capacity [30]. Direct shear strength of steel fiber-reinforced high-strength concrete on uncracked and pre-cracked push-off specimens was tested with varying fiber content and reinforcement ratios to analyze the slipping response and the transfer of shear across an open crack [31]. For initially uncracked specimens, ductile behavior was exhibited by specimens with both fibers and reinforcement, and the mechanical properties were improved before failure. In contrast, for pre-cracked specimens, a reduction in shear strength and an increase in slip was observed at all stages of loading. An investigation into shear transfer between vibrated concrete (VC) and SCC using small specimens with different inclinations of shear reinforcement and different combination types of concrete was performed. The results indicated that the residual resistance after slip had improved due to the inclination of shear reinforcement in the direction of the applied force. Additionally, higher adhesion resistance was observed in SCC than in VC [32].
The most widely used method to ensure shear resistance for proper bonding at the interface is to provide well-anchored shear ties across the interface. In composite construction, shear ties are placed across the concrete-to-concrete interface to maintain the monolithic behavior of the section. Shear ties are a typical extension of the shear reinforcement from the precast beam section, and are later cast into the slab. The slip is resisted further, and the integrity between the systems is maintained by the extension of shear ties across the interface. However, using shear ties invites certain disadvantages regarding cost, construction safety, etc. An increase in the number of shear ties increases fabrication cost, reduces construction safety, and increases life cycle cost. This indicates that ensuring shear strength with reduced shear ties can have a significant advantage. By replacing shear ties with another material that can provide sufficient bond strength, the efficiency of construction can also be improved. This paper mainly aims to determine whether providing steel fibers can increase the shear strength between concrete layers and reduce the dependency on shear ties. The interface between TGPC and high-strength concrete (HSC) is considered for the study. The variables considered are the volume fraction of steel fibers (0.50%, 0.75%, and 1%) and the number of shear ties at the interface (0, 2, or 3). Push-off specimens with TGPC as the substrate and HSC as the overlay are built and tested in a compression testing machine to produce shear at the interface.

2. Materials and Methods

2.1. Materials

Monolithic and bilithic specimens were used for the study. TGPC and HSC were cast as monolithic and bilithic specimens. In TGPC, the source materials used were fly ash, GGBS, and rice husk ash (RHA), and their chemical compositions are shown in Table 1. Low calcium (Class F, IS 3812:2003) fly ash acquired from Mettur Thermal Power Station in Tamil Nadu was used as the main binder of the source material. Fly ash is a dark grey powder with a specific gravity of 2.30 and a mean particle size of 75 µm [33]. GGBS conforming to BS 6699:1992 of dry density 2900 kg/m3 and off-white color having a specific gravity of 2.9 obtained from JSW cement Ltd. in Mangalore was used as one of the source materials. The TGPC also consisted of RHA as a source material procured from KC-Contech construction admixtures in Chennai, with a specific gravity of 2.1. In HSC, ordinary Portland cement (OPC) of grade 53 (conforming IS 12269:1987 (reaffirmed 2004)) [34] with a specific gravity of 3.14 and consistency of 32 % was used as binder material. Elkem micro silica of 920 D grade silica fume of specific gravity 2.1 was used as an admixture in HSC. Crimped steel fibers 30 mm in length and 0.45 mm in diameter, with an aspect ratio 66 and tensile strength of 800 N/mm2, were incorporated into this study.
In this study, manufactured sand (M sand) passed through an IS sieve (4.75 mm, conforming to grading zone II of IS 383:2016) was used as the fine aggregate. Crushed stone with a maximum size of 12.5 mm was used as a coarse aggregate. Table 2 shows the properties of aggregates used. The alkali activator solution was prepared using a mix of sodium hydroxide (NaOH) pellets of 99% purity and sodium silicate solution (64% H2O, 28% SiO2, 8% Na2O). Conplast SP 430, a naphthalene-based superplasticizer acquired from Fosroc chemicals, was used to ensure the required workability and reduce water content. Steel reinforcement bars with 8 mm diameter were used as vertical stirrups, and 10 mm diameter were used as main reinforcement to avoid all failure modes other than interfacial failure.

2.2. Mix Proportions

Rangan [35] guidelines based on the trial-and-error method were adopted for calculating the mix design of TGPC of grade M55. The proportions of fly ash, GGBS, and RHA, the molarity of NaOH, and the alkaline liquid-to-binder ratio were adopted from the detailed study carried out by the authors, the result of which are presented elsewhere [30]. Therefore, the TGPC mix consists of 65% fly ash, 30% GGBS, and 5% RHA. The alkaline activator-to-binder ratio and the molarity of NaOH were 2.5 and 12 M, respectively. For better workability, the water-to-binder ratio was fixed at 0.28. In the mix, superplasticizer was added at a rate of 2.5% to the total weight of the binder. The mix proportion for TGPC was kept constant for all monolithic and bilithic specimens by adding different volume fractions of fibers and numbers of shear ties to study the effect.
High-strength concrete of grade M65 was developed as per the recommendation of IS:10262-2019 and ACI 318 with a water-to-cement ratio of 0.27. Table 3 shows the mixture proportion of TGPC and HSC.

2.3. Specimen Details

The test method followed by Hofbeck et al. [36] was adopted for the direct shear test. This test has been generally carried out on push-off specimens, often referred to as double L-shaped or Z-shaped specimens. First, two L-shaped concrete elements are cast, having a common interface. A force is then applied from one end of the test specimen, while the other end is supported. The test can be conducted vertically or horizontally. Load is applied concentrically with the interface. Thus, direct shear (no moment) acts on the interface. The present study used push-off specimens with dimensions 520 mm × 300 mm × 125 mm, as shown in Figure 1. The specimen has a shear plane at the interface with an area of 27,500 mm2. In the present study, specimens were cast as monolithic and bilithic types. The monolithic specimens were used as control specimens, and all other specimens were bilithic in nature. In the monolithic specimens, both halves were cast simultaneously, whereas, in the bilithic specimens, two halves were cast separately. In bilithic specimens, TGPC was used as the substrate and HSC as the overlay, and a total of 13 different combinations of specimens were cast. The specimen types and their denomination are shown in Table 4.

2.4. Procedure for Mixing, Casting, and Curing

All the aggregates were prepared in saturated surface dry conditions. The required ingredients’ quantities were initially weighed and kept ready for mixing according to the optimum mix obtained. A drum-type mixer was used for the mixing of the dry materials. Cast iron molds for push-off specimens of size 520 mm × 300 mm × 125 mm were used for casting. The reinforcement cage was placed in position, and the molds were filled with concrete mix. For monolithic specimens, the TGPC mix was prepared using an alkaline solution, which was prepared one day before casting. The other ingredients were mixed well in the dry condition in the concrete mixer, and, slowly, alkaline solution with extra water was added to the mix. Later, superplasticizer was added to the mix, and all these were mixed thoroughly, and the TGPC specimen was cast. The specimen was kept in the mold for a rest period of 24 h and then demolded. It is then kept in a steam chamber for 24 h at 60 °C to gain strength rapidly, and then stored at ambient conditions for 28 days after steam curing. For HSC, the batching is performed using the adopted mix design. The concrete mix was prepared in a drum mixer. The reinforcement cage was adjusted in the mold, having a clear cover of 20 mm. The concrete mix was poured into the mold in layers, with every layer vibrated with a needle vibrator to ensure that no air bubbles were present. Then the mold was filled and leveled. After 24 h, specimens were demolded and taken for water curing for 28 days.
The whole specimen was cast simultaneously for monolithic specimens, whereas, for bilithic specimens, two halves of the specimens were cast separately. Initially, the first half of the specimen was cast with TGPC, and after 24 h of steam curing at 60 °C of the first half, the second half was cast over the first half using HSC. For the specimen with fibers and shear ties at the interface, the first layer was cast with shear ties projecting from the surface of the concrete at the interface, and the second layer was cast with fiber-reinforced HSC.
A total of three control specimen models were cast, where two were monolithic, and one was bilithic, with TGPC as the substrate and HSC as the overlay. Specimens without shear ties and steel fibers, and with shear ties and varying percentages of steel fibers (0.50, 0.75, and 1%) were cast.

2.5. Testing of Specimens

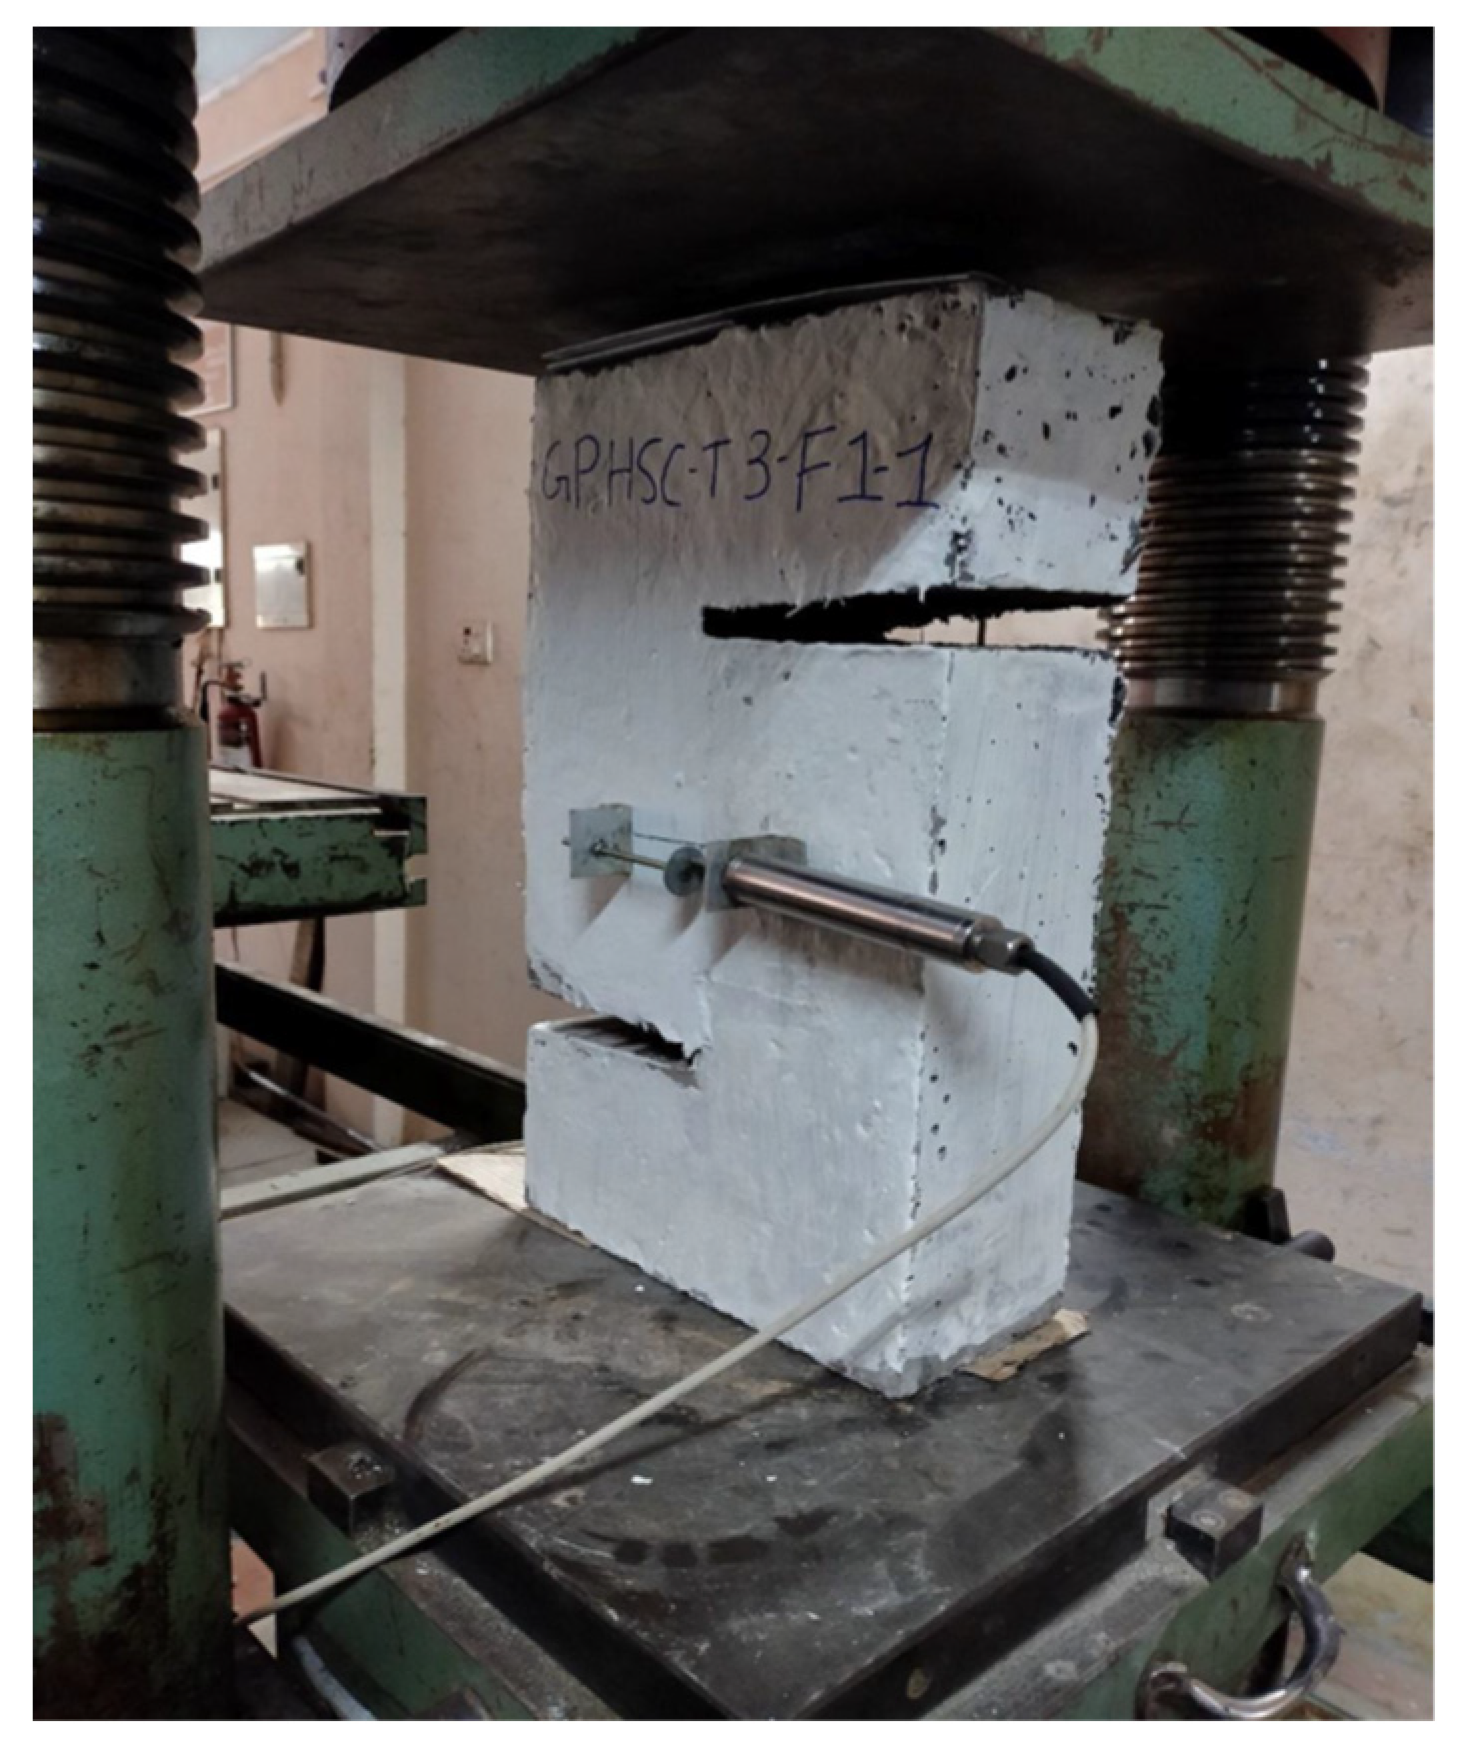
All the specimens were tested under load control conditions in a universal testing machine (UTM) of 300 tonne capacity. Horizontal displacement across the shear plane and vertical displacement along the shear plane was measured using two LVDTs attached to the specimen. Figure 2 shows the test setup, loading condition, and position of LVDTs. All the specimens were subjected to direct compressive loading. Specimens were loaded until failure, and horizontal and vertical displacements were noted for corresponding load values. Since there was no provision for displacement control in the machine, recording displacements in the post-peak zone was not possible.

3. Results and Discussions

The horizontal and vertical displacements were determined with the help of LVDTs for each 2-tonne load increment until failure, and the ultimate load was noted. Table 4 shows the ultimate load and shear strength of various specimens obtained from the experiment. Shear stress was calculated by dividing the ultimate load by a shear plane area of 27,500 mm2.

3.1. Strength Deformation Behavior of Specimens

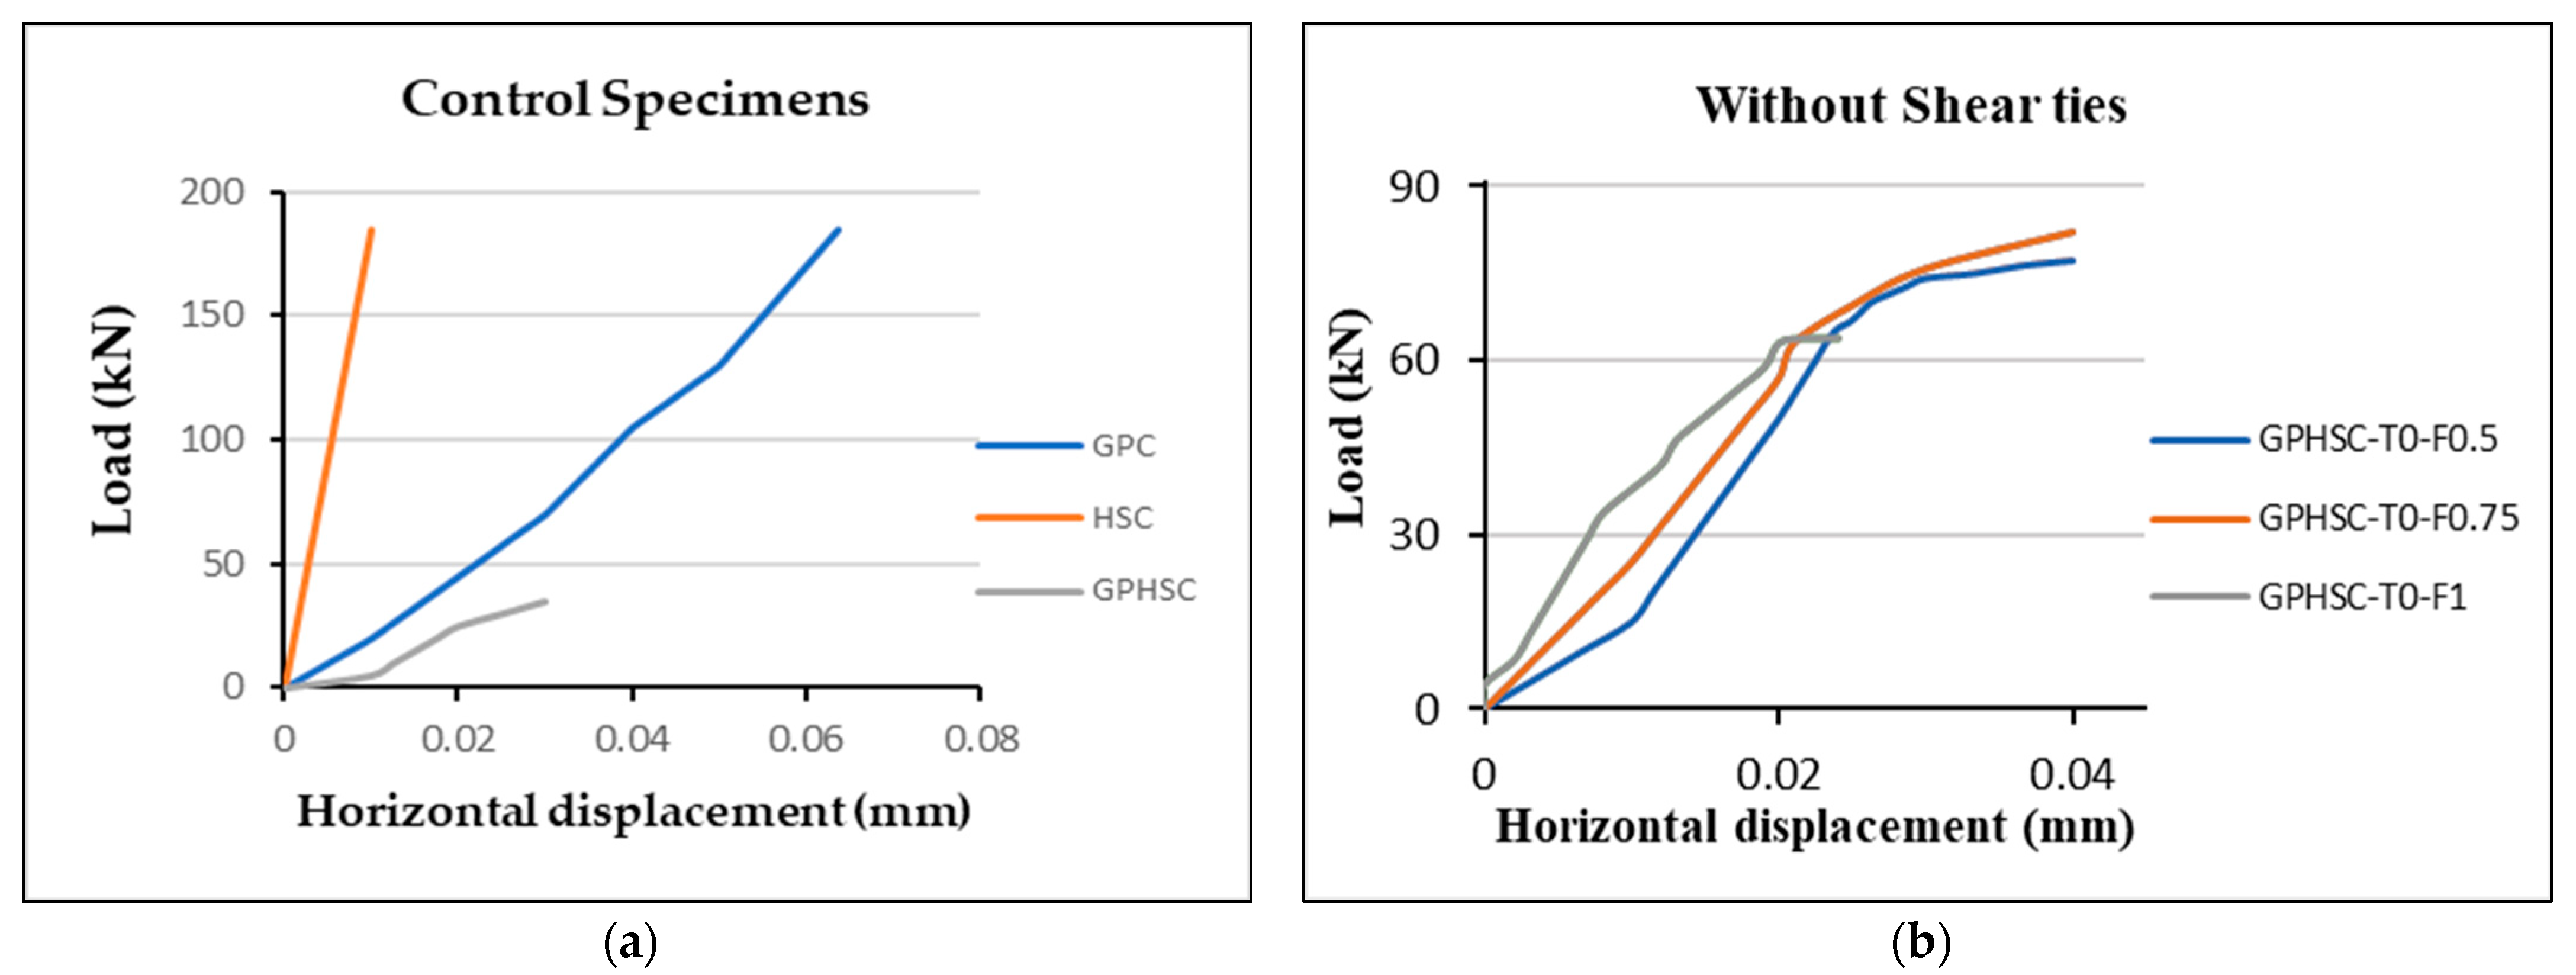
The load-displacement graphs for all the specimens are shown in Figure 3. It can be noted from Figure 3a that both the monolithic and bilithic specimens exhibited linear variation until the ultimate load. However, the load carrying capacity of monolithic specimens was more than that of the bilithic specimens. Additionally, all the control specimens failed in a brittle manner, and were separated into two L halves without crushing due to the breaking of the cohesion bond of concrete at the interface [29]. In Figure 3b, for the specimens with steel fibers, there is a short linear portion where a decrease in slip was observed at the early stages of loading, i.e., increased stiffness and ductile behavior were experienced at the ultimate stage of loading. All the curves were linear during the initial stage, and a change in slope occurred later, which can be observed in Figure 3c,d. Without shear ties, the GPHSC specimens with 0.75% steel fibers exhibited better performance. This can be attributed to the bridging action of the fibers during the crack formation along the interface. The GPHSC specimens with steel fibers and shear ties at the interface showed a similar behavior as the specimens with steel fibers only. Among them, the GPHSC specimen with two shear ties and a steel fiber content of 0.75% showed increased shear strength (an increase of 6%), and it was comparable with the GPHSC-T3 specimen. The GPHSC specimens with shear ties and 1% steel fibers showed poor performance due to the balling effect of the fibers.
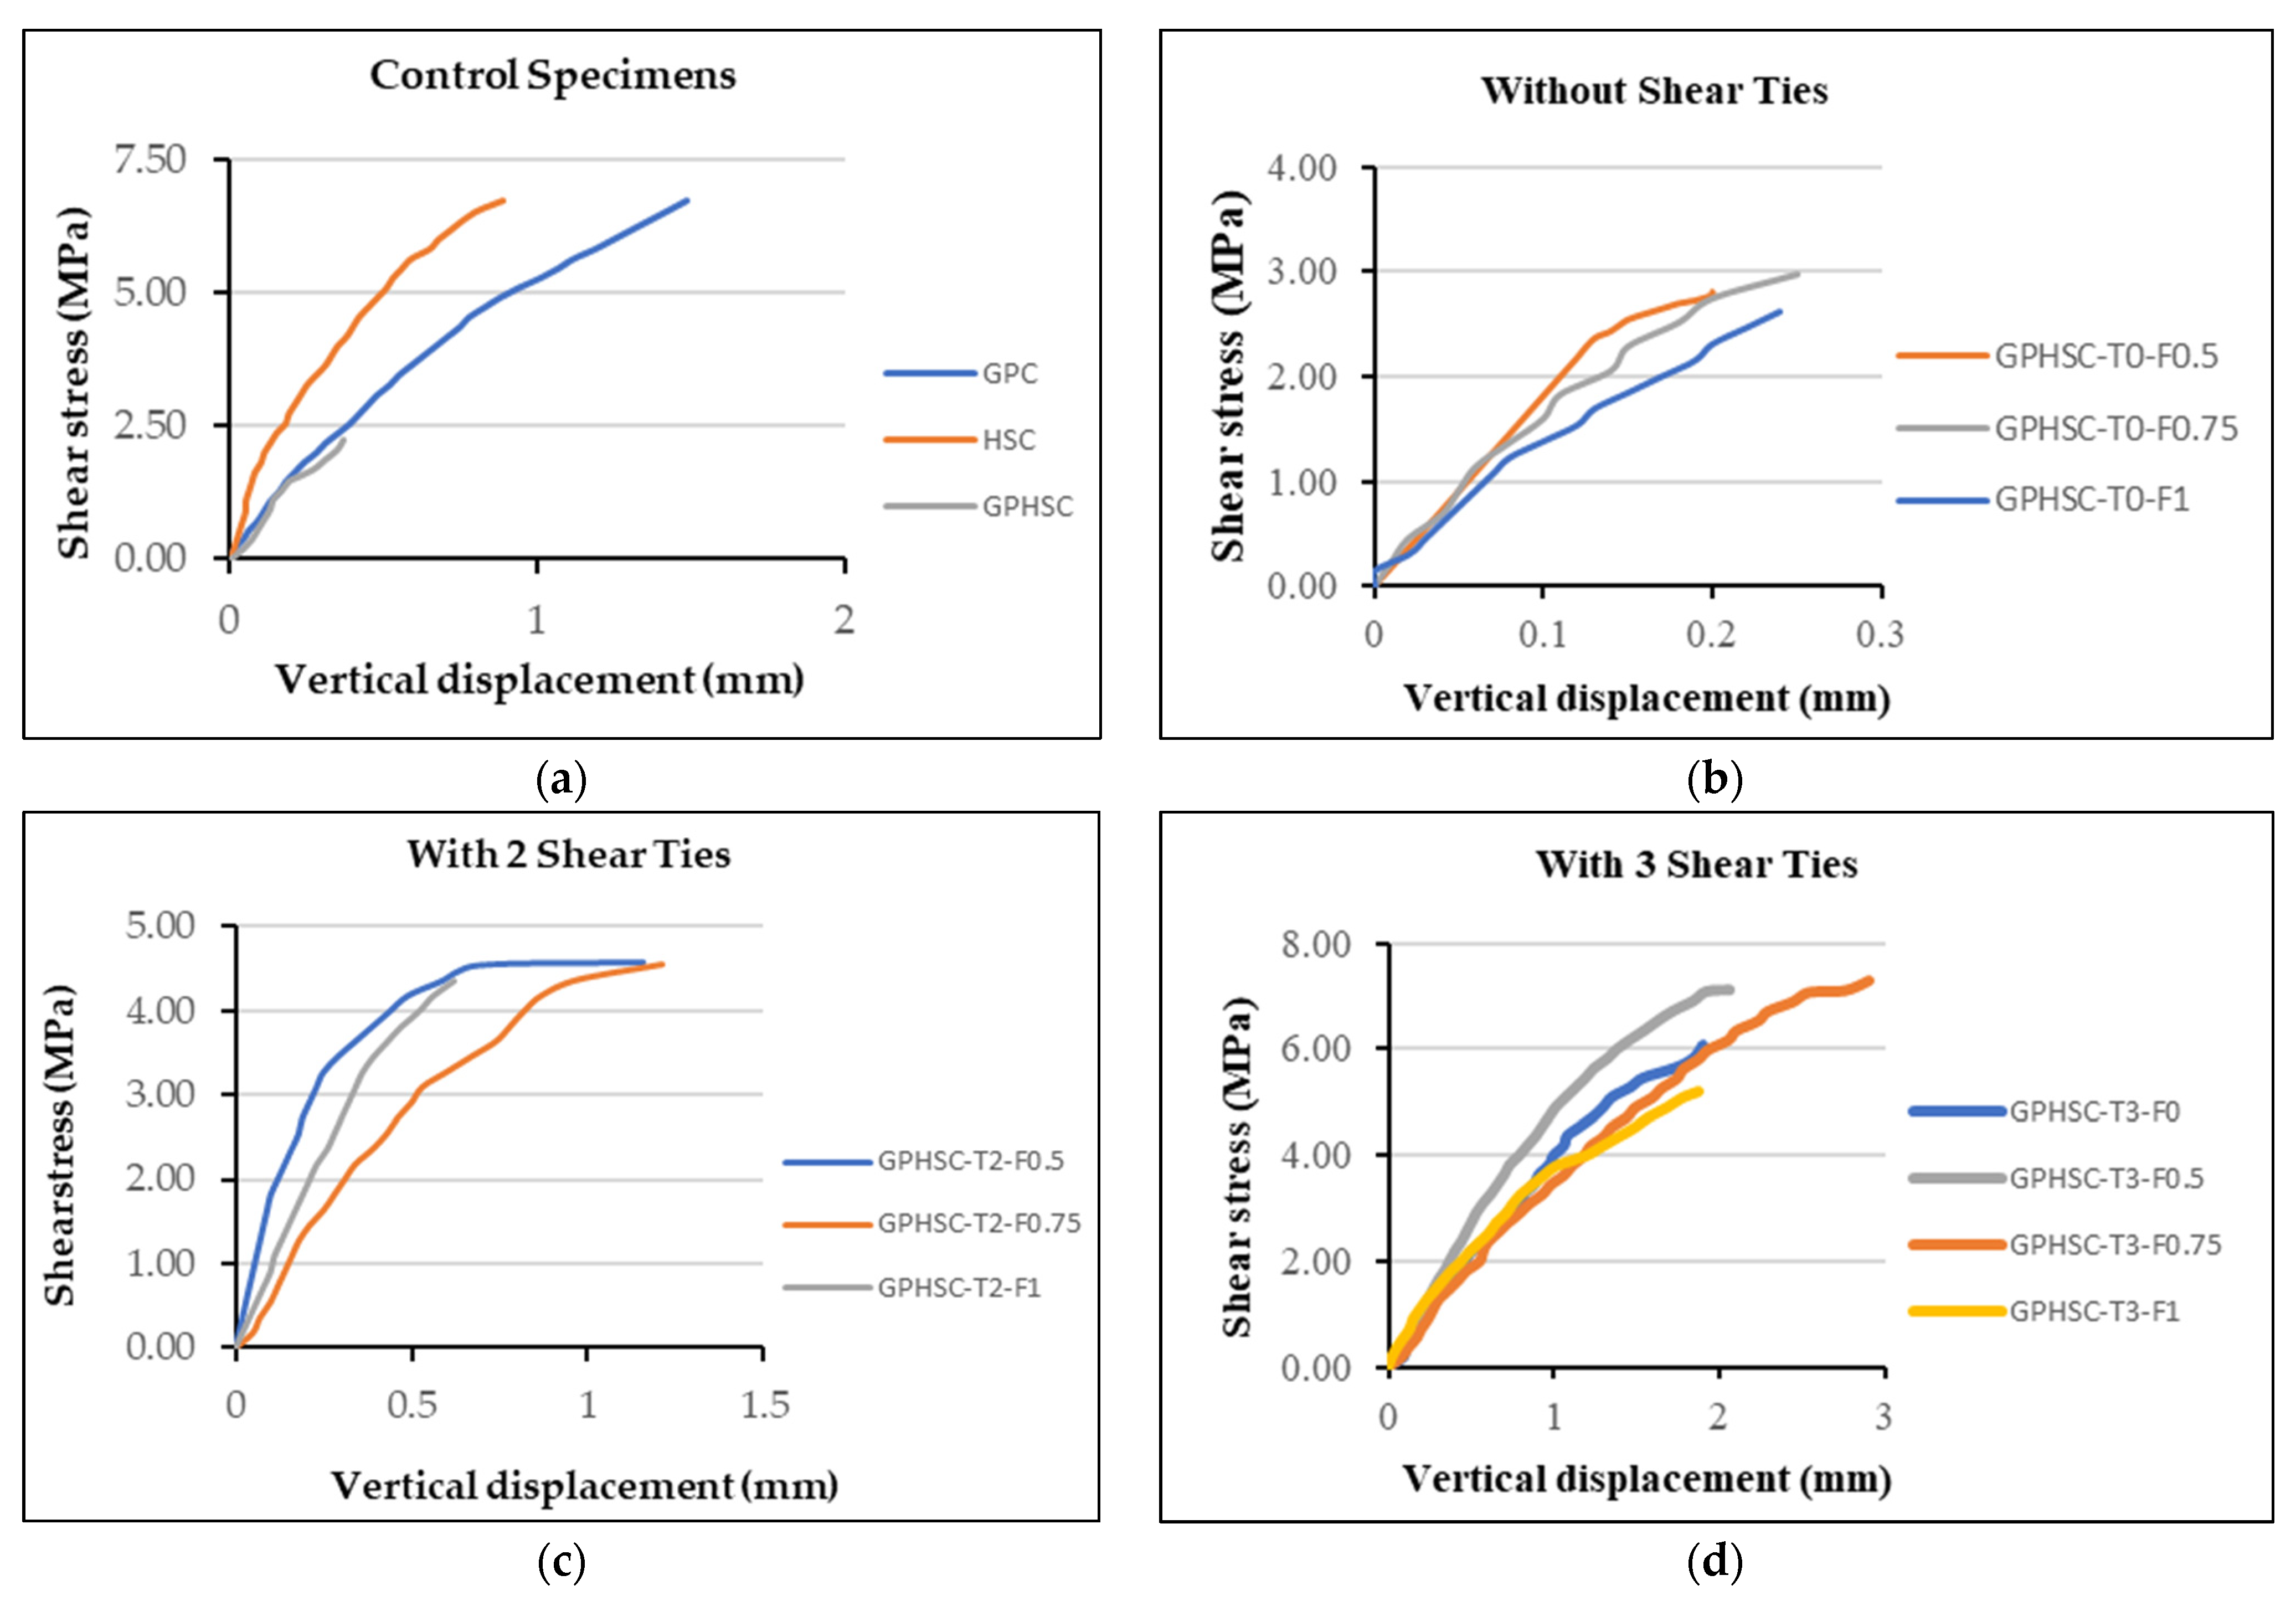
The plots for shear stress against vertical displacement are shown in Figure 4. Maximum shear stress for each specimen was calculated by dividing the ultimate load by the area of the shear plane at the interface. From Figure 4a–d, it may be noted that, during the initial stages of loading, linear variation was observed for all the specimens, and after the formation of the first crack, there was a reduction in stiffness. For the GPHSC specimens without shear ties, the interface shear strength was due to the surface friction and concrete cohesion at the interface. In Figure 4c,d, for the GPHSC specimen with shear ties, sudden failure was not observed; this was due to the cohesion and friction forces, and also by the clamping stress produced by the dowel action of the shear ties.

3.2. Cracking Pattern of Specimens

The failure patterns of all the specimens are shown in Figure 5, Figure 6, Figure 7 and Figure 8. In the control specimens (Figure 5), i.e., specimens without steel fibers or shear ties, the first crack appeared near the upper and lower notches, and with an increase in load, cracks propagated towards the center of the specimen. The second crack was then observed at the side of the specimen, and it propagated towards the notch of the specimen. After reaching the peak load, the specimens lost their integrity and fractured into two parts along the interface. The failure was brittle in nature, with no warning before the collapse of the specimen. The bilithic specimens with steel fibers (Figure 6) exhibited similar behavior to those without steel fibers, but with delayed crack formation due to the addition of steel fibers. In this case, several fine diagonal cracks were observed, which, in turn, joined together to form a crack band along the interface shear plane, and the specimens broke into two halves [37]. For bilithic specimens with two shear ties and steel fibers (Figure 7), the first crack was observed at the side face at a distance of 110–120 mm from the top of the specimen, and propagated towards the notch of the specimen. The second crack appeared near the upper and lower notches, and with an increase in load, cracks propagated towards the center of the specimen. A similar pattern of cracks was observed for bilithic specimens with three shear ties and steel fibers (Figure 8), with the first crack at the side face at a distance of 130–140 mm from the top of the specimen. Due to the addition of shear ties at the interface, the specimen did not split into two parts, and the crack propagation was also delayed by the incorporation of steel fibers at the interface, changing the mode of failure from a brittle to ductile manner.

4. Prediction of Interfacial Shear Strength

Comparison of Experimental Data with Available Design Equations

An equation for the assessment of the longitudinal shear strength of concrete-to-concrete interfaces was first proposed by Birkeland et al. [38], considering the steel reinforcement ratio, yield strength of steel, and friction parameter, as presented in Equation (1). The coefficient of friction assumes the value µ = 1.7 for monolithic concrete, µ =1.4 for artificially roughened construction joints, and µ = 0.8 to 1.0 for ordinary construction joints and concrete to steel interfaces.
V u   = μ   ρ   f y
Several researchers suggested later modifications to Equation (1) to include other parameters, such as interface cohesion, dowel action of reinforcing bars, and weakest concrete strength. The design expression proposed by Mattock et al. [39], known as the modified shear friction theory, considered the contribution of the interface cohesion and clamping stresses. The coefficient of friction was considered to be constant, having value of 0.8.
V u   = 2.8 + 0.8   ρ v   f y 0.3   f c
Later, Mattock modified Equation (2) to obtain a more precise result, as follows:
V u = 0.467 ( f c ) 0.545   +   0.8     ρ v   f y 0.3 f c
A design expression was proposed by Randl [40] that explicitly considered the contribution of load transfer by three different mechanisms: (i) cohesion due to aggregate interlocking, (ii) friction caused by the longitudinal relative slip between concrete layers, and (iii) the dowel action due to the shear reinforcement crossing the interface.
V u = c   f c 1 / 3 + μ   ρ v   k   f y + α   ρ   ( f y     f c )
The design expression in Equation (5), adopted in Eurocode 2 [41], considers the contribution of cohesion and friction only. Dowel action is not considered.
V u = c   f c t + μ   ρ v   f y 0.3   f c
where c = 0.35 , μ = 0.60 .
The interface shear strength of concrete can be predicted theoretically using the equations available in the literature. In this study, the influence of steel fibers on the interface shear strength of composite structures of ternary blend geopolymer concrete and high-strength concrete was determined. The experimental results were compared against shear interface models proposed by different researchers, as shown in Table 5. However, it was seen that there is a gap between the experimental and theoretical models in the literature. In order to eliminate this gap, a modification was performed in one of the available equations, that of Birkeland et al. [38], in which a lower coefficient of variation (10.8%) and a mean value of 1.01 (0.11) for the ratio Vu(ex)/Vu(th) was obtained. Therefore, the Birkeland equation was modified by introducing parameters and variables related to the fibers and shear ties used, such as the aspect ratio, volume fraction, and diameter of the fibers; number of shear ties at the interface; and area of shear reinforcement crossing the interface. Hence, to achieve a more precise prediction, effort has been made to add a correction factor that took into account the above parameters. Therefore, Equation (1) was further modified with a factor, Fs.
F s = a r     V f     η f   d f + n   K   A T
where a r   is the aspect ratio of the fibers, V f is the volume fraction of the fibers, η f = 1.2 is the bond efficiency factor of crimped steel fibers, d f is the diameter of the fibers, n is the number of shear ties crossing the interface, K is an approximation factor taken as 0.1, A T is the area of shear reinforcement crossing the interface.
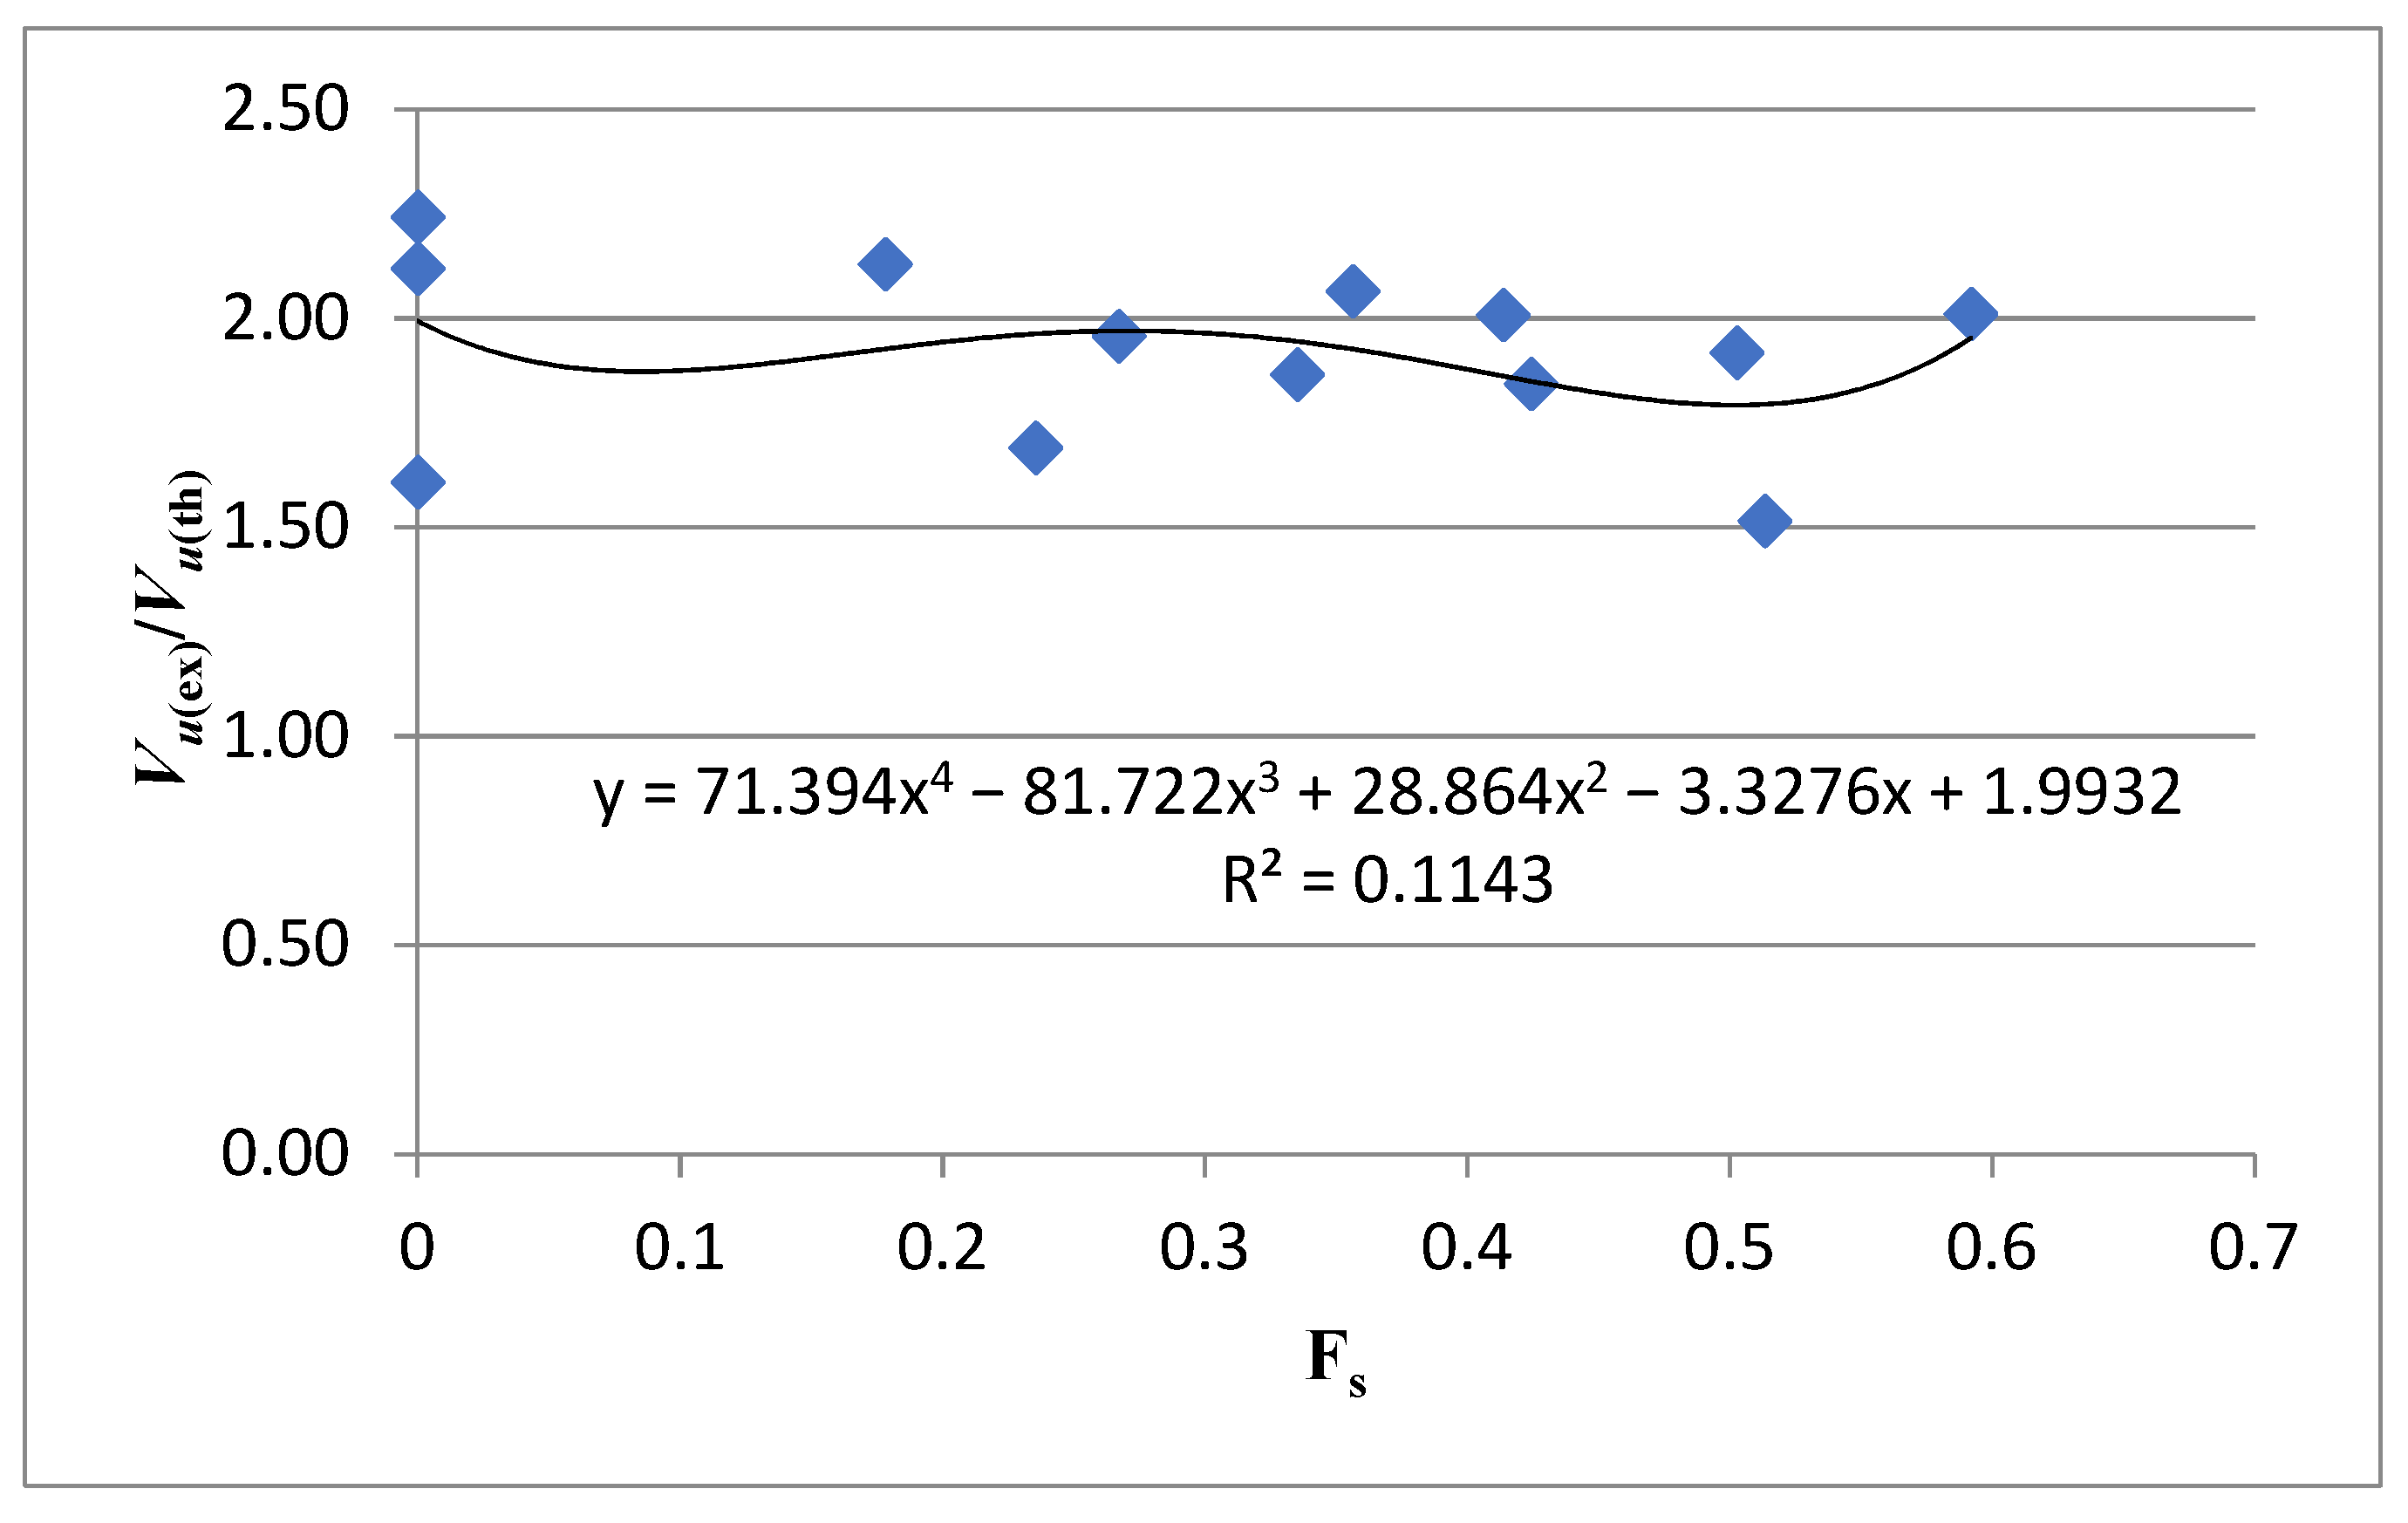
The ratio of shear strength Vu(ex)/Vu(th) was calculated using Equation (1), and is related to Fs as shown in Figure 9, for which the regression equation is:
Vu(ex)/Vu(th) = 71.39(Fs)4 − 81.72(Fs)3 + 28.86(Fs)2 − 3.327(Fs) + 1.993
To develop an equation for interface shear strength of push-off specimens, Vu(pr), Equation (7) was modified by replacing Vu(ex) with Vu(pr). Hence, the modified equation for calculating the interface shear strength of specimens is:
Vu(pr) = Vu(th) [71.39(Fs)4 − 81.72(Fs)3 + 28.86(Fs)2 − 3.327(Fs) + 1.993]
After accounting for a factor of 1.9 in Equation (1), and then substituting it into Equation (8), the following equation was produced:
V u ( pr ) = 1.9   μ     ρ   f y   [ 71.39 ( F s ) 4 81.72 ( F s ) 3 + 28.86 ( F s ) 2 3.327 ( F s ) + 1.993 ]
The experimental results were compared with the results obtained from Equation (9), and a graph was plotted for Vu(pr) against Vu(ex), as shown in Figure 10. From Figure 10, it can be understood that the majority of the points are inside the ± 15 %   lines of agreement. The coefficient of variation and mean value for the ratio Vu(ex)/Vu(th) are 10.8% and 1.01, respectively. From this, it is clear that the predicted equation can be correlated comparably with the experimental results.

5. Conclusions

The shear strength at the interface between TGPC and HSC was estimated using push-off specimens. The possibility of replacing shear ties at the interface (0, 2, or 3) with steel fibers (ranging from volume fractions 0, 0.50, 0.75, and 1%) was analyzed. The results from the experimental program were used to propose an equation for interface shear strength in terms of volume fraction of steel fibers and number of shear ties. The following conclusions can be drawn from the study:
  • The monolithic control specimens showed three times higher interfacial shear strength than the bilithic control specimen, which may be attributed to the concrete cohesion bond at the interface.
  • Due to the dowel action of steel reinforcement crossing the interface, the bilithic specimens with shear ties at the interface exhibited more shear strength than those without shear ties.
  • The shear strength of bilithic specimens reinforced with steel fibers alone at the interface showed an improved shear capacity at a higher volume fraction of fibers, and shifted the failure mode from brittle to ductile.
  • The bilithic specimens with and without shear ties showed an increase in interfacial shear strength with the addition of 0.75% steel fiber volume fraction. However, there was a reduction in the strength beyond the addition of 0.75% due to balling effect of the fibers.
  • The shear strength at the interface of the specimen with two shear ties and 0.75% steel fibers increased by 6% compared to the specimen with three shear ties. Hence, the number of shear ties at the interface can be reduced from three to two upon the inclusion of 0.75% steel fibers.
  • A modified equation for predicting the interfacial shear strength considering parameters related to shear ties and steel fibers at the interface was proposed, and was found comparable with the experimental test results.

Author Contributions

Conceptualization, M.G., N.G., P.V.I. and V.S.K.; methodology, M.G., N.G. and P.V.I.; validation, M.G., N.G. and P.V.I.; formal analysis, M.G., N.G. and P.V.I.; investigation, M.G., N.G. and P.V.I.; resources, M.G., V.S.K., G.M. and N.I.V.; data curation, V.S.K., G.M. and N.I.V.; writing—original draft preparation, M.G. and V.S.K.; writing—review and editing, M.G., V.S.K., G.M. and N.I.V.; supervision, N.G. and P.V.I.; project administration, N.G., P.V.I., G.M. and N.I.V.; funding acquisition, G.M. and N.I.V. All authors have read and agreed to the published version of the manuscript.

Funding

The research is partially funded by the Ministry of Science and Higher Education of the Russian Federation as part of the World-class Research Center program: Advanced Digital Technologies (contract No. 075-15-2022-311 dated 20.04.2022).

Institutional Review Board Statement

Not applicable.

Informed Consent Statement

Not applicable.

Data Availability Statement

Not applicable.

Acknowledgments

The authors would like to acknowledge the National Institute of Technology Calicut, India, for the facilities provided to complete this project successfully.

Conflicts of Interest

The authors declare no conflict of interest.

Nomenclature

VuUltimate shear strength
ρSteel reinforcement ratio
fyYield strength of steel
fctTensile strength of concrete
f’cConcrete cylinder compressive strength
cCohesion
kCoefficient of efficiency for tensile force that can be activated in the reinforcement
αCoefficient for flexural resistance of reinforcement (dowel action)

References

  1. Gunasekera, C.; Setunge, S.; Law, D.W. Correlations between Mechanical Properties of Low-Calcium Fly Ash Geopolymer Concretes. J. Mater. Civ. Eng. 2017, 29, 4017111. [Google Scholar] [CrossRef]
  2. Topark-Ngarm, P.; Chindaprasirt, P.; Sata, V. Setting Time, Strength, and Bond of High-Calcium Fly Ash Geopolymer Concrete. J. Mater. Civ. Eng. 2015, 27, 4014198. [Google Scholar] [CrossRef]
  3. Malhotra, V.M. Introduction: Sustainable development and concrete technology. Concr. Int. 2002, 24, 22. [Google Scholar]
  4. Hardjito, D.; Wallah, S.E.; Sumajouw, D.M.J.; Rangan, B.V. Factors influencing the compressive strength of fly ash-based geopolymer concrete. Civ. Eng. Dimens. 2004, 6, 88–93. [Google Scholar]
  5. McCaffrey, R. Climate change and the cement industry. GCL Mag. 2002, 15, 19. [Google Scholar]
  6. Habert, G.; De Lacaillerie, J.D.E.; Roussel, N. An environmental evaluation of geopolymer based concrete production: Reviewing current research trends. J. Clean. Prod. 2011, 19, 1229–1238. [Google Scholar] [CrossRef]
  7. Veerapandian, V.; Pandulu, G.; Jayaseelan, R.; Sathish Kumar, V.; Gunasekaran, M.; Nikolai Ivanovich, V. Numerical Modelling of Geopolymer Concrete In-Filled Fibre-Reinforced Polymer Composite Columns Subjected to. Materials 2022, 15, 3390. [Google Scholar] [CrossRef]
  8. Kuppusamy, Y.; Jayaseelan, R.; Pandulu, G.; Sathish Kumar, V.; Gunasekaran, M.; Saurav, D.; Nikolai Ivanovich, V. Artificial Neural Network with a Cross-Validation Technique to Predict the Material Design of Eco-Friendly Engineered. Materials 2022, 15, 3443. [Google Scholar] [CrossRef]
  9. Sathish Kumar, V.; Indira, P.V.; Ganesan, N. Tension stiffening and cracking behaviour of hybrid fibre reinforced ternary blend geopolymer concrete. J. Struct. Eng. 2019, 46, 257–266. [Google Scholar]
  10. Sathish Kumar, V.; Ganesan, N.; Indira, P.V. Effect of Molarity of Sodium Hydroxide and Curing Method on the Compressive Strength of Ternary Blend Geopolymer Concrete. IOP Conf. Ser. Earth Environ. Sci. 2017, 80, 12011. [Google Scholar] [CrossRef] [Green Version]
  11. Sathish Kumar, V.; Ganesan, N.; Indira, P.V. Engineering Properties of Hybrid Fibre Reinforced Ternary Blend Geopolymer Concrete. J. Compos. Sci. 2021, 5, 203. [Google Scholar] [CrossRef]
  12. Sathish Kumar, V.; Ganesan, N.; Indira, P.V. Effect of Hybrid Fibres on the Durability Characteristics of Ternary Blend Geopolymer Concrete. J. Compos. Sci. 2021, 5, 279. [Google Scholar] [CrossRef]
  13. Leela, D.; Manjula, R. Flexural behaviour of steel fibre reinforced ternary blend geopolymer concrete. PalArchs J. Archaeol. Egypt/Egyptol. 2021, 18, 1036–1047. [Google Scholar]
  14. Sathish Kumar, V.; Ganesan, N.; Indira, P.V.; Murali, G.; Vatin, N.I. Flexural Behaviour of Hybrid Fibre-Reinforced Ternary Blend Geopolymer Concrete Beams. Sustainability 2022, 14, 5954. [Google Scholar] [CrossRef]
  15. Sathish Kumar, V.; Ganesan, N.; Indira, P. V Shear Strength of Hybrid Fibre-Reinforced Ternary Blend Geopolymer Concrete Beams under Flexure. Materials 2021, 14, 6634. [Google Scholar] [CrossRef]
  16. Sathish Kumar, V.; Ganesan, N.; Indira, P.V.; Murali, G.; Vatin, N.I. Behaviour of Hybrid Fibre-Reinforced Ternary Blend Geopolymer Concrete Beam-Column Joints under Reverse Cyclic Loading. Polymers 2022, 14, 2239. [Google Scholar] [CrossRef]
  17. Valikhani, A.; Jahromi, A.J.; Mantawy, I.M.; Azizinamini, A. Effect of mechanical connectors on interface shear strength between concrete substrates and UHPC: Experimental and numerical studies and proposed design equation. Constr. Build. Mater. 2021, 267, 120587. [Google Scholar] [CrossRef]
  18. Alkatan, J. FRP Shear Transfer Reinforcement for Composite Concrete Construction; University of Windsor: Windsor, ON, Canada, 2016. [Google Scholar]
  19. Shah, S.G. Fracture and Fatigue Behavior of Concrete-Concrete Interfaces Using Acoustic Emission, Digital Image Correlation And Micro-Indentation Techniques. Ph.D. Thesis, Indian Institute of Science, Bengaluru, India, 2011. [Google Scholar]
  20. Santos, D.S.; Santos, P.M.D.; Dias-Da-Costa, D. Effect of surface preparation and bonding agent on the concrete-to-concrete interface strength. Constr. Build. Mater. 2012, 37, 102–110. [Google Scholar] [CrossRef]
  21. Santos, P.M.D.; Julio, E.N.B.S. Factors affecting bond between new and old concrete. ACI Mater. J. 2011, 108, 449–456. [Google Scholar] [CrossRef]
  22. Liu, J.; Chen, Z.; Guan, D.; Lin, Z.; Guo, Z. Experimental study on interfacial shear behaviour between ultra-high performance concrete and normal strength concrete in precast composite members. Constr. Build. Mater. 2020, 261, 120008. [Google Scholar] [CrossRef]
  23. Kovach, J.; Naito, C. Horizontal Shear Capacity of Composite Concrete Beams without Interface Ties; ATLSS Report No.08-05; Lehigh University: Bethleham, PA, USA, 2008. [Google Scholar]
  24. Ganeshan, M.; Venkataraman, S. Interface shear strength evaluation of self compacting geopolymer concrete using push-off test. J. King Saud. Univ.-Eng. Sci. 2022, 34, 98–107. [Google Scholar] [CrossRef]
  25. Phani Kumar, N.V.V.; Ramirez, J.A. Interface horizontal shear strength in composite decks with precast concrete panels. PCI J. 1996, 41, 42–55. [Google Scholar] [CrossRef]
  26. Gohnert, M. Horizontal shear transfer across a roughened surface. Cem. Concr. Compos. 2003, 25, 379–385. [Google Scholar] [CrossRef]
  27. Mohamad, M.E.; Ibrahim, I.S.; Abdullah, R.; Rahman, A.B.A.; Kueh, A.B.H.; Usman, J. Friction and cohesion coefficients of composite concrete-to-concrete bond. Cem. Concr. Compos. 2015, 56, 1–14. [Google Scholar] [CrossRef]
  28. ASCE-ACI Committee 445 on Shear and Torsion. Recent Approaches to Shear Design of Strucutral Concrete. J. Struct. Eng. 1998, 124, 1375–1417. [Google Scholar] [CrossRef]
  29. Mohamad, M.E.; Ibrahim, I.S. Interface Shear Strength of Concrete-to-Concrete Bond with and without Projecting Steel Reinforcement. J. Teknol. 2015, 75, 169–172. [Google Scholar] [CrossRef] [Green Version]
  30. Mohan, G.; Indira, P.V.; Ganesan, N. Behaviour of ternary blend fibre reinforced geopolymer concrete under direct shear. J. Struct. Eng. 2020, 46, 434–440. [Google Scholar]
  31. Ahmed, L.; Ansell, A. Direct shear strength of high-strength fibre concrete. Mag. Concr. Res. 2010, 62, 379–390. [Google Scholar] [CrossRef]
  32. Holschemacher, K.; Junker, F.; Mueller, T. Investigation of shear transfer between vibrated and self-consolidating concrete in precast reinforced concrete constructions. Procedia Eng. 2013, 57, 398–406. [Google Scholar] [CrossRef] [Green Version]
  33. IS 3812:2003; Pulverized fuel ash-Specification. Bureau of Indian Standards: New Delhi, India, 2003.
  34. IS 12269:1987; Specification for 53 Grade Ordinary Portland Cement. Bureau of Indian Standards: New Delhi, India, 2004.
  35. Rangan, B.V. Fly ash based geopolymer concrete. In Proceedings of the International Workshop on Geopolymer Cement and Concrete, Mumbai, India, 7 December 2010; pp. 68–106. [Google Scholar]
  36. Hofbeck, J.A.; Ibrahim, I.O.; Mattock, A.H. Shear Transfer in reinforced Concrete. J. Am. Concr. Inst. 1969, 66, 119–128. [Google Scholar]
  37. Valle, M.; Buyukozturk, O. Behavior of Fiber Reinforced High-Strength Concrete Under Direct Shear. ACI Mater. J. 1993, 90, 122–133. [Google Scholar]
  38. Birkeland, P.W.; Birkeland, W.H. Connections in Precast Concrete Construction. J. Am. Concr. Inst. 1966, 63, 345–368. [Google Scholar]
  39. Mattock, A.H.; Hawkins, N.M. Shear Transfer in Reinforced Concrete-Recent Research. PCI J. 1972, 17, 55–75. [Google Scholar] [CrossRef]
  40. Randl, N. Design recommendations for interface shear transfer in fib Model Code 2010. Struct. Concr. 2013, 14, 230–241. [Google Scholar] [CrossRef]
  41. Eurocode 2 (ENV-1992-1-1) Design of Concrete Structures—Part 1-1: General Rules and Rules for Buildings; CEN: Brussels, Belgium, 1992.
Figure 1. Diagram of push-off specimen.
Sustainability 14 07724 g001
Figure 2. Experimental test set up.
Sustainability 14 07724 g002
Figure 3. Load vs. displacement graph of (a) control specimens; (b) specimens without shear ties; (c) specimens with 2 shear ties; and (d) specimens with 3 shear ties.
Sustainability 14 07724 g003aSustainability 14 07724 g003b
Figure 4. Shear stress vs. vertical displacement (slip) plots of (a) control specimens; (b) specimens without shear ties; (c) specimens with 2 shear ties; and (d) specimens with 3 shear ties.
Sustainability 14 07724 g004
Figure 5. Failure pattern of control specimens.
Sustainability 14 07724 g005
Figure 6. Failure pattern of specimens without shear ties at interface.
Sustainability 14 07724 g006
Figure 7. Failure pattern of specimens with 2 shear ties at interface.
Sustainability 14 07724 g007
Figure 8. Failure pattern of specimens with 3 shear ties at interface.
Sustainability 14 07724 g008
Figure 9. Plot of correction factor (FS) and Vu(ex)/Vu(th).
Sustainability 14 07724 g009
Figure 10. Comparison of experimental and predicted values of interface shear strength.
Sustainability 14 07724 g010
Table 1. Chemical composition of source materials for TGPC.
Components (Weight in %)Fly AshGGBSRice Husk Ash
Silica (SiO2)55.3632.4983.60
Iron (Fe2O3)9.740.680.60
Alumina (Al2O3)27.7520.863.84
Calcium oxide (CaO)1.0737.041.80
Magnesium oxide (MgO)4.317.821.28
Potassium oxide (K2O)2.55-0.30
Titanium dioxide (TiO2)3.54--
Sodium oxide (Na2O)--0.20
Sulphur (S)-0.98-
Manganese (Mn)-0.11-
Chloride (Cl)-0.012-
Table 2. Properties of aggregates.
Type of AggregateProperties
Fine aggregate (M sand)Fineness modulus2.85
Specific Gravity2.66
Water absorption0.75%
Grading zoneII
Coarse aggregateFineness modulus6.2
Specific gravity2.75
Water absorption0.50%
Aggregate crushing value36%
Table 3. Mix proportion of TGPC and HSC.
Type of ConcreteMaterialsQuantity (kg/m3)
TGPCFly ash266.93
GGBS123.20
RHA20.53
Fine aggregate848.55
Coarse aggregate1096.95
NaOH solution40.89
Na2SiO3 solution102.22
Superplasticizer10.27
Water55
HSCCement430
Fly ash107
Silica fume59.60
Fine aggregate625.30
Coarse aggregate1057
Superplasticizer5.96
Water170.80
Table 4. Experimental test results.
SpecimenVol. Fraction of Fibers (%)No. of Shear TiesUltimate Load (kN)Shear Strength (MPa)
GPC00181.486.3
HSC0183.456.67
GPHSC061.82.25
GPHSC-T33141.765.81
GPHSC-T0-F0.500.50079.952.981
GPHSC-T2-F0.502120.174.37
GPHSC-T3-F0.503195.716.91
GPHSC-T0-F0.750.75085.352.98
GPHSC-T2-F0.752150.634.46
GPHSC-T3-F0.753201.107.1
GPHSC-T0-F11.00064.752.61
GPHSC-T2-F12112.824.2
GPHSC-T3-F13143.235.21
Table 5. Comparison of experimental and theoretical results.
SpecimenVu(ex)Vu(th) (MPa) Vu(ex)/Vu(th)
Birkeland et al.Mattock et al. (1972)Mattock et al. (1976)RandalEurocodeModified Birkeland EquationRatioRatioRatioRatioRatioRatio
iiiiiiivvviviii/iii/iiii/ivi/vi/vii/vii
GPC6.32.984.25.652.142.785.652.121.501.122.942.271.11
HSC6.672.984.26.072.202.935.652.241.591.103.032.281.18
GPHSC2.251.404.25.651.402.782.661.610.540.401.610.810.85
GPHSC-T35.813.446.247.693.324.316.541.690.930.761.751.350.89
GPHSC-T0-F0.502.811.404.25.651.352.782.672.010.670.502.081.011.05
GPHSC-T2-F0.504.372.285.086.532.203.444.341.920.860.671.981.271.01
GPHSC-T3-F0.506.913.446.247.693.324.316.542.011.110.902.081.611.06
GPHSC-T0-F0.752.981.404.25.651.352.782.672.130.710.532.201.071.12
GPHSC-T2-F0.754.462.285.086.532.203.444.341.960.880.682.021.301.03
GPHSC-T3-F0.757.13.446.247.693.324.316.552.061.140.922.141.651.08
GPHSC-T0-F12.611.404.25.651.352.782.681.860.620.461.930.940.98
GPHSC-T2-F14.22.285.086.532.203.444.351.840.830.641.911.220.97
GPHSC-T3-F15.213.446.247.693.324.316.551.510.830.681.571.210.80
Mean1.920.940.722.101.381.01
Standard Deviation0.210.320.230.440.460.11
Coefficient of Variation (%)11.1434.0632.1821.0433.2210.8
Publisher’s Note: MDPI stays neutral with regard to jurisdictional claims in published maps and institutional affiliations.