
Impact of Urban Spatial Transformation on the Mobility of Commuters with Different Transportation Modes in China: Evidence from Kunming 2011–2016

Abstract
:1. Introduction
2. Literature Review
2.1. Space–Time Impacts of Individual Mobility
2.2. Mobility and Transport-Related Social Exclusion
3. Data and Methods
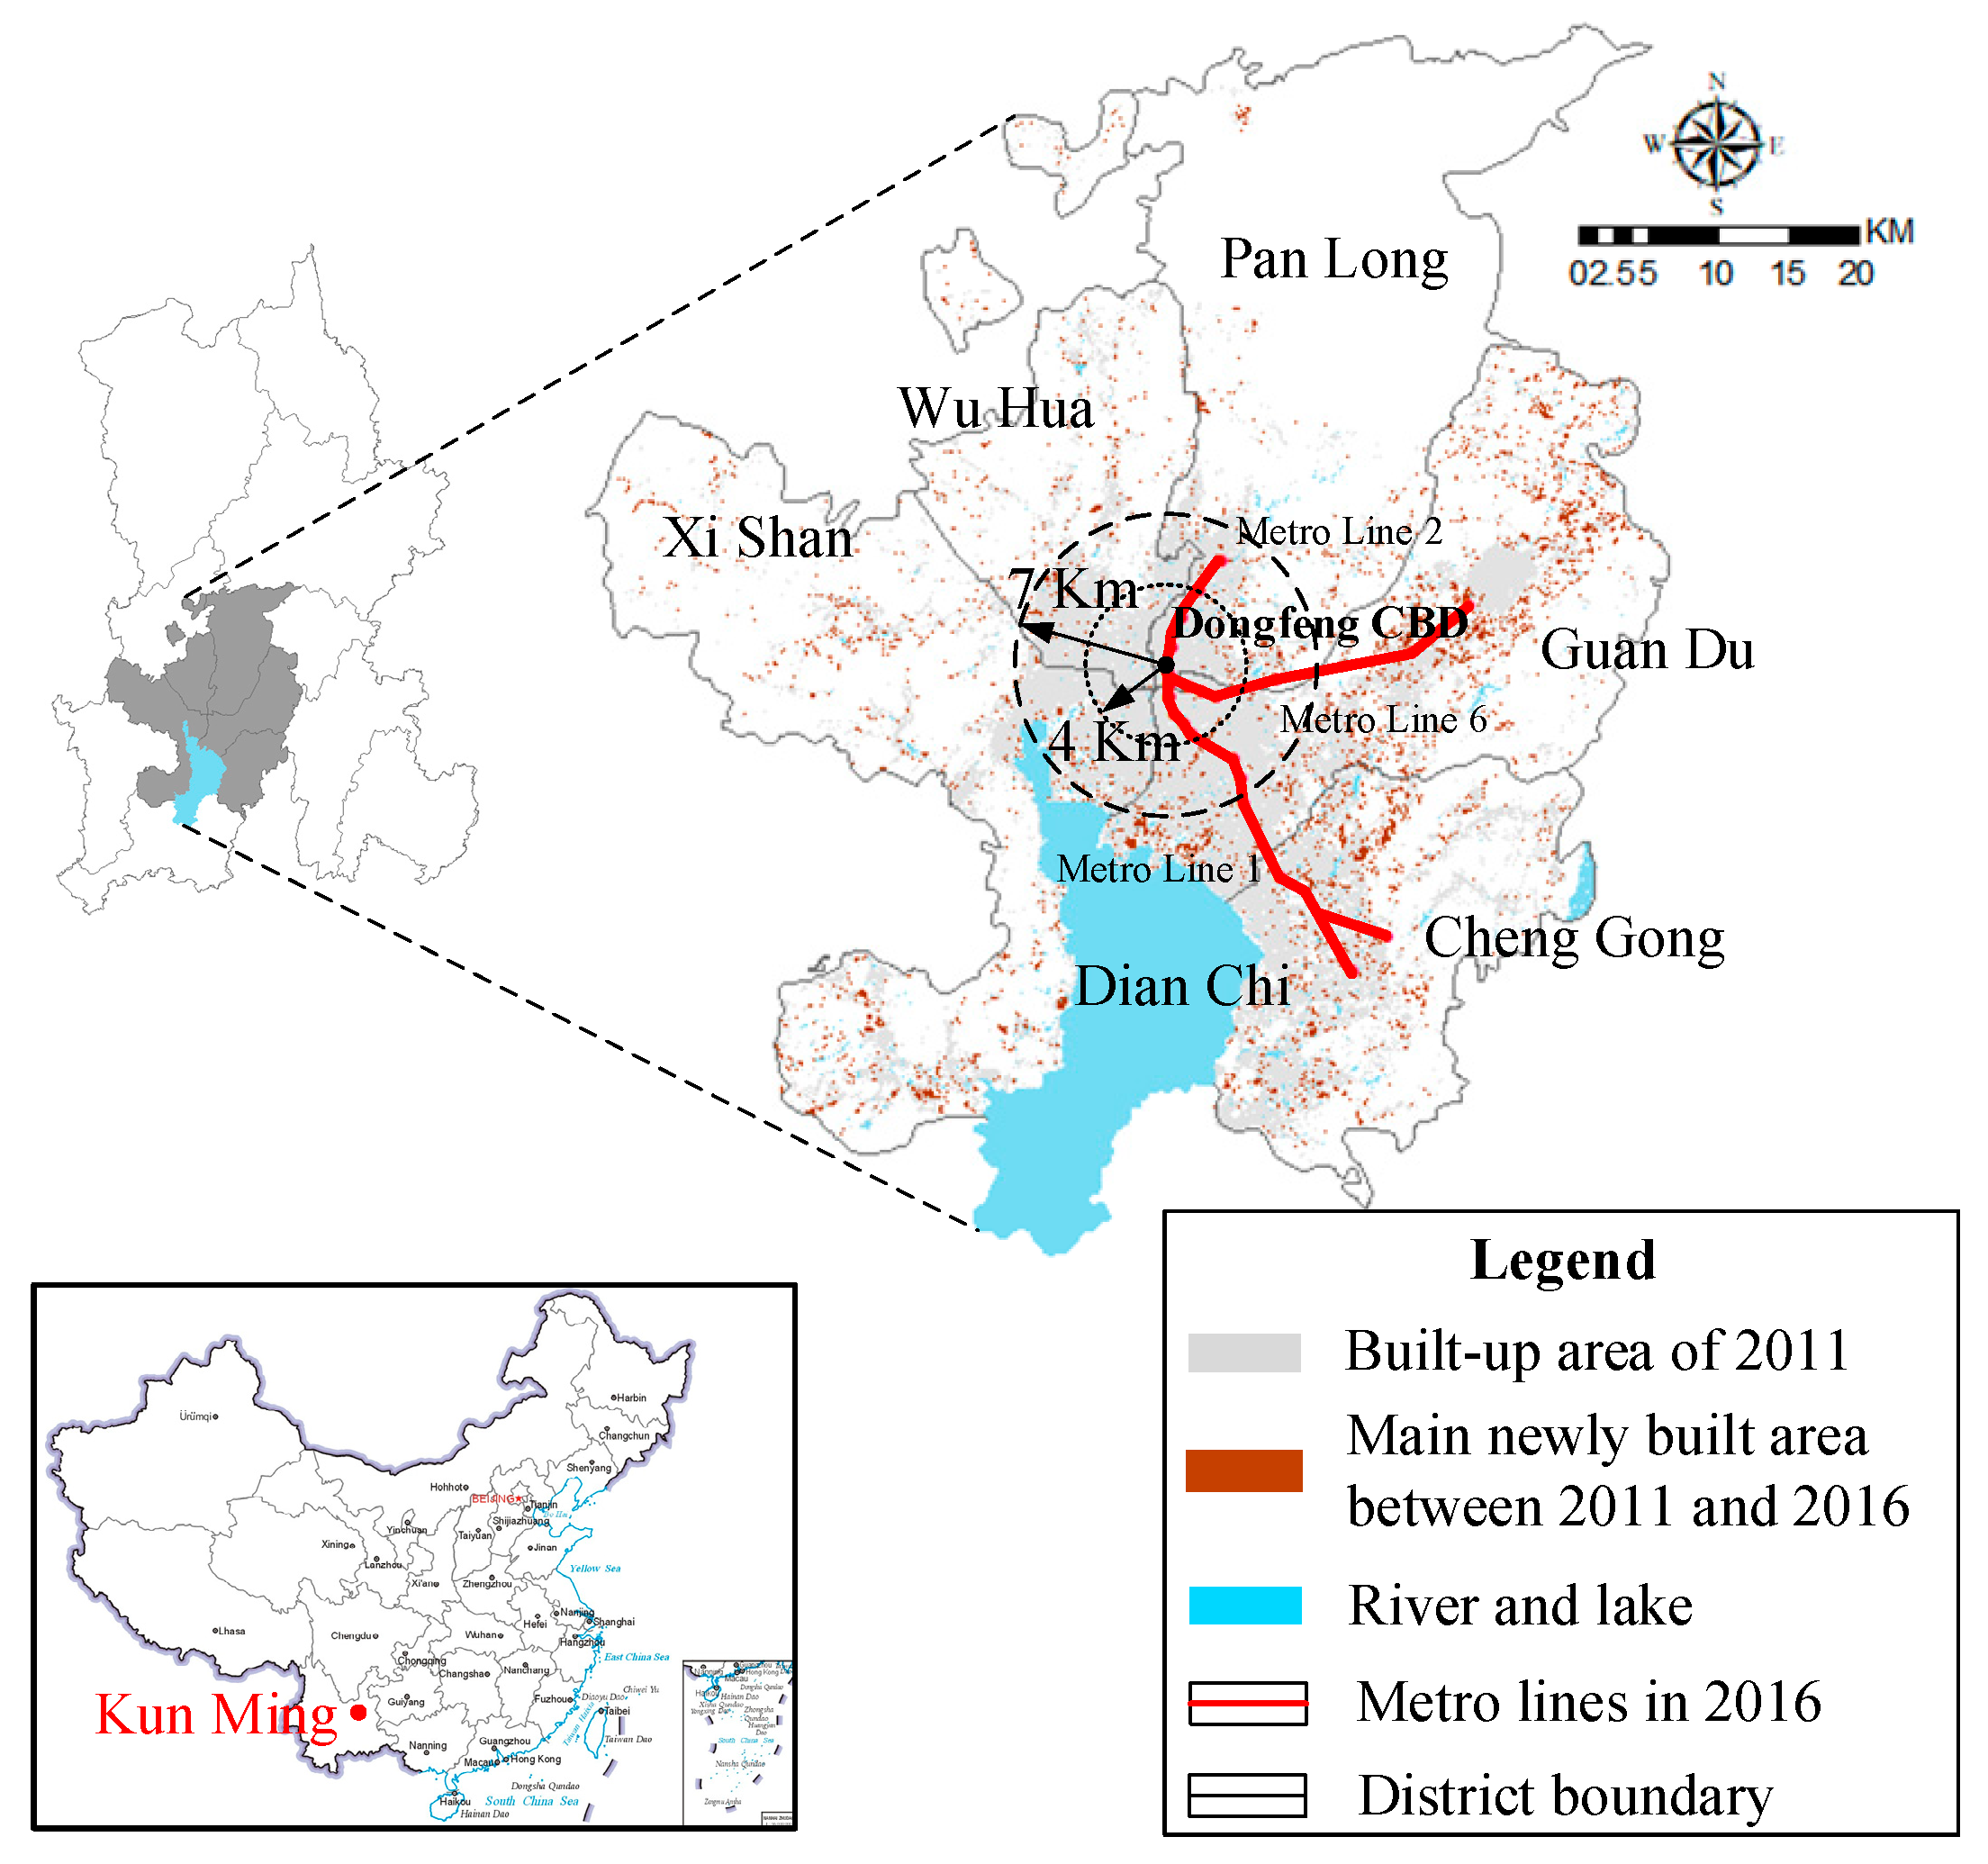
3.1. Study Area and Data
3.2. Methods
3.2.1. Activity Classification
3.2.2. Propensity Score Matching
3.2.3. Multinomial Logit Model
4. Descriptive Analyses
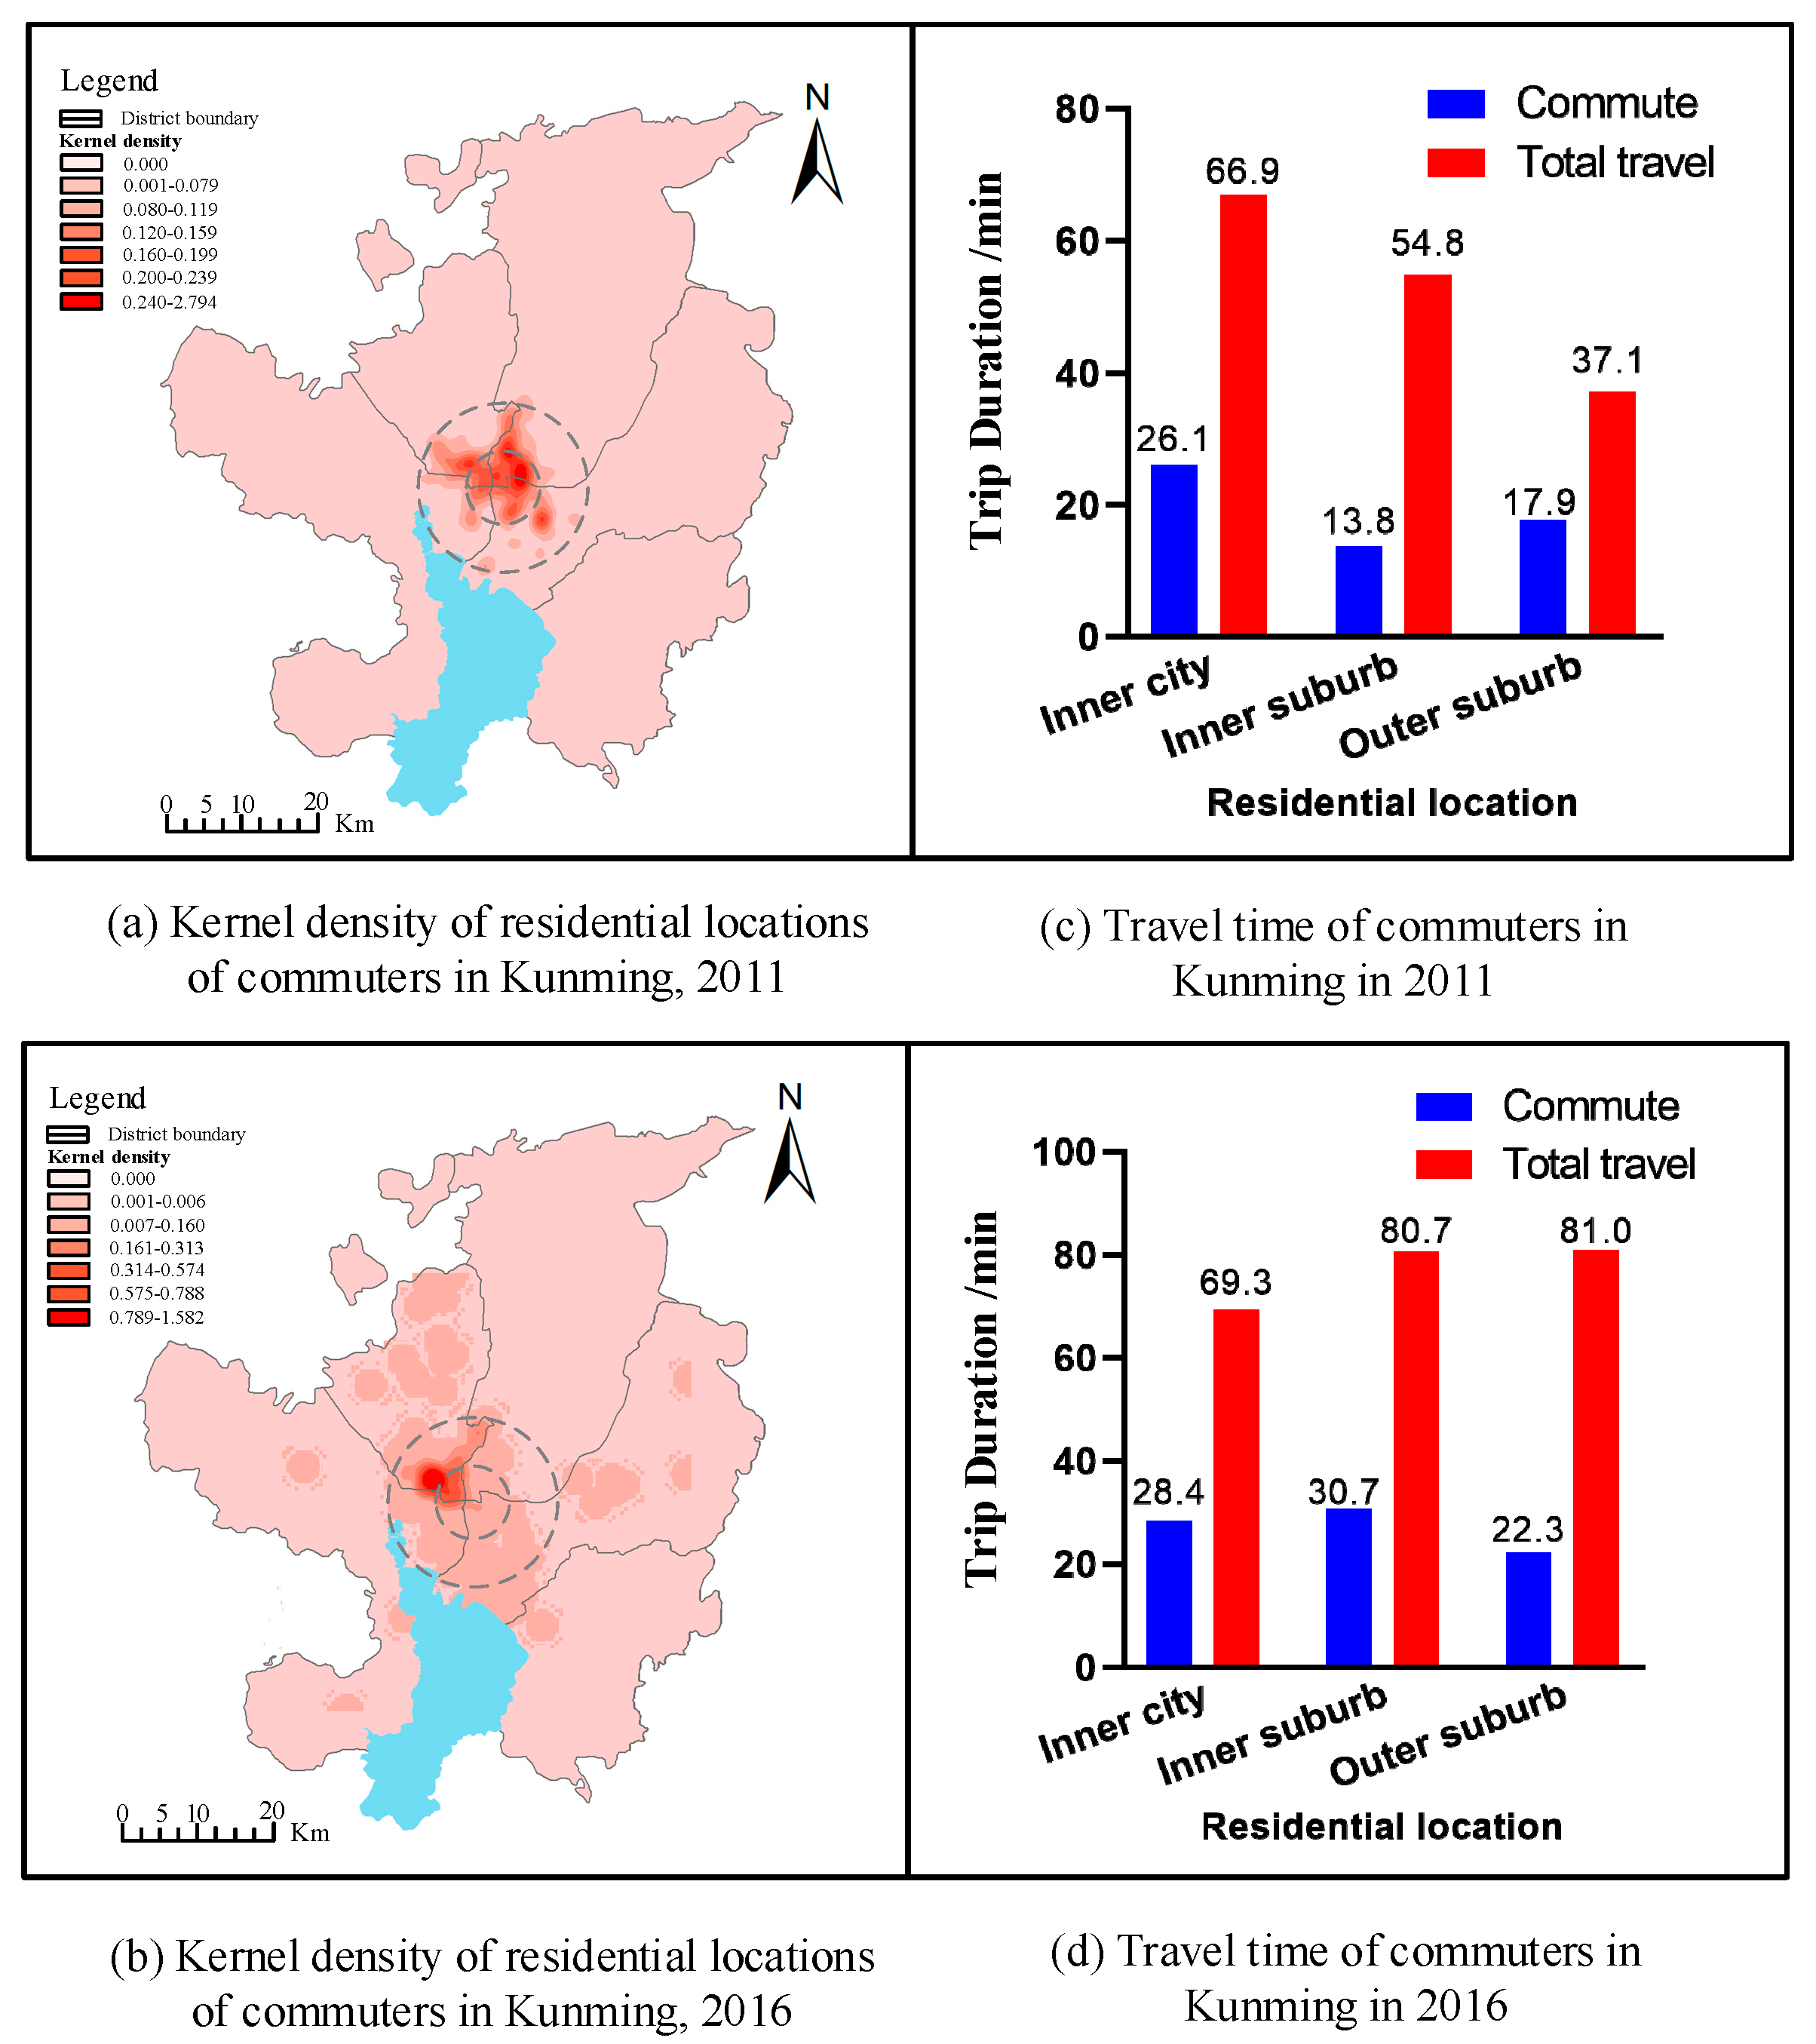
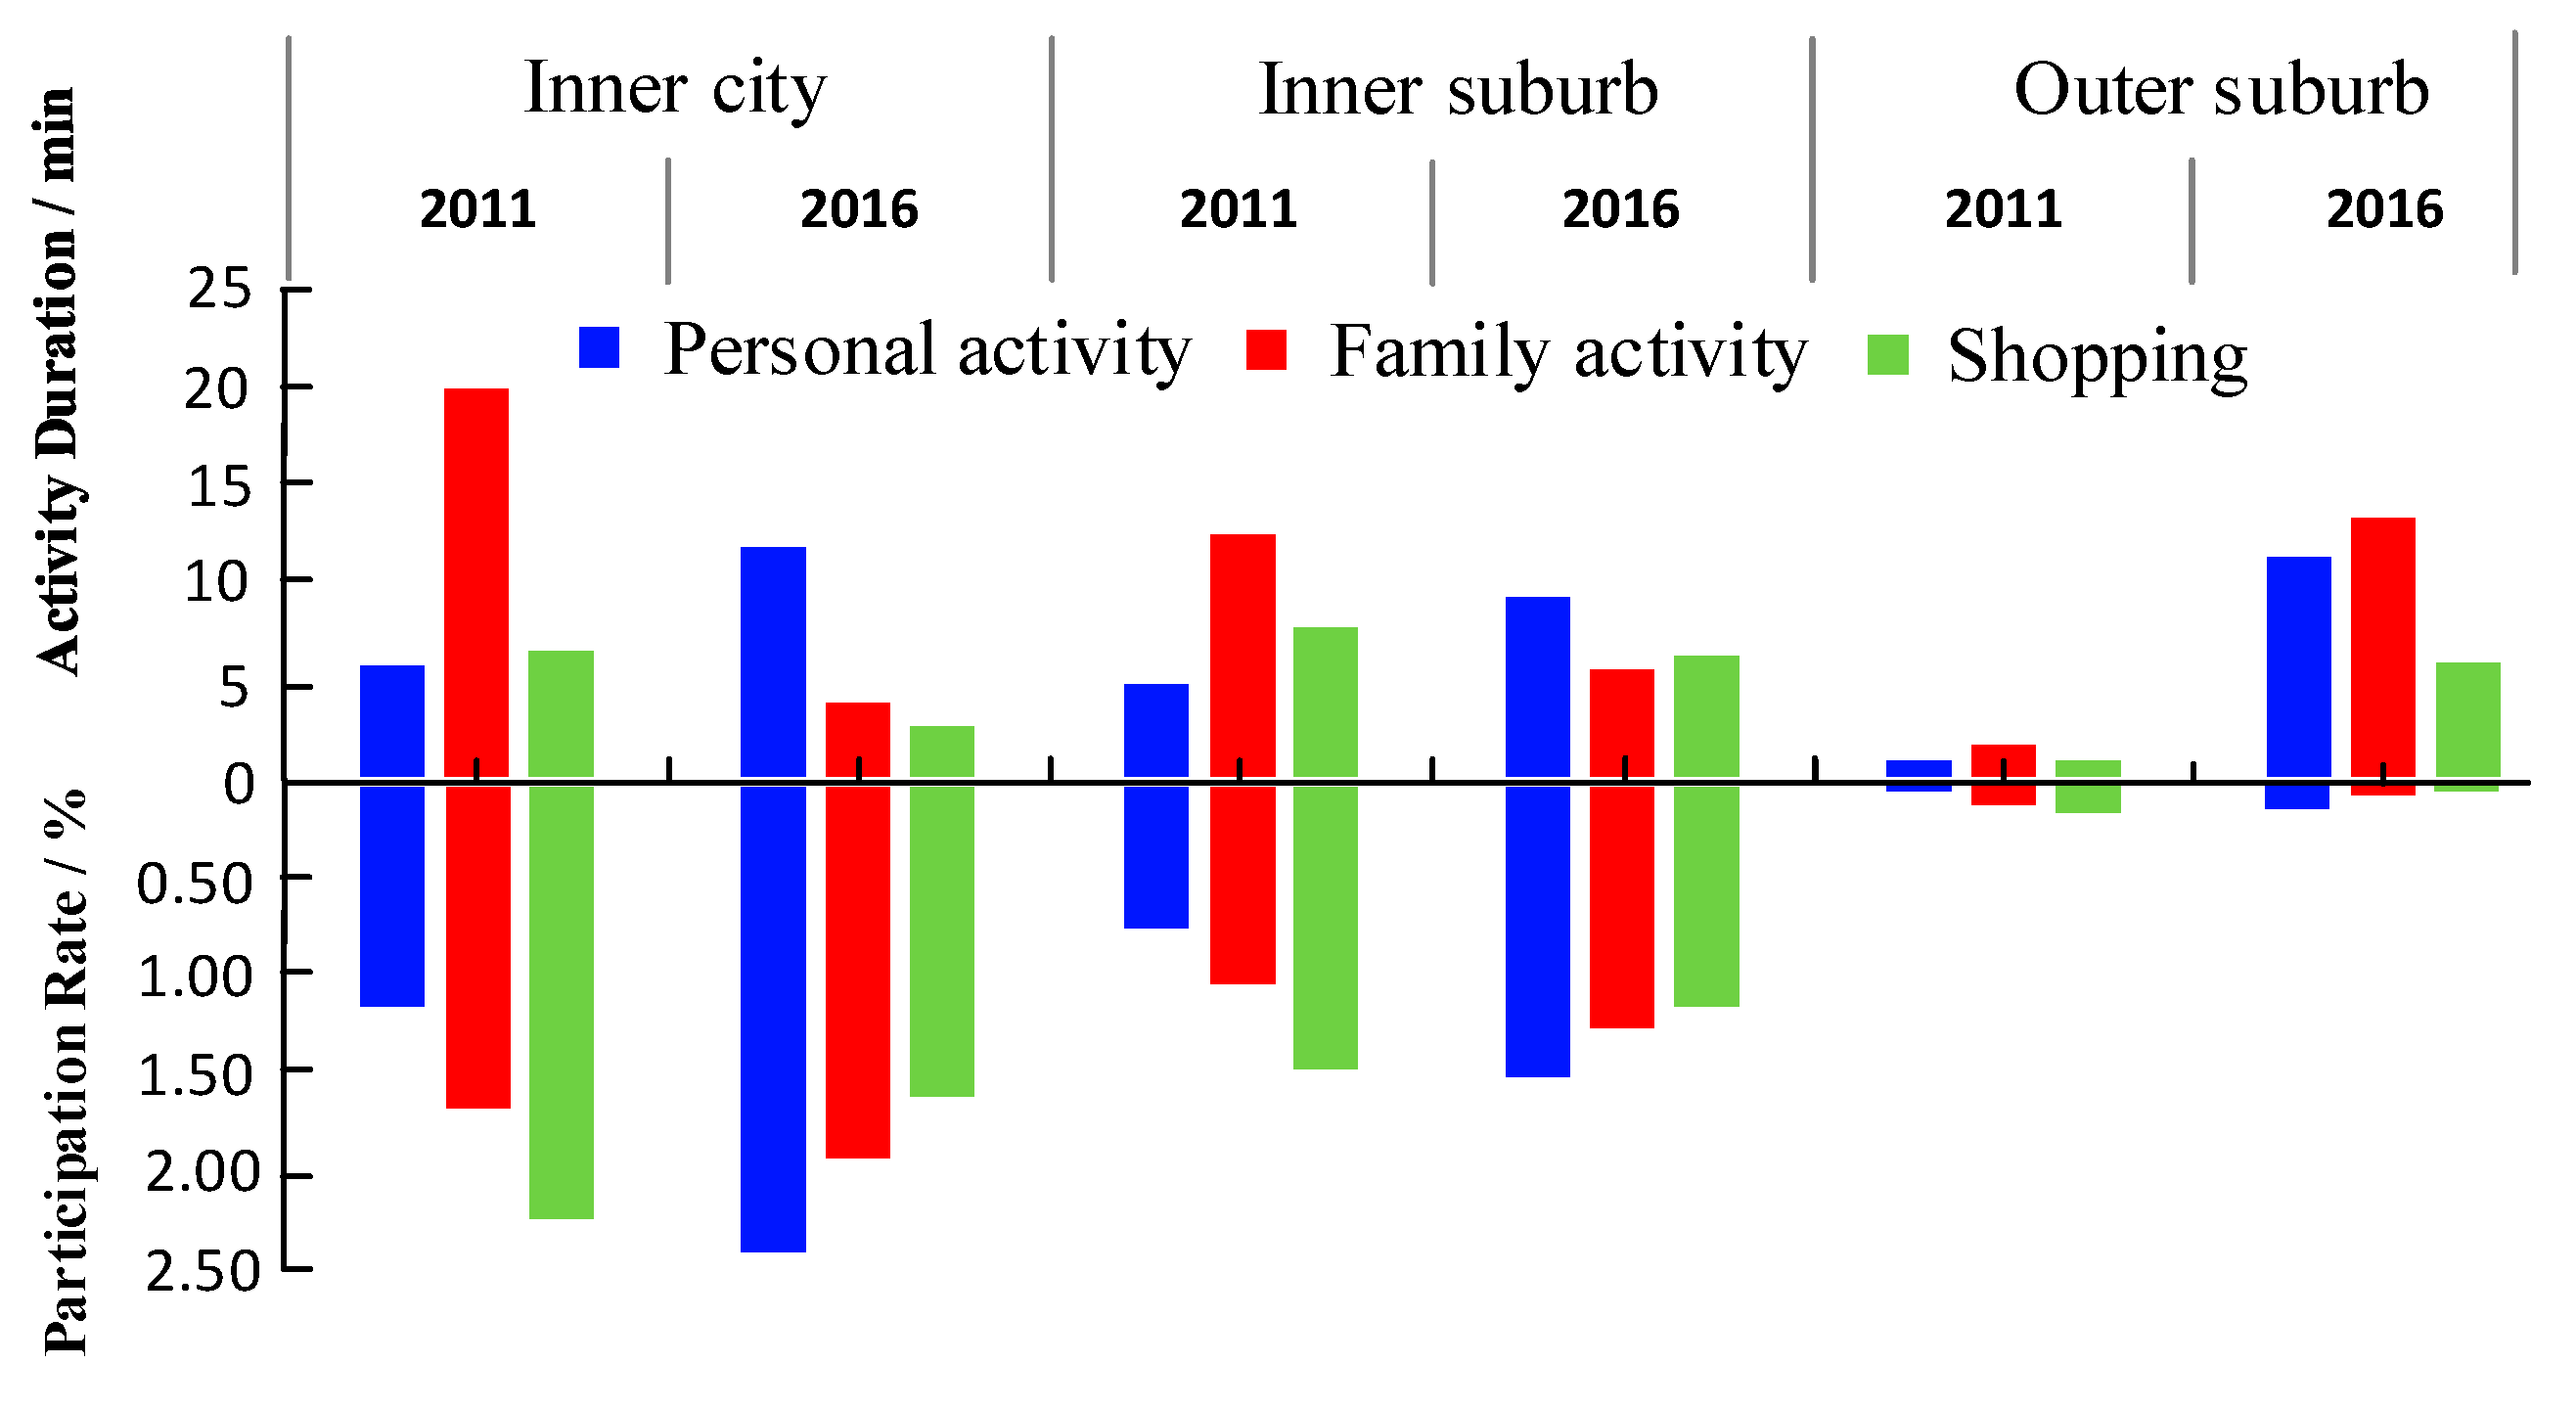
4.1. Residential Location and Mobility Changes of Commuters
4.2. Travel Patterns and Mobility Changes of Commuters
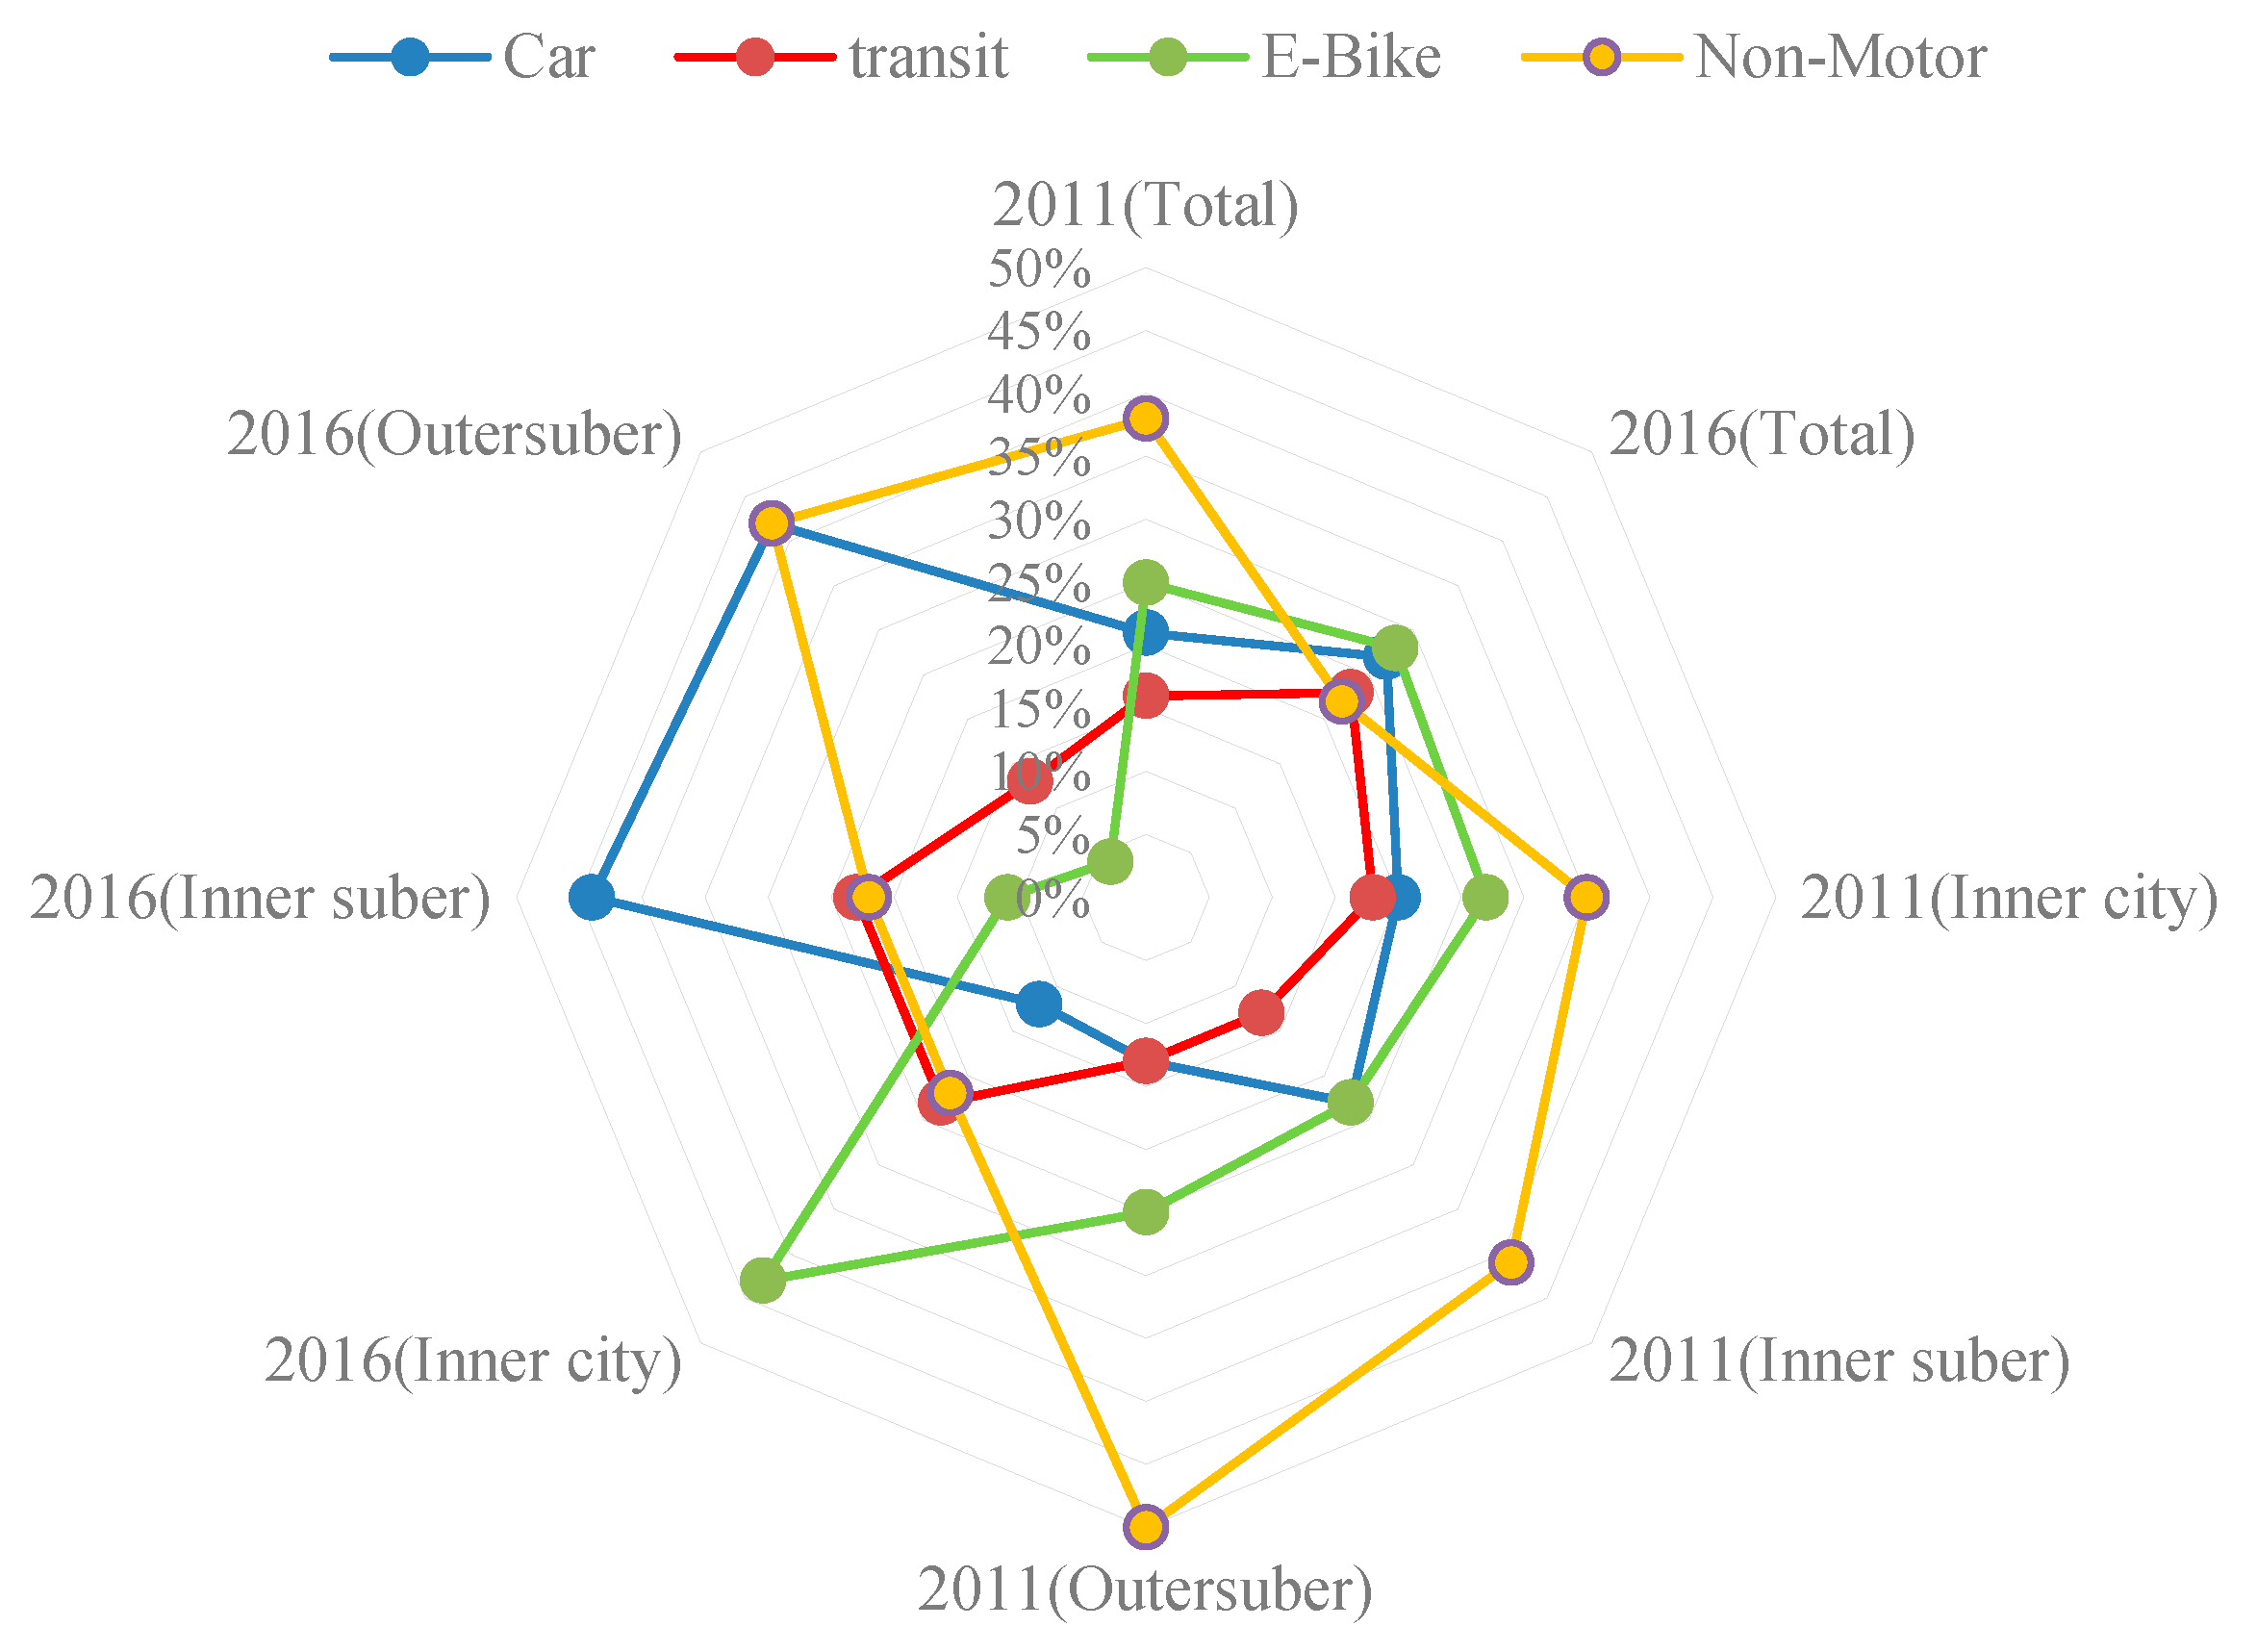
4.2.1. Choice of Transportation Mode
4.2.2. Comparison of Time Use among Groups of Different Travel Modes
5. Modeling and Results
6. Discussion and Policy Implications
7. Conclusions
Author Contributions
Funding
Data Availability Statement
Conflicts of Interest
References
- Pojani, D.; Stead, D. The Urban Transport Crisis in Emerging Economies, 1st ed.; Springer: Cham, Switzerland, 2017. [Google Scholar]
- Shaojian, W.; Zihan, X.; Rong, W.; Kuishang, F. How does urbanization affect the carbon intensity of human well-being? A global assessment. Appl. Energ. 2022, 312, 118798. [Google Scholar]
- Yigitcanlar, T.; Kamruzzaman, M. Planning, Development and Management of Sustainable Cities.: A Commentary from the Guest Editors. Sustainability 2015, 7, 14677–14688. [Google Scholar] [CrossRef] [Green Version]
- Mitra, S.K.; Saphores, J.-D. How do they get by without cars? An analysis of travel characteristics of carless households in California. Transportation 2019, 47, 2837–2858. [Google Scholar] [CrossRef]
- Wefering, F.R.S.; Bührmann, S. Guidelines-Developing and Implementing a Sustainable Urban Mobility Plan, 1st ed.; Rupprecht Consult-Forschung und Beratung GmbH: Cologne, Germany, 2014. [Google Scholar]
- Becker, U.; Gerike, R.; Böhmer, J. How to Define and Measure Access and Need Satisfaction in Transport, 1st ed.; Dresdner Institut für Verkehr und Umwelt e.V. (DIVU): Dresden, Germany, 2008; pp. 5–24. [Google Scholar]
- Fu, X.-M. How do out-of-home workers spend their daily time? An empirical comparison across five Cities. in china. Travel. Behav. Soc. 2020, 21, 203–213. [Google Scholar] [CrossRef]
- Farber, S.; Páez, A. Running to stay in place: The time-use implications of automobile oriented land-use and travel. J. Transp. Geogr. 2010, 19, 782–793. [Google Scholar] [CrossRef]
- Tianqi, G.; Inhi, K.; Graham, C. The two-wheeled renaissance in China—an empirical review of bicycle, E-bike, and motorbike development. Int. J. Sustain. Transp. 2021, 15, 239–258. [Google Scholar]
- Li, Y.; Chen, Z.; Wang, P. Impact of high-speed rail on urban economic efficiency in China. Transp. Policy 2020, 97, 220–231. [Google Scholar] [CrossRef]
- Ling, Z.; Cherry, C.R.; Yang, H.; Jones, L.R. From e-bike to car: A study on factors influencing motorization of e-bike users across China. Transp. Res. Part D Transp. Environ. 2015, 41, 50–63. [Google Scholar] [CrossRef] [Green Version]
- Chen, C.-F.; Chao, W.-H. Habitual or reasoned? Using the theory of planned behavior, technology acceptance model, and habit to examine switching intentions toward public transit. Transp. Res. Part F Traffic 2010, 14, 128–137. [Google Scholar] [CrossRef]
- Zhang, W.; Zhang, M. Incorporating land use and pricing policies for reducing car dependence: Analytical framework and empirical evidence. Urban. Stud. 2018, 55, 3012–3033. [Google Scholar] [CrossRef]
- Inon, P.; Kelvin, L.; Yu, J.; Justin, D.; Francisco, C.P. On the quality requirements of demand prediction for dynamic public transport. Commun. Transp. Res. 2021, 1, 100008. [Google Scholar]
- Downs, A. Still Stuck in Traffic: Coping with Peak-Hour Traffic Congestion, 1st ed; Brookings Institution Press: Washington, DC, USA, 2005. [Google Scholar]
- Wang, H.; Kwan, M.-P.; Hu, M. Social exclusion and accessibility among low- and non-low-income groups: A case study of Nanjing. China Cities 2020, 101, 102684. [Google Scholar] [CrossRef]
- Selim, J.; Ajay, B.; Uddin, H.M.; Shanawez, H.; Marco, H.; Martin, H. When I need to travel, I feel feverish: Everyday experiences of transport inequalities among older adults in Dhaka, Bangladesh. Gerontologist 2021, 62, 493–503. [Google Scholar]
- Ta, N.; Kwan, M.-P.; Shuting, L.; Qiuyu, Z. The activity space-based segregation of migrants in suburban Shanghai. Appl. Geogr. 2021, 133, 102499. [Google Scholar] [CrossRef]
- Kenyon, S.; Lyons, G.; Rafferty, J. Transport and social exclusion: Investigating the possibility of promoting inclusion through virtual mobility. J. Transp. Geogr. 2002, 10, 207–219. [Google Scholar] [CrossRef] [Green Version]
- Adeel, M.; Yeh, A.G.-O.; Zhang, F. Transportation disadvantage and activity participation in the Cities. of Rawalpindi and Islamabad, Pakistan. Transp. Policy 2016, 47, 1–12. [Google Scholar] [CrossRef] [Green Version]
- Susilo, Y.O.; Maat, K. The influence of built environment to the trends in commuting journeys in the Netherlands. Transportation 2007, 34, 589–609. [Google Scholar] [CrossRef]
- de Dios Ortúzar, J. Future transportation: Sustainability, complexity and individualization of choices. Commun. Transp. Res. 2021, 1, e100010. [Google Scholar] [CrossRef]
- Fan, C.C. Restructuring the Chinese City: Changing Society, Economy and Space. Ann. Assoc. Am. Geogr. 2007, 97, 221–222. [Google Scholar] [CrossRef]
- Pojani, D.; Stead, D. Sustainable Urban Transport in the Developing World: Beyond MegaCities. Sustainability 2015, 7, 7784–7805. [Google Scholar] [CrossRef] [Green Version]
- Chapin, F.S. Activity Systems and Urban Structure: A Working Schema. J. Am. Plann. Assoc. 1968, 34, 11–18. [Google Scholar] [CrossRef]
- Torsten, H. What about people in regional science? Pap. Reg. Sci. Assoc. 1970, 24, 6–21. [Google Scholar]
- Pred, A. The choreography of existence: Comments on Hägerstrand’s time-geography and its usefulness. Econ. Geogr. 1997, 53, 207–221. [Google Scholar] [CrossRef]
- Newsome, T.H.; Walcott, W.A.; Smith, P.D. Urban activity spaces: Illustrations and application of a conceptual model for integrating the time and space dimensions. Transportation 1998, 25, 357–377. [Google Scholar] [CrossRef]
- Schwanen, T.; Kwan, M.-P.; Ren, F. How fixed is fixed? Gendered rigidity of space–time constraints and geographies of everyday activities. Geoforum 2008, 39, 2109–2121. [Google Scholar] [CrossRef]
- Kuppam, A.R.; Pendyala, R.M. A structural equations analysis of commuters activity and travel patterns. Transportation 2001, 28, 33–54. [Google Scholar] [CrossRef]
- Krizek, K.J. Residential Relocation and Changes in Urban Travel: Does Neighborhood-Scale Urban Form Matter? J. Am. Plann. Assoc. 2003, 69, 265–281. [Google Scholar] [CrossRef]
- Dharmowijoyo, D.B.E.; Susilo, Y.O.; Karlström, A. Relationships among discretionary activity duration, its travel time spent and activity space indices in the Jakarta Metropolitan Area, Indonesia. J. Transp. Geogr. 2016, 54, 148–160. [Google Scholar] [CrossRef]
- Wang, D.; Chai, Y.; Li, F. Built environment diversities and activity–travel behaviour variations in Beijing, China. J. Transp. Geogr. 2011, 19, 1173–1186. [Google Scholar] [CrossRef]
- Department for Transport. Social Inclusion: Transport Aspects (final report); Department for Transport: London, UK, 2006.
- Burchardt, T.; Grand, J.L.; Piachaud, D. Social exclusion in britain 1991–1995. Soc. Policy Adm. 1999, 33, 227–244. [Google Scholar] [CrossRef]
- Burchardt, T.; Grand, J.L.; Piachaud, D. Introduction. In Understanding Social Exclusion; Hills, J., Grand, J.L., Piachaud, D., Eds.; Oxford University Press: Oxford, UK, 2002; pp. 1–12. [Google Scholar]
- Atkinson, R. Combating social exclusion in europe: The new urban policy challenge. Urban Stud. 2000, 37, 1037–1055. [Google Scholar] [CrossRef]
- Brennan, A.; Rhodes, J.; Tyler, P. The nature of local area social exclusion in England and the role of the labour market. Oxf. Rev. Econ. Policy 2000, 16, 129–146. [Google Scholar] [CrossRef]
- Cass, N.; Shove, E.; Urry, J. Social Exclusion, Mobility and Access 1. Sociol. Rev. 2005, 53, 539–555. [Google Scholar] [CrossRef]
- Gu, C.; Liu, J. Urban Sociology; Tsinghua University Press: Beijing, China, 2013; pp. 1196–1205. [Google Scholar]
- Páez, A.; Farber, S. Participation and desire: Leisure activities among Canadian adults with disabilities. Transportation 2012, 39, 1055–1078. [Google Scholar] [CrossRef]
- Kamruzzaman, M.; Yigitcanlar, T.; Yang, J.; Mohamed, M.A. Measures of Transport-Related Social Exclusion: A Critical Review of the Literature. Sustainability 2016, 8, 696. [Google Scholar] [CrossRef] [Green Version]
- Simpson, B. Making the Connections: Final Report on Transport and Social Exclusion. Report by the Social Exclusion Unit 2003. Proc. Inst. Civ. Eng. 2003, 156, 81–83. [Google Scholar] [CrossRef]
- Preston, J.; Rajé, F. Accessibility, mobility and transport-related social exclusion. J. Transp. Geogr. 2006, 15, 151–160. [Google Scholar] [CrossRef]
- Lucas, K. Transport and social exclusion: Where are we now? Transp. Policy 2012, 20, 105–113. [Google Scholar] [CrossRef]
- Dodson, J.; Gleeson, B.; Evans, R.; Sipe, N. Investigating the Social Dimensions of Transport Disadvantage II: From Concepts to Methods through an Empirical Case Study. Urban Policy Res. 2007, 25, 63–89. [Google Scholar] [CrossRef] [Green Version]
- Tan, Y.; Kushairi, R.; Fatih, D. Sustainable Urban and Transport Development for Transportation Disadvantaged: A Review. Open Transp. J. 2010, 4, 1–8. [Google Scholar]
- Church, A.; Frost, M.; Sullivan, K. Transport and social exclusion in London. Transp. Policy 2000, 7, 195–205. [Google Scholar] [CrossRef]
- Turoń, K. Social barriers and transportation social exclusion issues in creating sustainable car-sharing systems. Entrep. Sustain. Issues 2021, 9, 10–22. [Google Scholar]
- Xia, L.; Shen, H.L. Has the Floating Population Really Integrated Into the Society?—Research on Social Integration of Floating Population Based on Structural Equation Model. Popul. Dev. 2022, 28, 138–151. [Google Scholar]
- Burchardt, T.; Grand, J.L.; Piachaud, D. Degrees of exclusion: Developing a dynamic, multi-dimensional measure. In Understanding Social Exclusion; Hills, J., Grand, J.L., Piachaud, D., Eds.; Oxford University Press: Oxford, UK, 2002; pp. 30–43. [Google Scholar]
- Hine, J.; Mitchell, F. Transport Disadvantage and Social Exclusion: Exclusionary Mechanisms in Transport in Urban Scotland; Ashgate: Hampshire, UK, 2003. [Google Scholar]
- Currie, G.; Stanley, J. Investigating links between social capital and public transport. Transp. Rev. 2008, 28, 529–547. [Google Scholar] [CrossRef]
- Hine, J.; Mitchell, F. The Role of Transport in Social Exclusion in Urban Scotland; Scottish Executive Central Research Unit: Edinburgh, UK, 2001.
- Bantis, T.; Haworth, J. Assessing transport related social exclusion using a capabilities approach to accessibility framework: A dynamic Bayesian network approach. J. Transp. Geogr. 2020, 84, 102673. [Google Scholar] [CrossRef]
- Social Exclusion Unit (SEU). Making the Connections: Transport and Social Exclusion; Social Exclusion Unit, The Stationery Office: London, UK, 2003.
- Maslow, A.H. A theory of human motivation. Psychol. Rev. 1943, 50, 370–396. [Google Scholar] [CrossRef] [Green Version]
- Chapin, F.S. Free Time Activities and Quality of Urban Life. J. Am. Plann. Assoc. 1971, 37, 411–417. [Google Scholar] [CrossRef]
- Delbosc, A.; Currie, G. The spatial context of transport disadvantage, social exclusion and well-being. J. Transp. Geogr. 2011, 19, 1130–1137. [Google Scholar] [CrossRef]
- He, B.H.; Liang, L.T.; He, M.W.; He, Y. Method for Measuring Residents’ Activity Space Based on Time Geography. J. Transp. Syst. Eng. Inf. Technol. 2020, 20, 113–118. [Google Scholar]
- Currie, G.; Richardson, T.; Smyth, P.; Vella-Brodrick, D.; Hine, J.; Lucas, K.; Stanley, J.; Morris, J.; Kinnear, R.; Stanley, J. Investigating links between transport disadvantage, social exclusion and well-being in Melbourne—Updated results. Res. Transp. Econ. 2010, 29, 287–295. [Google Scholar] [CrossRef]
- Froud, J.; Johal, S.; Leaver, A.; Williams, K. Not Enough Money: The Resources and Choices of the Motoring Poor. Compet. Change 2002, 6, 95–111. [Google Scholar] [CrossRef]
- Morris, E.A.; Blumenberg, E.; Guerra, E. Does lacking a car put the brakes on activity participation? Private vehicle access and access to opportunities among low-income adults. Transp. Res. Part A Policy Pract. 2020, 136, 375–397. [Google Scholar] [CrossRef]
- Cherry, C.R.; Yang, H.; Jones, L.R.; He, M. Dynamics of electric bike ownership and use in Kunming, China. Transp. Policy 2016, 45, 127–135. [Google Scholar] [CrossRef] [Green Version]
- Liu, T.; Chai, Y. Daily life circle reconstruction: A scheme for sustainable development in urban China. Habitat. Int. 2015, 50, 250–260. [Google Scholar] [CrossRef]
- Wei, L.; Yi, W.; Pengpeng, J.; Zehao, W.; Pengfei, Z. What Kind of Travellers Are Using Carsharing in Beijing? A Study Based on Selective Ensemble Learning. Sustainability 2022, 14, 540. [Google Scholar]
- Power, A. Social Exclusion and Urban Sprawl: Is the Rescue of Cities. Possible? Reg. Stud. 2001, 35, 731–742. [Google Scholar] [CrossRef]
- Gong, L.; Jin, M.; Liu, Q.; Gong, Y.; Liu, Y. Identifying Urban Residents’ Activity Space at Multiple Geographic Scales Using Mobile Phone Data. ISPRS. Int. J. Geo Inf. 2020, 9, 241. [Google Scholar] [CrossRef]
- Tao, S.; He, S.Y.; Kwan, M.-P.; Luo, S. Does low income translate into lower mobility? An investigation of activity space in Hong Kong between 2002 and 2011. J. Transp. Geogr. 2020, 82, 102583. [Google Scholar] [CrossRef]
- Jian, X.; Lang, L. Comments on the utilization of Mann-Whitney U test and Kaplan-Meier method. J. Gynecol. Oncol. 2021, 32, e46. [Google Scholar]
- Ortuzar, J.; Willumsen, L.G. Modelling Transport, 3rd ed.; John Wiley & Sons, Inc.: Hoboken, NJ, USA, 2002; p. 2011. [Google Scholar]
- Feng, J.; Dijst, M.; Wissink, B.; Prillwitz, J. Changing travel behaviour in urban China: Evidence from Nanjing 2008–2011. Transp. Policy 2017, 53, 1–10. [Google Scholar] [CrossRef]
- Dharmowijoyo, D.B.E.; Susilo, Y.O.; Syabri, I. Time use and spatial influence on transport-related social exclusion, and mental and social health. Travel. Behav. Soc. 2020, 21, 24–36. [Google Scholar] [CrossRef]
- Fan, H. Exploration of Intelligent Traffic Control Network Strategy for Large-scale Traffic in Xiongan New Area. J. Phys. Conf. Ser. 2020, 1676, 012213. [Google Scholar] [CrossRef]
- Jia, N.; Zhang, Y.; He, Z.; Li, G. Commuters’ acceptance of and behavior reactions to license plate restriction policy: A case study of Tianjin, China. Transp. Res. Part D Transp. Environ. 2016, 52, 428–440. [Google Scholar] [CrossRef]
- Wu, H.; Wang, L.; Zhang, Z.; Gao, J. Analysis and optimization of 15-minute community life circle based on supply and demand matching: A case study of Shanghai. PLoS ONE 2021, 16, e0256904. [Google Scholar] [CrossRef] [PubMed]
- Lee, J.; He, S.Y.; Sohn, D.W. Potential of converting short car trips to active trips: The role of the built environment in tour-based travel. J. Transp. Health 2017, 7, 134–148. [Google Scholar] [CrossRef]
- Gim, T.-H.T. The relationships between land use measures and travel behavior:a meta-analytic approach. Transp. Plan. Technol. 2013, 36, 413–434. [Google Scholar] [CrossRef]
- Huba, M.; Ferencey, V. New Challenges in E-Mobility Education for Slovakia. In Proceedings of the 2015 13th International Conference on Emerging eLearning Technologies and Applications (ICETA), Stary Smokovec, Slovakia, 26–27 November 2015. [Google Scholar]
- Turoń, K.; Kubik, A.; Chen, F. When, What and How to Teach about Electric Mobility? An Innovative Teaching Concept for All Stages of Education: Lessons from Poland. Energies 2021, 14, 6440. [Google Scholar]
- Chica-Olmo, J.; Lizárraga, C. Effect of Interaction between Distance and Travel Times on Travel Mode Choice when Escorting Children to and from School. J. Urban Plan. Dev. 2022, 148, 05021055. [Google Scholar]
- Almeida, J. Understanding Student Mobility in Europe: An Interdisciplinary Approach; Taylor and Francis: Florence, KY, USA, 2020. [Google Scholar]
- De Vos, J.; Singleton, P.A.; Gärling, T. From attitude to satisfaction: Introducing the travel mode choice cycle. Transport. Rev. 2022, 42, 204–221. [Google Scholar]
- Adom-Asamoah, G.; Asibey, M.O.; Nyarko, S. Rethinking or Affirming the “Affordability” Debate on the Efficiency of Urban Public Transport Usage: Case of Kumasi, Ghana. Transp. Dev. Econ. 2021, 7, 22. [Google Scholar]
- Chan, W.; Ibrahim, W.H.W.; Lo, M.; Suaidi, M.K.; Ha, S.-T. Sustainability of Public Transportation: An Examination of User Behavior to Real-Time GPS Tracking Application. Sustainability 2020, 12, 9541. [Google Scholar]


| 2011 | 2016 | Changes (%) | |
|---|---|---|---|
| Population of Kunming city (ten thousand) | 648.64 | 672.8 | +1.83% |
| Regional GDP (RMB 100 million) | 2510 | 4300 | +26.28% |
| Built-up area (km2) | 298 | 412 | +16.06% |
| Population density (person/km2) | 300.5 | 320 | +3.14% |
| Population density of built-up area (person/km2) | 217.66 | 163.3 | −14.27% |
| Average disposable income (RMB/year) | 21966 | 36739 | +25.16% |
| Car ownership (ten thousand) | 150.8 | 226.8 | +20.13% |
| Number of buses in operation | 4292 | 6397 | +19.69% |
| Length of metro line (km) | 0 | 64.7 | +100.00% |
| Length of road line (km) | 1642 | 1997 | +9.76% |
| Length of urban expressway (km) | 119.0 | 119.2 | +0.17% |
| Motor vehicle parking lot (ten thousand) | 11.0 | 32.3 | +193.64% |
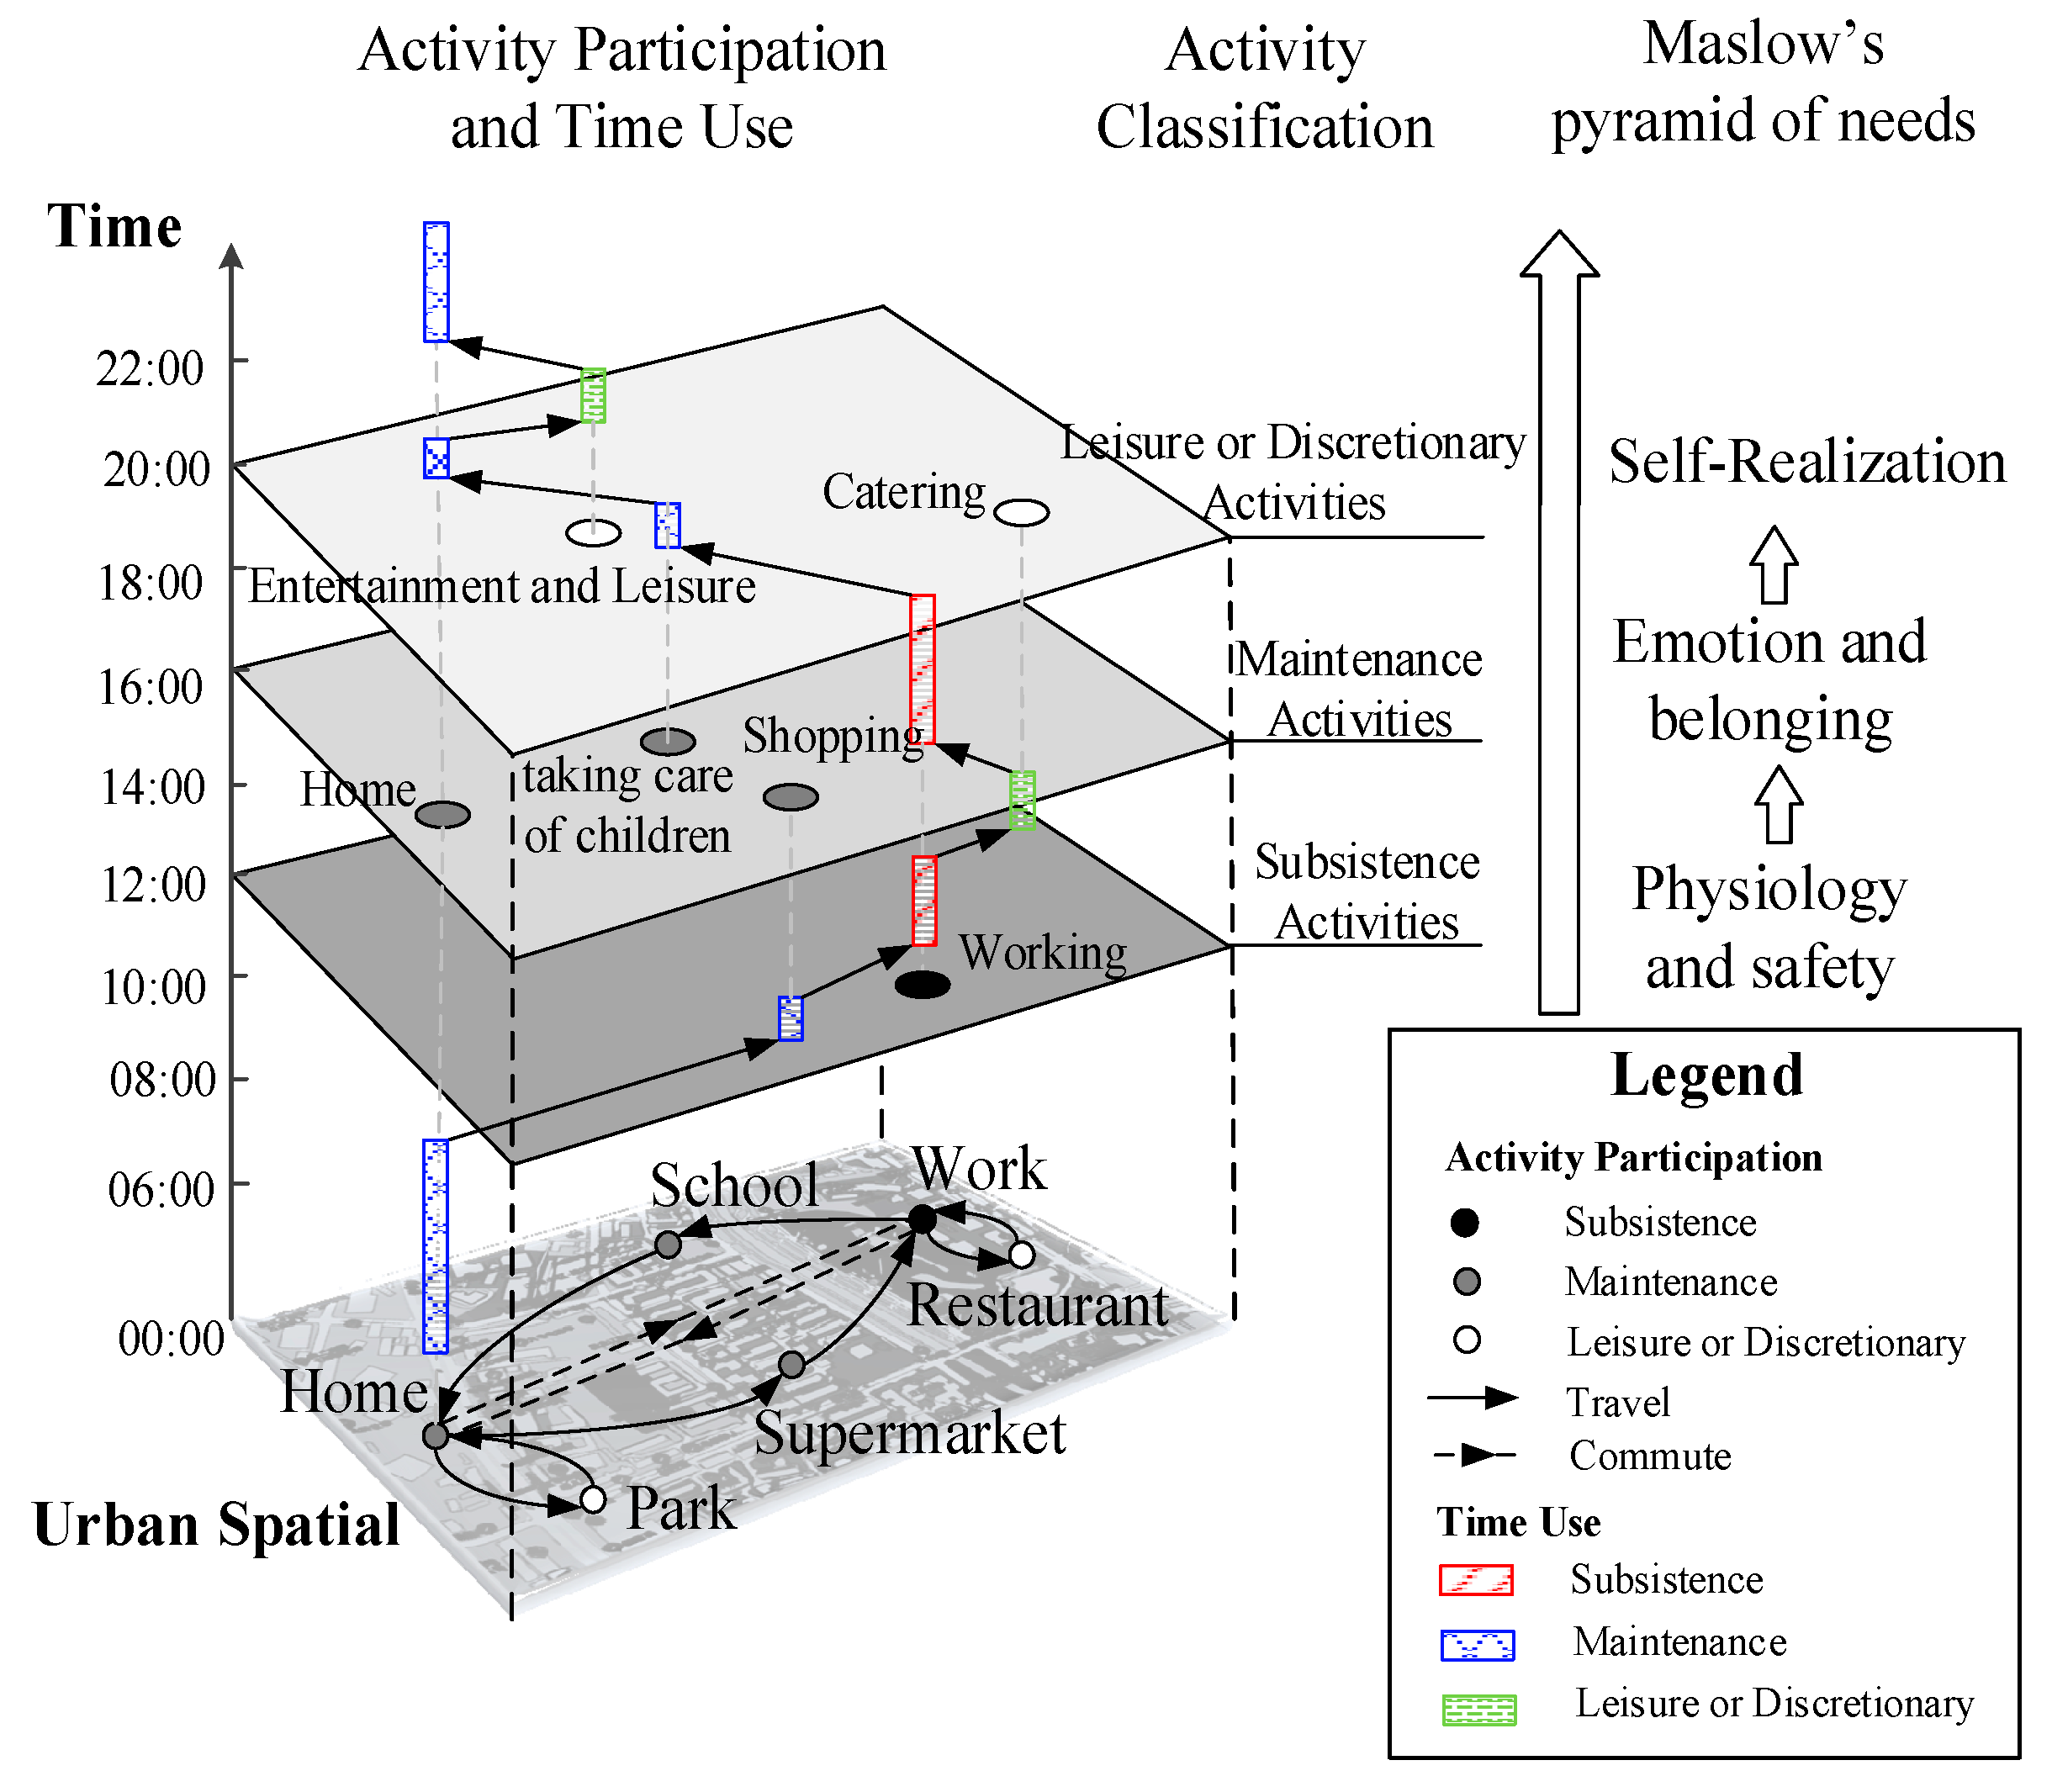
| Activity | Activity Classification | Description |
|---|---|---|
| Transportation | Travel | Actual travel of individuals participating in all activities |
| Commute | Euclidean distance between home and work. It means that the traveler does not participate in other activities, but only participate in work activities | |
| Subsistence Activities | Working | Work and work-related activities (e.g., business) |
| Maintenance activities | Family | Outdoor activities with family (including 4 subcategories: dinner, accompanying the elderly, taking care of children and medical care) |
| Shopping | Shopping alone or with family | |
| Home | All activities at home | |
| Leisure or Discretionary Activities | Personal | Outdoor activities completed alone (including 6 subcategories: catering, personal care, sports, social, entertainment and leisure) |
| 2011 | 2016 | ||
|---|---|---|---|
| (n = 1765) | (n = 1765) | ||
| Age | 18–24 | 2.60% | 3.60% |
| 25–34 | 24.50% | 30.10% | |
| 35–44 | 37.50% | 35.70% | |
| 45–54 | 27.30% | 23.80% | |
| 55 and above | 7.90% | 6.50% | |
| Gender | Male | 52.40% | 51.20% |
| Female | 47.60% | 48.70% | |
| Education level | Low | 6.00% | 2.20% |
| middle | 58.90% | 46.80% | |
| high | 35.00% | 50.90% | |
| Occupation | Freelance | 9.30% | 5.40% |
| Private | 22.90% | 19.60% | |
| Company | 19.30% | 15.90% | |
| Enterprise | 13.10% | 17.70% | |
| Government | 35.20% | 41.00% | |
| Family Size | 1 | 18.00% | 19.80% |
| 2 | 31.60% | 29.90% | |
| 3 | 39.40% | 40.40% | |
| 4 | 7.70% | 6.10% | |
| 5 and above | 3.10% | 3.50% | |
| Family with multiple workers | 70.70% | 67.10% | |
| Family with children under 6 years old | 13.30% | 15.00% | |
| Family with seniors over 60 years old | 10.30% | 20.00% | |
| Family with more than 1 car | 30.10% | 37.40% | |
| Family has its own house | 66.80% | 64.40% | |
| Income | Low | 39.70% | 31.70% |
| Middle | 56.80% | 65.50% | |
| High | 3.30% | 2.60% | |
| Pseudo-R2 of regression = 0.098 | |||
| Car | Transit | E-Bike | Non-Motor | |
|---|---|---|---|---|
| 2011 | ||||
| Travel | 73.49 | 92.12 | 60.83 | 42.53 |
| commute | 29.43 | 42.70 | 24.96 | 14.18 |
| Working | 412.83 | 391.13 | 432.55 | 301.82 |
| Personal | 11.34 | 14.03 | 3.07 | 4.05 |
| Family | 11.33 | 26.37 | 14.71 | 16.34 |
| Shopping | 6.23 | 7.99 | 6.06 | 7.91 |
| Home | 921.11 | 913.66 | 921.09 | 1065.6 |
| 2016 | ||||
| Travel | 88.70 | 86.46 | 64.80 | 57.83 |
| commute | 30.95 | 41.58 | 25.86 | 18.98 |
| Working | 476.12 | 478.86 | 510.3 | 416.24 |
| Personal | 10.7 | 3.89 | 6.21 | 12.34 |
| Family | 7.64 | 3.96 | 1.82 | 6.67 |
| Shopping | 6.15 | 3.64 | 3.22 | 4.65 |
| Home | 848.84 | 850.95 | 852.91 | 941.17 |
| Change | ||||
| Travel | +15.21 *** | −5.66 | +3.96 ** | +15.3 *** |
| commute | +1.51 | −1.12 | +0.86 ** | +4.81 *** |
| Working | +63.29 ** | +87.73 *** | +77.75 *** | +114.42 *** |
| Personal | −0.64 | −10.13 ** | +3.14 ** | +8.28 *** |
| Family | −3.69 ** | −22.4 * | −12.9 | −9.68 |
| Shopping | −0.07 | −4.36 ** | −2.84 | −3.26 |
| Home | −72.28 *** | −62.71 *** | −68.17 ** | −124.42 *** |
| Transit | E-Bike | Non-Motor | ||||
|---|---|---|---|---|---|---|
| Coef. | p | Coef. | p | Coef. | p | |
| Constant | 11.244 | 0.000 *** | 13.226 | 0.000 *** | 14.601 | 0.000 *** |
| (−2.751) | (0.003 **) | (−17.647) | (0.000 ***) | (0.580) | (0.493) | |
| PS | 0.593 | 0.377 | 2.090 | 0.000 *** | 2.127 | 0.000 *** |
| (0.866) | (0.140) | (0.533) | (0.374) | (2.501) | (0.000 ***) | |
| Residential Location (ref. = Outer Suburb) | ||||||
| Inner city | −14.131 | 0.000 *** | −13.891 | 0.000 *** | −13.906 | 0.000 *** |
| (1.676) | (0.001 **) | (19.200) | (0.000 ***) | (1.493) | (0.000 ***) | |
| Inner suburb | −14.524 | 0.000 *** | −14.299 | 0.000 *** | −14.271 | 0.124 |
| (0.399) | (0.415) | (16.579) | (0.210) | (0.216) | (0.554) | |
| Total travel | 0.002 | 0.397 | −0.003 | 0.340 | −0.006 | 0.079 * |
| (−0.005) | (0.002 **) | (−0.004) | (0.007 **) | (−0.008) | (0.000 ***) | |
| Commute | 0.035 | 0.000 *** | −0.017 | 0.001 ** | −0.083 | 0.000 *** |
| (0.040) | (0.000 ***) | (−0.023) | (0.000 ***) | (−0.075) | (0.000 ***) | |
| Subsistence activities | 0.001 | 0.768 | 0.001 | 0.595 | 0.000 | 0.883 |
| (0.000) | (0.648) | (0.001) | (0.224) | (−0.001) | (0.089 *) | |
| Maintenance activities | 0.001 | 0.536 | 0.001 | 0.686 | 0.002 | 0.536 |
| (0.001) | (0.431) | (0.001) | (0.613) | (0.001) | (0.074 *) | |
| Leisure or discretionary activities | −0.003 | 0.342 | −0.004 | 0.197 | −0.003 | 0.287 |
| (−0.001) | (0.376) | (−0.003) | (0.222) | (−0.001) | (0.714) | |
| Cases = 1765 (1765) LR chi2 = 774.524 (918.6) Cox and Snell R2 = 0.355 (0.406) Reference category = Car (Car) | ||||||
Publisher’s Note: MDPI stays neutral with regard to jurisdictional claims in published maps and institutional affiliations. |
© 2022 by the authors. Licensee MDPI, Basel, Switzerland. This article is an open access article distributed under the terms and conditions of the Creative Commons Attribution (CC BY) license (https://creativecommons.org/licenses/by/4.0/).
Share and Cite
Zheng, H.; He, B.; He, M.; Guo, J. Impact of Urban Spatial Transformation on the Mobility of Commuters with Different Transportation Modes in China: Evidence from Kunming 2011–2016. Sustainability 2022, 14, 7672. https://doi.org/10.3390/su14137672
Zheng H, He B, He M, Guo J. Impact of Urban Spatial Transformation on the Mobility of Commuters with Different Transportation Modes in China: Evidence from Kunming 2011–2016. Sustainability. 2022; 14(13):7672. https://doi.org/10.3390/su14137672
Chicago/Turabian StyleZheng, Hui, Baohong He, Mingwei He, and Jinghui Guo. 2022. "Impact of Urban Spatial Transformation on the Mobility of Commuters with Different Transportation Modes in China: Evidence from Kunming 2011–2016" Sustainability 14, no. 13: 7672. https://doi.org/10.3390/su14137672
APA StyleZheng, H., He, B., He, M., & Guo, J. (2022). Impact of Urban Spatial Transformation on the Mobility of Commuters with Different Transportation Modes in China: Evidence from Kunming 2011–2016. Sustainability, 14(13), 7672. https://doi.org/10.3390/su14137672