Article

Sustainable Sand Substitutes in the Construction Industry in the United States and Canada: Assessing Stakeholder Awareness

1
College of Professional Studies, Northeastern University, Toronto, ON M5X IE2, Canada
2
D’Amore-McKim School of Business, Northeastern University, Boston, MA 02115, USA
*
Author to whom correspondence should be addressed.
Sustainability 2022, 14(13), 7674; https://doi.org/10.3390/su14137674
Submission received: 11 May 2022 / Revised: 9 June 2022 / Accepted: 13 June 2022 / Published: 23 June 2022
(This article belongs to the Section Resources and Sustainable Utilization)

Abstract

:
The United Nations has declared a global sand crisis, called for reduced sand consumption, and proposed solutions to address the crisis, including adopting sustainable substitutes for sand. The construction industry is a major consumer of sand, yet a recent study found a very low level of awareness by stakeholders of the crisis. The purpose of this study is to assess the familiarity of construction industry stakeholders with 27 sand substitute materials, grouped into five components that emerged from a factor analysis. Data were collected using a survey designed by the authors. Respondents consisted of 156 construction industry professionals located in 35 US states and 7 Canadian provinces. Stakeholders were classified according to a framework considering the level of power and interest of each stakeholder in sustainable construction projects. Hypotheses of no differences in awareness for two types of stakeholder groups were generally supported. First, no differences were found for decision makers responsible for ordering sand vs. non-decision makers. Second, for professional roles, academics were more familiar with some substitutes than those in other roles. The article concludes with implications for research and practice, with recommendations on how to increase awareness of sand substitutes among stakeholders in the construction industry.

1. Introduction

The construction industry has made substantial progress in recent years toward addressing the environmental impact of construction materials and developing sustainable substitute materials. A primary objective has been to reduce greenhouse gas emissions, and the focus has been on cement and concrete because of the high volume of their use and their significant contributions to climate change. Globally, concrete production contributes about 5–10% to greenhouse gas emissions (GHGs), with 2.1 billion tons annual anthropogenic GHCs, mostly from cement clinker production [1,2]. Concrete is produced at the rate of about 4 billion tons annually (USG, 2014), and cement, the main binder, comprises 10 to 15% of concrete [3]. Recognizing the magnitude of concrete and cement production globally, researchers have developed numerous alternatives to traditional Portland cement. That type of cement has been the industry standard due to its performance characteristics. However, it needs heating to extremely high temperatures, thereby contributing to greenhouse gas emissions [4,5,6,7].
While strides have been made to reduce the impact of concrete and cement on greenhouse gas emissions, another environmental issue appears to have been overlooked in construction, namely the massive consumption of sand by the industry. The demand for sand has been increasing due to population growth, which has been driving a rapid increase in construction and urbanization, making this material the second largest natural resource extracted and traded by volume after water [8]. One striking indicator of this acceleration is the fact that the amount of concrete produced in China in the past decade is equal to that produced in the United States in the past century [9].
Annual global sand consumption is in the range of 32 to 50 billion metric tons [10]. Around 10 billion tons are used in the construction industry, and it is estimated that consumption will nearly double by mid-21st century [11]. Sand is a major ingredient in a wide variety of construction materials, and a number of substitutes have been developed for various applications. Sand contributes 40% of the aggregate used in concrete as well as 25–30% of concrete by volume [3]. Silica, mainly from sand, comprises up to 25% of cement [3]. Mortar consists of 75% sand. Sand is an ingredient in dozens of other building products including glass, ceramics, paints, plastics, rubber, sealants and grouts, adhesives, and resins [12].
The massive consumption of sand is a serious environmental issue for three reasons. First, concrete and many other sand-related products require natural alluvial sand, which is essentially a non-renewable resource. Other types of sand, such as desert sand, lack the appropriate angularity. Alluvial sand is formed over millennia by entering waterways downstream from mountains, or is created by years of wave action on rocky coastlines; thus, it is not easily replenished. Second, sand mining exacerbates the erosion of coasts and riverbanks, as well as the destruction of habitats for human communities as well as flora and fauna. Similarly, sand mined from inland deposits can interfere with aquifers and natural habitats. Third, localized shortages in some parts of the world have given rise to sand mafias in India, Kenya, Morocco, Cambodia, Vietnam, China, and Indonesia. Criminal groups illegally remove sand from rivers and coastlines and sell it on the black market, often to distant construction sites [9,13,14]. Bribery and lax law enforcement perpetuate this criminal activity, and some communities and individuals have been threatened or even killed for attempting to interfere [13,15]. This seemingly insatiable need for alluvial sand has created a global sand crisis. In 2019, the United Nations sounded an urgent call for change by publishing a detailed report on the origins of the crisis, detailing the toll it is taking on the environment and human life, and offering potential solutions [9]. A few other publications, such as in Science [8], have also addressed the subject, typically from a climate change perspective.
Over the past several decades, numerous efforts have been made to develop sustainable alternatives to traditional sand. Applications include normal concrete, road construction, and structural and non-structural applications [16,17,18,19,20].
In early studies, sand replacement in concrete was tested using a variety of materials including rubber, glass, slag, iron, ashes, plastic crushed concrete, artificial sand, quarry waste, brick waste, and biodegradable waste [21]. When compared to control concrete (without replacing fine aggregate), a variety of industrial byproducts seem to increase the strength of concrete. Such industrial wastes have also been used for decades as a partial replacement for cement. For example, copper slag, a byproduct from copper matte smelting and refining [22], has been widely used in cement clinker production and blended cement [23]. Construction and demolition (C&D) materials are generated from renovation or deconstruction activities [24]. Agricultural waste materials include sugarcane bagasse ash, groundnut shell, oyster shell, sawdust, giant reed ash, rice husk ash, cork, and tobacco waste [25]. They have been used in concrete as replacement alternatives for cement and aggregates as well as in landfills. Some materials are in the early stages of commercialization, such as hempcrete used for building houses [26]. Some materials are in the research and development stage, including building blocks made of sea salt as well as engineered living building materials (such as cyanobacterial bricks that use biology for the built environment) [27]. This technology is still in its infancy, but represents an exciting frontier in construction material manufacturing [28]. Finally, some sand substitutes have been developed, not to reduce the use of sand, but to reduce greenhouse gas emissions. For example, the technology developed by Carbon Cure is able to convert carbon dioxide into a mineral that makes the concrete stronger [29]. Table 1 provides a summary on a variety of sand substitutes, including a description and typical uses, along with key references from the literature.
Despite the extensive use of sand in construction, it is unclear how well known these substitutes are among industry professionals. This issue has received limited attention in the literature, and much of the work in this area is still limited to the development of new and more sustainable building materials with little attention paid to the end-user perspectives and knowledge of the proposed materials. This is where the novelty of our work lies.
With the importance of building awareness among key stakeholders in the construction industry and its impact on sustainability initiatives in this sector, the main objectives of this research are to:
  • Identify promising materials that can be used as sand replacement in the construction industry;
  • Determine the level of awareness of a variety of sand substitutes among key stakeholders in the construction industry in the United States and Canada;
  • Determine how the role and involvement of key stakeholders in construction projects can affect their level of knowledge of available sand substitutes.
The rest of this manuscript is structured as follows. First, we present the theoretical background used for stakeholder analysis and hypothesis generation in this study. Next, we explain the detailed research methodology, followed by the results and discussion of the implications of the findings. We conclude by summarizing the important findings and proposing future research avenues.

2. Theoretical Background

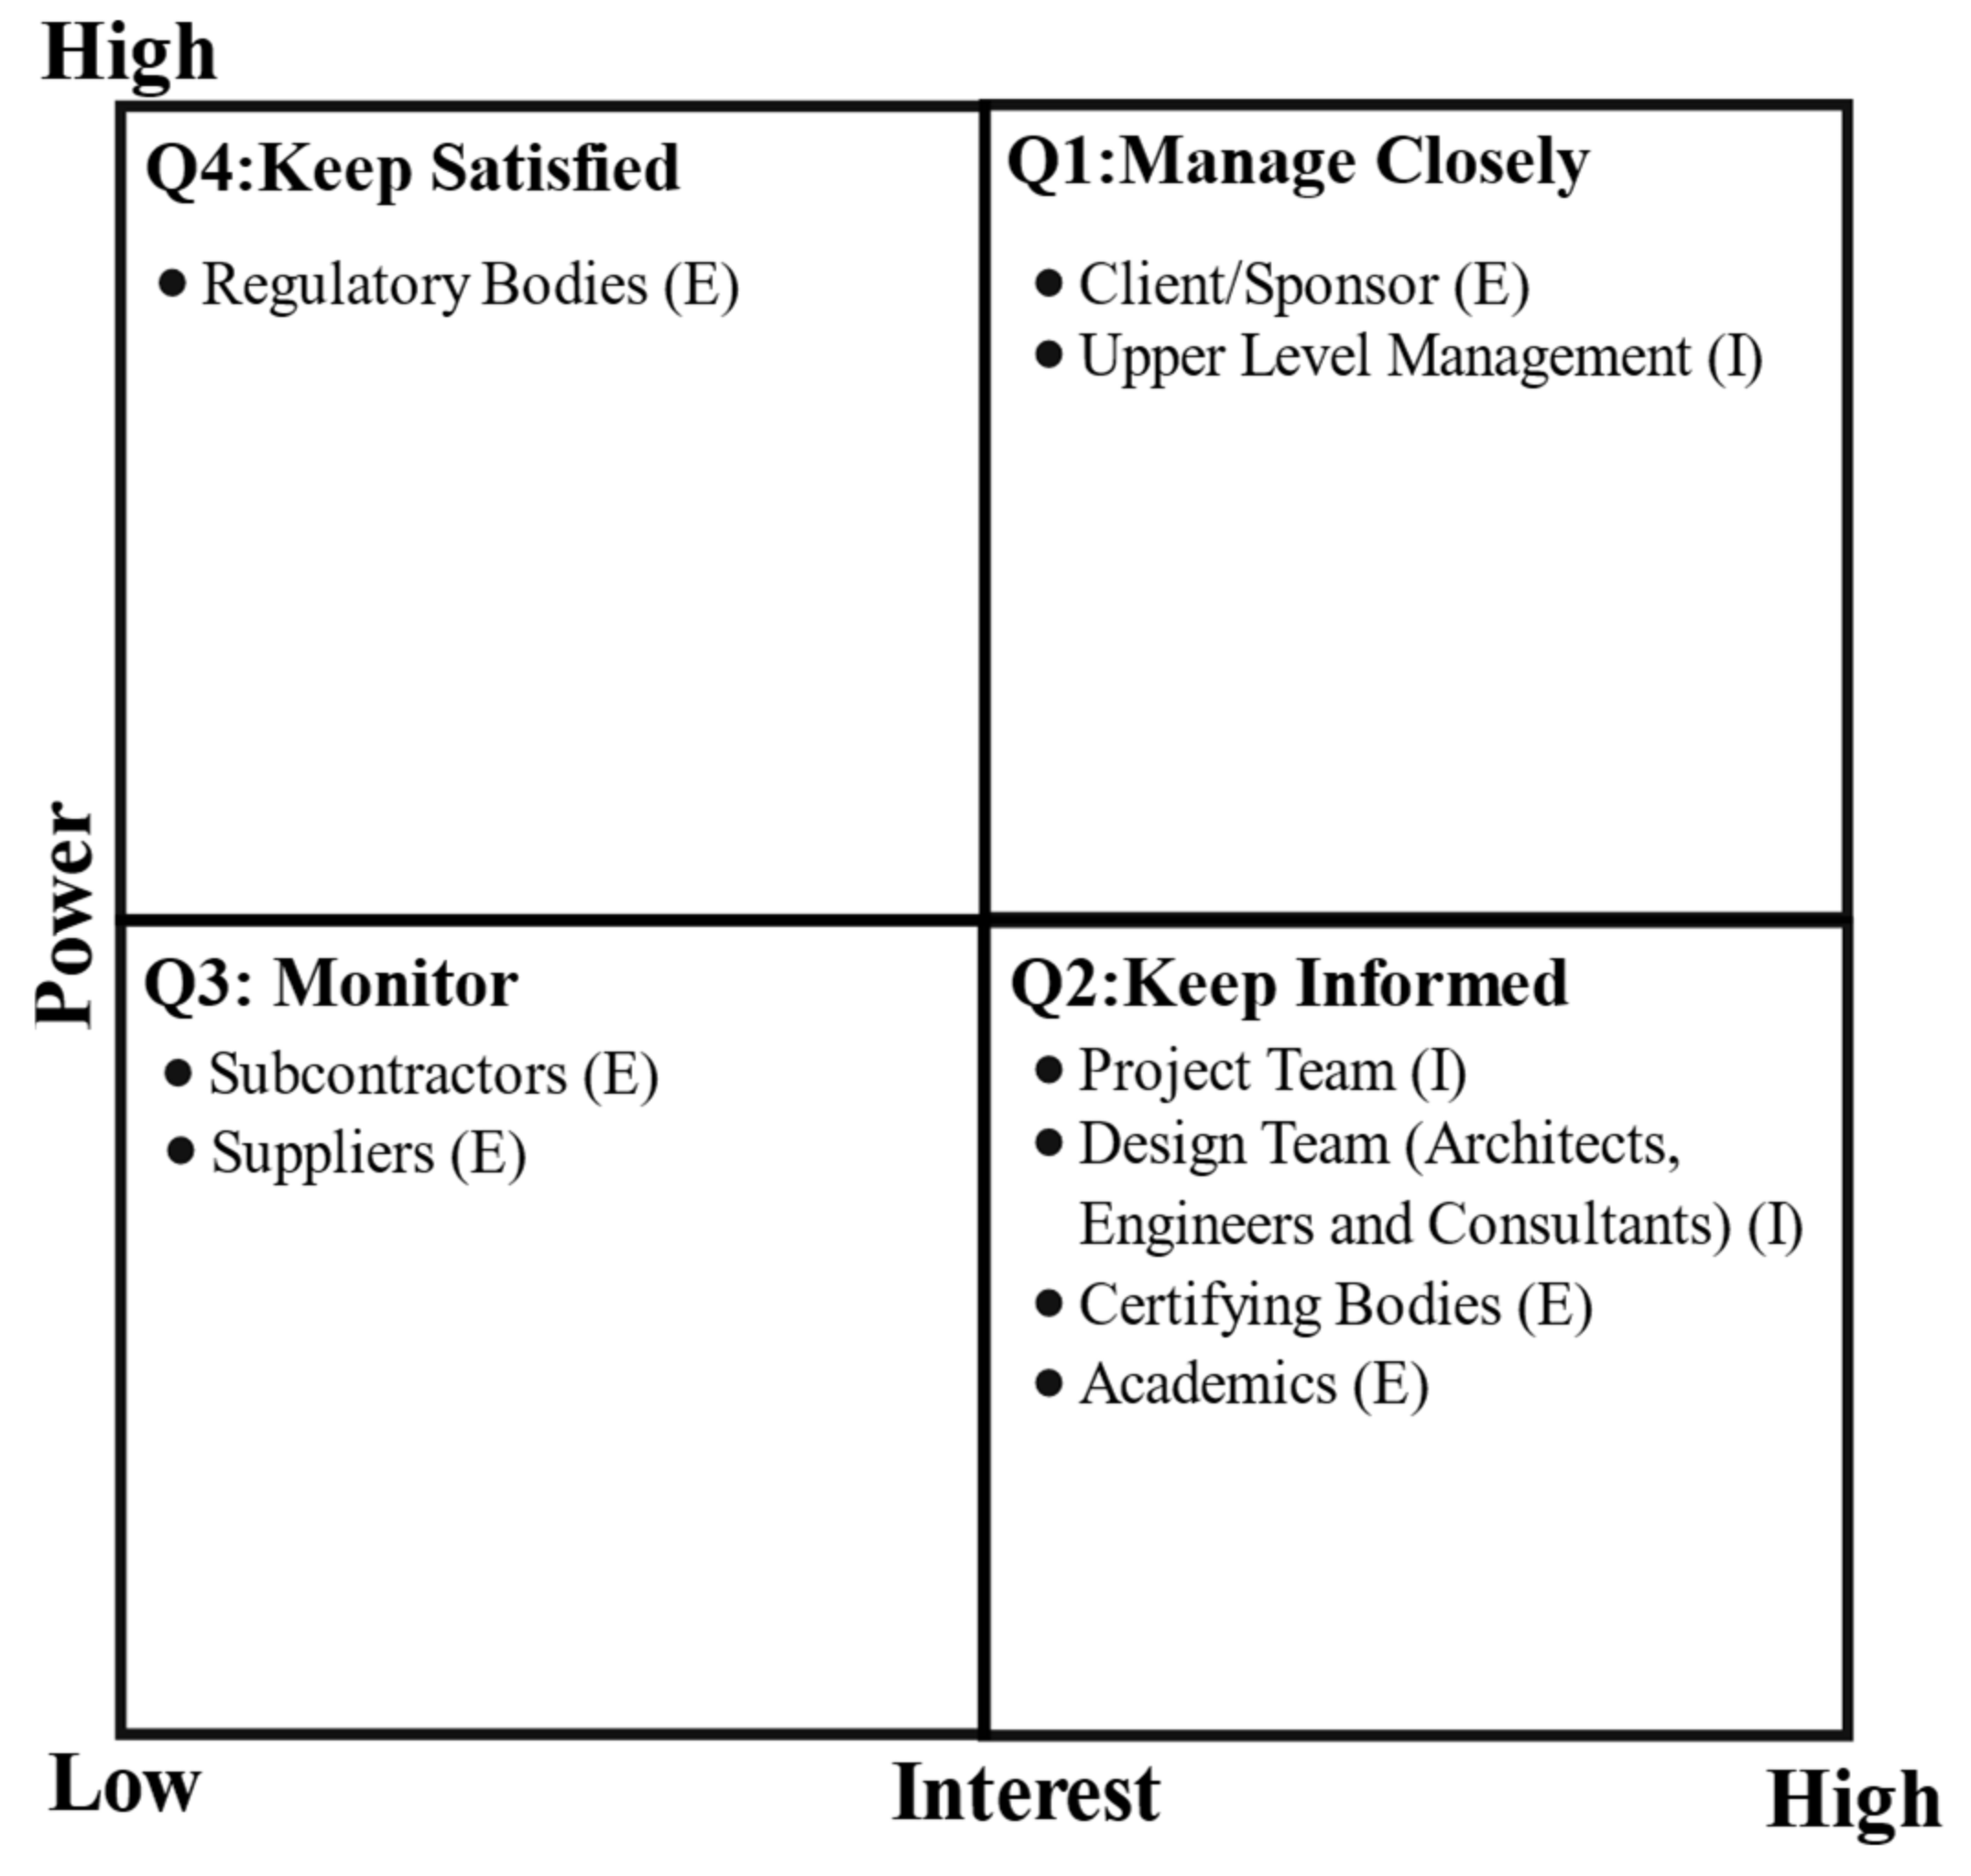
2.1. Stakeholders in Construction Sustainability Projects

We adopt a stakeholder framework to explore the awareness of sand substitutes in the construction industry to determine whether there are differences among stakeholder types. A general definition of stakeholders in a business context is “any group or individual who can affect, or be affected by, the achievement of a corporation’s purpose” [47]. A definition of stakeholders specific to project management is included in the PMBOK Guide: “A stakeholder is an individual, group, or organization who may affect, be affected by or perceive itself to be affected by a decision, activity, or outcome of a project” [48]. Stakeholder analysis is useful to identify stakeholders’ interest and how they influence other stakeholders [49]. It is important to identify key stakeholders who have input in decision making as well as who benefit from, or are negatively affected by, the outcomes of such decisions [50]. Various techniques have been developed to identify and analyze stakeholders in construction, with all parties having a particular stake or interest in project outcomes [49,51,52,53,54]. Regarding sustainability in construction, pressure from stakeholders might affect the acceptance and adoption of proposed sustainability initiatives and prevent its inclusion in large-scale projects. Stakeholders can be located inside the organization and include employees, design teams, and project management teams [55]. Others can be outside the organization, such as project sponsors and clients, suppliers and subcontractors, academics, community members, advocacy groups, and regulatory and certifying bodies [55].
Sustainability is challenging to incorporate in construction projects due to the many different types of stakeholders involved and the impact that incorporating sustainable materials can have on each stakeholder’s goals and interests [56]. Additionally, utilizing sustainable materials is often discretionary and subject to constraints due to budget, product availability, and project completion deadlines. Stakeholder identification is critical during the initiation phase, and preparing the initial project charter should occur before developing an engagement plan and beginning consultations [57].
A number of useful methods have been developed for stakeholder analysis including the power–interest matrix, the influence–interest matrix, the salience model, and the attitude and knowledge map. Stakeholder prioritization based on power and interest is the most popular approach. According to that framework, stakeholders can be classified according to their power and interest in construction sustainability initiatives from the perspective of how they are affected in a positive or negative way, resulting in their being proponents or opponents of a project [58]. Stakeholders with high power and high interest in the project are key stakeholders who can make or break a project [58,59]. We apply the power–interest matrix, expanding it to identify internal and external stakeholders involved in sustainable construction projects.
We first identified key stakeholders and then classified them based on their internal or external involvement in the project. Internal stakeholders have a direct relationship with the company leading the project, such as employment, ownership, or investment. As internal stakeholders, we include the client or sponsor, upper-level management, and the design team and project management team [60]. External stakeholders are those not working within a company but are affected by or have a role to play in the outcomes of the project. External stakeholders include constructor (general contractor or subcontractors), suppliers, academics (professors, students, and researchers), and regulatory and sustainability certifying bodies [55].
Next, we classified stakeholders based on their interest and power. As shown in Figure 1, the quadrants are labeled according to the type of communication needed with each type of stakeholder for successful completion of sustainable construction projects. Those having both high power and high interest need to be managed closely so they can make informed decisions (Quadrant 1). Those with less power but high interest need to be kept informed (Quadrant 2). Stakeholders with low interest and low power need to be monitored to ensure they provide materials and services according to contracted specifications (Quadrant 3). Lastly, stakeholders with high power but low interest in sustainability projects need to be kept satisfied that the project is in compliance with regulations (Quadrant 4).
In construction sustainability projects, key decision makers play a crucial role at the initiation phase when a feasibility study is undertaken and decisions are made about sustainability-related targets [57]. These individuals or groups, who enjoy a high level of power and a high level of interest in this stage, are the project sponsor (internal or external stakeholder) and upper-level management (internal). These stakeholders, depicted in Quadrant 1, are responsible for the overall objectives of the project and are highly focused on its ultimate success. Communication with them needs to be managed carefully to ensure that the project stays on target with regard to budget, time, and performance criteria.
Stakeholders included in Quadrant 2 have high interest but less power than those in Quadrant 1 are both internal and external. Internally, the design team of engineers, architects, and consultants, in collaboration with the project management (PM) team, including the area manager, the development manager, the managing director, or the technical director, perform the design and construction of the project. They have limited power and authority to incorporate sustainability features into the project unless approved by the key decision makers in Quadrant 1. Depending on the delivery system used in the project, the project management and design teams can share sustainability solutions with key decision makers and indirectly encourage more sustainable options. Therefore, the project management and design teams need to be kept informed of the project details. Their awareness of sustainability advancements in construction design and materials can significantly affect overall sustainability implementation if supported by key decision makers [52].
Regarding external stakeholders in Quadrant 2, certifying bodies, such as those providing LEED, BREAM, and WELL certifications, aim to promote sustainability. Thus, they are highly interested in the adoption of sustainable building practices and materials. However, their power to fulfill this mission is dependent upon the client or upper-level management deciding to seek such certification for the project. They too need to be kept informed of the project’s progress, primarily when the sponsors are seeking certification. Another external stakeholder with high interest but low power is academics. While they may be highly interested in developing and promoting sustainable alternatives, they are external to the construction project, and their research findings may take time to be discovered and accepted by practitioners. Therefore, their power to influence sustainability decisions, at least in the short term, could be considered relatively low.
The third set of stakeholders, located in Quadrant 3, is external and includes subcontractors and suppliers. They have low power and relatively little interest in the project beyond their own self-interest of meeting their profit margins while delivering contracted services and materials in a timely way. While important to the construction project, they typically adhere to the specifications set by internal stakeholders. Therefore, their activities need to be monitored to ensure they are meeting specifications.
Finally, as depicted in Quadrant 4, regulators at various government levels have high power but relatively low interest in the outcomes of construction projects other than those that involve regulations. They need to be kept satisfied through regular reporting and inspections to ensure that the project complies with existing regulations. Regulators also exercise power by revising regulations, including those related to sustainability, and passing new ones into law.

2.2. Hypotheses

Having identified stakeholders in the construction industry and classified them according to their status as internal or external to the firm, as well as by their power and interest in construction projects, we return to the research questions of assessing the extent of familiarity with various types of sustainable sand substitutes. As mentioned, stakeholders must first have knowledge of these materials in order to promote their adoption. As in our previous study (reference withheld), we view stakeholders in two ways. The first is decision makers vs. non-decision makers with regard to their authority to purchase sand and sand-related materials. Individuals who have the authority to purchase cement and sand-related materials may have more familiarity than non-decision makers with available materials since this is part of their responsibilities [61]. On the other hand, decision makers might not be motivated to learn about new materials if they have established relationships with suppliers who provide traditional materials [62]. These two contradictory possibilities lead to the following hypothesis.
Hypothesis 1 (H1).
There are no differences in familiarity with sand substitutes between stakeholders who make decisions about purchasing sand-related materials and non-decision makers.
The second way we classify stakeholders is by their role in the construction industry. Stakeholders who have high power as well as high interest in the construction project, namely sponsors/clients and upper-level management, can be the most influential to make change if they were aware of sustainable sand substitutes since they have the authority to require their adoption and allocate funds to purchase them. However, those two stakeholders might not make learning about such materials a priority. They focus instead on complex business issues including profitability, project timelines, and regulatory issues, and thus sustainability may not be a top priority for them [63]. These stakeholders typically rely on others to inform them about sustainability, and may not seek out that information from them. Academics, who have high interest but low power, may have more familiarity since they are presumably at the cutting edge of knowledge by conducting research and staying current with the literature for their teaching. Architects, as key members of the design team, have professional training that tends to include sustainability and new products more than engineers. Engineers are trained to focus predominantly on performance criteria and tend to rely on established materials that have proven effective over time. Regulators, who have high power and impact, enforce existing regulations as their primary responsibility, and are unlikely to be the initiators of regulations for new sustainable materials. Certifying bodies involved in sustainability may vary in their knowledge of sand depending on their area of specialization [64,65]. For instance, proponents of sustainable wood products may not follow advances in the research of substitute materials for cement and sand. Lastly, subcontractors and suppliers may not be knowledgeable about sand substitutes since they receive product specifications by the project management team. While academics and architects may have greater familiarity than other stakeholders, there is insufficient evidence to definitively support this argument. This leads to the following hypothesis.
Hypothesis 2 (H2).
There are no differences in familiarity with sand substitutes among stakeholders who hold different roles in the construction industry.
In summary, we hypothesize that there are no differences among stakeholder groups in the construction industry regarding their familiarity with a variety of sand substitutes. These two general hypotheses will be expanded with sub-hypotheses in the data analysis section according to the results of the factor analysis of sand substitutes constituting the dependent variables. We operationalize stakeholder groups in two ways: first, decision makers who purchase sand and sand-related materials vs. non-decision makers; and second, various roles in the construction industry.

3. Methodology

3.1. Overview

To address the research objectives, we first developed a quantitative survey. This included creating a list of sustainable sand substitutes, as well as independent and control variables. The 27 substitutes were reduced to five components using principal components analysis, and the hypotheses were tested using ordinary least squares regression, with and without main effects. The following sections provide detailed information on the design and distribution of the survey, and the data analysis approach.

3.2. Survey Instrument

This study is part of our larger research program on sand substitutes in the construction industry. We designed a survey using Qualtrics that included questions relating to the hypotheses in this study, as well as demographics and topics to be covered in other studies. Over a period of several months, the research team generated and refined questions and question formats, with all team members participating in discussions and contributing questions. We sought advice from colleagues specializing in survey design and incorporated their recommendations into the instrument. We pilot-tested the survey with a dozen construction industry professionals in our networks in the United States and Canada by reviewing each proposed question with them in individual video calls. These professionals included academics, architects, engineers, managers, and sustainability consultants. Taking their feedback into account, we reworded some questions for clarity and added and deleted questions. We wanted to ensure that the questions were understandable by all the respondents since they represented different professions. The survey was approved by our university’s institutional research board.

3.3. Sample and Data Collection

The survey was administered from May 2020 to June 2021. We recruited respondents in several ways. First, we contacted people in our professional networks, including academic colleagues and friends involved in the construction industry. We then requested referrals to others in their networks. The survey was also posted on the Brown University Listserv (https://listserv.brown.edu (accessed on 22 June 2020)) and in the BuildingGreen newsletter (www.buildinggreen.com (accessed on 19 October 2020)). To seek broader geographic and demographic representation, we posted the survey on our LinkedIn pages and also contacted individually nearly 1000 people whose LinkedIn profiles indicated involvement in the construction industry, including sustainable construction. We sought to attract respondents from all 50 US states and 10 Canadian provinces. We chose these two countries for three reasons. First, they have large construction sectors and thus are heavy users of sand. Second, as highly developed economies with strong regulatory environments, these countries have the potential to enact legislation to reduce sand use and increase the adoption of sustainable substitutes through government incentives and regulations, serving as role models for other countries. Third, we wanted to determine whether there are any differences in the results for the two countries in light of their potentially different regulatory environments or other factors. Four USD 50 gift card drawings were offered to encourage participation. Winners were selected using a random number generator after the data collection period ended. A total of 378 usable responses were retained for the research project as a whole, after eliminating 37 responses that did not contain meaningful answers beyond an initial screening question. For the current study, only those who answered “Yes, I am familiar with sand substitutes” were retained, resulting in 156 respondents.

3.4. Variables

The initial dependent variables consisted of 27 sustainable substitutes for sand that the research team had gathered from our general knowledge as well as an extensive literature search and consultation with industry professionals. We began by compiling a comprehensive review of all possible sand alternatives through Web of Science and Google Scholar. In light of our academic and practitioner experience and the retrieved literature, we identified a list of keywords for the search strings. By using several synonyms for sand alternatives, we sought to retrieve as many relevant research papers as possible. Research strings included all identified sand alternative synonyms, such as “sand replacement” and “slag”. In order to include all related research, we did not specify a start date of publications. We also conducted interviews with a dozen subject matter experts and professionals in the construction industry, and in some instances, our contacts and their referrals shared insights into alternative sand substitutes with us.
The sand substitutes, provided in Appendix A (Table A1), were listed in alphabetical order in the survey to avoid suggesting any groupings of the variables. For each substitute, respondents were instructed as follows: “Please indicate your level of knowledge about each of the following sand substitutes”. The questions were created using Likert-type scales with the following response options: 5 = extremely familiar, 4 = moderately familiar, 3 = somewhat familiar, 2 = slightly familiar, and 1 = not familiar at all.
The two independent variables were created as categorical. For the first variable, Decision maker, respondents were asked: “Are you the primary decision maker in your organization regarding purchasing construction sand and sand-related products?”. A “yes” response was coded as 1 and a “no” response was coded as 0. For the second variable, Role, the question was: “What is your main role?”. Responses were coded as 1 = academic, 2 = architect, 3 = engineer, 4 = management, and 5 = other.
Six control variables were included to account for their potential relationships with the dependent variables. First, respondents’ possession of sustainable building certifications (e.g., LEED, WELL) was coded as 1 if “yes” and 0 if “no”. Sustainable materials may be discussed in certification courses and thus respondents with certifications might be more familiar with sustainable materials as a result. Second, the size of the respondents’ current organization was coded as 1 = micro-sized (fewer than 10 employees), 2 = small-sized (10–49 employees), 3 = medium-sized (50–250 employees), and 4 = large-sized (more than 250 employees). Large organizations might be more able to fund professional development, potentially including information about sustainable materials. Third, the respondents’ country was coded as 1 for the United States and 0 for Canada to account for potential differences in awareness due to different construction regulations and building codes, as well as government incentives to adopt sustainable materials. Fourth, the number of years worked in the construction industry was coded as 0 = no experience, 1 = 1–5 years, 2 = 6–10 years, 3 = 11–15 years, 4 = 16–19 years, and 5 = more than 20 years. Individuals with more experience might prefer materials that have a demonstrated track record and are purchased from known suppliers. Fifth, the respondent age was coded as 1 = 20–29, 2 = 30–39, 3 = 40–49, 4 = 50–59, 5 = 60 or older, and 6 = prefer not to answer, with the latter respondents dropped from the analyses. Older respondents, who may have completed their professional degrees earlier, might have less current knowledge of sustainable materials. Sixth, gender was coded as 1 = female, 2 = male, 3 = other, and 4 = prefer not to answer. The two respondents answering 3 or 4 were combined in the analyses. We had no hypotheses for gender differences in awareness, but included this variable as a demographic control.

4. Results

The goal of our analysis was to determine the level of familiarity with a variety of sand substitutes among stakeholders in the construction industry in the United States and Canada. Further, we sought to determine whether stakeholder type had an effect on the levels of familiarity with the sand substitutes, while controlling for possession of sustainability certification (CERT), organizational size (SIZE), respondent’s country of residence (COUNTRY), years of experience in the construction industry (YEARSWORKED), age (AGE), and gender (GENDER). The statistical software package R (version 4.2.0 (Vigorous Calisthenics) Institute for Statistics and Mathematics Wirtschaftsuniversität Wien Welthandelsplatz: Vienna, Austria, released on 22 April 2022) was used to conduct the analyses.
The methodology involved various steps due to the complex nature of the research question. The overall objective was to determine if two stakeholder types, decision maker or non-decision maker in purchasing sand and sand substitutes, as well as the type of professional role, had an effect on familiarity with the various types of sand substitutes. Since the dependent variables consisted of familiarity with 27 different sand substitutes, with many sharing similarities in form and in familiarity, we decided to conduct a series of tests to determine if dimensionality reduction methods were appropriate for the data. We first conducted a Bartlett’s test of sphericity, which determines if the level of correlations amongst the variables is sufficient for forming linear combinations [66,67]. The test showed that the data were indeed sufficient to conduct dimensionality reduction (χ2 (351) = 2815.6, p < 0.05). Next, we tested for the sampling adequacy of conducting a dimensionality reduction on the sample by undertaking the Kaiser–Meyer–Olkin (KMO) test. Results indicate a KMO value of 0.9159, which is well above the recommended value of 0.50 for the sample to be adequate for use in dimensionality reduction [68,69,70].
After conducting the necessary steps in order to justify the need for a dimensionality reduction, the research team discussed which reduction method was the most appropriate. Generally, there are two broad approaches and the choice is greatly a function of how one interprets the resulting reduced dimensions. If the resulting dimensions are interpreted to be formative constructs, then they are often referred to as components, and we must hence undertake a component analysis. On the other hand, if the reduced dimensions are interpreted to be reflective factors, then they are often referred to as factors, and a factor analysis is appropriate [71].
After considerable deliberation and preliminary analysis, the team determined that it was best to undertake principal component analysis (PCA). The resulting components are indeed formative, based on the nature of the problem at hand. When the substitute familiarity levels are combined into broader constructs, these constructs are interpreted as categories rather than a latent factor. It is logical to presume that if one is familiar with the specific substitutes, and because those substitutes can formulate or define a single category, the individual can thus be familiar with the category (although perhaps not necessarily by the name of said category, but based on the groupings of the substitutes).
On the other hand, familiarity with a category of substitutes may not necessarily explain or predict one’s familiarity with individual substitutes that may or may not be categorized under such categories. Therefore, we hypothesized that the resulting dimensions after reduction can be formative constructs. To provide further evidence of our reasoning, we conducted a series of exploratory and confirmatory factor analysis fits to determine if any one of these measurement models can adequately explain the data. Regardless of the measurement models considered and estimated, each one’s respective fit metrics fell well outside of acceptable ranges [72]. Hence, we concluded that a principal component analysis was indeed necessary for the proper reduction in the dimensions.
Using the psych package in R, we first computed the Eigenvalues for PCA solutions using component numbers from 1 to 25. It is common to choose the number of dimensions based on (1) the first Eigenvalue in an ordered list of Eigenvalues which falls below 1.0 and (2) the total cumulative variance explained which is at least 60% [73]. As shown in Table 2, Dimensions 1–5 have an Eigenvalue greater than 1, and the cumulative variance contribution is 67.25%, above the recommended 60%. This suggests that the dimensions can be reduced to five components.
We again used the psych package in R to conduct the PCA with a promax rotation to better understand and interpret the components. After thorough discussion, and after using a minimum absolute loading of 0.5 [74], we interpreted each component using loading scores that were larger than 0.5 in absolute value. Results are shown in Table 3. We labeled the components as familiarity with natural byproducts, earth materials, construction waste, industrial byproducts, and carbon-based substitutes. The sand substitutes included in each respective component are indicated in boldface and shaded in gray in the table. Five substitutes—foundry sand, hemp, iron ore, recycled concrete, and washed glass sand—failed to provide meaningful insight into the interpretation of the five components since they fell below the 0.5 threshold.
We labeled the first component as Familiarity with Natural Byproducts since, with the exception of familiarity with sheet glass, the factor included agricultural waste (tobacco, oil palm shell, agro-waste, and nutshells) and salt. Familiarity with Earth Materials was a logical name for the second component which included familiarity with materials made from dust, stone, and clay (quarry dust, granite dust, quarry stone, and fire bricks). Third, the component consisting of recycled materials (rubber tires, plastic, glass, and construction waste) was labeled as Familiarity with Construction Waste. The fourth component, with the exception of familiarity with metakaolin, grouped waste materials resulting from industrial production processes. This component, which included silica fume, washed bottom ash, and slag, was labeled as Familiarity with Industrial Byproducts. Lastly, the fifth component was titled Familiarity with Carbon-based Materials as it included familiarity with carbon cure, fly ash, and cyanobricks. The component scores were computed based on the principal components analysis and were used in subsequent analyses.
After computing the component scores for each newly identified component, we appended the scores to the original data set to conduct further analyses. The objective was to determine if the two different representations of stakeholder type, decision maker in purchasing sand and sand substitutes as well as the professional role, affected the familiarity levels with the sand substitute categories identified in the previous analysis. We did so while controlling for the size of the organization (SIZE), the possession of sustainability certification (CERT), respondents’ country of residence (COUNTRY), the number of years of experience in the industry (YEARSWORKED), as well as the respondents’ age (AGE) and gender (GENDER). The analysis was conducted in R using various packages in order to undertake statistical tests as well as to perform the model estimations.

Descriptive Statistics

As shown in Table 4, the mean for organization size (3.04) was medium-sized (50–250 employees), the mean years worked in the construction industry (2.76) was 6–10 years, and the age (2.5) was 30–39. The means of the components representing the five dependent variables were 0.
The means for the categorical variables are shown in Table 5. The majority of respondents (51.9%) held at least one certificate in sustainability, nearly three-quarters (73.7%) were located in the United States, and two-thirds (67.3%) were male. Most interviewees (85.9%) were not decision makers in purchasing sand or sand substitutes. Regarding roles, one-third (33.3%) were managers, another third (33.3%) were engineers, 17.9% were architects, 12.1% were academics, and 3.2% were classified as “other”.
Means and standard deviations for the initial dependent variables of familiarity with each of the 27 sand substitutes are provided in the Appendix A (Table A1). The means of the five most familiar substitutes on five-point scales were fly ash (3.90), recycled concrete (3.79), crushed aggregate from quarried stone (3.72), construction and demolition waste (3.65), and recycled glass (3.38). The means of the five least familiar substitutes were tobacco waste (1.48), oil palm shell (1.64), cyanobacterial bricks (1.70), iron ore tailings (1.94), and nutshell (1.95). Intercorrelations of the 27 materials are provided in Figure 2.
Correlations among the five components representing the dependent variables, as well as the organizational size, years worked, and age, are provided in Figure 3. The five components were slightly to moderately intercorrelated, ranging from approximately 0.2 to 0.4.
Using the results of the principal components analysis, we expanded our initial two hypotheses and created hypotheses for each of the five groups of sand substitutes:
1.
Hypothesis 1. There are no differences in familiarity between stakeholders who make decisions about purchasing sand-related materials and non-decision makers for:
  • 1a. construction waste sand substitutes;
  • 1b. industrial byproduct sand substitutes;
  • 1c. natural byproduct sand substitutes;
  • 1d. earth material sand substitutes;
  • 1e. carbon-based sand substitutes.
2.
Hypothesis 2. There are no differences in familiarity among stakeholders who hold different roles in the construction industry for:
  • 2a. construction waste sand substitutes;
  • 2b. industrial byproduct sand substitutes;
  • 2c. natural byproduct sand substitutes;
  • 2d. earth material sand substitutes;
  • 2e. carbon-based sand substitutes.
The primary analysis involved a two-step estimation process whereby we first estimated the models by including only the control variables. This step was followed by a second estimation with the main effects (DECISIONMAKER and ROLE) included in the base models [75,76]. Each pair of fitted models (without and with main effects) was compared using AIC, BIC, and the log-likelihood ratio test, with the latter being appropriate due to the nested design of the models [75]. We first estimated the models using ordinary least squares (OLS), followed by a series of assumption tests to ensure that the models abided by the OLS assumptions [75,77]. For each failed assumption, we explored alterations to the model to address any assumption violation concerns. All models were subsequently estimated using the Huber–White sandwich estimator to account for small salience of heteroskedasticity within the data [78]. The models for each of the five types of sand substitute materials are as follows, with non-decision maker and academic selected as the categories against which the other categories for the two independent variables were compared.
Model 1—Familiarity with Construction Waste:
CONSTRUCTION WASTE = β 0 + β 1 CERTIFICATION + β 2 SIZE + β 3 COUNTRY US + β 4 YEARS WORKED + β 5 AGE + β 6 GENDER MALE + β 7 GENDER OTHER + ϵ = β 0 + Controls + ϵ
ONSTRUCTION WASTE = β 0 + β 8 ARCHITECT + β 9 ENGINEER + β 10 MANAGEMENT + β 11 OTHER + β 12 DECISION MAKER + Controls + ϵ
Model 2—Familiarity with Industrial Byproducts:
INDUSTRIAL BYPRODUCT = β 0 + β 1 CERTIFICATION + β 2 SIZE + β 3 COUNTRY US + β 4 YEARS WORKED + β 5 AGE + β 6 GENDER MALE + β 7 GENDER OTHER + ϵ = β 0 + Controls + ϵ
INDUSTRIAL BYPRODUCT = β 0 + β 8 ARCHITECT + β 9 ENGINEER + β 10 MANAGEMENT + β 11 OTHER + β 12 DECISION MAKER + Controls + ϵ
Model 3—Familiarity with Natural Byproducts:
NATURAL BYPRODUCT = β 0 + β 1 CERTIFICATION + β 2 SIZE + β 3 COUNTRY US + β 4 YEARS WORKED + β 5 AGE + β 6 GENDER MALE + β 7 GENDER OTHER + ϵ = β 0 + Controls + ϵ
NATURAL BYPRODUCT = β 0 + β 8 ARCHITECT + β 9 ENGINEER + β 10 MANAGEMENT + β 11 OTHER + β 12 DECISION MAKER + Controls + ϵ
Model 4—Familiarity with Earth Materials:
EARTH MATERIAL = β 0 + β 1 CERTIFICATION + β 2 SIZE + β 3 COUNTRY US + β 4 YEARS WORKED + β 5 AGE + β 6 GENDER MALE + β 7 GENDER OTHER + ϵ = β 0 + Controls + ϵ
EARTH MATERIAL = β 0 + β 8 ARCHITECT + β 9 ENGINEER + β 10 MANAGEMENT + β 11 OTHER + β 12 DECISION MAKER + Controls + ϵ
Model 5—Familiarity with Carbon-based Materials:
CARBON BASED = β 0 + β 1 CERTIFICATION + β 2 SIZE + β 3 COUNTRY US + β 4 YEARS WORKED + β 5 AGE + β 6 GENDER MALE + β 7 GENDER OTHER + ϵ = β 0 + Controls + ϵ
CARBON BASED = β 0 + β 8 ARCHITECT + β 9 ENGINEER + β 10 MANAGEMENT + β 11 OTHER + β 12 DECISION MAKER + Controls + ϵ
As shown in Table 6, for Model 1 (Familiarity with Construction Waste), both the base (χ2 (7) = 1.94, p = 0.067) and the main effect model (χ2 (12) = 1.57, p = 0.11) were inadequate fits. The base model indicated that the number of years worked (β4 = −0.15, p < 0.05) played a statistically significant role in explaining the familiarity with construction waste substitutes. Furthermore, we tested the assumptions of the base model using a variety of tests. A Ramsey RESET test and the Breusch–Pagen test did not present evidence of misspecification or heteroskedasticity [75], respectively, while the VIF scores were all less than 10, indicating a lack of evidence of multicollinearity [79]. In addition, while an Anderson–Darling test revealed potential signs of non-normality (A = 0.996, p < 0.05), which was at odds with the results from the Shapiro–Wilk (p < 0.05, W = 0.977) and Kolmogorov–Smirnov tests (D = 0.0735, p = 0.37). Analogous results from assumption testing were found for the main effect model when adding DECISION MAKER and ROLE. The only difference in results was within the main effect model. Specifically, gender (β7 = −0.97, p < 0.05) and ROLE 5, i.e., other (β11 = −0.99, p < 0.05), were statistically significant. The log-likelihood ratio test confirmed that the two models were statistically insignificant from each other χ2 (5) = 5.63, p = 0.34), which indicated that the addition of the main effects did not explain the model any better than the base model [75,77].
To address the inconsistent results, we computed the AIC and BIC scores, which can be used as another metric for model comparison [75]. Generally, decreases in the AIC and BIC from one model to the next indicate an improved fit, while increases indicate a worse fit. The AIC results for the base and main effects model were 446.02 and 450.39, respectively, while the BIC results for the base and main effects model were 473.47 and 493.09, respectively. Put simply, the AIC and BIC each increased, respectively, indicating that the addition of the main effects variables did not lead to an improved explanation of the Familiarity with Construction Waste dependent variable. In light of these results, the model estimations for Familiarity with Construction Waste suggest support for Hypothesis 1(a) for decision maker. Weak support was found for Hypothesis 2 (a) for each role, such that those having the role of “other” appeared to have less familiarity than academics.
In contrast, we found adequate overall fits for the base (χ2 (7) = 3.21, p < 0.05) and main effect (χ2 (12) = 2.65, p < 0.05) versions of Model 2, respectively, i.e., Familiarity with Industrial Byproducts, see Table 6. Assumption testing revealed similar results to those of Model 1, whereby we found a lack of violation of specification and homoskedasticity, but conflicting results for normality. Testing the base model revealed a few findings. First, the Anderson–Darling test indicated the possible presence of non-normality (A = 1.04, p < 0.05), while the Shapiro–Wilk (p < 0.05, W = 0.972) and Kolmogorov–Smirnov (D = 0.0737, p = 0.36) test indicated the opposite. The only control variable to be found as statistically significant was the certification variable (β1 = −0.53, p < 0.05). In the main effects version of Model 2, none of the normality tests showed evidence of non-normality. We further found that the main effects model also had certification (β1 = −0.4, p < 0.05) and years worked (β1 = 0.14, p < 0.05) as statistically significant predictors, along with the main effects of role 2—architect (β8 = −0.73, p < 0.05), role 4—manager (β10 = −0.59, p < 0.05), and role 5—other (β11 = −1.03, p < 0.05) as statistically significant predictors.
However, further analysis revealed that these may not in fact play a significant role in explaining the Familiarity with Industrial Byproducts hypothesis. The log-likelihood ratio test revealed that the base and main effects models were statistically insignificant χ2 (5) = 9.25, p = 0.1). This, of course, left us at a crossroads similar to that of Model 1. The AIC scores of the base and main effects model were 437.66 and 438.41, respectively, and the BIC scores for the same respective models were 465.11 and 481.11, respectively. In both instances, the addition of the main effects of DECISIONMAKER and ROLE worsened the AIC and BIC scores. In light of this evidence, we can hence suggest that for Familiarity with Industrial Byproducts, Hypothesis 1(b) for decision maker has support. Hypothesis 2(b) for role is weakly supported in that architects, managers, and others appeared to be less familiar than academics.
Interestingly, Model 3 (Familiarity with Natural Byproducts) estimations indicated conflicting outcomes. The base model (χ2 (7) = 1.38, p = 0.22) was found to be an inadequate fit, while the main effects model (χ2 (12) = 2.48, p < 0.05) indicated an overall adequate fit. Assumption testing mostly passed, with the exception of normality, whereby in both the base (p < 0.05, W = 0.92) and main effect (p < 0.05, W = 0.951) models, the Shapiro–Wilk test indicated no evidence of non-normality, while the Kolmogorov–Smirnov (base: D = 0.144, p < 0.05; main effects: D = 0.119, p <0.05) and Anderson–Darling (base: A = 3.84, p < 0.05; main effects: A = 2.7, p < 0.05) tests indicated a potential violation of normality assumptions. Furthermore, the homoskedasticity assumption for the main effects version of Model 3 failed χ2 (12) = 22.2, p < 0.05). However, undertaking the Hubert–White robust sandwich estimation approach [78] indicated that the nature of the heteroskedasticity did not impact interpretation of the significance levels. The main effects model indicated that Role 3—engineers (β9 = −1.024, p < 0.05) and Role 4—managers (β10 = −0.93, p < 0.05) were statistically significant. The log-likelihood ratio test indicated a statistically significant difference between the models χ2 (5) = 19.6, p < 0.05). In light of this evidence, we can conclude that for Familiarity with Natural byproducts, Hypothesis 1(c) for decision maker has support. Hypothesis 2(c) for role lacks support given that engineers and managers had significantly less familiarity than academics.
Model 4 (Familiarity with Earth Materials) underwent the same estimations as the other models with some additional robustness checks. First, both the base (χ2 (7) = 3.39, p < 0.05) and main effects (χ2 (12) = 2.22, p < 0.05) models were found to be adequate fits. In the base model, age (β5 = 0.18, p < 0.05) and gender (β6 = 0.5, p < 0.05; β7 = −0.92, p < 0.05) were found to be statistically significant, which was also consistent with the main effects model (β5 = 0.18, p < 0.05; β6 = 0.47, p < 0.05; β7 = −0.8, p < 0.05). Most of the assumption tests had passed, with the exception of the Ramsey RESET specification test. In both the base model (F(2146) = 10.6, p < 0.05) and the main effects model (F(2141) = 4.87, p < 0.05), we found support for misspecification. A comparison of the base and main effects model using the log-likelihood ratio test led us to conclude that the addition of the main variables did not indicate a statistically significant difference between the two models χ2 (5) = 3.45, p = 0.63). In light of the violation of specification, we undertook additional robustness checks to confirm or challenge the findings. Upon further investigation, it was revealed that a more adequate specification involved appending our base and main effects model with a squared term for age, years worked, and organization size, as well as a cubed term on the size. Doing so and re-estimating the models led us to a model that did not violate the Ramsey RESET test. Upon investigation of the newly fitted model, we found consistent results with those of the basic OLS model. More specifically, no main effect variable was statistically significant, and the log-likelihood ratio test found no statistically significant difference between the adjusted base and adjusted main effects models χ2 (5) = 1.53, p = 0.91). This leads us to conclude that there is adequate support for Familiarity with Earth Material for Hypothesis 1(d) for decision maker and Hypothesis 2(d) for role.
Last, Model 5 (Familiarity with Carbon-based Materials) also indicated conflicting fits, with the base model (χ2 (7) = 2.35, p < 0.05) indicating an overall adequate fit but the main effects model (χ2 (12) = 1.48, p = 0.14) indicating an overall poor fit. All assumptions, including normality, passed our testing. The certification (β1 = 0.32, p < 0.05) and gender (β7 = −0.86, p < 0.05) variables were found to be statistically significant in the base model, while only gender (β7 = −0.77, p < 0.05) was found to be statistically significant in the main effects model. The log-likelihood ratio test confirmed that the addition of the main effects did not show a statistically significant difference between the respective base and the main effects model χ2 (5) = 1.83, p 0.87), providing support for Familiarity with Carbon-based Materials in relation to Hypothesis 1(e) for decision maker and Hypothesis 2(e) for role.

5. Discussion

The purpose of this study was to determine the familiarity of stakeholders in the US and Canadian construction industry with sand substitutes in construction and building materials. Our research was inspired by evidence documented by the United Nations and other scientific sources of a global sand crisis and the urgent need to reduce consumption of alluvial sand. We focused on the construction industry since it is a major consumer of sand. We adopted a stakeholder approach, classifying stakeholders according to their power and interest in construction projects and whether they were internal or external to the project. We hypothesized low awareness of sand substitutes and no differences among stakeholder groups. Overall, there was very low awareness of sand substitutes. The top five most familiar substitutes—fly ash, recycled concrete, crushed aggregate from quarried stone, construction and demolition waste, and recycled glass—represented carbon-based materials, earth materials, and construction waste, as grouped by our respondents. These materials were rated as less than “moderately familiar” and closer to “somewhat familiar” (between 3.38 and 3.90 on a 5-point scale). The least familiar substitutes—tobacco waste, oil palm shell, cyanobacterial bricks, iron ore tailings, and nutshell—were predominantly grouped as natural byproducts and ranged from “not at all familiar” to “slightly familiar” (between 1.48 and 1.95). These results point to the need to raise awareness of substitute materials among stakeholders in the construction industry and to highlight, as noted earlier in Table 1, the wide range of applications, such as replacement materials in concrete, roads, and building materials. This confirms the results of [62,80] who identified a lack of awareness as the most important obstacle to the implementation of green building practices. It should be noted that the sand crisis is also a relatively new issue, and it is not addressed in sustainability guidelines or rating systems. Thus, people with sustainability credentials had no more awareness of it, contrary to expectations in the literature of such credentials providing greater awareness [64]. We will discuss potential ways of raising awareness in a later section.
We operationalized stakeholders in two ways: decision makers who purchase sand and sand-related materials vs. non-decision makers, as well as five different roles in the construction industry. As summarized in Table 7, 7 of the 10 hypotheses predicting no differences among stakeholders were supported. Regarding decision makers, no differences in awareness were found between decision makers versus non-decision makers, confirming Hypotheses 1a through 1e regarding Familiarity with Construction Waste, industrial byproducts, natural byproducts, earth materials, and carbon-based substitutes, respectively. The finding of no differences between decision makers and non-decision makers arguably indicates that the former may not be motivated to learn about new materials if they have established relationships with suppliers who provide traditional materials with proven performance properties.
As for stakeholders categorized into five professional roles, there were no differences in Familiarity with Earth Materials (quarry dust, granite dust, quarried stone, and fire bricks) or Familiarity with Carbon-based Materials (carbon cure, fly ash, and cyanobricks), supporting Hypotheses 2d and 2e. This is interesting in that these materials include both the most familiar (with fly ash at 3.90 being the most familiar of all 27 substitutes) and the least familiar (with cyanobricks at 1.70 being the third least familiar).
However, academics were more familiar with construction waste (rubber tires, plastic, glass, and construction waste) than those in the “other” role. Given that the “other” role includes a variety of people in the construction industry that did not fall into the four major roles, an interpretation is not readily evident. Academics were also more familiar with industrial byproducts (silica fume, washed bottom ash, and slag) than architects, managers, and others. Yet, they did not have more familiarity than engineers. This makes sense in that engineers typically deal directly with such industrial byproducts unlike architects and managers. Academics were also more familiar with natural byproducts (tobacco, oil palm shell, agro-waste, and nutshells) than engineers and managers, but they did not have more familiarity than architects. These products appear to be relatively new in the US and Canadian markets and perhaps not widely available or having limited applications. Thus, academics (with their attention on the latest research) and architects (with their focus on the design phase) might be familiar with them ahead of their general adoption by the construction industry.
In our matrix, we classified stakeholders according to their power and interest in the sustainable construction projects. Managers and owners, with high power and high interest, were particularly less familiar with sand substitutes than others for industrial and natural byproducts. Other stakeholders on the project and design teams have high interest but less power in the overall decision-making process. They could be more proactive in sharing their more specific knowledge during the project initiation phase when materials are being evaluated.
Our findings based on a broad representation of stakeholders in the United States and Canada underscore the need for the construction industry as a whole to become much more informed about the availability of sand substitute materials. These two developed countries could well take the lead globally in creating educational campaigns to raise awareness of the need for greater adoption of sustainable substitutes for sand. It was interesting that despite different regulatory environments, there were no differences in awareness between the two countries. This suggests that regulatory bodies can play a more significant role in raising awareness in both countries. This is consistent with the findings of [81] which emphasized the importance of local regulations for persuading people and organizations to build sustainable green buildings. Educational campaigns could be designed by government bodies regulating the construction industry. Such campaigns could also be directed toward end-users in the supply chain and consumers to encourage them to request such materials during the product specification phase. Professional associations in the industry as well as sustainability consultants could raise awareness through presentations at conferences and industry publications. Academics could increase awareness by including sand substitute materials in textbooks and by disseminating their research more widely to industry audiences.

6. Conclusions

This study has shed light on the low level of awareness of substitutes for sand in the construction industry in the United States and Canada. It has also offered recommendations for increasing awareness among academics and industry practitioners with the goal of reducing the use of alluvial sand in construction and building materials. Our research was motivated by a detailed United Nations’ 2019 report documenting that the world is facing a sand crisis. Recognizing that the construction industry is a major consumer of sand, we set out to determine how familiar various stakeholders in the US and Canadian construction industry were of available sand substitutes. We applied a power–interest framework to classify stakeholders according to their interest in sustainable construction projects and varying levels of power. There was a very low level of familiarity with sand substitutes among two types of stakeholders—decision makers who ordered sand and those who did not and roles in construction projects (academics, architects, engineers, engineers, other). As hypothesized, none of the stakeholders had much familiarity with sand substitutes. The three exceptions to our 10 hypotheses of no differences among stakeholders were that academics were more familiar than some other stakeholders with construction waste and industrial and natural byproducts, but not earth or carbon-based materials.
An implication of our findings is that efforts are needed to communicate with stakeholders involved in decisions about using sand and sustainable substitutes. Information about the global sand crisis, e.g., documented in the 2019 United Nations report, could sensitize stakeholders to the need for reducing sand consumption. At the time we completed our article, the United Nations published a follow-up report outlining 10 key strategies for alleviating the sand crisis. Our research aligns with Key Action 8.2 calling for mainstreaming technically proven alternative materials [82]. Assessing awareness, as we determined in this study, is a first step toward acceptance and adoption of such materials.
This study has made significant contributions to the academic literature in a number of areas. First, this study emphasizes that stakeholder identifications and engagements are essential to initiating sustainability measures and ensuring the effectiveness of sustainability communication in construction projects. Sustainability communication addresses the social understanding of causes and potential solutions to responsible human interaction with the environment [83]. A lack of awareness can be an overlooked cause of failure to adopt sustainable sand substitutes, and appropriate communication techniques can be applied to educate stakeholders. It has been reflected in recent trends in construction delivery systems and an increased interest in integrated project delivery (IPD), which emphasizes full integration of project teams and knowledge sharing in order to maximize success [84]. Therefore, it is imperative to identify key decision makers in construction projects, including those deciding to pursue sustainability initiatives. Awareness of alternative or environmentally friendly materials plays a crucial role here [61,85,86].
Second, our study also demonstrated that in spite of the extensive research and effort in developing sustainable alternatives, there is a lack of awareness among construction stakeholders, which might hinder the widespread use of these materials in construction projects. Our study underscores that the starting point is to assess the level of awareness of available substitutes on the part of all stakeholders before proceeding. Prior research has shown that a key decision in addressing sustainability challenges in organizations is to decide how many and which stakeholders to involve in new product development, and at what stages of the process, as well as applying the appropriate strategy for doing so [63]. This includes determining engagement strategies for reporting sustainability initiatives [87]. While our study found few differences in awareness among decision makers and professional roles, different engagement strategies might be needed to effectively increase awareness of sand substitutes for different types of stakeholders. The concept of stewardship can be applied to promote responsible actions by stakeholders to advance sustainability [88].
More information about the availability, costs, properties, and applications of sand substitutes can also be a starting point for stakeholders to evaluate the viability of such substitutes. Such information could be disseminated by industry associations (such as the US Green Building Council), certifying bodies (such as LEED), and professional bodies (such as the American Institute of Architects and the American Society of Civil Engineers). Educational outlets include newsletters, seminars, and conferences. Equipped with such knowledge, construction industry professionals could collaborate with policymakers, certifying bodies, and regulators to develop guidelines or regulations, as well as offer incentives to promote greater use of sustainable substitutes. The construction industry is a highly visible economic sector. By taking a leading role in promoting awareness and adoption of sustainable substitutes for sand, the industry could enhance its reputation as contributing significantly to the sustainability of the planet.
We believe our findings can be generalized across the US and Canadian construction industry since respondents came from 35 of the 50 US states and 7 of the 10 Canadian provinces, i.e., 70% of the jurisdictions in both countries. The 15 US states that were not included—Alaska, Delaware, Idaho, Iowa, Kansas, Louisiana, Mississippi, Montana, Nebraska, Nevada, New Mexico, North Dakota, South Dakota, West Virginia, and Wyoming—were located primarily in the central region of the country (with the exception of the first two). Since they bordered on states that were included, we believe the findings can apply to those states not surveyed. Three Canadian provinces that had no respondents were Manitoba, Newfoundland/Labrador, and Prince Edward Island, i.e., all lightly populated provinces. Moreover, no differences were found between the two countries when the respondents’ country was included as a control variable. We caution, however, against generalizing the findings beyond the US and Canada for two reasons. First, the availability of sand substitutes might differ around the globe. For instance, regions that are not involved in mining might not have easy access to slag. A second factor affecting generalizability is the existence of different certifying bodies, laws, and regulations across countries. For instance, some sustainable substitutes may not be approved for use in some countries.
We recognize several limitations of our study. First, while we sought respondents from all states and provinces, we utilized a snowball referral sample at the outset and supplemented it with postings of the survey on industry listservs. We also contacted nearly 1000 industry professionals individually on LinkedIn to increase coverage throughout the US and Canada. A random sampling method can increase generalizability, such as selecting names randomly from membership lists of architects, engineers, professional associations, and trade associations. A second limitation relates to stakeholders. Most of the respondents were stakeholders with high interest in the success of construction projects, and varying levels of power, as found in the two right quadrants in Figure 1. Stakeholders with low interest, including those with high power (regulators) and low power (suppliers and subcontractors), were much fewer and were grouped in the other category.
We offer several research topics on sustainable substitutes for sand in the construction industry. First, it could be informative to learn the perspective of stakeholders who were not well represented in the current study, particularly those in the two left-hand quadrants denoting relatively low or less interest in construction projects. These include regulators, i.e., high-power stakeholders who have the authority to pass regulations and provide incentives for adopting sustainable sand substitutes. Likewise, suppliers and subcontractors, i.e., low-power stakeholders, need to become aware of sustainable materials and offer incentives to provide them. The first step in studying these two types of stakeholders is to assess their level of awareness of available sand substitutes.
Second, the five categories of sand substitutes were derived from respondents’ familiarity with the 27 substitutes listed in alphabetical order in our survey. Further research could determine how the specific sand substitutes cluster according to other criteria, such as chemical and physical properties, as well as by uses or applications. Such findings may be useful in reaching various stakeholders to inform them of criteria they use in decision making, including the current or potential adoption of substitutes that can replace sand. For example, engineers may be reluctant to adopt new materials unless data assures them that properties of sand substitutes meet accepted standards for traditional materials. Similarly, regulators need hard data in order to approve and even require adoption of sand substitutes. Moreover, managers need to be persuaded if sand substitute materials are more expensive than traditional ones, as other benefits could outweigh the financial costs. These could include enhanced company reputation for incorporating sustainability into construction projects. Architects, in their position as early in the design phase of construction projects, could be vocal proponents of viable sand substitutes.
Third, research could explore obstacles and incentives for adopting sustainable substitutes for sand, similar to other sustainable materials and practices [89,90,91].

Author Contributions

Conceptualization, A.A.Z., S.M.P. and Y.P.; methodology, M.D.G.; software, M.D.G.; formal analysis, M.D.G.; data curation, A.A.Z., Y.P. and S.M.P.; writing—original draft preparation, A.A.Z., Y.P., S.M.P. and M.D.G.; writing—review and editing, A.A.Z., Y.P., S.M.P. and M.D.G.; visualization, A.A.Z., Y.P. and M.D.G. All authors have read and agreed to the published version of the manuscript.

Funding

This research received no external funding.

Data Availability Statement

Please refer to suggested Data Availability Statements in section “MDPI Research Data Policies” at https://www.mdpi.com/ethics, accessed on 12 June 2022.

Acknowledgments

The authors gratefully acknowledge the assistance of Paul Wallace, Lucas Troup, Felicia Lassk, and Jamie Ladge in the development of our survey instrument.

Conflicts of Interest

The authors declare no conflict of interest.

Appendix A

Table A1. Descriptive statistics of familiarity with 27 sand substitutes.
Sand SubstituteOverallAcademicArchitectEngineerManagementOtherDecision MakerNon Decision Maker
Mean (SD)Mean (SD)Mean (SD)Mean (SD)Mean (SD)Mean (SD)Mean (SD)Mean (SD)
Agro-waste2.06 (1.23)2.45 (1.31)2.03 (1.15)1.91 (1.15)2.01 (1.26)2.36 (1.07)2.29 (1.3)2 (1.21)
Carbon cure2.7 (1.49)2.86 (1.61)2.94 (1.48)2.69 (1.45)2.54 (1.48)2.57 (1.05)2.75 (1.43)2.68 (1.51)
Construction and demolition waste (e.g., concrete, wood, metals, and brick)3.65 (1.19)3.74 (1.18)3.5 (1.12)3.67 (1.16)3.68 (1.25)3.27 (0.96)3.52 (1.3)3.68 (1.16)
Crushed fine aggregate from quarried stone3.72 (1.22)3.71 (1.23)3.41 (1.03)3.83 (1.21)3.77 (1.25)3.73 (1.14)3.73 (1.34)3.72 (1.18)
Crushed spent fire bricks2.54 (1.25)2.9 (1.27)2.62 (1.16)2.55 (1.25)2.42 (1.25)1.91 (1)2.75 (1.29)2.49 (1.24)
Cyanobacterial bricks1.7 (1.04)2.04 (1.22)1.79 (1.05)1.6 (0.94)1.62 (1)1.55 (0.99)1.91 (1.21)1.65 (0.99)
Fly ash3.9 (1.21)3.72 (1.42)4.15 (0.84)3.97 (1.18)3.91 (1.19)3.5 (1.32)4.04 (1.07)3.86 (1.24)
Foundry sand2.52 (1.39)2.28 (1.35)2.33 (1.2)2.33 (1.31)2.8 (1.45)2.91 (1.38)2.95 (1.42)2.42 (1.36)
Granite dust2.57 (1.26)2.77 (1.32)2.44 (1.19)2.46 (1.22)2.62 (1.3)2.36 (0.98)2.77 (1.3)2.52 (1.25)
Hempcrete/Hemp stone2.18 (1.34)2.35 (1.31)2.56 (1.35)2.04 (1.3)2.12 (1.39)2.27 (1.48)2.63 (1.49)2.06 (1.28)
Iron ore tailing (with or without steel fiber)1.94 (1.17)2.48 (1.33)1.91 (1.07)1.72 (0.98)1.99 (1.26)2.14 (1.12)2.1 (1.36)1.9 (1.11)
Metakaolin1.99 (1.34)2.41 (1.5)1.39 (0.6)2.13 (1.43)2.01 (1.37)1.88 (1.17)2.22 (1.38)1.93 (1.33)
Nutshell (e.g., walnut shell, pecan shell)1.95 (1.14)2.21 (1.28)2.29 (1.04)1.72 (0.97)1.94 (1.19)1.55 (0.89)2.21 (1.21)1.89 (1.12)
Oil palm shell1.64 (0.99)1.9 (1.2)1.68 (0.79)1.55 (0.91)1.6 (0.98)1.55 (0.78)1.88 (1.05)1.58 (0.96)
Quarry dust2.51 (1.34)2.67 (1.44)2.38 (1.16)2.37 (1.29)2.58 (1.36)2.36 (1.3)2.57 (1.37)2.5 (1.33)
Recycled concrete3.79 (1.26)3.38 (1.36)3.74 (1.15)3.7 (1.31)4.07 (1.15)3.91 (1.08)3.88 (1.13)3.76 (1.29)
Recycled glass3.38 (1.37)3.23 (1.42)3.56 (1.17)3.45 (1.33)3.44 (1.43)2.6 (1.2)3.42 (1.33)3.37 (1.39)
Recycled plastic2.84 (1.38)3.26 (1.54)2.5 (1.19)2.93 (1.29)2.75 (1.37)2.18 (1.11)2.68 (1.42)2.87 (1.37)
Recycled tires/rubber2.91 (1.39)3.13 (1.47)2.79 (1.47)3.01 (1.29)2.8 (1.41)2.75 (0.92)2.67 (1.41)2.96 (1.38)
Sheet glass powder2.18 (1.33)2.62 (1.43)2.09 (1.2)2.16 (1.25)2.08 (1.34)1.82 (1.03)2.27 (1.29)2.16 (1.34)
Salt1.96 (1.24)3 (1.48)1.91 (1.16)1.69 (1.12)1.9 (1.18)1.86 (0.83)2.13 (1.23)1.91 (1.24)
Sand from stone3.12 (1.41)3.37 (1.29)2.59 (1.24)3.05 (1.47)3.23 (1.44)3 (1.33)3.31 (1.44)3.07 (1.4)
Silica fume2.83 (1.51)2.76 (1.54)2.5 (1.19)2.97 (1.41)2.88 (1.64)2.45 (1.44)2.91 (1.56)2.8 (1.49)
Slag3.29 (1.39)3.34 (1.44)3.32 (1.23)3.39 (1.31)3.22 (1.49)3.08 (1.26)3.18 (1.45)3.32 (1.38)
Tobacco waste1.48 (0.91)1.83 (1.28)1.44 (0.65)1.41 (0.85)1.41 (0.79)1.27 (0.62)1.59 (0.9)1.45 (0.92)
Washed bottom ash2.01 (1.29)2.29 (1.55)1.76 (1.02)2.05 (1.28)1.94 (1.23)1.73 (1.05)2.25 (1.44)1.95 (1.25)
Washed glass sand2.09 (1.29)2.37 (1.52)1.94 (1.03)2.12 (1.34)2.05 (1.23)1.55 (0.78)2.38 (1.42)2.02 (1.25)
Other (please specify)2.42 (1.76)1.94 (1.48)1.33 (0.47)2.77 (1.93)2.81 (1.86)1.5 (0.87)3.67 (1.56)2.21 (1.71)
Other (please specify)1.84 (1.48)1.64 (1.29)1 (0)1.43 (1.05)2.29 (1.77)1.5 (0.87)3.67 (1.37)1.54 (1.26)

References

  1. Gursel, A.P. Life-Cycle Assessment of Concrete: Decision-Support Tool and Case Study Application; University of California: Berkeley, CA, USA, 2014. [Google Scholar]
  2. Scrivener, K.; Kirkpatrick, R.J. Innovation in use and research on cementitious material. Cem. Concr. Res. 2008, 38, 128–136. [Google Scholar] [CrossRef]
  3. Hewlett, P.; Liska, M. Lea’s Chemistry of Cement and Concrete; Butterworth-Heinemann: Oxford, UK, 2019. [Google Scholar]
  4. Cook, G.; Ponssard, J.-P. A proposal for the renewal of sectoral approaches building on the Cement Sustainability Initiative. Clim. Policy 2011, 11, 1246–1256. [Google Scholar] [CrossRef]
  5. Gartner, E.; Macphee, D.E. A physico-chemical basis for novel cementitious binders. Cem. Concr. Res. 2011, 41, 736–749. [Google Scholar] [CrossRef]
  6. Klee, H.; Hunziker, R.; Van Der Meer, R.; Westaway, R. Getting the numbers right: A database of energy performance and carbon dioxide emissions for the cement industry. Greenh. Gas Meas. Manag. 2011, 1, 109–118. [Google Scholar] [CrossRef]
  7. Rodrigues, F.A.; Joekes, I. Cement industry: Sustainability, challenges and perspectives. Environ. Chem. Lett. 2010, 9, 151–166. [Google Scholar] [CrossRef]
  8. Torres, A.; Brandt, J.; Lear, K.; Liu, J. A looming tragedy of the sand commons. Science 2017, 357, 970–971. [Google Scholar] [CrossRef]
  9. United Nations Environment Programme. Sand and Sustainability: Finding New Solutions for Environmental Governance of Global Sand Resources; United Nations Environment Programme: Geneva, Switzerland, 2019. [Google Scholar]
  10. Koehnken, L.; Rintoul, M.S.; Goichot, M.; Tickner, D.; Loftus, A.-C.; Acreman, M.C. Impacts of Riverine Sand Mining on Freshwater Ecosystems: A Review of the Scientific Evidence and Guidance for Future Research. River Res. Appl. 2020, 36, 362–370. [Google Scholar] [CrossRef]
  11. Sverdrup, H.U.; Koca, D.; Schlyter, P. A Simple System Dynamics Model for the Global Production Rate of Sand, Gravel, Crushed Rock and Stone, Market Prices and Long-Term Supply Embedded into the WORLD6 Model. Biophys. Econ. Resour. Qual. 2017, 2, 8. [Google Scholar] [CrossRef] [Green Version]
  12. Lavender, M.D. The importance of silica to the modern world. Indoor Built Environ. 1999, 8, 89–93. [Google Scholar] [CrossRef]
  13. Beiser, V. He Who Controls the Sand: The Mining ‘Mafias’ Killing Each Other to Build Cities. The Guardian. 2017. Available online: https://www.theguardian.com/cities/2017/feb/28/sand-mafias-killing-each-other-build-cities (accessed on 10 May 2022).
  14. Wesley, D.T.A.; Puffer, S.M. The End of Sand: Confronting One of the Greatest Environmental Challenges of the New Millennium. In Reusable and Sustainable Building Materials in Modern Architecture; IGI Global: Hershey, PA, USA, 2018; pp. 1–27. [Google Scholar]
  15. Koigi, B. FairPlanet. Deadly and Destructive: Kenya Cartels Fan Sand Wars. 12 September 2017. Available online: https://www.fairplanet.org/story/deadly-and-destructive-kenya-cartels-fan-sand-wars/ (accessed on 5 May 2022).
  16. Wang, R.; Shi, Q.; Li, Y.; Cao, Z.; Si, Z. A critical review on the use of copper slag (CS) as a substitute constituent in concrete. Constr. Build. Mater. 2021, 292, 123371. [Google Scholar] [CrossRef]
  17. Miraldo, S.; Lopes, S.; Pacheco-Torgal, F.; Lopes, A. Advantages and shortcomings of the utilization of recycled wastes as aggregates in structural concretes. Constr. Build. Mater. 2021, 298, 123729. [Google Scholar] [CrossRef]
  18. Santhosh, K.G.; Subhani, S.M.; Bahurudeen, A. Cleaner production of concrete by using industrial by-products as fine aggregate: A sustainable solution to excessive river sand mining. J. Build. Eng. 2021, 42, 102415. [Google Scholar] [CrossRef]
  19. Collivignarelli, M.; Cillari, G.; Ricciardi, P.; Miino, M.; Torretta, V.; Rada, E.; Abbà, A. The Production of Sustainable Concrete with the Use of Alternative Aggregates: A Review. Sustainability 2020, 12, 7903. [Google Scholar] [CrossRef]
  20. Behera, M.; Bhattacharyya, S.; Minocha, A.; Deoliya, R.; Maiti, S. Recycled aggregate from C&D waste & its use in concrete—A breakthrough towards sustainability in construction sector: A review. Constr. Build. Mater. 2014, 68, 501–516. [Google Scholar] [CrossRef]
  21. Srivastava, A.; Singh, S.K. Utilization of alternative sand for preparation of sustainable mortar: A review. J. Clean. Prod. 2020, 253, 119706. [Google Scholar] [CrossRef]
  22. Davenport, W.G.; King, M.; Schlesinger, M.E.; Biswas, A.K. Extractive Metallurgy of Copper; Elsevier: Amsterdam, The Netherlands, 2002. [Google Scholar]
  23. Shi, C.; Meyer, C.; Behnood, A. Utilization of copper slag in cement and concrete. Resour. Conserv. Recycl. 2008, 52, 1115–1120. [Google Scholar] [CrossRef]
  24. Marie, I.; Quiasrawi, H. Closed-loop recycling of recycled concrete aggregates. J. Clean. Prod. 2012, 37, 243–248. [Google Scholar] [CrossRef]
  25. Prusty, J.K.; Patro, S.K.; Basarkar, S. Concrete using agro-waste as fine aggregate for sustainable built environment—A review. Int. J. Sustain. Built Environ. 2016, 5, 312–333. [Google Scholar] [CrossRef] [Green Version]
  26. Celebrate the First Hemp House Built in America Today! NoCo Hemp Expo, 1 December 2017. Available online: https://www.nocohempexpo.com/celebrate-first-hemp-house-built-america-today/ (accessed on 10 May 2022).
  27. Heveran, C.M.; Williams, S.L.; Qiu, J.; Artier, J.; Hubler, M.; Cook, S.M.; Cameron, J.C.; Srubar, W.V. Biomineralization and Successive Regeneration of Engineered Living Building Materials. Matter 2020, 2, 481–494. [Google Scholar] [CrossRef] [Green Version]
  28. Corless, V. Scientists Create Living Concrete from Bacteria and Sand. Advanced Science News. 16 January 2020. Available online: https://www.advancedsciencenews.com/scientists-create-living-concrete-from-bacteria-and-sand/ (accessed on 11 April 2022).
  29. CarbonCure Technologies Inc. CarbonCure’s Sustainable Concrete Solution. Available online: https://www.carboncure.com/ (accessed on 11 April 2022).
  30. Sastry, K.K.; Ravitheja, A.; Reddy, C.S.R. Effect of Foundry Sand and Mineral Admixtures on Mechanical Properties of Concrete. Arch. Civ. Eng. 2018, 64, 117–131. [Google Scholar] [CrossRef] [Green Version]
  31. Siddique, R.; Singh, G.; Singh, M. Recycle option for metallurgical by-product (Spent Foundry Sand) in green concrete for sustainable construction. J. Clean. Prod. 2017, 172, 1111–1120. [Google Scholar] [CrossRef]
  32. Prokopski, G.; Marchuk, V.; Huts, A. The effect of using granite dust as a component of concrete mixture. Case Stud. Constr. Mater. 2020, 13, e00349. [Google Scholar] [CrossRef]
  33. Hk, T.; Hossiney, N. A short review on environmental impacts and application of iron ore tailings in development of sustainable eco-friendly bricks. Mater. Today Proc. 2021, 61, 327–331. [Google Scholar] [CrossRef]
  34. Lv, Z.; Jiang, A.; Liang, B. Development of eco-efficiency concrete containing diatomite and iron ore tailings: Mechanical properties and strength prediction using deep learning. Constr. Build. Mater. 2022, 327, 126930. [Google Scholar] [CrossRef]
  35. Chakkor, O.; Altan, M.F. Evaluation of metabentonite and metazeolite performance based geopolymers with metakaolin river sand replacement. Case Stud. Constr. Mater. 2022, 16, e00924. [Google Scholar] [CrossRef]
  36. Cheah, C.B.; Lim, J.S.; Ramli, M.B. The mechanical strength and durability properties of ternary blended cementitious composites containing granite quarry dust (GQD) as natural sand replacement. Constr. Build. Mater. 2018, 197, 291–306. [Google Scholar] [CrossRef]
  37. Issa, C.; Salem, G. Utilization of recycled crumb rubber as fine aggregates in concrete mix design. Constr. Build. Mater. 2013, 42, 48–52. [Google Scholar] [CrossRef]
  38. Pungercar, V.; Musso, F. Salt as a Building Material: Current Status and Future Opportunities. Plan J. 2021, 6, 393–413. [Google Scholar] [CrossRef]
  39. Harrison, E.; Berenjian, A.; Seifan, M. Recycling of waste glass as aggregate in cement-based materials. Environ. Sci. Ecotechnol. 2020, 4, 100064. [Google Scholar] [CrossRef]
  40. Steyn, Z.; Babafemi, A.; Fataar, H.; Combrinck, R. Concrete containing waste recycled glass, plastic and rubber as sand replacement. Constr. Build. Mater. 2020, 269, 121242. [Google Scholar] [CrossRef]
  41. Ghafoori, N.; Diawara, H. Strength and Wear Resistance of Sand-Replaced Silica Fume Concrete. ACI Mater. J. 2007, 104, 206–214. [Google Scholar]
  42. Alwaeli, M. Application of granulated lead–zinc slag in concrete as an opportunity to save natural resources. Radiat. Phys. Chem. 2013, 83, 54–60. [Google Scholar] [CrossRef]
  43. Fares, A.I.; Sohel, K.; Al-Jabri, K.; Al-Mamun, A. Characteristics of ferrochrome slag aggregate and its uses as a green material in concrete—A review. Constr. Build. Mater. 2021, 294, 123552. [Google Scholar] [CrossRef]
  44. Lye, C.-Q.; Koh, S.-K.; Mangabhai, R.; Dhir, R.K. Use of copper slag and washed copper slag as sand in concrete: A state-of-the-art review. Mag. Concr. Res. 2015, 67, 665–679. [Google Scholar] [CrossRef]
  45. Sani, M.S.; Muftah, F.; Muda, Z. The Properties of Special Concrete Using Washed Bottom Ash (WBA) as Partial Sand Replacement. Int. J. Sustain. Constr. Eng. Technol. 2010, 1, 65–76. [Google Scholar]
  46. Limbachiya, M.C. Bulk engineering and durability properties of washed glass sand concrete. Constr. Build. Mater. 2009, 23, 1078–1083. [Google Scholar] [CrossRef]
  47. Freeman, R.E. My Own Book Review. Strategic Management: A Stakeholder Approach. Management 2022, 25, 66–68. [Google Scholar] [CrossRef]
  48. Project Management Institute, A guide to the Project Management Body of Knowledge (PMBOK guide), 6th ed.; Project Management Institute: Newtown Square, PA, USA, 2017.
  49. Olander, S. Stakeholder impact analysis in construction project management. Constr. Manag. Econ. 2007, 25, 277–287. [Google Scholar] [CrossRef]
  50. Phillips, R. Stakeholder Theory and Organizational Ethics; Berrett-Koehler Publishers: Oakland, CA, USA, 2003. [Google Scholar]
  51. Yang, J.; Shen, G.Q.; Ho, M.; Drew, D.S.; Chan, A.P. Exploring critical success factors for stakeholder management in construction projects. J. Civ. Eng. Manag. 2009, 15, 337–348. [Google Scholar] [CrossRef]
  52. Yang, J.; Shen, G.Q.; Drew, D.S.; Ho, M. Critical Success Factors for Stakeholder Management: Construction Practitioners’ Perspectives. J. Constr. Eng. Manag. 2010, 136, 778–786. [Google Scholar] [CrossRef]
  53. Yang, J.; Shen, G.Q.; Ho, M.; Drew, D.S.; Xue, X. Stakeholder management in construction: An empirical study to address research gaps in previous studies. Int. J. Proj. Manag. 2011, 29, 900–910. [Google Scholar] [CrossRef]
  54. Yang, R.J.; Shen, G.Q. Framework for stakeholder management in construction projects. J. Manag. Eng. 2015, 31, 04014064. [Google Scholar] [CrossRef] [Green Version]
  55. Olander, S.; Landin, A. A Comparative Study of Factors Affecting the External Stakeholder Management Process. Construct. Manag. Econ. 2008, 26, 553–561. [Google Scholar] [CrossRef]
  56. Persson, U.; Olander, S. Methods to estimate stakeholder views of sustainability for construction projects. In Proceedings of the 21th Conference on Passive and Low Energy Architecture, Eindhoven, The Netherlands, 9–22 September 2004; pp. 19–22. [Google Scholar]
  57. Bal, M.; Bryde, D.; Fearon, D.; Ochieng, E. Stakeholder Engagement: Achieving Sustainability in the Construction Sector. Sustainability 2013, 5, 695–710. [Google Scholar] [CrossRef] [Green Version]
  58. Bourne, L.; Walker, D.H. Visualising and mapping stakeholder influence. Manag. Decis. 2005, 43, 649–660. [Google Scholar] [CrossRef]
  59. Eskerod, P.; Huemann, M.; Savage, G. Project Stakeholder Management—Past and Present. Proj. Manag. J. 2015, 46, 6–14. [Google Scholar] [CrossRef]
  60. The Impact of Internal Stakeholders on Building Sustainability—IOPscience. Available online: https://iopscience.iop.org/article/10.1149/10701.13917ecst/meta (accessed on 3 June 2022).
  61. Lam, P.T.I.; Chan, E.H.W.; Poon, C.S.; Chau, C.K.; Chun, K.P. Factors affecting the implementation of green specifications in construction. J. Environ. Manag. 2010, 91, 654–661. [Google Scholar] [CrossRef] [PubMed]
  62. AlSanad, S. Awareness, Drivers, Actions, and Barriers of Sustainable Construction in Kuwait. Procedia Eng. 2015, 118, 969–983. [Google Scholar] [CrossRef] [Green Version]
  63. Juntunen, J.K.; Halme, M.; Korsunova, A.; Rajala, R. Strategies for Integrating Stakeholders into Sustainability Innovation: A Configurational Perspective. J. Prod. Innov. Manag. 2018, 36, 331–355. [Google Scholar] [CrossRef]
  64. Berardi, U. Sustainability Assessment in the Construction Sector: Rating Systems and Rated Buildings. Sustain. Dev. 2011, 20, 411–424. [Google Scholar] [CrossRef]
  65. Castro-Lacouture, D.; Sefair, J.A.; Flórez, L.; Medaglia, A. Optimization model for the selection of materials using a LEED-based green building rating system in Colombia. Build. Environ. 2009, 44, 1162–1170. [Google Scholar] [CrossRef]
  66. Wen, B.; Burley, J.B. Expert Opinion Dimensions of Rural Landscape Quality in Xiangxi, Hunan, China: Principal Component Analysis and Factor Analysis. Sustainability 2020, 12, 1316. [Google Scholar] [CrossRef] [Green Version]
  67. Zhang, Y.; Wang, J.; Cai, W. Passengers’ Demand Characteristics Experimental Analysis of EMU Trains with Sleeping Cars in Northwest China. Sustainability 2019, 11, 5338. [Google Scholar] [CrossRef] [Green Version]
  68. Boukary, A.G.; Diaw, A.; Wünscher, T. Factors Affecting Rural Households’ Resilience to Food Insecurity in Niger. Sustainability 2016, 8, 181. [Google Scholar] [CrossRef] [Green Version]
  69. Kaiser, H.F. An index of factorial simplicity. Psychometrika 1974, 39, 31–36. [Google Scholar] [CrossRef]
  70. De Oliveira, L.K.; Bertoncini, B.V.; Nascimento, C.D.O.L.; Rocha, L.B.; Batista, L.A.M.D.L.; Cellin, L.V. Factors Affecting the Choice of Urban Freight Vehicles: Issues Related to Brazilian Companies. Sustainability 2019, 11, 7010. [Google Scholar] [CrossRef] [Green Version]
  71. Diamantopoulos, A.; Siguaw, J.A. Formative Versus Reflective Indicators in Organizational Measure Development: A Comparison and Empirical Illustration. Br. J. Manag. 2006, 17, 263–282. [Google Scholar] [CrossRef]
  72. Hopwood, C.J.; Donnellan, M.B. How Should the Internal Structure of Personality Inventories Be Evaluated? Pers. Soc. Psychol. Rev. 2010, 14, 332–346. [Google Scholar] [CrossRef]
  73. Guldemond, R.A.; Purdon, A.; Van Aarde, R.J. A systematic review of elephant impact across Africa. PLoS ONE 2017, 12, e0178935. [Google Scholar] [CrossRef]
  74. Richman, M.B. A cautionary note concerning a commonly applied eigenanalysis procedure. Tellus B 1988, 40, 50–58. [Google Scholar] [CrossRef] [Green Version]
  75. Greene, W.H. Econometric Analysis, 5th ed.; Prentice Hall: Upper Saddle River, NJ, USA, 2003. [Google Scholar]
  76. Wooldridge, J.M. Econometric Analysis of Cross Section and Panel Data; MIT Press: Cambridge, MA, USA, 2010. [Google Scholar]
  77. Cameron, A.C.; Trivedi, P.K. Microeconometrics: Methods and Applications; Cambridge University Press: Cambridge, UK, 2005. [Google Scholar]
  78. Freedman, A.D. On the So-Called “Huber Sandwich Estimator” and “Robust Standard Errors”. Am. Stat. 2006, 60, 299–302. [Google Scholar] [CrossRef]
  79. Chatterjee, S.; Price, B. Regression Analysis by Example. Biom. J. 1992, 34, 734. [Google Scholar] [CrossRef]
  80. Hwang, B.-G.; Tan, J.S. Green building project management: Obstacles and solutions for sustainable development. Sustain. Dev. 2010, 20, 335–349. [Google Scholar] [CrossRef]
  81. Son, H.; Kim, C.; Chong, W.K.; Chou, J.-S. Implementing sustainable development in the construction industry: Constructors’ perspectives in the US and Korea. Sustain. Dev. 2011, 19, 337–347. [Google Scholar] [CrossRef]
  82. UNEP. Sand and Sustainability: 10 Strategic Recommendations to Avert a Crisis; GRID-Geneva, United Nations Environment Programme: Geneva, Switzerland, 2022. [Google Scholar]
  83. Fischer, D.; Lüdecke, G.; Godemann, J.; Michelsen, G.; Newig, J.; Rieckmann, M.; Schulz, D. Sustainability communication. In Sustainability Science; Springer: Berlin/Heidelberg, Germany, 2016; pp. 139–148. [Google Scholar]
  84. Wu, W.; Issa, R. Integrated process mapping for bim implemenation in green building project delivery. In Proceedings of the 13th International Conference on Construction Applications of Virtual Reality (CONVR 2013), London, UK, 30–31 October 2013. [Google Scholar]
  85. Keysar, E.; Pearce, A.R. Decision Support Tools for Green Building: Facilitating Selection Among New Adopters on Public Sector Projects. J. Green Build. 2007, 2, 153–171. [Google Scholar] [CrossRef]
  86. Ayarkwa, J.; Opoku, D.-G.J.; Antwi-Afari, P.; Li, R.Y.M. Sustainable building processes’ challenges and strategies: The relative important index approach. Clean. Eng. Technol. 2022, 7, 100455. [Google Scholar] [CrossRef]
  87. Stocker, F.; De Arruda, M.P.; De Mascena, K.M.C.; Boaventura, J.M.G. Stakeholder engagement in sustainability reporting: A classification model. Corp. Soc. Responsib. Environ. Manag. 2020, 27, 2071–2080. [Google Scholar] [CrossRef] [Green Version]
  88. Gibson, K. Stakeholders and Sustainability: An Evolving Theory. J. Bus. Ethic 2012, 109, 15–25. [Google Scholar] [CrossRef]
  89. Enshassi, A.; Saleh, N.; Mohamed, S. Barriers to the application of lean construction techniques concerning safety improvement in construction projects. Int. J. Constr. Manag. 2019, 21, 1044–1060. [Google Scholar] [CrossRef]
  90. Sodangi, M. Overcoming the constraints to the adoption of sustainable civil engineering practices. Int. J. Constr. Manag. 2019, 21, 490–507. [Google Scholar] [CrossRef]
  91. Wirahadikusumah, R.; Abduh, M.; Messah, Y.; Aulia, M. Introducing sustainability principles into the procurement of construction works—Case of Indonesian developers. Int. J. Constr. Manag. 2019, 21, 932–944. [Google Scholar] [CrossRef]
Figure 1. Stakeholder analysis (power–interest grid) in construction sustainability projects (I—internal stakeholder, E—external stakeholderre).
Sustainability 14 07674 g001
Figure 2. Intercorrelations of familiarity with 27 sand substitutes. Circles depict the degree of correlation ranging from black (100% positive) to red (100% negative), with clockwise wedges indicating positive correlations and counterclockwise wedges indicating negative correlations.
Sustainability 14 07674 g002
Figure 3. Correlations of continuous variables.
Sustainability 14 07674 g003
Table 1. Sand substitutes: description, use, and references.
Sand SubstituteDescription and UseReference
Agro-waste
  • Plant and shell material including sugarcane bagasse ash, groundnut shell, oyster shell, sawdust, giant reed ash, rice husk ash, cork, and tobacco waste.
  • Used as a partial replacement of fine aggregate which provides additional pozzolanic property in concrete.
[25]
Carbon Cure
  • Technology that introduces recycled CO2 into fresh concrete to reduce its carbon footprint without compromising performance.
  • Used in concrete.
[29]
Construction and demolition waste (e.g., concrete, asphalt, brick, and ceramic materials)
  • Debris generated during the construction, renovation, and demolition of buildings, roads, and bridges.
  • Used as a powder or filler in the composition of construction materials (cement, concrete, asphalt, etc.) or used as aggregates (e.g., concrete, bricks).
[17]
Crushed fine aggregate from quarried stone/Sand from stone
  • Aggregate for road construction and maintenance. It is also used for making cement and lime, as well as for other chemical applications, including in agriculture.
[19]
Cyanobacterial bricks
  • The microbes in the bricks are cyanobacteria, which perform photosynthesis to grow, taking in carbon dioxide.
  • Uses bacteria or fungi to fill cracks in bricks and mortar.
[27]
Foundry sand
  • Byproduct from ferrous and nonferrous metal casting industries with ferrous foundries producing the most sand.
  • Used as a substitute for fine aggregate in asphalt paving mixes. It is also used as a fine aggregate substitute in flowable (or controlled density) fill applications.
[30,31]
Granite dust
  • Otherwise known as M-10 or manufactured sand.
  • Used in concrete.
[32]
Hempcrete/Hemp stone
  • A concrete-like material created from the woody inner fibers of the hemp plant.
  • Used for insulating walls, linings, roofs, screeds, attic spaces, and renders.
[28]
Iron ore tailings
  • A form of solid waste produced during the beneficiation process of iron ore concentrate.
  • Used for making bricks and road-building materials, and for preparing cement and concrete.
[33,34]
Metakaolin
  • A fine natural white clay which has high silica content, also called high-reactivity metakaolin (HRM).
  • Used in cement and concrete.
[35]
Quarry dust
  • Concentrated byproduct releases from the cutting and crushing process of stone.
  • Used as a fine aggregate.
[36]
Recycled tires/rubber
  • Produced from scrap tires.
  • Used in flooring products, including modular and antifatigue tiles, rolled flooring, and rubber flooring underlayments.
[37]
Sea salt
  • Sea salt is a general term for salt produced by evaporation of ocean water or water from saltwater lakes.
  • Used for structural walls, blocks and concrete, and seawater strcutures.
[38]
Sheet glass/glass powder
  • Obtained from crushing waste glass, which is disposed as landfill by glass industries.
  • Used as a fine aggregate.
[39,40]
Silica Fume
  • Byproduct from the production of elemental silicon or alloys containing silicon in electric arc furnaces.
  • Used as cement replacement in high performance concrete.
[41]
Slag
  • Waste separated from metals obtained during smelting and refining the ore, including copper, ferrochrome, nickel, lead, and GGBS.
  • Used as a partial replacement of fine aggregate and cement.
[16,42,43,44]
Washed bottom Ash
  • Waste material from electric power plants and the source material is called bottom ash.
  • Used as a fine aggregate and cement replacement
[45]
Washed glass sand
  • Obtained by recycling used glass.
  • Used in roads, walkways, garden paths, and as a raw material for producing glass sand.
[46]
Table 2. Resulting dimensions of principal component analysis.
DimensionEigenvalueVariance ContributionCumulative Variance Contribution
111.79760.43690.4369
22.12770.07880.5158
31.71720.06360.5794
41.36930.05070.6301
51.14690.04250.6725
60.99610.03690.7094
70.8480.03140.7408
80.67640.02510.7659
90.66980.02480.7907
100.60550.02240.8131
110.53020.01960.8328
120.47050.01740.8502
130.4490.01660.8668
140.40940.01520.882
150.38650.01430.8963
160.36550.01350.9098
170.33880.01250.9224
180.30320.01120.9336
190.27870.01030.9439
200.25920.00960.9535
210.23660.00880.9623
220.220.00810.9705
230.19880.00740.9778
240.18010.00670.9845
250.15330.00570.9902
Table 3. Component-observable loadings of familiarity with 27 sand substitutes.
VariableNATURAL
BYPRODUCT
EARTH
MATERIAL
CONSTRUCTION
WASTE
INDUSTRIAL BYPRODUCTCARBON BASED
FAM_TOB_WASTE0.85−0.230.050.20−0.05
FAM_SALT0.710.080.190.07−0.18
FAM_OIL_PALM0.640.2−0.06−0.030.09
FAM_SHEET_GLASS0.570.090.270.17−0.04
FAM_AGRO0.560.060.070.090.26
FAM_NUTSHELL0.510.160.07−0.100.16
FAM_QUARRY_DUST0.050.920.050.01−0.25
FAM_GRANITE_DUST0.250.830.02−0.04−0.16
FAM_FIRE_BRICKS0.010.66−0.01−0.110.21
FAM_Q_STONE−0.280.630.300.130.09
FAM_SAND_FROM_STONE0.080.570.010.40−0.15
FAM_R_TIRES_RUBBER0.280.100.89−0.21−0.17
FAM_R_PLASTIC0.43−0.140.84−0.18−0.03
FAM_R_GLASS0.15−0.020.630.080.19
FAM_CONSTR_WASTE−0.140.320.61−0.080.19
FAM_METAKAOLIN0.110.08−0.360.830.12
FAM_SILICA_FUME0.08−0.050.020.730.18
FAM_WASHED_BOTTOM_ASH0.46−0.05−0.020.65−0.01
FAM_SLAG−0.07−0.050.000.590.49
FAM_CARBON_CURE0.11−0.22−0.040.270.77
FAM_FLY_ASH−0.23−0.210.210.250.74
FAM_CYANO_BRICKS0.340.22−0.28−0.130.64
FAM_FOUNDRY_SAND0.060.42−0.060.050.41
FAM_HEMP0.47−0.210.24−0.180.48
FAM_IRON_ORE0.480.33−0.030.080.11
FAM_R_CONCRETE−0.230.310.450.250.07
FAM_WASHED_GLASS_SAND0.490.100.10.48−0.10
Note. The main sand substitutes loading on each component are indicated in bold.
Table 4. Descriptive statistics for continuous variables.
VariableMeanSt. Dev.MinPctl(25)MedianPctl(75)Max
SIZE3.041.0812344
YEARS_WORKED2.761.690134.25
AGE2.501.1912235
NATURAL_BYPRODUCTS0.001.00−1.419−0.7300−0.22650.50443.2498
EARTH_MATERIAL0.001.00−1.7933−0.7368−0.07170.65772.3355
CONSTRUCTION_WASTE0.001.00−2.3169−0.65540.00540.80582.1716
INDUSTRIAL_BYPRODUCTS0.001.00−1.5710−0.7999−0.15930.59483.1195
CARBON_BASED0.001.00−2.0059−0.7100−0.07870.70172.5209
Table 5. Descriptive statistics for categorical variables.
VariableLeveln%
1CERTNo8151.9%
2CERTYes7548.07%
3COUNTRYCanada4126.28%
4COUNTRYUS11573.71%
5GENDERFemale4931.41%
6GENDERMale10567.30%
7GENDEROther/Non-Response21.28%
8DECISION_MAKERNo13485.89%
9DECISION_MAKERYes2214.10%
10ROLEAcademic1912.17%
11ROLEArchitect2817.94%
12ROLEEngineer5233.33%
13ROLEManagement5233.33%
14ROLEOther53.20%
Table 6. Results of OLS regressions for five dependent variables.
CONSTRUCTION WASTEINDUSTRIAL
BYPRODUCT
NATURAL
BYPRODUCT
EARTH
MATERIAL
CARBON
BASED
Without
Main
Effects
With
Main Effects
Without
Main Effects
With
Main
Effects
Without
Main
Effects
With Main EffectsWithout
Main
Effects
With
Main
Effects
Without
Main Effects
With
Main Effects
Constant−0.130.060.110.350.541.23 **−0.88 **−0.65−0.63 *−0.52
(0.38)(0.42)(0.37)(0.41)(0.45)(0.52)(0.34)(0.41)(0.35)(0.39)
CERT10.220.28−0.53 ***−0.40 **−0.12−0.100.030.120.32 **0.28
(0.17)(0.19)(0.16)(0.17)(0.17)(0.18)(0.17)(0.18)(0.16)(0.18)
SIZE0.050.04−0.010.002−0.14 *−0.15 *0.030.03−0.02−0.02
(0.08)(0.08)(0.08)(0.08)(0.08)(0.08)(0.07)(0.07)(0.07)(0.07)
COUNTRY1−0.22−0.27−0.15−0.16−0.31−0.30−0.06−0.04−0.01−0.03
(0.20)(0.21)(0.19)(0.19)(0.21)(0.20)(0.18)(0.19)(0.19)(0.19)
YEARS WORKED−0.15 **−0.12 *0.11 *0.14 **−0.06−0.040.010.030.004−0.0004
(0.06)(0.07)(0.06)(0.06)(0.05)(0.06)(0.06)(0.06)(0.06)(0.06)
AGE0.130.14−0.07−0.070.110.110.18 **0.18 **0.18 **0.18*
(0.09)(0.09)(0.08)(0.08)(0.09)(0.09)(0.08)(0.08)(0.09)(0.09)
GENDER20.200.240.260.270.090.120.50 ***0.47 **0.140.16
(0.19)(0.20)(0.18)(0.20)(0.18)(0.17)(0.18)(0.19)(0.18)(0.19)
GENDER4−1.43 *−0.97 **−0.67−0.180.160.04−0.92 ***−0.80 ***−0.86 **−0.77 **
(0.75)(0.49)(0.48)(0.33)(0.22)(0.40)(0.24)(0.29)(0.38)(0.39)
DECISION_MAKER1 −0.35 0.15 0.28 0.12 0.18
(0.25) (0.23) (0.28) (0.23) (0.24)
ROLE2 −0.30 −0.73 ** −0.71 * −0.54 0.02
(0.30) (0.31) (0.39) (0.34) (0.35)
ROLE3 −0.22 −0.33 −1.02 *** −0.36 −0.15
(0.26) (0.28) (0.32) (0.28) (0.28)
ROLE4 −0.22 −0.59 ** −0.93 *** −0.35 −0.18
(0.28) (0.27) (0.33) (0.29) (0.29)
ROLE5 −0.99 *** −1.03 *** −0.46 −0.34 −0.34
(0.30) (0.31) (0.65) (0.35) (0.57)
Observations156156156156156156156156156156
R20.080.120.130.180.060.170.140.160.100.11
Adjusted R20.040.040.090.110.020.100.100.090.060.04
Residual Std. Error0.98
(df = 148)
0.98
(df = 143)
0.95
(df = 148)
0.94
(df = 143)
0.99
(df = 148)
0.95
(df = 143)
0.95
(df = 148)
0.96
(df = 143)
0.97
(df = 148)
0.98
(df = 143)
F Statistic1.94 *
(df = 7; 148)
1.57
(df = 12; 143)
3.21 ***
(df = 7; 148)
2.65 ***
(df = 12; 143)
1.38
(df = 7; 148)
2.48 ***
(df = 12; 143)
3.39 ***
(df = 7; 148)
2.22 **
(df = 12; 143)
2.35 **
(df = 7; 148)
1.48
(df = 12; 143)
Note: * p < 0.10, ** p < 0.05, *** p < 0.01.
Table 7. Summary of results and hypotheses for familiarity with five types of sand substitutes.
HypothesisDependent VariableIndependentResult
1aCONSTRUCTION_WASTEDECISION_MAKERSupported
2aROLEWeakly Supported (“other” less familiar than academics)
1bINDUSTRIAL_BYPRODUCTDECISION_MAKERSupported
2bROLEWeakly Supported (architects, managers, “other” less familiar than academics)
1cNATURAL_BYPRODUCTDECISION_MAKERSupported
2cROLENot Supported (engineers, managers less familiar than academics)
1dEARTH_MATERIALDECISION_MAKERSupported
2dROLESupported
1eCARBON_BASEDDECISION_MAKERSupported
2eROLESupported
Publisher’s Note: MDPI stays neutral with regard to jurisdictional claims in published maps and institutional affiliations.

