Article

The Dynamic Behaviour of a Binary Adsorbent in a Fixed Bed Column for the Removal of Pb2+ Ions from Contaminated Water Bodies

by
Charlene Harripersadth
1,* and
Paul Musonge
1,2
1
Institute of Systems Science, Durban University of Technology, Durban 4001, South Africa
2
Faculty of Engineering, Mangosuthu University of Technology, Durban 4031, South Africa
*
Author to whom correspondence should be addressed.
Sustainability 2022, 14(13), 7662; https://doi.org/10.3390/su14137662
Submission received: 28 May 2022 / Revised: 20 June 2022 / Accepted: 21 June 2022 / Published: 23 June 2022
(This article belongs to the Special Issue Advances in Biomass Valorization Approaches for the Circular Economy)

Abstract

:
In the search for a technically efficient and abundant adsorbent in water treatment processes, a bio-composite adsorbent derived from agricultural wastes has been identified as a potential candidate. In this study, eggshells and sugarcane bagasse were combined in varied proportions (1:0, 1:3, 1:1, 3:1 and 0:1) and applied as biosorbents in a lab-scale adsorption column. The effect of bed depth (4–12 cm) of the biosorbents was investigated which enabled the prediction of breakthrough curves for the removal of Pb (II) ions. The life span of the column was extended by increasing the bed depth of the column. The binary adsorbent of 1:3 weight ratio of <75 µm particle size showcased the highest removal efficiency of 91% at a bed depth of 12 cm. The mass transfer zone (MTZ) increased with increasing bed depth with a minor portion of the bed left unused, signifying that the process was highly efficient. The Thomas model constant, KTh, decreased with increasing bed depth with the maximum amount of Pb adsorbed being 28.27 mg/g. With the Yoon–Nelson model, KYN decreased with an increase in τ as the bed height increased. In this study, a novel approach was adopted where the proposed methodology enabled the use of a bio-composite adsorbent in heavy metal removal. The findings of this research will aid in the design and optimisation of the pilot-scale operation of environmentally friendly treatment options for metal laden effluent.

1. Introduction

The industrial revolution of the 1970s has played a pivotal role in the world as we know it today, and while it has significantly improved the quality of human life, the extensive use of machinery has caused an alarming increase in heavy metal contamination [1]. Heavy metals are dense metallic elements which are known to adversely affect living organisms and the environment, even at low metal ion concentrations [2]. The most common sources of these pollutants are natural and anthropogenic, with metal contamination being mainly due to the discharge of sewage, mining activities and industrial effluents [3,4,5]. Due to their non-degradable nature, they can bioaccumulate causing a great deal of health issues and environmental risks.
Heavy metals found in waste effluent include arsenic, cadmium, chromium, copper, lead, nickel and zinc. Of these, lead has shown to be a predominant contaminant posing a great environmental health risk due to its extensive use, toxicity and widespread distribution [6]. The aforementioned metal is dangerous as a cation (from soluble compounds) and in organometallic forms (bonded to organic molecules). The toxic effect of this metal, even though it has no biological role in the human body, remains present in some form which is harmful to the functioning of the body. The toxicological and carcinogenic effects of Pb (II) ions have been well documented in scientific studies [7,8,9]. While there have been increased efforts to remediate the worldwide environmental challenge [10], progress in this field has not been rapid enough considering its detrimental effects. At present, a wide range of treatment technologies exist such as reverse osmosis [11] and chemical precipitation, with the process of adsorption being widely used as an efficient and economically sustainable technology for metal removal [12]. Moreover, since environmental regulations require stringent standards, it is vital that technical applicability and financial viability are key factors in adsorbent selection [13].
Agricultural waste materials in particular have been widely researched as potential adsorbents for metal removal from contaminated water sources [14,15,16]. Some of these adsorbents include the use of spent tea leaves [17], fruit peels [18] and banana peel powder [19]. The recycling of waste materials is considered a sustainable approach towards waste management practices serving to solve disposal problems which aligns with the circular economy [20]. The use of biosorbents derived from agricultural waste materials is very promising due to their chemical constituents, abundance and high selectivity capabilities. Two such materials are eggshells and sugarcane bagasse. The disposal of eggshells has posed an ongoing pollution problem in the food, bakery and poultry sectors [13], and although research has prompted investigations into the production of biodiesel and collagen, results have not proven to be economically viable. However, with the application of biosorbents in metal removal, promising results have been reported [21,22,23,24]. Sugarcane bagasse, another agricultural waste material is a by-product of the sugarcane industry where disposal is also problematic with some factories resorting to landfills and incineration. As a biosorbent, it is highly efficient, especially when modified. That said, with sustainability efforts taking precedence as key objectives in the industrial sector, together with global warming effects at an all-time high, biosorbents in their natural form are the preferred choice where a trade-off is often needed with respect to efficacy versus environmental impact.
The use of adsorption exploits the ability of certain solid adsorbents to preferentially concentrate the adsorbate onto the surface of the solid. Batch studies are generally conducted to determine equilibrium characteristics and mechanisms for the process [25], in addition to determining the effect of fundamental variables on the efficacy of an adsorbent. With that said, to apply the adsorbents at an industrial level, column studies are vital to explore in order to investigate the operational and technical parameters for successful implementation in terms of scaling up the process. In recent times, there have been several studies focused on the adsorption process using eggshells and bagasse in metal removal [23,26,27,28], but none have reported using a combination of the two. Eggshells are alkaline-rich materials [29] which are dolomitic in nature. The earth has an abundance of rock which is also dolomitic, and so this biomaterial, if proven to be effective, can be easily harnessed from the environment. Likewise, bagasse is a lignocellulosic plant material, the components of which can be found in many plants in the surrounding environment. With this in mind, the application of these biomaterials will contribute towards the 2030 Sustainability Goals within the chemical industry, where a trade-off is usually expected with regards to efficacy in “green” adsorbents. Furthermore, a difference in adsorptive capabilities of naturally occurring adsorbents in comparison to chemically modified/commercial ones is expected.
Thus, the present study deals with the scope of conducting batch studies in the removal of Pb ions with fixed bed column studies investigated to explore the effect of bed depth on the five adsorbents used in this work. The adsorbents were characterised using the analytical technique of Fourier transform infrared (FTIR) spectroscopy and scanning electron microscopy (SEM) analysis. Concentration–time breakthrough curves were plotted against two mathematical models (Thomas and Yoon–Nelson) which were used to predict the adsorption behaviour of the adsorbents. The interpretation of the relevant technical parameters with respect to column performance was documented to gain insight into the technical aspects of the process.

2. Materials and Methods

2.1. Preparation of the Biosorbents

Waste sugarcane bagasse and eggshells were sourced from a local sugar mill and take-away and in Durban, South Africa. After collection, they were washed with deionised water several times to remove any sand and dirt particles present. Following the methodology of Wong et al. [30] and Mao [31], the adsorbents were dried in an oven at 105 °C until constant weight. After drying, the biomaterials were crushed using a coffee grinder in 30 s intervals and sieved to achieve the particle size of x < 75 µm. To prepare the binary adsorbents with the ratios of 1:3, 1:1 and 3:1, the 2 biomaterials were combined on a dry weight basis corresponding to the ratios presented in Table 1 below the biosorbents were stored in an airtight container for use. The samples were used in its natural form without any chemical modifications [32].

2.2. Characterisation of the Biosorbents

2.2.1. Fourier Transform Infrared (FTIR) Spectroscopy

The functional groups present on the surface of the biomass were qualitatively detected with Fourier transform infrared (FTIR) spectroscopy using a spectrum spectrophotometer. This is important in elucidating the mechanisms responsible in the biosorption process. The spectrum was obtained in a frequency band range from 4000 to 400 cm−1.

2.2.2. Scanning Electron Microscopy (SEM)

A FEI Nova Nano SEM 230 Scanning Electron Microscope was used to characterise the surface morphology of the biomass surface. An ETD and TLD detector was used with a high-resolution immersion lens. An EDS detector (Oxford X-Max equipped with INCA software Landing E 5.00 KeV), HFW of 5.97–298, spot of 3.5 and WD of 4.9–7.4 was used (Capetown, South Africa).

2.3. Batch Experiments

A synthetic stock solution of Pb (II) ions of 1000 mg/L concentration was prepared by dissolving 1.60 g of lead nitrate Pb(NO3)2 in 1L deionised water. The stock solution was subsequently diluted to the required concentration using deionised water. All chemicals used in the experiments, 0.1 M NaOH and 0.1 M H2SO4 (for pH adjustment) and 1N HNO3 which was used to clean the glassware, were of analytical reagent grade and obtained from Sigma-Aldrich (St. Louis, MO, USA) chemical company.
A comparative performance study was conducted to evaluate the performance of the adsorbents in batch studies. For each batch test, a 100 mg/L concentrated adsorbate solution was prepared by diluting the stock solution with the addition of an appropriate amount of deionised water. For each experiment, 1.0 g of adsorbent was mixed with 100 mL of metal solution in a 1 L glass beaker which was agitated at 150 rpm for a duration of 120 min to ensure equilibrium was reached. The pH of the aqueous solutions was maintained at 5.5 with 0.1 M H2SO4 or 0.1 M NaOH. All experiments were conducted at room temperature. After each experiment, the glassware used was cleaned with deionised water followed by 1N HNO3. The supernatant solution was filtered using 0.45 µm syringe filters where a Varian Spectra AA 50B atomic absorption spectrophotometer (product of Spain) was used to determine the concentration of the samples. A calibration curve of Pb was plotted by measuring the absorbance at 283.3 nm for Pb at varying concentrations. Absorbance values with a standard deviation greater than 1% were discarded, and an average value was taken from the duplicate results.
The adsorption uptake and percentage removal of metal ions from the aqueous solution (mg of adsorbate/g of adsorbent) was calculated using Equations (1) and (2):
q e =   C o   C t W   V  
%   R = 100   ( C o   C t ) C o  
where q e is the amount of metal ion adsorbed per gram of adsorbent (mg/g), Co (mg/L) is the initial metal ion concentration, Ct (mg/L) is the metal ion concentration at time t, W(g) is the mass of the adsorbent used and V (L) is the volume of the solution.

2.4. Fixed Bed Experiments

The experimental setup for the lab-scale adsorption column is shown in Figure 1, which consists of an adsorption column of borosilicate glass of 2.3 cm in diameter and 30 cm in height. Fixed bed studies using 5 adsorbents of varying ratios (1:0, 3:1, 1:1, 1:3, 0:1) in the removal of Pb ions were investigated. The column was packed with a desired amount of adsorbent between two supporting layers of glass wool (1 cm) with a 1 cm layer of glass beads (5 cm in size) at the top and bottom of the column to provide a uniform flow. All experiments were performed in a down-flow configuration using a Flexflow A-100 NV peristaltic pump at room temperature (298 K). For each fixed bed experiment, deionised water was allowed to pass through the adsorbent bed until complete wetting of the adsorbent particles was achieved. The outlet stream (product) was collected at predefined intervals (30 min for the first 5 h and thereafter at 2 h intervals) which were analysed using an AAS spectrophotometer. The effect of bed depth on the breakthrough curves was investigated at 4, 8 and 12 cm bed depth (corresponding to a range of masses between 3.82 and 59.83 g) at a constant flowrate of 4 mL/min, initial Pb concentration of 100 mg/L and at pH 5.5. All experiments were carried out in duplicate, and the average values were used for further calculations.
The treated effluent volume of the column is calculated as follows:
V eff = Q   t total
where ttotal is the total flow time in min, and Q is the volumetric flowrate which circulates through the column in (mL/min).
The performance of an adsorption column for a given adsorbent is directly related to the number of bed volumes processed before the breakthrough point is reached [16]. The number of bed volumes treated before breakthrough can occur is given by the following Equation:
( BV ) =   Volume   break   point   ( L ) Volume   of   adsorbent   bed   ( L )  
The rate at which the adsorbent gets exhausted during adsorption is used to determine when the adsorbent needs replacement or needs to be regenerated. The adsorption exhaustion rate (AER) of an adsorbent is determined by Equation (5):
AER =   mass   of   adsorbent   ( g ) Volume   of   water   treated   ( L )  
The area under the breakthrough curve represents the maximum column capacity, qtotal, in mg, for a given feed concentration and flowrate which is determined by integrating the following Equation:
q total =   Q 1000   t = 0 t = t total C ad   dt  
where Cad = Ci − Ce is the adsorbed metal concentration in mg/L, ttotal is the total flow time in min, Q is the flowrate (mL/min) and A is the area under the breakthrough curve (cm2).
The total amount of adsorbate delivered to the column is expressed by the equation below:
m t = C o Qt total 1000  
where Co is the initial concentration in mg/L, Q is the flowrate in mL/min and ttotal is the total time in min.
The mass transfer zone (MTZ) represents the length of unused bed and is calculated using the following equation [17]:
H UNB = ( 1 t u t t ) H T  
where tu is the breakthrough time in min, and tt is the total time in min. HT is the total length in cm.
The total removal percentage of adsorbate is found from the ratio of total adsorbed quantity of adsorbate Madsorbed to the total amount of adsorbate sent to the column mtotal as given by the following Equation:
%   Removal =   M adsorbed m total × 100  
where Madsorbed is the total adsorbed quantity of adsorbate in g and mtotal is the total amount of adsorbate sent to the column in g.
The column efficiency is expressed as follows:
η = q b q e × 100  
where qb is the capacity at breakthrough in mg/g and qe is the capacity at exhaustion in mg/g.

2.5. Mathematical Modelling

2.5.1. The Thomas Model

In the Thomas model, performance is governed by the Thomas rate constant and the outlet concentration. The Thomas model is based on two assumptions [33]. The first assumption assumes Langmuir kinetics of adsorption–desorption with no axial dispersion, whilst the second assumes that the rate driving force obeys second-order reversible reaction kinetics [34]. In this model, the rate constant is used to calculate the maximum solid phase concentration of the solute (qo) which is represented by the linearised form as given below:
ln [ ( C o C t ) 1 ] = ( k TH q o m Q ) ( k TH q o V eff Q )  
where kTH is the Thomas rate constant (mL/mg.min), qo is the equilibrium adsorbate uptake (mg/g) and m is the adsorbate quantity (g). The kTH and qo values are calculated from slope and intercepts of linear plots of ln [(Co/Ct) − 1] against t using values from the column experiments [35].

2.5.2. The Yoon–Nelson Model

The Yoon and Nelson model is derived based on the assumption that the rate of decrease in the probability of adsorption for each adsorbate molecule is proportional to the probability of adsorbate breakthrough on the adsorbent [36]. The linearized model for a single component system is expressed as follows:
ln C t C o   C t =   k YN t   k YN τ  
where KYN is the rate constant (L/min) and τ is the time required for 50% of adsorbate breakthrough to occur. The values of KYN and τ are estimated from slope and intercepts of the linear graph between ln [Ct/Co − Ct] versus t at different operational conditions [35].
The validity of the two breakthrough models (Yoon–Nelson and the Thomas model) used in this study were assessed by means of two widely used error metrics, the root mean squared error (RMSE) and the mean absolute error (MAE), which evaluates the goodness of fit between the actual and predicted breakthrough curves. Generally, the lower the RMSE and MAE values, the better the fit between the model and the experimental data.

3. Results and Discussion

3.1. Characterisation

3.1.1. Fourier Transform Infrared (FTIR) Spectroscopy Analysis

The defining peaks of bagasse (Figure 2a) occur at the wavelengths of 3345 cm−1, 1736 cm−1, 1364 cm−1, 1217 cm−1, 1035 cm−1 and 899 cm−1. A medium broadband peak was observed at 3345 cm−1 due to hydroxyl groups, and the sharp peak at 1736 cm−1 represents C=O carbonyl groups. The bands observed within the range of 1364 to 1035 cm−1 were due to the C–O stretching vibration of cellulose, lignin and hemicellulose as supported by Gurgel et al. [27] and Putra et al. [37]. The minor peak at 899 cm−1 was due to the glycosidic bond in cellulose. With eggshells (Figure 2b), the weak minor band at 1740 cm−1 was characteristic of C=O stretching of carboxylic acid. The characteristic of C=O stretching at the above wavenumber was further discussed by Flores-Cano et al. [24,35]. The sharp absorption bands at 1405, 873 and 712 cm−1 were characteristic of the mineral carbonate with the absorption band at 1405 cm−1 characteristic of the C–O bond in the carbonate due to a stretching vibration. Moreover, the two sharp bands at 874 and 711 cm−1 were due to the out-of-plane and in-plane deformation modes of carbonate, respectively.
With the binary adsorbents (Figure 2c), a lower transmittance was seen with the binary adsorbent of 1:3 ratio indicative of a high population of bonds with vibrational energies capable of adsorption. In contrast, the binary adsorbent ratios of 1:1 and 3:1 were found to have higher transmittance, implying that there were fewer bonds of functional groups in those adsorbents. It was interesting to find that the broad peaks at 3345 cm−1 due to the hydroxyl groups present in bagasse were completely inhibited in the binary adsorbents. This revealed that when the adsorbents were combined, both adsorbents interacted with each other, altering the chemical structure and functional groups of the adsorbents. Bagasse is an acidic lignocellulosic material. When combined with an alkaline biomaterial such as eggshells, it is plausible that a reaction (i.e., a modification of the structure) occurs. The weak narrow bands observed at 1217cm−1 due to the C–O stretching vibration of cellulose, lignin and hemicellulose were still visible but were less pronounced. Additionally, the sharp, narrow peaks observed in eggshells at 713, 874, 1411 and 1741 cm−1 were still prominent in the binary adsorbents with the peaks being more pronounced with increasing eggshell content. This was indicative that the adsorbent combinations were rich in the mineral carbonate with the C=O stretching of carboxylic acid and the stretching vibration of the C–O bond together with the in-plane and out-of-plane deformation modes of carbonate, respectively.

3.1.2. Scanning Electron Microscopy (SEM)

The general view of bagasse depicted a circular pore as seen from Figure 3a. With eggshells (Figure 3e), layered cloud-like grains which formed the matrix of the biomass were prominent. Notably, layered surfaces provide a larger surface area available for adsorption when compared to flat one-dimensional surfaces. For the combination of adsorbents (Figure 3b–d), as the content of eggshells increased, the SEM images appeared to consist of a layered surface. Generally, observation of structural morphology is a subjective analytical technique and it is often difficult to interpret without the expert opinion of experienced professionals dealing with this type of analysis. In this regard, it is recommended that additional analytical techniques such as BET analysis be conducted to complement the SEM observations.

3.2. Comparative Performance of the Adsorbents

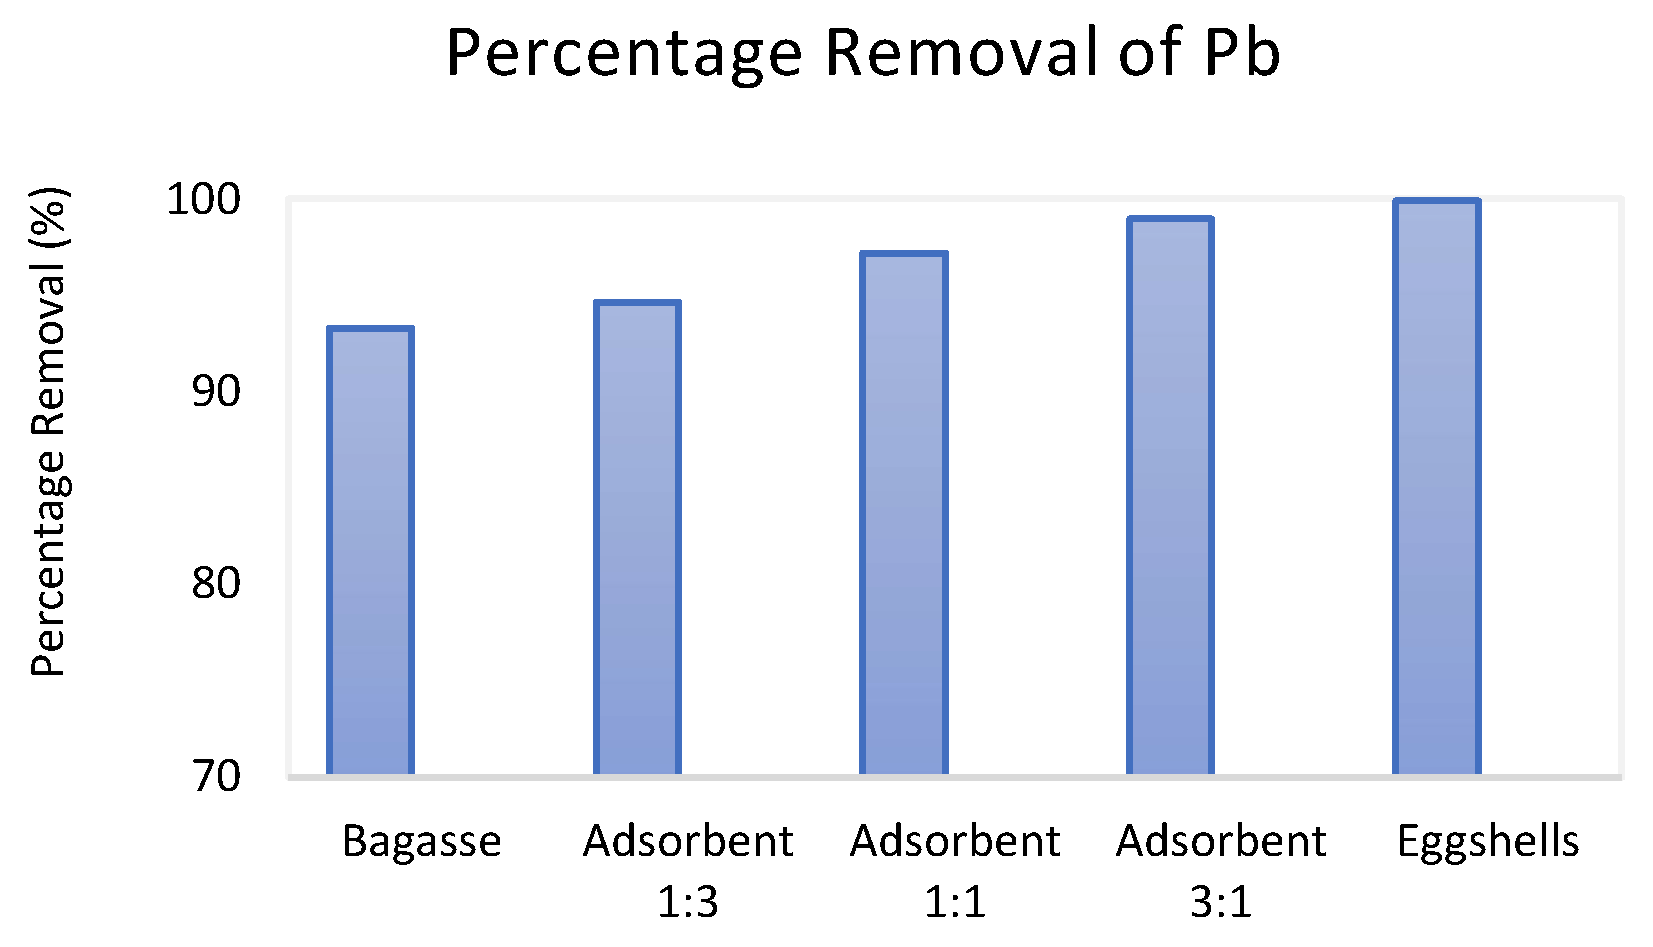
The percentage removal for Pb ions was in the range of 93 to 99% (Figure 4) for all the adsorbents studied. Eggshells and the binary adsorbent of 1:3 ratio was found to be most proficient in the removal of Pb ions. The order of efficiency for Pb removal was as follows: eggshells > adsorbent 1:3 > adsorbent 1:1 > adsorbent 3:1 > bagasse. Supporting these results is the FTIR analysis, which shows that the possible removal mechanisms could be due to the carboxyl groups present in eggshells that increased as the content of eggshells in the binary adsorbents increased.

3.3. Breakthrough Curve Analysis

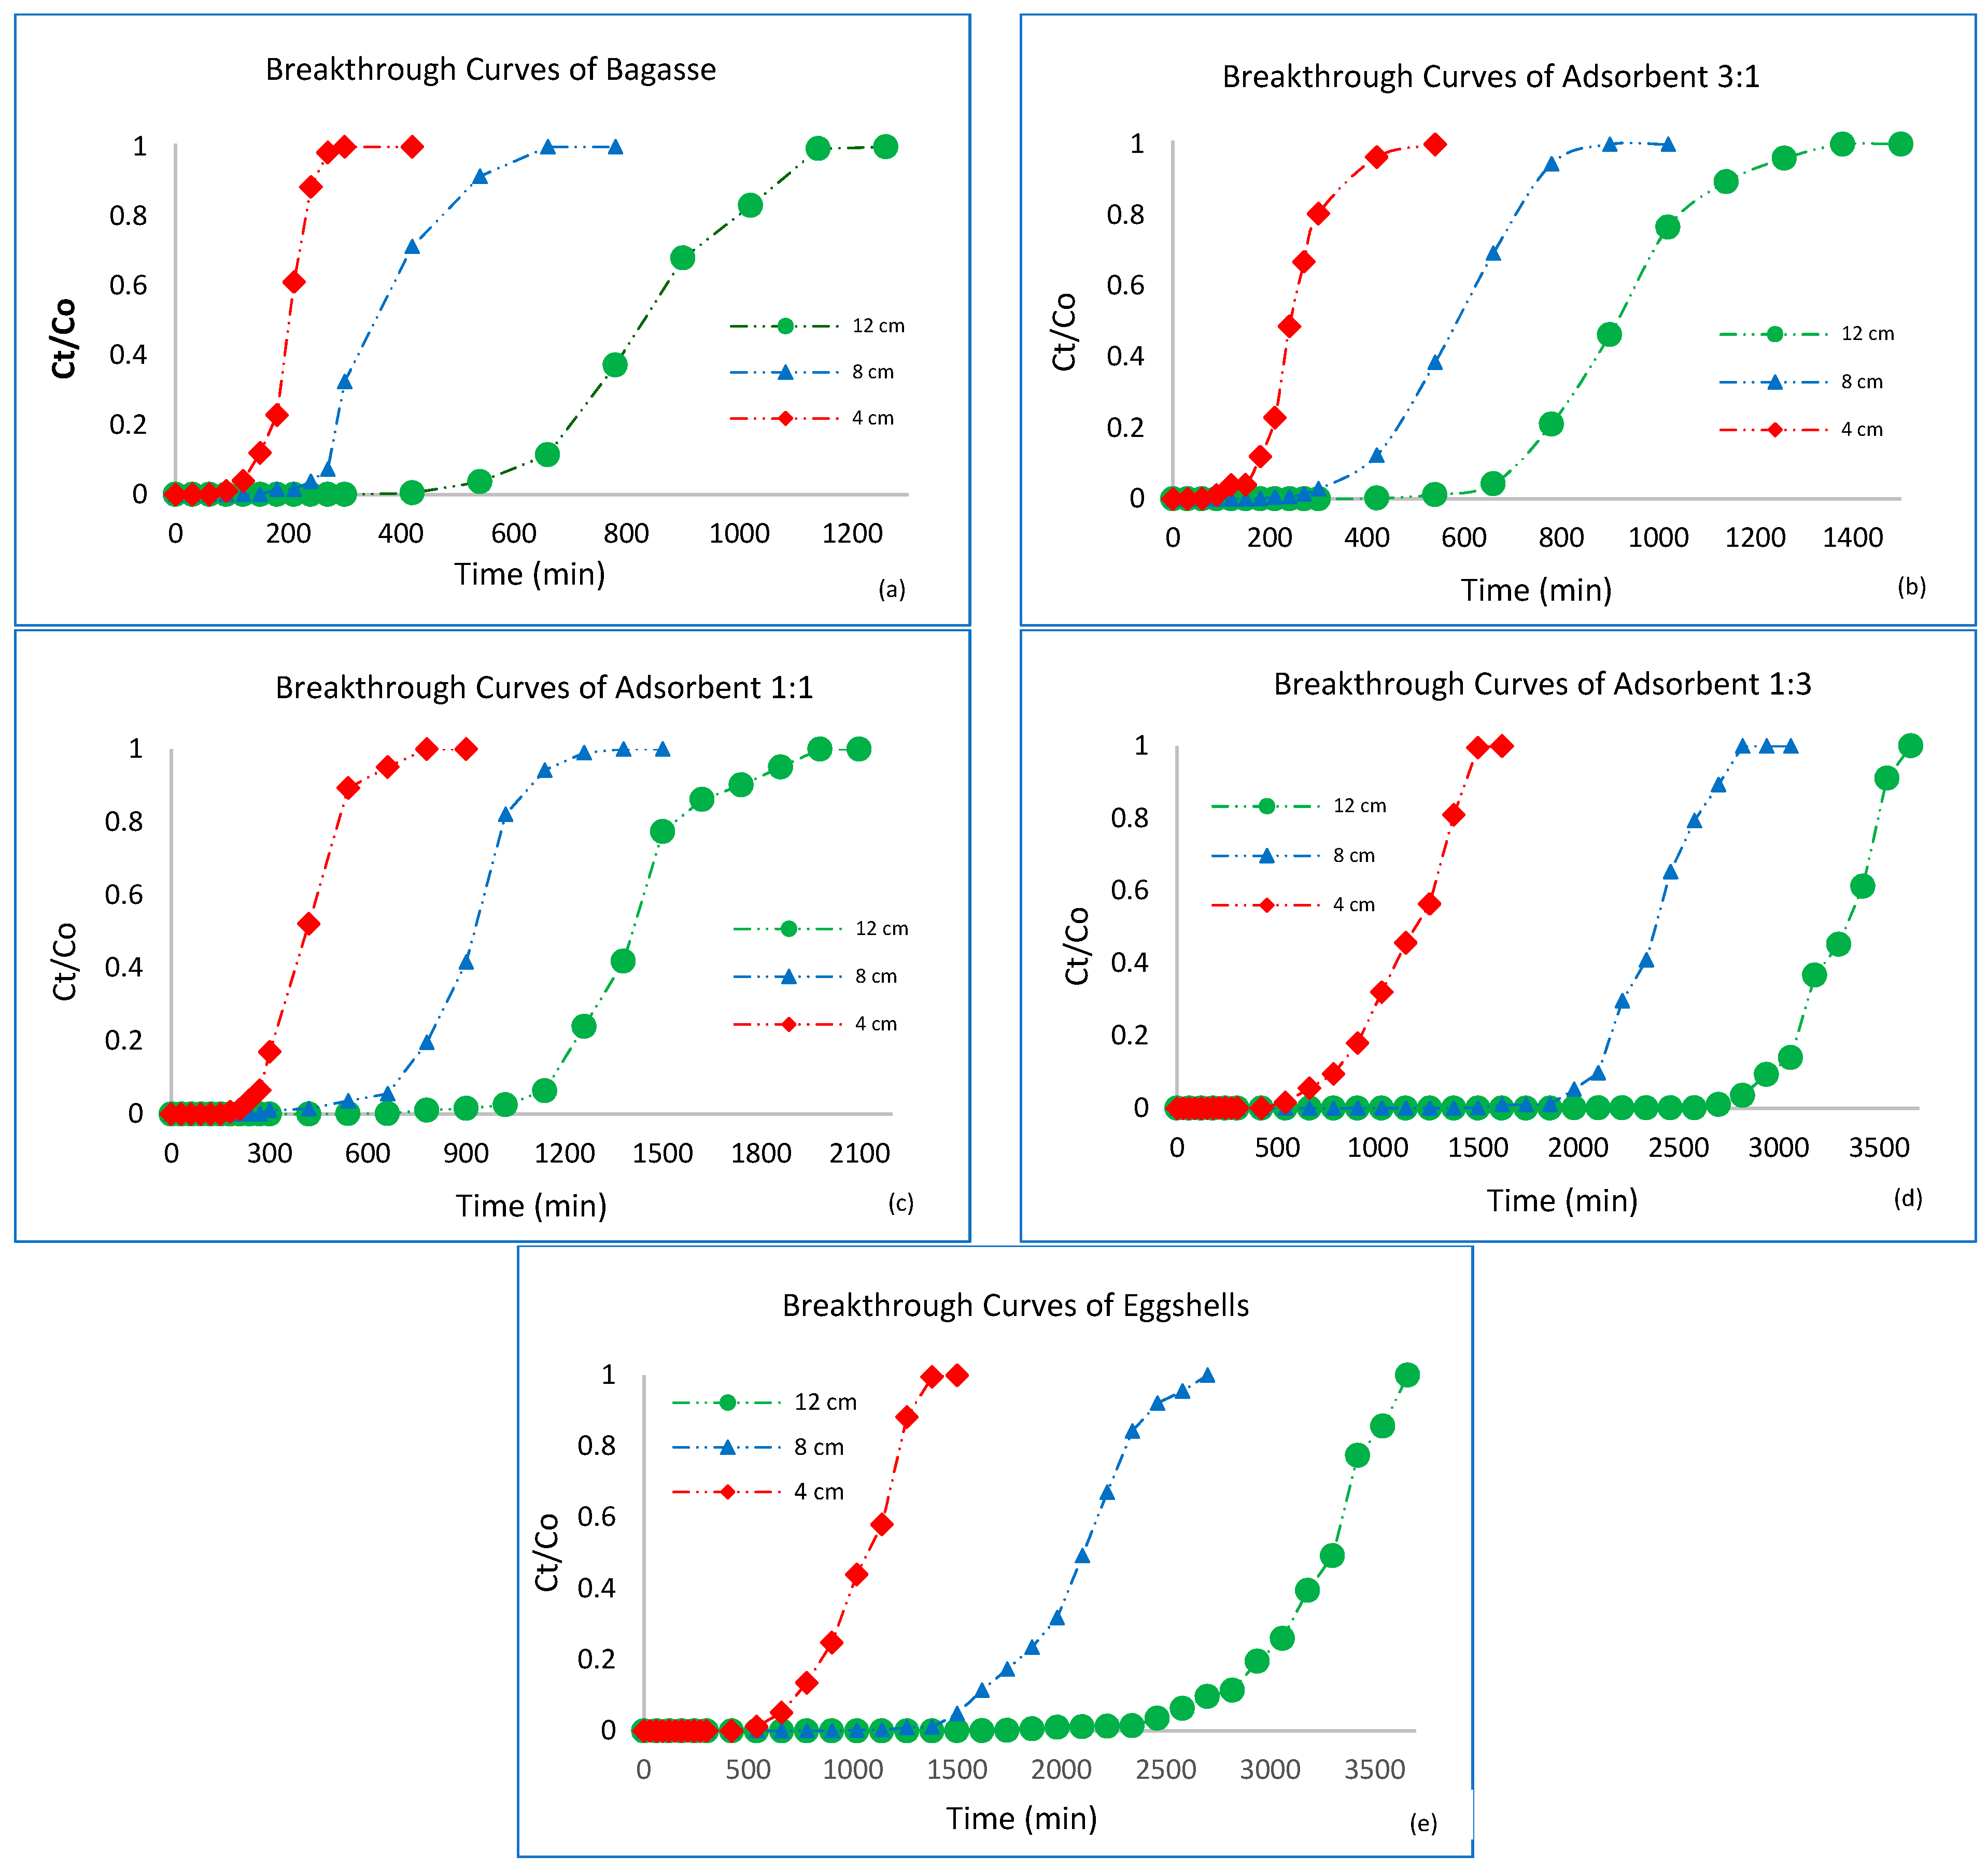
Fixed bed experiments were conducted to investigate the effect of bed depth (4, 8 and 12 cm) on the performance of the five adsorbents (eggshells, bagasse, adsorbent 3:1, adsorbent 1:1 and adsorbent 1:3) at a constant flowrate of 4 mL/min, an initial Pb concentration of 100 mg/L at pH 5.5 which was determined as the optimum pH in earlier studies [38]. Breakthrough curves were plotted as shown in Appendix A and the results presented in Table 2. The breakthrough point was chosen as 1% of C/Ci with a saturation point of 95% which is the standard limits of Pb ions in wastewater. From earlier batch studies, the equilibrium data were found to follow the Langmuir isotherm thereby producing typical S shaped breakthrough curves [39] in the fixed bed experiments.

3.4. Effect of Bed Height

From the results, a consensus was found where an increase in dosage (bed depth) increased the removal percentage, the mass transfer zone (MTZ), volume of effluent treated to breakpoint, breakthrough time, exhaustion time and adsorption capacity for the adsorbents. With increased dosages, there is a larger quantity of adsorbent particles present in the column, and therefore, more available sites for the adsorbate to be adsorbed, in addition to longer contact time for adsorbate–adsorbent interactions to take place [40]. The results of this study were in accordance with several other researchers [12,14,16]. Moreover, longer beds have longer diffusion paths thus allowing the adsorbate more time to penetrate the adsorbent particles in the column allowing for a longer distance for the mass transfer zone to reach the exit resulting in extended breakthrough times [12,41]. With that said, according to Luo et al. [42], at lower bed depths, the axial dispersion phenomena dominates in the mass transfer zone and reduces the diffusion of adsorbate ions. Notably, the majority of adsorption of the solute takes place in the mass transfer zone where it is preferred to have a sharp mass transfer zone so that efficient use of the adsorbent occurs [39].
The optimum composition for the highest removal uptake of Pb was found to be the mixed adsorbent of 1:3 ratio constituting of 75 wt% eggshells with 25 wt% bagasse being able to treat the largest volume of water with the largest adsorption capacities.

3.5. Bed Volumes (BV)

The performance of breakthrough curves is governed by the number of bed volumes processed before the bed is deemed ineffective. It is preferred to have a large number of bed volumes for a particular adsorbent since this means regeneration is not needed as often. From Table 2, it was found that by increasing the bed length, the adsorbents could process more water before it required regeneration or needed to be discarded. The mixed adsorbent of 1:3 ratio had the largest bed volume thereby being able to be used for a longer period before it required regeneration. By increasing the length from 4–8 cm, the adsorbent was able to be used 40% longer (from 122–210 bed volumes). However, the effect of moving from 8–12 cm was not as significant (210–212 bed volumes).

3.6. Adsorption Exhaustion Rate (AER)

The adsorption exhaustion rate is another performance indicator used in fixed bed operations where low AER values implies good performance of a bed [16]. From Table 2, as the bed depth increased, the AER values decreased. For depths of 4, 8 and 12 cm, the mixed adsorbent with 1:3 ratio was the most proficient with the lowest recorded AER values of 3.35, 3.34 and 3.58 respectively. On the contrary, the AER value of 3.58 at a depth of 12 cm was an outlier.

3.7. Mass Transfer Zone (MTZ)

The value of HUNB represents the length of bed unused in a column and is pivotal in column design since it represents the mass transfer zone (MTZ). When this value is small, it suggests that the breakthrough curve is close to an ideal step with negligible mass transfer resistance and no axial dispersion [43]. However, in reality, an ideal case is rarely achieved where the value of the mass transfer zone is zero. The closer the column is operated to the ideal case, the more efficient the MTZ [44]. It is common practice to stop a column’s operation once the breakthrough point is reached since this implies that the usefulness of a column has expired. However, it is necessary to continue operation until exhaustion to determine the length of the bed unused, HLUB, which is an important technical variable needed for the column scale-up which also affects the feasibility of the process [44].
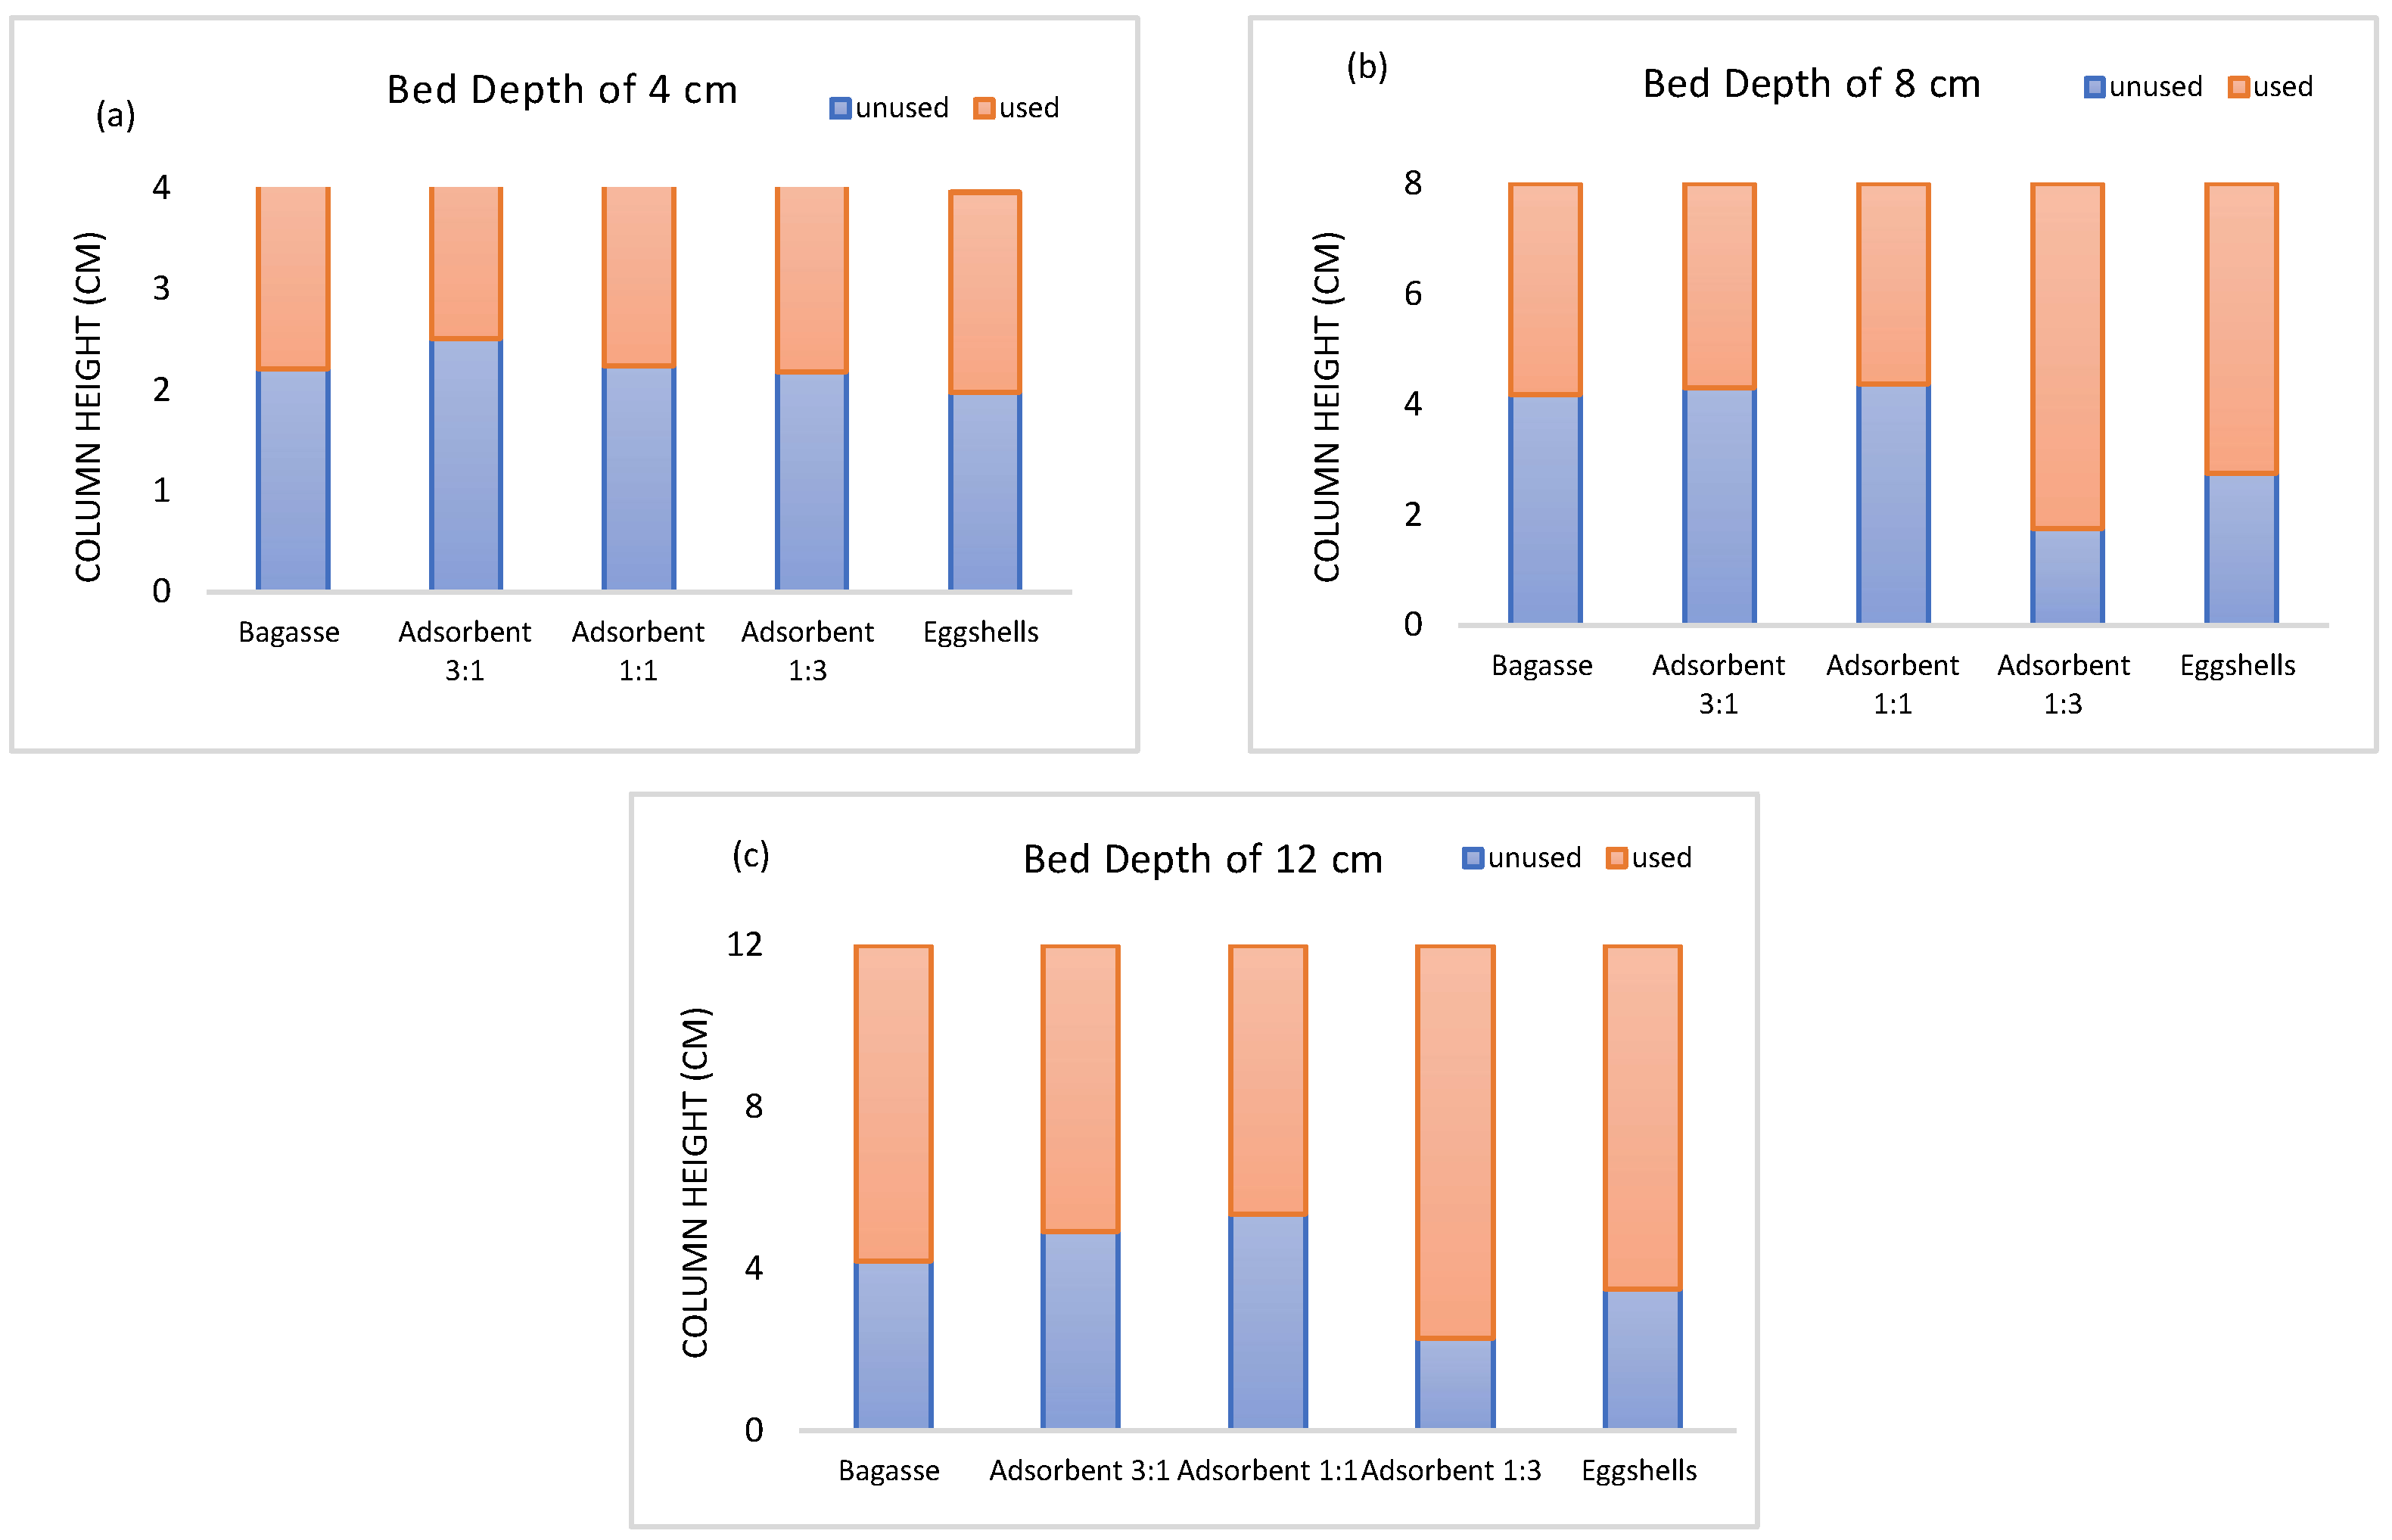
The increase in bed height increased the MTZ of the adsorbents as shown in Table 2. The MTZ moved from the entrance of the bed and proceeded towards the exit. Hence for same influent concentration of 100 mg/L, an increase in bed height (4–12 cm) created a longer distance for the MTZ to reach the exit subsequently resulting in a longer lifespan of the column. This in turn led to a longer time for the MTZ to approach fully developed flow. With the exception of the binary adsorbent of 1:1, all the adsorbents had a HLUB/HL ratio of less than 1. The MTZ length (HLUB) for the adsorbent 1:3 and eggshells were relatively small in comparison to HL (Figure 5 and Table 2), highlighting that most of the bed had been used at breakpoint (HL > HLUB) which is indicative of an efficient process [45].
The percentage of metal removal until exhaustion (%R) of the column was much higher when the column height was increased. Metal removal % of Pb ions was between 60 and 90% within the range of height investigated with the binary adsorbent (1:3) and eggshells being able to remove up to 90% Pb ions at a depth of 12 cm. The highest column efficiency (81%) was obtained for adsorbent 1:3 supported by the MTZ length of 2.29 cm (Figure 5c).

3.8. Breakthrough Curve Modelling

Mathematical modelling is an important tool in the design and optimisation of a fixed bed adsorption column. The validation of a model is achieved by assessing a model against the data obtained from a lab-scale column.

3.8.1. Application of the Thomas Model

The experimental data were fitted to the Thomas model to determine the Thomas rate constant (KTh) and the maximum solid-phase concentration (qo,th) which were ascertained by linearising the data and calculating the parameters from this model. As the bed height of the adsorbents increased, the values of the kinetic constant, KTh, decreased for all adsorbents concerned. In other words, a shorter contact time was required for adsorbent–adsorbate interactions to occur since there was a greater quantity of adsorbent particles available to adsorb the solute. Upon comparison between the experimental data (qo,exp) and the maximum capacity from the model (qo,th), there was a very close agreement between both values, highlighting that this model was a good fit as seen from the coefficients of determination (R2), most of which were found to be >0.9, indicating the goodness of fit. Supporting this, the work of Malkoc et al. [41] showed a negligible difference between experimental and predicted values of the bed capacity suggesting that the Thomas model is valid.
From earlier batch studies [38], the removal of Pb ions followed the pseudo-second-order reaction kinetics with the equilibrium data following the Langmuir isotherm which are two assumptions of the Thomas model suggesting that this model is a good fit to the experimental data. However, with this model, caution should be exercised since the adsorption process is not solely limited by chemical interaction kinetics and is often controlled by interphase mass transfer resistances as stated by Aksu and Gönen [46]. Two error metrics were used to analyse the variation in error of the experimental data against the Thomas model, namely RMSE and MAE. From Table 3, the values obtained were very low, highlighting the good fit between the model and experimental data. In this regard, the work of Chai and Draxler [47] states that RMSE is not a good indicator of average model performance, which could be a misleading indicator of the average error, and thus MAE is a better metric. Considering this, the results of the MAE were <0.02, much lower than the RMSE values of <0.08.

3.8.2. Application of the Yoon–Nelson Model

The model developed by Yoon and Nelson was used to predict the adsorption of Pb by calculating 50% of the breakthrough time. This was carried out by linearising the data and calculating the desired constants, KYN and τ, for the model. As shown in Table 4, KYN decreased and τ increased as the bed height increased for all adsorbents concerned. As the mass of the adsorbents increased, there were more available adsorbent particles in the column to interact with, and hence a longer time was required to reach 50% breakthrough. In addition, by increasing the mass, a larger number of particles was available for adsorption to occur, requiring a shorter contact time for adsorbent–adsorbate interactions. Upon comparison between the experimental times (τ,exp) and the calculated times from the Yoon–Nelson model (τ,th), there was a relatively good agreement between both values, highlighting that this model was a good fit as seen from the correlation coefficients (R2). The work of Zhang et al. [48] supported these results with the correlation coefficients R2 being fairly close to 1 and the theoretical model matching the experimental data well. For this study, the Yoon–Nelson model was adequate in the description of the adsorption of Pb removal since the fixed bed experiments investigated a single-solute system. However, it should be noted that when dealing with multi-component systems, this model is not advisable since it is developed for single-solute systems. On the contrary, when estimates are required on the breakthrough times without physical information given on the adsorbent, the ease of use of this model makes it an ideal choice since it has a simple form when compared to other models as detailed data concerning the character of adsorbate–adsorbent interactions and parameters of the fixed bed are not required [49]. RMSE and MAE were used to analyse the variation in error of the experimental data against the Yoon–Nelson model. The RMSE and MAE values obtained were very low, highlighting the good fit between the model and experimental data. The RMSE values calculated were <0.06 and the MAE values <0.03.

4. Conclusions

From the Fourier transform infrared (FTIR) spectroscopy analysis, it was found that carboxylic and carbonate functional groups were present in eggshells, with hydroxyl and carbonyl groups present in bagasse. Fixed bed studies showed that bed performance improved with an increase in bed depth resulting in greater mass transfer zones (MTZs), breakthrough times and larger quantities of effluent treated. Two kinetic models (Thomas and Yoon–Nelson) were used to interpret the fixed bed breakthrough curves for the removal of Pb ions. The data of both models were able to simulate the breakthrough curves in the region of breakpoint and saturation. The mixed adsorbent of 1:3 ratio was found to be most proficient in the removal of Pb ions with eggshells, adsorbent 1:1, adsorbent 3:1 and bagasse following suit. Future lines of work should look at testing the adsorption potential of the adsorbents using real waste effluent instead of synthesized solutions to determine whether the adsorbents can be applied at an industrial scale. Additionally, multi-solute systems could also be investigated. In conclusion, evidence provided in this study shows that the simultaneous use of biosorbents has good promise for applications in viable adsorbents for bioremediation.

Author Contributions

Resources, C.H., Investigation, C.H., Methodology, C.H., Formal Analysis, C.H., Data Curation, C.H., Writing—Original Draft, C.H., Supervision, P.M., Writing—Review and Editing, P.M. All authors have read and agreed to the published version of the manuscript.

Funding

This research received no external funding.

Informed Consent Statement

Not applicable.

Data Availability Statement

Not applicable.

Conflicts of Interest

The authors declare no conflict of interest.

Appendix A

Figure A1. Effect of bed depth on the breakthrough curves of bagasse (a), adsorbent 3:1 (b), adsorbent 1:1 (c), adsorbent 1:3 (d) and eggshells (e) (F = 4 ml/min, Co = 100 mg/L, pH = 5.5).
Sustainability 14 07662 g0a1

References

  1. Abdolali, A.; Ngo, H.H.; Guo, W.; Zhou, J.L.; Zhang, J.; Liang, S.; Chang, S.W.; Nguyen, D.D.; Liu, Y. Application of a breakthrough biosorbent for removing heavy metals from synthetic and real wastewaters in a lab-scale continuous fixed-bed column. Bioresour. Technol. 2017, 229, 78–87. [Google Scholar] [CrossRef] [Green Version]
  2. Jaishankar, M.; Tseten, T.; Anbalagan, N.; Mathew, B.B.; Beeregowda, K.N. Toxicity, mechanism and health effects of some heavy metals. Interdiscip. Toxicol. 2014, 7, 60–72. [Google Scholar] [CrossRef] [Green Version]
  3. Lakherwal, D. Adsorption of Heavy Metals: A Review. Int. J. Environ. Res. Dev. 2014, 4, 41–48. [Google Scholar]
  4. Lestari, I. Isotherm and Kinetics of Cd(II) Adsorption by Durian (Durio zibethinus) seed Immobilized into Ca-alginate. In Proceedings of MICoMS; Emerald Reach Proceedings Series; Emerald Publishing Limited: Bradford, UK, 2018; Volume 1, pp. 569–574. [Google Scholar]
  5. Aldaghi, T.; Javanmard, S. The evaluation of wastewater treatment plant performance: A data mining approach. J. Eng. Des. Technol. 2021. ahead of print. [Google Scholar] [CrossRef]
  6. Tchounwou, P.B.; Yedjou, C.G.; Patlolla, A.K.; Sutton, D.J. Heavy metal toxicity and the environment. Mol. Clin. Environ. Toxicol. 2012, 101, 133–164. [Google Scholar] [CrossRef] [Green Version]
  7. Cruz-Olivares, J.; Perez-Alonso, C.; Barrera-Díaz, C.; Ureña-Nuñez, F.; Chaparro-Mercado, M.; Bilyeu, B. Modeling of lead (II) biosorption by residue of allspice in a fixed-bed column. Chem. Eng. J. 2013, 228, 21–27. [Google Scholar] [CrossRef]
  8. Morosanu, I.; Teodosiu, C.; Paduraru, C.; Ibanescu, D.; Tofan, L. Biosorption of lead ions from aqueous effluents by rapeseed biomass. New Biotechnol. 2017, 39, 110–124. [Google Scholar] [CrossRef] [PubMed]
  9. Dong, Y.; Lin, H. Competitive adsorption of Pb(II) and Zn(II) fromaqueous solution by modified beer lees in a fixedbed column. Proc. Saf. Environ. Protect. 2017, 111, 263–269. [Google Scholar] [CrossRef]
  10. Farouk, A.M.; Rahman, R.A.; Romali, N.S. Economic analysis of rehabilitation approaches for water distribution net-works: Comparative study between Egypt and Malaysia. J. Eng. Des. Technol. 2021. ahead of print. [Google Scholar]
  11. Okampo, E.J.; Nwulu, N. Optimal energy mix for a reverse osmosis desalination unit considering demand response. J. Eng. Des. Technol. 2020, 18, 1287–1303. [Google Scholar] [CrossRef]
  12. Chowdhury, Z.Z.; Zain, S.M.; Rashid, A.K.; Rafique, R.F.; Khalid, K. Breakthrough Curve Analysis for Column Dynamics Sorption of Mn(II) Ions from Wastewater by Using Mangostana garcinia Peel-Based Granular-Activated Carbon. J. Chem. 2012, 2013, 959761. [Google Scholar] [CrossRef] [Green Version]
  13. Mittal, A.; Teotia, M.; Soni, R.; Mittal, J. Applications of egg shell and egg shell membrane as adsorbents: A review. J. Mol. Liq. 2016, 223, 376–387. [Google Scholar] [CrossRef]
  14. De Angelis, G.; Medeghini, L.; Conte, A.M.; Mignardi, S. Recycling of eggshell waste into low-cost adsorbent for Ni removal from wastewater. J. Clean. Prod. 2017, 164, 1497–1506. [Google Scholar] [CrossRef]
  15. Park, H.J.; Jeong, S.W.; Yang, J.K.; Gil Kim, B.; Lee, S.M. Removal of heavy metals using waste eggshell. J. Environ. Sci. 2007, 19, 1436–1441. [Google Scholar] [CrossRef]
  16. Masukume, M.; Onyango, M.S.; Maree, J. Sea shell derived adsorbent and its potential for treating acid mine drainage. Int. J. Miner. Process. 2014, 133, 52–59. [Google Scholar] [CrossRef]
  17. Zaib, Q.; Kyung, D. Optimized removal of hexavalent chromium from water using spent tea leaves treated with ascorbic acid. Sci. Rep. 2022, 12, 1–14. [Google Scholar] [CrossRef]
  18. Gómez-Aguilar, D.L.; Rodríguez-Miranda, J.P.; Salcedo-Parra, O.J. Fruit Peels as a Sustainable Waste for the Biosorption of Heavy Metals in Wastewater: A Review. Molecules 2022, 27, 2124. [Google Scholar] [CrossRef] [PubMed]
  19. Hussain, T.; Imran, M.; Mushtaq, Z.; Khan, M.I.; Ahmad, M.H.; Mahr-Un-Nisa; Khan, M.K. Heavy Metal Biosorption by Polyphenol-Free Banana Peel Powder. JAPS J. Anim. Plant Sci. 2022, 32, 2. [Google Scholar]
  20. Sahu, V.; Attri, R.; Gupta, P.; Yadav, R. Development of eco friendly brick using water treatment plant sludge and processed tea waste. J. Eng. Des. Technol. 2019, 18, 727–738. [Google Scholar] [CrossRef]
  21. Won, S.W.; Kotte, P.; Wei, W.; Lim, A.; Yun, Y.-S. Biosorbents for recovery of precious metals. Bioresour. Technol. 2014, 160, 203–212. [Google Scholar] [CrossRef]
  22. Chojnacka, K. Biosorption of Cr(III) ions by eggshells. J. Hazard. Mater. 2005, 121, 167–173. [Google Scholar] [CrossRef] [PubMed]
  23. Kuppusamy, V.; Man Joshi, U. Chicken Eggshells Remove Pb(II) Ions from Synthetic Wastewater. Environ. Eng. Sci. 2013, 30, 67–73. [Google Scholar]
  24. Flores-Cano, J.V.; Leyva-Ramos, R.; Mendoza-Barron, J.; Guerrero-Coronado, R.M.; Aragón-Piña, A.; Labrada-Delgado, G.J. Sorption mechanism of Cd(II) from water solution onto chicken eggshell. Appl. Surf. Sci. 2013, 276, 682–690. [Google Scholar] [CrossRef]
  25. Amar, I.A.; Hassan, S.M.; Aqeela, F.H.; Najem, M.Y.; Altohami, F.A. Removal of methylene blue using balanites ae-gyptiaca bark powder as low-cost and eco-friendly biosorbent. Res. J. Text. Appar. 2021. ahead of print. [Google Scholar]
  26. Zhang, T.; Tu, Z.; Lu, G.; Duan, X.; Yi, X.; Guo, C.; Dang, Z. Removal of heavy metals from acid mine drainage using chicken eggshells in column mode. J. Environ. Manag. 2017, 188, 1–8. [Google Scholar] [CrossRef] [PubMed]
  27. Gurgel, L.; Freitas, R.; Gil, L.F. Adsorption of Cu(II), Cd(II), and Pb(II) from aqueous single metal solutions by sugarcane bagasse and mercerized sugarcane bagasse chemically modified with succinic anhydride. Carbohydr. Polym. 2008, 74, 922–929. [Google Scholar] [CrossRef] [Green Version]
  28. Chao, H.P.; Chang, C.C.; Nieva, A. Biosorption of heavy metals on Citrus maxima peel, passion fruit shell, and sugarcane bagasse in a fixed-bed column. J. Ind. Eng. Chem. 2014, 20, 3408–3414. [Google Scholar] [CrossRef]
  29. Shekhawat, P.; Sharma, G.; Singh, R.M. Durability analysis of eggshell powder–flyash geopolymer composite subjected to wetting–drying cycles. J. Eng. Des. Technol. 2020, 18, 2043–2060. [Google Scholar] [CrossRef]
  30. Wong, S.Y.; Tan, Y.P.; Abdullah, A.H.; Ong, S.T. Removal of Basic Blue 3 And Reactive Orange 16 By Adsorption Onto Quartenized Sugar Cane Bagasse. Malays. J. Analyt. Sci. 2009, 13, 185–193. [Google Scholar]
  31. Mao, Y.; Mingming, S.; Xu, C.; Yanfang, F.; Jinzhong, W.; Kuan, L.; Da, T.; Manqiang, L.; Jun, W.; Schwab, A.P.; et al. Feasibility of sulfate-calcined eggshells for removing pathogenic bacteria and antibiotic resistance genes from landfill leachates. Waste Manag. 2017, 63, 275–283. [Google Scholar]
  32. Hussin, M.H.; Othman, N.H.; Wan Ibrahim, M.H. Carbonation of concrete containing mussel (Perna viridis) shell ash. J. Eng. Des. Technol. 2019, 17, 904–928. [Google Scholar] [CrossRef]
  33. Luo, X.; Liu, F.; Deng, Z.; Lin, X. Removal of copper(II) from aqueous solution in fixed-bed column by carboxylic acid functionalized deacetylated konjac glucomannan. Carbohydr. Polym. 2011, 86, 753–759. [Google Scholar] [CrossRef]
  34. Thomas, H.C. Heterogeneous Ion Exchange in a Flowing System. J. Am. Chem. Soc. 1944, 66, 1664–1666. [Google Scholar] [CrossRef]
  35. Acheampong, M.A.; Pakshirajan, K.; Annachhatre, A.P.; Lens, P.N. Removal of Cu(II) by biosorption onto coconut shell in fixed-bed column systems. J. Ind. Eng. Chem. 2012, 19, 841–848. [Google Scholar] [CrossRef]
  36. Yoon, Y.H.; Nelson, J.H. Application of Gas Adsorption Kinetics—II: A Theoretical Model for Respirator Cartridge Service Life and Its Practical Applications. Am. Ind. Hyg. Assoc. J. 1984, 45, 517–524. [Google Scholar] [CrossRef]
  37. Putra, W.P.; Kamari, A.; Yusoff, S.N.M.; Ishak, C.F.; Mohamed, A.; Hashim, N.; Isa, I.M. Biosorption of Cu(II), Pb(II) and Zn(II) Ions from Aqueous Solutions Using Selected Waste Materials: Adsorption and Characterisation Studies. J. Encapsulation Adsorpt. Sci. 2014, 4, 25–35. [Google Scholar] [CrossRef] [Green Version]
  38. Harripersadth, C.; Musonge, P.; Isa, Y.M.; Morales, M.G.; Sayago, A. The application of eggshells and sugarcane bagasse as potential biomaterials in the removal of heavy metals from aqueous solutions. S. Afr. J. Chem. Eng. 2020, 34, 142–150. [Google Scholar] [CrossRef]
  39. Geankoplis, C.J. Transport Processes and Separation Process Principles: Includes Unit Operations, 4th ed.; Prentice Hall Professional Technical Reference: Hoboken, NJ, USA, 2003. [Google Scholar]
  40. Du, Z.; Zheng, T.; Wang, P. Experimental and modelling studies on fixed bed adsorption for Cu(II) removal from aqueous solution by carboxyl modified jute fiber. Powder Technol. 2018, 338, 952–959. [Google Scholar] [CrossRef]
  41. Malkoc, E.; Nuhoglu, Y.; Abali, Y. Cr(VI) adsorption by waste acorn of Quercus ithaburensis in fixed beds: Prediction of breakthrough curves. Chem. Eng. J. 2006, 119, 61–68. [Google Scholar] [CrossRef]
  42. Luo, X.; Deng, Z.; Lin, X.; Zhang, C. Fixed-bed column study for Cu2+ removal from solution using expanding rice husk. J. Hazard. Mater. 2011, 187, 182–189. [Google Scholar] [CrossRef]
  43. Nakajima, H. Mass Transfer Advances in Sustainable Energy and Environment Oriented Numerical Modeling; InTech Open: London, UK, 2014. [Google Scholar]
  44. Naja, G.; Volesky, B. Behavior of the Mass Transfer Zone in a Biosorption Column. Environ. Sci. Technol. 2006, 40, 3996–4003. [Google Scholar] [CrossRef] [PubMed]
  45. Verduzco-Navarro, I.P.; Rios-Donato, N.; Jasso-Gastinel, C.F.; Martínez-Gómez, D.J.; Mendizábal, E. Removal of Cu(II) by Fixed-Bed Columns Using Alg-Ch and Alg-ChS Hydrogel Beads: Effect of Operating Conditions on the Mass Transfer Zone. Polymers 2020, 12, 2345. [Google Scholar] [CrossRef] [PubMed]
  46. Aksu, Z.; Gönen, F. Biosorption of phenol by immobilized activated sludge in a continuous packed bed: Prediction of breakthrough curves. Process Biochem. 2004, 39, 599–613. [Google Scholar] [CrossRef]
  47. Chai, T.; Draxler, R. Root mean square error (RMSE) or mean absolute error (MAE)? Geosci. Model Dev. 2014, 7, 1247–1250. [Google Scholar] [CrossRef] [Green Version]
  48. Zhang, W.; Dong, L.; Yan, H.; Li, H.; Jiang, Z.; Kan, X.; Yang, H.; Li, A.; Cheng, R. Removal of methylene blue from aqueous solutions by straw based adsorbent in a fixed-bed column. Chem. Eng. J. 2011, 173, 429–436. [Google Scholar] [CrossRef]
  49. Xu, Z.; Cai, J.-G.; Pan, B.-C. Mathematically modeling fixed-bed adsorption in aqueous systems. J. Zhejiang Univ. A 2013, 14, 155–176. [Google Scholar] [CrossRef] [Green Version]
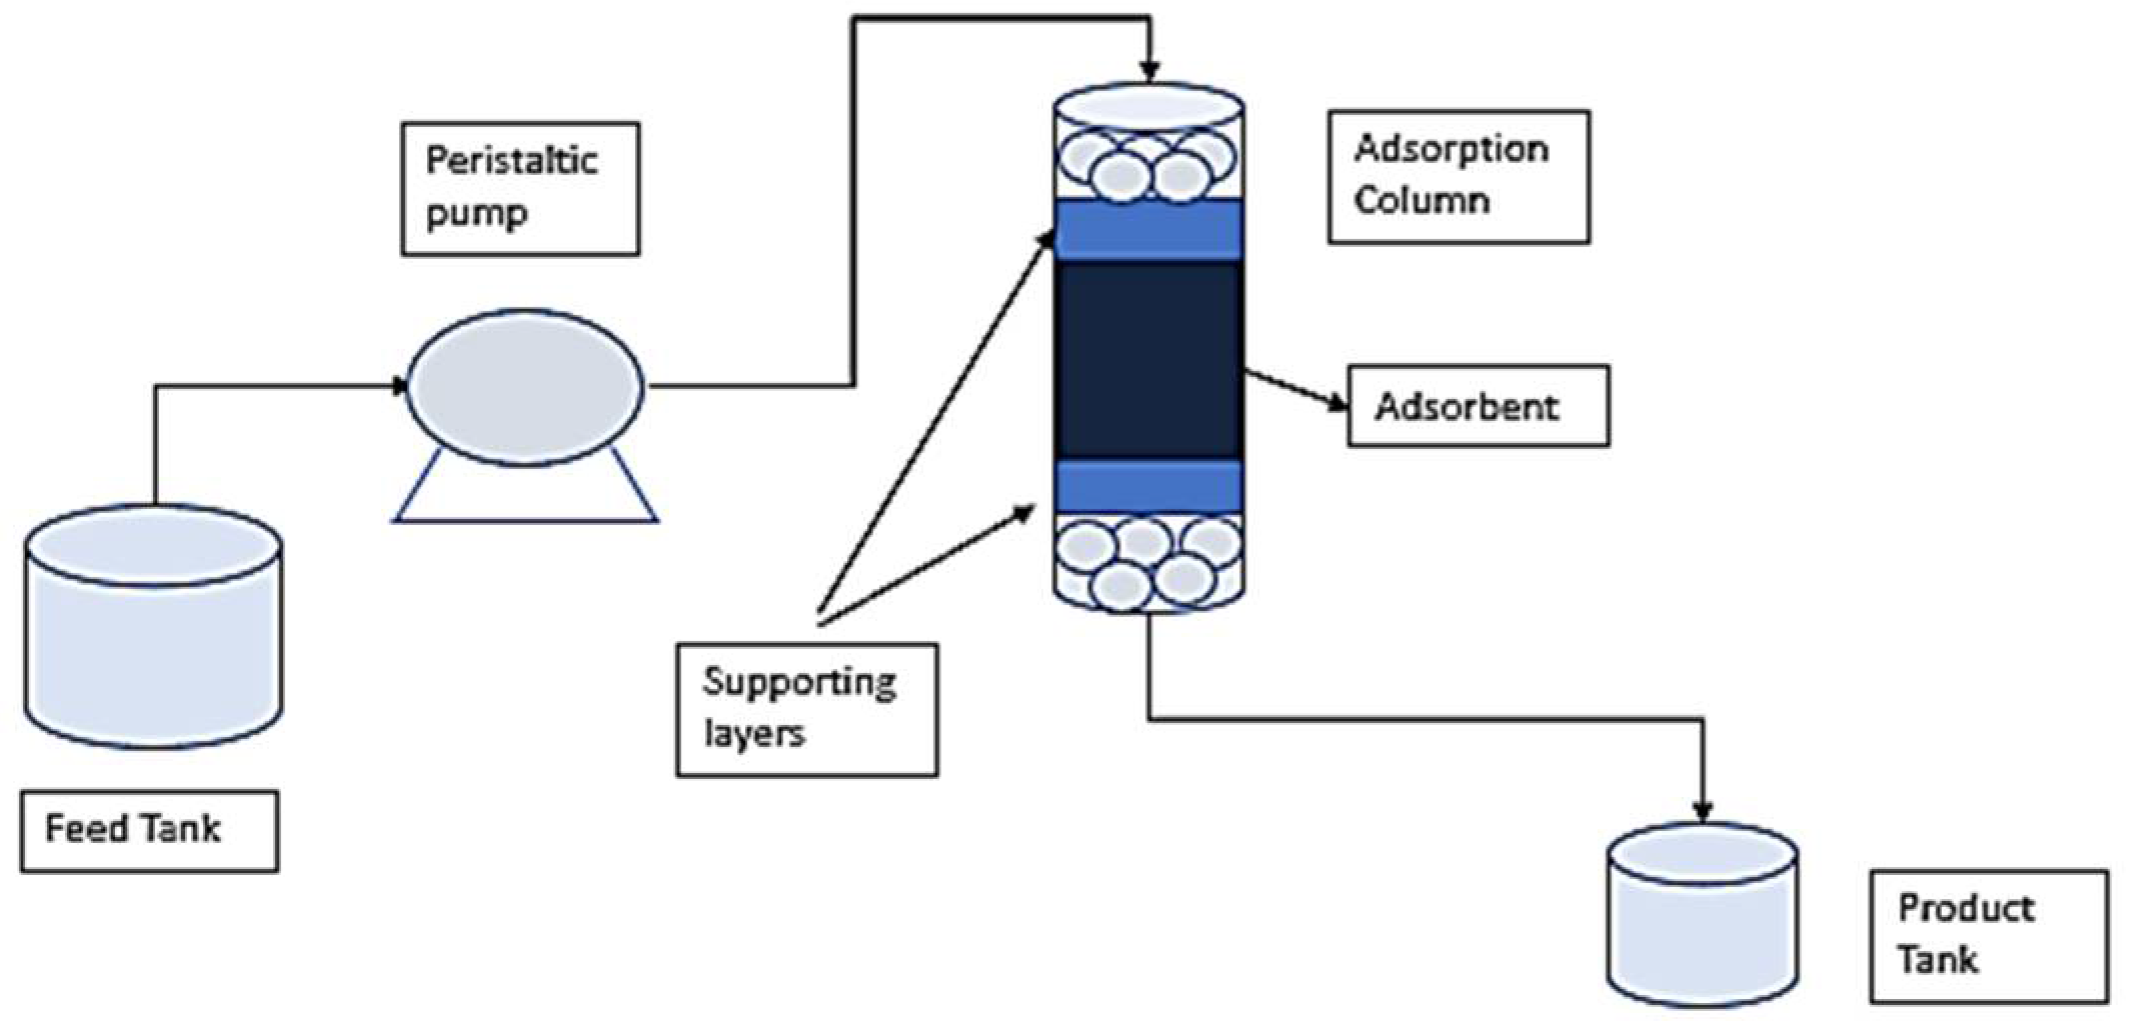
Figure 1. Visual representation of the lab-scale fixed bed column setup.
Sustainability 14 07662 g001
Figure 2. FTIR spectra of bagasse (a), eggshells (b) and the binary adsorbents (c).
Sustainability 14 07662 g002
Figure 3. SEM images of (a) sugarcane bagasse, (b) adsorbent 1:3, (c) adsorbent 1:1, (d) adsorbent 3:1 and (e) eggshells of 1 µm at a magnification of 50,000.
Sustainability 14 07662 g003
Figure 4. Batch study: comparison of Pb2+ removal.
Sustainability 14 07662 g004
Figure 5. Effect of bed depth on the length of unused bed (MTZ). (a) Bed depth of 4 cm, (b) bed depth of 8 cm, (c) bed depth of 12 cm.
Sustainability 14 07662 g005
Table 1. Weight percentages of the adsorbents.
BagasseAdsorbent 1:3Adsorbent 1:1Adsorbent 3:1Eggshells
Bagasse100%75%50%25%-
Eggshells-25%50%75%100%
Table 2. Summary of technical parameters for Pb removal in a fixed bed column.
A d s o r b e n t t b ( m i n ) t e ( m i n ) H T ( c m ) H L ( c m ) H L U B ( c m ) %   R V b ( m L ) η H L U B ( c m ) H L ( c m ) q e ( m g g ) B V A E R
Bagasse9020141.792.2148240450.5521.05 22 4.75
21043583.824.1856600480.5222.77254.39
540830127.814.19661200650.3528.97433.45
Adsorbent 3:19024241.492.5145240370.6312.32218.12
27058583.694.3165600460.5414.90316.70
540915127.084.92661200590.4115.53416.44
Adsorbent 1:121047741.762.2461480441.2715.57486.22
42092583.634.37671020451.2015.80486.42
7801408126.655.35712160550.8016.06596.32
Adsorbent 1:3540118841.822.18731680451.2027.951223.35
1860238586.241.76784560780.2829.852103.34
27003336129.712.29916960810.2429.982123.58
Eggshells540107142.021.98711680500.9821.111214.65
1380210585.242.76783120660.5321.481554.74
23403303128.53.5905520710.4122.081754.53
Table 3. Breakthrough curve modelling parameters for the Thomas model.
Adsorbent Bed Height K t h ( L m g · m i n ) q o ,   t h ( m g g ) q e x p ( m g g ) R2RMSEMAE
Bagasse4 cm5.29 × 10−420.4821.050.9620.0340.009
8 cm2.67 × 10−420.5722.770.8560.0680.020
12 cm1.47 × 10−428.9028.970.9780.0330.003
Adsorbent 3:14 cm3.55 × 10−412.4412.320.90870.0290.004
8 cm1.85 × 10−414.6514.910.91550.0390.001
12 cm1.35 × 10−416.0315.540.94860.0370.010
Adsorbent 1:14 cm2.42 × 10−414.9916.060.8900.0470.019
8 cm1.35 × 10−415.0015.570.91080.0280.005
12 cm5.29 × 10−416.0615.800.98810.0300.007
Adsorbent 1:34 cm1.10 × 10−427.7928.050.94820.0780.013
8 cm8.20 × 10−422.1629.950.8840.0800.036
12 cm6.0 × 10−528.2334.260.92650.0480.017
Eggshells4 cm1.27 × 10−421.4820.330.96760.0650.010
8 cm6.7 × 10−521.1120.690.98280.0210.000
12 cm4.5 × 10−522.0821.510.98040.0360.001
Table 4. Breakthrough curve modelling parameters for the Yoon–Nelson model.
AdsorbentBed Height τ exp
( m i n )
τ th
( m i n )
K Y N ( m i n 1 ) R2RMSEMAE
Bagasse4 cm2021961.36 × 10−20.9620.0340.009
8 cm2843662.73 × 10−20.7690.0580.002
12 cm8008775.29 × 10−20.9790.0270.006
Adsorbent 3:14 cm2422632.95 × 10−20.8950.0580.032
8 cm5855751.85 × 10−20.9160.0390.001
12 cm9159441.35 × 10−20.9490.0370.010
Adsorbent 1:14 cm4134451.92 × 10−20.8900.0470.019
8 cm9258901.29 × 10−20.9130.0270.005
12 cm140814278.40 × 10−30.9850.0480.017
Adsorbent 1:34 cm118811061.10 × 10−20.9480.0780.013
8 cm238522468.20 × 10−30.8840.080.036
12 cm87733746.00 × 10−30.9270.0480.017
Eggshells4 cm107110241.26 × 10−20.9710.0600.006
8 cm210621066.20 × 10−30.9680.0240.011
12 cm330432624.20 × 10−30.9450.0390.008
Publisher’s Note: MDPI stays neutral with regard to jurisdictional claims in published maps and institutional affiliations.