Article

Topography and Soil Properties Determine Biomass and Productivity Indirectly via Community Structural and Species Diversity in Karst Forest, Southwest China

1
Key Laboratory of Crop Physiology, Ecology and Genetic Breeding, Ministry of Education, Jiangxi Agricultural University, Nanchang 330045, China
2
Research Center on Ecological Sciences, Jiangxi Agricultural University, Nanchang 330045, China
3
Laboratory of Agro-Ecological Processes in Subtropical Region, Institute of Subtropical Agriculture, Chinese Academy of Sciences, Changsha 410125, China
4
Guangxi Key Laboratory of Karst Ecological Processes and Services, Huanjiang Karst Ecosystem Observation and Research Station, Chinese Academy of Sciences, Huanjiang 547100, China
5
Forestry College, Guangxi University, Nanning 530004, China
*
Authors to whom correspondence should be addressed.
These authors contributed equally to this work.
Sustainability 2022, 14(13), 7644; https://doi.org/10.3390/su14137644
Submission received: 13 May 2022 / Revised: 14 June 2022 / Accepted: 17 June 2022 / Published: 23 June 2022
(This article belongs to the Special Issue Conservation and Sustainability of Forest Biodiversity)

Abstract

:
The forest ecosystem is an important part of the terrestrial ecosystem carbon sink, and its rate of biomass accumulation influences its carbon sink potential. Therefore, it is particularly important to understand the biomass and productivity of forest ecosystems, and their driving factors, especially in karst areas with a fragile ecological environment. We established a 2 ha plot in karst forest in southwest China, and investigated species composition, community structure, topography and soil nutrients in the years 2007 and 2017. In this analysis, the correlations between tree diversity and each factor were evaluated using a Pearson correlation analysis. In addition, the relationships between soil nutrients and topographies and their effects on productivity and biomass were further evaluated, either directly or indirectly, through species and structural diversity by using a structural equation model (SEM). The results showed that the number of individuals in each species decreased, and productivity was 1.76 Mg ha1 yr1, from 2007 to 2017. Species diversity was negatively correlated with biomass and positively correlated with productivity; structural diversity was negatively correlated with biomass and productivity, while structural diversity was negatively correlated with biomass and positively correlated with productivity. In addition, the effects of soil factors on biomass and productivity were significantly different: TN had a significant positive effect on productivity, while all soil factors except total nitrogen (TN) had significant positive effects on biomass. The structural equation results also showed that topographic and soil factors can directly affect productivity; structural diversity has a strong direct negative impact on biomass, while species diversity, structural diversity and biomass have similar direct positive impacts on productivity. Structural diversity was better than species diversity when explaining biomass accumulation. In conclusion, biotic and abiotic factors both influence forest productivity in karst forests in southwest China, and improving species diversity and community structure complexity is of great significance for forest management and productivity promotion. The research further improve the understanding of biomass and productivity in karst forest ecosystems, and their driving factors, which will provide relevant theoretical support for sustainable forest development in southwest karst.

1. Introduction

The forest ecosystem is a natural system with a well-defined structure, function and regulation, and is the most extensive component of the terrestrial ecosystems [1,2]. Meanwhile, the forest ecosystem is also the largest carbon pool among terrestrial ecosystems, accounting for more than 3/4 of terrestrial biomass [3]. Therefore, the forest ecosystem plays an important role in regulating terrestrial carbon cycle [3,4]. Global change and human disturbance strongly affect ecosystem components, structures, functions, processes and services and their spatial patterns [5]. Forest fire disturbance is a natural ecological process of forest ecosystem, which is one of the main driving factors of ecosystem structure and function, and has long-term influence on nutrient cycling and composition of fuel types. Driven by the dual pressures of global change and human interference, biodiversity on the earth is facing serious loss, and the structure and function of forest ecosystems are seriously affected [6]. Therefore, maintaining the stability of forest ecosystem services and functions is necessary to understand the mechanisms underlying forest community dynamics [7].
The relationship between biodiversity and productivity is an important indicator to measure ecosystem dynamics, function [8,9], an important topic in sustainable forest management [10], and one of the issues of concern for global scientists [11]. A large number of studies have shown that species diversity is positively correlated with productivity [12,13,14,15]. For example, Liang et al. indicated that continued loss of biodiversity will lead to an accelerated decline in global forest productivity [13]. But negative correlation [16], a hump relationship [11], and irrelevance [17] have also been reported. Some studies have also shown that mixed forest has higher productivity than pure forest [10,12], and that increasing species diversity improves productivity [10,18]. Such results can be explained by the niche complementing effect [11]. Of course, other studies have shown that this effect cannot explain all the results: the niche complementarity effect is not only related to interspecific differences, but is also affected by a variety of biotic and abiotic factors [19]. So far, the effects of species diversity on productivity and biomass in natural forests and their maintenance mechanisms remain controversial. Therefore, it is urgent to further strengthen the research on the relationship between diversity and productivity and biomass.
Community structure diversity plays an important role in productivity [20,21], and is generally defined as one or more combinations of spatial structure distribution, species diversity, and tree size variation (such as tree height and diameter) [20,22,23]. Complex structures can cause resource heterogeneity or variable resource use efficiency, and may be the cause of different results in past studies [6,24]. Through access to environmental resources and by promoting biomass accumulation [3,4,25,26], forests can increase productivity. In adddtion, the age of a forest ecosystem greatly affects its biomass/carbon storage and production. The biomass of different forest ecosystems may reach their peaks at different ages [27]. In another word, similar size structures may have different production rates. Previous studies show that community structure diversity is positively with productivity relationship [18,21], uncorrelated or negatively correlated [16,20]. Individual differences, DBH variation index, species fragrance index, stand age density and other factors will each affect the distribution of tree species and lead to changes in forest structure [24,28,29,30]. Overall, the effects of species diversity and community structure on biomass and productivity need further discussion and research.
In addition, the distribution pattern of plant communities is the result of climate, soil, topography and other environmental factors at different scales. The productivity of vegetation is also influenced by species composition and geographical environment [12]. Soil fertility and topography are key factors affecting plant community structure and productivity [20]. Studies have shown that high-nutrient soils can promote faster plant growth and thus have a more positive effect on tree productivity than poor soils [31], while topographic factors such as elevation, slope and aspect also influence the accumulation of biomass and changes in productivity [32,33]. Therefore, it is necessary to study the relationship between biodiversity and productivity and environmental factors in complex natural forest ecosystems.
Southwest China is the largest area of karst forests in the world, with the characteristics of weak ecosystem stability and strong heterogeneity of habitat (exposed rock, barren ground and discontinuous soil, with an extremely fragile geological background, small environmental carrying capacity, low tolerance to disturbance and establishment on rocky surfaces, and excessive soil calcium, etc.) [34,35]. Mixed evergreen-deciduous broadleaf forest is unique and representative of the karst landscape in southwest China. This forest type has a complicated community structure, rich biodiversity, and high habitat heterogeneity, making it an ideal community in which to study forest productivity.
In the early stages, large-scale productivity research is mainly carried out by remote sensing. Most small-scale biomass studies are single community surveys, and productivity research is mostly carried out in space instead of time. Many studies have explored influencing factors of karst biomass, but few studies have focused on the interaction between biomass and productivity in karst forests. In particular, biotic and abiotic factors contributing to biomass changes are less studied in this region [36,37,38]. In recent years, due to climate change and other factors, the structure of the forest ecosystem has changed, so that it is urgent to strengthen research on the relationship between biodiversity and biomass and productivity of this ecosystem. Therefore, a detailed study of karst forest productivity is of great significance for understanding the spatial distribution and characteristics of forest vegetation in China.
This study focused on karst forests in southwest China, exploring the structure and species diversity of karst forests to indirectly determine biomass and productivity through the analysis and assessment of topography and soil. The study combined multiple statistical methods, with the following objectives. (1) What are the dynamic changes of forest biomass and productivity in the primary forest 2 ha plot? (2) Species diversity or structural diversity—which has the greatest impact on biomass and productivity? (3) How do topographic and soil factors affect changes in biomass and productivity?

2. Materials and Methods

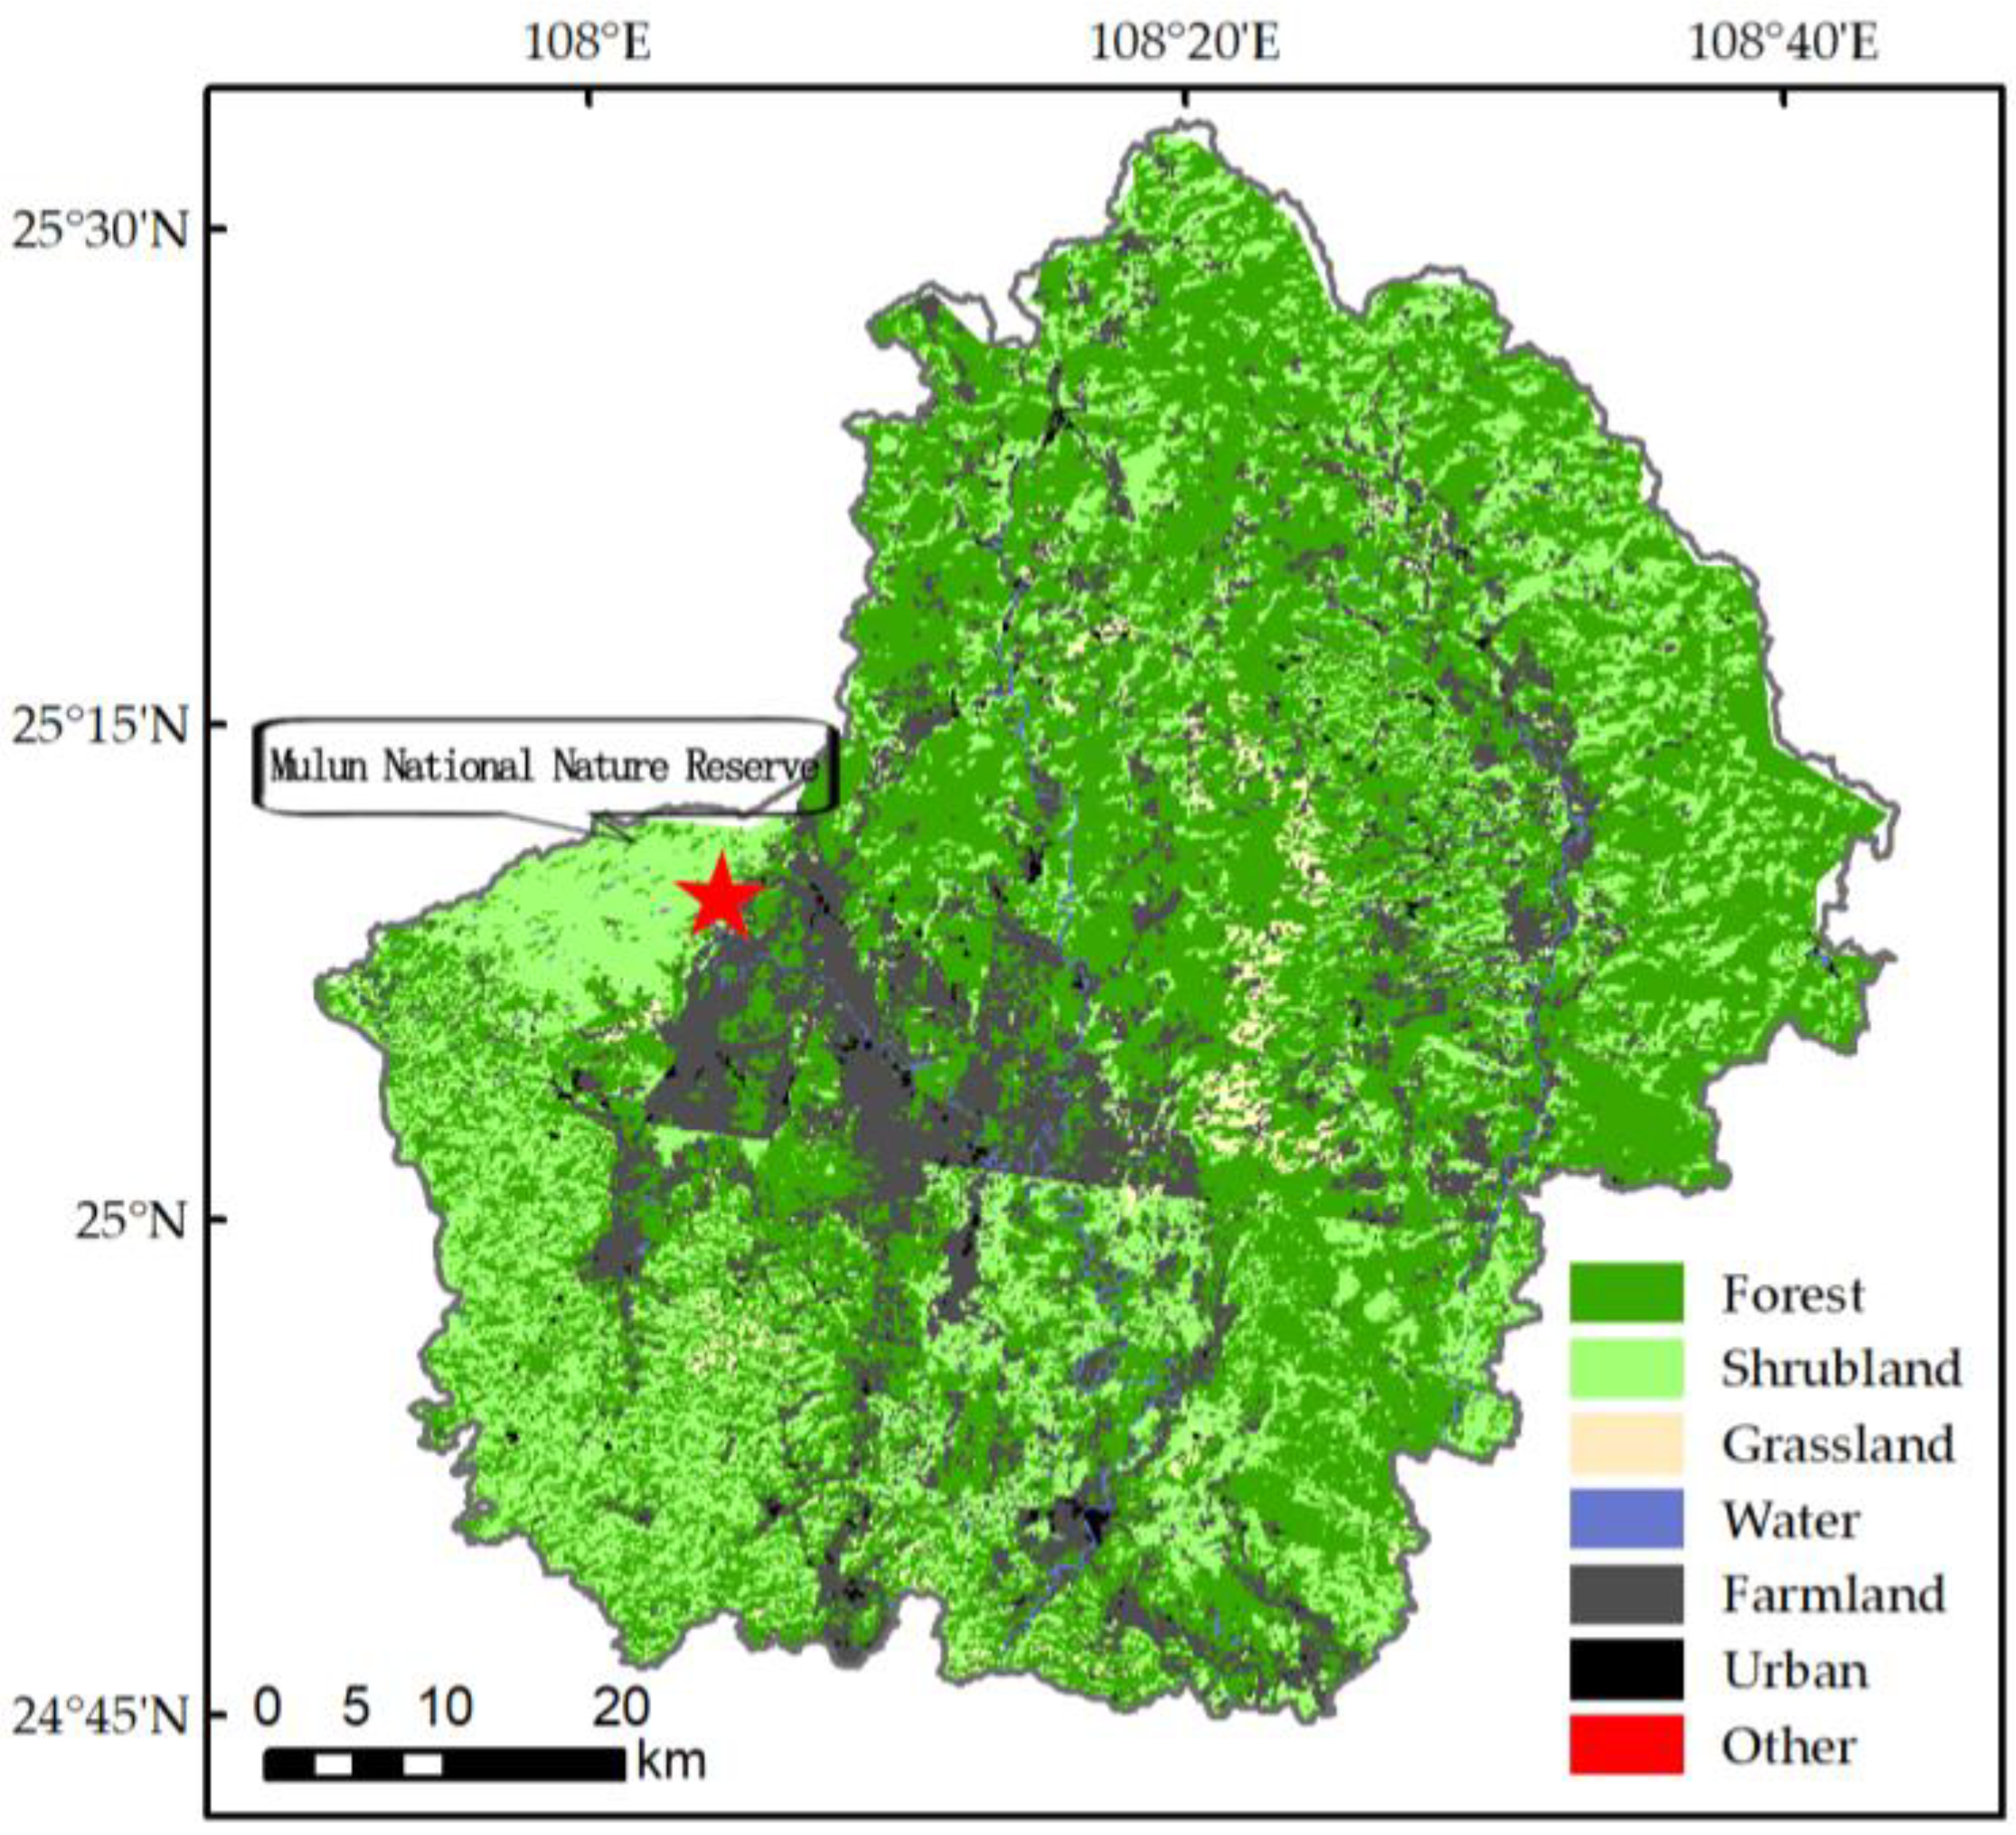
2.1. Study Description

The study was conducted in Mulun National Nature Reserve (hereafter, Mulun Reserve), which is among the most important refuges in China for primary and secondary karst forest flora. The reserve lies in the Huanjiang Autonomous County, northwestern Guangxi Province, China (107°54′01″–108°05′51″ E, 25°07′01″–25°12′22″ N), with an area of 301 km2 (Figure 1). It was established in 1991 to protect the subtropical mixed evergreen and deciduous broad-leaf forest ecosystem, which has developed on the limestone substrate, and contains the world’s largest and best preserved karst forest.
The forest coverage rate is 94.8%, and the region has a subtropical monsoon climate with annual average temperature of 19.3 °C, average annual precipitation 1529.2 mm and frost-free period of 310 d [35]. The elevation range is 413.6 to 637.8 m. The geology is predominantly soluble and porous limestone, resulting in a karst landscape of steep hills separated by lowland depressions with numerous potholes and caves and extensive below-ground streams. Hillside rock exposure rate is high, soil is sparsely and unevenly distributed, and is mainly lime soil; vegetation coverage is very low [38].

2.2. Data Collection

2.2.1. Field Survey

In 2007, a dynamic monitoring plot with a projection area of 2 ha (200 m × 100 m) was established from the depression to the top of the slope in the east buffer area of Mulun Reserve. It represents all the vegetation types in Mulun Reserve and includes primary forest, secondary forest, and plantation. The plot was divided into 50 quadrats of 20 m × 20 m. Each quadrat was further divided into 16 subquadrats of 5 m × 5 m, following the standard field protocol of the Center for Tropic Forest Sciences (CTFS, http://www.ctfs.si.edu, accessed on 18 June 2013). All the individuals of woody plant with a diameter at breast height (DBH) ≥ 1 cm were tagged, identified, measured, and georeferenced from August to October 2007, (main: tree species name, DBH, tree height, crown width, coordinates and growth status were recorded). The important forest species included Sinosideroxylon pedunculatum, Boniodendron minus, Ligustrum quihoui, Handeliodendron bodinieri, Radermachera sinica.

2.2.2. Topographic Variables and Soil Variables

Topographical factors, including elevation (ELE), slope (SLO), cos (aspect) (ASP), convexity (CON), and rock exposure rate (ROR) for each quadrat were measured. ELE was obtained from a Garmin GPSmap 60CSX (Garmin Ltd., Olathe, KS, USA), ASP was obtained from an electronic tachometer (NTS-302R, SOUTH Ltd., GuangZhou, China), and slope was obtained as the mean angular deviation from horizontal of each of the four triangular planes formed by connecting three of its corners. The ROR was calculated as the ratio of rock to the total area of a grid using a 100 cm × 100 cm grid with 25 subgrids of 20 cm × 20 cm, taking the average of five points along the diagonal for each quadrat. ASP and ROR were converted to quantitative data (ASP: 0, 1, 2, 3, 4, 5, 6, 7, and 8 for a depression, northern slope, northeast slope, northwest slope, eastern slope, western slope, southeast slope, southwest slope, and southern slope, respectively) [39].
About 8–10 soil subsamples were collected at a depth of 15 cm, along an S-shaped transect, using a soil corer 3 cm in diameter. The soil subsamples were pooled into one composite sample per quadrat of 20 m × 20 m. The soil samples were air-dried, thoroughly mixed, and passed through a 2-mm sieve to remove gravel and roots [38].
Soil pH was determined in a 1:5 soil–water slurry using a combination glass electrode. Soil organic matter (SOM) was determined by the chloride potassium dichromate volumetric-external heating method. Total nitrogen (TN) was determined by the semi-micro Kjeldahl determination of nitrogen method. Total phosphorus (TP) was determined by sodium hydroxide (NaOH) fusion-ammonium molybdate spectro photometry. Total potassium (TK) was determined by NaOH fusion-flame spectrophotometry. Available nitrogen (AN) was determined by the diffusion–absorption method. Available phosphorus (AP) was determined by NaHCO3 extraction-ammonium molybdate spectrophotometry. Available potassium (AK) was determined by (NH4)2CO3 extraction-flame spectrophotometry. Root content and gravel content were obtained in the process of sieving as a percentage of the total weight. To improve the precision of the results, three replicate samples were analyzed and averaged for each of the soil analyses, except for root and gravel content. Statistical data are shown in Table 1.

2.2.3. Species Diversity and Community Structure Diversity

Species richness (R), Shannon-Wiener diversity index (H′), Simpson diversity index (D) and Pielou evenness index (E) were selected as four commonly used indices to measure species diversity of communities. Basal area standard deviation (SDba), basal area coefficient of variation (CVba), DBH Shannon-Wiener index (H′ba), and stand density (DEN) were selected as four indicators to measure the diversity of community structure [22]. The coefficient of variation quantifies the degree of dispersion of DBH. Calculation formulas and results of each index are shown in Table 2.

2.2.4. Biomass and Productivity

Biomass includes aboveground (branches, leaves, fruits) and underground biomass (roots). Since there may be errors in estimating biomass, only the allometric growth equation based on DBH was used in this study. Allometric growth equations were selected as appropriate for the subtropical forests of China [40]. Biomass is reported for 2017, and the change in biomass accumulation from 2007 to 2017 was used to measure productivity [41]. The calculation is as follows:
Biomass: AGB = a × DBHb
Productivity: PRO = (Biomass2017 − Biomass2007)/t
Here, BIO is biomass, PRO is productivity, DBH is diameter at breast height (cm), a and b are regression coefficients, t is the time interval (2007 to 2017), Biomass2007 and Biomass2017 are the total biomass of all individuals in the sample at the time of investigation in the respective year. Considering that different initial amounts of biomass within the quadrat may in turn affect the change of biomass within the quadrat, this study used the relative change of biomass to represent the primary productivity of the community (referred to as “productivity” in this paper). To ensure the normality of data, biomass and productivity were log transformed before further analysis.

2.3. Statistical Analysis

Before analysis, the explanatory variables of topographic factors, soil factors, species diversity and structural diversity were standardized by log function normalization method. Correlation analysis was conducted using the transformed response and explanatory variables. Then, principal components analysis (PCA) was used to analyze topographic factors, soil factors, species diversity and structural diversity. A unitary regression model was used to examine the relationships between tree diversity, biomass and productivity. Then, Pearson correlation analysis was used to explain the correlation between species diversity, structural diversity, productivity, biomass, soil nutrients and topographic factors. We randomly selected 30 samples to calculate the p-value and repeat this process 1000 times (bootstrapping). Then, we reported the average p-values in our manuscript. The statistical significance level was set as p < 0.05.
To compare the relative effects of biotic and abiotic factors on productivity and to determine the relative contributions of key factors and community dynamics, we used the structural equation model (SEM). We also used the SEM to investigate their direct and indirect effects on biomass and productivity. The guaranteed loading values of the first two PCA axes were chosen as topographic factors, soil factors, species diversity and structural diversity. SEM was performed in Amos 26 and was evaluated for goodness-of-fit using Bentler’s Comparative Fit Index (CFI > 0.90), standardized root mean square residual (RMSEA ≤ 0.05), and a Chi-square (χ2) test statistic (p > 0.05) [17,42]. Statistical analysis and plotting were completed in R software version 4.12.

3. Results

3.1. Changes in Community Composition, Structure and Biomass

The number of genera and species in the primary forest decreased by 5 genera and 7 species, and the number of individual trees decreased by 2680, including 1978 new trees and 4658 dead trees from 2007 to 2017. Overall, the number of species and individuals in the whole forest decreased gradually, but the average AGB increased from 53.19 Mg ha−1 to 70.47 Mg ha−1, and the 10-year average productivity was 1.76 Mg ha−1 yr−1 (Table 3).

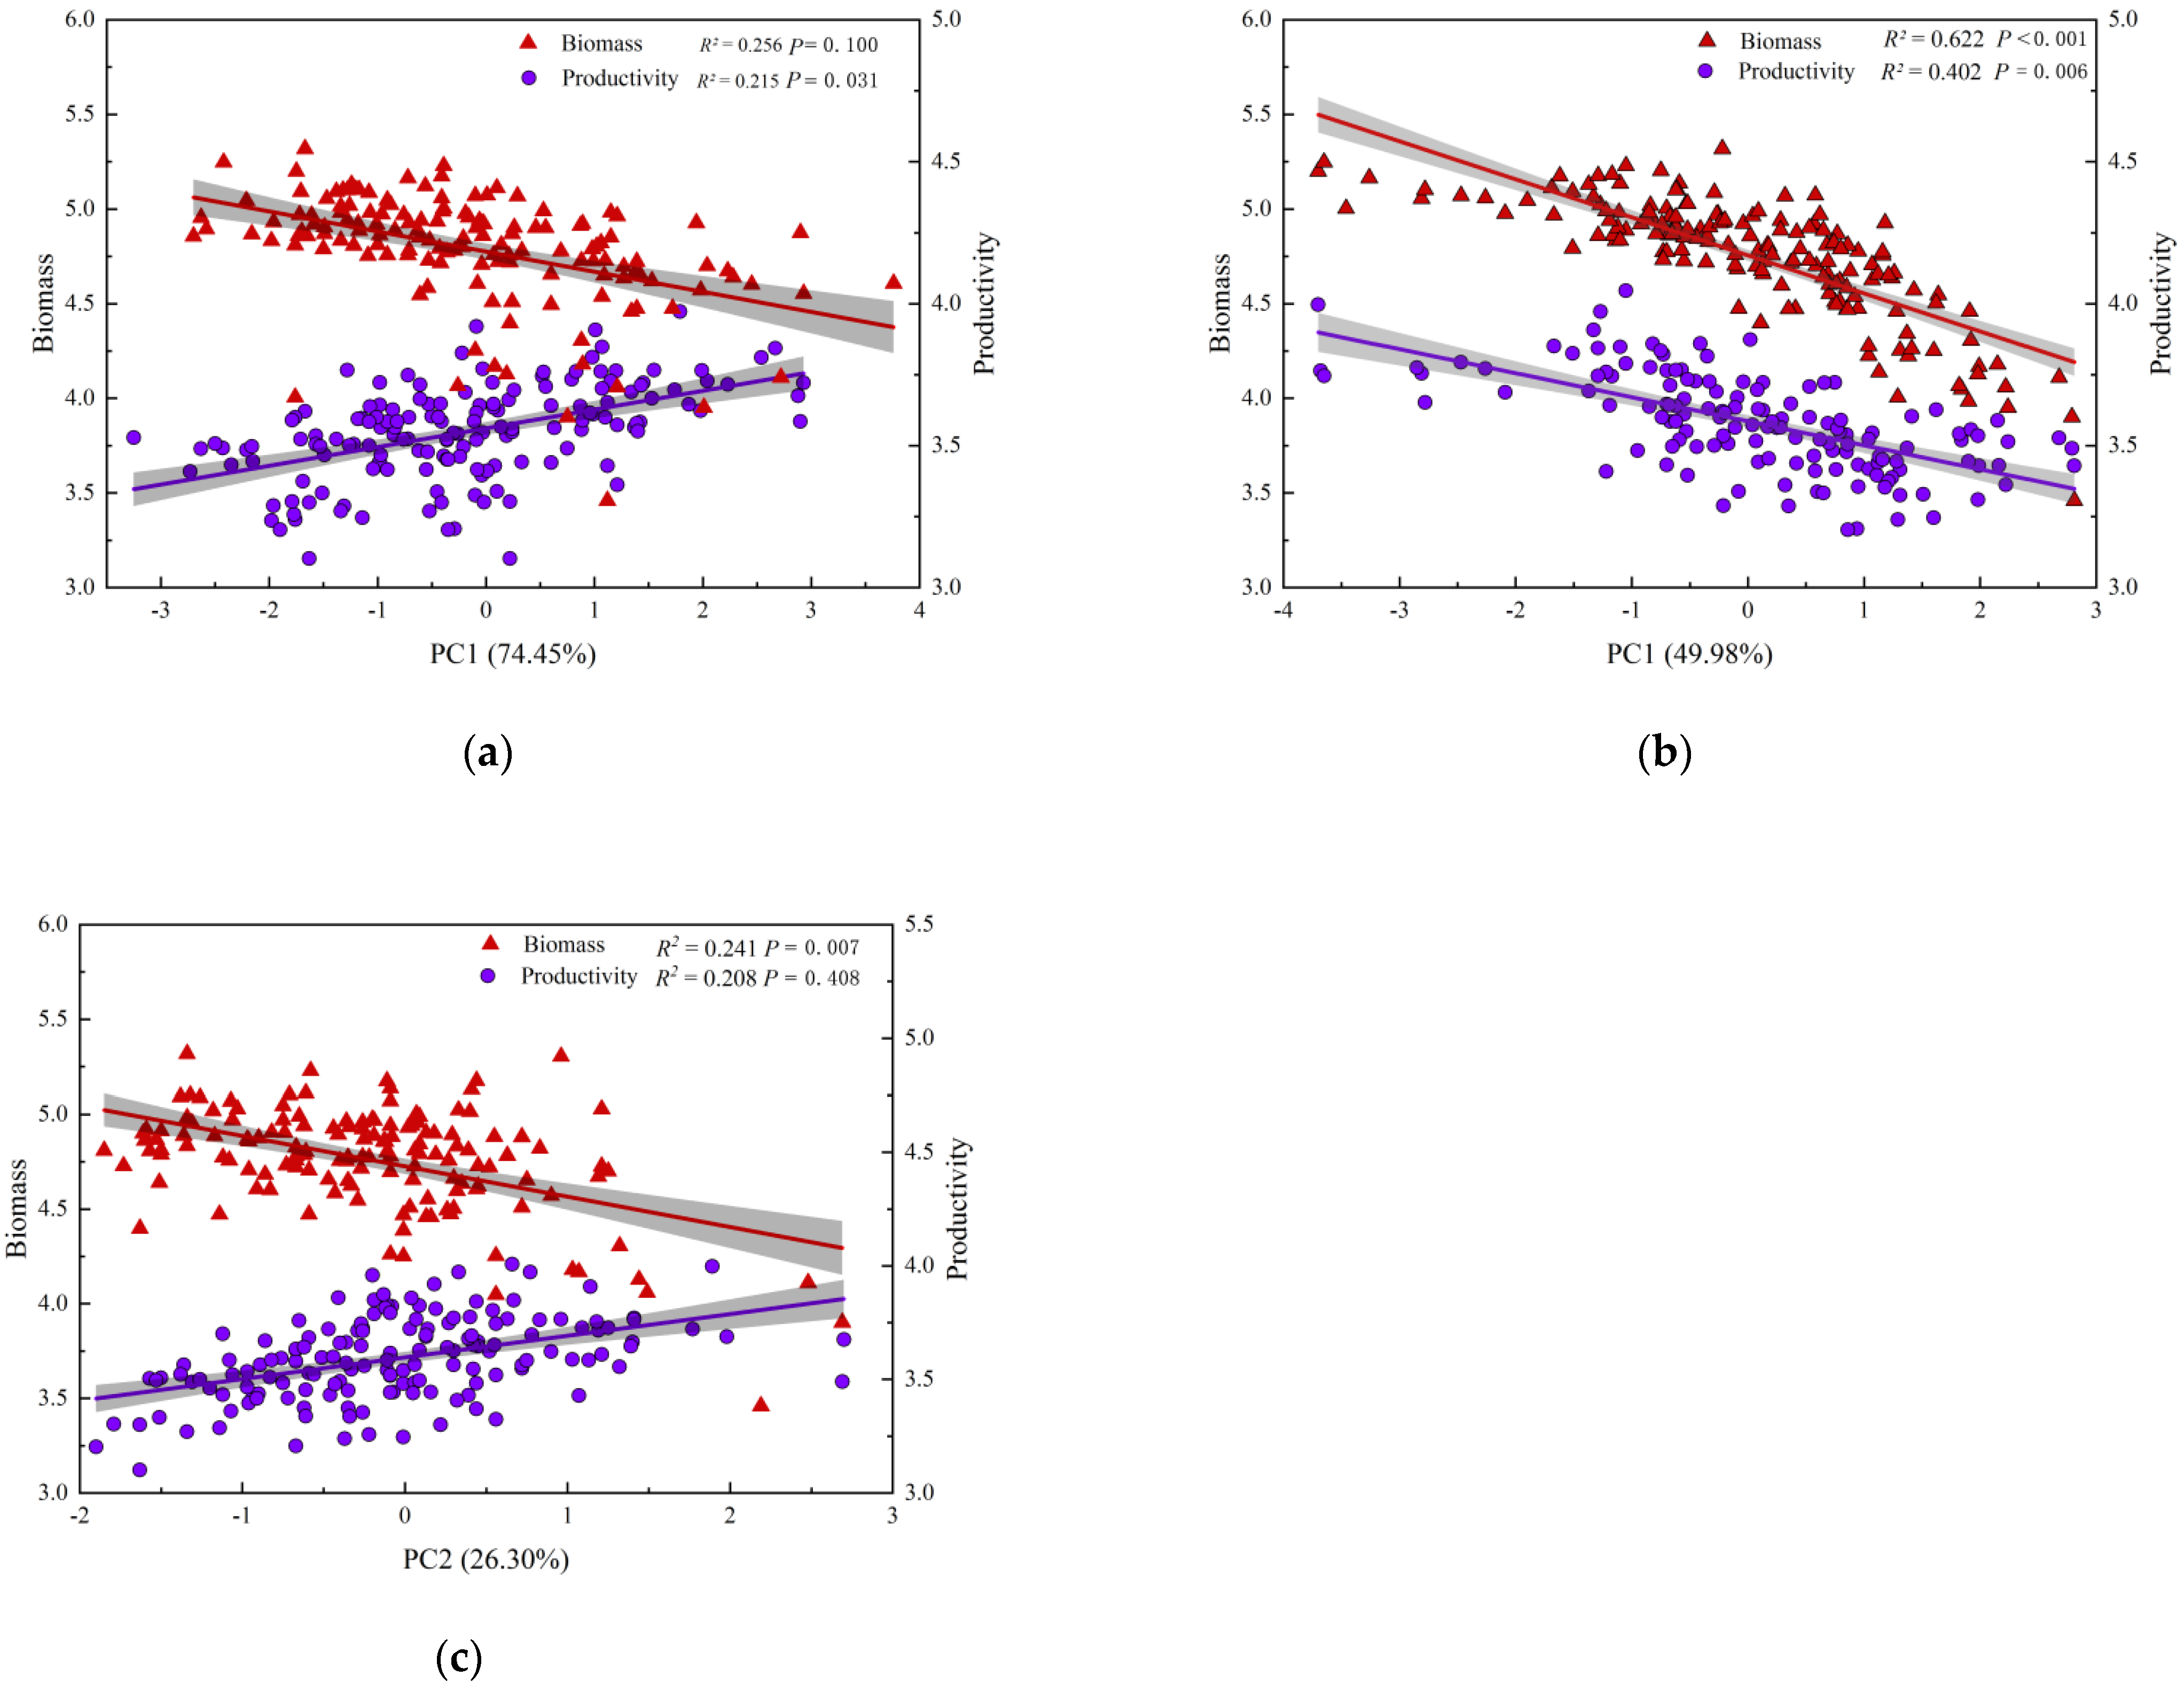
3.2. The Relationship between Biodiversity and Biomass, Productivity

PCA results (Table S1) show that the first two axes of topographic factors explain 61.47% of total variance, the first two axes of soil factors explain 93.01% of total variance, the first two axes of species diversity explain 96.88% of total variance, and the first two axes of structural diversity explain 76.28% of total variance. The first axis can represent the changes of soil factors and species diversity, and the first and second axes represent the changes of topographic and structural diversity.
The unitary linear regression showed that forest productivity increased with increasing species diversity (R2 = 0.215, p = 0.031, Figure 2a), but biomass significantly decreased with increasing species diversity (R2 = 0.256, p = 0.100, Figure 2a). However, the first axis (productivity and biomass) decreased with increasing structural diversity (R2 = 0.402, p = 0.006, R2 = 0.622; p < 0.001, Figure 2b), and the second axis (productivity) increased with increasing species diversity (R2 = 0.208, p = 0.408, Figure 2c), while the biomass decreased significantly with increasing species diversity (R2 = 0.241, p = 0.007, Figure 2c).

3.3. Correlation of Topography and Soil Factors with Biodiversity, Biomass, and Productivity

Pearson correlation analysis (Figure 3) showed that productivity was significantly positively correlated with TK (p < 0.001), and significantly negatively correlated with pH, SOM, TN, AN, AP (0.05 < p < 0.01), and there was no significant correlation with TP, AK and topographic factors. Biomass was significantly positively correlated with soil factors except TK (p < 0.001), and significantly negatively correlated with ASP and ROR, and showed no significant correlation with ELE, SOL and CON.
Species diversity, Shannon-Wiener diversity and Simpson diversity were positively correlated with elevation (p < 0.001), and not significantly correlated with CON and ROR (p < 0.01); Pielou evenness index was not significantly correlated with topographic factors (except ASP) and soil factors.
The basal area standard deviation was significantly positively correlated with pH, TP, TK, AP and AK (p < 0.001), and significantly negatively correlated with SOM, TN and AN (p < 0.01); the basal area coefficient of variation was significantly positively correlated with pH, TP and AK (p < 0.001), and significantly negatively correlated with ASP, SOM, TN, TK, AN and AP (p < 0.01). Neither basal area standard deviation nor basal area coefficient of variation were significantly correlated with topographic factors (except ASP). Shannon-wiener index of DBH was significantly positively correlated with ELE (p < 0.001) and significantly negatively correlated with CON, and not significantly correlated with other factors. Stand density was significantly positively correlated with soil factors except TK (p < 0.001), and significantly positively correlated with ASP and ROR, and not significantly correlated with ELE or SLO (p > 0.05).

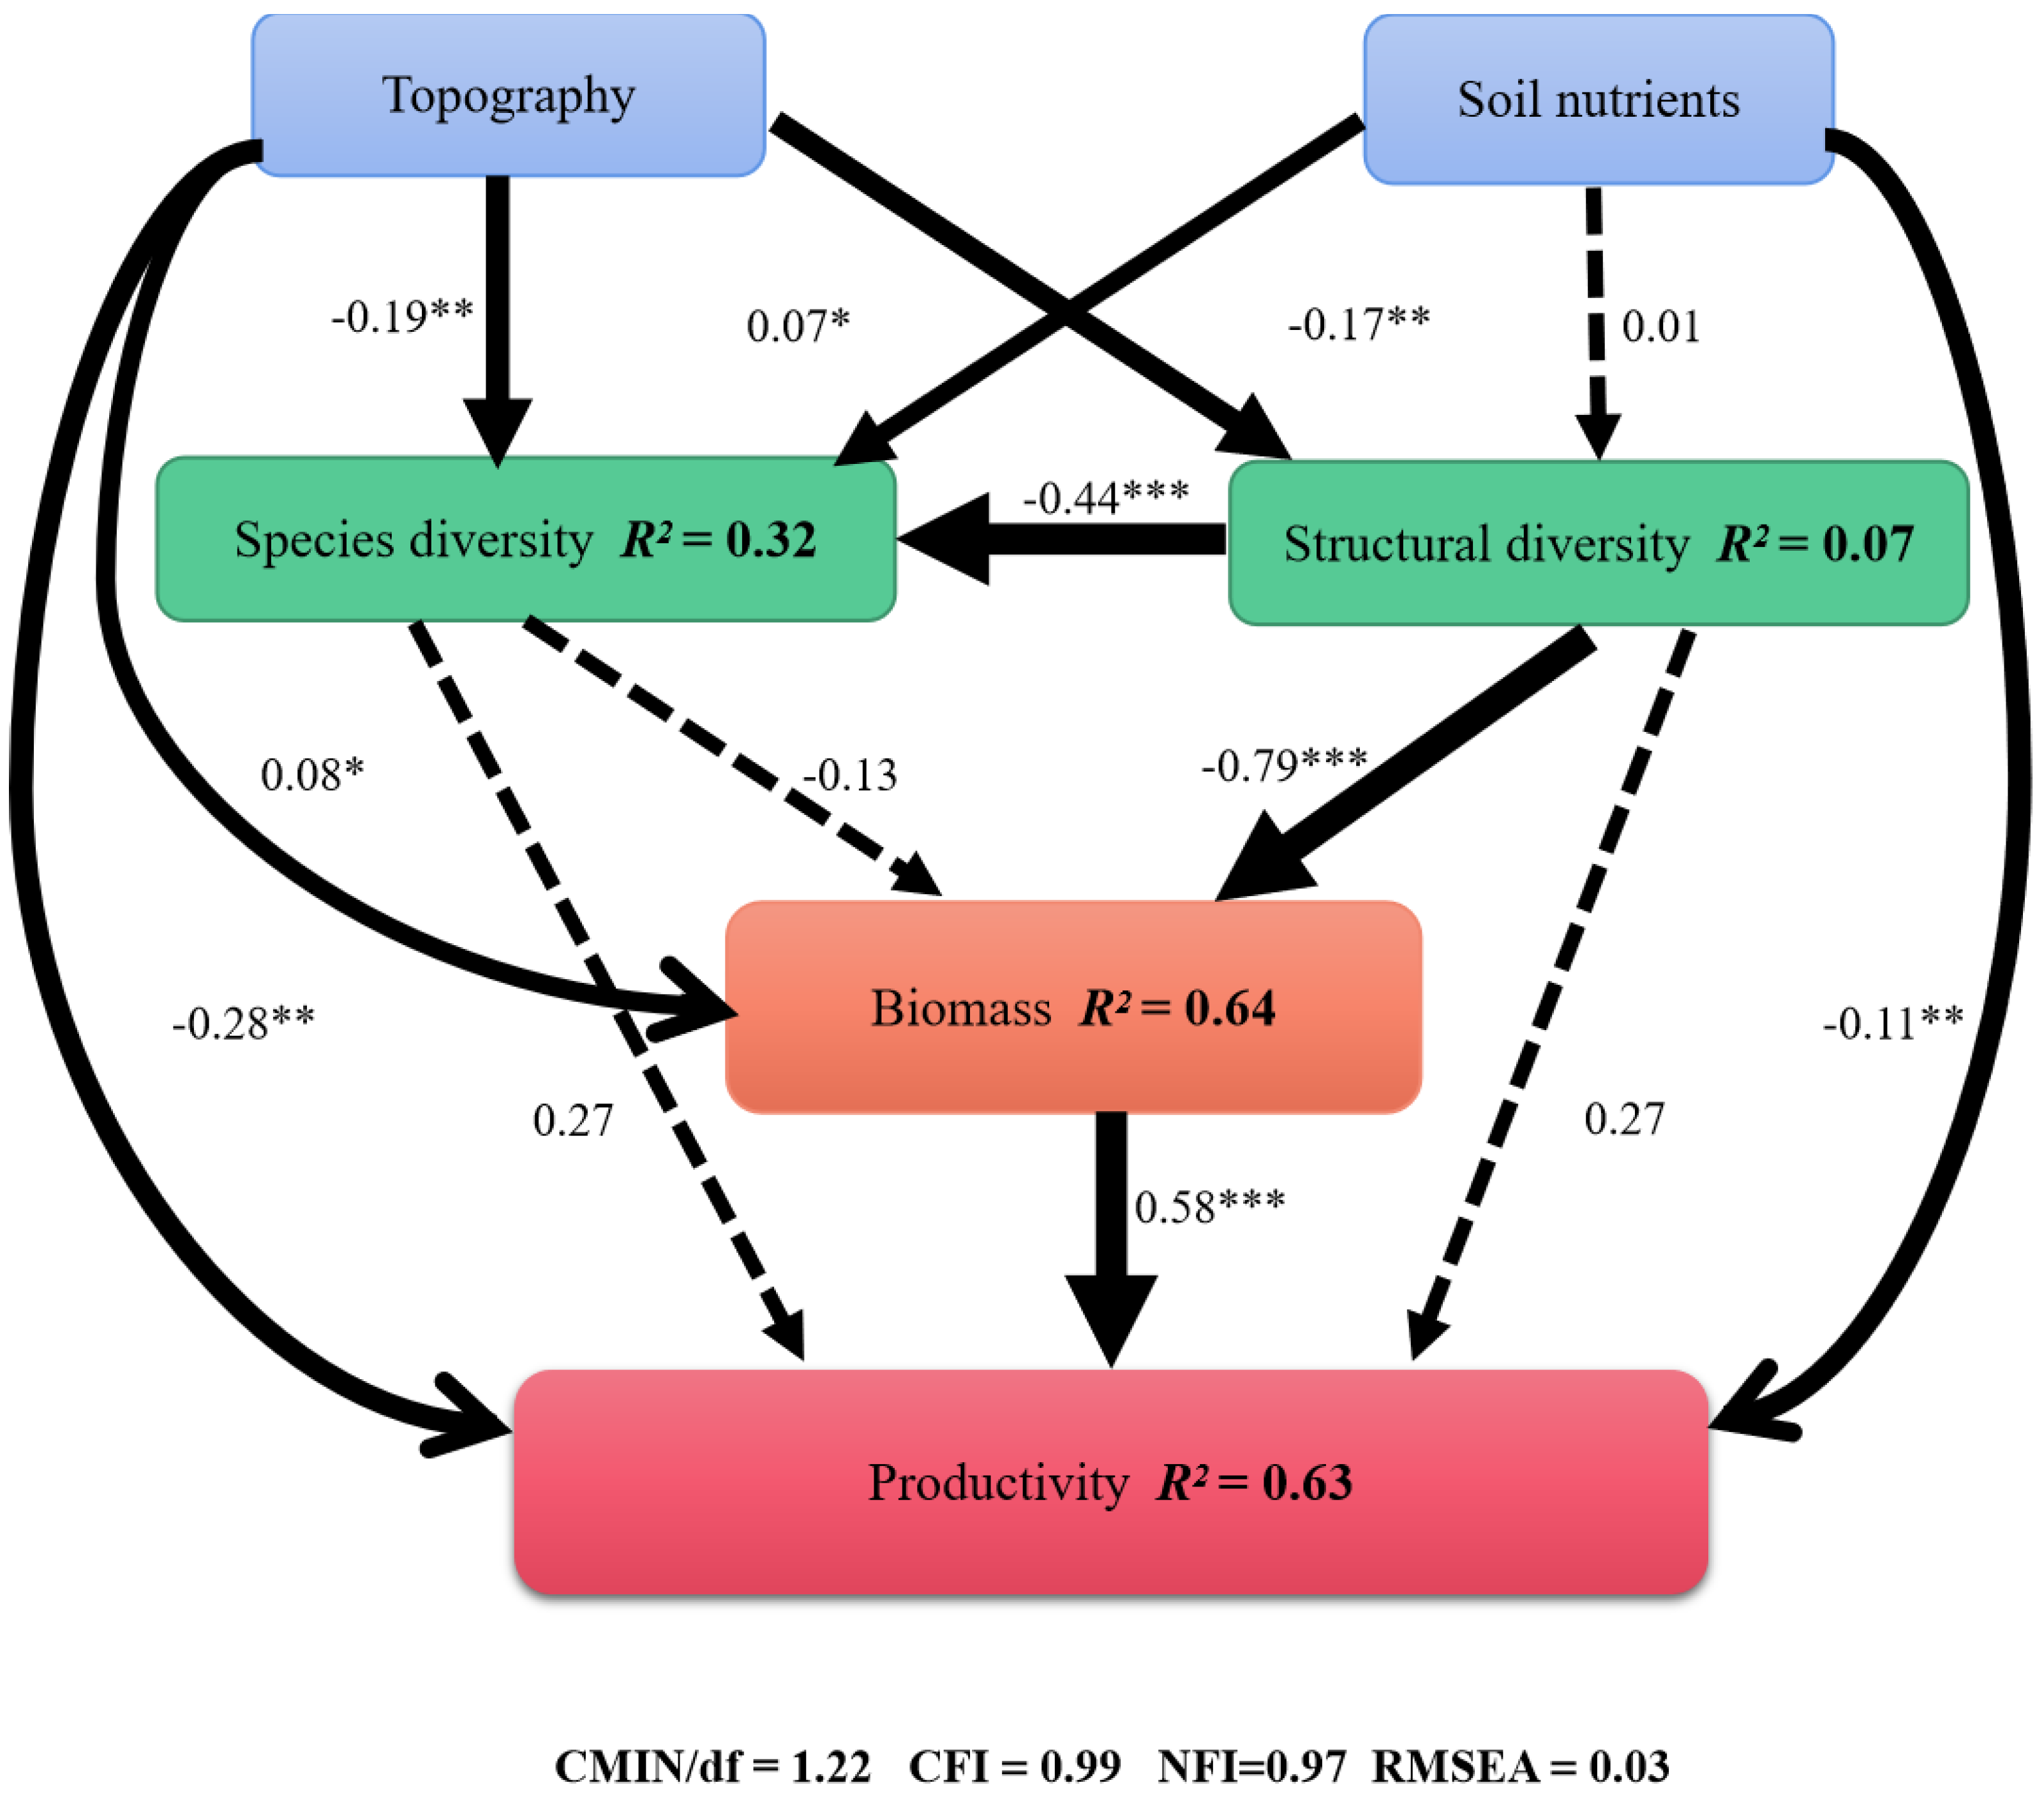
3.4. Relative Importance of Stand Conditions in Determining Productivity

The SEM model (Figure 4) explained 63% of the productivity in Mulun National Nature Reserve: the direct influences were topography (β = 0.28), soil nutrients (β = −0.11), species diversity (β = 0.27), structural diversity (β = 0.27), and biomass (β = 0.58). However, biomass was directly influenced by topography (β = 0.08), and also negatively influenced by species diversity (β = −0.13), and structural diversity (β = −0.79); species diversity was directly influenced by soil nutrients (β = 0.07), and negatively influenced by topography (β = −0.19) and structural diversity (β = −0.44); structural diversity was directly influenced by soil nutrients (β = 0.01), and negatively influenced by topography (β = −0.17).

4. Discussion

4.1. Dynamic Changes of Forest Biomass and Productivity

Over the 2007–2017 study period, the number of genera and species of native forest woody plants decreased, but the biomass increased. The results showed that the average AGB (70.47 Mg ha−1) in 2017 was 24.52% higher than that in 2007 (53.19 Mg ha−1), indicating that the forest is still growing and is rich in species composition and stable in structure [43]. However, its AGB was lower than that of the main forests surrounding the karst mountains in the southwest China (122.95–136.4 Mg ha−1) [36]. This shows that the primary forest is still in the period of community succession and growth, and that the biomass and productivity are gradually increasing [44]; in addition, different study areas and scales can also cause differences. We also found that the karst forest had lower AGB than typical forests in non-karst regions (152.88 Mg ha−1) in the same climate zone [45], which may be due to the shallow soil layer and poor water retention capacity of the karst environment, which restricts the growth of plants and accumulation of biomass [46]. This pattern was attributed to the number of individuals and different distributions of the different species [47]. Terrain with good growing conditions can capture enough light to help promote growth. Trees in valleys are adversely influenced by harsh conditions such as high humidity and high canopy density, leading to reduced biomass accumulation in valleys than on ridges [48].

4.2. The Influence of Species Diversity and Structural Diversity on Community Dynamic

The results of unary linear regression (Figure 2a) showed that species diversity was significantly positively correlated with productivity, consistent with previous studies [15,49]. Again, this suggests that the Karst primary forest site is in the stage of succession and growth, and that the forest structure is relatively stable and the resources can be fully utilized. It is also evident that when the individual species distribution is more uneven, productivity is higher [44]. However, species diversity was negatively correlated with biomass, which is consistent with Zhu, J. et al. [50], and contrary to Wu, C. et al. [15]. The total biomass of the community mainly depends on the species with high carbon storage. When the species with high carbon storage compete or die, the biomass accumulation will be reduced [14]. The complex karst topography and landforms lead to spatially heterogeneous elevations, slopes and niche types, which encourage a faster regeneration rate of some species. This influences the growth of species with high storage, resulting in negative correlation between species diversity and biomass.
The community structure through light complementary utilization to promote productivity, and reflects individuals the complexity of spatial structure, and its diversity reflects the resource allocation of constituent species [51]. The results showed that the structural diversity (PCA1) was negatively correlated with productivity. Productivity was positively correlated with SDba and CVba (Figure 2b, Table S1). This indicates that when individuals were more evenly distributed across the full range of diameters, the productivity level was higher [52], and individuals in different diameter classes, different forest layers and different habitats could promote complexity in the canopy structure [51]. Meanwhile, the structural diversity (PCA2) was positively correlated with productivity. Productivity was negatively correlated with H′ba and DEN (Figure 2c, Table S1). When the karst forests are influenced by external disturbance, the spatial structure of the community will change, and the impact of community structure (DBH Shannon index) and stand density on productivity will be weakened by scarce resources and decreased absorption efficiency [10]. Likewise, communities with high structural heterogeneity can have reduced productivity [14]. Due to the influences of spatial structure, climate and geographical conditions on karst forest, some species grow slowly: in particular, young plants are subjected to extremely intense pressure of intraspecific competition, with limited resources (such as light and space), leading to high sapling mortality. Together these factors explain the negative correlation between community structure diversity and productivity.
The results showed that the structural diversity axes (PCA1, PCA2) were all negatively correlated with biomass (Figure 2b,c). With increasing community age, community structure complexity and canopy density, some positive species were at a disadvantage in the competition for environmental resources and may not have survived. These factors explain the rapid regeneration rate of the community [18], as well as the higher SDba index, the greater dispersion, and the increase of stand density, which resulted in fierce resource competition and the decline in biomass.

4.3. The Relative Influences of Biotic and Abiotic Factors on Community Dynamics

Biotic and abiotic factors were both closely related to the structure and function of forest communities. Changes in topographic factors and soil nutrient determined species community distribution, forest carbon pool and forest function. Biodiversity is a major driver of ecosystem function. During community succession, species and environment interact and gradually form a stable community structure.
The results above showed that topography had a direct impact on species diversity, structural diversity, biomass and productivity (Figure 4), while topography had a significant negative correlation with biodiversity and productivity. There is more light in convex high elevation areas (such as topographic high points), which is beneficial to the growth of trees, while the restricted light together with shallow and barren soil in the valleys are not suitable for growth, the number of species decreases and forest structure change with increasing elevation from the depression to the slope top and cause species diversity and complexity of species structure gradually decreased from the depression to the slope top (Figure 3) [53,54], so topography had a significant negative correlation with species diversity. Topography was positively correlated with biomass, which is consistent with Hui et al. and de Castilho et al. [55], at greater slope angles, improved light conditions are conducive to the growth of species with high carbon storage, promoting the increase of biomass. Topography affected the distribution of different diameter classes of species. Although small-diameter individuals rapidly regenerated and improved community productivity, it mainly depended on large-diameter individuals, the number of large-diameter individuals affected by topographic factors decreased, leaded to decreased productivity and had a negative correlation with topography.
Changes in topography and soil nutrients determine multiple aspects of species distribution, forest carbon pool composition and function. Species in natural communities have evolved over a long period of time, forming a specific community structure of interdependence and interaction between species and the environment. The results of showed that topographic factors had no significant effect on biomass and productivity, which was consistent with the results of Zhu Jie et al.’s study on evergreen broad-leaved forests in the subtropical region [50], and different from the results of Wu Chuping’ s study on secondary forest in Dinghai, Zhejiang [15], this indicates that the structure of the community is influenced by region and forest type. Elevation was positively correlated with species diversity, while slope was negatively correlated with species diversity. The possible reason was that the topography of the study area changed from depression to steep slope, and species diversity varies with elevation and slope, leading to multiple relationships between topographic factors and species diversity. The nutrient status of the soil is an indicator to measure the nutrient limitation of the environment on the growth of vegetation, the soil nitrogen and phosphorus required by plant growth mainly come from soil. The low availability of phosphorus and high availability of calcium due to high soil weathering in karst areas of southwest China. In this study, it was found that the community structure was complex in the environment with high content of soil phosphorus and soil available potassium in karst primeval forest. While the environment with high soil organic carbon and soil nitrogen content reduced community structure, which was similar to the results of Zhu Jie et al.’s study [50]. The possible causes: soil nitrogen deposition affects the changes of species diversity and structural diversity, and the more nitrogen in soil, the lower the community species diversity and structural diversity, and the lower the biodiversity will affect the growth of forest productivity. Therefore, soil nutrients have a significant impact on vegetation biomass and productivity in karst forests.
There was a direct positive correlation between species diversity and productivity, and a direct negative correlation between species diversity and biomass, but these relationships only explained 13% of variance. Previous studies have confirmed that species richness has a positive impact on forest productivity [56,57]. Other studies have also found that species richness is positively correlated with biomass and has a significant quadratic influence on productivity [15]. It is sometimes believed that species diversity is one of the determinants of ecosystem function [9]: the higher the species richness, the stronger the aggregation traits of dominant species, which can promote productivity. Studies have also shown that biomass can instead decrease at higher functional diversity [19], because when the number of species in the community is small, the dominant species are the pioneer species with high productivity and low carbon reserves. With the increase of species richness, the number of species with high carbon storage increases in the community. Owing to the particular characteristics of the karst sample, most of the species with high carbon storage were located on the slope or on a topographic high, leading to direct and significant positive correlation between biomass and productivity (Figure 4). There was a direct and significant negative correlation between structural diversity and biomass. Research has shown that stand density can alter biomass accumulation by changing the interaction between species [10]. Species competition increases mortality and changes seedling stand density and spatial pattern [58]. Furthermore, the amount of biomass is mainly controlled by some minority species or individuals in the community, and the sizes of different species and trees have different influences on biomass [42]–in particular, large trees have a higher capacity for photosynthesis and growth and therefore a more direct influence on biomass.

5. Conclusions

Our study highlights how multiple abiotic and biotic factors interact to influence the biomass and productivity dynamics in a 2 ha dynamic forest plot in Southwest China. We found that the productivity was 1.76 Mg ha−1 yr−1 between 2007 and 2017. Both species diversity and structural diversity were influenced by topographic and soil factors, but their influences on species diversity were stronger. There was no significant difference between species diversity and structural diversity in explaining productivity, while structural diversity was better than species diversity in explaining biomass accumulation. Both biotic factors and abiotic factors can directly explain biomass and productivity, but biotic factors are better than abiotic factors in explaining biomass and productivity. This study explored the dynamics of community biomass and productivity in subtropical forests, and identified key influencing factors. There are two major limitations in this study that could be address in future research. First, the area of the study sample plot is only 2 ha, and the results obtained are of reference value, but not completely representative of other forests. Second, the depression in the study sample was partially disturbed by natural disasters, which caused a little damage to the species in the depression, but the overall impact was not significant, and this is why the topographic factors have various influence relationships on species diversity and the topographic factors have no effect on species diversity. Over time, the forest restoration process provides an ideal place for subsequent sustainable development and research.

6. Implication

Based on the results presented above, it is reasonable to conclude that forest productivity is closely related to tree species structure, stand density, and species diversity in subtropical karst forest, and therefore, measures such as forest tending should be emphasized to increase forest productivity, so as to achieve sustainable management of forests. Therefore, the combined influences of biotic and abiotic factors should be considered in future studies on biodiversity and ecosystem function, providing a scientific basis for understanding the services and functions of karst ecosystems. These results provide novel insights into the driving mechanism of forest productivity, which is beneficial to achievie effective protection and the sustainable utilization of forest resources, maintain the stability of the forest ecosystem, as well as help policy makers in planning sustainable forest management are of great significance.

Supplementary Materials

The following supporting information can be downloaded at: https://www.mdpi.com/article/10.3390/su14137644/s1, Table S1: Mean and contribution rate of topography factors, soil factors, species diversity factors and structural diversity factors variables of each 10 m × 10 m quadrat and Correlation between them with the PCA axes.

Author Contributions

Conceptualization, L.Z., H.D. and G.H.; methodology, L.Z., H.D. and T.S.; investigation, L.Z. and Z.Y.; writing—original draft preparation, L.Z.; writing—review and editing, T.S. and G.H.; funding acquisition, H.D., F.Z. and W.P. All authors have read and agreed to the published version of the manuscript.

Funding

This work was funded by the National Natural Science Foundation of China (31971487, 42071073), Youth Innovation Promotion Association of the Chinese Academy of Sciences (2021366), Guangxi Key Research and Development Program (AB17129009), Hechi Distinguished Expert Program to Fuping Zeng.

Institutional Review Board Statement

Not applicable.

Informed Consent Statement

Not applicable.

Data Availability Statement

All data is stored at the Institute of Subtropical Agriculture, Chinese Academy of Sciences, and is available from the corresponding author on reasonable request.

Conflicts of Interest

The authors declare no conflict of interest.

References

  1. Houghton, R.A.; Hall, F.; Goetz, S.J. Importance of biomass in the global carbon cycle. J. Geophys. Res.-Biogeosci. 2009, 114, G00E03. [Google Scholar] [CrossRef]
  2. Pan, Y.; Birdsey, R.A.; Phillips, O.L.; Jackson, R.B. The Structure, Distribution, and Biomass of the World’s Forests. Annu. Rev. Ecol. Evol. Syst. 2013, 44, 593–622. [Google Scholar] [CrossRef] [Green Version]
  3. Pan, Y.; Birdsey, R.A.; Fang, J.; Houghton, R.; Kauppi, P.E.; Kurz, W.A.; Phillips, O.L.; Shvidenko, A.; Lewis, S.L.; Canadell, J.G.; et al. A large and persistent carbon sink in the world’s forests. Science 2011, 333, 988–993. [Google Scholar] [CrossRef] [PubMed] [Green Version]
  4. Ruiz-Benito, P.; Ratcliffe, S.; Jump, A.S.; Gomez-Aparicio, L.; Madrigal-Gonzalez, J.; Wirth, C.; Kaendler, G.; Lehtonen, A.; Dahlgren, J.; Kattge, J.; et al. Functional diversity underlies demographic responses to environmental variation in European forests. Glob. Ecol. Biogeogr. 2017, 26, 128–141. [Google Scholar] [CrossRef] [Green Version]
  5. Allan, E.; Manning, P.; Alt, F.; Binkenstein, J.; Blaser, S.; Bluethgen, N.; Boehm, S.; Grassein, F.; Hoelzel, N.; Klaus, V.H.; et al. Land use intensification alters ecosystem multifunctionality via loss of biodiversity and changes to functional composition. Ecol. Lett. 2015, 18, 834–843. [Google Scholar] [CrossRef]
  6. Ratcliffe, S.; Wirth, C.; Jucker, T.; van der Plas, F.; Scherer-Lorenzen, M.; Verheyen, K.; Allan, E.; Benavides, R.; Bruelheide, H.; Ohse, B.; et al. Biodiversity and ecosystem functioning relations in European forests depend on environmental context. Ecol. Lett. 2017, 20, 1414–1426. [Google Scholar] [CrossRef]
  7. Albrich, K.; Rammer, W.; Thom, D.; Seidl, R. Trade-offs between temporal stability and level of forest ecosystem services provisioning under climate change. Ecol. Appl. 2018, 28, 1884–1896. [Google Scholar] [CrossRef] [Green Version]
  8. Paquette, A.; Messier, C. The effect of biodiversity on tree productivity: From temperate to boreal forests. Glob. Ecol. Biogeogr. 2011, 20, 170–180. [Google Scholar] [CrossRef] [Green Version]
  9. Tilman, D.; Isbell, F.; Cowles, J.M. Biodiversity and Ecosystem Functioning. Annu. Rev. Ecol. Evol. Syst. 2014, 45, 471–493. [Google Scholar] [CrossRef]
  10. Forrester, D.I.; Bauhus, J. A Review of Processes behind Diversity-Productivity Relationships in Forests. Curr. For. Rep. 2016, 2, 45–61. [Google Scholar] [CrossRef] [Green Version]
  11. Loreau, M.; Naeem, S.; Inchausti, P.; Bengtsson, J.; Grime, J.P.; Hector, A.; Hooper, D.U.; Huston, M.A.; Raffaelli, D.; Schmid, B.; et al. Ecology-Biodiversity and ecosystem functioning: Current knowledge and future challenges. Science 2001, 294, 804–808. [Google Scholar] [CrossRef] [Green Version]
  12. Zhang, Y.; Chen, H.Y.H.; Reich, P.B. Forest productivity increases with evenness, species richness and trait variation: A global meta-analysis. J. Ecol. 2012, 100, 742–749. [Google Scholar] [CrossRef]
  13. Liang, J.; Crowther, T.W.; Picard, N.; Wiser, S.; Zhou, M.; Alberti, G.; Schulze, E.-D.; McGuire, A.D.; Bozzato, F.; Pretzsch, H.; et al. Positive biodiversity-productivity relationship predominant in global forests. Science 2016, 354, aaf8957. [Google Scholar] [CrossRef] [Green Version]
  14. Ouyang, S.; Xiang, W.; Wang, X.; Zeng, Y.; Lei, P.; Deng, X.; Peng, C. Significant effects of biodiversity on forest biomass during the succession of subtropical forest in south China. For. Ecol. Manag. 2016, 372, 291–302. [Google Scholar] [CrossRef]
  15. Wu, C.; Han, W.; Jiang, B.; Liu, B.; Yuan, W.; Shen, A.; Huang, Y.; Zhu, J. Relationships between species richness and biomass/productivity depend on environmental factors in secondary forests of Dinghai, Zhejiang Province. Biodivers. Sci. 2018, 26, 545–553. [Google Scholar] [CrossRef]
  16. Liang, J.; Buongiorno, J.; Monserud, R.A.; Kruger, E.L.; Zhou, M. Effects of diversity of tree species and size on forest basal area growth, recruitment, and mortality. For. Ecol. Manag. 2007, 243, 116–127. [Google Scholar] [CrossRef]
  17. Grace, J.B.; Anderson, T.; Michael, S.; Eric, W.; Borer, E.T.; Adler, P.B.; Harpole, W.S.; Hautier, Y.; Hillebrand, H.; Lind, E.M.; et al. Integrative modelling reveals mechanisms linking productivity and plant species richness. Nature 2016, 529, 390–393. [Google Scholar] [CrossRef]
  18. Zhang, Y.; Chen, H.Y.H. Individual size inequality links forest diversity and above-ground biomass. J. Ecol. 2015, 103, 1245–1252. [Google Scholar] [CrossRef]
  19. Zhou, T.; Zhang, J.; Qin, Y.; Jiang, M.; Qiao, X. The Effects of Biotic and Abiotic Factors on the Community Dynamics in a Mountain Subtropical Forest. Forests 2021, 12, 427. [Google Scholar] [CrossRef]
  20. Long, J.N.; Shaw, J.D. The influence of compositional and structural diversity on forest productivity. Forestry 2010, 83, 121–128. [Google Scholar] [CrossRef] [Green Version]
  21. Danescu, A.; Albrecht, A.T.; Bauhus, J. Structural diversity promotes productivity of mixed, uneven-aged forests in southwestern Germany. Oecologia 2016, 182, 319–333. [Google Scholar] [CrossRef]
  22. Clark, J.S. Individuals and the Variation Needed for High Species Diversity in Forest Trees. Science 2010, 327, 1129–1132. [Google Scholar] [CrossRef] [Green Version]
  23. Morin, X.; Fahse, L.; Scherer-Lorenzen, M.; Bugmann, H. Tree species richness promotes productivity in temperate forests through strong complementarity between species. Ecol. Lett. 2011, 14, 1211–1219. [Google Scholar] [CrossRef]
  24. Ali, A.; Yan, E.-R. The forest strata-dependent relationship between biodiversity and aboveground biomass within a subtropical forest. For. Ecol. Manag. 2017, 401, 125–134. [Google Scholar] [CrossRef]
  25. Hardiman, B.S.; Bohrer, G.; Gough, C.M.; Vogel, C.S.; Curtis, P.S. The role of canopy structural complexity in wood net primary production of a maturing northern deciduous forest. Ecology 2011, 92, 1818–1827. [Google Scholar] [CrossRef] [Green Version]
  26. Vila, M.; Carrillo-Gavilan, A.; Vayreda, J.; Bugmann, H.; Fridman, J.; Grodzki, W.; Haase, J.; Kunstler, G.; Schelhaas, M.; Trasobares, A. Disentangling Biodiversity and Climatic Determinants of Wood Production. PLoS ONE 2013, 8, e53530. [Google Scholar] [CrossRef] [Green Version]
  27. Diao, J.; Liu, J.; Zhu, Z.; Wei, X.; Li, M. Active forest management accelerates carbon storage in plantation forests in Lishui, southern China. For. Ecosyst. 2022, 9, 100004. [Google Scholar] [CrossRef]
  28. Coomes, D.A.; Holdaway, R.J.; Kobe, R.K.; Lines, E.R.; Allen, R.B. A general integrative framework for modelling woody biomass production and carbon sequestration rates in forests. J. Ecol. 2012, 100, 42–64. [Google Scholar] [CrossRef]
  29. Yuan, Z.; Ali, A.; Wang, S.; Gazol, A.; Freckleton, R.; Wang, X.; Lin, F.; Ye, J.; Zhou, L.; Hao, Z.; et al. Abiotic and biotic determinants of coarse woody productivity in temperate mixed forests. Sci. Total Environ. 2018, 630, 422–431. [Google Scholar] [CrossRef]
  30. Pretzsch, H.; Bielak, K.; Block, J.; Bruchwald, A.; Dieler, J.; Ehrhart, H.-P.; Kohnle, U.; Nagel, J.; Spellmann, H.; Zasada, M.; et al. Productivity of mixed versus pure stands of oak (Quercus petraea (Matt.) Liebl. and Quercus robur L.) and European beech (Fagus sylvatica L.) along an ecological gradient. Eur. J. For. Res. 2013, 132, 263–280. [Google Scholar] [CrossRef]
  31. Prado-Junior, J.A.; Schiavini, I.; Vale, V.S.; Arantes, C.S.; van der Sande, M.T.; Lohbeck, M.; Poorter, L. Conservative species drive biomass productivity in tropical dry forests. J. Ecol. 2016, 104, 817–827. [Google Scholar] [CrossRef] [Green Version]
  32. Murphy, S.J.; Audino, L.D.; Whitacre, J.; Eck, J.L.; Wenzel, J.W.; Queenborough, S.A.; Comita, L.S. Species associations structured by environment and land-use history promote beta-diversity in a temperate forest. Ecology 2015, 96, 705–715. [Google Scholar] [CrossRef] [Green Version]
  33. Valencia, R.; Condit, R.; Muller-Landau, H.C.; Hernandez, C.; Navarrete, H. Dissecting biomass dynamics in a large Amazonian forest plot. J. Trop. Ecol. 2009, 25, 473–482. [Google Scholar] [CrossRef] [Green Version]
  34. Du, H.; Liu, L.; Su, L.; Zeng, F.; Wang, K.; Peng, W.; Zhang, H.; Song, T. Seasonal Changes and Vertical Distribution of Fine Root Biomass during Vegetation Restoration in a Karst Area, Southwest China. Front. Plant Sci. 2019, 9, 2001. [Google Scholar] [CrossRef] [Green Version]
  35. Du, H.; Hu, F.; Zeng, F.; Wang, K.; Peng, W.; Zhang, H.; Zeng, Z.; Zhang, F.; Song, T. Spatial distribution of tree species in evergreen-deciduous broadleaf karst forests in southwest China. Sci. Rep. 2017, 7, 15564. [Google Scholar] [CrossRef] [Green Version]
  36. Liu, L.; Wu, Y.-Y.; Hu, G.; Zhang, Z.-H.; Cheng, A.-Y.; Wang, S.-J.; Ni, J. Biomass of karst evergreen and deciduous broad-leaved mixed forest in central Guizhou province, southwestern China: A comprehensive inventory of a 2 ha plot. Silva Fenn. 2016, 50, 1492. [Google Scholar] [CrossRef] [Green Version]
  37. Cheng, J.; Lee, X.; Theng, B.K.G.; Zhang, L.; Fang, B.; Li, F. Biomass accumulation and carbon sequestration in an age-sequence of Zanthoxylum bungeanum plantations under the Grain for Green Program in karst regions, Guizhou province. Agric. For. Meteorol. 2015, 203, 88–95. [Google Scholar] [CrossRef]
  38. Du, H.; Peng, W.X.; Song, T.Q.; Zeng, F.P.; Wang, K.L.; Song, M.; Zhang, H. Spatial pattern of woody plants and their environmental interpretation in the karst forest of southwest China. Plant Biosyst. 2015, 149, 121–130. [Google Scholar] [CrossRef]
  39. Zhang, F.; Zhang, J.; Zhang, F. Pattern of forest vegetation and its environmental interpretation in Zhuweigou, Lishan Mountain Nature Reserve. Acta Ecol. Sin. 2003, 23, 421–427. [Google Scholar]
  40. Wang, Z.; Du, H.; Song, T.; Peng, W.; Zeng, F.; Zeng, Z.; Zhang, H. Allometric models of major tree species and forest biomass in Guangxi. Acta Ecol. Sin. 2015, 35, 4462–4472. [Google Scholar]
  41. Lasky, J.R.; Uriarte, M.; Boukili, V.K.; Erickson, D.L.; Kress, W.J.; Chazdon, R.L. The relationship between tree biodiversity and biomass dynamics changes with tropical forest succession. Ecol. Lett. 2014, 17, 1158–1167. [Google Scholar] [CrossRef]
  42. Ali, A.; Lin, S.-L.; He, J.-K.; Kong, F.-M.; Yu, J.-H.; Jiang, H.-S. Climate and soils determine aboveground biomass indirectly via species diversity and stand structural complexity in tropical forests. For. Ecol. Manag. 2019, 432, 823–831. [Google Scholar] [CrossRef]
  43. Shen, W.; He, Q.; Peng, Y.; Huang, X.; Pang, S.; Li, Y. Species composition and diversity of different shrub communities in West Guangxi. Guihaia 2016, 36, 1165–1171. [Google Scholar]
  44. Cadotte, M.W. Functional traits explain ecosystem function through opposing mechanisms. Ecol. Lett. 2017, 20, 989–996. [Google Scholar] [CrossRef]
  45. Yu, W.; Dong, D.; Ni, J. Comparison of biomass and productivity between karst and non-karst forests in mountainous areas of southwest China. J. Subtrop. Resour. Environ. 2010, 5, 25–30. [Google Scholar]
  46. Lin, D.; Lai, J.; Mi, X.; Ren, H.; Ma, K. Spatial variation in community structure of a subtropical evergreen broad-leaved forest: Implications for sampling design. Chin. Sci. Bull. 2013, 58, 1181–1186. [Google Scholar] [CrossRef] [Green Version]
  47. Lohbeck, M.; Poorter, L.; Martinez-Ramos, M.; Bongers, F. Biomass is the main driver of changes in ecosystem process rates during tropical forest succession. Ecology 2015, 96, 1242–1252. [Google Scholar] [CrossRef]
  48. Xu, Y.; Franklin, S.B.; Wang, Q.; Shi, Z.; Luo, Y.; Lu, Z.; Zhang, J.; Qiao, X.; Jiang, M. Topographic and biotic factors determine forest biomass spatial distribution in a subtropical mountain moist forest. For. Ecol. Manag. 2015, 357, 95–103. [Google Scholar] [CrossRef]
  49. Liu, B.; Chen, H.Y.H.; Yang, J. Linking understory species diversity, community-level traits and productivity in a Chinese boreal forest. J. Veg. Sci. 2019, 30, 247–256. [Google Scholar] [CrossRef]
  50. Zhu, J.; Wu, A.; Zou, S.; Xiong, X.; Liu, S.; Chu, G.; Zhang, Q.; Liu, J.; Tang, X.; Yan, J.; et al. Relationships between tree diversity and biomass/productivity and their influence factors in a lower subtropical evergreen broad-leaved forest. Biodivers. Sci. 2021, 29, 1435–1446. [Google Scholar] [CrossRef]
  51. Fahey, R.T.; Fotis, A.T.; Woods, K.D. Quantifying canopy complexity and effects on productivity and resilience in late-successional hemlock-hardwood forests. Ecol. Appl. 2015, 25, 834–847. [Google Scholar] [CrossRef]
  52. Tan, L.; Fan, C.; Fan, X. Relationships between species diversity or community structure and productivity of woody-plants in a broad-leaved Korean pine forest in Jiaohe, Jilin, China. Chin. J. Plant Ecol. 2017, 41, 1149–1156. [Google Scholar]
  53. Fortunel, C.; Lasky, J.R.; Uriarte, M.; Valencia, R.; Joseph Wright, S.; Garwood, N.C.; Kraft, N.J.B. Topography and neighborhood crowding can interact to shape species growth and distribution in a diverse Amazonian forest. Ecology 2018, 99, 2272–2283. [Google Scholar] [CrossRef] [PubMed]
  54. Yuan, Z.; Ali, A.; Jucker, T.; Ruiz-Benito, P.; Wang, S.; Jiang, L.; Wang, X.; Lin, F.; Ye, J.; Hao, Z.; et al. Multiple abiotic and biotic pathways shape biomass demographic processes in temperate forests. Ecology 2019, 100, e02650. [Google Scholar] [CrossRef] [PubMed] [Green Version]
  55. Bobbink, R.; Hicks, K.; Galloway, J.; Spranger, T.; Alkemade, R.; Ashmore, M.; Bustamante, M.; Cinderby, S.; Davidson, E.; Dentener, F.; et al. Global assessment of nitrogen deposition effects on terrestrial plant diversity: A synthesis. Ecol. Appl. 2010, 20, 30–59. [Google Scholar] [CrossRef] [PubMed] [Green Version]
  56. Ouyang, S.; Xiang, W.; Wang, X.; Xiao, W.; Chen, L.; Li, S.; Sun, H.; Deng, X.; Forrester, D.I.; Zeng, L.; et al. Effects of stand age, richness and density on productivity in subtropical forests in China. J. Ecol. 2019, 107, 2266–2277. [Google Scholar] [CrossRef]
  57. Huang, Y.; Chen, Y.; Castro-Izaguirre, N.; Baruffol, M.; Brezzi, M.; Lang, A.; Li, Y.; Haerdtle, W.; von Oheimb, G.; Yang, X.; et al. Impacts of species richness on productivity in a large-scale subtropical forest experiment. Science 2018, 362, 80–83. [Google Scholar] [CrossRef] [Green Version]
  58. McDowell, N.G.; Allen, C.D.; Anderson-Teixeira, K.; Aukema, B.H.; Bond-Lamberty, B.; Chini, L.; Clark, J.S.; Dietze, M.; Grossiord, C.; Hanbury-Brown, A.; et al. Pervasive shifts in forest dynamics in a changing world. Science 2020, 368, eaaz9463. [Google Scholar] [CrossRef]
Figure 1. Location map of the sample plot.
Sustainability 14 07644 g001
Figure 2. Relationships of species diversity and structural diversity with plant biomass and productivity. (a) Relationship between loading on the first axis of species diversity and plant biomass and productivity. (b) Relationship between loading on the first axis of structural diversity and plant biomass and productivity. (c) Relationship between loading on the second axis of structural diversity and plant biomass and productivity. The grey shadow represent 95% confidence intervals.
Sustainability 14 07644 g002
Figure 3. Pearson correlation between species diversity, structural diversity, biomass, productivity and soil nutrients, topographic factors in the southwest karst forest. Letters B and P mean biomass and productivity, blue symbols show positive correlation, red symbols show negative correlation, the size of the circle represents r2, greyscale shading indicates p > 0.05, 0.05 < p < 0.01, 0.01 < p < 0.001, p < 0.001. Abbreviations follows Table 1 and Table 2.
Sustainability 14 07644 g003
Figure 4. The impacts of topography, soil nutrients, species diversity and structural diversity on biomass and productivity. The SEM considered all plausible pathways, to increase the degrees of freedom. The numbers on the arrows indicate standardized path coefficients (* p < 0.05, ** p < 0.01, *** p < 0.001). Black arrows represent significant influence and dashed arrows represent non-significant influence. Arrow width is proportional to the strength of the path coefficients. R2 is the proportion of variance explained.
Sustainability 14 07644 g004
Table 1. The statistical information of basic variables in the sampling plot.
VariableRangeMeanStandard Deviation
Elevation (ELE) (m)438.11–522.0772.1120.77
Slope (SLO) (°)2.34–60.1531.5813.47
Cos (Aspect) (ASP)−0.99–0.99−0.190.65
Convexity (CON)−5.99–5.27−0.262.01
Rock outcrop ratio (ROR) (%)8–9876.1920.29
Soil total nitrogen (TN) (g·kg−1)2.38–19.578.365.11
Soil total phosphorus (TP) (g·kg−1)0.31–3.371.310.71
Soil total potassium (TK) (g·kg−1)1.46–11.095.632.42
Soil available nitrogen (AN) (mg·kg−1)266.51–2075.69855.63504.77
Soil available phosphorus (AP) (mg·kg−1)0.20–25.288.886.69
Soil available potassium (AK) (mg·kg−1)33.79–336.18139.3473.88
Soil organic matter (SOM) (g·kg−1)46.08–372.17156.2895.27
Soil pH value (pH)5.64–7.646.770.58
Table 2. The formulas and results of species diversity and community structure of woody plants in the studied forest.
IndexFormulaRangeStandard Deviation
Species diversitySpecies richness (R)R = Ns1–304.54
Shannon-Wiener diversity index (H’) H = i = 1 N s n i N × ln ( n i N ) 0.64–3.160.45
Simpson diversity index (D) D = 1 i = 1 N s ( n i N ) 2 0.44–0.950.09
Pielou evenness index (E) E = H / ln ( N s ) 0.60–0.980.08
Structural diversityBasal area standard deviation (SDba)0.56–117.6520.19
Basal area coefficient of variation (CVba) C V ba = 100 × S D ba x b a ¯ 18.09–1526.15220.35
DBH Shannon-Wiener diversity index (Hba) H ba = j = 1 N d n j N × ln ( n j N ) 0.69–4.010.51
Stand density (DEN)0.08–2.330.58
N is the total number of individuals in a subplot; Ns is the total number of species in a subplot; ni is the individual number of the ith species; nj is the individual number of the jth diameter class.
Table 3. Changes in the species biomass and productivity of the primary forest in karst cluster-peak-depression region.
Years200720172007–2017
Number of genera10095
Number of species130123
Total number of individuals80735393
Total number of recruitments1978↑
Total number of recruitments4658↓
The average of AGB (Mg ha−1)53.1970.74
Productivity (Mg ha−1 yr−1)1.76
Note: ↑ indicates the number of new species, ↓ indicates the number of dead species from 2007 to 2017.
Publisher’s Note: MDPI stays neutral with regard to jurisdictional claims in published maps and institutional affiliations.

