Article

Leaf Carbon, Nitrogen and Phosphorus Stoichiometry in a Pinus yunnanensis Forest in Southwest China

1
Institute of Highland Forest Science, Chinese Academy of Forestry, Kunming 650224, China
2
Pu’er Forest Ecosystem Research Station, National Forestry and Grassland Administration, Kunming 650224, China
*
Author to whom correspondence should be addressed.
Sustainability 2022, 14(10), 6365; https://doi.org/10.3390/su14106365
Submission received: 21 April 2022 / Revised: 16 May 2022 / Accepted: 21 May 2022 / Published: 23 May 2022
(This article belongs to the Special Issue Conservation and Sustainability of Forest Biodiversity)

Abstract

:
Pinus yunnanensis forest is a unique forest type in southwest China and one of the main forest types in Yunnan Province, which also has great ecological, economic and social significance. Understanding the changes in the stoichiometric characteristics is a key to study the nutrient cycling, limiting factors and stability mechanisms of the forest ecosystem. However, the stoichiometric characteristics, stability of the ecosystem of P. yunnanensis natural forests and whether they are limited by nutrients are still poorly understood. Based on a K-S test, ANOVA analysis and OLS regression analysis, we analyzed the concentrations of leaf C, N and P in 48 woody species of natural P. yunnanensis forests from 122 plots to explore the pattern of leaf C:N:P stoichiometry. Our results showed that the mean values of leaf C, N and P plus C:N, C:P and N:P for the 48 woody species were 451.12, 11.05 and 1.11 mg/g and 45.03, 496.98 and 11.27, respectively. The coefficients of variation of leaf C, N and P plus C:N, C:P and N:P were 5.29%, 36.75%, 51.53%, 29.63%, 43.46% and 41.68%, respectively. The geometric mean values of leaf N, P and N:P were 10.49 and 1.00 mg/g and 10.51, respectively. Leaf C and N, and C and P relationships showed significant negative correlations, but a significant positive correlation was observed between leaf N and P. There were significant differences in leaf N and C:N across functional groups. There were significant differences in leaf C and P between evergreen and deciduous, conifer and broadleaf trees. Significant differences in leaf C:P were only observed between evergreen and deciduous trees, and significant differences in leaf N:P were observed between conifer and broadleaf trees. The relatively low N:P in all sampled trees indicated that N was a limiting factor in the distribution of natural P. yunnanensis forests. However, the higher leaf C:N and C:P ratios indicated that the P. yunnanensis natural forest ecosystem was in a relatively stable state.

1. Introduction

Nitrogen (N) and phosphorus (P) are fundamental elements required by plants and are the basic chemical elements in a variety of proteins and genetic material. Carbon (C) is made through photosynthesis assimilation and is the energy source of various physiological and biochemical processes in plants [1]. The combined effects of C, N and P on plant growth are stronger when compared with other nutrient elements [2,3]. Stoichiometric ratios can reflect plant ecological strategies, for example, C:N and C:P ratios can reflect plant growth rates, and the growth rates were related to the N and P efficiency of plants. Plant N:P stoichiometry can reflect the N or P limitation in plant growth [4,5,6,7,8,9]. If lacking either N or P, the leaf trait relationships and photosynthesis are changed and plant growth rates are reduced [10,11]. Leaf C, N and P contents and C:N:P ratios are important plant functional traits that reflect nutrient use efficiency and nutrient limitations, which are crucial to ecosystem structure and functions [12]. Therefore, ecological stoichiometry provides us with a framework to discuss the circulation of matter, balance and the coupling of nutrient elements in an ecosystem through the relationship of the proportion of elements [12]. Han et al. (2005) comprehensively analyzed the patterns of leaf N and P stoichiometry in 753 Chinese terrestrial plant species [13]. Since then, ecological stoichiometry has rapidly developed in recent years in China. Research has focused on forest [14,15,16], grassland [17,18,19] and wetland ecosystems [20,21,22] and the effect of fertilizers on N:P ratios [23,24]. In general, the research has been broad, showing a trend of taking forest, the largest ecosystem on land, as the dominant ecosystem. For example, Wu et al. (2017) used 348 plant species from eight forest types in China to analyze the stoichiometry of N and P and found that the distribution of leaf N and P contents was significantly different among the eight different forest types and leaf N and P generally increased with increasing latitude, except for a slight decrease in the cold temperate zone [25]. Zhang et al. (2018) used 803 plant species to explore C:N:P stoichiometry in nine natural forest ecosystems, ranging from cold temperate to tropical forests, and found that the C:P and N:P ratios decreased with increasing latitude, and the trend of P limitation increased in the lower latitudes of China’s forests [26]. However, there is lack of research on ecological stoichiometry in a particular area of a specific type of forest ecosystem, especially ecological stoichiometry in natural Pinus yunnanensis forests, which have important ecological and economic value.
P. yunnanensis is a fast-growing native tree species in southwest China. The plateau in mid-Yunnan is the distribution center of P. yunnanensis. P. yunnanensis forests live mainly in river valleys between 700 and 3000m above sea level and are distributed from 23° to 30° N and 96° to 108° E [27]. The P. yunnanensis forests can provide lots of good quality wood, large quantities of industrial raw materials and a variety of habitat conditions and habitats for animals and plants which play an important role in biodiversity protection, water conservation and soil retention [28]. Between the 1960s and 1980s, large areas of P. yunnanensis forests were destroyed by humans, and the great majority of P. yunnanensis forests were replaced by artificial forests. Thus, P. yunnanensis natural forests have declined significantly [29].
To our knowledge, the stoichiometric pattern of P. yunnanensis natural forest is still poorly understood. The main objectives of this study were to (1) investigate the leaf C, N, P, C:N ratios, C:P ratios and N:P ratios in P. yunnanensis forests at the community-level; (2) analyze the intrinsic relationships among leaf C, N and P; and (3) determine whether the growth of a P. yunnanensis natural forest is limited by N or P. Our results will be conducive to providing a scientific basis for the evaluation of ecosystem service function and the sustainable development of P. yunnanensis forests. This study can enrich the database of forest stoichiometry and help enhance the parameters of future ecological models.

2. Material and Methods
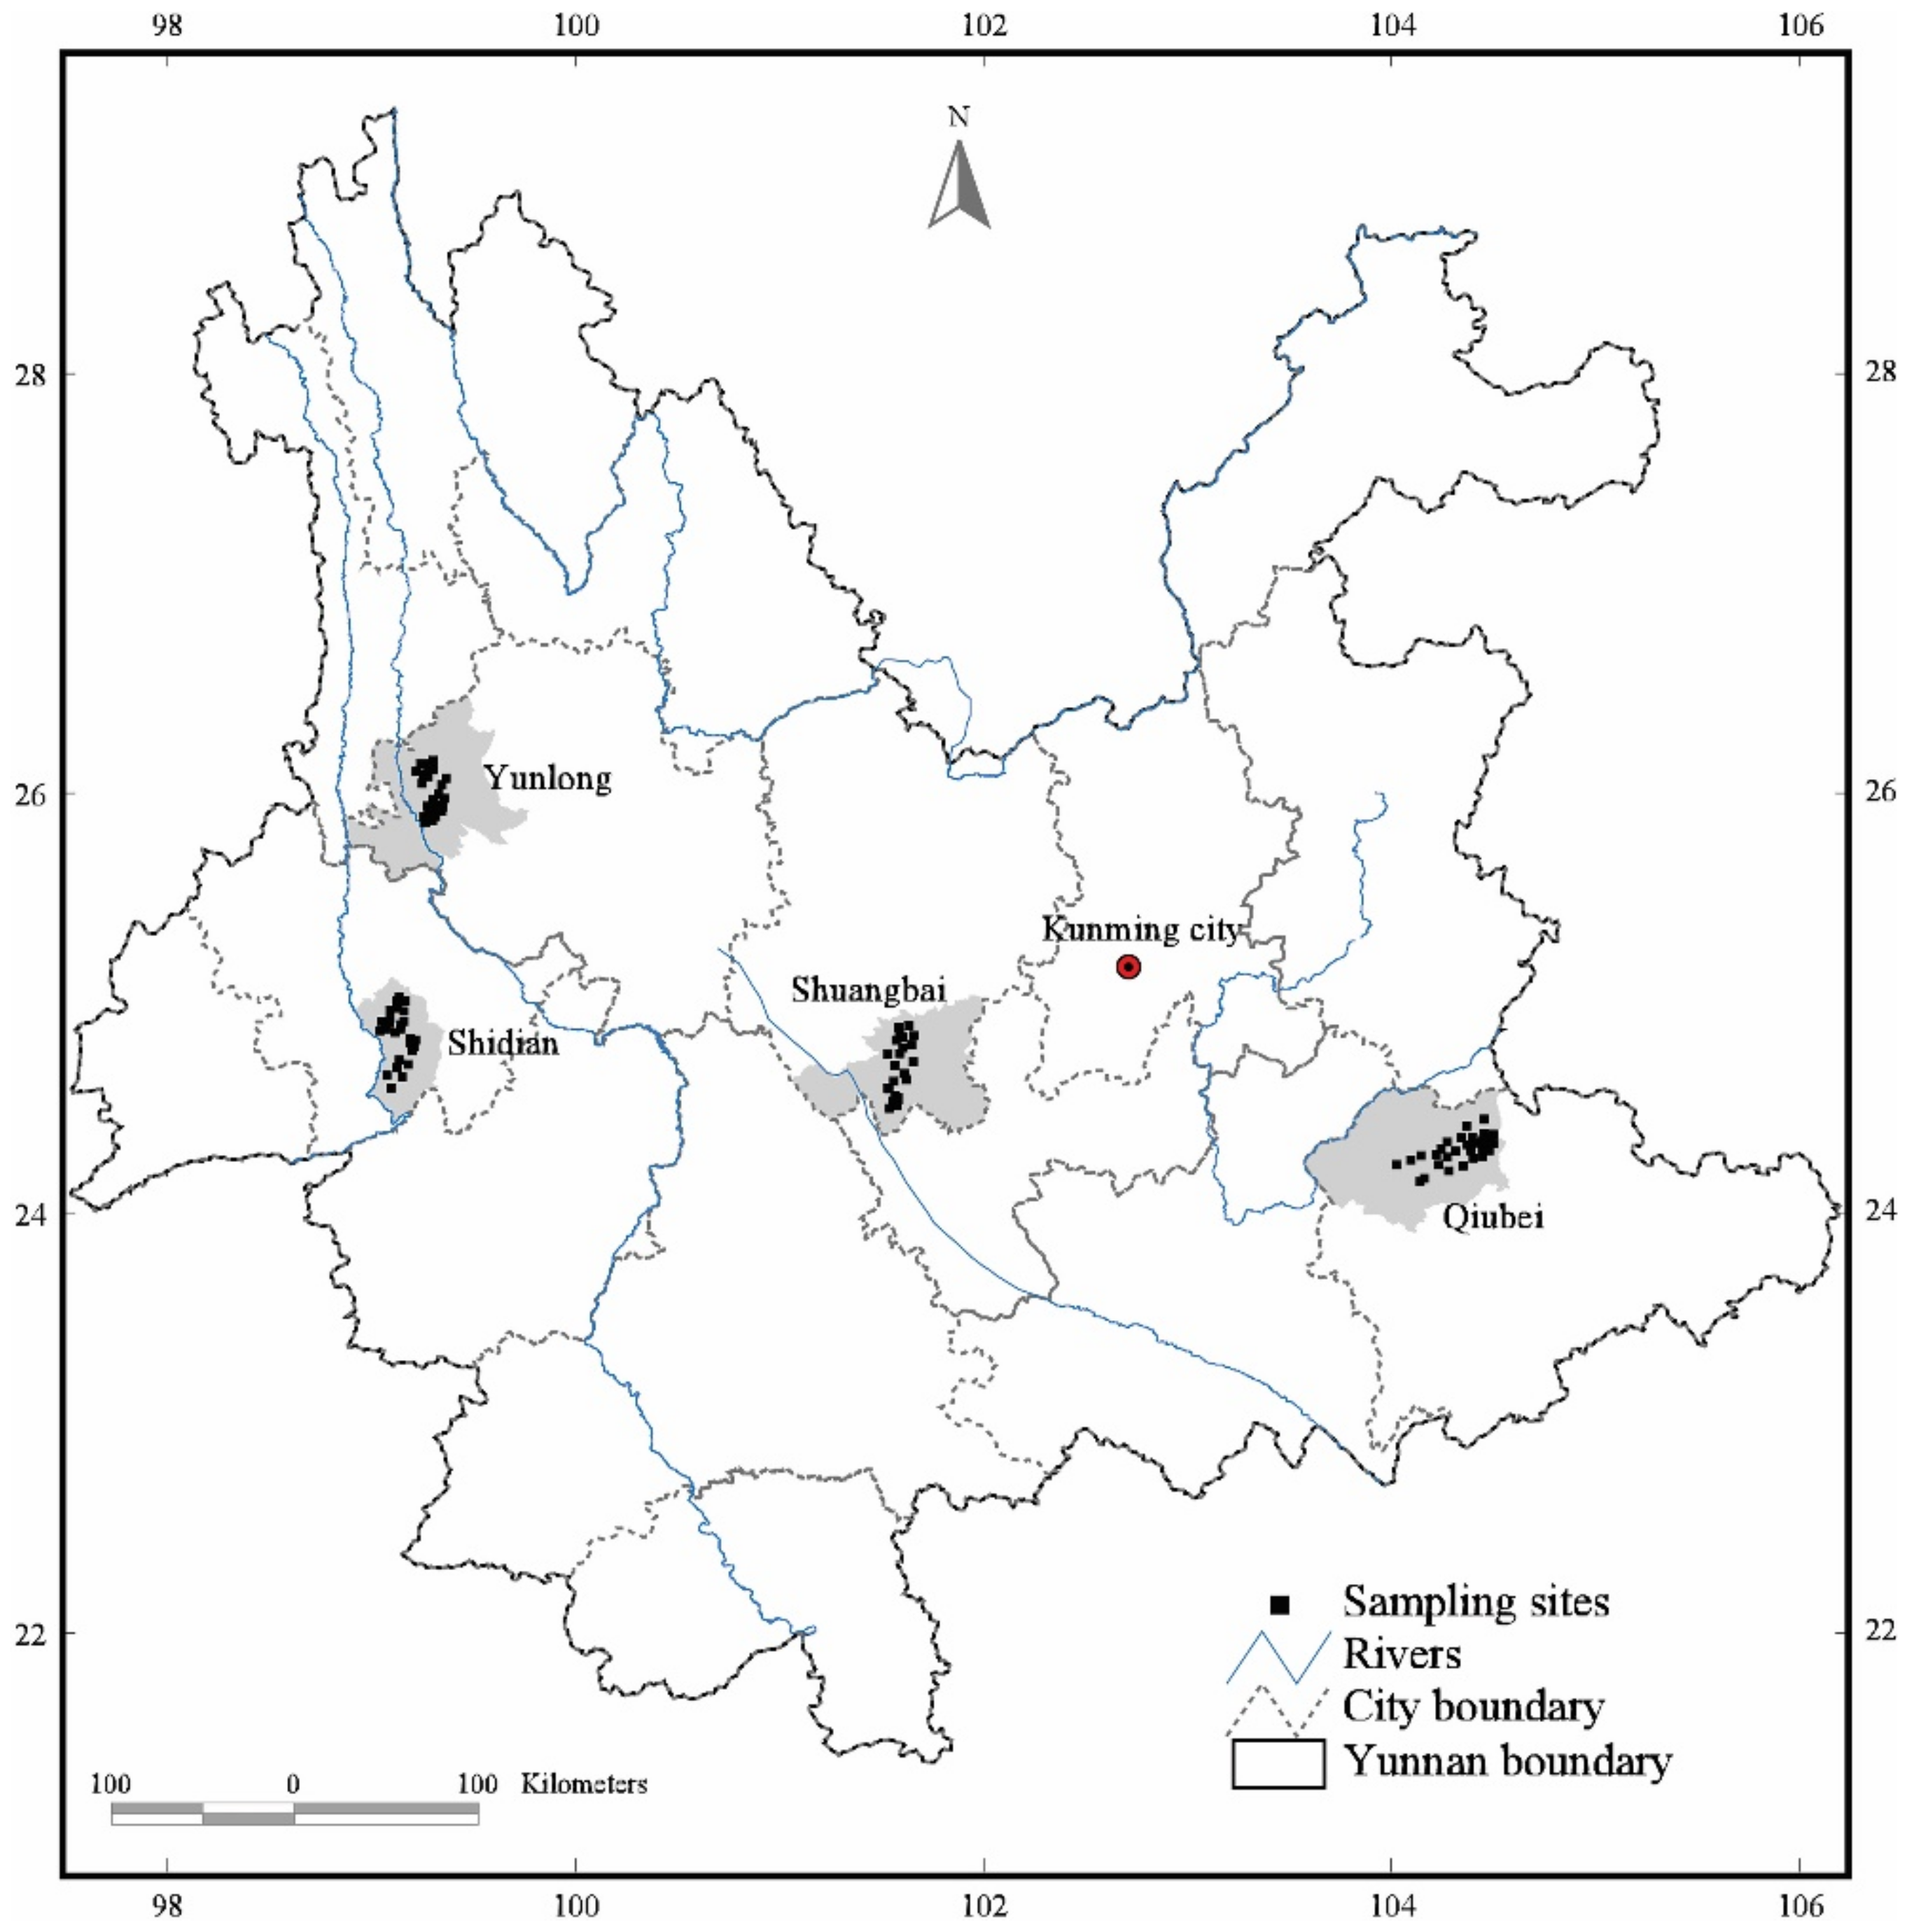
2.1. Study Area

Four study sites were selected in each of Qiubei, Shidian, Yunlong and Shuangbai Counties in Yunnan Province, China (Figure 1). These specific chosen areas are concentrated distributions of P. yunnanensis natural forest with low human disturbance. The site of Qiubei has a mean annual temperature ranging from 13.2 to 19.7 °C and a mean annual precipitation ranging from 1000 to 1270 mm, with an altitude range from 1000 to 1500 m. The main associated tree species are Lyonia ovalifolia, Quercus variabilis, Schima noronhae, Craibiodendron stellatum and so on. The site of Shidian has a mean annual temperature of 17.6 °C and a mean annual precipitation of 883.2 mm, with an altitude range from 1600 to 1900 m. The main associated tree species are Schima noronhae, Pyrus pashia, Dodonaea viscosa and so on. The site of Shuangbai has a mean annual temperature of 15 °C and a mean annual precipitation of 927 mm, with an altitude ranged from 1900 to 2100 m. The main associated tree species are Schima noronhae, Craibiodendron stellatum, Lyonia ovalifolia, Phyllanthus emblica and so on. The site of Yunlong has a mean annual temperature of 13.2 °C and a mean annual precipitation of 815.5 mm, with the altitude range from 2500 to 3000 m. The main associated tree species are Lyonia ovalifolia, Pinus armandii, Rhododendron delavayi, Rhododendron decorum and so on. All the soil types are classified as hilly red soil. Such a wide geographical distribution provides us with a rare opportunity to examine the nutritional status and stoichiometric characteristics of natural P. yunnanensis forests on a regional scale.

2.2. Sampling and Measurements

Field surveys were conducted from April to June 2020 using a random sampling method. We set up 122 plots (20 × 20 m2) in the four sites and collected leaves from woody trees. Of the 122 plots, 30 plots were in Qiubei County, 28 plots were in Shidian County, 28 plots were in Yunlong County and 36 plots were in Shuangbai County. Leaves from 48 plant species (a total of 271 samples) belonging to 25 families were sampled without the replication of plant species (Table 1). For every plant species, we collected 50–100 sun-exposed and mature leaves from the middle or upper part of plants from five to ten individuals. All samples were carefully put into paper bags, and the paper bags were marked. The samples were dried for 72h at 60 °C, and all samples were ground to a fine powder using a ball mill (NM200, Retsch, Haan, Germany) for the measurement of leaf C, N and P concentrations. Leaf C and N concentrations were analyzed using an elemental analyzer (2400 II CHNS/O Elemental Analyzer, Perkin-Elmer, USA) with a combustion temperature of 950 °C and a reduction temperature of 640 °C. Leaf P concentrations were analyzed by a molybdate/ascorbic acid method [30] after dilution using H2SO4-HClO4, then a molybdenum-stibium-ascorbic acid reagent was added, and after 20 min, the absorbance of each sample was measured at 700 nm. Every experiment was repeated three times, and the data were averaged.

2.3. Data Analysis

In this study, leaf C, N and P were measured as quality contents (mg/g) and leaf C:N, C:P and N:P were measured as mass ratios. Data of leaf C, N and P and their stoichiometric ratios were checked for normal distribution with a K-S test (one-sample Kolmogorov–Smirnov test) and were based on 10 log transforms to test the assumption of normality and homogeneity of variances when necessary. Data with a normal distribution with a mean value explained the size of the overall species of leaf C, N, P, C:N, C:P and N:P, while data lacking a normal distribution with a mean value explained the size of the overall species of leaf C, N, P, C:N, C:P and N:P. A bivariate correlation (Pearson’s r) and OLS regression analysis were used to analyze the correlation between lgC, lgN and lgP across all species. One-way ANOVA and LSD tests were carried out to test significance of the differences in leaf C, N, P, C:N, C:P and N:P, along with the change in the elevation gradient. An independent sample T test was used to compare the significance of the differences in leaf C, N, P, C:N, C:P and N:P for different trees/shrubs, evergreen/deciduous trees and conifer/broadleaf trees. All statistical analyses were performed with SPSS 18.0 software (SPSS Inc., Chicago, IL, USA). All scatter diagrams were constructed with SigmaPlot 12.5.

3. Results

3.1. Patterns of Leaf C, N and P and Stoichiometric Ratios across All Species

Forty-eight plant species from the 122 plots were selected from the four P. yunnanensis forest sites. The selected plant species belonged to 25 families and were divided into six types: trees and shrubs, evergreen and deciduous trees, and conifer and broadleaf trees (Table 1).
In the K-S test, the distribution of leaf C, the C:N ratio and the C:P ratio for all species were normally distributed, while the distribution of leaf N and P and the N:P ratio for all species did not have normal distributions (Figure 2) and exhibited large variations. The ranges of variation in leaf C, N and P and the leaf C:N, C:P and N:P ratios for all species were 342.61–500.41 mg/g, 5.00–35.79 mg/g, 0.36–4.50 mg/g, 12.31–9.41, 85.34–1278.90 and 1.77–39.82, respectively. The mean values of leaf C, N and P and the leaf C:N, C:P and N:P ratios for all species were 451.12 mg/g, 11.05 mg/g, 1.11 mg/g, 45.03, 496.98 and 11.27, respectively. The geometric mean values of leaf N and P and the N:P ratio for all species were 10.49 mg/g, 1.00 mg/g and 10.51, respectively. The CV of leaf P was highest (51.53%), and the CV of leaf C was lowest (5.29%). This was because leaf C comprised the main backbone in the plant body. The CV of leaf N and the leaf C:N, C:P and N:P ratios were 36.75%, 29.63%, 43.46% and 41.68%, respectively.

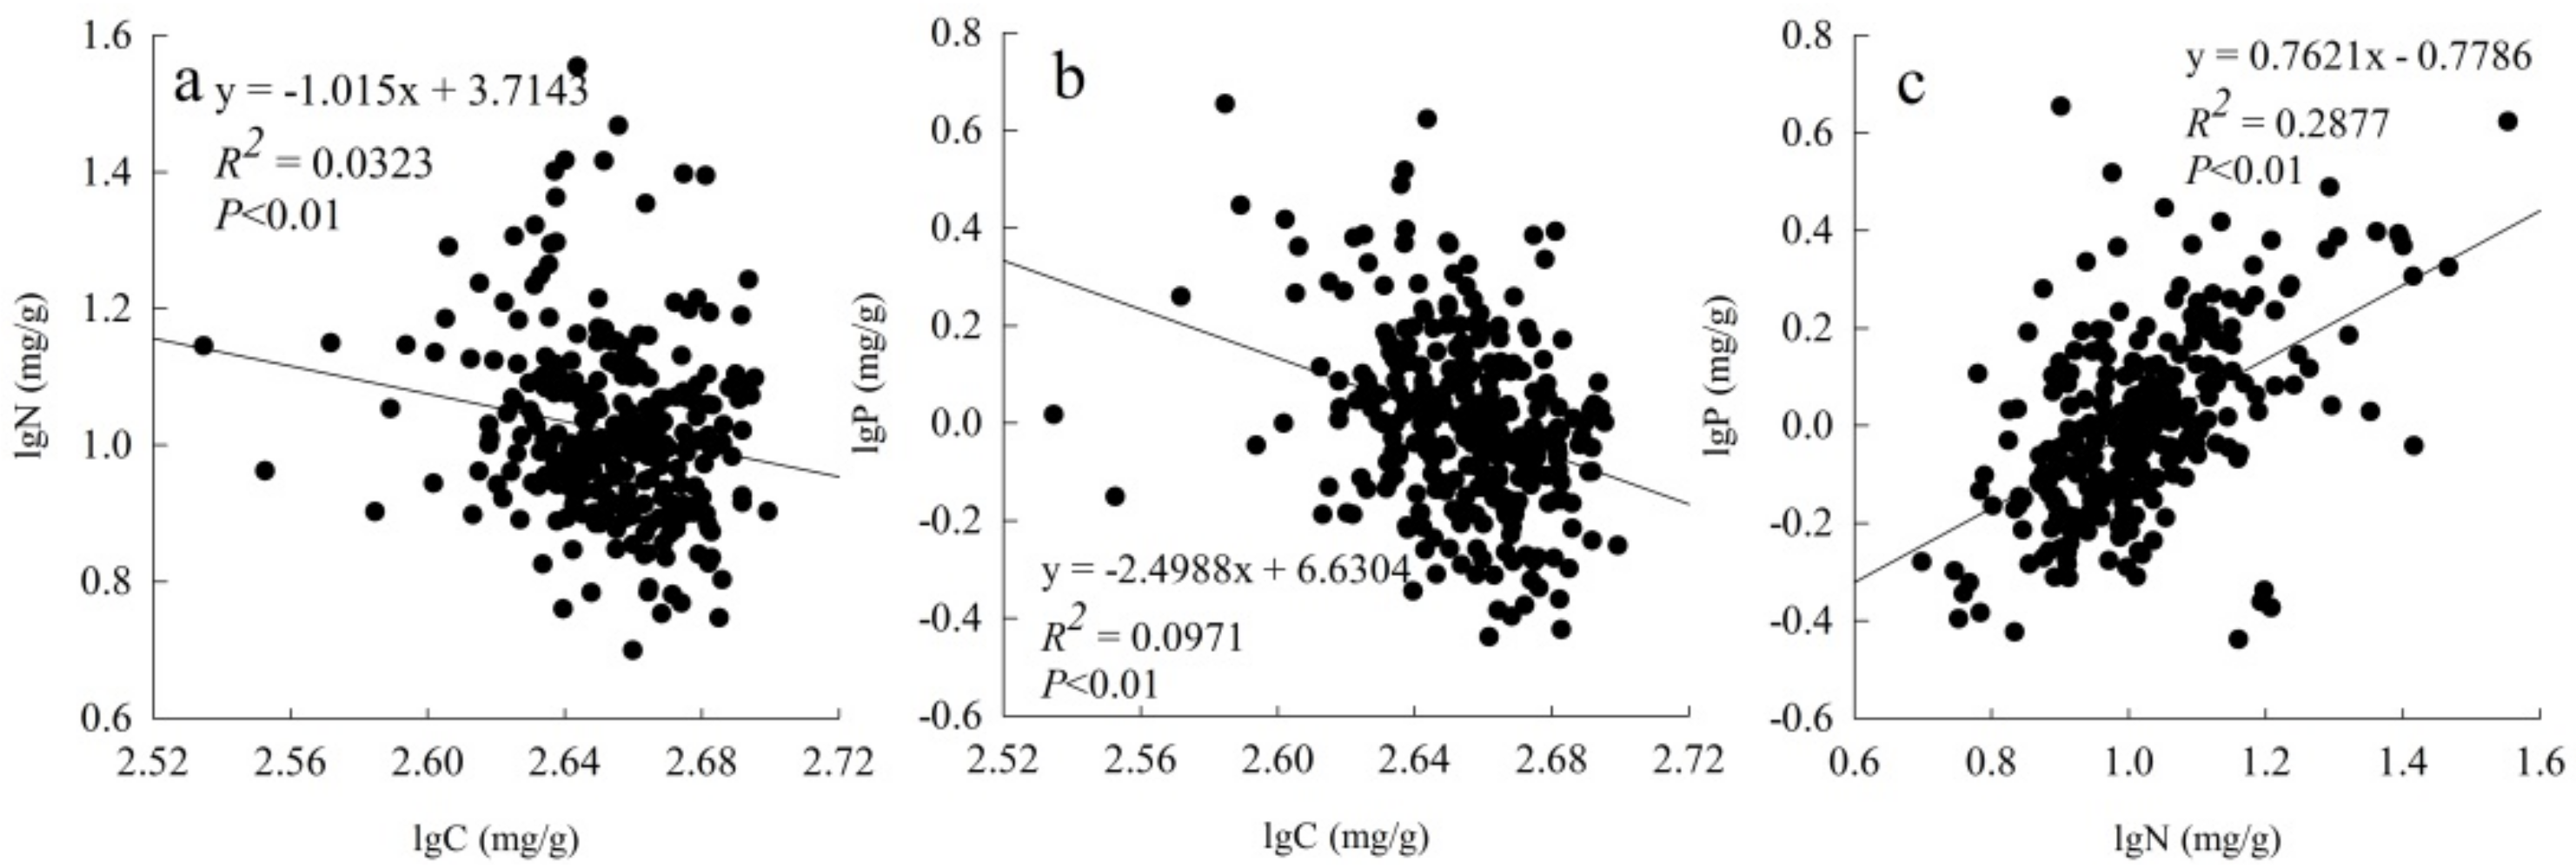
3.2. Relationships among Leaf C, Leaf N and Leaf P for All Species

We calculated Pearson’s correlation coefficient among leaf C, N and P of all species. The results showed that there was a very significant negative correlation between leaf C and leaf N (r = −0.180, p < 0.01) (Figure 3a) and a very significant negative correlation between leaf C and leaf P (r = −0.312, p < 0.01) (Figure 3b). The relationship between leaf N and leaf P had a very significant positive correlation (r = 0.536, p < 0.01) (Figure 3c).

3.3. Comparison of Leaf C, N and P and Stoichiometric Ratios across Functional Groups

Leaf C, N and P and the leaf C:N, C:P and N:P ratios had different patterns, depending on the plant type (Table 2). There were significant differences in leaf C between evergreen and deciduous, and conifer and broadleaf plants (p < 0.05). The leaf C of evergreens (453.36 ± 22.64 mg/g) was higher than that of deciduous plants (431.69 ± 25.76 mg/g), and the leaf C in conifers (468.32 ± 12.15 mg/g) was higher than that of broadleaves (446.74 ± 24.15 mg/g). Significant differences between all plant types (p < 0.05) were found in leaf N. Among the three comparison pairs, the leaf N of trees (11.38 ± 4.24 mg/g) was higher than that of shrubs (10.17 ± 3.41 mg/g), deciduous plants (16.86 ± 6.75 mg/g) were higher than evergreens (10.38 ± 2.99 mg/g), and broadleaves (11.50 ± 4.34 mg/g) were higher than conifers (9.29 ± 1.87 mg/g). There were significant differences between evergreen and deciduous, and conifer and broadleaf leaf P (p < 0.05). The leaf P of deciduous plants (1.71 ± 0.77 mg/g) was higher than that of evergreens (1.04 ± 0.50 mg/g), and broadleaves (1.14 ± 0.62 mg/g) were higher than conifers (0.97 ± 0.23 mg/g). There were significant differences in leaf C:N between all plant types (p < 0.05). The leaf C:N ratio of shrubs (48.73 ± 14.31) was higher than that of trees (43.62 ± 12.71), evergreens (46.86 ± 12.43) were higher than deciduous trees (29.20 ± 10.28), and conifers (52.51 ± 11.13) were higher than broadleaves (43.13 ± 13.21). For leaf C:P, among the three comparison pairs, only one (evergreen vs deciduous) showed a significant difference (p < 0.05). The leaf C:P ratio of evergreens (518.92 ± 212.29) was higher than that of deciduous trees (306.52 ± 143.66). Similarly, among the three comparison pairs, only one (conifer vs broadleaf) showed a significant difference for the leaf N:P ratio (p < 0.05). The leaf N:P ratio of broadleaves (11.65 ± 5.13) was higher than that of conifers (9.80 ± 1.65).

4. Discussion

4.1. Overall Leaf C, N and P in Natural P. yunnanensis Forests

Our research showed that the leaf C of all species had a mean value (± SD) (451.12 ± 23.87 mg/g) that was lower than the global average (464 ± 32.1 mg/g) [31]. Leaf C was also lower than the mean value reported by Wu et al. [32] for a coniferous forest in the Pearl River Delta, South China (517.85 ± 35.96 mg/g), and lower than the mean value reported by Yu et al. [33] for primary forest in depressions between karst hills in southwest China (484.24 ± 7.03 mg/g). It was, however, higher than the mean value reported by Li et al. [20] for Suaeda salsa in coastal wetlands of China (262.94 ± 42.91 mg/g) and higher than the mean value reported by Yan et al. [34] for plants in the Lake Dianchi watershed of southwestern China (441.42 mg/g). It is nearly identical to that reported by Huang and Wang [35] for 32 evergreen broadleaved plant species in Zhejiang Province of China (450 mg/g).
The mean value of leaf N was 10.49 mg/g in our study, which was lower than the global mean value [31] for 397 terrestrial plants (17.7 mg/g), the value calculated Reich and Oleksyn [36] for 1251 world plant terrestrial species (18.3 mg/g) and lower than the Chinese mean value reported by Han et al. [13] for 753 terrestrial plant species in China (18.6 mg/g). It is also lower than the mean value reported by Ren et al. [14] for 654 terrestrial plant species in forest ecosystems along the North-South Transect of East China (17.55 mg/g), the mean value reported by Huang and Wang [35] for 32 evergreen broadleaved plant species in Zhejiang Province of China (16.06 mg/g), the mean value reported by Wu et al. [32] for coniferous forests in the Pearl River Delta, South China (11.5 mg/g), and the mean value reported by Yu et al. [33] for primary forest in depressions between karst hills in southwest China (15.88 mg/g). Many studies have suggested that leaf N content has a decreasing trend as latitude decreases, either at the global or national scale [13,31,36]. Our results support this idea.
The mean value of leaf P was 1.00 mg/g, which is lower than the global mean value reported by Elser et al. [31] of 1.58 mg/g and the value calculated by Reich and Oleksyn [36] of 1.42 mg/g and lower than the Chinese mean value reported by Han et al. [13] of 1.21 mg/g. This value is also lower than the mean value reported by Ren et al. [14] of 1.28 mg/g, by Wu et al. [32] of 1.31 mg/g and Yan et al. [34] of 1.92 mg/g, but was higher than the mean value reported by Huang and Wang [35] (0.86 mg/g). Our study showed low P, which is possible because soil P is usually low in the south of China [13].
A significant negative correlation between leaf C and leaf N or P and a significant positive correlation between leaf N and P were common characteristics of the C, N and P stoichiometry of higher terrestrial plants. They also reflect the economic strategy between blade properties [37]. A good linear relationship between N and P (Figure 3c) explains the synchronous change in the two nutrient elements in natural P. yunnanensis forests, which can provide a strong guarantee for stable growth and development. This is one of the most basic characteristics of plants [20].

4.2. Leaf C:N, C:P and N:P and Nutrient Limitation

The growth rate theory states that organisms have the ability to adapt to changes in growth rate in the process of growth and development [7]. Leaf C:N and C:P represent the ability of plants to absorb nutrients for assimilating C and are partly reflected by the productivity of the nutrient supply per unit and the uptake of nutrients by plants, so it has an important ecological significance [38]. In this study, the mean values (± SD) of leaf C:N and C:P ratios were 45.03 ± 13.34 and 496.98 ± 215.99, respectively. Both were higher than the global mean values reported by Elser et al. [31] (22.5 ± 10.6 and 232 ± 145). Compared with previous studies in China, both were higher than the mean values reported by Han et al. [39] for plant species in Beijing and its periphery (17.3 and 241.9, respectively). Yu et al. [33] demonstrated higher leaf C:N and C:P ratios, indicating that the vegetation, soil and climate achieved a higher state of balance. Therefore, the natural P. yunnanensis forest ecosystem is stable.
Several studies have shown that C, N and P play an important role in the growth, development and behavior of trees. Leaf N:P has been shown to be an important index of nutrient limitation in forests [6]. Previous research has shown that a leaf N:P of less than 14 mainly indicates N limitation, and a leaf N:P of greater than 16 mainly indicates P limitation. If the leaf N:P ratio is in the range of 14 to 16, it would show that growth was limited by either N or P or both [4]. Because leaf N and P have a close relationship, leaf N:P ratios are also relatively stabile. The mean value (10.51) of leaf N:P from the overall species of natural P. yunnanensis forest was lower than the general Chinese level (14.40) [13] based on 753 plant species and also the global level (11.80 [36] or (11.00 [31]). In our study, the mean value of leaf N:P, either the arithmetic or geometric mean value, was less than 14, and 81.92% of leaf N:P values from all samples were less than 14. This study shows that, overall, plants of natural P. yunnanensis forest were limited by N.

4.3. Variations in Leaf C, N and P and Stoichiometry Ratios across Plant Types

Many previous studies demonstrated that there were significant differences in different plant taxonomic groups and growth forms, which was usually considered an adaptive strategy of plants existing in different growth forms [40,41]. In this study, there were only significant differences in the leaf N and C:N ratios between trees and shrubs. This is because trees and shrub are more similar to each other in growth form as compared with other plant types (e.g., herbaceous plants), so they might have similar patterns of leaf C, N and P and stoichiometric ratios [39]. There were significant differences in leaf C, N and P and stoichiometric ratios between evergreen and deciduous, and conifer and broadleaf trees, except there was no significant difference in leaf C:P between conifer and broadleaf trees or leaf N:P between evergreen and deciduous trees. According to the growth rate hypothesis [2,5,37], deciduous broadleaved plants with short leaf lifespans had higher growth rates, so they were richer in leaf N than evergreen and conifer plants, and leaf P had a similar condition because N and P were combined in organic chemicals and were both regulated by plant growth [42]. Our findings are in agreement with this hypothesis, and the lower leaf N and P led to the higher leaf C:N and C:P of evergreen and conifer trees. No matter what type of plant, the leaf N:P was less than 14, indicating that growth was limited by N.

5. Conclusions

In our study, we found that natural P. yunnanensis forests had lower leaf C, N and P contents, but natural P. yunnanensis forests still have a high capacity to absorb nutrients for assimilating C. According to our study, it was proven that the natural P. yunnanensis forest was a stable ecosystem for the time being. In the natural P. yunnanensis forest, most plants of different functional types have different strategies for obtaining nutrients. Our results provide strong evidence that natural P. yunnanensis forests are limited by N. However, this study did not analyze the influencing factors of ecological stoichiometric characteristics, such as climate and soil properties. Future study will focus on the responses of ecological stoichiometric characteristics of natural P. yunnanensis forests to more environmental factors.

Author Contributions

X.H. conducted the field measurements and drafted the manuscript; J.S. conceived the study and revised the manuscript; X.L., S.L. and W.L. conducted the field measurements. All authors have read and agreed to the published version of the manuscript.

Funding

This work was supported by the Fundamental Research Funds of CAF (Grant Number CAFYBB2020SY026) and the Yunnan Basic Research Program (Grant Number 202101AT070236).

Institutional Review Board Statement

Not applicable.

Informed Consent Statement

Not applicable.

Data Availability Statement

Not applicable.

Acknowledgments

We thank the Tianchi Natural Reserve in Yunnan Province, China, for providing permission for us to carry out our field studies.

Conflicts of Interest

The authors declare no conflict of interest.

References

  1. Zhang, K.; He, M.; Li, X.; Tan, H.; Gao, Y.; Li, G.; Han, G.; Wu, Y. Foliar carbon, nitrogen and phosphorus stoichiometry of typical desert plants across the Alashan Desert. Acta Ecol. Sin. 2014, 34, 6538–6547. [Google Scholar] [CrossRef] [Green Version]
  2. Ågren, G.I. The C: N: P stoichiometry of autotrophs–theory and observations. Ecol. Lett. 2004, 7, 185–191. [Google Scholar] [CrossRef]
  3. Knecht, M.F.; Göransson, A. Terrestrial plants require nutrients in similar proportions. Tree physiol. 2004, 24, 447–460. [Google Scholar] [CrossRef] [PubMed] [Green Version]
  4. Koerselman, W.; Meuleman, A.F. The vegetation N: P ratio: A new tool to detect the nature of nutrient limitation. J. Appl. Ecol. 1996, 33, 1441–1450. [Google Scholar] [CrossRef]
  5. Elser, J.J.; Acharya, K.; Kyle, M.; Cotner, J.; Makino, W.; Markow, T.; Watts, T.; Hobbie, S.; Fagan, W.; Schade, J.; et al. Growth rate–stoichiometry couplings in diverse biota. Ecol. Lett. 2003, 6, 936–943. [Google Scholar] [CrossRef] [Green Version]
  6. Güsewell, S.; Koerselman, W.; Verhoeven, J.T. Biomass N: P ratios as indicators of nutrient limitation for plant populations in wetlands. Ecol. Appl. 2003, 13, 372–384. [Google Scholar] [CrossRef]
  7. Makino, W.; Cotner, J.; Sterner, R.; Elser, J. Are bacteria more like plants or animals? Growth rate and resource dependence of bacterial C: N: P stoichiometry. Funct. Ecol. 2003, 17, 121–130. [Google Scholar] [CrossRef] [Green Version]
  8. McGroddy, M.E.; Daufresne, T.; Hedin, L.O. Scaling of C: N: P stoichiometry in forests worldwide: Implications of terrestrial Redfield-type ratios. Ecology 2004, 85, 2390–2401. [Google Scholar] [CrossRef]
  9. Niklas, K.J.; Cobb, E.D. N, P, and C stoichiometry of Eranthis hyemalis (Ranunculaceae) and the allometry of plant growth. Am. J. Bot. 2005, 92, 1256–1263. [Google Scholar] [CrossRef]
  10. Wright, I.J.; Reich, P.B.; Westoby, M.; Ackerly, D.D.; Baruch, Z.; Bongers, F.; Cavender-Bares, J.; Chapin, T.; Cornelissen. J.H.C.; Diemer, M. The worldwide leaf economics spectrum. Nature 2004, 428, 821–827. [Google Scholar] [CrossRef]
  11. Blanes, M.C.; Viñegla, B.; Merino, J.; Carreira, J.A. Nutritional status of Abies pinsapo forests along a nitrogen deposition gradient: Do C/N/P stoichiometric shifts modify photosynthetic nutrient use efficiency? Oecologia 2013, 171, 797–808. [Google Scholar] [CrossRef] [PubMed]
  12. Zhang, J.; Li, M.; Xu, L.; Zhu, J.; Dai, G.; He, N. C: N: P stoichiometry in terrestrial ecosystems in China. Sci. Total Environ. 2021, 795, 148849. [Google Scholar] [CrossRef] [PubMed]
  13. Han, W.; Fang, J.; Guo, D.; Zhang, Y. Leaf nitrogen and phosphorus stoichiometry across 753 terrestrial plant species in China. New Phytol. 2005, 168, 377–385. [Google Scholar] [CrossRef] [PubMed]
  14. Ren, S.; Yu, G.; Tao, B.; Wang, S. Leaf nitrogen and phosphorus stoichiometry across 654 terrestrial plant species in NSTEC. Environ. Sci. 2007, 28, 2665–2673. [Google Scholar] [CrossRef]
  15. Wang, J.; Wang, S.; Li, R.; Yan, J.; Sha, L.; Han, S. C: N: P stoichiometric characteristics of four forest types’ dominant tree species in China. Chin. J. Plant Ecol. 2011, 35, 587–595. [Google Scholar] [CrossRef]
  16. Liu, W.; Su, J.; Li, S.; Lang, X.; Zhang, Z.; Huang, X. Leaf carbon, nitrogen and phosphorus stoichiometry at different growth stages in dominant tree species of a monsoon broad-leaved evergreen forest in Pu’er, Yunnan Province, China. Chin. J. Plant Ecol. 2015, 39, 52–62. [Google Scholar] [CrossRef]
  17. Yang, K.; Huang, J.; Dong, D.; Ma, W.; He, J. Canopy leaf N and P stoichiometry in grassland communities of Qinghai-Tibetan Plateau, China. Chin. J. Plant Ecol. 2010, 34, 17–22. [Google Scholar] [CrossRef]
  18. Ding, X.; Luo, S.; Liu, J.; Li, K.; Liu, G. Longitude gradient changes on plant community and soil stoichiometry characteristics of grassland in Hulunbeir. Acta Ecol. Sin. 2012, 32, 3467–3476. [Google Scholar] [CrossRef] [Green Version]
  19. Xiong, X.; Cai, H.; Li, Y.; Ma, W.; Niu, K.; Chen, D.; Liu, N.; Su, X.; Jing, H.; Feng, X.; et al. Seasonal dynamics of leaf C, N and P stoichiometry in plants of typical steppe in Nei Mongol, China. Chin. J. Plant Ecol. 2020, 44, 1138–1153. [Google Scholar] [CrossRef]
  20. Li, Z.; Han, L.; Liu, Y.; An, S.; Leng, X. C, N and P stoichiometric characteristics in leaves of Suaeda salsa during different growth phase in coastal wetlands of China. Chin. J. Plant Ecol. 2012, 36, 1054–1061. [Google Scholar] [CrossRef]
  21. Liu, B.; Liao, B.; Fang, Z. Different tide status and salinity alter stoichiometry characteristics of mangrove Kandelia candel seedlings. Acta Ecol. Sin. 2012, 32, 7818–7827. [Google Scholar] [CrossRef] [Green Version]
  22. Wang, W.; Wang, C.; Zeng, C.; Tong, C. Soil carbon, nitrogen and phosphorus ecological stoichiometry of Phragmites australis wetlands in different reaches in Minjiang River estuary. Acta Ecol. Sin. 2012, 32, 4087–4093. [Google Scholar] [CrossRef]
  23. An, Z.; Niu, D.; Wen, H.; Yang, Y.; Zhang, H.; Fu, H. Effects of N addition on nutrient resorption efficiency and C: N: P stoichiometric characteristics in Stipa bungeana of steppe grasslands in the Loess Plateau, China. Chin. J. Plant Ecol. 2011, 35, 801–807. [Google Scholar] [CrossRef]
  24. Yan, Z.; Kim, N.Y.; Han, T.; Fang, J.; Han, W. Effects of nitrogen and phosphorus fertilization on leaf carbon, nitrogen and phosphorus stoichiometry of Arabidopsis thaliana. Chin. J. Plant Ecol. 2013, 37, 551–557. [Google Scholar] [CrossRef]
  25. Wu, Y.; Liu, H.; Song, Z.; Yang, X.; Li, Z.; Hao, Q.; Liu, L. Ecological stoichiometry of nitrogen, phosphorous, and sulfur in China’s forests. Acta Geochim. 2017, 36, 525–530. [Google Scholar] [CrossRef]
  26. Zhang, J.; Zhao, N.; Liu, C.; Yang, H.; Li, M.; Yu, G.; Wilcox, K.; Yu, Q.; He, N. C: N: P stoichiometry in China’s forests: From organs to ecosystems. Funct. Ecol. 2018, 32, 50–60. [Google Scholar] [CrossRef]
  27. Li, S.; Huang, X.; Shen, J.; Xu, F.; Su, J. Effects of plant diversity and soil properties on soil fungal community structure with secondary succession in the Pinus yunnanensis forest. Geoderma 2020, 379, 114646. [Google Scholar] [CrossRef]
  28. Huang, X.; Li, S.; Su, J. Selective logging enhances ecosystem multifunctionality via increase of functional diversity in a Pinus yunnanensis forest in Southwest China. For. Ecosyst. 2020, 7, 55. [Google Scholar] [CrossRef]
  29. Li, G.; Shi, H.; Meng, G.; Fang, X.; Chai, Y.; He, L.; Zhang, Z.; Yang, Y. Community structural properties and species diversity in primary Pinus yunnanensis forest. J. Zhejiang AF Univ. 2007, 24, 396–400. [Google Scholar] [CrossRef]
  30. John, M.K. Colorimetric determination in soil and plant material with ascorbic acid. Soil Sci. 1970, 109, 214–220. [Google Scholar] [CrossRef]
  31. Elser, J.J.; Fagan, W.F.; Denno, R.F.; Dobberfuhl, D.R.; Folarin, A.; Huberty, A.; Interlandi, S.; Kilham, S.S.; McCauley, E.; Schulz, K.L.; et al. Nutritional constraints in terrestrial and freshwater food webs. Nature 2000, 408, 578–580. [Google Scholar] [CrossRef] [PubMed]
  32. Wu, T.; Chen, B.; Xiao, Y.; Pan, Y.; Chen, Y.; Xiao, J. Leaf stoichiometry of trees in three forest types in Pearl River Delta, South China. Chin. J. Plant Ecol. 2010, 34, 58–63. [Google Scholar] [CrossRef]
  33. Yu, Y.F.; Peng, W.; Song, T.; Zeng, F.; Wang, K.; Weng, L.; Fan, F. Stoichiometric characteristics of plant and soil C, N and P in different forest types in depressions between karst hills, southwest China. Chin. J. Appl. Ecol. 2014, 25, 947–954. [Google Scholar]
  34. Yan, K.; Fu, D.; He, F.; Duan, C. Leaf nutrient stoichiometry of plants in the phosphorus-enriched soils of the Lake Dianchi watershed, southwestern China. Chin. J. Plant Ecol. 2011, 35, 353–361. [Google Scholar] [CrossRef]
  35. Huang, J.; Wang, X. Leaf Nutrient and Structural Characteristics of 32 Evergreen Broad-leaved Species. J. Eastchina Norm. Univ. 2003, 1, 92–97. [Google Scholar] [CrossRef]
  36. Reich, P.B.; Oleksyn, J. Global patterns of plant leaf N and P in relation to temperature and latitude. Proc. Natl. Acad. Sci. USA 2004, 101, 11001–11006. [Google Scholar] [CrossRef] [Green Version]
  37. Sterner, R.W.; Elser, J.J. Ecological Stoichiometry: The Biology of Elements from Molecules to the Biosphere; Princeton University Press: Princeton, NJ, USA, 2002. [Google Scholar]
  38. Wardle, D.A.; Walker, L.R.; Bardgett, R.D. Ecosystem properties and forest decline in contrasting long-term chronosequences. Science 2004, 305, 509–513. [Google Scholar] [CrossRef] [Green Version]
  39. Han, W.; Wu, Y.; Tang, L.; Chen, Y.; Li, L.; He, J.; Fang, J. Leaf Carbon, Nitrogen and Phosphorus Stoichiometry across Plant Species in Beijing and Its Periphery. Acta Sci. Nat. Univ. Pekin. 2009, 45, 855–860. [Google Scholar]
  40. Poorter, L.; Bongers, F. Leaf traits are good predictors of plant performance across 53 rain forest species. Ecology 2006, 87, 1733–1743. [Google Scholar] [CrossRef]
  41. Sterck, F.J.; Poorter, L.; Schieving, F. Leaf traits determine the growth-survival trade-off across rain forest tree species. Am. Nat. 2006, 167, 758–765. [Google Scholar] [CrossRef]
  42. Aerts, R.; Chapin, F. The mineral nutrition of wild plants revisited: A re-evaluation of processes and patterns. Adv. Ecol. Res. 2000, 30, 1–67. [Google Scholar] [CrossRef]
Figure 1. Map showing the location of our study (black circles, n = 122).
Sustainability 14 06365 g001
Figure 2. Histograms showing the distribution patterns of (a) leaf C (mg/g), (b) leaf N (mg/g), (c) leaf P (mg/g), (d) leaf C:N, (e) leaf C:P and (f) leaf N:P for all species. Max = maximum value, Min = minimum value, AM = mean values, GM = geometric mean values, SD = standard deviation, CV = coefficient of variation, P = value of K-S test.
Sustainability 14 06365 g002
Figure 3. Relationships between leaf C, leaf N and leaf P for all species in this study. Each data point represents a lg-transformed leaf C, N or P concentration. Linear regressions are shown for (a) leaf C and N, (b) leaf C and P, and (c) leaf N and P.
Sustainability 14 06365 g003
Table 1. Species list of P. yunnanensis natural forest in southwest of China.
NumberSpeciesFamilyPlant Type
1Albizia kalkoraLeguminosaeTree/Deciduous/Broadleaf
2Alnus nepalensisBetulaceaeTree/Deciduous/Broadleaf
3Anneslea fragransTheaceaeTree/Evergreen/Broadleaf
4Castanopsis delavayiFagaceaeTree/Evergreen/Broadleaf
5Cerasus dielsianaRosaceaeTree/Evergreen/Broadleaf
6Coriaria nepalensisCoriariaceaeShrub/Deciduous/Broadleaf
7Craibiodendron stellatumEricaceaeTree/Evergreen/Broadleaf
8Cyclobalanopsis delavayiFagaceaeTree/Evergreen/Broadleaf
9Cyclobalanopsis glaucoidesFagaceaeTree/Evergreen/Broadleaf
10Cyclobalanopsis kerriiFagaceaeTree/Evergreen/Broadleaf
11Dichotomanthus tristaniaecarpaRosaceaeShrub/Evergreen/Broadleaf
12Dodonaea viscosaSapindaceaeShrub/Evergreen/Broadleaf
13Elaeagnus confertaElaeagnaceaeShrub/Evergreen/Broadleaf
14Engelhardtia spicataJuglandaceaeTree/Evergreen/Broadleaf
15Eurya groffiiTheaceaeTree/Evergreen/Broadleaf
16Ficus semicordataMoraceaeTree/Evergreen/Broadleaf
17Glochidion hirsutumEuphorbiaceaeShrub/Evergreen/Broadleaf
18Keteleeria evelynianaPinaceaeTree/Evergreen/Conifer
19Lithocarpus variolosusFagaceaeTree/Evergreen/Broadleaf
20Lyonia doyonensisEricaceaeShrub/Evergreen/Broadleaf
21Lyonia ovalifoliaEricaceaeShrub/Evergreen/Broadleaf
22Myrica esculentaMyricaceaeTree/Evergreen/Broadleaf
23Myrica rubraMyricaceaeTree/Evergreen/Broadleaf
24Osyris wightianaSantalaceaeShrub/Evergreen/Broadleaf
25Photinia glomerataRosaceaeShrub/Evergreen/Broadleaf
26Phyllanthus emblicaEuphorbiaceaeTree/Evergreen/Broadleaf
27Pinus armandiiPinaceaeTree/Evergreen/Conifer
28Pinus yunnanensisPinaceaeTree/Evergreen/Conifer
29Pyrus pashiaRosaceaeTree/Evergreen/Broadleaf
30Quercus alienaFagaceaeTree/Deciduous/Broadleaf
31Quercus semicarpifoliaFagaceaeTree/Evergreen/Broadleaf
32Quercus variabilisFagaceaeTree/Deciduous/Broadleaf
33Rapanea neriifoliaMyrsinaceaeShrub/Evergreen/Broadleaf
34Rhododendron decorumEricaceaeTree/Evergreen/Broadleaf
35Rhododendron delavayiEricaceaeShrub/Evergreen/Broadleaf
36Rhododendron lapponicumEricaceaeShrub/Evergreen/Broadleaf
37Rhododendron moulmainenseEricaceaeShrub/Evergreen/Broadleaf
38Rhododendron spinuliferumBignoniaceaeShrub/Evergreen/Broadleaf
39Schima argenteaTheaceaeTree/Evergreen/Broadleaf
40Schima noronhaeTheaceaeTree/Evergreen/Broadleaf
41Symplocos chinensisSymplocaceaeShrub/Deciduous/Broadleaf
42Ternstroemia gymnantheraTheaceaeShrub/Evergreen/Broadleaf
43Toona ciliataMeliaceaeTree/Deciduous/Broadleaf
44Ulmus tonkinensisUlmaceaeTree/Evergreen/Broadleaf
45Vaccinium vitis-idaeaEricaceaeShrub/Evergreen/Broadleaf
46Viburnum cylindricumCaprifoliaceaeShrub/Evergreen/Broadleaf
47Wendlandia uvariifoliaRubiaceaeTree/Evergreen/Broadleaf
48Zanthoxylum bungeanumRutaceaeTree/Deciduous/Broadleaf
Table 2. Differences in leaf C, N and P and stoichiometric ratios across functional groups.
Growth FormC mg/gN mg/gP mg/gC:NC:PN:P
Tree449.93 ± 23.75 a11.38 ± 4.24 a1.12 ± 0.56 a43.62 ± 12.71 b483.99 ± 204.58 a11.35 ± 4.88 a
Shrub454.25 ± 24.04 a10.17 ± 3.41 b1.06 ± 0.59 a48.73 ± 14.31 a530.91 ± 241.50 a11.08 ± 4.21 a
Evergreen453.36 ± 22.64 a10.38 ± 2.99 b1.04 ± 0.50 b46.86 ± 12.43 a518.92 ± 212.29 a11.37 ± 4.88 a
Deciduous431.69 ± 25.76 b16.86 ± 6.75 a1.71 ± 0.77 a29.20 ± 10.28 b306.52 ± 143.66 b10.40 ± 2.49 a
Conifer468.32 ± 12.15 a9.29 ± 1.87 b0.97 ± 0.23 b52.51 ± 11.13 a509.86 ± 119.73 a9.80 ± 1.65 b
Broadleaf446.74 ± 24.15 b11.50 ± 4.34 a1.14 ± 0.62 a43.13 ± 13.21 b493.70 ± 234.38 a11.65 ± 5.13 a
a and b indicate no significant difference between different growth forms (Tree vs. Shrub, Evergreen vs. Deciduous, Conifer vs. Broadleaf); on the contrary, a and b indicate a significant difference between different life forms (p < 0.05).
Publisher’s Note: MDPI stays neutral with regard to jurisdictional claims in published maps and institutional affiliations.

