Abstract
Biochar is a potential carbon-rich soil amendment that improves the physicochemical properties of soil, besides acting as a controlled release fertilizer. An experiment was conducted to investigate the effect of biochars on rice yield, fertilizer use efficiency and recovery under water-saving irrigation by 15N isotopic tracer study. Two types of irrigation as alternate wetting and drying (AWD) and continuous flooding (CF), and four types of biochar treatments such as rice husk biochar (RHB) with 15N urea, oil palm empty fruit bunch biochar (EFBB) with 15N urea, 15N urea alone and control, were applied to assess their impact on rice. About 4% reduced grain yield with 18% improved water productivity was achieved by the AWD regime over the CF, whereas RHB and EFBB significantly increased rice yield compared to unamended soil. RHB and EFBB enhanced the water productivity up to 25.3%. The fertilizer N uptake and recovery were boosted by RHB and EFBB up to 18.8% and 24.5%, respectively. RHB and EFBB accelerated the agronomic use efficiency and partial factor productivity of N (up to 21% and 8%, respectively). RHB and EFBB profoundly enhanced the pH, the total C and N and the available N (NH4+ and NO3−) of the post-harvest soil. This study suggests that adding RHB and EFBB with urea improves fertilizer N utilization and soil N retention, and their combination with AWD could enhance rice yield with better water productivity due to their porous structure and controlled N release capacity.
1. Introduction
Rice is considered one of the vital food crops of the world after corn and wheat. Notably in Asia, rice is consumed as the staple food [1] and the consumption of rice is expected to increase until 2025 due to the expanding population [2]. Continuously flooded lowland irrigation systems account for approximately 75% of overall rice productivity [3], utilizing around 24% to 30% of the world’s established freshwater resources [4]. As a remedy, extensive international programs led by the IRRI (International Rice Research Institute) and other organizations are pushing alternate wetting and drying (AWD) as a way to reduce water demands [5]. If AWD water-saving measures are to be extensively adopted, one of the most significant considerations will be their impact on grain production. It is stated that AWD irrigation can sustain or even improve grain output compared to constantly flooded condition [6,7,8,9] and that there have been occasional declines in yield [10,11]. Furthermore, Belder et al.’s [12] and Bouman and Tuong’s [3] findings also highlighted the fact that the yield reduction of rice is frequently noticed with AWD irrigation compared to continuously flooded irrigation practice; however, AWD usually enhanced water productivity with total irrigation input while the yield reduced due to the amount of water saved [6]. The regenerating agriculture concept incorporates agricultural systems that are more sensitive to biological and ecological interactions rather than just yields and production [13]; in this regard, AWD irrigation is classified as a type of sustainable agricultural system.
AWD irrigation causes a significant alteration in the water regime in the soil, which transforms the soil from an anaerobic to an aerobic condition, which regulates water and nutrient availability as well as crop growth [14]. Although AWD irrigation can significantly reduce water input at the field level, there is a concern about unexpected excess water inputs in heavy clayey soils since percolation rates may rise with soil drying or due to the formation of fractures that permit for quick bypass flow [3,15]. AWD promotes more oxidizing conditions in the soil compared to flooded irrigation, which promotes the decomposition of plant residue and organic materials in soil [16]. Moreover, during the dry period of AWD, heterotrophic respiration occurs in the soil, resulting in the increased mineralization of soil organic carbon (SOC) [17].
This soil transition affects N availability and leaching by regulating microbial activities such as mineralization, nitrification and denitrification [18]. The paddy soil that comprises greater clay content during drying cycles of AWD irrigation soils may consequently shrink and create cracks termed macrospores in a well-puddled paddy field. Solutes may be carried quickly to the subsurface and groundwater by preferential flow via these fractures, which is responsible for N leaching loss [19,20]. Previous research found that nitrogen loss from paddy soil was accelerated by denitrification during AWD irrigation [21,22]; as a result, the crop obtains inadequate N. Moreover, AWD irrigation increases the release of N2O (nitrous oxide) from rice fields by the denitrification process [23]. This emission of N2O must be minimized since it is a greenhouse that contributes to global warming [23].
Biochar is a carbon-rich substance formed from the incomplete combustion (300–800 °C) of diverse organic materials in an oxygen-limited condition; it is currently gaining popularity worldwide for its role in supporting agricultural and environmental sustainability [24]. Biochar has the potential to raise soil carbon stocks, retain plant nutrients, improve soil fertility and enhance crop yield [25,26,27,28]. Incorporating biochar into soil effectively maintains inorganic N content, regulating N mineralization and, ultimately, plant growth [29]. Denitrifiers accelerate the depletion of the available soil nitrates by transforming them into gases such as N2O (nitrous oxide), NO2 (nitrogen oxide) and N2 (nitrogen gas) [30]. At the same time, biochar incorporation increases soil porosity and water retention capacity, resulting in reduced denitrifier activity and increased nitrate content in the soil [31]. Biochar has been shown to have the ability to decrease soil nitrate leaching [32,33], consecutively retain ammonium ions [30,31]. Biochar inclusion was also found to improve rice N absorption in several experiments [24,34,35] and exhibited soil ameliorating properties.
Increased rice yield is also an indicator of better nitrogen uptake and indicates greater N availability and reduced loss from soil. Khan et al. [36] reported that the addition of sewage sludge biochar at the rate 50 and 100 (g kg−1) significantly enhanced above ground biomass around 71% and 92%, respectively, compared to the unamended treatment. The addition of rice straw biochar at the 10.5 t ha−1 in a cold waterlogged paddy increased the grain yield up to 10.12% over control also reported by Liu et al. [27].
In enhancing rice production generally, N deficiency is considered the major yield-constraining nutrient [37]. For achieving improved rice yields, farmers frequently used various types of simple and fast-acting chemical fertilizers, particularly N fertilizer [38]. Therefore, the application rate of N fertilizer in the rice field has surpassed 300 kg nitrogen per hectare, far beyond the adequate level [39]. Previous studies especially concentrated on the N transformation, losses and rice yield under AWD irrigation due to its periodic drying and wetting, but few studies focus on the biochar incorporation in this water-saving irrigation and its effect on the rice growth performance, water use efficiency, fertilizer N use efficiency (NUE) and recovery. Rice processing sectors and oil palm extraction factories in Malaysia lead to a lot of rice husk and empty fruit bunch, therefore, converting these byproducts into biochar has a lot of potential, and the addition of these biochars enriches the nutrients and moisture content of soil [40].
Seeing the nutrient retention properties and productivity characteristics of the biochar in this study, we applied rice husk and empty fruit bunch biochar with 15N labelled urea assuming it will boost N uptake, efficiency and recovery which improves rice yield. Considering the foregoing, the current research was carried out to assess the impact of biochar on rice production, water use efficiency, NUE and fertilizer nitrogen recovery using a 15N tracer with AWD irrigation regimes.
2. Materials and Methods
2.1. Collection and Analysis of Soil and Biochar Samples
The soil samples for this study were obtained from an abandoned wetland paddy field in TanjungKarang (UTM Easting 742873.39 and UTM Northing 379289.29, UTM Zone 47N). The field belongs to the TanjungKarang Rice Irrigation Scheme region, located in the Kuala Selangor district of Selangor state, Malaysia. Collected soil samples were air-dried, crushed and sieved through a 2 mm screen to analyze their initial properties.
The soil belongs to the clay textural class (sand 6.60%, silt 29.62% and clay 63.79%) according to USDA taxonomy [40]. The pH of the soil was measured by a glass electrode digital pH meter from the 1:2.5 ratio soil and water solution [41]. A CNS analyzer (LECO, Corporation, Saint Joseph, USA was used for the dry combustion method to measure total carbon, nitrogen and sulphur content in the soil. The amount of available N (ammonium and nitrate N) was measured from fresh soil by 1:4 ratio of soil and 2 M KClphenylmercuric acetate (KCl-PMA) mixture and titrating it against 0.01 N HCl [42]. Available phosphorus was extracted by the Bray and Kurtz II method [43] using 0.03 N NH4F and 0.1 N HCl as the extracting solution and P concentration was determined by inductively coupled plasma spectrometry (ICP-OES). Determination of exchangeable forms of various basic cations such as potassium (K+), calcium (Ca2+) and magnesium (Mg2+) was extracted by leaching method using ammonium acetate Schollenberger [44]. Atomic absorption spectrophotometer (AAS, PerkinElmer Analyst 400) was used to determine exchangeable K, Ca and Mg in the collected leachate. The soil properties presented in Appendix A (Table A1).
There were two types of commercially produced biochar used in this study: rice husk biochar (produced from rice husk pyrolyzed at 300 °C) and oil palm empty fruit bunch biochar (produced from oil palm bunch pyrolyzed at 450 °C). A CNS analyzer (LECO, Corporation, Saint Joseph, MO, USA) was used to analyze the total carbon, nitrogen and sulphur content in the biochar. Total phosphorus, potassium and calcium in the biochar was analyzed by dry ashing [45], followed by using atomic absorption spectrophotometer (AAS, PerkinElmer Analyst 400). The pH of the biochar was measured from the 1:10 (w/w) ratio solution of biochar and water using a glass electrode digital pH meter [46]. The properties of biochars are presented in Appendix A (Table A2).
2.2. Scanning Electron Microscopy (SEM) of Biochar
The biochars were dried followed by metalizing through-TECB sputter coater system (SCD 005, BALZERS) to get the ideal conductive surface. Next, the metalized biochar samples were analyzed and amplified to 1000X by an SEM (LEO 1455VP, Oxford instrument and INCA software, London, UK) at 15 kilovolts.
2.3. Experimental Design and Pot Set-Up
A pot study was executed at glasshouse of Agriculture faculty (UTM Easting 768998.92 and UTM Northing 331890.63, UTM Zone 47N), Universiti Putra Malaysia (UPM), Serdang, Selangor, Malaysia from April 2020 to July 2020. The meteorological data for the months of the research are referred to in Appendix A (Table A3). The experiment was laid out in a factorial randomized complete block design (RCBD) with four replications, where two irrigation treatments namely AWD and CF were assigned as the first factor and four biochar and 15N labelled urea combinations were assigned as the second factor such as (i) Rice husk biochar + 15N urea, (ii) Oil palm empty fruit bunch biochar + 15N urea and (iii) 15N urea (iv) Control (no biochar and 15N urea). The rice variety used in this study was MR297 developed in the year 2017 by the Malaysian Agricultural Research and Development Institute (MARDI).
A total of 32 experimental pots (45 cm × 52 cm) were filled with 50 kg of air-dried soil; furthermore, for AWD irrigation regimes (16 pots), a 4 cm diameter and 30 cm long perforated PVC pipe was inserted in soil up to 20 cm by keeping 10 cm above the surface and keeping others pot normal. After the pot preparation, RHB and EFBB were applied at the rate of 4% of the soil (wt/wt) in the respective treatments. The biochars were mixed thoroughly with soil 10 days before the transplanting and irrigated for proper seedling establishment. In this study, we used 10% atom excess 15N labelled urea. Nitrogen (3.1 g pot−1), phosphorus (0.7 g pot−1) and potassium (2.5 g pot−1) were applied from urea, triple superphosphate and muriate of potash, respectively, as recommended by MARDI.
Four seedlings with 15 cm plant spacing were transplanted in a single pot, and further 3–5 cm ponding water depth was retained for the seedlings’ establishment for 15 days. Moreover, in the individual AWD treated pots, a perforated PVC pipe was inserted up to 20 cm below the soil surface to monitor the water levels in the soil. In the AWD pots, the soil is allowed to dry until the water levels reach 15 cm from the surface, and after that, the pots were flooded to 5 cm above the soil surface (Figure 1). This periodical drying cycle continued to the whole growth period, except in the flowering stage. In the continuously flooded irrigation pots, water levels were kept above 3–5 cm from the soil surface during the whole growth period of the rice. Other intercultural operations such as weeding and spraying pesticides were performed when necessary. At maturity, rice was harvested after 98 days of transplanting.
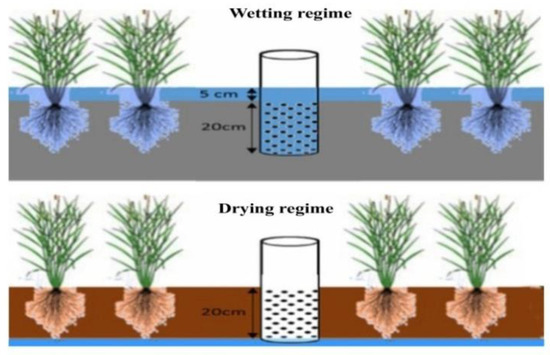
Figure 1.
Schematic diagram of wetting and drying cycles of alternate wetting and drying irrigation.
2.4. Estimation of Soil Moisture Content, the Volume of Irrigation Water and Water Use Efficiency
A soil moisture meter (FieldScout TDR 150, Aurora, IL, USA) was used to determine the moisture content during the drying cycles of alternate wetting and drying irrigation.
The total volume of water (L) consumed by the plants in a pot was calculated by subtracting the volume of water required for pot preparation before transplanting of seedlings from the total volume of water applied until crop harvesting. A volumetric jar was used to measure the amount of water applied during each irrigation.
Water productivity (WP) of rice was calculated by dividing the grain yield by the total volume of water applied [47]:
2.5. Determination Yield Component and Yield
A SPAD meter (SPAD-502, Konica Minolta sensing Inc. Sakai Osaka, Japan) was used to determine the leaf chlorophyll content of rice at three major growth stages (tillering, flowering and grain filling). Different yield-contributing parameters such as plant height, tiller number per hill, panicle length and the number of grains per panicle were recorded during the harvest. Grain and straw were sorted and weighed after harvesting from each pot. The biological yield is the sum of total grain and straw production.
2.6. Analysis of Plant Sample
After harvesting the plants at maturity, grain and straw were collected, separated and dried in the oven at 70 °C for 3 days to get a stable weight. Furthermore, the dried samples were finely milled for total nitrogen and 15N analysis in the samples. Total N content in grain and straw sample was measured by dry combustion using CNS analyzer (LECO, Corporation, Saint Joseph, MO, USA) and 15N isotope in the milled grain and straw samples were determined by using a Europa EA-GSL sample preparation system connected to a Sercon 20–22 stable isotope ratio mass spectrometer running in continuous flow mode.
Per cent of N derived from fertilizer (%Ndff), N uptake, fertilizer N uptake, fertilizer N use efficiency and recovery were calculated using the following formulas:
Total plant N yield (TNY) = Grain N uptake + straw N uptake
Ndff (g g−1) in the grain or straw = %Ndff of grain or straw × TNY
Total Ndff by plant = Ndff in grain + Ndff in straw
2.7. Percent Relative Data
For each element, the relative data of the value were presented as percentages relative to control [48].
2.8. Statistical Analysis
The statistical software R (version 3.6.1, R Foundation for Statistical Computing, Vienna, Austria) was used to analyze the experimental data by analysis of variance (ANOVA) to evaluate the statistical difference among the treatments. Two-way ANOVA was performed to determine the effect of the treatments. Tukey’s test was used to compare the significant difference between the mean values at a 0.05 level of significance. The relation between the parameters was determined by Pearson’s correlation analysis. The figures of different impacted by treatments were prepared using Microsoft Excel.
3. Results
3.1. Scanning Electron Microscopy (SEM) of Biochar
SEM visualization was performed to observe the internal structure of RHB and EFBB. The SEM micrograph showed porous structures in both biochars originating from the plant-derived cellular structure used as feedstocks (Figure 2). The figure illustrates that the biochar originating from rice husk exhibited pores with cell wall composition varying from 0.5 to 10 micrometres (µm). Furthermore, the origins of the pore structure in EFBB was similar to that of rice husk, although pore size varied from 1 to 10 µm. A greater number of micropores (<1 µm) was observed in the case of RHB compared to EFBB.
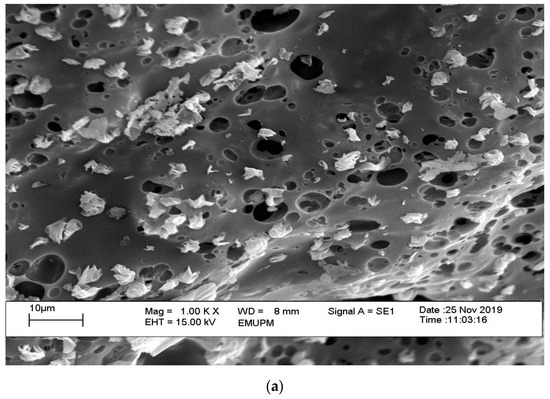
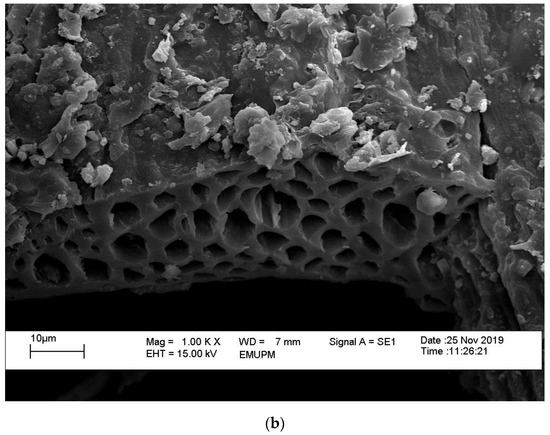
Figure 2.
Micrograph of RHB and EFBB at 1000× magnification by SEM. (a) Rice husk biochar (RHB), (b) Oil palm empty fruit bunch biochar (EFBB).
3.2. Leaf Chlorophyll (SPAD) Impacted by Various Biochar Treatments and Irrigation Regimes at Different Growth Stages of Rice
The main effect of the irrigation regime and biochar with 15N urea combinations significantly (p < 0.05) impacted the leaf chlorophyll (SPAD value) at tillering stage of rice (Table 1), but their interaction was insignificant. The CF irrigation produced a significantly higher SPAD value over AWD irrigation (31.74 and 30.56, respectively). Moreover, biochar treatments B1 (RHB + 15N urea) and B2 (EFBB + 15N urea) exhibited similar SPAD values (33.45 and 33.45, respectively) over B3 (15N urea alone), which were significantly lower than the values obtained by B0 (control). Moreover, at the flowering stage, identical SPAD values were exhibited by B1, B2 and B3 compared to B0, but no significant main effect was observed from the AWD and CF regimes. Concurrently, in the tillering stage, CF showed enhanced SPAD value over AWD at the grain filling stage. Furthermore, from the main effect of the biochar treatments, the B1 and B2 treatments showed similar SPAD values which were significantly greater than B3 and B0 in the AWD regime.

Table 1.
Main effect of irrigation and biochar with 15N urea combination on leaf chlorophyll (SPAD) of rice at different growth stages of rice.
3.3. Impact of Biochar on Rice Yield, Irrigation Water Volume and Water Productivity under AWD and CF Irrigation
The grain and straw yield of rice was significantly (p < 0.05) influenced by the two irrigation and different biochar treatments but was unaffected by their interaction (Table 2). The main effect showed that a significant grain yield increase was recorded by the B1 (202.57 g pot−1) compared to AWD (193.89 g pot−1). Moreover, B1 and B2 produced similar grain yields (226.73 and 229.83 g pot−1, respectively), which were significantly higher thanB3 (211.20 g pot−1), and the lowest yield produced by B0 (125.16 g pot−1). Furthermore, the straw yield of rice exhibited a similar trend for the main effect of irrigation and biochar as such as grain yield. The AWD and CF regime produced 307.27 and 312.29 g pot−1 straw yield, respectively.
Table 2.
Rice yield, irrigation water volume and water productivity influenced by the significant main effect of irrigation and biochar with 15N urea combination.
The main effect of the irrigation regimes and the biochar treatments significantly (p < 0.05) impacted the irrigation water volume and water productivity (WP), while no difference was observed from their interaction. The CF irrigation obtained maximum irrigation water consumption (116.25 L) in comparison to the AWD regime (94.63 L). From the effect of biochar and 15N urea combination, the maximum water consumption was obtained by the B3 treatment (122.38 L) over B1 and B2 irrigation, which exhibited similar water uses (105.00 and 108.88 L, respectively), and the minimum water usage was obtained by B0 (85.50 L). Considering that the WP of rice by AWD irrigation showed profoundly greater results (2.04 g L−1) compared to CF (1.73 g L−1). The biochar treatments B1 and B2 showed identical but greater WP over B3 and B0.
3.4. Impact of Biochar and 15N Urea Combination on the %Soil Moisture Content at Various Drying Cycles of AWD Irrigation
The soil moisture percentage was significantly (p < 0.05) influenced by the inclusion of combined RHB and EFBB with 15N urea treatments (Figure 3) at different drying cycles (D) of AWD. From the first drying cycle (D1), it was observed that B1, B2, B3 and B0 showed very near values (47.56%, 46.59%, 44.75% and 43.02%, respectively). Nevertheless, in the subsequent drying cycles of AWD, the biochar treatments (B1 and B2) presented significantly greater moisture contents over B3 and B0. The biochar treatments B1 and B2 showed adjacent value in most drying cycles except in D8. Similarly, B3 and B0 also exhibited somewhat similar soil moisture values from D1 to D8, but profound variation was only found in D7. Overall, the total number of drying cycles (10) were similar for B1, B2 and B3, while 8 drying cycles were found in B0. However, B1 and B2 remarkably boosted soil moisture content compared to B3 and control B0 at various drying cycles of AWD irrigation.
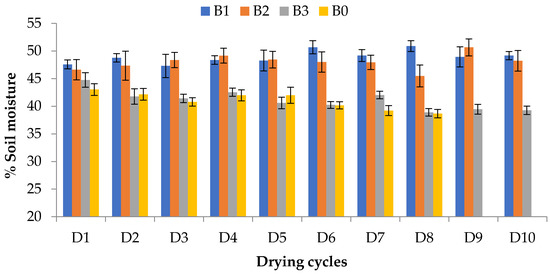
Figure 3.
Impact of biochar and 15N urea combination on the %soil moisture content at various drying cycles (D) of alternate wetting and drying (AWD) irrigation. Vertical bars indicate the standard error of means (n = 4). RHB, rice husk biochar; EFBB, oil palm empty fruit bunch biochar. B1: RHB + 15N urea; B2: EFBB + 15N urea; B3: 15N urea only and B0: Control (no biochar and 15N urea).
3.5. Impact of Biochar on N Uptake by Grain, Straw and Their Total under Two Irrigation Regimes
Different biochar treatments and irrigation regimes significantly (p < 0.05) impacted N content in grain, straw and their total uptake, but their interaction was unaffected (Table 3). In the main impact of irrigation, the AWD regime showed lower grain N content over CF (2.68 and 2.95 g pot−1, respectively). Considering the main effect of biochar treatment, identical grain N was obtained by B1 and B2 (3.35 and 3.48 g pot−1, respectively), followed by B3 (2.95 g pot−1), and reduced N was found from B0 (1.49 g pot−1). Meanwhile, similar to grain N content, similar treatment variations were observed in the straw and total N content for the main effect of the irrigation and biochar treatments. However, the straw and total N content were 1.81 and 4.50 g pot−1, respectively, in the AWD while CF showed 2.04 and 4.98 g pot−1. Nevertheless, for the main effect of biochar, straw and total N content varied from 0.84 to 2.43 g pot−1 and 2.33 to 5.92, respectively.
Table 3.
N content in grain, straw and their total influenced by the significant main effect irrigation and biochar with 15N urea combination.
3.6. Impact of Biochar on Per Cent of N Derived from 15N Urea Fertilizer and Soil in Grain and Straw under Two Irrigation Regimes
Different biochar and 15N combination and irrigation regimes significantly (p < 0.05) impacted the %N content in grain and straw from fertilizer and soil sources, while their interaction did not show any significant result (Table 4). The CF irrigation significantly enhanced the %N in grain and straw from urea (31.96% and 31.22%, respectively) and reduced from soil sources (68.04% and 68.78%, respectively) over the AWD regime. However, in the case of the main effect of biochar, B1 and B2 exhibited higher but similar %Nin grain from urea compared to B3. Furthermore, the biochar unamended treatment (B3) significantly increased the %N content in grain from the soil compared to the biochar treatments such as B1 and B2. Moreover, the %N derived from fertilizer and soil ranged from 29.67% to 31.63% and 68.37% to 70.33%, respectively, observed from straw.
Table 4.
Per cent of N derived from 15N urea fertilizer and soil in grain and straw influenced by the significant main effect of irrigation and biochar with 15N urea combination.
3.7. Effect of Biocharon Grain, Straw, Total N Uptake from 15N Urea and Fertilizer N Recovery (FNR) under Two Irrigation Regimes
Several biochar treatments and irrigation regimes significantly (p < 0.05) affected the N derived from 15N urea (Ndff) in grain, straw, total uptake and (FNR), while no impact was found from their interaction (Table 5). From the main effect of irrigation, it was observed that significantly increased value derived from 15N urea (Ndff) in grain, straw, total and fertilizer N recovery (FRN) were obtained by CF irrigation (1.09 g pot−1, 0.75 g pot−1, 1.84 g pot−1and 0.59 g g−1, respectively) over the AWD irrigation. Furthermore, biochar treatments B1 and B2 showed similar results of N derived from 15N urea (Ndff) in grain (1.09 and 1.11 g pot−1, respectively), which was significantly higher than B3 (0.90 g pot−1). As in grain, B1, B2 and B3 also exhibited an identical trend of Ndff in straw in the AWD. Total Ndff also followed a similar pattern of the result by different biochar. However, the higher but similar values of FRN were obtained by B1 and B2 in comparison to B3.
Table 5.
Grain, straw, total N uptake from 15N urea and fertilizer N recovery influenced by the significant main effect of irrigation and biochar treatment.
3.8. Effect of Biochar and Irrigation Regimes on Nitrogen Use Efficiency Parameters of Rice
The agronomic efficiency (AE), physiological efficiency (PE) and partial factor productivity (PFP) of nitrogen in rice were significantly (p < 0.05) influenced by various biochar and 15N urea combination, but the effect of irrigation and its interaction with biochar treatments were insignificant (Table 6). The biochar treatments B1 and B2 produced similar but significantly greater AE of nitrogen (32.77 and 33.67 g g−1, respectively) over B3 (27.76 g g−1). For the PE of N, the maximum value was obtained by B3 (86.56 g g−1); which was significantly higher than B1 and B2 (80.05 and 74.39 g g−1, respectively). Similar to AE, the maximum PFP of N was found from B2 (74.14 g g−1), which was similar to B1 (73.14 g g−1) but significantly greater than B3 (68.13 g g−1).
Table 6.
Main effect of biochar with 15N urea combination on nitrogen use efficiency parameters of rice.
3.9. Effect of Biochar with 15N Urea Combination on Soil Total C and N under AWD and CF Irrigation Regimes
Regarding the total carbon content in the soil (Figure 4), the biochar treatment B2 exhibited greater under both AWD and CF irrigation (6.92% and 7.04%, respectively) followed by B1 (6.55% and 6.60%, respectively). Whereas, profoundly decreased results were observed from B3 and B0 in both irrigations. Considering the same biochar treatment, B3 and B0 with AWD regime exhibited reduced soil carbon (4.38% and 4.23%, respectively) compared to CF irrigation (5.58 and 5.36, respectively).
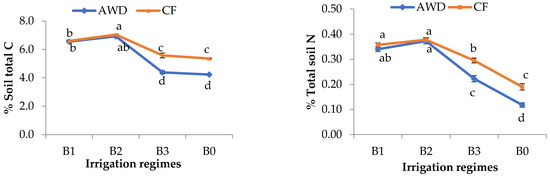
Figure 4.
Effect of biochar with 15N urea combination on the soil total C and N under AWD and CF irrigation regime. Means with different letters indicate the significant difference between the treatments. Vertical bars denote the standard error of means (n =4). Irrigation regime and biochar showed a significant interaction effect (p < 0.05) by two-way ANOVA analysis.
In the AWD irrigation, B1 and B2 showed similar but higher values of total soil N (0.34% and 0.37%, respectively) over B3 (0.22%) and the lowest soil N was found from B0 (0.12). Likewise, AWD regime, B1 and B2 showed a similar variation of soil N (0.36% and 0.38%, respectively) compared toB3 (0.30) and B0 (0.19) under the CF regime. However, in the same biochar treatment, B3 and B0 with CF irrigation significantly boosted soil C and N content values over AWD irrigation, though B1 and B2 produced similar results.
3.10. Effect of Biochar on pH and Available Nitrogen of Post-Harvest Soil
Different biochar and irrigation regimes significantly (p < 0.05) impacted the soil pH, but their interaction was insignificant (Table 7). However, the AWD irrigation profoundly reduced the soil pH value over the CF regime. Biochar treatment B2 obtained the maximum pH value (6.45) followed by B1 (6.28), which were markedly greater than B3 and B0, which produced identical values (5.36 and 5.27, respectively).
Table 7.
Main effect of irrigation and biochar with 15N urea combination on pH, ammonium-N and nitrate-N of post-harvest soil.
Various biochar and irrigation treatments significantly influenced the available N (NH4+-N and NO3−-N). The AWD irrigation significantly increased the NH4+-N of soil over the CF regime (49.02 and 37.41 mg kg−1, respectively). Consecutively, AWD irrigation reduced the NO3-N in soil compared to CF. Biochar treatments such as B1 and B2 obtained identical values of NH4+-N (53.44 and 58.77 mg kg−1, respectively) but greater than B3 (38.36 mg kg−1), and the lowest results were found from B0 (22.30 mg kg−1). Moreover, the maximum NO3-N in soil was observed from B2 (54.50 mg kg−1) followed by B1 (44.77 mg kg−1) and B3 (21.27 mg kg−1). In comparison, the minimum value was also observed from B0 (14.74 mg kg−1).
3.11. Relationship between Grain Yield, Irrigation Water Usage, Fertilizer N Recovery and Soil Properties at Harvest
Pearson’s correlation analysis assessed the relationship between grain yield, irrigation water usage, fertilizer N recovery and soil properties (Table 8). Grain yield showed a positive and significant relationship fertilizer N recovery, soil pH, total carbon and nitrogen (r = 0.87***, 0.75***, 0.72***, 0.70***and 0.86***, respectively). Furthermore, fertilizer N recovery (FRN) exhibited a positive and significant association with pH, STC and STN (0.83***, 0.86*** and 0.88***, respectively). However, the soil total carbon (STC) positively correlated with pH, STN, soil NH4+-N and NH4+-N (r = 0.94***, 0.92***, 0.53** and 0.90***, respectively).
Table 8.
Relationship between grain yield, water use efficiency, fertilizer N recovery, N use efficiency and soil properties at harvest.
4. Discussion
4.1. Leaf Chlorophyll and Yield
Incorporating biochar such as RHB and EFBB remarkably boosted the SPAD value (up to 7.5%), water productivity (up to 25%) and rice yield (up to 7%). Compared to the sole application of 15N urea, at the tillering and grain-filling stage, biochar combined with urea increased the leaf SPAD value up to 6.6% and 7.5%, respectively. A recent study by Win et al. [49] found that the application of RHB profoundly enhanced the SPAD value of rice. Moreover, Lai et al. [50] observed that rice straw biochar with 150 kg ha−1 significantly increased the SPAD value compared to a single application of N fertilizer. This increased leaf activity by the addition of biochar and 15N fertilizer combination was also reported by a previous study by Ullah et al. [24].
Rice yield performance is to be considered as the key indicator to adopt a management practice. Different studies from the past obtained varieties of yield responses to the AWD irrigation. Among some of them reported the increase [9,51,52], decrease [11,53,54] or no prominent effect on the grain yield [18,55,56]. From the main effect of irrigation, the AWD regime sharply decreased the grain yield (4.2%) compared to the CF irrigation. In this experiment, safe-AWD was practiced, where water levels were allowed to drain up to 15 cm from the surface during the drying cycles and then irrigated with 5 cm ponding water depth. Thereby, no drastic yield loss because the plant roots always reached soil water during the drying cycles. Nevertheless, this little yield reduction was also reported by Haque et al. [57], where carbon isotope discrimination in the rice leaf revealed that rice faces a sharp moisture deficit condition to some extent under AWD, which can be recovered by applying biochar such as RHB and EFBB [57]. From a previous study, Bakar et al. [58] reported that the application of EFBB improved the soil quality by increasing soil cation exchange capacity (CEC) and soil carbon; in addition, it also alleviates soil pH, which ultimately increased the rice yield. Furthermore, this study also revealed that integrated RHB and EFBB with N fertilizer increased the grain yield up to 7–8% by the main effect of biochar. Many studies from the past also reported the positive impact of biochar on rice yield [24,57,59,60]. There are several factors through which biochar inclusion in the soil accelerates rice yield, including enhanced nutrient uptake [57], photosynthetic activity [61] and improved soil properties such as nutrient availability [62], CEC [58], porosity [28] and moisture retention [59].
4.2. Irrigation Water Usage and Productivity
The key component in AWD irrigation is reducing irrigation water usage and improved water productivity (WP). This research examined that AWD irrigation decreased irrigation water usage by 28.6% and increased water productivity by 17.9%. Furthermore, RHB and EFBB with 15N urea reduced the water usage up to 14.2% and improved WP up to 25.3% compared to the 15N urea(without biochar) application. The AWD irrigation can save up to 35% of irrigation water for rice production also found from previous studies [51,52,55,56]. Due to the RHB and EFBB addition with15N urea, the enhanced moisture retention at different drying cycles of AWD is presented in Figure 3. This improved moisture retention might be explained by SEM micrographs of RHB and EFBB (Figure 2). The figures of RHB and EFBB revealed the presence of different sized micropores, and these pores could be served as a capillary store of water [40]. However, RHB did not show porous properties as EFBB did, possibly due to the different feedstock and divergence in temperature during the biochar preparation. At a very high pyrolytic temperature (>350 °C), rice husk loses carbon (C), whereas oil-palm branch biochar produces higher C at temperatures from 400 to 500 °C [63]. This might be because their origins and cellulose/hemicellulose contents are different [64].
Moreover, biochar generated from agricultural residue is high in silicon, which reacts with water molecules and has characteristics similar to a silica hydrogel, preventing water loss by preserving it [65]. However, biochar can also influence soil moisture retention by changing several soil physical parameters such as bulk density, porosity, aggregate stability, cracking, etc. [66]. According to Chen et al. [67], the addition of rice straw and rice husk biochar improved the moisture content of sandy loam and silty loam soil up to 18.61% and 19.66%, respectively. In Vertisol clay soil, rice straw and woodchip biochar boosted the moisture content up to 18.4% and 6.8%, respectively, as observed by Sun and Liu [68]. Furthermore, the addition of bamboo and rice straw biochar combined with urea enhanced the soil moisture content by 9% and 15%, respectively [59].
4.3. Nitrogen Use Efficiency (NUE) and Recovery
The main effect of irrigation demonstrates that AWD remarkably reduced the nitrogen uptake, which is similar to the findings of previous studies [21,22]. Thereby, it also decreases the fertilizer N recovery. The inclusion of biochar with 15N urea increased the total and fertilizer uptake up to 23.4% and 18.8%, respectively. A study by Huang et al. [34] reported that depending on the application rate, the addition of cassava stem biochar with 15N boosted the fertilizer N uptake up to 27% in rice. Similarly, Ali et al. [69] documented that biochar application with urea increased the N uptake by rice. Another study using 15N labelled urea with biochar also observed that biochar incorporation increased about 23.9% of leaf N in rice [24].
Moreover, the agronomic efficiency (AE) and partial factor productivity (PFP) of N also accelerated by combined application of 15N urea with RHB (18% and 7%, respectively) and EFBB (up to 21% and 8%, respectively). These parameters are mainly correlated to the grain yield; in this study, biochar addition profoundly increased the rice yield, which ultimately resulted in improved AE and PFP of N. However, this study revealed that biochar addition reduced the physiological efficiency (PE) of N. The PE of N is the ratio between biological yield and N uptake. In this context, compared to biological yield response, higher N uptake obtained from biochar amended soil over lone 15N urea might result in reduced PE. However, Oladele et al. [35] reported that the integrated use of biochar with N fertilizer increased the AE by 140% in rice over 2 years. Another study demonstrated that urea with chicken litter biochar significantly boosted the AE of N [70]. Nevertheless, Zheng et al. [71] found that incorporating rice straw biochar with urea fertilizer increased the AE of N by 4.0 kg−1. Likewise, Chen et al. observed that biochar-based fertilizers enhanced about 33% to 74% of PFP of N [72]. This positive effect of biochar on NUE is also similar to the findings of several researchers [73,74,75].
In addition, RHB and EFBB increased the fertilizer N recovery (FNR) up to 24.5% over the sole application of urea since FNR is directly related to the fertilizer N uptake. From this study, 15N isotopic analysis of grain and straw revealed that biochar incorporation markedly enhanced the N uptake from urea, which ultimately increased the FNR. Findings from a past study reported that biochar increased about 192% of grain N recovery in rice [35]. A similar positive impact of biochar on N recovery result of also observed from a previous study [76]. Liu et al. [77] demonstrated that the inclusion of biochar with urea accelerated fertilizer N retention and increased N mineralization in the soil, which possibly resulted in enhanced N uptake with the improved FNR of rice.
4.4. Soil pH, Carbon and Nitrogen Content of Post-Harvest Soil
A profound change in the pH of the post-harvest soil has been observed due to the incorporation of RHB and EFBB. Biochar shows a different mechanism to control soil pH due to its unique surface chemistry and the presence of various functional organic groups and compounds [78]. Biochar itself exhibits high pH due to carbonates and organic anions derived from acidic functional groups [79]. In addition, inorganic alkali such as silicate (SiO44−), phosphate (PO43−) and iron hydroxides (FeO2−) absorb proton by the combination of these anions with H+ [80]. Thereby, biochar is used as a soil amendment to optimize soil pH for crop production. Most of the studies reported that biochar addition plays a significant role in altering the pH value of soil [81]. Xie et al. [82] reported that the application of urea in an acidic Ultisol increased soil acidity, and the addition of corn biochar reduced the soil pH and buffered the nitrogen acidification in paddy soil. In a recent study, rice husk biochar and rice straw biochar was applied in two types of paddy soil, and in both cases, the pH value increased 0.27 to 1.61 units, respectively [67]. The addition of rice straw biochar increased the pH value from 0.1–0.46 in a Ultisol in Southern China [83].
The addition of biochar with 15N urea boosted the soil total carbon up to 57.9% and 26.3% in the AWD and CF irrigation, respectively, whereas the case of biochar-unamended soil with AWD irrigation lost an eminent percentage of soil carbon. Compared to CF irrigation, in the drying period of AWD irrigation, the soil prevails in aerobic conditions [84]. This oxidizing environment might hasten the degrading organic matter and diminishing organic carbon status in the soil, and this occurrence may lead to significant CO2 emissions from the soil [85]. Furthermore, due to the aerobic environment, heterotrophic respiration occurs in soil, resulting in the accelerated mineralization of organic carbon during the drying cycles of AWD [17]. The increased soil C by biochar in this study due to the biochar enriched with the stable and recalcitrant form of carbon [86], through the application of this soil amendment act as both sink and source of carbon [25], resulting in improved soil fertility [87]. Findings from past studies revealed that biochar inclusion conspicuously enhanced the soil carbon content. Gamage et al. [28] found that the addition of 1% RHB increased the soil organic carbon (SOC) by 65% in sandy loam soil. Yang et al. [88] reported that biochar application increased the SOC up to 26.7% under water-saving irrigation. Moreover, in a clay loam paddy soil, the addition of bamboo chip and rice straw biochar with urea increased the SOC by 58.4% and 37.4%, respectively [59].
As with total carbon, the AWD irrigation without biochar inclusion significantly reduces the soil’s total N content over CF irrigation. A theatrical transformation between the aerobic and anaerobic conditions in AWD affects the nitrogen mineralization, nitrification and denitrification due to the microbial activity in the soil [18]. In AWD irrigation, soil N is lost through the nitrification and denitrification process [22,59]. Nevertheless, AWD accelerates the N2O production by denitrification in the soil and declining the indigenous N [23]. However, in this study, the incorporation of RHB and EFBB with 15N urea remarkably boosted the total N in soil under AWD (52.8% and 67.42%, respectively) and CF (21.2% and 28.0%, respectively) irrigation. Incorporation of biochar enhanced soil N was also reported from previous studies [40,58,59]. For example, Haefele et al. [62] observed that the application of RHB with fertilizer increased the N up to 15.6% in paddy soil. In another study, wheat straw biochar at 40 t ha−1 increased the soil N by about 22.7% in the subtropical paddy soil [89]. Likewise, the incorporation of sewage sludge biochar in acidic soil accelerated the N content up to 550% depending on application rates.
This study also revealed the enhancement of the mineral N (NH4+-N and NO3−-N) by biochar inclusion. Biochar application promotes NO3+-N in soil, possibly due to the absorption phenolic compound, which restricts the soil nitrification process [90], further increasing the activities of nitrifying bacteria in the soil [91]. Moreover, biochar has unique surface chemistry inclusive of acid functional groups and the presence of both cation and anion exchange sites [92]. This cation exchange site of biochar absorbs the NH4+ion and the acid functional groups react with NH4+ and forms amine and amides, thereby decreasing the loss of NH4+ from soil [93].
In addition, there are some limitations of this study such as this experiment being conducted in pots under controlled conditions, so there was no source of irrigation from precipitation and water loss by percolation and seepage. Nevertheless, this is a short-term study, and the result may vary for long-term experiments under field conditions. A long-term field study should be carried out to validate the results.
5. Conclusions
The AWD irrigation noticeably curtails about 28% of the irrigation water usage with a 4% grain reduction over the CF regime. Concurrently, the application of RHB and EFBB with 15N urea prominently boosted the rice yield compared to alone 15N urea inclusion. Therefore, this minor yield penalty could be recovered by biochar application. Furthermore, RHB and EFBB incorporated soil enhanced the fertilizer N uptake and recovered more fertilizer N compared to a single 15N urea application. Additionally, these biochars conspicuously accelerated the agronomic efficiency and partial factor productivity of N. RHB and EFBB also improved the soil pH and total carbon content of post-harvest. The biochar addition with 15N urea further increased the total and available soil nitrogen. However, the biochar (RHB and EFBB) with 15N urea improved the rice yield, N use efficiency and soil properties. Still, in the CF regime, excessive irrigation water is required to keep the soil inundated during the whole growing period of rice. Thereby, biochar utilizes more fertilizer N while reducing excessive N fertilizer use for better environmental quality. Therefore, the integrated use of biochar and urea with AWD irrigation might be a better adoption for sustainable rice production with better WP.
Supplementary Materials
The following are available online at https://www.mdpi.com/article/10.3390/su14137622/s1. The non-significant interaction values of various parameters influenced by irrigation and biochar treatment are presented in Tables S1–S5. Table S1: Interaction effect of irrigation and biochar on leaf chlorophyll (SPAD) of rice at different growth stages of rice, Table S2: Interaction effect of irrigation and biochar on rice yield, irrigation water volume and water productivity, Table S3: Interaction effect of irrigation and biochar on N derived from 15N urea fertilizer and soil in grain and straw under two irrigation regimes, Table S4: Interaction effect of irrigation and biochar on N content in grain, straw, their total grain, straw, total N uptake from 15N urea and fertilizer N recovery, Table S5: Interaction effect of irrigation and biochar on different N use efficiency parameters and soil pH, total carbon, total and available nitrogen of post-harvest soil.
Author Contributions
Conceptualization, M.K.U. and M.F.S.; methodology, A.N.A.H. and M.F.S. formal analysis, A.N.A.H., A.A.A. and M.M.; investigation, M.K.U. data curation, A.M.A.; writing—original draft preparation, A.N.A.H.; writing—review and editing, M.H.; Z.M.S. and A.M.A.; supervision, M.K.U. All authors have read and agreed to the published version of the manuscript.
Funding
This research was funded by National Agricultural Technology Program Phase-II Project, Bangladesh Agricultural Research Council (Vote No. 6282514-10201). Fundamental Research Grant Scheme (FRGS 1/2020/WAB04/ Vote no 5540389), Universiti Putra Malaysia.
Institutional Review Board Statement
Not applicable.
Informed Consent Statement
Not applicable.
Data Availability Statement
The data presented in this study are available on request from the corresponding author. The data are not publicly available because theyare a part of a PhD study.
Acknowledgments
The authors are grateful to the National Agricultural Technology Program Phase-II Project, Bangladesh Agricultural Research Council, for the financial support and Universiti Putra Malaysia, Serdang, Selangor, Malaysia, for the research facilities. Last but not the least, Bangladesh Institute of Nuclear Agriculture (BINA), Mymensingh 2202, Bangladesh for providing the 15N labelled urea.
Conflicts of Interest
The authors declare no conflict of interest.
Appendix A
Table A1.
Chemical properties of initial soil.
Table A1.
Chemical properties of initial soil.
| Parameter | Value |
|---|---|
| pH (Soil: water = 1:2.5) | 5.14 |
| Cation exchange capacity (cmolc kg−1) | 16.46 |
| Total Carbon (%) | 5.36 |
| Total Nitrogen (%) | 0.40 |
| Available P (mg kg−1) | 12.34 |
| Exchangeable K (cmolc kg−1) | 1.38 |
| Exchangeable Ca (cmolc kg−1) | 12.01 |
| Exchangeable Mg (cmolc kg−1) | 7.71 |
| Total S (mg kg−1) | 1400 |
Table A2.
Chemical properties of biochars.
Table A2.
Chemical properties of biochars.
| Parameters | Biochar Type | |
|---|---|---|
| Rice Husk Biochar (RHB) | Oil Palm Empty Fruit Bunch Biochar (EFBB) | |
| pH (Soil: water = 1:10) | 7.12 | 8.50 |
| Cation exchange capacity (cmolckg−1) | 50.42 | 58.32 |
| Total C (%) | 24.86 | 52.11 |
| Total N (%) | 0.38 | 1.13 |
| Total P (%) | 0.31 | 0.19 |
| Total K (%) | 0.75 | 5.08 |
| Total Ca (%) | 0.17 | 0.71 |
| Total Mg (%) | 0.17 | 0.39 |
| Total S (%) | 0.15 | 0.15 |
Table A3.
Monthly average temperature and humidity during the experiment.
Table A3.
Monthly average temperature and humidity during the experiment.
| Month | Temperature (°C) | Relative Humidity (%) | |
|---|---|---|---|
| Maximum | Minimum | ||
| April | 34 | 25 | 79 |
| May | 33 | 24 | 81 |
| June | 32 | 23 | 82 |
| July | 31 | 23 | 82 |
References
- Oo, A.Z.; Sudo, S.; Inubushi, K.; Chellappan, U.; Yamamoto, A.; Ono, K.; Mano, M.; Hayashida, S.; Koothan, V.; Osawa, T.; et al. Mitigation Potential and Yield-Scaled Global Warming Potential of Early-Season Drainage from a Rice Paddy in Tamil Nadu, India. Agronomy 2018, 8, 202. [Google Scholar] [CrossRef]
- Bouman, B.A.M.; Barker, R.; Humphreys, E.; Tuong, T.P.; Atlin, G.; Bennett, J.; Dawe, D.; Dittert, K.; Dobermann, A.; Facon, T. Rice: Feeding the billions. In Water for Food, Water for Life: A Comprehensive Assessment of Water Management in Agriculture; Molden, D., Ed.; Earthscan: London, UK, 2007; pp. 515–549. [Google Scholar]
- Bouman, B.A.; Tuong, T. Field water management to save water and increase its productivity in irrigated lowland rice. Agric. Water Manag. 2001, 49, 11–30. [Google Scholar] [CrossRef]
- Bouman, B.A.M.; Feng, L.; Tuong, T.P.; Lu, G.; Wang, H.; Feng, Y. Exploring options to grow rice using less water in northern China using a modelling approach. Agric. Water Manag. 2007, 88, 23–33. [Google Scholar] [CrossRef]
- Lampayan, R.M.; Rejesus, R.M.; Singleton, G.R.; Bouman, B.A.M. Adoption and economics of alternate wetting and drying water management for irrigated lowland rice. Field Crop. Res. 2015, 170, 95–108. [Google Scholar] [CrossRef]
- Yao, F.; Huang, J.; Cui, K.; Nie, L.; Xiang, J.; Liu, X.; Wu, W.; Chen, M.; Peng, S. Agronomic performance of high-yielding rice variety grown under alternate wetting and drying irrigation. Field Crop. Res. 2012, 126, 16–22. [Google Scholar] [CrossRef]
- Liang, K.; Zhong, X.; Huang, N.; Lampayan, R.M.; Pan, J.; Tian, K.; Liu, Y. Grain yield, water productivity and CH 4 emission of irrigated rice in response to water management in south China. Agric. Water Manag. 2016, 163, 319–331. [Google Scholar] [CrossRef]
- Zhang, H.; Xue, Y.; Wang, Z.; Yang, J.; Zhang, J. An Alternate Wetting and Moderate Soil Drying Regime Improves Root and Shoot Growth in Rice. Crop Sci. 2009, 49, 2246–2260. [Google Scholar] [CrossRef]
- Norton, G.J.; Shafaei, M.; Travis, A.J.; Deacon, C.M.; Danku, J.; Pond, D.; Cochrane, N.; Lockhart, K.; Salt, D.; Zhang, H.; et al. Impact of alternate wetting and drying on rice physiology, grain production, and grain quality. Field Crop. Res. 2017, 205, 1–13. [Google Scholar] [CrossRef]
- Sudhir-Yadav; Humphreys, E.; Li, T.; Gill, G.; Kukal, S.S. Evaluation of tradeoffs in land and water productivity of dry seeded rice as affected by irrigation schedule. Field Crop. Res. 2012, 128, 180–190. [Google Scholar] [CrossRef]
- Xu, Y.; Ge, J.; Tian, S.; Li, S.; Nguy-Robertson, A.L.; Zhan, M.; Cao, C. Effects of water-saving irrigation practices and drought resistant rice variety on greenhouse gas emissions from a no-till paddy in the central lowlands of China. Sci. Total Environ. 2015, 505, 1043–1052. [Google Scholar] [CrossRef]
- Belder, P.; Bouman, B.A.; Cabangon, R.; Guoan, L.; Quilang, E.J.; Yuanhua, L.; Spiertz, J.H.; Tuong, T. Effect of water-saving irrigation on rice yield and water use in typical lowland conditions in Asia. Agric. Water Manag. 2004, 65, 193–210. [Google Scholar] [CrossRef]
- McLennon, E.; Dari, B.; Jha, G.; Sihi, D.; Kankarla, V. Regenerative Agriculture and Integrative Permaculture for Sustainable and Technology Driven Global Food Production and Security. Agron. J. 2021. Available online: https://acsess.onlinelibrary.wiley.com/doi/full/10.1002/agj2.20814 (accessed on 1 October 2021). [CrossRef]
- Alhaj Hamoud, Y.; Wang, Z.; Guo, X.; Shaghaleh, H.; Sheteiwy, M.; Chen, S.; Qiu, R.; Elbashier, M. Effect of Irrigation Regimes and Soil Texture on the Potassium Utilization Efficiency of Rice. Agronomy 2019, 9, 100. [Google Scholar] [CrossRef]
- Garg, K.K.; Das, B.S.; Safeeq, M.; Bhadoria, P.B.S. Measurement and modeling of soil water regime in a lowland paddy field showing preferential transport. Agric. Water Manag. 2009, 96, 1705–1714. [Google Scholar] [CrossRef]
- Oliver, V.; Cochrane, N.; Magnusson, J.; Brachi, E.; Monaco, S.; Volante, A.; Courtois, B.; Vale, G.; Price, A.; Teh, Y.A. Effects of water management and cultivar on carbon dynamics, plant productivity and biomass allocation in European rice systems. Sci. Total Environ. 2019, 685, 1139–1151. [Google Scholar] [CrossRef]
- Moyano, F.E.; Manzoni, S.; Chenu, C. Responses of soil heterotrophic respiration to moisture availability: An exploration of processes and models. Soil Biol. Biochem. 2013, 59, 72–85. [Google Scholar] [CrossRef]
- Tan, X.; Shao, D.; Liu, H.; Yang, F.; Xiao, C.; Yang, H. Effects of alternate wetting and drying irrigation on percolation and nitrogen leaching in paddy fields. Paddy Water Environ. 2013, 11, 381–395. [Google Scholar] [CrossRef]
- Liu, P.; Ptacek, C.J.; Blowes, D.W.; Berti, W.R.; Landis, R.C. Aqueous Leaching of Organic Acids and Dissolved Organic Carbon from Various Biochars Prepared at Different Temperatures. J. Environ. Qual. 2015, 44, 684–695. [Google Scholar] [CrossRef]
- Yang, S.; Peng, S.; Xu, J.; He, Y.; Wang, Y. Effects of water saving irrigation and controlled release nitrogen fertilizer managements on nitrogen losses from paddy fields. Paddy Water Environ. 2015, 13, 71–80. [Google Scholar] [CrossRef]
- Dong, N.M.; Brandt, K.K.; Sørensen, J.; Hung, N.N.; Van Hach, C.; Tan, P.S.; Dalsgaard, T. Effects of alternating wetting and drying versus continuous flooding on fertilizer nitrogen fate in rice fields in the Mekong Delta, Vietnam. Soil Biol. Biochem. 2012, 47, 166–174. [Google Scholar] [CrossRef]
- Pandey, A.; Mai, V.T.; Vu, D.Q.; Bui, T.P.L.; Mai, T.L.A.; Jensen, L.S.; de Neergaard, A. Organic matter and water management strategies to reduce methane and nitrous oxide emissions from rice paddies in Vietnam. Agric. Ecosyst. Environ. 2014, 196, 137–146. [Google Scholar] [CrossRef]
- Hoang, T.T.H.; Do, D.T.; Tran, T.T.G.; Ho, T.D.; Rehman, H. ur Incorporation of rice straw mitigates CH4 and N2O emissions in water saving paddy fields of Central Vietnam. Arch. Agron. Soil Sci. 2019, 65, 113–124. [Google Scholar] [CrossRef]
- Ullah, S.; Zhao, Q.; Wu, K.; Ali, I.; Liang, H.; Iqbal, A.; Wei, S.; Cheng, F.; Ahmad, S.; Jiang, L.; et al. Biochar application to rice with 15N-labelled fertilizers, enhanced leaf nitrogen concentration and assimilation by improving morpho-physiological traits and soil quality. Saudi J. Biol. Sci. 2021, 28, 3399–3413. [Google Scholar] [CrossRef]
- El-Naggar, A.; Lee, S.S.; Awad, Y.M.; Yang, X.; Ryu, C.; Rizwan, M.; Rinklebe, J.; Tsang, D.C.W.; Ok, Y.S. Influence of soil properties and feedstocks on biochar potential for carbon mineralization and improvement of infertile soils. Geoderma 2018, 332, 100–108. [Google Scholar] [CrossRef]
- Solaiman, Z.M.; Shafi, M.I.; Beamont, E.; Anawar, H.M. Poultry Litter Biochar Increases Mycorrhizal Colonisation, Soil Fertility and Cucumber Yield in a Fertigation System on Sandy Soil. Agriculture 2020, 10, 480. [Google Scholar] [CrossRef]
- Liu, Y.; Lu, H.; Yang, S.; Wang, Y. Impacts of biochar addition on rice yield and soil properties in a cold waterlogged paddy for two crop seasons. Field Crop. Res. 2016, 191, 161–167. [Google Scholar] [CrossRef]
- Gamage, D.N.V.; Mapa, R.B.; Dharmakeerthi, R.S.; Biswas, A. Effect of rice-husk biochar on selected soil properties in tropical Alfisols. Soil Res. 2016, 54, 302. [Google Scholar] [CrossRef]
- Liu, Y.; Lonappan, L.; Brar, S.K.; Yang, S. Impact of biochar amendment in agricultural soils on the sorption, desorption, and degradation of pesticides: A review. Sci. Total Environ. 2018, 645, 60–70. [Google Scholar] [CrossRef]
- Gao, S.; DeLuca, T.H. Influence of Biochar on Soil Nutrient Transformations, Nutrient Leaching, and Crop Yield. Adv. Plants Agric. Res. 2016, 4, 1–16. [Google Scholar] [CrossRef]
- Cayuela, M.L.; van Zwieten, L.; Singh, B.P.; Jeffery, S.; Roig, A.; Sánchez-Monedero, M.A. Biochar’s role in mitigating soil nitrous oxide emissions: A review and meta-analysis. Agric. Ecosyst. Environ. 2014, 191, 5–16. [Google Scholar] [CrossRef]
- Beck, D.A.; Johnson, G.R.; Spolek, G.A. Amending greenroof soil with biochar to affect runoff water quantity and quality. Environ. Pollut. 2011, 159, 2111–2118. [Google Scholar] [CrossRef]
- Yao, Y.; Gao, B.; Zhang, M.; Inyang, M.; Zimmerman, A.R. Effect of biochar amendment on sorption and leaching of nitrate, ammonium, and phosphate in a sandy soil. Chemosphere 2012, 89, 1467–1471. [Google Scholar] [CrossRef]
- Huang, M.; Yang, L.; Qin, H.; Jiang, L.; Zou, Y. Fertilizer nitrogen uptake by rice increased by biochar application. Biol. Fertil. Soils 2014, 50, 997–1000. [Google Scholar] [CrossRef]
- Oladele, S.; Adeyemo, A.; Awodun, M.; Ajayi, A.; Fasina, A. Effects of biochar and nitrogen fertilizer on soil physicochemical properties, nitrogen use efficiency and upland rice (Oryza sativa) yield grown on an Alfisol in Southwestern Nigeria. Int. J. Recycl. Org. Waste Agric. 2019, 8, 295–308. [Google Scholar] [CrossRef]
- Khan, S.; Chao, C.; Waqas, M.; Arp, H.P.H.; Zhu, Y.-G. Sewage Sludge Biochar Influence upon Rice (Oryza sativa L.) Yield, Metal Bioaccumulation and Greenhouse Gas Emissions from Acidic Paddy Soil. Environ. Sci. Technol. 2013, 47, 8624–8632. [Google Scholar] [CrossRef]
- Cassman, K.G.; Peng, S.; Olk, D.C.; Ladha, J.K.; Reichardt, W.; Dobermann, A.; Singh, U. Opportunities for increased nitrogen-use efficiency from improved resource management in irrigated rice systems. Field Crop. Res. 1998, 56, 7–39. [Google Scholar] [CrossRef]
- Ali, I.; He, L.; Ullah, S.; Quan, Z.; Wei, S.; Iqbal, A.; Munsif, F.; Shah, T.; Xuan, Y.; Luo, Y.; et al. Biochar addition coupled with nitrogen fertilization impacts on soil quality, crop productivity, and nitrogen uptake under double-cropping system. Food Energy Secur. 2020, 9, e208. [Google Scholar] [CrossRef]
- Wang, D.J.; Liu, Q.; Lin, J.H.; Sun, R.J. Optimum Nitrogen Use and Reduced Nitrogen Loss for Production of Rice and Wheat in the Yangtse Delta Region. Environ. Geochem. Health 2004, 26, 221–227. [Google Scholar] [CrossRef]
- Haque, A.N.A.; Uddin, M.K.; Sulaiman, M.F.; Amin, A.M.; Hossain, M.; Zaibon, S.; Mosharrof, M. Assessing the Increase in Soil Moisture Storage Capacity and Nutrient Enhancement of Different Organic Amendments in Paddy Soil. Agriculture 2021, 11, 44. [Google Scholar] [CrossRef]
- Benton, J.J. Laboratory Guide for Conducting Soil Tests and Plant Analysis; CRC Press: Boca Raton, FL, USA, 2001; ISBN 9780429132117. [Google Scholar]
- Keeney, D.R.; Nelson, D.W. Nitrogen—Inorganic Forms. In Methods of Soil Analysis; Agronomy Monographs; 1983; pp. 643–698. ISBN 9780891189770. Available online: https://acsess.onlinelibrary.wiley.com/doi/10.2134/agronmonogr9.2.2ed.c33 (accessed on 1 November 2021).
- Bray, R.H.; Kurtz, L.T. Determination of total, organic, and available forms of phosphorus in soils. Soil Sci. 1945, 59, 39–46. [Google Scholar] [CrossRef]
- Schollenberger, C.J.; Simon, R.H. Determination of exchange capacity and exchangeable bases in soil—Ammonium acetate method. Soil Sci. 1945, 59, 13–24. [Google Scholar] [CrossRef]
- Cottenie, A. Soil Testing and Plant Testing as a Basic Fertilizer Recommendation; Rome, Italy. 1980. Available online: https://www.cabdirect.org/cabdirect/abstract/19806734748 (accessed on 1 October 2021).
- Dey, A.; Srivastava, P.C.; Pachauri, S.P.; Shukla, A.K. Time-dependent release of some plant nutrients from different organic amendments in a laboratory study. Int. J. Recycl. Org. Waste Agric. 2019, 8, 173–188. [Google Scholar] [CrossRef]
- Tuong, T.P.; Bouman, B.A.M. Rice production in water-scarce environments. In Water Productivity in Agriculture: Limits and Opportunities for Improvement; Kijne, J.W., Barker, R., Molden, D., Eds.; CABI Publishing: Wallingford, UK, 2003; Volume 1, pp. 13–42. [Google Scholar]
- Ashraf, M.; Waheed, A. Screening of local/exotic accessions of lentil (Lens culinaris Medic.) for salt tolerance at two growth stages. Plant Soil 1990, 128, 167–176. [Google Scholar] [CrossRef]
- Win, K.T.; Okazaki, K.; Ookawa, T.; Yokoyama, T.; Ohwaki, Y. Influence of rice-husk biochar and Bacillus pumilus strain TUAT-1 on yield, biomass production, and nutrient uptake in two forage rice genotypes. PLoS ONE 2019, 14, e0220236. [Google Scholar] [CrossRef]
- Lai, L.; Ismail, M.R.; Muharam, F.M.; Yusof, M.M.; Ismail, R.; Jaafar, N.M. Effects of Rice Straw Biochar and Nitrogen Fertilizer on Rice Growth and Yield. Asian J. Crop Sci. 2017, 9, 159–166. [Google Scholar] [CrossRef][Green Version]
- Yang, J.; Huang, D.; Duan, H.; Tan, G.; Zhang, J. Alternate wetting and moderate soil drying increases grain yield and reduces cadmium accumulation in rice grains. J. Sci. Food Agric. 2009, 89, 1728–1736. [Google Scholar] [CrossRef]
- Djaman, K.; Mel, V.; Diop, L.; Sow, A.; El-Namaky, R.; Manneh, B.; Saito, K.; Futakuchi, K.; Irmak, S. Effects of Alternate Wetting and Drying Irrigation Regime and Nitrogen Fertilizer on Yield and Nitrogen Use Efficiency of Irrigated Rice in the Sahel. Water 2018, 10, 711. [Google Scholar] [CrossRef]
- Linquist, B.A.; Anders, M.M.; Adviento-Borbe, M.A.A.; Chaney, R.L.; Nalley, L.L.; da Rosa, E.F.F.; van Kessel, C. Reducing greenhouse gas emissions, water use, and grain arsenic levels in rice systems. Glob. Chang. Biol. 2015, 21, 407–417. [Google Scholar] [CrossRef] [PubMed]
- Khairi, M.; Nozulaidi, M.; Jahan, M.S. Effects of Flooding and Alternate Wetting and Drying on the Yield Performance of Upland Rice. Pertanika Trop. Agric. Sci. 2016, 39, 299–309. [Google Scholar]
- Zhang, Y.; Tang, Q.; Peng, S.; Xing, D.; Qin, J.; Laza, R.C.; Punzalan, B.R. Water Use Efficiency and Physiological Response of Rice Cultivars under Alternate Wetting and Drying Conditions. Sci. World J. 2012, 2012, 287907. [Google Scholar] [CrossRef]
- Carrijo, D.R.; Akbar, N.; Reis, A.F.B.; Li, C.; Gaudin, A.C.M.; Parikh, S.J.; Green, P.G.; Linquist, B.A. Impacts of variable soil drying in alternate wetting and drying rice systems on yields, grain arsenic concentration and soil moisture dynamics. Field Crop. Res. 2018, 222, 101–110. [Google Scholar] [CrossRef]
- Haque, A.N.A.; Uddin, M.K.; Sulaiman, M.F.; Amin, A.M.; Hossain, M.; Aziz, A.A.; Mosharrof, M. Impact of Organic Amendment with Alternate Wetting and Drying Irrigation on Rice Yield, Water Use Efficiency and Physicochemical Properties of Soil. Agronomy 2021, 11, 1529. [Google Scholar] [CrossRef]
- Bakar, R.A.; Razak, Z.A.; Ahmad, S.H.; Seh-Bardan, B.J.; Tsong, L.C.; Meng, C.P. Influence of Oil Palm Empty Fruit Bunch Biochar on Floodwater pH and Yield Components of Rice Cultivated on Acid Sulphate Soil under Rice Intensification Practices. Plant Prod. Sci. 2015, 18, 491–500. [Google Scholar] [CrossRef]
- Dong, D.; Feng, Q.; McGrouther, K.; Yang, M.; Wang, H.; Wu, W. Effects of biochar amendment on rice growth and nitrogen retention in a waterlogged paddy field. J. Soils Sediments 2015, 15, 153–162. [Google Scholar] [CrossRef]
- Chen, X.; Yang, S.; Ding, J.; Jiang, Z.; Sun, X. Effects of Biochar Addition on Rice Growth and Yield under Water-Saving Irrigation. Water 2021, 13, 209. [Google Scholar] [CrossRef]
- Solaiman, Z.; Sarcheshmehpour, M.; Abbott, L.; Blackwell, P. Effect of biochar on arbuscular mycorrhizal colonisation, growth, P nutrition and leaf gas exchange of wheat and clover influenced by different water regimes. In Proceedings of the 19th World Congress of Soil Science, Soil Solutions for a Changing World, Brisbrane, Australia, 1–6 August 2010; pp. 35–37. [Google Scholar]
- Haefele, S.M.; Konboon, Y.; Wongboon, W.; Amarante, S.; Maarifat, A.A.; Pfeiffer, E.M.; Knoblauch, C. Effects and fate of biochar from rice residues in rice-based systems. Field Crop. Res. 2011, 121, 430–440. [Google Scholar] [CrossRef]
- Claoston, N.; Samsuri, A.; Ahmad Husni, M.; Mohd Amran, M. Effects of pyrolysis temperature on the physicochemical properties of empty fruit bunch and rice husk biochars. Waste Manag. Res. J. A Sustain. Circ. Econ. 2014, 32, 331–339. [Google Scholar] [CrossRef]
- Tomczyk, A.; Sokołowska, Z.; Boguta, P. Biochar physicochemical properties: Pyrolysis temperature and feedstock kind effects. Rev. Environ. Sci. Bio/Technol. 2020, 19, 191–215. [Google Scholar] [CrossRef]
- Pandis, C.; Spanoudaki, A.; Kyritsis, A.; Pissis, P.; Hernández, J.C.R.; Gómez Ribelles, J.L.; Monleón Pradas, M. Water sorption characteristics of poly(2-hydroxyethyl acrylate)/silica nanocomposite hydrogels. J. Polym. Sci. Part B Polym. Phys. 2011, 49, 657–668. [Google Scholar] [CrossRef]
- Haque, A.N.A.; Uddin, M.K.; Sulaiman, M.F.; Amin, A.M.; Hossain, M.; Solaiman, Z.M.; Mosharrof, M. Biochar with Alternate Wetting and Drying Irrigation: A Potential Technique for Paddy Soil Management. Agriculture 2021, 11, 367. [Google Scholar] [CrossRef]
- Chen, L.; Liu, M.; Ali, A.; Zhou, Q.; Zhan, S.; Chen, Y.; Pan, X.; Zeng, Y. Effects of Biochar on Paddy Soil Fertility Under Different Water Management Modes. J. Soil Sci. Plant Nutr. 2020, 20, 1810–1818. [Google Scholar] [CrossRef]
- Sun, F.; Lu, S. Biochars improve aggregate stability, water retention, and pore-space properties of clayey soil. J. Plant Nutr. Soil Sci. 2014, 177, 26–33. [Google Scholar] [CrossRef]
- Ali, I.; Ullah, S.; He, L.; Zhao, Q.; Iqbal, A.; Wei, S.; Shah, T.; Ali, N.; Bo, Y.; Adnan, M.; et al. Combined application of biochar and nitrogen fertilizer improves rice yield, microbial activity and N-metabolism in a pot experiment. PeerJ 2020, 8, e10311. [Google Scholar] [CrossRef]
- Maikol, N.; Haruna, A.O.; Maru, A.; Asap, A.; Medin, S. Utilization of urea and chicken litter biochar to improve rice production. Sci. Rep. 2021, 11, 9955. [Google Scholar] [CrossRef]
- Zheng, Y.; Han, X.; Li, Y.; Liu, S.; Ji, J.; Tong, Y. Effects of Mixed Controlled Release Nitrogen Fertilizer with Rice Straw Biochar on Rice Yield and Nitrogen Balance in Northeast China. Sci. Rep. 2020, 10, 9452. [Google Scholar] [CrossRef]
- Chen, L.; Qiao, Z.-G.; Li, L.-Q.; Pan, G.-X. Effects of biochar-based fertilizers on rice yield and nitrogen use efficiency. J. Ecol. Rural Environ. 2013, 29, 671–675. [Google Scholar]
- Amin, A.E.-E.A.Z.; Eissa, M.A. Biochar effects on nitrogen and phosphorus use efficiencies of zucchini plants grown in a calcareous sandy soil. J. Soil Sci. Plant Nutr. 2017, 17, 912–921. [Google Scholar] [CrossRef]
- Sun, H.; Shi, W.; Zhou, M.; Ma, X.; Zhang, H. Effect of biochar on nitrogen use efficiency, grain yield and amino acid content of wheat cultivated on saline soil. Plant Soil Environ. 2019, 65, 83–89. [Google Scholar] [CrossRef]
- Xia, H.; Riaz, M.; Zhang, M.; Liu, B.; El-Desouki, Z.; Jiang, C. Biochar increases nitrogen use efficiency of maize by relieving aluminum toxicity and improving soil quality in acidic soil. Ecotoxicol. Environ. Saf. 2020, 196, 110531. [Google Scholar] [CrossRef] [PubMed]
- Liu, Z.; He, T.; Cao, T.; Yang, T.; Meng, J.; Chen, W. Effects of biochar application on nitrogen leaching, ammonia volatilization and nitrogen use efficiency in two distinct soils. J. Soil Sci. Plant Nutr. 2017, 17, 515–528. [Google Scholar] [CrossRef]
- Liu, Z.; Cheng, X.; Sun, D.; Meng, J.; Chen, W. Maize stover biochar increases urea (15 N isotope) retention in soils but does not promote its acquisition by plants during a 4-year pot experiment. Chil. J. Agric. Res. 2017, 77, 382–389. [Google Scholar] [CrossRef]
- Shi, R.; Li, J.; Ni, N.; Xu, R. Understanding the biochar’s role in ameliorating soil acidity. J. Integr. Agric. 2019, 18, 1508–1517. [Google Scholar] [CrossRef]
- Yuan, J.-H.; Xu, R.-K. Effects of biochars generated from crop residues on chemical properties of acid soils from tropical and subtropical China. Soil Res. 2012, 50, 570. [Google Scholar] [CrossRef]
- Fidel, R.B.; Laird, D.A.; Thompson, M.L.; Lawrinenko, M. Characterization and quantification of biochar alkalinity. Chemosphere 2017, 167, 367–373. [Google Scholar] [CrossRef]
- Ding, Y.; Liu, Y.; Liu, S.; Huang, X.; Li, Z.; Tan, X.; Zeng, G.; Zhou, L. Potential Benefits of Biochar in Agricultural Soils: A Review. Pedosphere 2017, 27, 645–661. [Google Scholar] [CrossRef]
- Xie, Z.; Xu, Y.; Liu, G.; Liu, Q.; Zhu, J.; Tu, C.; Amonette, J.E.; Cadisch, G.; Yong, J.W.H.; Hu, S. Impact of biochar application on nitrogen nutrition of rice, greenhouse-gas emissions and soil organic carbon dynamics in two paddy soils of China. Plant Soil 2013, 370, 527–540. [Google Scholar] [CrossRef]
- Peng, X.; Ye, L.L.; Wang, C.H.; Zhou, H.; Sun, B. Temperature- and duration-dependent rice straw-derived biochar: Characteristics and its effects on soil properties of an Ultisol in southern China. Soil Tillage Res. 2011, 112, 159–166. [Google Scholar] [CrossRef]
- Bouman, B.A.; Lampayan, R.; Tuong, T.P. Water Management in Irrigated Rice. Coping with Water Scarcity; Hardy, B., Ed.; International Rice Research Institute (IRRI): Los Baños, Philippines, 2007. [Google Scholar]
- Alberto, M.C.R.; Wassmann, R.; Buresh, R.J.; Quilty, J.R.; Correa, T.Q.; Sandro, J.M.; Centeno, C.A.R. Measuring methane flux from irrigated rice fields by eddy covariance method using open-path gas analyzer. Field Crop. Res. 2014, 160, 12–21. [Google Scholar] [CrossRef]
- Lehmann, J. A handful of carbon. Nature 2007, 447, 143–144. [Google Scholar] [CrossRef]
- Hussain, M.; Farooq, M.; Nawaz, A.; Al-Sadi, A.M.; Solaiman, Z.M.; Alghamdi, S.S.; Ammara, U.; Ok, Y.S.; Siddique, K.H.M. Biochar for crop production: Potential benefits and risks. J. Soils Sediments 2017, 17, 685–716. [Google Scholar] [CrossRef]
- Yang, S.; Chen, X.; Jiang, Z.; Ding, J.; Sun, X.; Xu, J. Effects of Biochar Application on Soil Organic Carbon Composition and Enzyme Activity in Paddy Soil under Water-Saving Irrigation. Int. J. Environ. Res. Public Health 2020, 17, 333. [Google Scholar] [CrossRef] [PubMed]
- Zhang, A.; Bian, R.; Pan, G.; Cui, L.; Hussain, Q.; Li, L.; Zheng, J.; Zheng, J.; Zhang, X.; Han, X.; et al. Effects of biochar amendment on soil quality, crop yield and greenhouse gas emission in a Chinese rice paddy: A field study of 2 consecutive rice growing cycles. Field Crop. Res. 2012, 127, 153–160. [Google Scholar] [CrossRef]
- DeLuca, T.H.; MacKenzie, M.D.; Gundale, M.J.; Holben, W.E. Wildfire-Produced Charcoal Directly Influences Nitrogen Cycling in Ponderosa Pine Forests. Soil Sci. Soc. Am. J. 2006, 70, 448–453. [Google Scholar] [CrossRef]
- Kameyama, K.; Miyamoto, T.; Shiono, T.; Shinogi, Y. Influence of Sugarcane Bagasse-derived Biochar Application on Nitrate Leaching in Calcaric Dark Red Soil. J. Environ. Qual. 2012, 41, 1131–1137. [Google Scholar] [CrossRef]
- Ahmad, M.; Lee, S.S.; Dou, X.; Mohan, D.; Sung, J.-K.; Yang, J.E.; Ok, Y.S. Effects of pyrolysis temperature on soybean stover- and peanut shell-derived biochar properties and TCE adsorption in water. Bioresour. Technol. 2012, 118, 536–544. [Google Scholar] [CrossRef]
- Hale, S.E.; Alling, V.; Martinsen, V.; Mulder, J.; Breedveld, G.D.; Cornelissen, G. The sorption and desorption of phosphate-P, ammonium-N and nitrate-N in cacao shell and corn cob biochars. Chemosphere 2013, 91, 1612–1619. [Google Scholar] [CrossRef]


Publisher’s Note: MDPI stays neutral with regard to jurisdictional claims in published maps and institutional affiliations. |
© 2022 by the authors. Licensee MDPI, Basel, Switzerland. This article is an open access article distributed under the terms and conditions of the Creative Commons Attribution (CC BY) license (https://creativecommons.org/licenses/by/4.0/).