Article

Evaluation of the Resilience of the Socio-Hydrological System of the Tarim River Basin in China and Analysis of the Degree of Barriers

1
Xinjiang Production and Construction Group Key Laboratory of Modern Water-Saving Irrigation, College of Water and Architectural Engineering, Shihezi University, Shihezi 832000, China
2
State Key Laboratory of Simulation and Regulation of Water Cycle in River Basin, China Institute of Water Resources and Hydropower Research, Beijing 100044, China
3
State Key Laboratory of Hydraulic Engineering Simulation and Safety, School of Civil Engineering, Tianjin University, Tianjin 300072, China
*
Author to whom correspondence should be addressed.
Sustainability 2022, 14(13), 7571; https://doi.org/10.3390/su14137571
Submission received: 6 May 2022 / Revised: 11 June 2022 / Accepted: 15 June 2022 / Published: 21 June 2022

Abstract

:
The study of changes in the resilience of socio-hydrological systems in arid zones is of great significance to ensure the sustainable development of socio-economic and water resources in arid zones. In order to fully understand the level of resilience development of the Tarim River Basin socio-hydrological system and the main impediments to its development, we constructed a resilience evaluation model of the Tarim River Basin socio-hydrological system from two aspects, vulnerability and adaptability, which is what makes this paper different from other studies. The evaluation index weights were determined using a comprehensive assignment, and the barrier factors and evolutionary characteristics of the system resilience were revealed based on the TOPSIS algorithm and barrier degree model. The results show that (1) during the period 2001–2020, the resilience of the socio-hydrological system in the Tarim River Basin showed a fluctuating upward trend, with the calculated values mainly in the range of 0.8–1.5, and the overall resilience level was mainly at the medium or good level; (2) from the changes in each criterion layer, the vulnerability and adaptability of the Tarim River Basin showed a fluctuating upward trend from 2001 to 2020, with an increase in vulnerability and adaptability; and (3) the main barriers to the resilience of the socio-hydrological system in the Tarim River Basin are the degree of pollution of surface water sources and the amount of water consumption per 10,000 yuan of GDP. We believe that we should continue to change the economic development model, vigorously develop water-saving irrigation technology, improve water resource utilisation and economic benefits, and improve the overall resilience of the socio-hydrological system. A full understanding of the evolutionary characteristics of the resilience of socio-hydrological systems and the main influencing factors can provide a theoretical basis for future water resources development and utilisation, socio-economic development, and related policy formulation.

1. Introduction

With the deepening exploitation of natural systems by human societies, human and natural resource systems have been deeply integrated, forming various types of human–society–natural resource systems [1,2]. As the natural resource most closely related to human society, the Earth’s hydrological and water resources systems have formed socio-hydrological systems in a long-term reciprocal feeder evolution with human society [3]. Because of the impact of human activities on hydrological change, Wagener [4] and others have called for a redefinition of hydrology. The expression of mutual response mechanisms between water and humans has become an urgent need for the development of the discipline of hydrology. In 2012, Sivapalan et al. [5] first proposed social hydrology, which aims to reveal the interaction mechanisms between hydrological systems and humans at different spatial and temporal scales, in order to promote the development of social hydrology for the sustainable use of water resources. Social hydrology has developed into a science based on traditional hydrology and its interdisciplinary aspects, studying coupled human–water systems, with interdisciplinary and multi-scale characteristics [5,6,7]. As the theoretical system related to social hydrology has been perfected, many scholars have carried out research from different perspectives and at different scales. The focus of these studies is mainly divided into four parts: policy making [8,9,10], surface runoff changes [11,12], groundwater level changes [13], and climate change [14,15]. In addition, scholars have explored the impact of the water cycle on the social hydrological system in the global economic trade based on virtual water-related theories.
Resilience is a physical concept that represents the ability of a material to absorb energy before plastic deformation and rupture. Resilience has since been introduced into other fields, giving rise to concepts such as ecological resilience, socio-ecological resilience, and urban ecological resilience. Given the close connection between human society and hydrological systems, Mao et al. [16] combined the properties of resilience and the characteristics of socio-hydrological systems, and first proposed the concept and framework of socio-hydrological system resilience in 2017. Eslamian et al. [17] further refined the definition of socio-hydrological system resilience on this basis. Scholars in the field now generally agree that socio-hydrological system resilience is defined as the ability of socio-hydrological systems to adapt in the face of biophysical or hydrological changes and to thrive in a changing environment [17,18,19].
As the definition of socio-hydrological system resilience has been accepted by scholars, qualitative and quantitative research on socio-hydrological system resilience has been conducted. Current research on socio-hydrological system resilience has been conducted mainly through the construction of evaluation index systems and the analysis of the impact of natural disasters or policy management [20,21,22]. At present, relevant studies in China have focused on the evaluation of urban ecological resilience and the analysis of the driving factors [23,24]. However, relatively little research has been conducted on the evolutionary characteristics and mechanisms of socio-hydrological system resilience, especially in arid regions of China. The Tarim River is the largest inland river in China, and the basin suffers from water stress, agricultural irrigation crowding out ecological water, salinisation of arable land, and groundwater decline [25,26]. In recent years, numerous scholars have studied the socio-hydrological systems of the Tarim River Basin from different perspectives. These studies have focused on the mechanisms of human–water system coupling or the interactions between the properties within each system. These studies have not looked at the socio-hydrological system as a whole, examining its ability to cope with external disturbances or internal pressures [27,28].
In recent years, with the introduction of the Chinese government’s development plan for the Tarim River Basin, there has been increasing interest in the exploitation of water resources and the socio-economic development of the basin. However, various water-consuming industries in the basin have also expanded, and the coupling of socio-hydrological systems in the basin has deepened. In this paper, we first construct a socio-hydrological system resilience model for the Tarim River Basin, and then we evaluate and analyse the changes in socio-hydrological system resilience in the Tarim River Basin from 2001 to 2020, in order to provide support for development decisions in the Tarim River Basin. The main research contents of this paper are as follows: (1) We combined entropy weighting and random weighting to determine the combined weight of each evaluation indicator. (2) Firstly, the TOPSIS algorithm was used to calculate the closeness of each evaluation target, and then, according to the resilience evaluation model, the resilience of the Tarim River Basin system was calculated for the period 2001–2020. (3) Finally, based on the barrier degree model, the main barrier factors of system resilience in the Tarim River Basin were obtained. This work is organised as depicted in Figure 1.

2. Materials and Methods

2.1. Overview of the Study Area

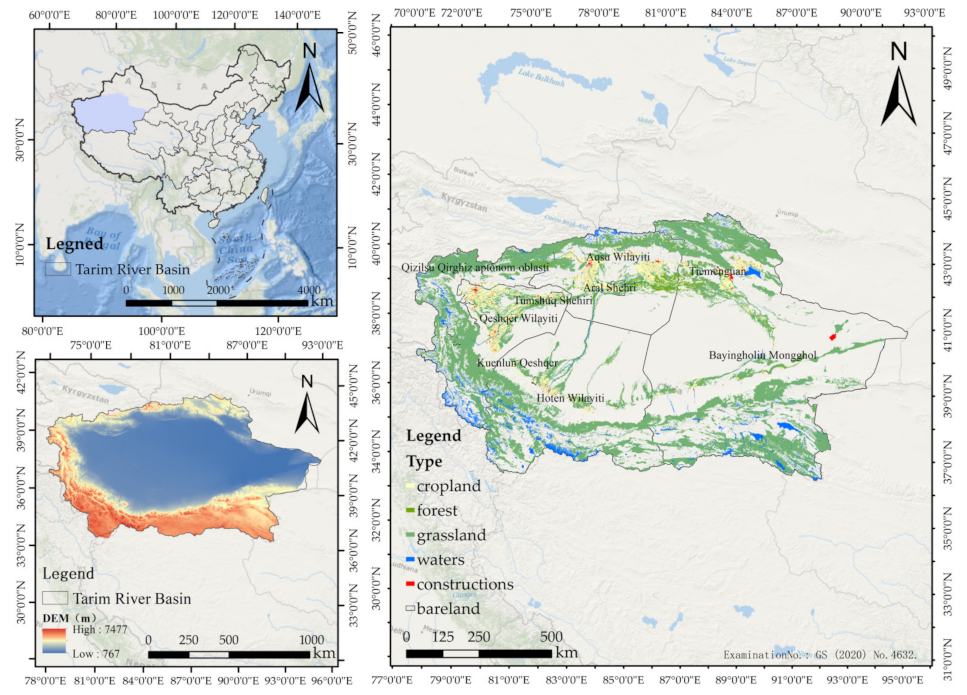
The Tarim River Basin (73°10′ E–94°5′ E, 34°55′ N–43°8′ N) is located in the southern region of the Xinjiang Uyghur Autonomous Region (Figure 2). The Tarim River Basin is bounded by the Tianshan Mountains to the northeast, the Kunlun Mountains to the southeast, and the Pamir Plateau to the west. The basin is characterised by scarce rainfall, strong evaporation, an arid climate, relatively poor water resources, and an extremely fragile ecological environment. The Tarim River is formed by the confluence of the Yarkant, Hotan, and Aksu rivers, forming a water resource pattern of “four sources and one stem”. The total water resources of the river basin amount to 42.9 billion m3, with an average runoff of 39.83 billion m3 over the years, which translates into a runoff depth of only 42 mm, much lower than the national average runoff depth of 276 mm. The population of the basin accounts for 46.85% of the whole of Xinjiang, and the total value of gross domestic product (GDP) is 27.68%. The GDP per capita is far below the average level of Xinjiang, and the economic and social development is relatively backward. In recent years, affected by climate change, disorderly exploitation, and inefficient use of water resources, the Tarim River Basin has experienced river disruptions. The conflict between supply and demand of water resources has intensified, and the sustainable development of social and economic development has been restricted.

2.2. Data Sources and Processing

The years 2001–2020, for which data are more complete, were selected for this study. The original data on the number of students in schools at all levels, the population without safe drinking water, the unemployment rate, water-saving irrigation area, effective irrigation area, GDP, total population, forest land area, and investment in water conservancy were taken from the Xinjiang Statistical Yearbook (2001–2020). The original data on multi-year average precipitation, total water consumption, per capita water consumption, water resources development rate, reservoir storage, sewage discharge, and number of reservoirs are from the Xinjiang Water Resources Bulletin (2001–2020). Precipitation data are from the China Meteorological Data website (http://data.cma.cn/wa, accessed on 28 April 2022) and runoff data and basin area data are from the Xinjiang Uygur Autonomous Region Water Resources Department (http://slt.xinjiang.gov.cn/, accessed on 28 April 2022).

2.3. Research Ideas and Methods

2.3.1. Evaluation System

According to Babel et al. [29] and Folke et al. [30], socio-hydrological system resilience (SHR) is positively related to its adaptive capacity (SHA), i.e., the stronger the adaptive capacity, the greater the resilience. Socio-hydrological system resilience is negatively related to its vulnerability (SHV), meaning, the greater the vulnerability, the less the resilience. Therefore, we used the quotient method to construct a socio-hydrological resilience evaluation model, with the following formula:
S H R = S H A S H V
where SHR is the basin socio-hydrological system resilience, and SHA and SHV are the basin socio-hydrological system resilience and basin socio-hydrological system vulnerability, respectively.
Adaptation (SHA) refers to the ability to prepare for, or adapt and respond to, stresses and changes [31,32], and the SHA can be divided into four areas: natural adaptation, physical adaptation, social adaptation, and economic adaptation. (1) Natural adaptation is the ability of the natural hydrological system to cope with its own needs, mainly influenced by the amount of water resources and the main factors affecting the production and flow of water. (2) Physical adaptation is the ability of social actors to reduce water use and the impact of water scarcity, mainly taking into account the extent to which water-saving irrigation is widespread and the degree of improvement of water facilities [33]. (3) Social adaptation is the ability of the social system to learn from past experience and to adapt to its own needs [34]. The main factors include the level of education of the society as a whole and the main factors affecting social stability [33]. (4) Economic adaptability is the wealth development of the socio-hydrological system, i.e., the ability of the socio-economic system to cope in the face of crises, mainly considering the wealth development of individuals.
Vulnerability (SHV) is the state of the socio-hydrological system in the face of internal system pressures such as water scarcity and population growth, as well as external system pressures such as ecological changes [18]. (1) Water resource variability is possible water scarcity due to resource variability; water resources variability can be determined by the relative deviation of the current year’s precipitation from the multi-year average precipitation. (2) Water resources shortage mainly refers to the impact on society due to the scarcity of water resources, and also refers to the availability of water resources and the amount of water available [29]. (3) Water resources utilisation is the impact of different human exploitation and use of water resources, taking into account the ability of human society to regulate water resources, the intensity of exploitation, and the level of efficiency of use. (4) Water pollution mainly reflects the extent of the impact of human socio-economic activities on the quality of water resources.

2.3.2. Indicator Systems

Based on the synthesis of previous research results and the actual situation of the Tarim River Basin, we constructed a system of indicators for evaluating the resilience of the socio-hydrological system in the Tarim River Basin based on the constructed evaluation system and with reference to the existing socio-hydrological system resilience evaluation index system. The vulnerability and adaptability indicators are detailed in Table 1 and Table 2.

2.3.3. Resilience Classification

In order to more concisely describe the development level of socio-hydrological system resilience, combining the characteristics of the socio-hydrological system in the Northwest Arid Zone and the research results of Jaramillo et al. [18], the socio-hydrological system resilience was classified into four levels, according to the calculated values of socio-hydrological system resilience, which are I, II, III, and IV, indicating that the system resilience is at a good, medium, poor, or worse level, respectively. The specific classification criteria are shown in Table 3.

2.3.4. Data Standardisation

In this paper, we use the entropy-based method and the random assignment method to assign the indicators. The entropy-based assignment overcomes the disadvantages of subjective assignment and has a higher degree of confidence [34]. The indicator data may have grey correlation, and the random assignment method can indicate the uncertainty between elements. Therefore, we adopted the combined method of assignment based on entropy value assignment and random assignment to assign weights to evaluation indicators.
As the indicators have different magnitudes, they need to be standardised so that different data can be comparable. Based on the core idea of the TOPSIS algorithm, we adopted the standardisation of deviations and calculated the formulae according to the characteristics of the indicators.
  • Positive indicators:
x i j = x i j m i n x i j m a x x i j m i n x i j + 1
2.
Negative indicators:
x i j = m a x x i j x i j m a x x i j m i n x i j + 1
where x i j is the jth indicator in the ith sample year and x i j represents the jth indicator in the ith sample year after standardisation; 1 ≤ im, 1 ≤ jn, m is the number of sample years and n is the number of evaluation indicators. In this paper, the range of m is 1, 2, …, 19, 20; the range of n is 1, 2, …, 15, 16.

2.3.5. Entropy Assignment

The basic idea of the entropy assignment method is to determine the indicator weights by calculating the information entropy among the indicators, in accordance with the degree of relative changes in the indicators to the degree of influence on the system, and the measured indicator weights have strong objectivity and credibility [35].
1.
Calculate the weighting matrix of the indicator system:
P i j m , n = P 11 P 12 P 1 n P 21 P 22 P 2 n P m 1 P m 2 P m n = x i j i = 1 n x i j
where P i j m , n is the weighting matrix of evaluation indicators; 0 ≤   P i j   ≤ 1, where m represents the number of sample years, and m takes values in the range of 1, 2, …, 19, 20; n represents the number of evaluation indicators, and n takes values in the range of 1, 2, …, 15, 16; x i j represents the jth indicator in sample year i after standardisation, with i taking values in the range 1, 2, …, 19, 20 and j taking values in the range 1, 2, …, 15, 16.
2.
Calculate the entropy value of each indicator:
e j = 1 ln m i = 1 m P i j ln P i j
where e j is the entropy value of each indicator, 0 ≤ e j ≤ 1.
3.
Calculating indicator weights:
g j = 1 e j
W j s z = g j j = 1 n g j  
where g j is the coefficient of variance term of the jth indicator; W j s z is the entropy weight of the jth indicator.

2.3.6. Random Empowerment

The stochastic weighting method calculates the stochastic weights of each indicator by introducing a random matrix and constructing a random weighting matrix. This method not only considers the important parameter of the edge node weights, but also allows the characterisation of the uncertainty between the indicators [36].
1.
Construct a random weighting matrix r i j k , m :
r i j k , m = r 11 r 12 r 1 n r 21 r 22 r 2 n r k 1 r k 2 r m n = w i j k , n j = 1 n w i j k , n × x i j n , m j = 1 m x i j n , m  
where x i j m , n is the indicator sample matrix, indicating the jth indicator of the ith sample; w i j k , n is the random matrix; k indicates the number of rows of the random matrix, taking values in the range of 1, 2, …, 19, 20; m represents the number of sample years, 1 ≤ im; n represents the number of evaluation indicators 1 ≤ jn. The elements in both the indicator sample matrix and the random matrix are dimensionless.
2.
Calculating the entropy value of an indicator:
H j = 1 ln k i = 1 n f i j ln f i j  
f i j = 1 + r i j i = 1 k 1 + r i j  
where H j is the entropy value of the jth evaluation indicator; f i j is the information entropy of the jth indicator, with i taking values in the range of 1, 2, …, k − 1, k and j taking values in the range of 1, 2, …, n − 1, n.
3.
Calculating random weights for indicators:
g j = 1 H j
σ j = 1 K I = 1 K r i j r ¯ j 2  
W j s j = g j + σ j j = 1 m σ j r ¯ j ¯ j = 1 m g j + j = 1 m σ j · j = 1 m σ j r ¯ j ¯
where g j is the coefficient of the difference term for the jth indicator; σ j is the standard deviation of the sample values, indicating the effect of interactions between elements; r ¯ j represents the mean of the jth column in the random weighting matrix; W j s j is the random weight of the jth element.

2.3.7. Comprehensive Empowerment

The indicator weights based on entropy assignment and random assignment not only compensate for the uncertainty caused by random assignment, but also consider the uncertainty among indicators in order to more accurately reflect the importance and authenticity of each evaluation indicator. The specific calculation steps are as follows:
W j z h = α W j s j + β W j s z
where W j z h is the combined weight of each indicator; W j s j is the random weight of each indicator; W j s z is the entropy weight of each indicator; α and β are the coefficients of each weight, both of which are taken as 0.5; the values of j range from 1, 2, …, 15, 16.

2.3.8. TOPSIS Algorithm

The basic principle of the TOPSIS algorithm is to measure the relative distance between each sample solution and the optimal (inferior) solution, and then obtain the closeness of each evaluation target to the ideal solution and the ranking of superiority and inferiority. The closeness indicates how close the corresponding evaluation target is to the optimal level, and takes a value in the range [0, 1]; the higher the value, the better the evaluation target, and vice versa. This method is easy to calculate and has the characteristics of making full use of existing data and reducing the loss of data information [37], and can accurately express the change in evaluation objectives over time; so, we used the TOPSIS algorithm. The specific calculation of this algorithm can be found in the study of Shen Zuiyi et al. [38].
C i = s e p i s e p i + + s e p i
where C i takes values in the range [0, 1]; s e p i + is the distance between the ith sample solution and the optimal solution; s e p i is the distance between each sample solution and the worst solution; 1 ≤ im and m is the number of sample years.

2.3.9. Barrier Degree Model

Improving system resilience is an important prerequisite for promoting the sustainable development of socio-hydrological systems. In order to further [39] reveal the main factors impeding the improvement of the resilience level of socio-hydrological systems in the Tarim River Basin, we used the barrier degree model to quantitatively analyse the barrier factors and the degree of barriers affecting the resilience of socio-hydrological systems in the basin, and on the basis of analysing the barrier degree of individual indicators on the total target, we further analysed the factors. We performed a quantitative analysis of the barriers to the resilience of socio-hydrological systems in watersheds and referred to the methods provided in the relevant literature for the calculation [39,40].
Z i j = L i j W j j = 1 n L i j W j × 100 %  
L i j = 1 x i j  
where Z i j is the barrier degree of the jth indicator to the resilience of the basin socio-hydrological system in year i; L i j is the gap between the single factor and the target condition; W j is the weight of the jth indicator, which we use the comprehensive weight to express; 1 ≤ im, 1 ≤ jn, where m is the number of sample years and n is the number of evaluation indicators.

2.3.10. Sensitivity Analysis

The main purpose of sensitivity analysis is to identify the main independent variable influencing factors affecting the dependent variable and to analyse the degree of influence and sensitivity of the independent variable on the dependent variable. The sensitivity analysis method is divided into single-factor sensitivity analysis and multi-factor sensitivity analysis, depending on the number of changes in the dependent variable at a time. Considering the grey correlation among the indicators, we used the single-factor sensitivity analysis method, and details of the calculation can be found in the study by Liu et al. [41].

3. Results

3.1. Weighting of Evaluation Indicators

Based on the results of data standardisation, the selected indicators were assigned weights using the integrated weighting method, and the indicators were ranked according to their weights (Table 4 and Table 5). In terms of the indicator layer, wastewater emissions had the highest weight (0.076) and per capita water use had the lowest weight (0.044), with a weight difference of 0.032. The indicators ranked in the top five weights were derived from three and two indicators of vulnerability and adaptability, respectively, with a small weight difference. The top three indicators in the factor tier are physical adaptation (0.196), water use (0.189), and water pollution (0.141), with two and one indicator(s) derived from vulnerability and adaptation, respectively. Water resource change has the lowest weight of 0.056.

3.2. Changes in Basin Socio-Hydrological Adaptation and Vulnerability

The raw data were standardised according to the data standardisation method described in Section 3.2.1. According to the comprehensive weight of each indicator, the standardized method was used to calculate the processed data set. According to the different indicator systems corresponding to each criterion and factor layer, the TOPSIS algorithm was used to calculate the relative distance between each sample scenario and the optimal (inferior) solution for different evaluation objectives from 2001 to 2020. Finally, the adaptive capacity and vulnerability of the basin’s socio-hydrological system and the closeness of each indicator in the factor layer to which it belongs were obtained.

3.2.1. Adaptive Change in Basin Socio-Hydrological Systems

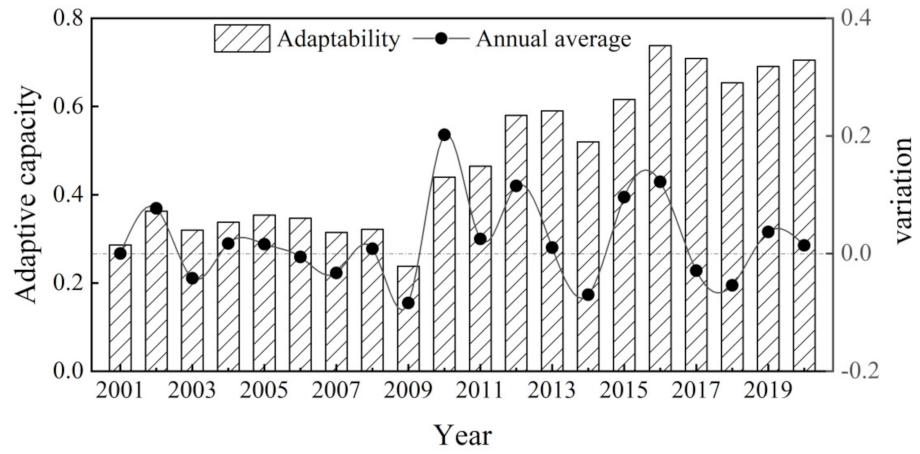
Over the past 20 years, the adaptive capacity of the socio-hydrological system of the Tarim River Basin has shown a fluctuating upward trend (Figure 3), with a variation of 0.420. The adaptive capacity of the system changed abruptly in 2009, achieving a very small value of 0.238, and a very large value of 0.738 in 2016. Using 2009 as the cut-off point, the overall adaptive capacity showed a slow decline from 2001 to 2009, with a variation of −0.048; from 2010 to 2020, the adaptive capacity showed an increasing trend and tended to be stable, with a significant increase in adaptive capacity from 2010 to 2016, with a variation of 0.298, and a stable change from 2017 to 2020, with a variation of −0.004.
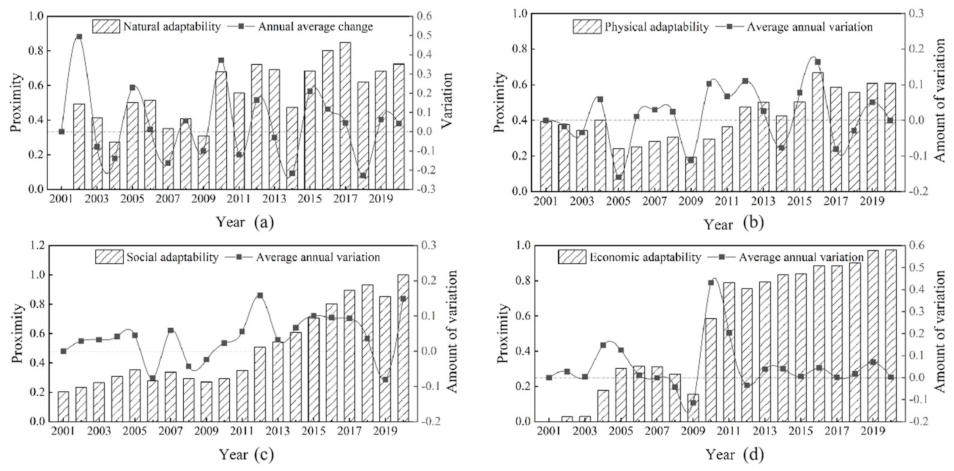
The overall trend of change in the indicators of each factor layer included in adaptation is the same, all showing a fluctuating upward trend (Figure 4), but there are differences in their specific changes at different times. (1) Before 2011, there was a clear upward trend in the overall natural adaptation closeness, and the sum of the average annual changes was greater than 0. After 2011, the changes were slow and levelled off, with the average annual changes tending to 0 (Figure 4a). (2) Both the physical fitness and the average annual variation were divided between 2009 and 2015, with the fitness first showing a clear downward trend, then a clear upward trend, and eventually levelling off (Figure 4b); the average annual variation was mainly negative until 2009, then mainly positive, and tended to zero after 2015. (3) The average annual change in social adaptation indicators is mainly positive and the trend of its closeness can be divided into two periods: a slow rising phase from 2001 to 2009 and a larger change from 2010 to 2020, when it sees a bigger boost (Figure 4c). (4) Economic resilience as a whole fluctuated upwards while the average annual change was slow, but both changed abruptly in 2010; economic resilience was at a low level in the range (0, 0.4) in 2010 and before, and at a high level after 2011 (Figure 4d).

3.2.2. Changes in the Vulnerability of the Basin’s Socio-Hydrological System

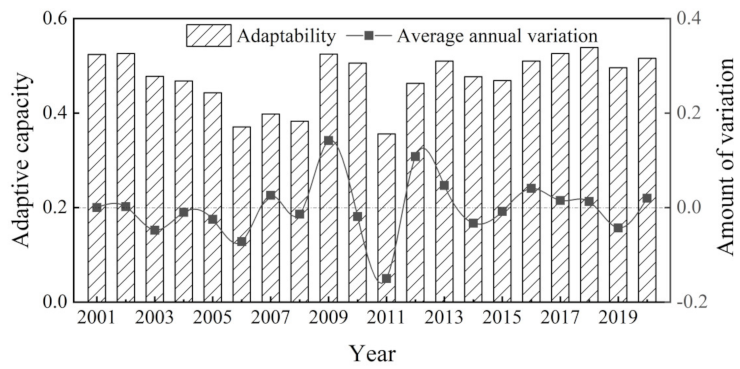
The system vulnerability tended to increase slowly over the study period (Figure 5), with a variation of only 0.012. The year 2009 saw an abrupt change in its closeness, with the system vulnerability decreasing each year between 2001 and 2009, and fluctuating and relatively stable over the period 2010–2020, with values mainly concentrated in the range (0.46, 0.53).
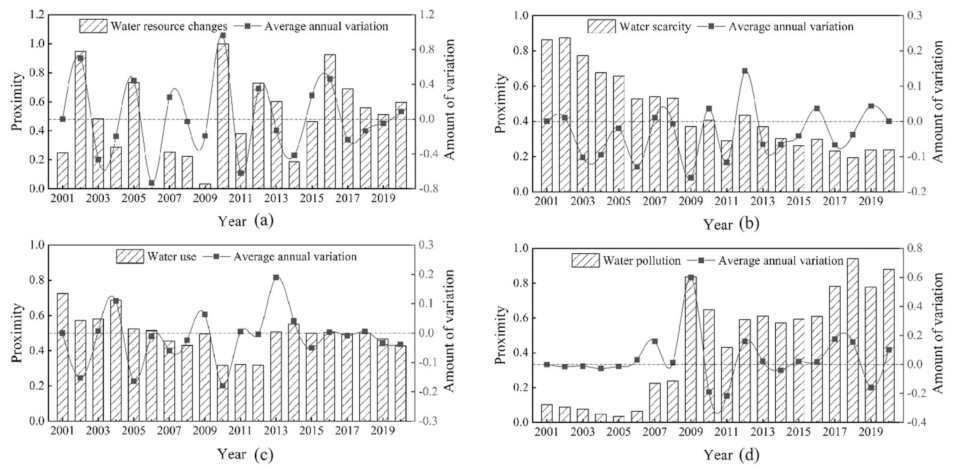
Figure 6a–d shows the trend of the closeness of each factor layer. (1) The average annual variation in the water resources change indicator shows a fluctuating trend, and the closeness increases from 0.248 to 0.598; the closeness and average annual variation change abruptly in 2010, and the closeness achieves a large value (1.0), and a very small value (0) in 2009. (2) The vulnerability to water scarcity declined significantly, from 0.864 to 0.239, and the average annual change was mainly negative; using 2015 as the boundary, the change can be divided into two stages: a significant decline and a stabilisation. (3) The vulnerability of water use decreased from 0.725 to 0.428, and its closeness varied by −0.408 between 2001 and 2012, and the average annual change is mainly negative; between 2013 and 2020, the closeness changed slowly and more steadily, and the average annual change tended to zero. (4) The closeness of water pollution indicators increased from 0.103 to 0.879, and the annual average change was slow; in 2009, both the closeness and the annual average change changed abruptly; taking 2005 as the boundary, the closeness can be divided into two stages: decreasing and increasing.

3.2.3. Changes in the Resilience of the Basin’s Socio-Hydrological System

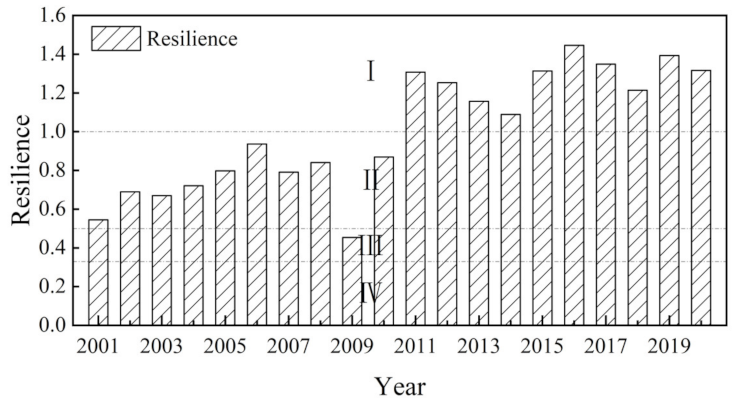
Figure 7 shows that the socio-hydrological system toughness of the Tarim River Basin showed an overall increasing trend during the study period, with a variation of 0.772. The toughness levels were mainly in the I and II classes, with good or moderate toughness levels. The year 2009 saw a sudden change in the system toughness, with a very small value (0.454), and the toughness level dropped to the III class. The change in system toughness can be divided into two segments: before 2009, the system toughness value mainly tends to increase, with a variation of 0.296, and the toughness levels are all in the II grade; after 2009, the statistical toughness number first rises, and then tends to stabilise, with the range of values mainly concentrated in (1.1, 1.4), and the transition period from 2010 to 2011, when the toughness levels change, and from 2011 to 2020, the toughness levels are all at level I.

3.3. Analysis of the Degree of Resilience Barriers in Basin Socio-Hydrological Systems

The barrier degree of each indicator was calculated according to the barrier degree model to obtain the barrier degree of each indicator to system resilience in different years. The barrier degree of each indicator was analysed, and the main barrier factors of the system were identified from the indicator level, factor level, and criterion level. The barriers were ranked in order of magnitude, and the barriers were screened according to the criterion of barrier degree Zi ≥ 4.0% [42]. The results of the diagnosis of the main barriers to system resilience in the Tarim River Basin were obtained (Table 6). The top five ranked barrier factors for each sample year were selected to analyse the changes in the main barrier factors for system resilience (Table 7).
As can be seen from Table 6, among the resilience barriers to the socio-hydrological system in the Tarim River Basin from 2001 to 2020, the highest frequency of surface water pollution (X7) occurs at 85.00%, followed by water-saving irrigation efficiency (X11), with a frequency of 80.00%. In terms of indicators in the factor layer, there are one, one, and two indicators derived from water resources change, water resources shortage, and water resources pollution, respectively; and one, three, and two indicators derived from natural adaptation, physical adaptation, and social adaptation, respectively. In terms of indicators in the criterion layer, there are four indicators belonging to vulnerability and adaptation, and six indicators of adaptation.
As can be seen from Table 7, the cumulative barrier, ranked in the top five in the indicator layer, gradually increases. The year 2020 even reaches 77.9%, while 2008 and 2007 have the smallest cumulative barriers, at 41.4% and 42.8%, respectively. Among the barriers to system resilience in different years, those with a barrier greater than 20% are mainly the proportion of population with unsafe drinking water (X2) and the amount of water used per 10,000 yuan GDP (X6). Other barrier factors less than 10% are mainly the coefficient of variation of rainfall (X1), per capita water use (X3), dam density (X4), water resources development (X15), and the proportion of economically active population (X15).
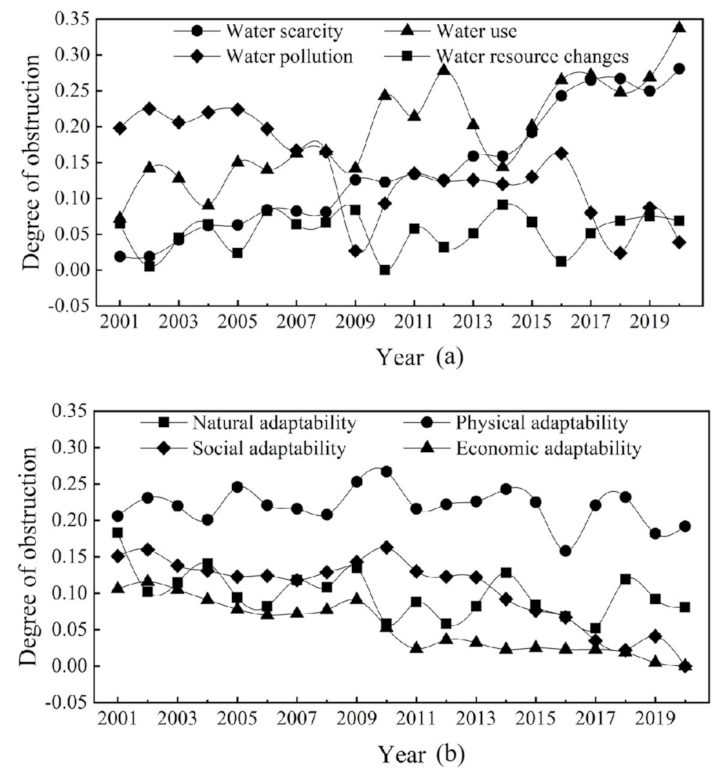
As can be seen from Figure 8, there are variations in the barriers to the resilience of the socio-hydrological system in the Tarim River Basin in terms of the indicators of each factor layer, with the barriers to water pollution, natural adaptation, physical adaptation, social adaptation, and economic adaptation showing an overall decreasing trend, and the barriers to water resources change, water scarcity, and water resources use showing an overall increasing trend. Between 2001 and 2010, physical adaptation was the greatest barrier, followed by water pollution and water use; between 2011 and 2020, water use was the greatest barrier, followed by physical adaptation and water scarcity.
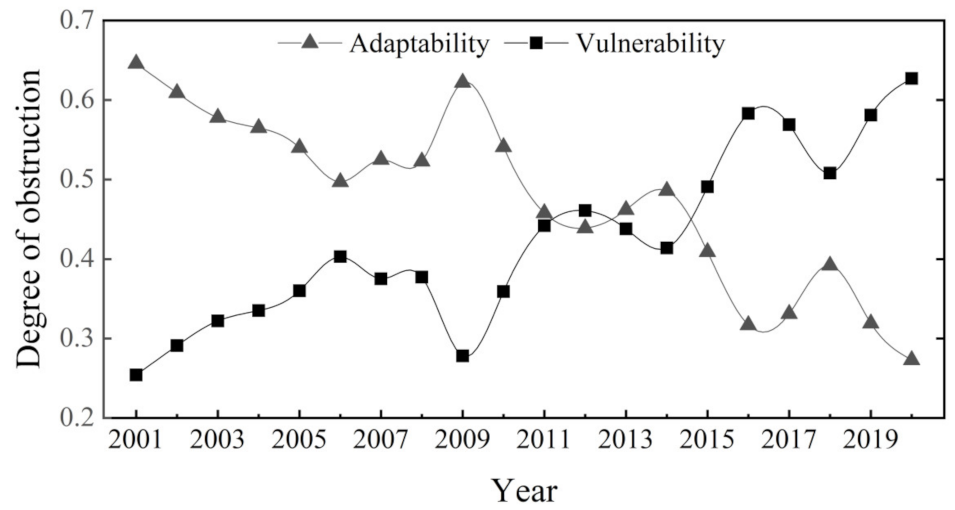
As can be seen in Figure 9, the change in the barrier to system resilience also varies between the guideline layers. During the study period, the barrier to adaptability declined significantly, while the barrier to vulnerability increased significantly. The year 2001 saw a maximum value for the barrier to adaptability (0.646) and a minimum value for the barrier to vulnerability (0.354), and 2020 saw a minimum (0.273) and a maximum (0.727) for the barrier to adaptability and the barrier to vulnerability, respectively.

4. Discussion

4.1. Changes in Basin Socio-Hydrological Adaptation and Vulnerability

The results of the change and sensitivity analysis of the indicators and evaluation targets (Table A1) show that the adaptive capacity of the socio-hydrological system in the Tarim River Basin has been mainly influenced by natural and economic adaptation over the past 20 years, while physical adaptation changes have had a significant impact on the adaptive development of the basin since 2009. (1) With the implementation of policies such as returning farmland to forest, the area of forest land has increased year by year, precipitation in the basin has increased steadily, and the background conditions of water resources have improved somewhat compared to the multi-year average [43], so the natural adaptive capacity has been significantly improved. (2) The promotion of water-saving irrigation technology has improved the economic benefits of agricultural production and the efficiency of water resources irrigation [44], while with the construction and completion of various water conservation projects in the basin, the amount of water stored in reservoirs has gradually increased, and the ability to regulate water and cope with sudden floods has been greatly improved [45]. All of this has contributed to the development of physical adaptive capacity. (3) The collective literacy of societies in the basin has increased, awareness of water conservation has increased, and social development has been good, improving the resilience of social systems to disturbance [46]. (4) The living standards of the people in the Tarim River Basin were greatly improved from 2001 to 2020, and the implementation of policies such as the Western Development and counterpart support led to the rapid development of local industries and improved the level of social and economic development.
With the rapid economic and social development of the basin, the demand for water resources in the basin has been increasing. Despite the abundant precipitation and increased water supply in the basin in the past 20 years, the supply and demand situation is still tight, water pollution is becoming increasingly serious, and the overall vulnerability of the basin’s socio-hydrological system has increased [43]. (1) Vulnerability to changes in water resources has increased, mainly due to an overall increasing trend in precipitation and water inflows during the period 2001–2020, but with high inter-annual variability and increased chances of droughts and floods [47]. (2) Social water security has improved rapidly in the past 20 years, improving the quality of life of people in society, ensuring smooth social development, and reducing vulnerability to water scarcity. (3) The decreasing closeness of water resource use indicators indicates that the density of dams in the Tarim River Basin has increased in the past 20 years, and the ability of society in the region to regulate water resources has increased, while the economic benefits of water resources have improved rapidly [48]. (4) Production activities in the basin have generated a large amount of production and domestic wastewater, causing the deterioration of water quality in the basin, resulting in water quality-based water shortages and exacerbating water scarcity [43].
The year 2009 was mainly affected by the decrease in rainfall, which led to a decrease in the adaptive capacity and increased vulnerability of the socio-hydrological system, causing an abrupt change in the resilience values. Taking 2009 as the boundary, the reduction in the vulnerability of the socio-hydrological system in the Tarim River Basin is the main cause of changes in system resilience during the period 2001–2009, and during the period 2010–2020, system resilience was mainly influenced by changes in adaptive capacity. In recent years, climate change has led to an increasing trend in water quantity in the Tarim River Basin, promoting system resilience development. Studies have shown that when water quantity is certain, indicators such as water use and water scarcity are the main factors hindering the resilient development of the system, so water endowment, water demand, and water allocation are the keys to promoting the resilient development of the socio-hydrological system.

4.2. Analysis of Barriers to Resilience in Social Hydrological Systems

In terms of indicators in the factor layer, there are one, one, and two indicators in the water resources change factor layer, the water resources scarcity factor layer, and the water pollution factor layer, respectively; there are one, three, and two indicators in the natural adaptation factor layer, the physical adaptation factor layer, and the social adaptation factor layer, respectively. In terms of the indicators in the guidelines layer, there are four indicators of vulnerability and six indicators of adaptation. On the one hand, these data show that the resilience of the socio-hydrological system in the Tarim River Basin is subject to the combined effect of vulnerability and adaptability, and on the other hand, that the resilience barrier factors mainly originate from the water pollution factor layer and the physical adaptability factor layer. The socio-economic level of the Tarim River Basin, the area of forested land, and the ecological environment have continued to improve in the past 20 years; however, the intensity of water resources exploitation and utilization is high, the proportion of water-saving irrigation coverage area is at a low level, and the water environment is experiencing a deteriorating trend [43]. Thus, there is still an urgent need to strengthen the water resources and ecological environmental protection efforts in the basin for high-quality development [49].

4.3. Shortcomings and Outlook

Based on the TOPSIS algorithm and the entropy assignment method, in this study, we introduced the random weighting method into the calculation of indicator weights. The random weighting method considers the uncertainty in the interaction of the elements in SHR. The relative distance between individual sample solutions and the optimal (inferior) solution is used to calculate the closeness of each evaluation objective to the ideal solution, to obtain the calculated value of each factor layer and criterion layer indicator, and, finally, to calculate the system toughness according to the model constructed in this paper. The barrier degree model can profile the internal factors of the system and their degree of action, and the model can also reveal the evolutionary law of SHR development from the barrier degree facets of the indicator layer, factor layer, and criterion layer. The application of the resilience criterion for SHR is limited by the fact that it depends on the thresholds of the indicators in the SHR of the study area [36]. In addition, to address the water resources issues and socio-economic issues in the study area, we focused on the evolutionary characteristics of resilience of water resources and socio-economics and the main barrier factors. Studying socio-economic resilience development from an ecological perspective will be our next step. In addition, we focused here on the main barriers to water resources and socio-economics and did not adequately consider their indirect factors. Studying the indirect influences and the impact of ecosystem change on them will be another future direction we take in our research.

5. Conclusions

Based on the construction of a system of resilience indicators for the socio-hydrological system of the Tarim River Basin, we analysed the evolutionary characteristics of the resilience of the socio-hydrological system of the Tarim River Basin and its main obstacle factors using the integrated weight TOPSIS model and the obstacle degree diagnostic model, and our conclusions are as follows:
1.
Based on entropy weighting and random weighting, the comprehensive weights of each evaluation index in the Tarim River Basin were determined.
2.
The socio-hydrological system resilience of the Tarim River Basin showed an overall upward trend from 2001 to 2020, with the resilience level mainly at the medium and good levels.
3.
The main barriers to the resilience of the socio-hydrological system in the Tarim River Basin differ from year to year. Overall, the degree of pollution of surface runoff is the main barrier factor affecting the resilience of the system; additionally, water consumption per 10,000 yuan of GDP gradually replaces wastewater discharge as the main barrier factor.
The evaluation criteria are limited by the uncertainty of the threshold values of each indicator, which limits the application of the criteria and does not fully consider the indirect influence factors and the impact of ecological transformations on the resilience of the system.

Author Contributions

Conceptualisation, A.L.; methodology, A.L. and N.P.; software, L.Z.; validation, A.L. and N.P.; formal analysis, N.P.; investigation, X.G.; resources, X.G.; data curation, N.P.; writing—original draft preparation, N.P., X.D. and A.L.; writing—review and editing, N.P. and X.D.; visualisation, X.G. and L.Z.; supervision, X.G.; project administration, A.L.; funding acquisition, A.L. All authors have read and agreed to the published version of the manuscript.

Funding

This research was supported by the Third Xinjiang Scientific Expedition Program (Grant Number 2021XJKK0406).

Institutional Review Board Statement

Not applicable.

Informed Consent Statement

Not applicable.

Data Availability Statement

Not applicable.

Conflicts of Interest

The authors declare no conflict of interest.

Appendix A

Table A1. The results of the socio-hydrological system resilience sensitivity analysis.
Range of Variation (%)Influencing Factors
X1X2X3X4X5X6X7X8X9X10X11X12X13X14X15X16
System resilience growth rate (%)−207.6207.4807.7007.5007.4707.4507.5107.8006.8807.5806.1367.5107.4307.5707.524 7.410
−107.6507.5407.6507.5507.5307.5207.5507.7007.2107.5906.9087.5607.5107.5907.563 7.500
07.6007.6007.6007.6007.6007.6007.6007.6007.6007.6007.6047.6007.6007.6007.604 7.600
107.4207.6707.5507.6707.6907.6907.6607.5108.0507.6208.2287.6607.7007.6207.646 7.720
207.2607.7407.5007.7507.7907.7807.7207.4308.5307.6308.7897.7107.8107.6407.688 7.840
307.1207.8207.4607.8307.9007.8707.7807.3509.0607.6509.2947.7807.9207.6607.730 7.970
407.0107.9007.4107.9208.0207.9607.8507.2709.6207.6709.7487.8408.0407.6907.771 8.110
506.9807.9807.3708.0308.1608.0607.9207.20010.2207.70010.1597.9208.1707.7107.811 8.250
606.8708.0707.3308.1408.3108.1507.9907.14010.8407.72010.5327.9908.3107.7407.850 8.400
Relative rate of change (%)−20−0.0700.600−0.4800.5200.6900.7700.490−0.9603.6200.1107.3400.4500.8500.1500.399 0.990
−10−0.4200.630−0.4900.5600.7500.8000.510−0.9503.9100.1206.9540.4800.8900.1600.408 1.040
00.0000.0000.0000.0000.0000.0000.0000.0000.0000.0000.0000.0000.0000.0000.000 0.000
10−1.7900.680−0.5000.6600.8700.8500.560−0.9104.4200.1406.2450.5300.9800.1800.418 1.130
20−1.7100.700−0.4900.7100.9300.8700.580−0.8804.6400.1505.9270.5501.0200.1900.420 1.180
30−1.6100.720−0.4900.7500.9900.8800.600−0.8604.8500.1605.6330.5801.0600.2000.420 1.220
40−1.4900.740−0.4800.8001.0500.9000.610−0.8305.0500.1705.3610.6001.1000.2100.419 1.260
50−1.2500.760−0.4700.8501.1100.9100.630−0.8005.2300.1905.1110.6201.1400.2200.415 1.300
60−1.2200.770−0.4600.8901.1700.9200.640−0.7805.3900.2004.8800.6501.1700.2300.410 1.330
Mean relative change (%) −1.0600.620−0.4300.6400.8400.7700.510−0.7704.1200.1405.2720.4900.9100.1700.368 1.050
Note: The multi-year average rate of change in system toughness (7.60%) calculated by the model is used as the baseline value to calculate the relative rate of change.

References

  1. Wang, H.; Wang, J.; Liu, J.; Mei, C. Analysis of urban water cycle evolution and countermeasures. J. Hydraul. Eng. 2021, 52, 3–11. [Google Scholar]
  2. Xu, Z.; Cheng, T. Basic theory for urban water management and sponge city—Review on urban hydrology. J. Hydraul. Eng. 2019, 50, 53–61. [Google Scholar]
  3. Tian, F.; Cheng, T.; Lu, Y.; Xu, Z. A review on socio-hydrology and urban hydrology. Adv. Earth Sci. 2018, 37, 46–56. [Google Scholar]
  4. Wagener, T.; Sivapalan, M.; Troch, P.A.; McGlynn, B.L.; Harman, C.J.; Gupta, H.V.; Kumar, P.; Rao, P.S.C.; Basu, N.B.; Wilson, J.S. The future of hydrology: An evolving science for a changing world. Water Resour. Res. 2010, 46, 8906. [Google Scholar] [CrossRef]
  5. Sivapalan, M.; Savenije, H.H.G.; Bloschl, G. Socio-hydrology: A new science of people and water. Hydrol. Processes 2012, 26, 1270–1276. [Google Scholar] [CrossRef]
  6. Montanari, A.; Young, G.; Savenije, H.H.G.; Hughes, D.; Wagener, T.; Ren, L.L.; Koutsoyiannis, D.; Koutsoyiannis, D.; Cudennec, C.; Toth, E.; et al. “Panta Rhei-Everything Flows”: Change in hydrology and society-The IAHS Scientific Decade 2013–2022. Hydrol. Sci. J. 2013, 58, 1256–1275. [Google Scholar] [CrossRef]
  7. Jimenez-Cisneros, B. Responding to the challenges of water security: The Eighth Phase of the International Hydrological Programme, 2014–2021. In 11th Kovacs Colloquium on Hydrological Sciences and Water Security: Past, Present and Future; UNESCO: Paris, France, 2014. [Google Scholar]
  8. Du, E.; Tian, Y.; Cai, X.; Zheng, Y.; Li, X.; Zheng, C. Exploring spatial heterogeneity and temporal dynamics of human-hydrological interactions in large river basins with intensive agriculture: A tightly coupled, fully integrated modeling approach. J. Hydrol. 2020, 591, 125313. [Google Scholar] [CrossRef]
  9. Loch, A.; Adamson, D.; Mallawaarachchi, T. Role of hydrology and economics in water management policy under increasing uncertainty. J. Hydrol. 2014, 518, 5–16. [Google Scholar] [CrossRef]
  10. Reddy, V.R.; Syme, G.J. Social sciences and hydrology: An introduction. J. Hydrol. 2014, 518, 1–4. [Google Scholar] [CrossRef]
  11. Herrera-Franco, G.; Montalván-Burbano, N.; Carrión-Mero, P.; Bravo-Montero, L. Worldwide Research on Socio-Hydrology: A Bibliometric Analysis. Water 2021, 13, 1283. [Google Scholar] [CrossRef]
  12. Liangqing, X.; Fan, Y.; Changbing, Y.; Luochen, Z.; Guanghui, W.; Xinfang, C. Sensitivity analysis of the streamflow alteration subjected to climate changes and anthropogenic activities in the Tarim River Basin. J. Hohai Univ. 2018, 46, 1–6. Available online: https://kns.cnki.net/kcms/detail/detail.aspx?FileName=HHDX201801001&DbName=CJFQ2018 (accessed on 5 May 2022).
  13. Keilholz, P.; Disse, M.; Halik, U. Effects of Land Use and Climate Change on Groundwater and Ecosystems at the Middle Reaches of the Tarim River Using the MIKE SHE Integrated Hydrological Model. Water 2015, 7, 3040–3056. [Google Scholar] [CrossRef] [Green Version]
  14. Xue, L.; Yang, F.; Yang, C.; Luochen, Z.; Zhang, L.; Chi, Y.; Yang, G. Identification of potential impacts of climate change and anthropogenic activities on streamflow alterations in the Tarim River Basin, China. Sci. Rep. 2017, 7, 1–12. [Google Scholar] [CrossRef] [PubMed]
  15. Mohammed, I.N.; Bolten, J.D.; Souter, N.J.; Shaad, K.; Vollmer, D. Diagnosing challenges and setting priorities for sustainable water resource management under climate change. Sci. Rep. 2022, 12, 1–15. [Google Scholar] [CrossRef] [PubMed]
  16. Mao, F.; Clark, J.; Karpouzoglou, T.; Dewulf, A.; Buytaert, W.; Hannah, D. HESS Opinions: A conceptual framework for assessing socio-hydrological resilience under change. Hydrol. Earth Syst. Sci. 2017, 21, 3655–3670. [Google Scholar] [CrossRef] [Green Version]
  17. Eslamian, S.; Reyhani, M.N.; Syme, G. Building socio-hydrological resilience: From theory to practice. J. Hydrol. 2019, 575, 930–932. [Google Scholar] [CrossRef]
  18. Jaramillo, L.V.; Stone, M.C.; Morrison, R.R. An indicator-based approach to assessing resilience of socio-hydrologic systems in Nepal to hydropower development. J. Hydrol. 2018, 563, 1111–1118. [Google Scholar] [CrossRef]
  19. Dewulf, A.; Karpouzoglou, T.; Warner, J.; Wesselink, A.; Mao, F.; Vos, J.; Tamas, P.; Groot, A.E.; Heijmans, A.; Ahmed, F.; et al. The power to define resilience in social-hydrological systems: Toward a power-sensitive resilience framework. Water 2019, 6, 14. [Google Scholar] [CrossRef] [Green Version]
  20. Hund, S.V.; Allen, D.M.; Morillas, L.; Johnson, M.S. Groundwater recharge indicator as tool for decision makers to increase socio-hydrological resilience to seasonal drought. J. Hydrol. 2018, 563, 1119–1134. [Google Scholar] [CrossRef]
  21. Horn, F.; Elagib, N.A. Building socio-hydrological resilient cities against flash floods: Key challenges and a practical plan for arid regions. J. Hydrol. 2018, 564, 125–132. [Google Scholar] [CrossRef]
  22. Hough, M.; Pavao-Zuckerman, M.A.; Scott, C.A. Connecting plant traits and social perceptions in riparian systems: Ecosystem services as indicators of thresholds in social-ecohydrological systems. J. Hydrol. 2018, 566, 860–871. [Google Scholar] [CrossRef]
  23. Yuan, Y.; Bai, Z.; Zhang, J.; Xu, C. Increasing urban ecological resilience based on ecological security pattern: A case study in a resource-based city. Ecol. Eng. 2022, 175, 106486. [Google Scholar] [CrossRef]
  24. Chen, Y.; Su, X.Y.; Zhou, Q. Study on the Spatiotemporal Evolution and Influencing Factors of Urban Resilience in the Yellow River Basin. Int. J. Environ. Res. Public Health 2021, 18, 10231. [Google Scholar] [CrossRef] [PubMed]
  25. Liu, F.; Zhang, H.; Qin, Y.; Dong, J.; Xu, E.; Yang, Y.; Zhang, G.; Xiao, X. Semi-natural areas of Tarim Basin in northwest China: Linkage to desertification. Sci. Total Environ. 2016, 573, 178–188. [Google Scholar] [CrossRef]
  26. Zuo, J.; Xu, J.; Chen, Y.; Li, W. Downscaling simulation of groundwater storage in the Tarim River basin in northwest China based on GRACE data. Phys. Chem. Earth 2021, 123, 103042. [Google Scholar] [CrossRef]
  27. Liu, Y.; Tian, F.; Hu, H.; Sivapalan, M. Socio-hydrologic perspectives of the co-evolution of humans and water in the Tarim River basin, Western China: The Taiji-Tire model. Hydrol. Earth Syst. Sci. 2014, 18, 1289–1303. [Google Scholar] [CrossRef] [Green Version]
  28. Li, W.; Huang, F.; Shi, F.; Wei, X.; Zamanian, K.; Zhao, X. Human and climatic drivers of land and water use from 1997 to 2019 in Tarim River basin, China. Int. Soil Water Conserv. Res. 2021, 9, 532–543. [Google Scholar] [CrossRef]
  29. Babel, M.S.; Pandey, V.P.; Rivas, A.A.; Wahid, S.M. Indicator-Based Approach for Assessing the Vulnerability of Freshwater Resources in the Bagmati River Basin, Nepal. Environ. Manag. 2011, 48, 1044–1059. [Google Scholar] [CrossRef]
  30. Folke, C. Resilience: The emergence of a perspective for social-ecological systems analyses. Glob. Environ. Change 2006, 16, 253–267. [Google Scholar] [CrossRef]
  31. Eakin, H.C.; Lemos, M.C.; Nelson, D.R. Differentiating capacities as a means to sustainable climate change adaptation. Glob. Environ. Change-Hum. Policy Dimens. 2014, 27, 1–8. [Google Scholar] [CrossRef]
  32. Dardonville, M.; Bockstaller, C.; Therond, O. Review of quantitative evaluations of the resilience, vulnerability, robustness and adaptive capacity of temperate agricultural systems. J. Clean. Prod. 2021, 286, 14. [Google Scholar] [CrossRef]
  33. Keck, M.; Sakdapolrak, P. What is Social Resilience? Lessons Learned and Ways Forward. Erdkunde 2013, 67, 5–19. [Google Scholar]
  34. Na, W.; Zhao, Z.C. The comprehensive evaluation method of low-carbon campus based on analytic hierarchy process and weights of entropy. Environ. Dev. Sustain. 2021, 23, 9308–9319. [Google Scholar] [CrossRef]
  35. Li, Y.; Sun, M.; Yuan, G.; Zhou, Q.; Liu, J. Study on Development Sustainability of Atmospheric Environment in Northeast China by Rough Set and Entropy Weight Method. Sustainability 2019, 11, 3793. [Google Scholar] [CrossRef] [Green Version]
  36. Yao, J.; Wang, G.; Xue, W.; Yao, Z.; Xue, B. Assessing the Adaptability of Water Resources System in Shandong Province, China, Using a Novel Comprehensive Co-evolution Model. Water Resour. Manag. 2019, 33, 657–675. [Google Scholar] [CrossRef]
  37. Galik, A.; Bąk, M.; Bałandynowicz-Panfil, K.; Cirella, G.T. Evaluating Labour Market Flexibility Using the TOPSIS Method: Sustainable Industrial Relations. Sustainability 2022, 14, 526. [Google Scholar] [CrossRef]
  38. Shen, Z.Y.; Zhao, Q.Q.; Fang, Q.M. Analysis of Green Traffic Development in Zhoushan Based on Entropy Weight TOPSIS. Sustainability 2021, 13, 8109. [Google Scholar] [CrossRef]
  39. Wei, L.Y.; Zhang, Y.; Wang, L.; Cheng, Z.; Wu, X. Obstacle Indicators Diagnosis and Advantage Functions Zoning Optimization Based on “Production-Living-Ecological” Functions of National Territory Space in Jilin Province. Sustainability 2022, 14, 4215. [Google Scholar] [CrossRef]
  40. Bai, X.; Jin, J.; Zhou, R.; Wu, C.; Zhou, Y.; Zhang, L.; Cui, Y. Coordination evaluation and obstacle factors recognition analysis of water resource spatial equilibrium system. Environ. Res. 2022, 210, 112913. [Google Scholar] [CrossRef]
  41. Guoqiang., L.; Shuo, K. Cost-utility analysis of atelelizumab in combination with standard chemotherapy regimens for the treatment of extensive stage small cell lung cancer. China Pharm. 2021, 32, 77–81. [Google Scholar]
  42. Li, Z.; Hu, Y.; Liu, Q.; Liu, S. Early Warning Evaluation and Simulation Analysis of Resources and Environmental Carrying Capacity in Inland Arid Regions: An Empirical Analysis from Ningxia. Ecol. Econ. 2021, 37, 209–215. [Google Scholar]
  43. Meng, L.; Liu, Y.; Ma, W.; Wang, Q.; Mo, X.; Tian, J. Variable fuzzy evaluation model for water resources carrying capacity in the Tarim River Basin, China. Water Supply 2022, 22, 1445–1458. [Google Scholar] [CrossRef]
  44. Chen, H.; Gao, Z.; Zeng, W.; Liu, J.; Tan, X.; Han, S.; Wang, S.; Zhao, Y.; Yu, C. Scale Effects of Water Saving on Irrigation Efficiency: Case Study of a Rice-Based Groundwater Irrigation System on the Sanjiang Plain, Northeast China. Sustainability 2018, 10, 47. [Google Scholar] [CrossRef] [Green Version]
  45. Xu, W. Study on Multi-Objective Operation Strategy for Multi-Reservoirs in Small-Scale Watershed Considering Ecological Flows. Water Resour. Manag. 2020, 34, 4725–4738. [Google Scholar] [CrossRef]
  46. Wang, W.; Zhao, X.; Zhang, M.; Li, H.; Lan, H.; Shi, Y. Public perception of water resources and water-saving intention in arid inland riverbasins of northwestern China: A case study of the Hexi Corridor in Gansu Province. China Popul. Resour. Environ. 2019, 29, 148–157. [Google Scholar]
  47. Zhu, Y.X.; Zhu, Y.; Sang, Y.-F.; Chen, D.; Sivakumar, B.; Li, D. Effects of the South Asian summer monsoon anomaly on interannual variations in precipitation over the South-Central Tibetan Plateau. Environ. Res. Lett. 2020, 15, 124067. [Google Scholar] [CrossRef]
  48. Wang, P. Study on the Utilization Efficiency of Agricultural Water Resources and the Economic Benefit of Famers’ Irrigation in Xinjiang; Xinjiang Agricultural University: Xinjiang, China, 2016. [Google Scholar]
  49. Zhao, J.Y. Multi-dimensional Perspectives and Differentiated Strategies of Basin-Scale Water Ecological Conservation and Restoration. Landsc. Archit. Front. 2021, 9, 8–11. [Google Scholar] [CrossRef]
Figure 1. Flowchart for the specific organisation of this work.
Sustainability 14 07571 g001
Figure 2. Geographical location map of the Tarim River Basin.
Sustainability 14 07571 g002
Figure 3. Adaptation capacity of social hydrological system in the Tarim River Basin.
Sustainability 14 07571 g003
Figure 4. Closeness degree of each factor index; Each subplot represents in turn the resource (a), physical (b), social (c) and economic (d) subsystem proximity values and the amount of change.
Sustainability 14 07571 g004
Figure 5. Vulnerability of social hydrological system in the Tarim River Basin.
Sustainability 14 07571 g005
Figure 6. Closeness degree of each factor index; Each subplot represents, in turn, the water resources change (a), water resources scarcity (b), water resources use (c), and water resources pollution (d) subsystem proximity values and the amount of change.
Sustainability 14 07571 g006
Figure 7. Resilience of social hydrological system in the Tarim River Basin; The I–IV represents the level of systemic tensile tension, in the order of good, moderate, low and poor.
Sustainability 14 07571 g007
Figure 8. Degree of resilience barriers to socio-hydrological systems by factor-level indicators; (a) and (b) represent, in turn, the characteristics of changes in the degree of obstruction of the indicators to which both adaptability and vulnerability belong.
Sustainability 14 07571 g008
Figure 9. The social toughness criterion layer hydrology system obstacle degree change trend.
Sustainability 14 07571 g009
Table 1. A vulnerability assessment index system for the resilience of the Tarim River Basin hydrological system.
Factor LevelIndicator LevelCalculation MethodProperties
Water resource changesCoefficient of variation of rainfall (X1)(Annual precipitation − Average annual precipitation)/Average annual precipitation+
Water scarcityPercentage of population with unsafe drinking water (X2)Number of people with non-safe drinking water/Total population+
Water consumption per capita (X3)Total water consumption/Total population+
Water useDam density (X4)Number of dams/Total land area
Rate of water resource development (X5)Total water resources development and use/Total water resources+
Water consumption per 10,000 yuan GDP (X6)Total water consumption/Total GDP+
Water pollutionLevel of contamination of surface runoff (X7)Effluent discharge/Surface water resources+
Wastewater discharge (X8)Total annual wastewater discharge+
Note: “(+)” is a positive index, indicating that the higher the target value, the higher the vulnerability development of the system; “(−)” is a negative index, indicating that the smaller the target value, the lower the vulnerability development of the system.
Table 2. An index system for evaluating the resilience adaptation of the Tarim River Basin hydrological system.
Factor LevelIndicator LevelCalculation MethodProperties
Natural adaptabilityTotal water resources (X9)Natural resources such as rainfall, runoff, and snow+
Vegetation cover (X10)Area of vegetation cover/total area of the region+
Physical adaptabilityWater-saving irrigation coverage (X11)Water-saving irrigated area/effective irrigated area+
Water infrastructure investment (X12)Total annual investment in water infrastructure+
Reservoir storage capacity (X13)Annual reservoir storage capacity+
Social adaptabilityEducational level (X14)High school enrolment/primary school enrolment+
Percentage of economically active population (X15)1 − Urban unemployment rate+
Economic adaptabilityGDP per capita index (X16) ln A n n u a l   i n c o m e   p e r   c a p i t a M i n i m u m   a v e r a g e   a n n u a l   i n c o m e ln M a x i m u m   a v e r a g e   a n n u a l   i n c o m e M a x i m u m   a v e r a g e   a n n u a l   i n c o m e +
Note: “(+)” is a positive index, indicating that the higher the target value, the higher the vulnerability development of the system.
Table 3. Resilience index range of social hydrological system.
GradeRange of Resilience IndicesDescription
(1, +∞)Good
(0.5, 1)Moderate
(0.3, 0.50)Poor
(0, 0.3)Worse
Table 4. Vulnerability indicator weights for the Tarim River Basin.
Factor LevelWeightIndicator LevelWeightRanking
Water resource changes0.056Coefficient of variation of rainfall (X1)0.05613
Water scarcity0.114Percentage of population with unsafe drinking water (X2)0.0705
Water consumption per capita (X3)0.04416
Water use0.189Dam density (X4)0.0657
Rate of water resource development (X5)0.05215
Water consumption per 10,000 yuan GDP (X6)0.0724
Water pollution0.141Level of contamination of surface runoff (X7)0.0666
Wastewater discharge (X8)0.0761
Table 5. Tarim River Basin adaptability indicator weights.
Factor LevelWeightIndicator LevelWeightRanking
Natural adaptability0.119Total water resources (X9)0.05810
Vegetation cover (X10)0.0658
Physical adaptability0.196Water-saving irrigation coverage (X11)0.05614
Water infrastructure investment (X12)0.0733
Reservoir storage capacity (X13)0.05711
Social adaptability0.116Educational level (X14)0.05612
Percentage of economically active population (X15)0.0609
Economic adaptability0.069GDP per capita index (X16)0.0692
Table 6. Main obstacle factors of social hydrological system resilience in the Tarim River Basin.
Barrier FactorsX7X11X1X2X8X10X12X13X14X15
Frequency (times)17161515151515151414
Entry frequency0.850.800.750.750.750.750.750.750.700.70
Table 7. Main obstacle factors and degree of social hydrological system resilience.
Year12345Total
Barrier FactorDegree of ObstructionBarrier FactorDegree of ObstructionBarrier FactorDegree of ObstructionBarrier FactorDegree of ObstructionBarrier FactorDegree of Obstruction
2001X80.112X120.108X160.106X130.098X100.0950.519
2002X80.126X120.120X160.116X100.102X70.0990.563
2003X80.110X120.108X160.105X70.097X100.0880.508
2004X80.122X120.108X70.098X160.091X100.0840.503
2005X80.117X70.106X120.106X100.081X40.0780.488
2006X80.102X70.094X120.093X10.082X130.0760.447
2007X80.099X120.092X70.090X160.075X100.0720.428
2008X80.090X40.087X120.084X160.077X150.0760.414
2009X130.093X160.091X150.090X10.084X90.0820.439
2010X110.107X150.101X40.095X60.087X120.0870.477
2011X110.095X60.091X20.085X40.085X150.0800.435
2012X20.126X60.118X40.114X130.083X70.0760.517
2013X20.137X60.135X110.100X130.072X70.0720.516
2014X20.127X60.124X130.107X110.103X10.0910.552
2015X20.149X60.143X110.115X130.083X70.0690.561
2016X20.203X60.189X110.127X70.096X50.0680.683
2017X20.201X60.194X110.157X50.078X70.0650.695
2018X20.195X60.192X110.173X90.100X30.0720.732
2019X60.193X20.193X110.157X90.082X10.0750.700
2020X60.222X20.218X110.188X90.081X10.0690.779
Publisher’s Note: MDPI stays neutral with regard to jurisdictional claims in published maps and institutional affiliations.