Article

Applicability Assessment of Active Safety Systems for Motorcycles Using Population-Based Crash Data: Cross-Country Comparison among Australia, Italy, and USA

1
Department of Biomedical Engineering and Mechanics, Virginia Tech, Blacksburg, VA 24061, USA
2
Department of Industrial Engineering—DIEF, University of Florence, Via di S. Marta, 3, 50139 Florence, Italy
3
Accident Research Centre, Monash University, Clayton, VIC 3800, Australia
*
Author to whom correspondence should be addressed.
This author has passed away.
Sustainability 2022, 14(13), 7563; https://doi.org/10.3390/su14137563
Submission received: 20 April 2022 / Revised: 31 May 2022 / Accepted: 10 June 2022 / Published: 21 June 2022

Abstract

:
The role of powered two-wheeler (PTW) transport from the perspective of a more sustainable mobility system is undermined by the associated high injury risk due to crashes. Motorcycle-based active safety systems promise to avoid or mitigate many of these crashes suffered by PTW riders. Despite this, most systems are still only in the prototype phase and understanding which systems have the greatest chance of reducing crashes is an important step in prioritizing their development. Earlier studies have examined the applicability of these systems to individual crash configurations, e.g., rear-end vs. intersection crashes. However, there may be large regional differences in the distribution of PTW crash configurations, motorcycle types, and road systems, and hence in the priority for the development of systems. The study objective is to compare the applicability of five active safety systems for PTWs in Australia, Italy, and the US using real-world crash data from each region. The analysis found stark differences in the expected applicability of the systems across the three regions. ABS generally resulted in the most applicable system, with estimated applicability in 45–60% of all crashes. In contrast, in 20–30% of the crashes in each country, none of the safety systems analyzed were found to be applicable. This has important implications for manufacturers and researchers, but also for regulators, which may demand country-specific minimum performance requirements for PTW active safety countermeasures.

1. Introduction

Motorcycles and mopeds—also called powered two-wheelers (PTWs)—play an increasingly important role in personal mobility in several countries. In the state of Victoria, Australia, from 2007 to 2012, the number of registered motorcycles increased by 30.6% (from 122,825 to 160,390), while passenger vehicle registrations increased by only 9.2% over the same period [1,2]. Similarly, there have been large increases in PTW numbers in Sweden (+50% from 2000 to 2013) [3] and Italy (+44% from 2004 to 2016) [4]. However, this large increase in registered PTWs increases the effect of the dangerous nature of these types of vehicles [5].
Despite their many advantages (e.g., low cost, minimum space occupation, and fuel efficiency) the risk of PTW riders and passengers suffering serious and fatal injuries is much greater than that of passenger car occupants: in Australia, fatality and serious injury rates per kilometer are 29 and 37 times higher for a PTW rider, respectively, than for other vehicle types [6,7]. Furthermore, the comparison between the number of PTW riders killed and the percentage of motorcycles in the fleet highlights the dangerous nature of PTWs: in the state of Victoria, Australia, motorcyclists represented 12.0% of people killed in road crashes in 2014, despite PTWs comprising only 3.9% of the registered vehicle fleet [8,9]. Similar results were found in the United States and Italy, where the accident statistics show that PTW riders or passengers represent, respectively, 11.8% and 25.3% of people killed on the roads, although motorcycles represent only 2.8% to 13.1% of the total [10,11]. New developments in road safety are required to reverse this trend by reducing PTW rider risk.
The increasing prevalence and effectiveness of active safety systems, e.g., electronic stability control [12], has greatly improved the safety of passenger cars. However, many factors, such as the unstable nature of PTWs and the increased influence of external forces, make the development of active safety systems for PTWs more challenging. The European Transport Safety Council (ETSC) has noted that, while design and construction improvements in cars have contributed to reductions in deaths, this has not been the case for motorcycles [13]. This lack of development could explain why, while road death numbers are generally declining, the deaths among motorcyclists have increased over the last decade in the European Union [14]. Many studies have proven the potential effectiveness of PTW active safety systems in avoiding PTW crashes or reducing their resulting injuries [15,16,17,18], but, at the same time, the improvements and the implementations of these systems have become increasingly difficult, both from a technical and economic point of view. To address these challenges, in recent years it has become increasingly important to perform applicability assessment studies. They make it possible to evaluate whether a safety system would apply to a crash based on crash features such as the crash configuration: “The active safety system X would have been applied in the accident scenario Y”. Therefore, applicability studies represent the starting point of efficient effectiveness studies, determining the systems on which it would be most beneficial to concentrate the available economic resources in terms of safety system research (effectiveness analysis that consider the benefits following the systems’ activation—e.g., [19,20]) and development (market penetration facilities and physical limits improvements).
Previous research has estimated the applicability of PTW active safety systems as a function of crash scenarios in Australia [21]. However, how these results can be generalized to other regions of the world is unknown. Several factors may result in regional differences in countermeasure applicability, such as the primary use of PTWs, the composition of the PTW fleet, the road system, and the traffic conditions. Each of these factors may directly impact the applicability and priority of the proposed active safety systems. There is a need for a multi-region applicability study to identify needs, opportunities, and priorities for PTW active safety systems development worldwide.
This study aims to assess and compare the applicability of five promising PTW active safety systems [22] in the Australian, Italian, and US PTW fleets, using real-world crash data from each region. The systems considered are: antilock braking systems (ABS), motorcycle autonomous emergency braking (MAEB), collision warning, curve warning, and curve assist. The new proposed approach aims to determine which systems have the greatest chance of reducing crashes and how differences between countries that influence system applicability could lead to region-specific priorities for developing systems.

2. Materials and Methods

Country-specific applicability for each system, alone and in combination, was estimated using three real-world crash databases containing crash data from Australia, Italy, and the US. In addition, using the approach developed in an earlier Australian study [21], it was possible to compare the results with those obtained from the analysis of the Australian Road Crash Information System (RCIS) database. The new proposed approach is one of the first methods to allow an applicability comparison among datasets originally characterized using different standards.

2.1. Settings: USA, Prato (IT), and Victoria (AUS)

Data for this study were taken from three different regions: the state of Victoria (Australia), the Municipality of Prato (Italy), and the United States of America (USA). Some characteristics of the three regions are shown in Table 1.
As of December 2014, the state of Victoria had an estimated population of 5.8 million [23] and presented 4,483,098 registered vehicles (773 vehicles per 1000 persons) [8]. The operator must be at least 18 years of age to hold a motorcycle learner’s permit [9]. Likewise, as of December 2018, the Municipality of Prato had a population of 190,000 with 154,557 registered vehicles, i.e., 813 vehicles per 1000 persons [24]. To hold a moped or motorcycle license, the operator must be at least 14 years old or 18 years old, respectively. In 2018, the United States had a population of 327 million, with a fleet of 297 million vehicles (909 vehicles per 1000 persons) [25]. Each state has its own rules, but generally, a PTW license can be obtained from 16 years of age in the US.
One major difference among the three regions is the higher prevalence of PTWs present in Prato (and Italy (Appendix A Table A1)) compared to the US and Victoria (Table 1, middle section), although the ratio between the number of registered vehicles and the population is similar for all three regions (Victoria = 0.77; Prato = 0.81; US = 0.91). In 2018, 11.7% of Prato’s fleet of vehicles were PTWs (18,080), and the percentages for the wider contexts of Tuscany (the region that contains the Municipality of Prato) and Italy were similar: 15.8% and 13.1%, respectively [10,24]. In contrast, in the state of Victoria (2011) and the US (2018), only 3.9% and 2.8%, respectively, of registered vehicles were PTWs [8,26]. These differences in PTW prevalence and use are likely to be greater than estimated based on registered vehicle numbers, since for countries such as the US and Australia, motorcycles are more often not the user’s primary motor vehicle for transport. For example, in Victoria, Australia, it is estimated that less than 1% of vehicles actually in traffic are motorcycles [27].
The lower part of Table 1 also highlights the high risk of PTW riders and passengers suffering fatal crashes worldwide, with fatally injured PTW riders/passengers in the United States (from 2016 to 2018) representing 11.8% (4181) of the total crash fatalities, despite PTW crashes representing only 1.2% (82,124) of the total crashes [25]. The same dangerous nature of PTWs is also found in Italy: even if, in 2018, only 14.2% (24,550) of total crashes were PTW crashes, the PTW riders or passengers killed in crashes represented 25.3% (844) of the people killed in all crashes—see also Appendix A Table A1 [10]. Since the Australian database contains only crashes with seriously injured people [28], to avoid possible bias, the relative occurrence was not calculated (“% PTW crashes (w.r.t. all crashes)” of Table 1).
The statistical validity of PTWs’ higher risk of being involved in a crash and the riders’ higher risk of being killed was assessed using a two-proportion Z-test with p < 0.01. The null hypothesis “there is no difference being involved in a crash between PTWs and other vehicles” and “there is no difference being killed during a crash between PTWs and other vehicle drivers” were both rejected. The greater risk of PTWs being involved in a crash and of riders being killed was found to be statistically significant (p < 0.01) for all three regions. It was not possible to reject the null hypothesis for the Prato region, as there were no people killed in a PTW crash in 2018.

2.2. Data Sources: CRSS, Prato-X, and MICIMS Database

The active safety systems applicability assessment was carried out based on real-world crashes contained in the Australian Managing Increasing Challenges in Motorcycle Safety (MICIMS) database from Victoria, the new Prato-X database from Italy, and the US’ Crash Reporting Sampling System (CRSS) database. Table 2 lists the main characteristics of the three datasets.
The Australian dataset, MICIMS, contained 235 PTW crashes from 2012 to 2014 that occurred on urban and rural roads in Victoria. MICIMS includes only crashes where motorcycle riders were non-fatally injured and admitted to one of the hospitals within the study area. A description of the characteristics of the MICIMS database can be found in previous studies [29,30]. The Prato-X database comprises data provided by the Prato Police for the 294 PTW crashes that occurred in the urban area of the Municipality of Prato during 2018. For each crash, the police collected information regarding the crash circumstances, the environment, the vehicles, and the people involved. The US Crash Report Sampling System (CRSS) is a nationally representative sample of all police-reported crashes in the US. Case weight values were assigned to each sample, following the national estimates procedure [25], to estimate the national incidence of each crash type. The CRSS comprised 6088 PTW cases from the years 2016 to 2018. To better compare with Prato-X (which contains exclusively urban crashes), only PTW crashes that occurred on urban roads were extracted from the CRSS dataset. An estimated total of 265,361 US PTW crashes was obtained after applying the CRSS sampling weights. The results obtained from the analysis of these three datasets were also compared with the applicability results obtained from the analysis of the crashes that occurred in the state of Victoria between 2001 and 2011 and were contained in the Road Crash Information System (RCIS) [21].

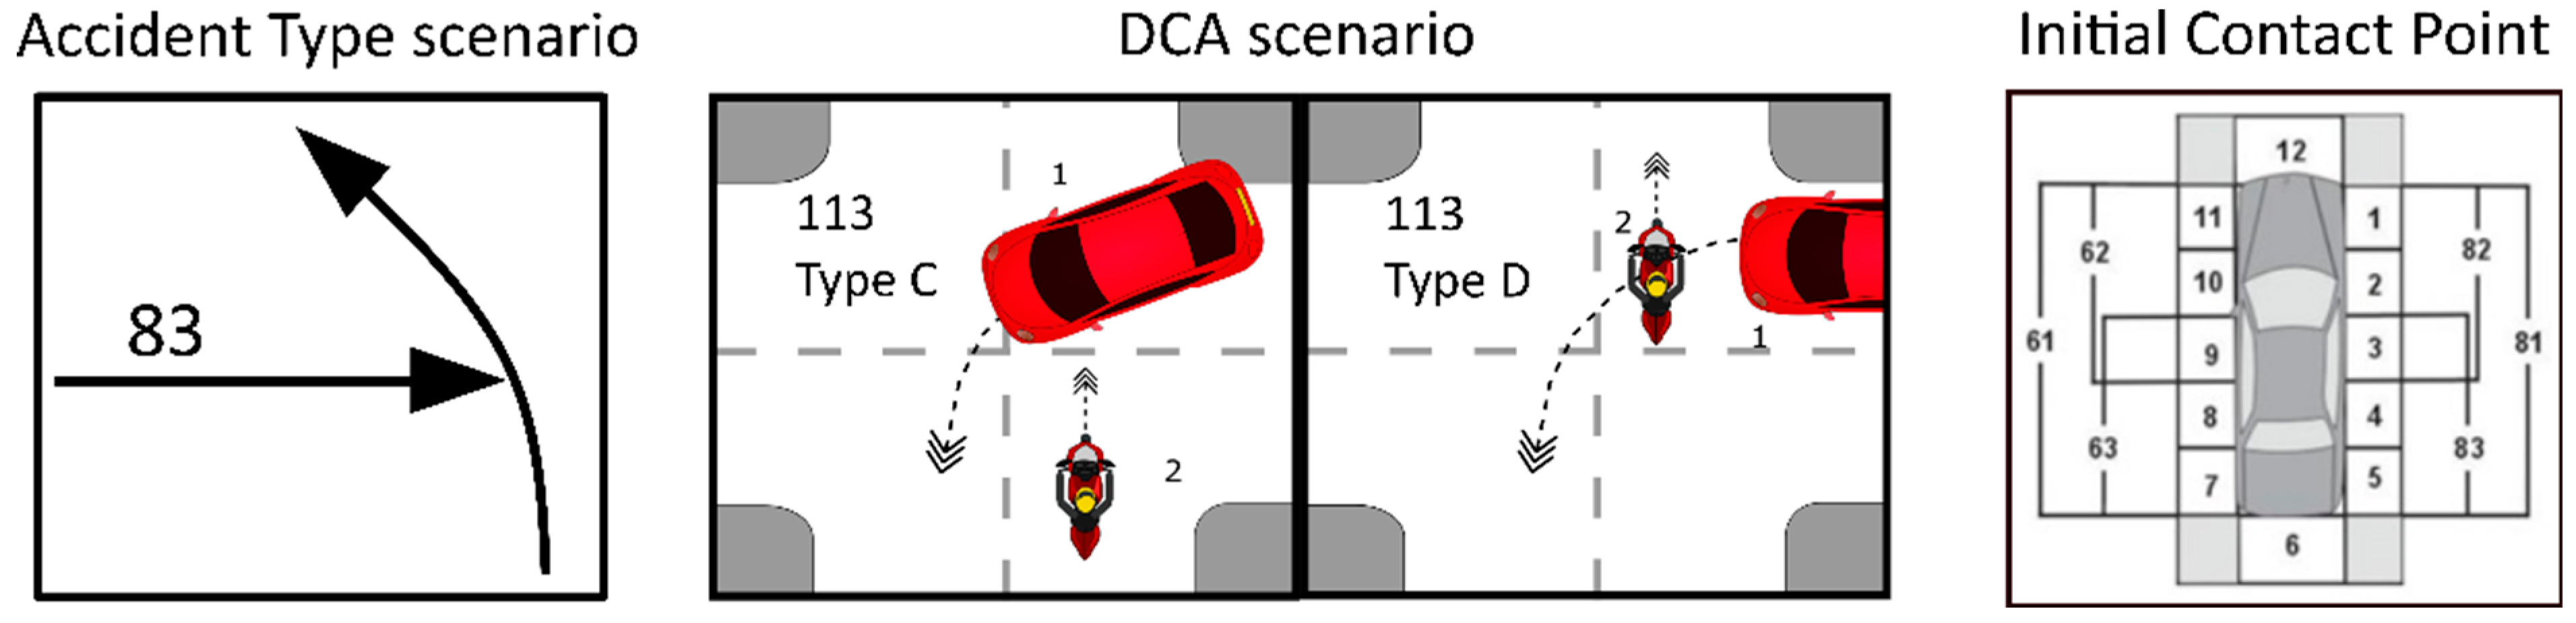
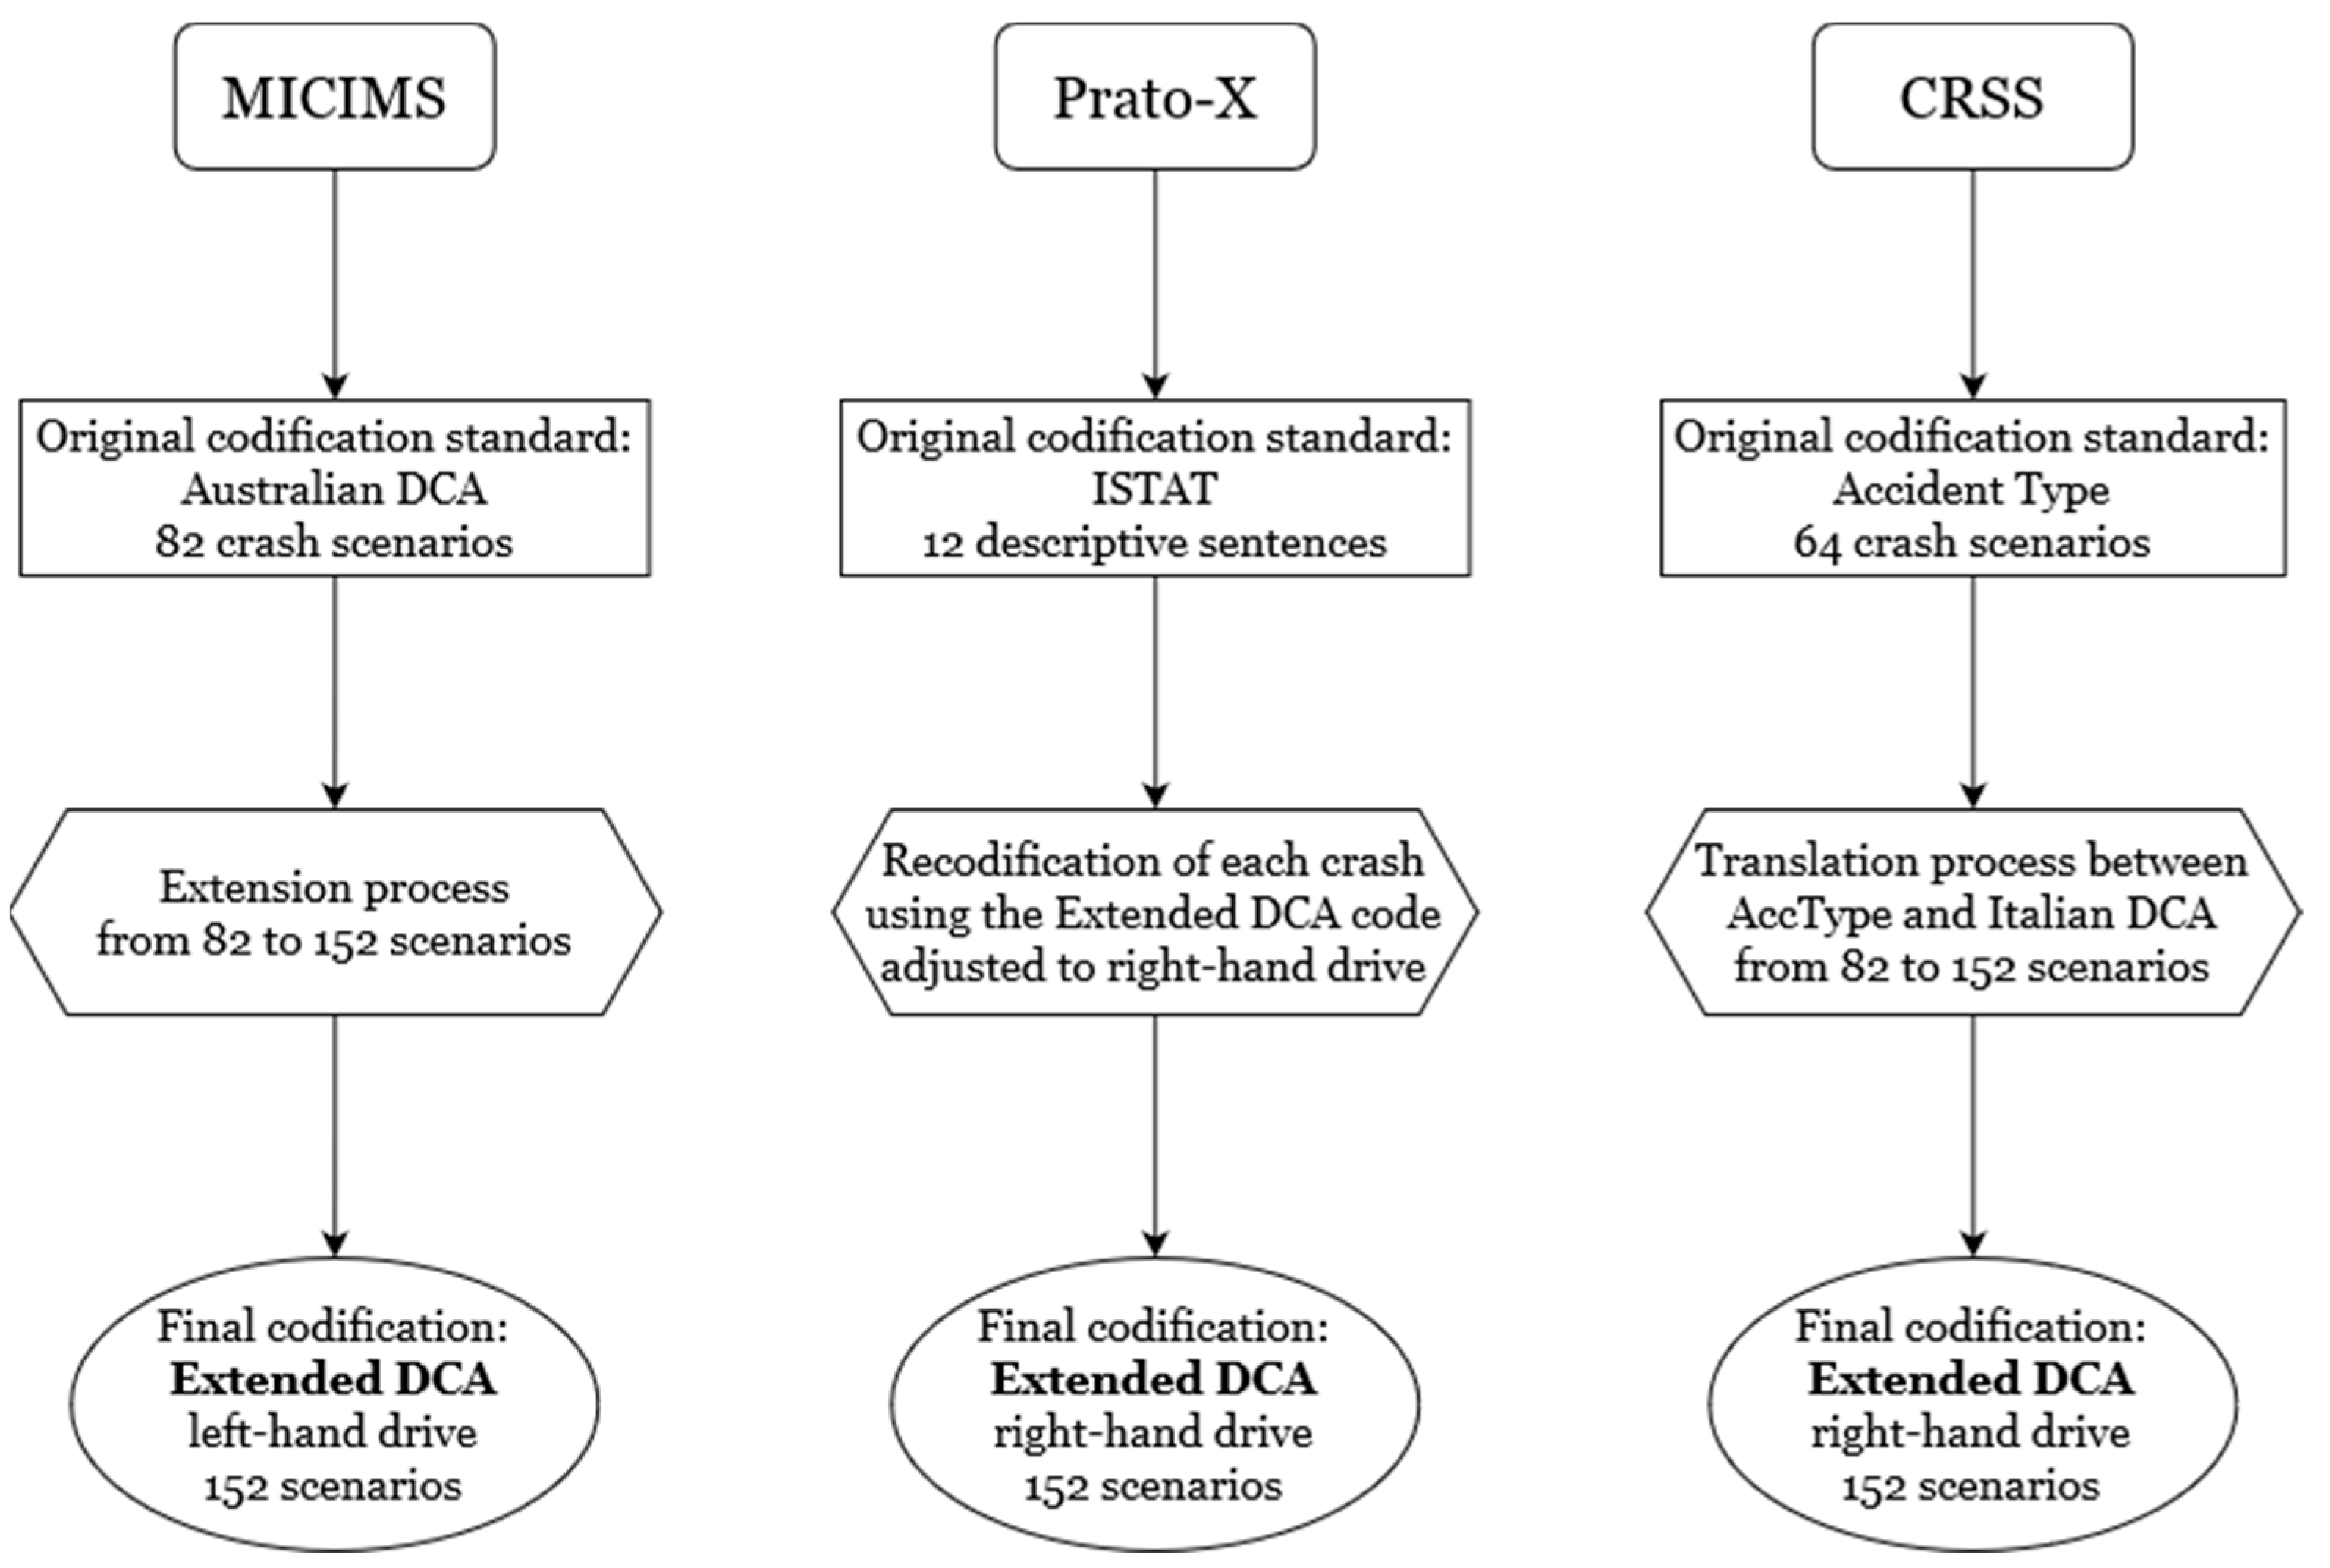
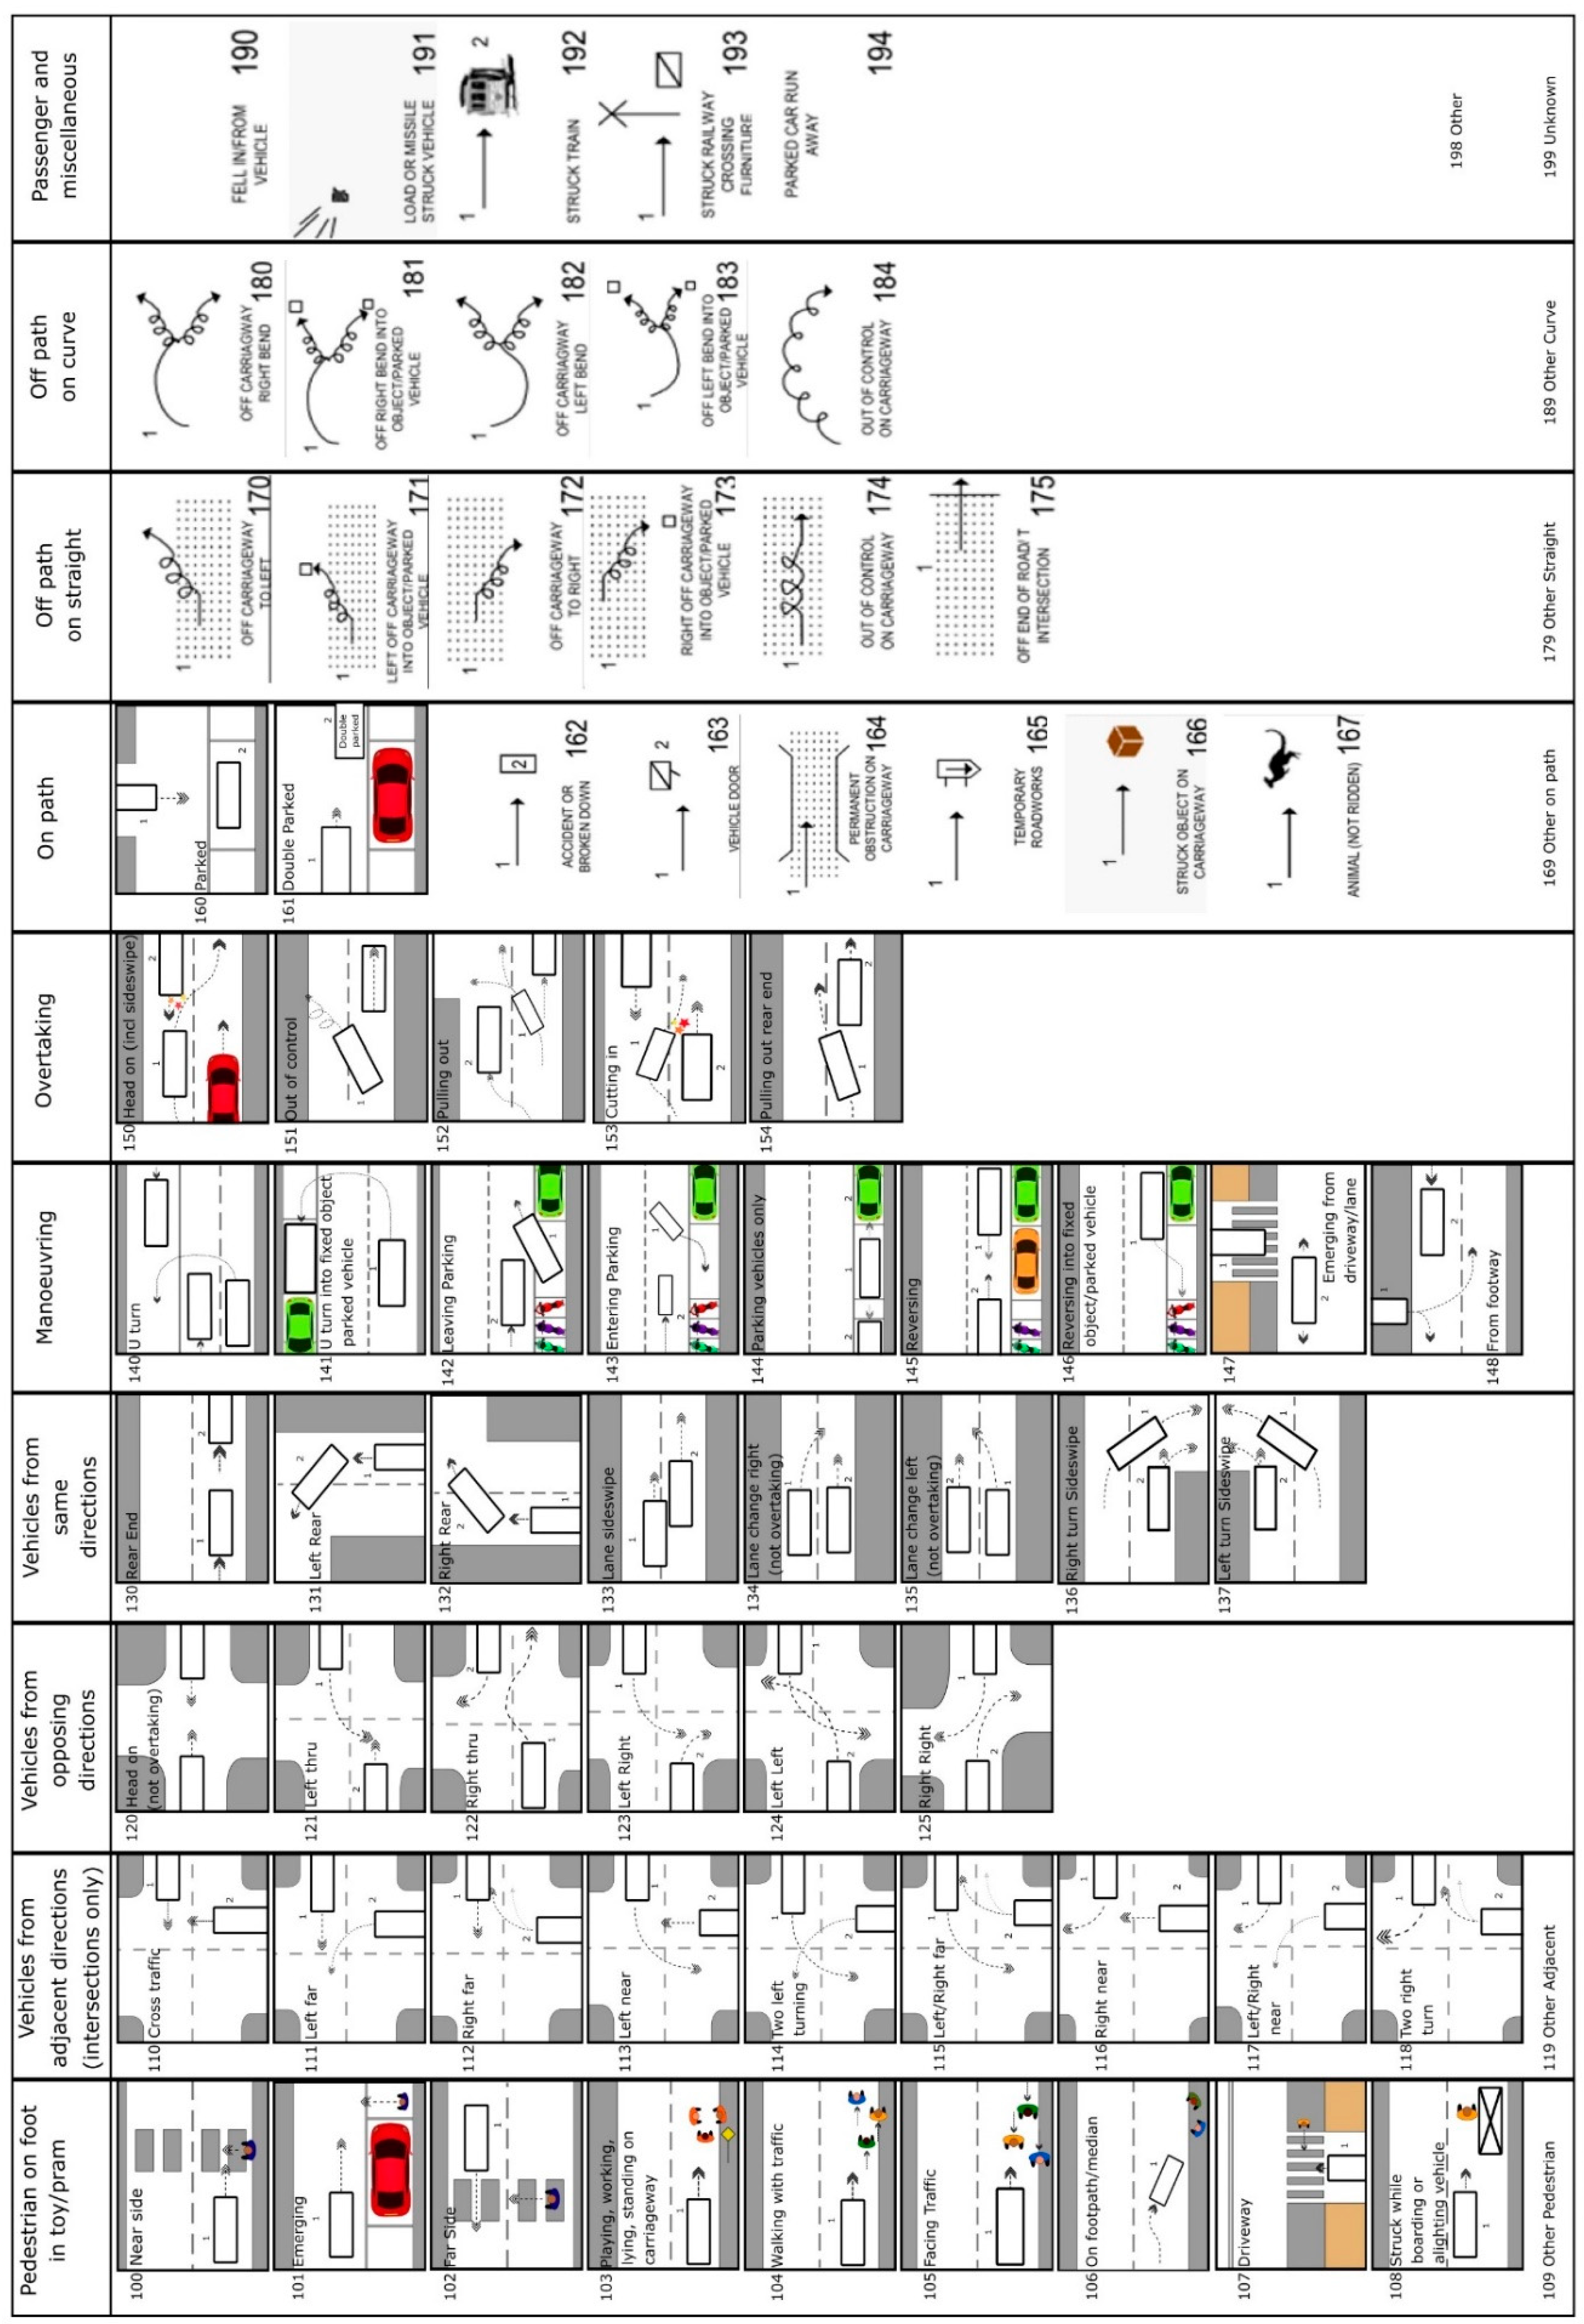
2.3. Crash Classification

Each database codes crashes according to its own national standards and rules. This section describes the method used to express all the crashes with the same crash configuration variables.
MICIMS codes crash configurations according to the Australian Definition for Classifying Accidents (DCA) chart [31]. The Australian DCA chart (Appendix A Figure A1) is divided into 10 categories, comprising 81 total crash configurations, each described by a pictogram containing the trajectory of the vehicles involved in the crashes without distinguishing between types of vehicles. Following Savino et al., it was necessary to extend the crash configurations from 81 to 152, because the original Australian DCA code does not specify the type of vehicle to which the trajectories correspond [21]. The expansion was achieved by introducing a new variable, “Type”, that specifies all the possible combinations of the position of motorcycles and other vehicles. Figure 1 shows an example of this extension process. Therefore, each of the MICIMS crashes was re-coded in one of the 152 possible extended DCA crash configurations.
Prato-X codes crashes using the national rules released by the Istituto Nazionale di Statistica (ISTAT), which employs short text descriptive phrases. Using the sanitized police crash information, each Prato-X crash was manually coded using the extended DCA code, after first adjusting the codes for driving on the right side of the road. This new chart (Appendix A Figure A2), called the Italian DCA, also contained 152 crash configurations, which specify the vehicle positions and types.
CRSS codes crash configurations based on an Accident Type classification scheme (Appendix A Figure A3), which contains 64 crash configurations divided by typology [11]. The main difference between the Accident Type and the DCA tables is that CRSS’ Accident Type table is based largely on the type of impact, while the DCA table is mainly based on the intentions and maneuvers of the riders. To make comparison with the other datasets possible, the Accident Type configuration chart used in CRSS was translated to the Italian DCA configuration chart, as they both use right-hand driving. To better specify the correspondence, additional CRSS variables [11] describing riders’ intentions and maneuvers were included as needed (Appendix A Table A2 shows the correspondence between the charts). Figure 2 shows an example of the translation between Accident Type scenario n°83 and DCA n°113, as well as the CRSS variable “Initial Contact Point”, which was used to make a distinction between DCA n°113 type C or D.
In this case, Accident Type scenario 83 was found to be equivalent to:
  • − DCA scenario n°113 type C when the CRSS variable “Initial Contact Point” had a value between 1 and 11 for the PTW and between 7 and 11 for the other vehicle.
  • − DCA scenario n°113 type D when the CRSS variable “Initial Contact Point” had a value between 1 and 5 for the PTW and between 1 and 11 for the other vehicle.
Figure 3 depicts the method proposed to express all the crashes with the same variables. MICIMS crashes were re-coded using the extended DCA chart containing 152 pictograms and obtained with the addition of the variable “Type”. Prato-X data were re-coded using the same extended DCA chart, after adjustment for right-hand driving. Regarding CRSS crashes, firstly, the exact correspondence between the Accident Type and the DCA scenarios was found. Then, the crashes were re-coded using the DCA chart with right-hand driving. However, Accident Type scenarios 1, 3, 6, 8, 34 to 41, and 54 to 61 did not correspond to any DCA scenario and were analyzed separately.

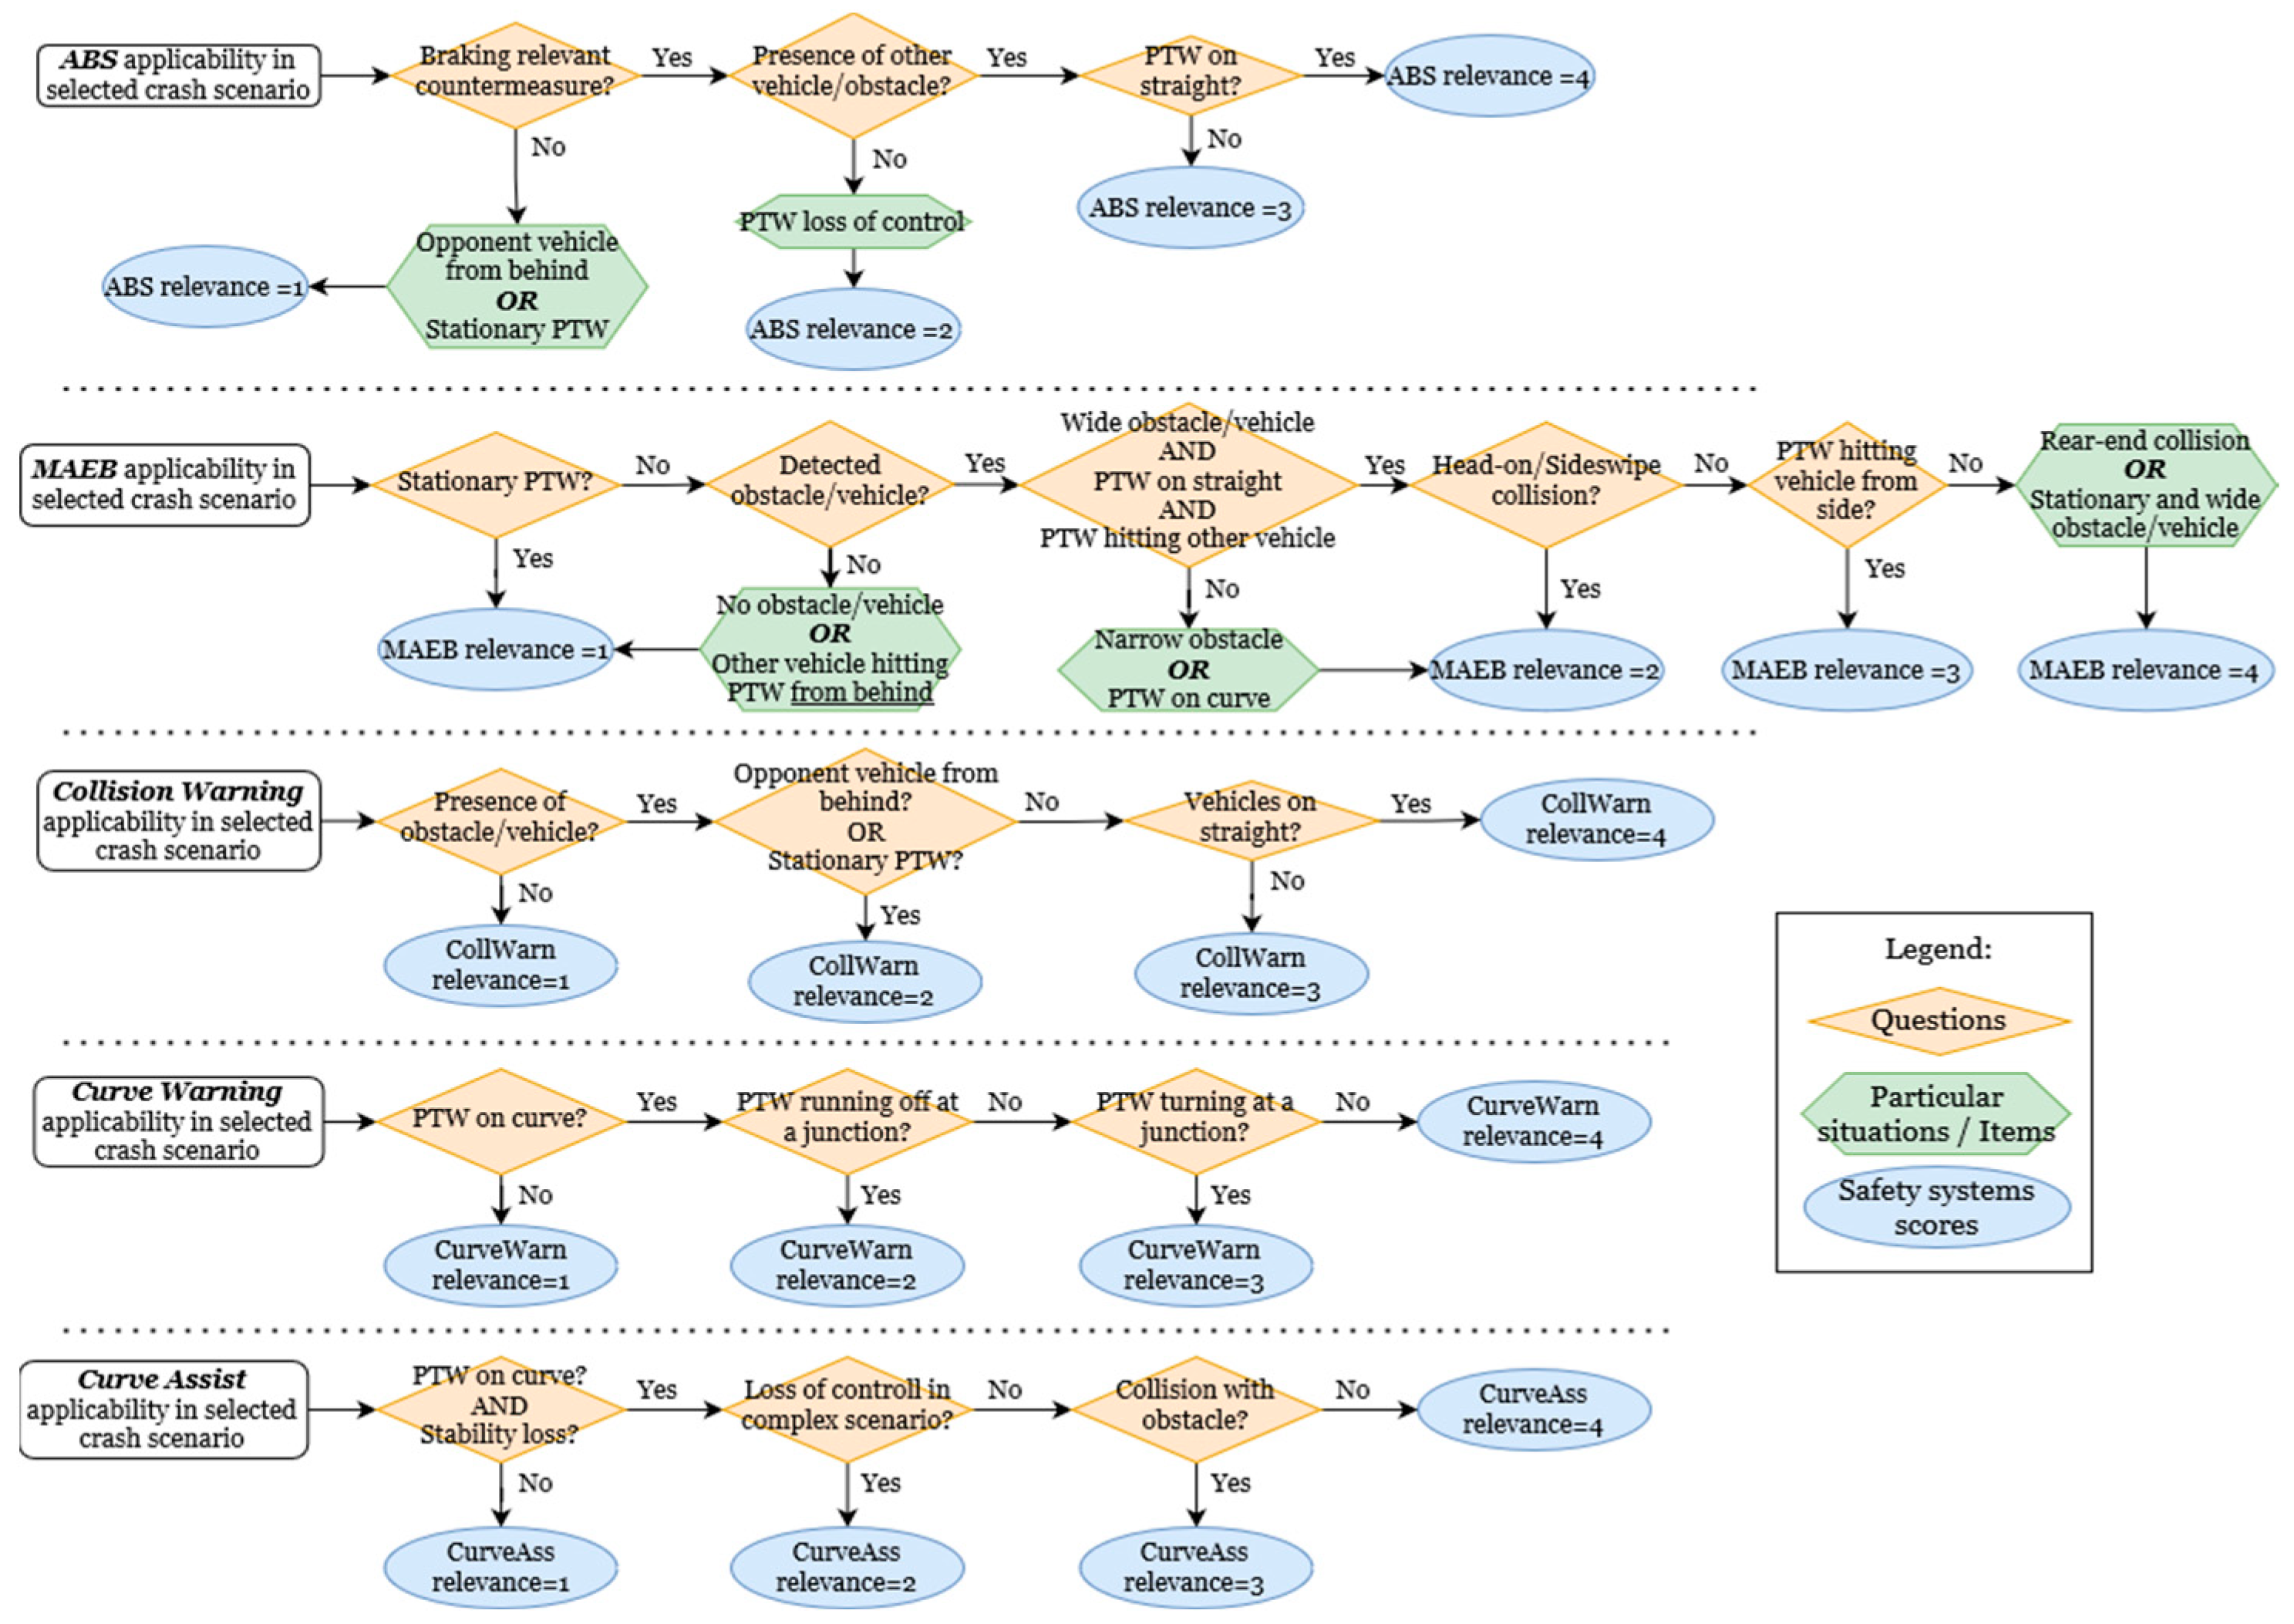
2.4. Determining Device Applicability

To make comparison possible also with the results obtained for the Australian RCIS crash database, the evaluation of safety system applicability was carried out using the same method as Savino et al. [21], who developed a scoring scheme for each safety system ranging from 1 (“system would have definitely not applied to crashes belonging to a given scenario”) to 4 (“system would definitely have applied”). In this study, the authors revised the definition of category 4 to improve clarity (“system would have applied if the technology was activated”) to emphasize the potential relevance of the systems. A score value of 2 was used in cases where the application was controversial, while a score value of 3 indicated “Would probably have applied but before some technical challenge need to be solved”. The scheme illustrated in Figure 4, regenerated from Table 1 in Savino et al. (2019), was based on a detailed taxonomy of the functionality, purpose, and applicability of the five safety systems [21]: for each score, specific and detailed rules were developed based on the current understanding of the device’s functionality.
The antilock braking system (ABS), already implemented in high-level PTWs, is useful for reducing braking distance and preventing wheel lock during intense braking or conditions of low adherence [32,33]. Motorcycle autonomous emergency braking (MAEB) performs a braking maneuver when the rider has no time to brake. AEB has been implemented in passenger cars but has not yet been implemented in PTWs, as it is still in the prototype phase [19,20]. Collision avoidance technologies for PTWs are systems designed to scan the environment and surroundings of the vehicle, issuing a warning to the rider when a risk of a collision has been computed. A similar system was recently implemented in production bikes (e.g., 2020 Ducati Multistrada) [34,35,36]. Curve warning is a prototype system that monitors the real-time state of the PTW and issues a warning to the rider when it identifies curve hazards [37,38]. Lastly, the prototype curve assistance system checks the vehicle dynamics in real time and makes some adjustments (i.e., engine torque/brake) when a loss of control is detected [17,39].
Two of the authors of [21] independently categorized each of the 152 extended DCA crash scenarios into one of the four relevance categories using the rules reported in Figure 4 (adjusted from Table 1 of [21]). A third researcher independently assessed the classification agreement. The three researchers were academics with at least 10 years of experience in the development and assessment of vehicle safety systems. This method was characterized by: (a) a large set of configurations used for the definition of the crash scenarios; (b) a high degree of detail in the definition of the taxonomy; and (c) a limited number of researchers involved in the evaluation process.
As reported in the Appendix A of Savino et al. (2019), the quadratic weighted kappa was used [40,41] as a measure of the inter-rater reliability statistic. The authors found that the quadratic weighted kappa was statistically significant and therefore the level of agreement was substantial.
Regarding the Accident Type scenarios with no correspondence to the DCA scenarios (n°1, 3, 6, 8, 34 to 41, and 54 to 61), two authors of the present work (P.T. and M.D.) separately assigned the relevant category to the scenarios for each safety system based on their functionality (Figure 4). After carrying out the assessment, two experts on road safety (G.S. and H.C.G.) assessed the classifications to make a final decision for the scenarios where there was no agreement.
Having assigned a relevance score to each scenario (Appendix A Table A3), the applicability of the safety systems to each real crash contained in the three datasets was determined. Each safety system was considered independently and in combination.

3. Results

This research aimed to perform an applicability assessment of five PTW safety systems using real-world crash data from three different regional databases. Table 3 and Table 4 show the percentage of crashes to which each safety system is relevant, alone and in combination.

3.1. Independent Systems Analysis

ABS was potentially relevant (category 2 + 3 + 4) for 93.7% of crashes contained in MICIMS, 92.3% in Prato-X, and 84.2% in CRSS. MAEB, on the other hand, “would have applied if the technology was activated” (category 4) for 7.2% of MICIMS crashes, 7.7% of Prato-X, and 14.2% of CRSS. Collision warning systems were considered potentially relevant (category 2 + 3 + 4) for 63.1% of crashes in MICIMS, 68.8% in Prato-X, and 69.9% in CRSS. On the contrary, curve warning was considered definitely not relevant (category 1) for 66.1% of MICIMS crashes, 88.1% of Prato-X, and 84.2% of CRSS. Similarly, curve assist was definitely not relevant for 54.2% of MICIMS, 60.4% of Prato-X, and 70.4% of CRSS crashes.
The safety system with the highest percentage of crashes classified in category 4 was ABS (MICIMS = 48.7%, Prato-X = 60.0%, CRSS = 45.6%), followed by collision warning (MICIMS = 22.9%, Prato-X = 31.9%, CRSS = 25.9%). Categories 2 and 3 were found to be particularly important for MAEB, as they included 48.8% of MICIMS, 59.3% of Prato-X, and 53.1% of CRSS crashes.
To assess if the differences in the percentages between countries were statistically significant, a chi-square test with p < 0.05 was performed. Except for “curve warning” category 3 (because of its null result), the null hypothesis “there is not a statistical difference between the percentages of applicability for the safety system in the countries” was rejected.

3.2. Combined Systems Analysis

For each dataset, Table 4 presents the percentage of crashes that were sensitive to a single system at a time (i.e., crashes that were not sensitive to more than one system) or to a set of multiple systems (i.e., crashes in which more than one system may have been applied). Focusing on the category 4 rating (high relevance), ABS alone obtained maximum applicability compared to the other systems: the percentage of crashes sensitive to only ABS (category 4) was between 19.7% and 28.1%. When considering ABS and collision warning in combination (A + C), i.e., both systems may have been applied, the percentage of sensitive crashes was between 11.6% and 24.2%.
Table 4 also shows the percentage of crashes where no safety system was found applicable (“None Apply”). None of the five selected safety systems obtained a score of 4 for 26.3% of crashes in MICIMS, 35.4% in Prato-X, and 44.0% in CRSS. Furthermore, considering category 3, the crash percentages were reduced by 4–6% in the case of Prato-X and MICIMS, and by almost 15% in the case of the CRSS dataset.

4. Discussion

The main challenge of the comparison was that, initially, crashes were coded differently from country to country: MICIMS crashes used the DCA scenarios with left-hand traffic, Prato’s crashes were cataloged using the ISTAT standard, and the CRSS database used the Accident Type classification. Despite this, our thorough re-coding methodology yielded comprehensive results showing the variability of the applicability of the five safety systems for the three countries considered.

4.1. ABS

ABS showed the largest independent applicability: its category 4 “Would have applied if the technology was activated” contained 48.7% of MICIMS crashes, 60.0% of Prato-X crashes, and 45.6% of CRSS crashes. Savino et al., using the same method but considering both urban and rural Australian crashes in the RCIS dataset, obtained an ABS applicability of 40.6% [21]. Rizzi et al., using different methods, obtained for Sweden an ABS relevance of 38% for all crashes and 48% for severe or fatal crashes [16].

Difference between Countries—ABS Category 4

ABS maximum relevance for Prato-X (60.0%) was quite different from both the literature and the other datasets analyzed in this paper: more than 10 percentage points greater than MICIMS and CRSS, and 20 percentage points greater than the RCIS database studied by Savino et al. [21]. The reduced number of crashes contained in Prato-X, compared to CRSS and RCIS, may have influenced this result. However, this does not explain the 10-percentage-point difference between the Prato-X and MICIMS databases, which contain a comparable number of crashes: 294 and 235, respectively. In this case, the difference in the results was likely influenced by differences in the features of the two countries’ transportation systems, such as the different road systems and the high number of mopeds in Prato’s fleet. MICIMS contains crashes that occurred within 150 km of the city of Melbourne, the capital of the state of Victoria and the second-most populous city in Australia [30]. Urban areas of the city contain large arterial roads, extra-urban roads, highways, and freeways, while non-urban areas are higher-speed zones with access to recreational routes with curved roads. Motorcycles also tend to be larger with relatively large engine capacities. Prato-X, on the other hand, contains crashes that occurred in the Municipality of Prato, a typical small/medium-sized Italian city, characterized by narrow streets, no highways, and high traffic on the roads. Due to these factors, 74% of Prato’s crashes occurred from contact with other vehicles or with pedestrians/bikes (only 4.6% of Prato-X crashes were detected while the PTW was cornering or in high-speed zones): these are scenarios where braking can be useful, and therefore, where ABS scored higher. On the contrary, 38.6% of MICIMS crashes occurred while cornering or in high-speed zones, scenarios where ABS has lower applicability. In addition, the high presence of mopeds—PTWs with an engine capacity equal to or less than 50 cc—in Prato’s fleet could have influenced the high applicability of ABS: they represented 36% of the PTWs involved in Prato’s crashes and, after an analysis of the Prato Police data, none were found to be equipped with ABS. The lack of vehicles equipped with this system could have increased its applicability: if it had been more widespread, it is possible that many crashes would have been mitigated or avoided.
The greater diffusion of ABS in the future will definitely bring the ABS category 4 of Prato-X to a value closer to that of other countries. This improvement could be achieved by reducing the cost of ABS, facilitating its implementation on mopeds, and by increasing the presence of high-level PTW types.

4.2. MAEB and Collision Warning

MAEB obtained the maximum applicability (category 4) in 7.2% of MICIMS, 7.7% of Prato-X, 14.2% of CRSS, and 5.7% of RCIS [21] crashes. Meanwhile, almost half of the crashes contained in the datasets belonged to controversial categories where the MAEB applicability was uncertain (category 2 + 3): 48.8% for MICIMS, 59.3% for Prato-X, 53.1% for CRSS crashes, and 41.6% for the RCIS dataset analyzed by Savino et. al. [21]. These results are aligned with studies that performed detailed crash reconstruction [20]. Typical scenarios where MAEB obtained a rating of 2 or 3 were crashes where the PTW was initially partially adjacent to the car (e.g., sideswipe crashes): at present, instruments to detect obstacles located laterally/frontally are reaching a high technology readiness level (TRL) and approaching a market release [36,42,43]. Such systems, once validated in field operational tests with motorcycles, could shift many of these crashes into category 4 of the MAEB. Such developments could also influence category 3 of collision warning, shifting many of these crashes into category 4.

Difference between Countries—MAEB Category 3

Substantial differences between regions were found for MAEB category 3: 26.3% for MICIMS, 31.2% for Prato-X, 8.8% for CRSS, and 17.3% for RCIS crashes [21]. While the MICIMS result is discussed later in the paper, the difference between Prato-X and CRSS was likely influenced by the variations in the number of sideswipe crashes between the datasets (MAEB has score 3 in sideswipe scenarios): making up 10.2% in Prato-X but only 2.9% of the total crashes in CRSS. These different percentages reflect the different traffic conditions in the two countries: in Italy, due to the layout of the roads and the typical traffic conditions, it is usual for PTWs to overtake other vehicles sideways when they are in a line. This maneuver is the reason for the high number of sideswipes in Prato-X crashes: cars in a row often turn to enter into secondary roads or private properties and hit PTWs intent on overtaking. This fact could have influenced the MAEB category 3 results for the Italian city.
On the contrary, the high percentage of crashes contained in MAEB category 3 of MICIMS was caused not by transportation features, but by one particular characteristic of this database: it contains only crashes where the rider/passenger was injured and admitted to one of the hospitals within the study area (Table 2). As a result, in MICIMS, there is a prevalence of scenarios where the rider has a high probability of being injured. For example, scenarios DCA 121 type C and 113 type C (where the other vehicle (Vehicle 1) cuts in front of the PTW (Vehicle 2)) have a high probability of the rider being injured, and in fact represented 16.5% of the total crashes, while in the Prato-X and CRSS datasets, they represented only 6.7% and 0.6% of the total, respectively.

4.3. ABS Plus MAEB Plus Collision Warning

ABS and collision warning are non-automatic safety systems, as they require the rider to take action for any safety benefits to be achieved. For this reason, riders may benefit more from the combined use of ABS and/or collision warning with MAEB. The advantages of these systems can add up in many situations, such as in a case where a rider may not have braked due to not recognizing the risk of a crash. In a situation like this, a collision warning system could trigger braking intervention by the rider, increasing the effectiveness of ABS. Additionally, MAEB could perform braking for riders if they do not brake despite the collision warning. When the DCA vehicle movement was classified as category 4, the combination of ABS and collision warning (A + C) covered a large number of crashes (Table 4): 15.7% in MICIMS, 24.2% in Prato-X, 11.6% in CRSS, and 17.4% in RCIS [21]. Good coverage was also provided by the combination of ABS, collision warning, and MAEB (A + B + C): 7.2% in MICIMS, 7.7% in Prato-X, 14.2% in CRSS, and 5.7% in RCIS [21].

4.4. Curve Warning and Curve Assist

When considering only category 4 scenarios, both curve warning and curve assist applied to only 4.6% of Prato-X crashes. This result differs from those of Savino et al. [21] and Biral et al. [44], where the systems were each found to be applicable to approximately 16% of crashes. For the CRSS dataset, the percentage was almost double (CW = 10.1%; CA = 10.4%), and it was even higher for MICIMS (CW = 24.6%; CA = 25.0%).

Differences between Countries—Curve Warning and Curve Assist Category 4

The higher MICIMS percentage was obtained because 58 out of 235 crashes (24.6%) were DCA scenarios involving a vehicle being run off the road on a curve, (scenarios between 180 and 184, “Off path on curve”; Appendix A Figure A1). In contrast, due to the narrow urban streets and the low speed of the PTWs (comprising mostly mopeds), Prato-X crashes that occurred while navigating a turn represented only 4.6% of the total crashes (scenarios 180 to 184). It is interesting to note that the two countries that exhibited the highest applicability for curve warning and curve assist systems, the US and Australia, are the countries in this study known for recreational PTW use. This may indicate a link between recreational PTW use and the loss of control at higher speeds while navigating turns, which promotes the implementation of these systems especially when motorcycles are used recreationally.

4.5. Remaining Crashes

After considering the coverage of category 3 and 4 scenarios, for either an independent system or a combination of systems, it was possible to determine the percentage of crashes where no safety system was considered applicable. The raw “None Apply” value in the right-side of Table 4 represents the number of crash scenarios where all five safety systems obtained scores lower than 3. The crashes in this group for Prato-X and MICIMS largely comprised loss-of-control scenarios (“Off path on straight” and “Off path on curve”, DCA columns 8 and 9; Appendix A Figure A1). For CRSS, nearly half of the crashes in this group consisted of PTWs that were rear-ended, run-off-road cases (not due to traction loss), and cases where the PTW was sideswiped.
The large percentages of cases for which none of these systems would apply emphasize the need to develop new solutions, especially in cases where the PTW is sideswiped or experiences a loss of control.

5. Limitations

One limitation of this study was that the systems’ applicability was based only on the crash configuration, which was a typology of data available in all the datasets (even if originally coded differently) but that did not provide specific information about the crashes. This influenced the applicability of the non-automatic safety systems—i.e., that require the rider to take action to achieve any safety benefits—such as ABS or collision warning. A more confident assessment of applicability would be possible using information regarding the riders’ activation of the brakes or avoidance maneuver (for collision warning), and the locking of the wheels (for ABS); however, this type of data was not available for CRSS and Prato-X. This could have led to an overestimation of the applicability of these two systems. Future studies that analyze riders’ actions (e.g., naturalistic data) are encouraged to validate these results.
An additional limitation was that we did not consider rider behavior factors (ability to react, medical or other impairment such as fatigue or alcohol), environmental conditions (i.e., weather and lighting), the physical limitations of the systems, and the riders’ ability to disable the system, which are variables that could influence a system’s applicability. Future effectiveness studies should consider these factors, as well as the presence of passenger vehicle technologies that might prevent crashes involving a motorcyclist [45], given that a relatively high proportion of these crashes involve errors by other drivers [29].
Lastly, even if it is proven that crashes within these countries have different contributing factors and that therefore the benefits of these technologies would not be evenly distributed, it is possible that, even within a single country, different areas could have different tendencies. Other than incorporating new crash datasets, future research should statistically relate the benefits of the safety systems to the tendencies of the crashes’ contributing factors.

6. Conclusions

This research was performed to assess and compare the applicability of five up-and-coming active safety systems in three different countries. Furthermore, the new proposed approach shows that there is space and need for PTW-based active safety systems, highlighting which system has the greatest chance of reducing crashes.
Aiming to achieve maximum coverage with the minimum number of systems, ABS and collision warning have the greatest chance of reducing crashes, as they were found to be applicable to half and one-quarter of the crashes of each database, respectively. Although these results are consistent with the literature, the applicability obtained by using a scenario-based approach could be improved in future studies that consider more in-depth crash datasets. Curve warning and curve assist are the only systems considered useful during the navigation of a curve. Even if the results for these systems varied widely between countries, their percentages were the same within individual countries. As Savino et al. determined from the RCIS dataset, these results suggest that all riders who could benefit from curve assist would also benefit from curve warning. Considering three systems at a time, riders may benefit from the combined use of ABS and collision warning with MAEB in one-third of crashes (category 3 + 4).
Furthermore, this study proved that the device relevance for each of these systems depends largely on the geographical location of interest. The countries analyzed in this paper differ according to their roadway structures (narrow roads versus wider highways); rules of the road (left-hand versus right-hand traffic); how PTWs are generally used (recreational use versus practical use, such as for commuting); and PTW interactions with passenger vehicles (US fleets contain larger vehicles and more pickup trucks, while the Italian fleet contains a consistent percentage of PTWs, including mopeds). Despite these differences, the proposed applicability assessment of PTW active safety systems presented in this study shows the need to prioritize the development of such systems. This has important implications for both researchers and manufacturers seeking to prioritize the development of active safety countermeasures for a particular PTW fleet. In addition, because active safety countermeasures may differ by motorcycle type, these regional differences suggest that regulators may need to consider country-specific minimum performance standards.

Author Contributions

Conceptualization, H.C.G. and G.S.; methodology, H.C.G., G.S., P.T. and M.E.D.; software and data analysis, P.T., S.P., M.E.D., T.J.A. and C.L.; formal analysis and investigation, G.S., M.E.D. and P.T.; resources, G.S., H.C.G., S.P. and T.J.A.; data curation and maintenance, T.J.A. and S.P.; writing—original draft preparation, P.T., M.E.D. and G.S.; writing—review and editing, all; supervision, G.S. and H.C.G.; funding acquisition, T.J.A., H.C.G. and G.S. All authors have read and agreed to the published version of the manuscript.

Funding

The MICIMS study was funded by the Australian Research Council (LP110100057), VicRoads, the Transport Accident Commission of Victoria, and the Victorian Government Department of Justice, with generous support from Victoria Police, the Victorian Automobile Chamber of Commerce, and Ambulance Victoria.

Institutional Review Board Statement

Not applicable.

Data Availability Statement

Restrictions apply to the availability of these data. Prato-X data are available to the MOVING research group members, and MICIMS data to the MICIMS research team members.

Acknowledgments

The authors would like to thank the Municipality Police of Prato, Italy, for providing the processed data. Thanks also to the MOVING research group of the University of Florence, the Centre for Injury Biomechanics of Virginia Tech, and the MICIMS research team. In addition, the authors would like to thank Miguel A. Perez and Luke E. Riexinger for their help and support in the last part of the research. Special thanks to Hampton C. Gabler for the fruitful and important supervision and contribution.

Conflicts of Interest

The authors declare no conflict of interest.

Appendix A

Table A1. National crash statistics of Australia and Italy [10,46]. The Australian “percentage of PTW crashes w.r.t. (with respect to) all crashes” has no value due to the lack of data regarding all the crashes that occurred, i.e., only crashes with fatal and hospitalized injured riders were counted in national reports.
Australia (2014)Italy (2018)
Population23,490,70060,480,000
N° vehicles17,633,49351,682,370
N° PTWs780,1746,780,733
All crashes34,091 172,553
PTW crashes7734 24,550
Killed in all crashes11563334
Killed in PTW crashes192844
Ratio vehicles/population0.750.85
% PTW in the fleets4.4%13.1%
(PTW per 1000 vehicles)(44.2)(131.2)
Mortality rate (killed in all crashes for 100,000 inhabitants)4.925.51
% PTW crashes (w.r.t. all crashes)-14.2%
% Killed in PTW crashes (w.r.t. all fatal crashes)16.6%25.3%
Table A2. Part of the translation of the Accident Type scenarios into DCA scenarios. In many cases, additional CRSS variables were used to better characterize the scenarios and express the correspondence.
DCA + Type (ITA and AUS)AccType (USA)Use of Additional Variables for Translation
100/101/102/103/104/105/16713No
106/107/108/109/16915/16No
110A86No
110B89No
110C88No
110D87No
112A/B81No
112C80Yes
112D80Yes
113A/B82No
113C83Yes
113D83Yes
114A74 + 75Yes
114B74 + 75Yes
114C74 + 75Yes
114D74 + 75Yes
115/117AB/CD84 + 85Yes
115/117CD/AB84 + 85Yes
116A78Yes
116B78Yes
116C79Yes
116D79Yes
118ABCD84 + 85Yes
11984 + 85 + 90 + 91Yes
12050 + 51Yes
121A/B68No
121C69Yes
121D69Yes
12952 + 53 + 62 + 63 + 66 + 67Yes
130/131/132A20 + 24 + 28Yes
130B21 + 25 + 29Yes
131B22 + 26 + 30Yes
132B23 + 27 + 31Yes
133A44Yes
133B44Yes
133C45Yes
133D45Yes
134A46No
135A47No
136A70Yes
136B71Yes
137A72No
137B73No
13932 + 33 + 42 + 43 + 48 + 49No
140A76Yes
140B76Yes
140C77Yes
140D77Yes
14111 + 12Yes
144/14692No
145A21 + 25 + 29Yes
145B20 + 24 + 28Yes
14998 + 99Yes
150A50 + 51 + 64Yes
150B50 + 51 + 65Yes
15998 + 99Yes
160/161/162A11No
16312Yes
16412Yes
16512Yes
16612Yes
1717Yes
1732Yes
17514No
17904 + 05 + 09 + 10Yes
180/182/18402 + 07Yes
181/18302 + 07Yes
18904 + 05 + 09 + 10Yes
19898Yes
19999Yes
Table A3. DCA scenarios that obtained a categorization value of 3 (system would probably have applied) or 4 (system would have applied) for the safety systems analyzed. DCA scenarios not included in this table did not obtain a relevance level of 3 or 4 for any safety system.
Code (DCA)ABSMAEBCollWarnCurveWarnCurveAss
100–1054--4----
106----3--3
1074--3----
108434----
11043 (PTW into OV)4----
1114 (1 PTW), 3 (2 PTW into 1 OV)3 (1 PTW into 2 OV)3--3 (2 PTW)
1124 (1 PTW)--3--3 (2 PTW)
1133 (1 PTW, 1 OV into 2 PTW),
4 (2 PTW into 1 OV)
3 (2 PTW into 1 OV)3--3 (1 PTW)
1143 (2 PTW)--3--3
1153--3--3
1163 (1 PTW), 4 (2 PTW) 3 (2 PTW into 1 OV)3--3 (1 PTW)
117–1183--3--3
1204--4----
1213 (1 PTW), 4 (2 PTW)3 (2 PTW into 1 OV)3--3 (1 PTW)
1224 (1 PTW), 3 (2 PTW)--3--3 (2 PTW)
123–1253--3--3
130–1324 (1 PTW)4 (1 PTW)4 (1 PTW)----
1334 (1 PTW)--------
134–1353 (1 PTW)--3 (1 PTW)--3 (1 PTW)
136–1374 (2 PTW)3 (2 PTW)3 (2 PTW)--3 (1 PTW)
1404--3--3 (1 PTW)
141--------3
142–1434 (2 PTW)3 (2 PTW)4 (2 PTW)----
1454 (2 PTW)4 (2 PTW)4 (2 PTW)----
14743 (1 PTW into 2 OV, 2 PTW)4----
14843 (1 PTW into 2 OV, 2 PTW)3----
1504--3----
152----3 (2 PTW)----
1533 (1 PTW), 4 (2 PTW)--3 (1 PTW)----
154----4 (1 PTW)----
160–1624 (1 PTW)4 (1 PTW)4 (1 PTW)----
1634--4----
164434----
165444----
166–1674--4----
1754--4----
180–184------44
189--------4
192444----
1934--4----
Figure A1. Definitions for Classifying Accidents (DCA) chart: Australian DCA chart (left-hand traffic) used for MICIMS categorization.
Sustainability 14 07563 g0a1
Figure A2. Italian DCA chart (right-hand drive) used for Prato-X and CRSS categorization.
Sustainability 14 07563 g0a2
Figure A3. CRSS US “Accident Type” chart, used in the original CRSS categorization.
Sustainability 14 07563 g0a3

References

  1. Australian Bureau of Statistics. Survey of Motor Vehicle Use, Australia 2008. Months Ended 31 October 2007. Available online: http://www.abs.gov.au/AUSSTATS/[email protected]/Lookup/9208.0Main+Features112 (accessed on 19 April 2022).
  2. Australian Bureau of Statistics. Motor Vehicle Census, Australia. 2013. Available online: https://www.abs.gov.au/AUSSTATS/[email protected]/Lookup/9309.0Main+Features131%20Jan%202013?OpenDocument= (accessed on 19 April 2022).
  3. Swedish Transport Administration. Increased Safety for Motorcycle and Moped Riders. Joint Strategy Version 2.0 for the Years 2010–2020; Swedish Transport Administration: Borlänge, Sweden, 2020.
  4. The Motorcycle Industry in Europe, “Brexit—ACEM—The Motorcycle Industry in Europe”. 2018. Available online: https://www.acem.eu/policy-areas/brexit (accessed on 19 April 2022).
  5. World Health Organization. Global Status Report on Road Safety; World Health Organization: Geneva, Switzerland, 2018. [Google Scholar]
  6. Department of Infrastructure, Transport, Regional Development and Local Government: Road deaths Australia 2008 statistical summary. Road Safety Report No. 4. Canberra: The Department. 2009. Available online: https://www.google.com/url?sa=t&rct=j&q=&esrc=s&source=web&cd=&ved=2ahUKEwiD3dz36qj4AhWdpXIEHcQbBcUQFnoECAsQAQ&url=https%3A%2F%2Fwww.bitre.gov.au%2Fsites%2Fdefault%2Ffiles%2FRDA_Summary_2008.pdf&usg=AOvVaw1W5PxGiGHROPA-LkOzp_go (accessed on 19 April 2022).
  7. Henley, G.; Harrison, J. Serious Injury due to Land Transport Accidents—Serious Injury Due to Land Transport Accidents. 2008. Available online: https://www.google.com/url?sa=t&rct=j&q=&esrc=s&source=web&cd=&ved=2ahUKEwj_r_vJ6qj4AhWOnHIEHaG2D0wQFnoECAoQAQ&url=https%3A%2F%2Fwww.aihw.gov.au%2Fgetmedia%2F7c390016-ebd1-4ca6-9813-254e85d99441%2Finjcat-129-11033.pdf.aspx%3Finline%3Dtrue&usg=AOvVaw1PO3_GpRo4TJEpGtxMOxlv (accessed on 19 April 2022).
  8. Australian Bureau of Statistics. Survey of Motor Vehicle Use, Australia. 2014. Available online: https://www.abs.gov.au/AUSSTATS/[email protected]/Lookup/9309.0Main+Features131%20Jan%202014?OpenDocument (accessed on 19 April 2022).
  9. Vic Roads. Motorcycle Licence and Learner Permit. In Melbourne, Australia—State Government of Victoria; 2014. Available online: https://www.vicroads.vic.gov.au/licences/licence-and-permit-types/motorcycle-licence-and-learner-permit (accessed on 19 April 2022).
  10. Istituto Nazionale di Statistica. Incidenti Stradali. 2019. Available online: https://www.istat.it/it/files//2019/07/Incidenti_stradali_2018_aggiornamento_Ottobre2019.pdf (accessed on 19 April 2022).
  11. National Highway Traffic Safety Administration. Crash Report Sampling System (CRSS) Analytical User’s Manual 2020. Available online: https://crashstats.nhtsa.dot.gov/Api/Public/ViewPublication/813236 (accessed on 19 April 2022).
  12. Lie, A.K.A.; Tingvall, C.; Krafft, M. The effectiveness of ESP (Electronic Stability Program) in reducing real life accidents. Traffic Inj. Prev. 2004, 5, 37–41. [Google Scholar] [CrossRef] [PubMed]
  13. European Transport Safety Council. Reducing Motorcyclist Deaths in Europe. 2007. Available online: https://www.google.com/url?sa=t&rct=j&q=&esrc=s&source=web&cd=&ved=2ahUKEwiCjpnT8aj4AhVRoHIEHao-A3MQFnoECAkQAQ&url=https%3A%2F%2Farchive.etsc.eu%2Fdocuments%2Fcopy_of_copy_of_copy_of_PIN%2520Flash%25207%2520Reducing%2520motorcyclist%2520deaths%2520in%2520Europe.pdf&usg=AOvVaw0dHDj8C7KZRDl0fUXitRN2 (accessed on 19 April 2022).
  14. Yannis, G.; Antoniou, C.; Evgenikos, P.; Papantoniou, P.; Kirk, A. Characteristics and Causes of Power Two Wheeler Accidents in Europe. Procedia—Soc. Behav. Sci. 2012, 48, 1535–1544. [Google Scholar] [CrossRef] [Green Version]
  15. Sporner, A.; Kramlich, T. Motorcycle braking and its influence on severity of injury. In Gesamtverband d. Dt. Versicherungswirtschaft e. V., GDV, Inst. f. Fahrzeugsicherheit; 2001; pp. 1–7. Available online: https://www-nrd.nhtsa.dot.gov/pdf/esv/esv17/Proceed/00168.pdf (accessed on 19 April 2022).
  16. Rizzi, M.; Strandroth, J.; Tingvall, C. The effectiveness of antilock brake systems on motorcycles in reducing real-life crashes and injuries. Traffic Inj. Prev. 2009, 10, 479–487. [Google Scholar] [CrossRef]
  17. de Filippi, P.; Tanelli, M.; Corno, M.; Savaresi, S.M.; Santucci, M.D. Electronic stability control for powered two-wheelers. IEEE Trans. Control Syst. Technol. 2014, 22, 265–272. [Google Scholar] [CrossRef]
  18. Matschl, G.; Mörbe, M.; Gröger, C. Motorcycle Stability Control—MSC The next step into safety solutions for motorcycles. In Proceedings of the 10th International Motorcycle Conference, Köln, Germany, 29–30 September 2014; pp. 128–154. [Google Scholar]
  19. Savino, G.; Mackenzie, J.; Allen, T.; Baldock, M.; Brown, J.; Fitzharris, M. A robust estimation of the effects of motorcycle autonomous emergency braking (MAEB) based on in-depth crashes in Australia. Traffic Inj. Prev. 2016, 17, 66–72. [Google Scholar] [CrossRef]
  20. Lucci, C.; Allen, T.; Pierini, M.; Savino, G. Motorcycle Autonomous Emergency Braking (MAEB) employed as enhanced braking: Estimating the potential for injury reduction using real-world crash modeling. Traffic Inj. Prev. 2021, 1–7. [Google Scholar] [CrossRef]
  21. Savino, G.; Pierini, M.; Fitzharris, M. Motorcycle active safety systems: Assessment of the function and applicability using a population-based crash data set. Traffic Inj. Prev. 2019, 20, 406–412. [Google Scholar] [CrossRef]
  22. Gil, G.; Savino, G.; Piantini, S.; Baldanzini, N.; Happee, R.; Pierini, M. Are automatic systems the future of motorcycle safety? A novel methodology to prioritize potential safety solutions based on their projected effectiveness. Traffic Inj. Prev. 2017, 18, 877–885. [Google Scholar] [CrossRef] [Green Version]
  23. Australian Bureau of Statistics. Australian Demographic Statistic. 2014. Available online: https://www.abs.gov.au/AUSSTATS/[email protected]/Lookup/3101.0Main+Features1Jun%202014 (accessed on 19 April 2022).
  24. Istituto Nazionale di Statistica. Incidenti Stradali in Toscana. 2020. Available online: https://www.istat.it/it/files//2019/11/Focus-Toscana-2018.pdf (accessed on 19 April 2022).
  25. National Highway Traffic Safety Administration. Traffic Safety Facts 2018 Data: Summary of Motor Vehicle Crashes. November 2020; pp. 1–10. Available online: https://www.nhtsa.gov/risky-driving (accessed on 19 April 2022).
  26. Teoh, E.R. Motorcycles registered in the United States, 2002–2021. Insur. Inst. Highw. Saf. 2021. Available online: https://www.iihs.org/api/datastoredocument/bibliography/2225 (accessed on 19 April 2022).
  27. Allen, T.; McClure, R.; Newstead, S.V.; Lenné, M.G.; Hillard, P.; Symmons, M.; Day, L. Exposure factors of Victoria’s active motorcycle fleet related to serious injury crash risk. Traffic Inj. Prev. 2016, 17, 870–877. [Google Scholar] [CrossRef]
  28. Vic Roads. 2014 Analysis of the Victorian Road Toll Fatalities and Serious Injuries. 2015. Available online: https://www.google.it/url?sa=t&rct=j&q=&esrc=s&source=web&cd=&ved=2ahUKEwjApqS2tqn4AhXQTd8KHXq_B9kQFnoECA0QAw&url=https%3A%2F%2Fwww.vicroads.vic.gov.au%2F-%2Fmedia%2Ffiles%2Fdocuments%2Fsafety-and-road-rules%2Farchived%2F2014_analysis_of_the_victorian_road_toll__fatalities_and_serious_injuries.ashx&usg=AOvVaw1QWDcJRCJ8RvzVmeoR9GFc (accessed on 19 April 2022).
  29. Allen, T.; Newstead, S.; Lenné, M.G.; McClure, R.; Hillard, P.; Symmons, M.; Day, L. Contributing factors to motorcycle injury crashes in Victoria, Australia. Transp. Res. Part F Traffic Psychol. Behav. 2017, 45, 157–168. [Google Scholar] [CrossRef]
  30. Day, L.; Lenné, M.G.; Symmons, M.; Hillard, P.; Newstead, S.; Allen, T.; McClure, R. Population based case-control study of serious non-fatal motorcycle crashes. BMC Public Health 2013, 13, 1–6. [Google Scholar] [CrossRef] [Green Version]
  31. Vic Roads. Crashstats—User Guide. 2013. Available online: https://www.google.com/url?sa=t&rct=j&q=&esrc=s&source=web&cd=&ved=2ahUKEwjbpqbLtqn4AhUOnXIEHclVCXIQFnoECAUQAQ&url=https%3A%2F%2Fdata.vicroads.vic.gov.au%2Fmetadata%2Fcrashstats_user_guide_and_appendices.pdf&usg=AOvVaw2f9Xa_hyXHKfyieFk8uLDa (accessed on 19 April 2022).
  32. Rizzi, M.; Strandroth, J.; Holst, J.; Tingvall, C. Does the improved stability offered by motorcycle antilock brakes (ABS) make sliding crashes less common? In-depth analysis of fatal crashes involving motorcycles fitted with abs. Traffic Inj. Prev. 2016, 17, 625–632. [Google Scholar] [CrossRef] [PubMed]
  33. Teoh, E.R. Motorcycle antilock braking systems and fatal crash rates: Updated results. Traffic Inj. Prev. 2022, 23, 1–5. [Google Scholar] [CrossRef] [PubMed]
  34. Silla, A.; Leden, L.; Rämä, P.; Scholliers, J.; Van Noort, M.; Morris, A.; Hancox, G.; Bell, D. A headway to improve PTW rider safety within the EU through three types of ITS. Eur. Transp. Res. Rev. 2018, 10, 1–12. [Google Scholar] [CrossRef] [Green Version]
  35. Fang, C.Y.; Hsu, W.H.; Ma, C.W.; Chen, S.W. A vision-based safety driver assistance system for motorcycles on a smartphone. In Proceedings of the 17th International IEEE Conference on Intelligent Transportation Systems (ITSC), Qingdao, China, 8–11 October 2014; pp. 328–333. [Google Scholar] [CrossRef]
  36. Gil, G.; Savino, G.; Piantini, S.; Pierini, M. Motorcycle that see: Multifocal stereo vision sensor for advanced safety systems in tilting vehicles. Sensors 2018, 18, 295. [Google Scholar] [CrossRef] [Green Version]
  37. Huth, V.; Gelau, C. Predicting the acceptance of advanced rider assistance systems. Accid. Anal. Prev. 2013, 50, 51–58. [Google Scholar] [CrossRef] [PubMed]
  38. Biral, F.; Bosetti, P.; Lot, R. Experimental evaluation of a system for assisting motorcyclists to safely ride road bends. Eur. Transp. Res. Rev. 2014, 6, 411–423. [Google Scholar] [CrossRef] [Green Version]
  39. Lich, T.; Block, W.; Prashanth, S.; Heiler, B. Motorcycle Stability Control—The Next Generation of Motorcycle Safety and Riding Dynamics. SAE Int. J. Engines 2016, 9, 491–498. [Google Scholar]
  40. Cohen, J. Weighted kappa: Nominal scale agreement provision for scaled disagreement or partial credit. Psychol. Bull. 1968, 70, 213. [Google Scholar] [CrossRef]
  41. Cohen, J. A Coefficient of Agreement for Nominal Scales. Educ. Psychol. Meas. 1960, 20, 37–46. [Google Scholar] [CrossRef]
  42. Gil, G.; Savino, G.; Piantini, S.; Pierini, M. Is stereo vision a suitable remote sensing approach for motorcycle safety? An analysis of LIDAR, RADAR, and machine vision technologies subjected to the dynamics of a tilting vehicle. In Proceedings of the 7th Transport Research Arena TRA, Vienna, Austria, 16–19 April 2017; Volume 12, pp. 1–10. [Google Scholar]
  43. Raj, T.; Hashim, F.H.; Huddin, A.B.; Ibrahim, M.F.; Hussain, A. A survey on LiDAR scanning mechanisms. Electronics 2020, 9, 741. [Google Scholar] [CrossRef]
  44. Biral, F.; da Lio, M.; Lot, R.; Sartori, R. An intelligent curve warning system for powered two wheel vehicles. Eur. Transp. Res. Rev. 2010, 2, 147–156. [Google Scholar] [CrossRef] [Green Version]
  45. Dean, M.E.; Haus, S.H.; Sherony, R.; Gabler, H.C. Potential Crash Benefits of Motorcycle-Detecting Automatic Emergency Braking Systems. In Proceedings of the IRCOBI Conference, online, 8–10 September 2021; pp. 39–50. [Google Scholar]
  46. Australian Bureau of Statistics “Road Trauma Australia 2014-Statistical Summary”. 2015. Available online: https://www.nrspp.org.au/resources/bitre-road-deaths-australia-2014-statistical-summary/ (accessed on 19 April 2022).
Figure 1. Example of the extension process applied to DCA scenario n°110 (left). It was divided into four different crash scenarios (right) using the variable “Type”, which specifies all possible crash combinations, i.e., if vehicle 1 and 2 are PTWs or other vehicles and all the possible combination of crashes between them.
Sustainability 14 07563 g001
Figure 2. Example of the translation process between AccType scenario n°83 and DCA n°113. The picture on the right shows the CRSS variable “Initial Contact Point”, used to make a distinction between the two possible correspondences of Accident Type scenario n°83 with DCA scenario n°113 Type C or Type D.
Sustainability 14 07563 g002
Figure 3. Different re-coding methods used for the three datasets. MICIMS crashes, originally catalogued into 82 scenarios, were re-coded into 152 scenarios. Prato-X and CRSS, using different procedures, were both re-coded using the extended DCA adjusted for right-hand driving (Italian DCA).
Sustainability 14 07563 g003
Figure 4. Scoring scheme of relevance. Using this flowchart, each safety system was evaluated in each scenario, obtaining a score from 1 to 4. Regenerated from Savino et al. (2019) [21].
Sustainability 14 07563 g004
Table 1. Comparison among the three regions considered: US, Victoria, and Prato, plus the addition of the Italian data. In the upper section of the table, general data about the country and the fleets are reported (N° of vehicles and N° of PTWs in the region, N° of all crash typologies and N° of PTW crashes, fatalities in all road crashes, and fatalities in PTW crashes). In the central and lower sections are reported the ratios and proportions used for a first comparison between the countries. The Victorian” percentage of PTW crashes w.r.t. (with respect to) all crashes” has no value due to the lack of data regarding all the crashes that occurred, i.e., only crashes with fatal and hospitalized injured riders were counted in national reports.
Victoria (2014)Prato (2018)USA (2018)
Population5,800,000190,000326,895,465
N° vehicles4,483,098154,557297,042,658
N° PTWs174,33618,0808,305,171
All crashes5098 9646,734,000
PTW crashes958 29482,124
Killed in all crashes249935,560
Killed in PTW crashes3004181
Ratio vehicles/population0.770.810.91
% PTW in the fleets3.9%11.7%2.8%
(PTW per 1000 vehicles)(38.9)(116.9)(27.9)
Mortality rate (killed in all crashes for 100,000 inhabitants)4.294.7310.87
% PTW crashes (w.r.t. all crashes)-30.5%1.2%
% Killed in PTW crashes (w.r.t. all fatal crashes)12.0%0.0%11.8%
Table 2. Comparison of the main characteristics of the three databases analyzed in the study: Prato-X, CRSS, and MICIMS. The data presented are: extended database name; number of crashes extracted from each dataset (for US, sampling weights were applied); crash location; crash period; road types; injury types; and a special characteristic of the MICIMS dataset. The last row reports the original dataset categorization method.
MICIMSPrato-XCRSS
Extended nameManaging Increasing Challenges in Motorcycle Safety--Crash Reporting Sampling System
LocationVictoria, AustraliaMunicipality of PratoUnited States of America
Considered crashes (with sampling weights)2352946088
(265,361)
Period01/2012–08/201420182016–2018
Type of roadsUrban and ruralOnly urbanOnly urban
Included crashesHospital admission
(non-fatal injury)
Police reportedPolice reported
Particular characteristicOnly crashes where injured riders were admitted to one of the hospitals within the study area----
Table 3. Applicability comparison between countries with percentages of crashes for each category and safety system.
Category 1Category 2Category 3Category 4
System would definitely not have appliedSystem would possibly have applied (the applicability is controversial)System would probably have applied (technical challenge still needs to be solved)System would have applied if the technology was activated
MICIMS Prato-X CRSS MICIMS Prato-X CRSS MICIMS Prato-X CRSS MICIMS Prato-X CRSS
ABS6.4%7.7%15.8%40.3%29.1%28.0%4.7%3.2%10.6%48.7%60.0%45.6%
MAEB44.1%33.0%32.7%22.5%28.1%44.3%26.3%31.2%8.8%7.2%7.7%14.2%
Collision warning36.9%31.2%30.1%9.7%7.0%11.0%30.5%29.8%33.1%22.9%31.9%25.9%
Curve warning66.1%88.1%84.2%9.3%7.4%5.7%0.0%0.0%0.0%24.6%4.6%10.1%
Curve assist54.2%60.4%70.4%16.5%32.6%11.4%4.2%2.5%7.9%25.0%4.6%10.4%
Table 4. Applicability comparison of safety systems alone or in combination.
Category 4Category 3 + 4
MICIMSPrato-XCRSSMICIMSPrato-XCRSS
Safety Systems Alone
  ABS alone (A)25.8%28.1%19.7%0.8%1.7%0.8%
  MAEB alone (B)------------
  CollWarn alone (C)------0.4%--1.1%
  CurveWarn alone (D)------------
  CurveAssist alone (E)0.4%--0.3%0.4%--0.5%
Two Systems in Combination
  A + C15.7%24.2%11.6%15.3%20.4%27.2%
  D + E24.6%4.6%10.1%24.6%4.6%10.1%
  C + E------0.4%0.4%2.5%
  Other double combination------------
Three Systems in Combination
  A + B + C7.2%7.7%14.2%33.5%38.9%23.0%
  A + C + E------3.8%2.1%5.2%
  Other triple combination------------
  None apply26.3%35.4%44.0%20.8%31.9%29.7%
Publisher’s Note: MDPI stays neutral with regard to jurisdictional claims in published maps and institutional affiliations.

