Article

Spatial Distribution and Land Development Parameters of Shopping Centers Based on GIS Analysis: A Case Study on Kraków, Poland

Faculty of Architecture, Cracow University of Technology, Warszawska Street 24, 31-155 Kraków, Poland
*
Author to whom correspondence should be addressed.
Sustainability 2022, 14(13), 7539; https://doi.org/10.3390/su14137539
Submission received: 12 April 2022 / Revised: 14 June 2022 / Accepted: 19 June 2022 / Published: 21 June 2022

Abstract

:
The progressive development of shopping centers in the world affects the urban structure of cities. These facilities are constantly evolving, which also entails changes in the way their vicinity is shaped. In this context, this article deals with the trend in the way of locating and developing shopping center areas, showing the changes taking place over the years. The subject of investigations are the areas of Kraków’s shopping centers—their spatial distribution and the way the land is developed. The aim of the research was to characterize and assess the spatial development of the analyzed shopping centers, to determine the trends in the location and characteristic urban indicators. This made it possible to verify whether possible changes in the way new investments of this type are shaped should be sought in order to improve the quality of the urban environment. To assess the spatial distribution of shopping centers, standard deviation ellipse analysis was used, as well as the nearest neighbor method. In order to determine the parameters of development of shopping centers, basic urban indicators were used, i.e., building plot ratio (BPR), floor area ratio (FAR), and green plot ratio (GPR). Spatial analysis was performed using QGIS software. Studies have shown that brownfield investments are scattered along the north–south axis of the city, while greenfield investments are located at a greater distance from its central area. Over the years, there has been a gradual concentration of shopping centers, but they are still characterized by dispersion. The results of analyses of changes in the land development of their areas indicate that over the years there has been an imperceptible trend of creating objects occupying an increasing part of the investment plot. In turn, the share of total leaf area of greenery is slightly reduced. With the increase in distance from the city center, indicators regarding the floor area and gross floor area of shopping centers are clearly decreasing. On the other hand, the share of greenery increases mildly, although this index remains at a level not exceeding 20%. These results indicate the need to take action to enforce a greater share of greenery within the areas of shopping centers and the need to care for the quality of their surroundings in order to ensure sustainable spatial development of the city.

1. Introduction

A shopping center is a relatively new element in the urban space in Poland, although the first shopping centers were built in the United States at the beginning of the 20th century [1]. The concept of a contemporary shopping mall refers to the definition from the 1950s [2,3]. In the literature on the subject, facilities of this type are described differently depending on their location. Regarding the area of Europe, the definition developed by the International Council of Shopping Centers (ICSC) [4] is often cited. Based on the studies conducted as part of a doctoral dissertation [5], it was assumed that a shopping center is a compact architectural and urban complex, created according to a coherent investment design with a mainly commercial function, being a building or a group of objects in a separate plot, with a minimum gross lease area (GLA) of 5000 m2 and a sales area of more than 2000 m2, consisting of at least 10 tenants with parking for clients.
The creation of this type of facility was associated with the development of the automotive industry, the process of suburbanization, and technological progress. Initially, they were built on the outskirts of cities, and with time, they were implemented in city centers, sometimes as part of the revitalization of the downtown area [6]. Currently, shopping centers are part of the global economy, usually located in large cities and metropolises.
The first shopping centers in Poland appeared in the early 1990s—nearly 70 years later than in the United States. Over 500 facilities of this type were built in less than 30 years (Figure 1). They are most numerous in the largest Polish cities in terms of the number of inhabitants, i.e., Warsaw, Kraków, Łódź, Wrocław, Poznań, Gdańsk, Szczecin, and Lublin (Figure 2).
The number of shopping centers in selected large cities of Central and Eastern Europe is in the range 14–39 (Table 1). Kraków is one of the big cities in Central and Eastern Europe with high historical and cultural values. It is one of the oldest cities in Poland and the fifth city in Poland in terms of the number of shopping centers. The development of modern, large-scale commercial facilities in a city with historical roots and rich historic urban tissue is an important issue from the point of view of sustainable urban development.
The construction of shopping centers is associated with the transformation of the urban tissue. These facilities are being built both in undeveloped areas (greenfield investments) and in degraded areas which have lost their existing utility functions (brownfield investments).
The distinction between brownfield and greenfield investments is widely used in traditional spatial planning [7]. These are two opposing approaches that influence a city’s development model. The contemporary idea of sustainable development is implemented, i.e., by actions for reducing the uncontrolled growth of urban fabric (urban sprawl) [8]. For this purpose, more and more attention is paid to the transformation of post-industrial areas, while limiting the designation of new suburban areas for development. For example, the UK government proposed in 1998 that 60% of newly built homes should be built on brownfield sites [7]. In the European Union, various types of economic incentives are used to support brownfield investments [9]. The issues of brownfield and greenfield investments have been a frequent subject of research by scientists over the last 20 years [10,11,12], including the use of GIS tools [13,14]. Countries such as the USA, England, Canada, Germany, and China have made an important contribution to the development of research on environmental protection and urban planning issues in the context of brownfield sites [15]. It has been noticed that there is a correlation between the revitalization of brownfield sites and three factors: socio-economic factors (income level), green development, and tax incentives [16]. Sustainable participation of the investor, community, and local authorities in this type of investment is important to ensure optimal effects [17,18].
Due to the scale of their space, shopping centers are investments that have a significant impact on city structure. In order to determine to what extent these facilities contribute to urban sprawl, it is important to consider their development divided into brownfield and greenfield investments.
Balancing built-up urban areas and planted landscapes is an essential aspect of contemporary spatial planning. The planning measures used to determine the principles of land development, are the following urban indicators (land development indicators): building plot ratio (BPR), floor area ratio (FAR), and green plot ratio (GPR) [19]. BPR is an important indicator used in local spatial development plans, although in Poland it is increasingly being replaced by the FAR. It specifies the maximum area that can be built up in relation to the plot area. FAR is the ratio of a building’s total floor area (gross floor area—GFA) to the size of the piece of land upon which it is built. GFA means the total floor area—the sum of the gross horizontal area of all floors of all buildings measured from the exterior faces of the exterior walls [20]. GPR is an architectural and planning metric for greenery in cities and buildings [21]. These indicators are also used in the world in planning practice and scientific research [22]. The literature emphasizes the importance of GPR to increase the amount of greenery in cities and improve the quality of the environment [21]. Similarly, the FAR is used to regulate the intensity of buildings to reduce the negative effects of too high density, such as traffic congestion, noise, or insufficient exposure to sunlight [20].
Shopping centers are facilities adapted to service, in particular, motorized customers; therefore, they offer large parking spaces and contribute to increasing car traffic in their vicinity. For this reason, the determination of optimal indicators for the land development of shopping center areas is an important measure of spatial policy, aimed at maintaining a balance between the floor area ratio and the related traffic density, and the availability of green areas [23].
Despite the small tradition, there is considerable scientific literature on shopping centers. It covers issues from various fields and scientific disciplines, such as architecture and urban planning, economics, geography, and sociological sciences. Some of the publications refer to issues of location and design principles of the discussed objects [1,24]. An analysis of the work of V. Gruen, one of the first founders of shopping centers, is included in the publication by M. Jeffrey Hardwick [25]. Shopping centers are sometimes located based on both the knowledge and experience of decision-makers, and research on spatial models [26]. Of great importance for the location of shopping centers is not only transport accessibility and population size but especially income [27]. Increasingly, they are multifunctional facilities that become places for spending free time [28,29]. Due to their spatial arrangement and accessibility, they can be treated as semi-public spaces [30]. Such large commercial facilities also affect the functional and spatial changes in cities, in particular, quantitative changes regarding entities conducting business activity in their surroundings [31,32,33,34]. The dynamic development of shopping centers outside the United States is observed in Europe, including Central and Eastern Europe, Canada, and Asia [35]. These facilities appeared in the 1920s and 1930s in the United States, in the 1950s in Western Europe, and in the 1990s in Central and Eastern Europe and China [36,37]. Models of development for the latter do not differ significantly from Western models. The difference is the period of evolution of this type of facility [38].
In the analyzed literature, there are not enough publications discussing the changes taking place in the way shopping center areas are shaped over the years. In this context, the article takes up the topic of trends in the way of locating and developing their areas. The subject of the research are the areas of Kraków’s shopping centers, their spatial distribution, and the way they are developed. The article presents the results of the analyses of the influence of these facilities on the development of urban fabric, initiated in the doctoral dissertation by Łabuz R. [5]. The research aims are to characterize and evaluate the spatial development of shopping centers, including, in particular, the determination of trends in the location and development of these areas over the years. The intensive expansion of large-format retail buildings in Poland over the past 30 years has been associated with a significant impact of this type of development on the urban structure. Determining how their areas are located and used will verify whether there are some trends in their spatial development and whether it is necessary to pursue possible changes in the way new shopping centers are shaped to improve the quality of the urban environment. The results of the research may be useful in planning and design practice in the process of creating urban spatial policy. This research is important because it verifies the effects of the current spatial policy by analyzing changes in the way the areas of Kraków’s shopping centers are shaped. The assessment of spatial distribution allows for an assessment of the level of dispersion of these facilities, which might be helpful for planning future investments.
This article is organized as follows: Section 2 describes the research method and data sources; spatial characteristics of the locations of Kraków’s shopping centers and their historical context are presented in Section 3; Section 4 shows the results of the analyses of land development of considered areas, based on the basic urban indicators. Section 5 identifies development trends in the manner of locating and arranging the areas of shopping centers; the conclusions of the research are presented in Section 6.

2. Materials and Methods

The research concerns spatial development and changes in the way of developing the areas of shopping centers located in Kraków, the second-largest city in Poland in terms of population. To identify them, the databases of commercial objects of Colliers International [39], the Polish Council of Shopping Centers (Polska Rada Centrów Handlowych) [40], the commercial real estate service “The City” [41], and our own urban inventory were used. The verification of the above-mentioned databases with the defining features of shopping centers allowed for the identification of 15 facilities of this type, located in the city.
As a result of the analyses of the aforementioned databases and the Municipal Spatial Information System of Kraków (MSIP Kraków) [42], information was obtained on the name of the shopping center, year of construction, gross leasable area (GLA), floor area, and number of storeys. Based on the original field research and comparison of Open Street Map data [43] and satellite images, information on the total leaf area of greenery was obtained. These data were collected and updated in the years 2019–2021.
To determine the type of changes related to the construction of a shopping center, such facilities were classified into two groups: brownfield and greenfield investments. The classification was made based on archival cartographic maps, satellite photos, and various literature sources.
The spatial analysis of shopping centers was performed using the QGIS software. GIS tools were used, among others, to analyze various phenomena taking place in cities, as well as to support decisions in spatial management, including choosing the optimal location [44].
First, the distances of individual shopping centers from the city center were determined. The distances were measured based on the designated centroids to obtain comparable values. Then, studies of the spatial distribution of shopping centers were carried out using statistics describing spatial dispersion using the standard deviation ellipse analysis and also using the nearest neighbor method. These analyses were carried out for point data in two classifications: according to the type of investment and the period of its implementation. The standard deviation ellipse enabled the determination of the scattering direction of shopping centers and the delimitation of the scattering area [45]. Analyses of spatial distribution are widely used in works in the field of geography, climate sciences, town planning, medicine, and criminology, among others [46,47,48,49]. They enable, for example, the comparison of changes in spatial development after the construction of an object constituting an impulse for the development, e.g., an airport [50]. They are also used to analyze the distribution patterns of commercial facilities [35,51]. The method of this research was adopted from Križan, Kunc, Bilková, and Novotná [38]. The CrimeStat method was used to calculate the standard deviation ellipse. This method is also used, e.g., in hot spot analysis [52]. The comparison of the standard deviation ellipses in different periods allows for the determination of changes in the directions of the spatial distribution of shopping centers.
On the other hand, the nearest neighbor method is used to describe the spatial concentration level of the examined shopping centers. For this purpose, the nearest neighbor index (NNI) is used, calculated according to the formula:
N N I = N N ¯ r a n ¯
where: N N ¯ —observed mean distance;
r a n ¯ —expected mean distance.
Expected mean distance is expressed by a formula:
r a n ¯ = 1 2 A N
where: N—number of point;
A—area under study.
Nearest neighbor index (NNI) is based on the method described by botanists Clark and Evans [53,54]. The values of NNI < 1 indicate a cluster of points, NNI ≈ 1 mean random distribution, and NNI > 1—a large dispersion of the examined facilities (Figure 3). The application of this method allows for determining whether shopping centers create concentration areas (clusters), or whether their distribution is dispersed [55]. This method is used to study the distribution and the existing correlations of both elements of the natural environment [56], and selected groups of objects of the built environment, among other things [57].
The next part of the research concerns the analysis of the way of organizing shopping center areas (land development) and their changes over the years. To compare individual areas, three urban indicators were calculated, often used in spatial planning, i.e.:
  • Building plot ratio (BPR), defined by the equation:
    B P R = F A   [ m 2 ] I A   [ m 2 ]
    where: FA—floor area;
    IA—investment area (area of land on which the shopping center was built—area of a plot of land).
  • 2.
    Floor area ratio (FAR), calculated according to the equation:
    F A R =   G F A   [ m 2 ] I A   [ m 2 ]
    where:   G F A —gross floor area of all floors of all buildings measured from the exterior faces of the exterior walls;
    IA—investment area.
    3.
    Green plot ratio (GPR), expressed by the equation:
    G P R = L A G   [ m 2 ] I A   [ m 2 ]
    where: LAG—total leaf area of greenery;
    IA—investment area.
    BPR and FAR allow for determining the degree of build-up of the investment plot, i.e., what part of the investment area is occupied by the building. GPR shows the share of green areas in the plot area of a shopping center. These are the parameters used in Polish planning documents at the municipal level. It is important to balance these indicators to limit the excessive development of built-up areas with the simultaneous lack of greenery.
    Then, changes in the values of these indicators were observed in two sections: time and distance from the city center. As a result, development trends were established to arrange the space of shopping centers. For this purpose, course charts were used to show trends in a series of values. From the data, linear trend functions were plotted. The comparison of their direction and the pitch angle allowed the identification of occurring development trends.

    3. Spatial Characteristics of Kraków Shopping Centers

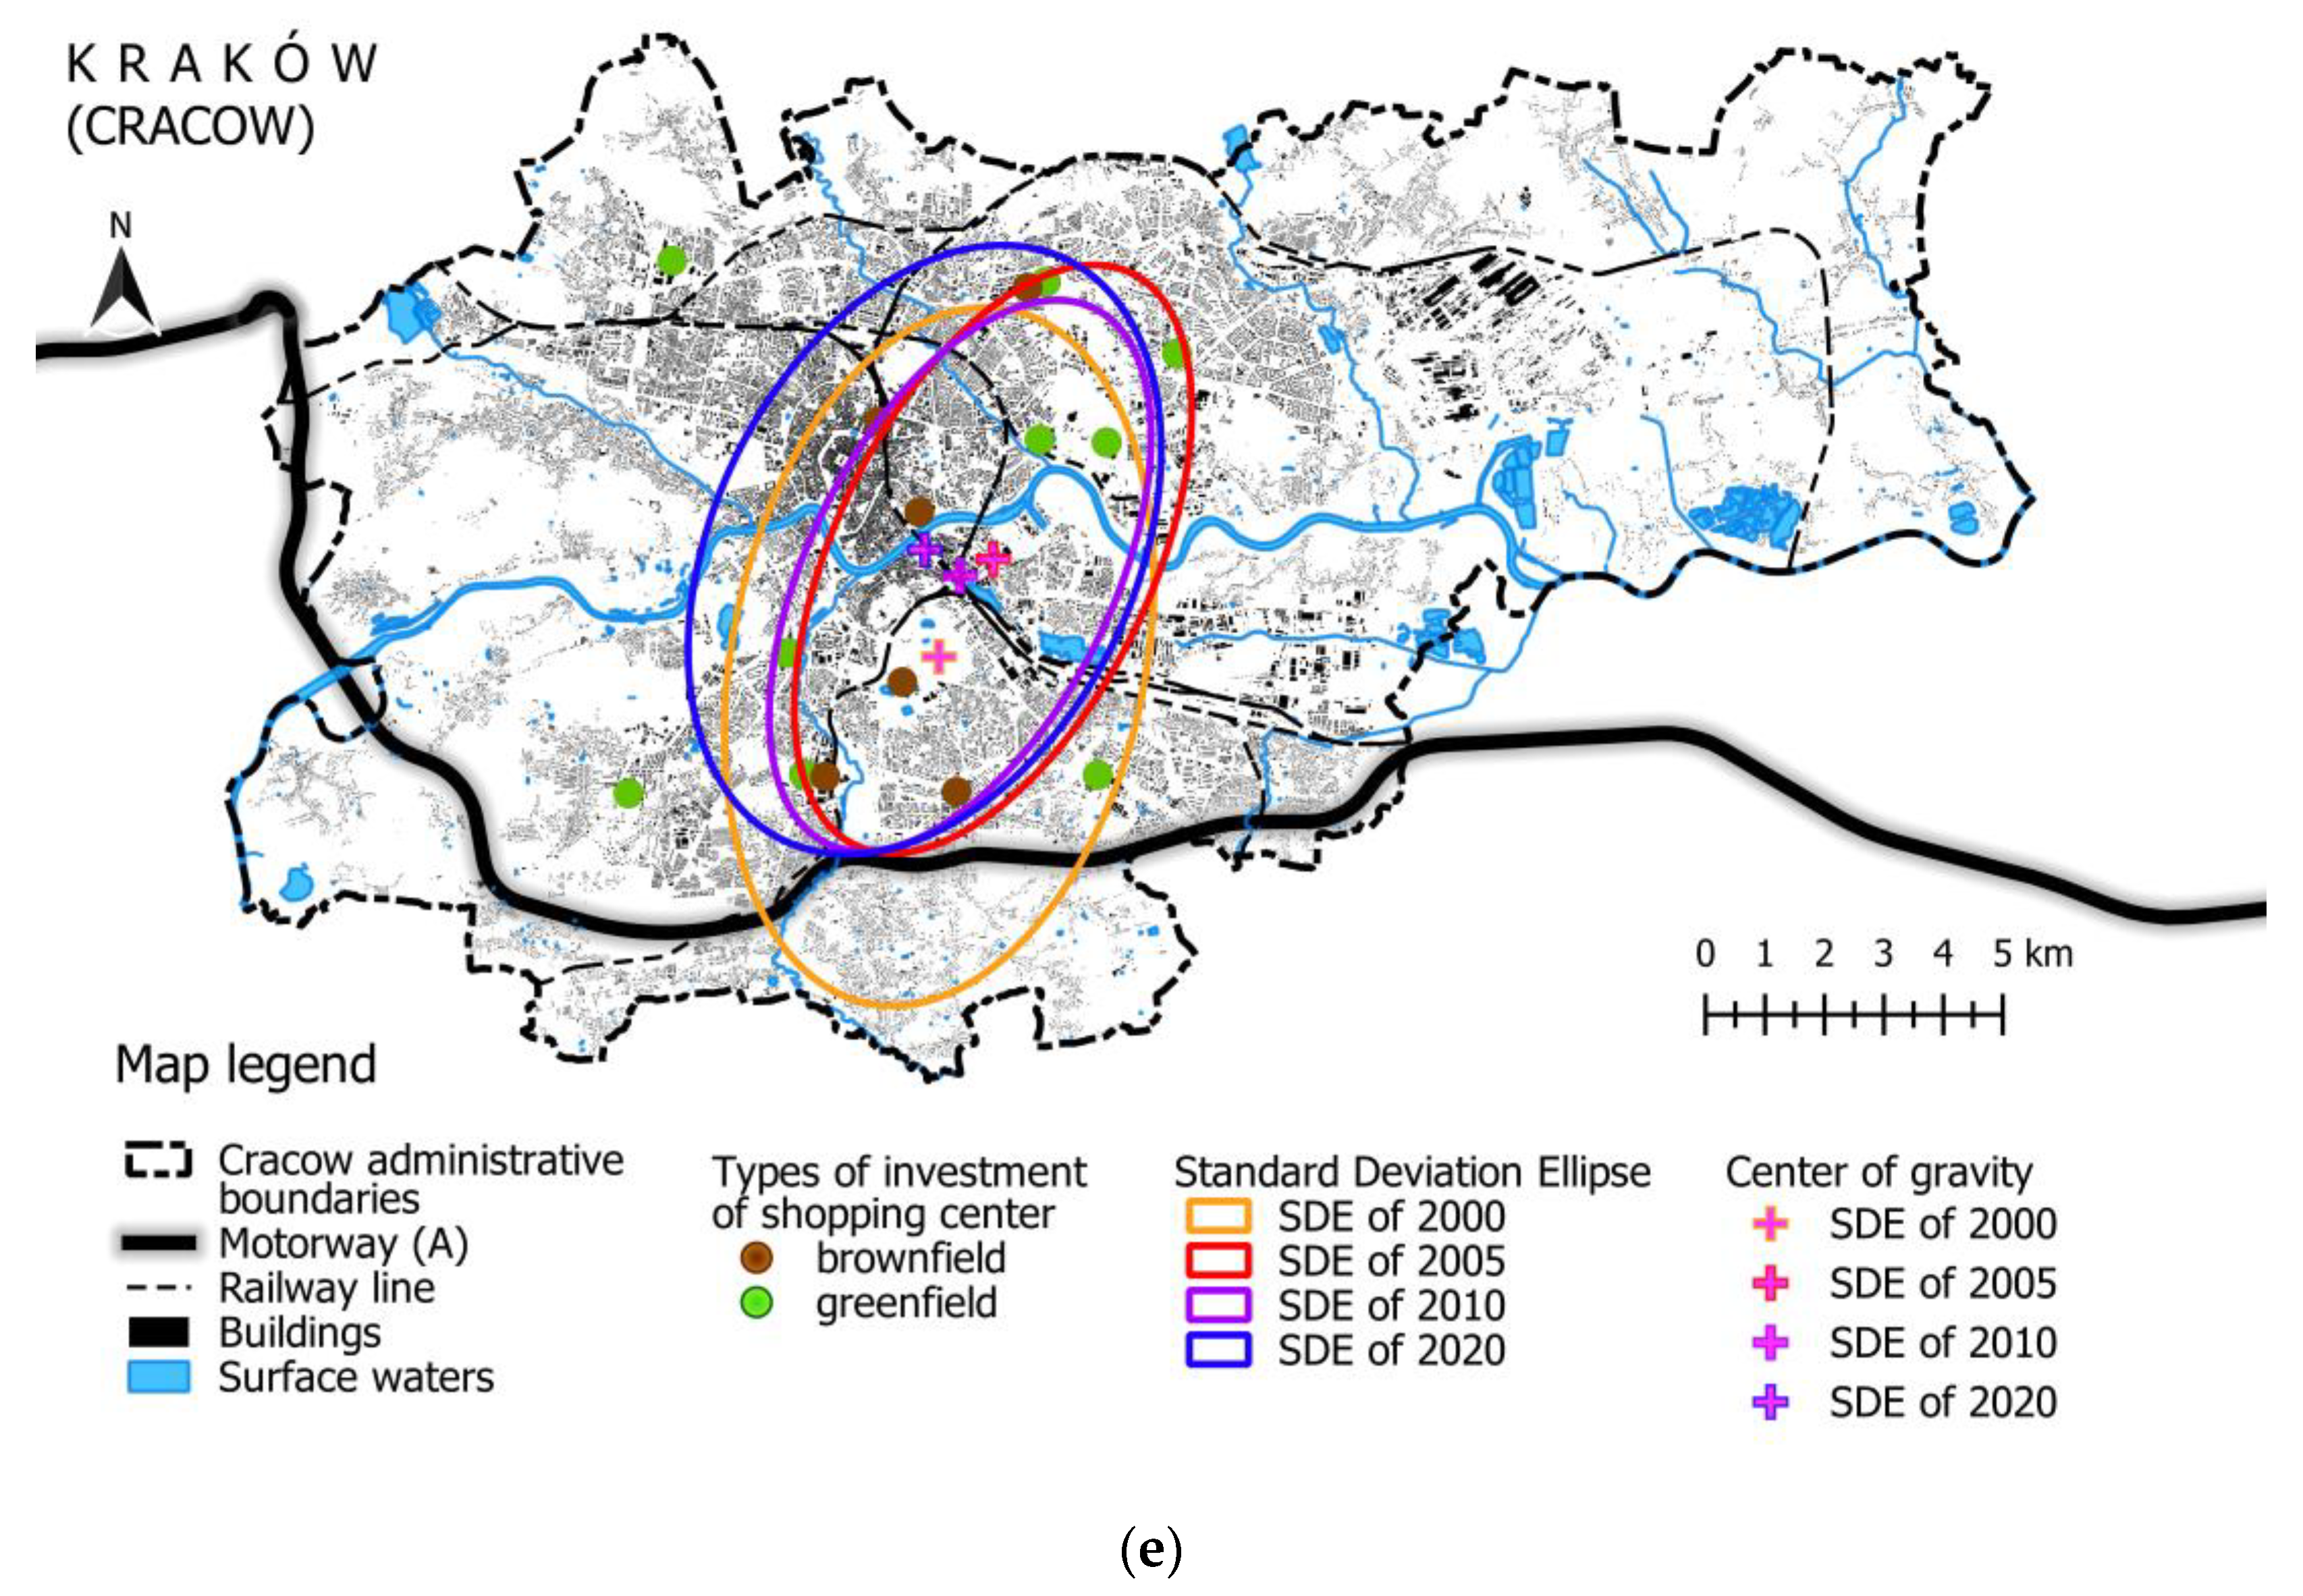
    3.1. Location of Shopping Centers in Kraków

    There are 15 shopping centers in Kraków (Figure 4). One of them—Plaza Kraków—was closed in 2021 and its demolition is planned for the future. The names used are proper names of the analyzed objects. However, Tesco Wielicka and Tesco Kapelanka, due to the recent change of the owner, are now called Kaufland Wielicka and Pasaż Kapelanka. Shopping centers are located in 9 out of 18 Districts of Kraków (Table 2) in the vicinity of important main class roads: fast traffic trunk road or main road. There are two shopping malls in the downtown area (intensively built-up zone with a variety of functions, characteristic of the area of the city center): Galeria Krakowska and Galeria Kazimierz. Galeria Krakowska is an element of the transport hub, connecting the railway station, bus station, and city public transport. The location of shopping centers in the vicinity of railway stations is a frequent indication, not always improving the functioning of the transport interchange [58].
    Most of the considered facilities are located in urbanized areas (zones comprising built-up areas forming continuous, compact spatial arrangements in which there are larger groupings of buildings, e.g., housing estates, service complexes, etc., well-connected to the city center via public transport, excluding larger storage and industrial-production complexes or those related to technical infrastructure) or low-urbanized areas (zones of discontinuous, dispersed buildings, located in the vicinity of compact green areas). Their surrounding areas are dominated by service, office, commercial, and multi-family residential buildings. There are uncontrolled greenery areas in the peripheral region. Kraków’s shopping centers are usually not adjacent to the waterside areas. The exceptions are: Galeria Krakowska located in the area of the Vistula River, Plaza Kraków located on the Staw Dąbski—an ecological site, under legal protection (wildlife conservation), and Bonarka City Center built in the area of small ponds (mineral voids) created after the operation of the former Bonarka brickyard.
    Analyses of the distance of Kraków’s shopping centers from the city center show that they are located within a radius of 0.9–6.83 km (Figure 5). The closest to the Main Square is Galeria Krakowska, 0.9 km away. The farthest is Tesco Wielicka, located in the south-eastern part of Kraków, by the exit road towards Wieliczka (distance 6.83 km).

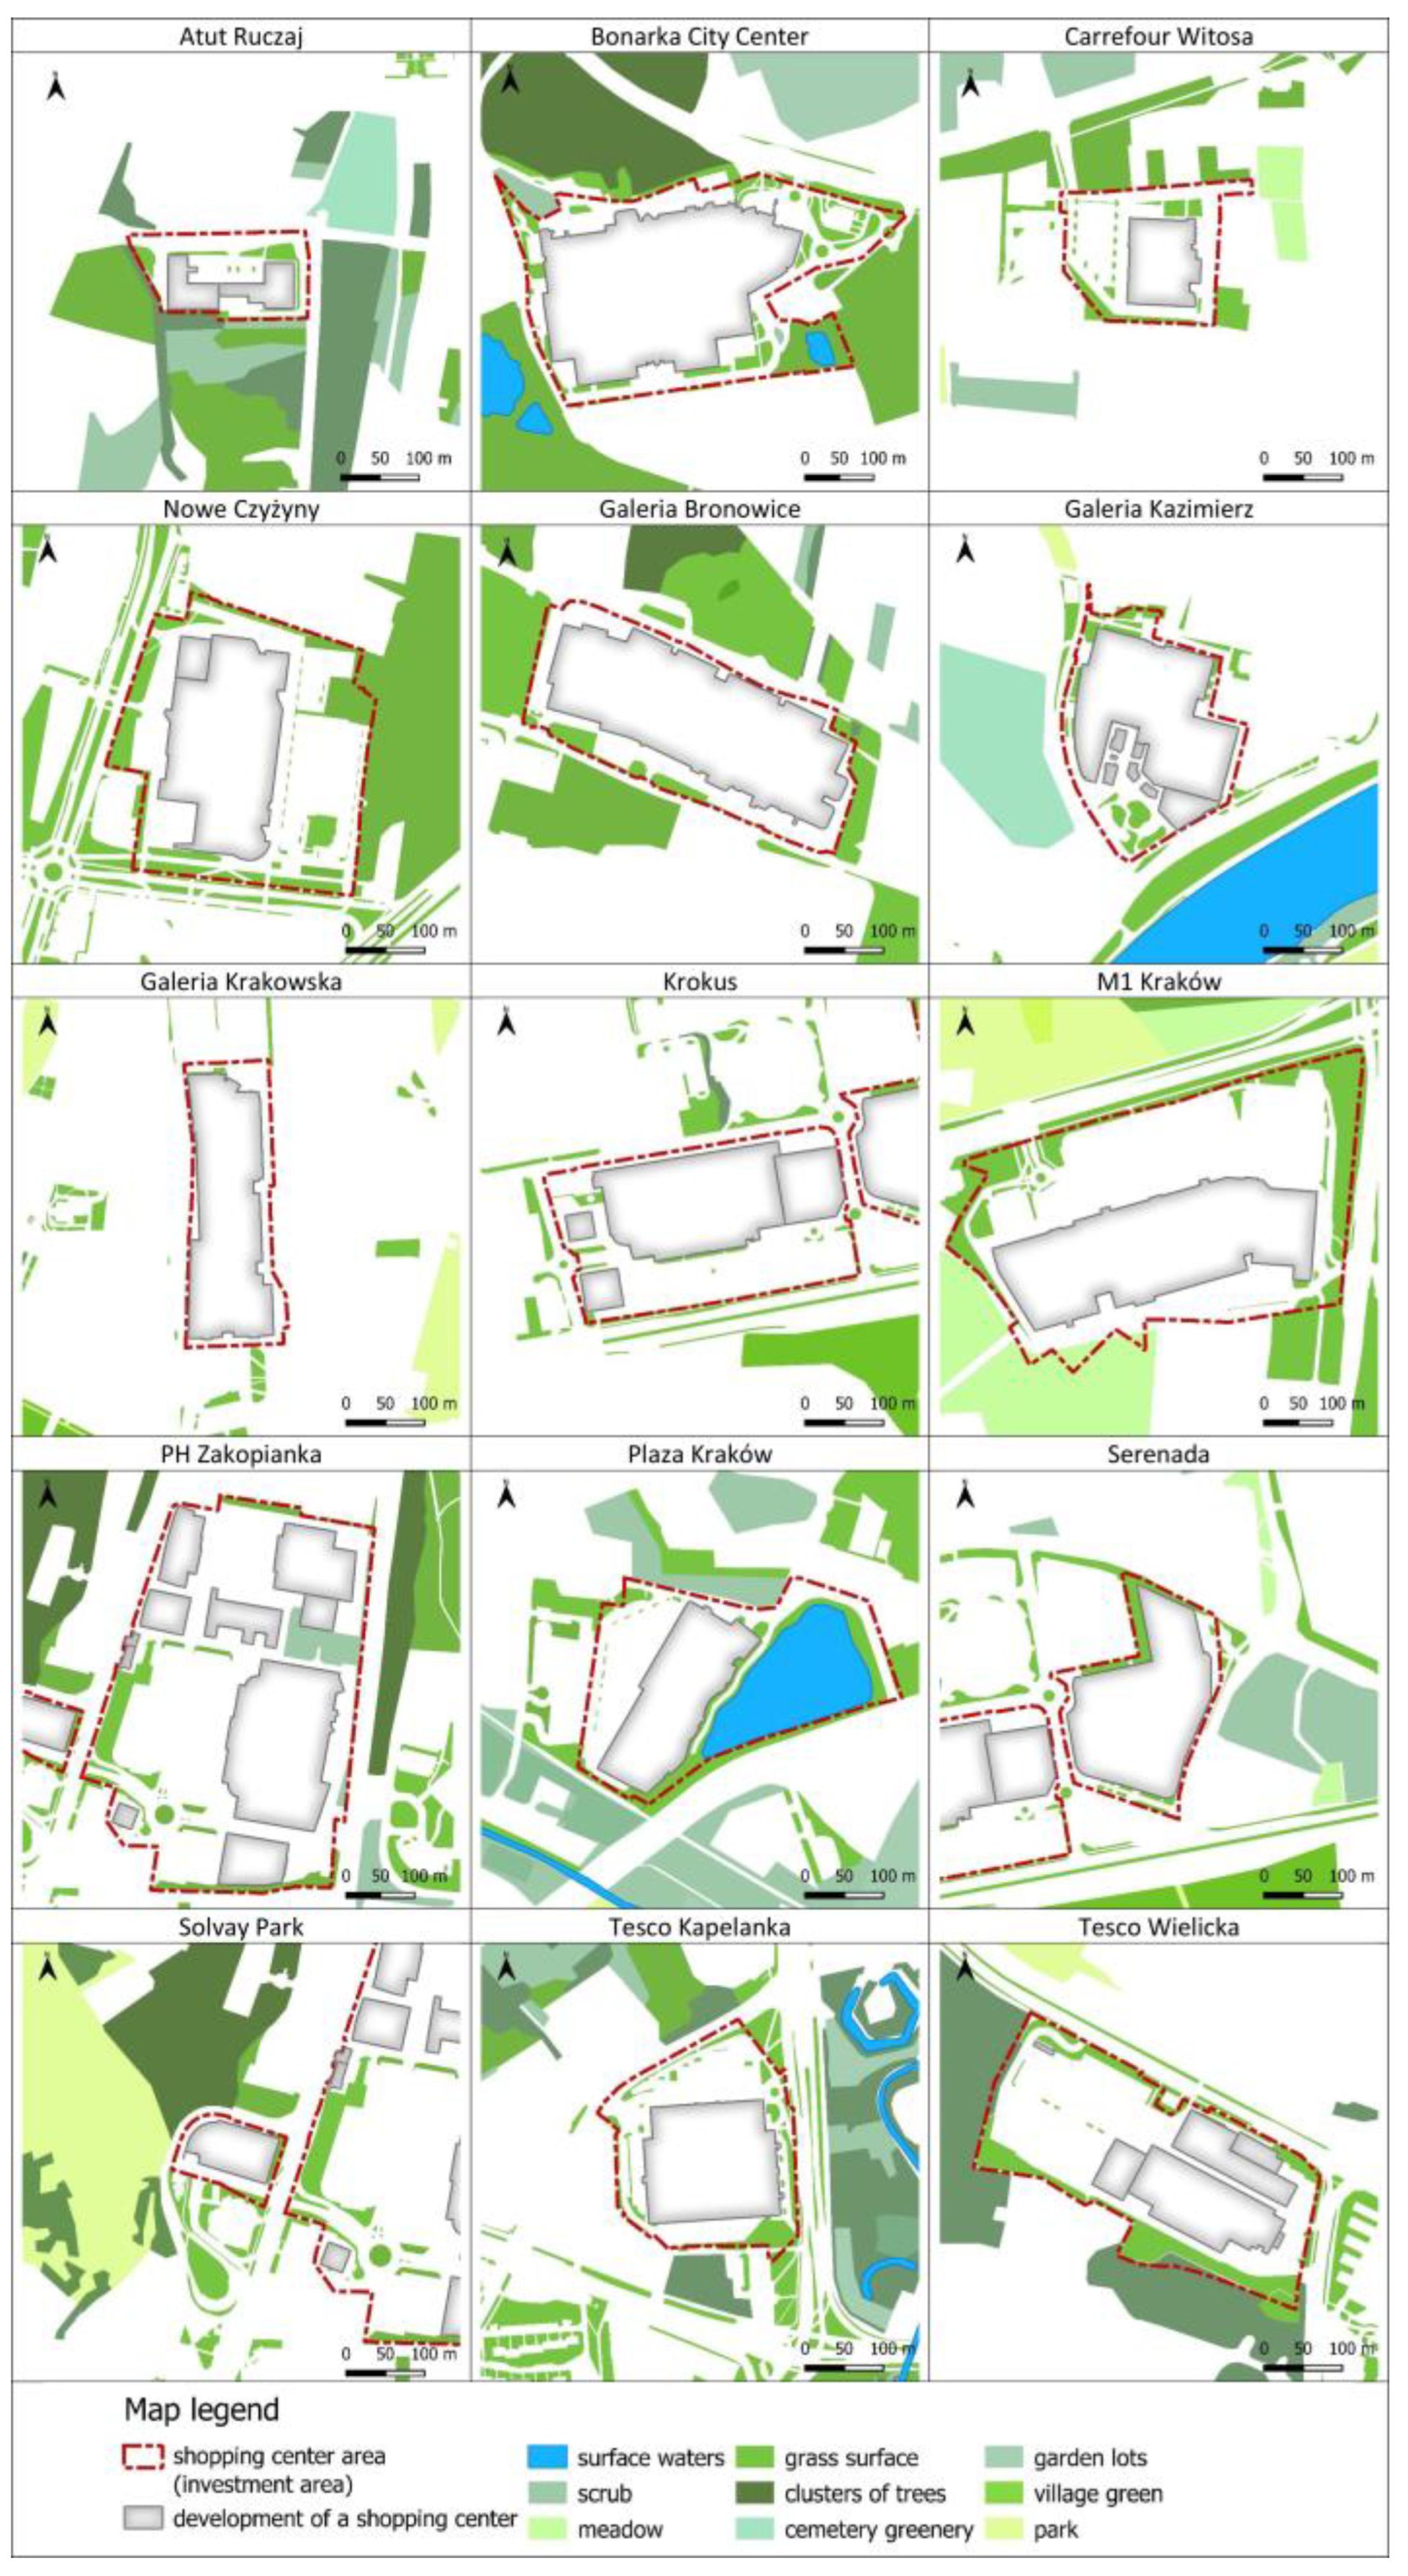
    3.2. The Spatial Development of Kraków Shopping Centers

    The first shopping centers in Kraków were established in 1997. They were: Krokus, Tesco Wielicka, and Carrefour Witosa. They were examples of commercial centers included in the so-called first-generation, dominated by one large-format tenant (a hypermarket with a few accompanying, smaller shops) [34]. In the following years, facilities representing the second and third generations were realized (Figure 6). As the generation grew, the variety of functions increased, and the hypermarket ceased to be the dominant tenant. The first fourth generation shopping center in Kraków was built in 2009. It is a multifunctional facility that combines retail, services, entertainment, and office functions in the neighboring buildings. The evolution of Kraków and Polish shopping centers, in general, is similar to the development of this type of project in the USA and Western Europe [5]. The first investments usually included smaller buildings with one or two storeys, located on the periphery. Subsequent projects created an ever larger and multifunctional complex.
    Most of Kraków’s facilities are the so-called traditional shopping malls, known as enclosed shopping centers. Only Park Handlowy Zakopianka is an example of an open-air shopping center.
    Shopping centers have a diverse genesis. They are created both in open areas, so far undeveloped, and in areas previously fulfilling other functions. These facilities are sometimes implemented as part of the revitalization of former production or industrial plants, redevelopment of post-mining sites, or as part of the transformation of other service areas. They are also created as an element of a transport node, e.g., within an existing or planned railway station, or as part of an airport city near major airports.
    This paper adopts a basic division, distinguishing each type of project as either greenfield investments—built on undeveloped areas, or brownfield investments—built as part of the revitalization, adaptation, or transformation of areas that have lost their utility functions.
    Based on the analysis of the history of the construction of shopping centers in Kraków, six facilities were classified as brownfield investments, and the remaining nine were classified as greenfield investments. Kraków brownfield investments are most often examples of the revitalization of the former production and industrial sites and post-excavation sites (residual sites), or the transformation of transport functions, e.g., areas of the former airport or bus stations. Similar trends are observed in other large Polish cities [5]. For example, Galeria Kazimierz was built on the ground of the former meat processing plant (now it is the central area of the city). Galeria Krakowska was built as part of the transformation of the now-demolished bus station in the downtown area.
    A characteristic feature of Kraków’s brownfield projects is their spatial distribution, clearly concentrated along the north–south axis, with a slight deviation to the east (Figure 7). The tilt angle of the standard deviation ellipse is 11 degrees north-east with an eccentricity of 0.96. Greenfield investments are more dispersed in relation to the city center with a tendency to develop east–west. The angle of the standard deviation ellipse is 39.32 degrees north-east, and the eccentricity is 0.70 (Table 3).
    The results of the nearest neighbor analysis indicate a clear dispersion of commercial facilities regardless of the type of investment—NNI is significantly above 1 (Table 4). The observed average distance between buildings is over 2 km, with brownfield investments being located closer to each other. In contrast, the analysis of the standard deviation ellipse shows that brownfield investments were mainly realized along the north–south axis, with no east–west dispersion. Greenfield investments are scattered in different parts of the city.
    Analyses of changes in the dispersion of shopping centers in 2000, 2005, 2010, and 2020 (Table 5) showed that the first shopping centers developed along the north–south axis, with the highest concentration in the southern part of Kraków—the center of gravity for built facilities until 2000, it was 3.7 km to the south from the center (Figure 8a). In these areas, an extensive shopping complex was built at Zakopiańska Street, as well as the first hypermarkets located along the main road arteries. These facilities were located peripherally to the city center. In the years 2000–2010, the flattening of the standard deviation ellipse and the shift of the center of gravity towards the north were visible—the distance from the center in 2005 was 3 km and in 2010 it was 2.8 km (Figure 8b,c). During this period, there was a significant development of shopping centers in the central area of the city and in the eastern part. Thus, the angle of the ellipse axis increased concerning the north. This proved the greater concentration of shopping centers and their development in the central and eastern parts of Kraków. This is probably related to the progressive development of buildings between the city center and Nowa Huta, as well as the construction of new housing estates and service concentration zones in the north-eastern part of Kraków. It is also associated with the revitalization of former industrial sites in the areas of intensification of development. In the period 2010–2020, there was a redevelopment of peripherally located shopping centers (Figure 8d). The gentle convex of the standard deviation ellipse proved a further gradual dispersion of the analyzed facilities. It was related to the construction of two shopping centers in the north-west and south-west part of Kraków and one in the north-east region, connected with the main road system. These two objects were outside the area defined by the standard deviation ellipse. Their location in the northern parts of the city caused the center of gravity to shift closer to the city center again—in 2020 the distance was 2.0 km.
    Based on the results of the nearest neighbor analysis, it can be seen that in the subsequent periods the observed average distances between shopping centers decreased from about 3.2 km to 1.6 km. NNI also gradually decreased (Table 6). This meant that over the years there was an increasing concentration of shopping centers. Nevertheless, in the last 10 years, new investments resulted in a slight increase in the observed average distance. It should be emphasized that despite these slight tendencies to concentrate NNI still reached the value above 1 (NNI = 1.40), which meant that shopping centers in Kraków are characterized by a significant dispersion.

    4. Land Development of Kraków Shopping Center Areas—Indicators

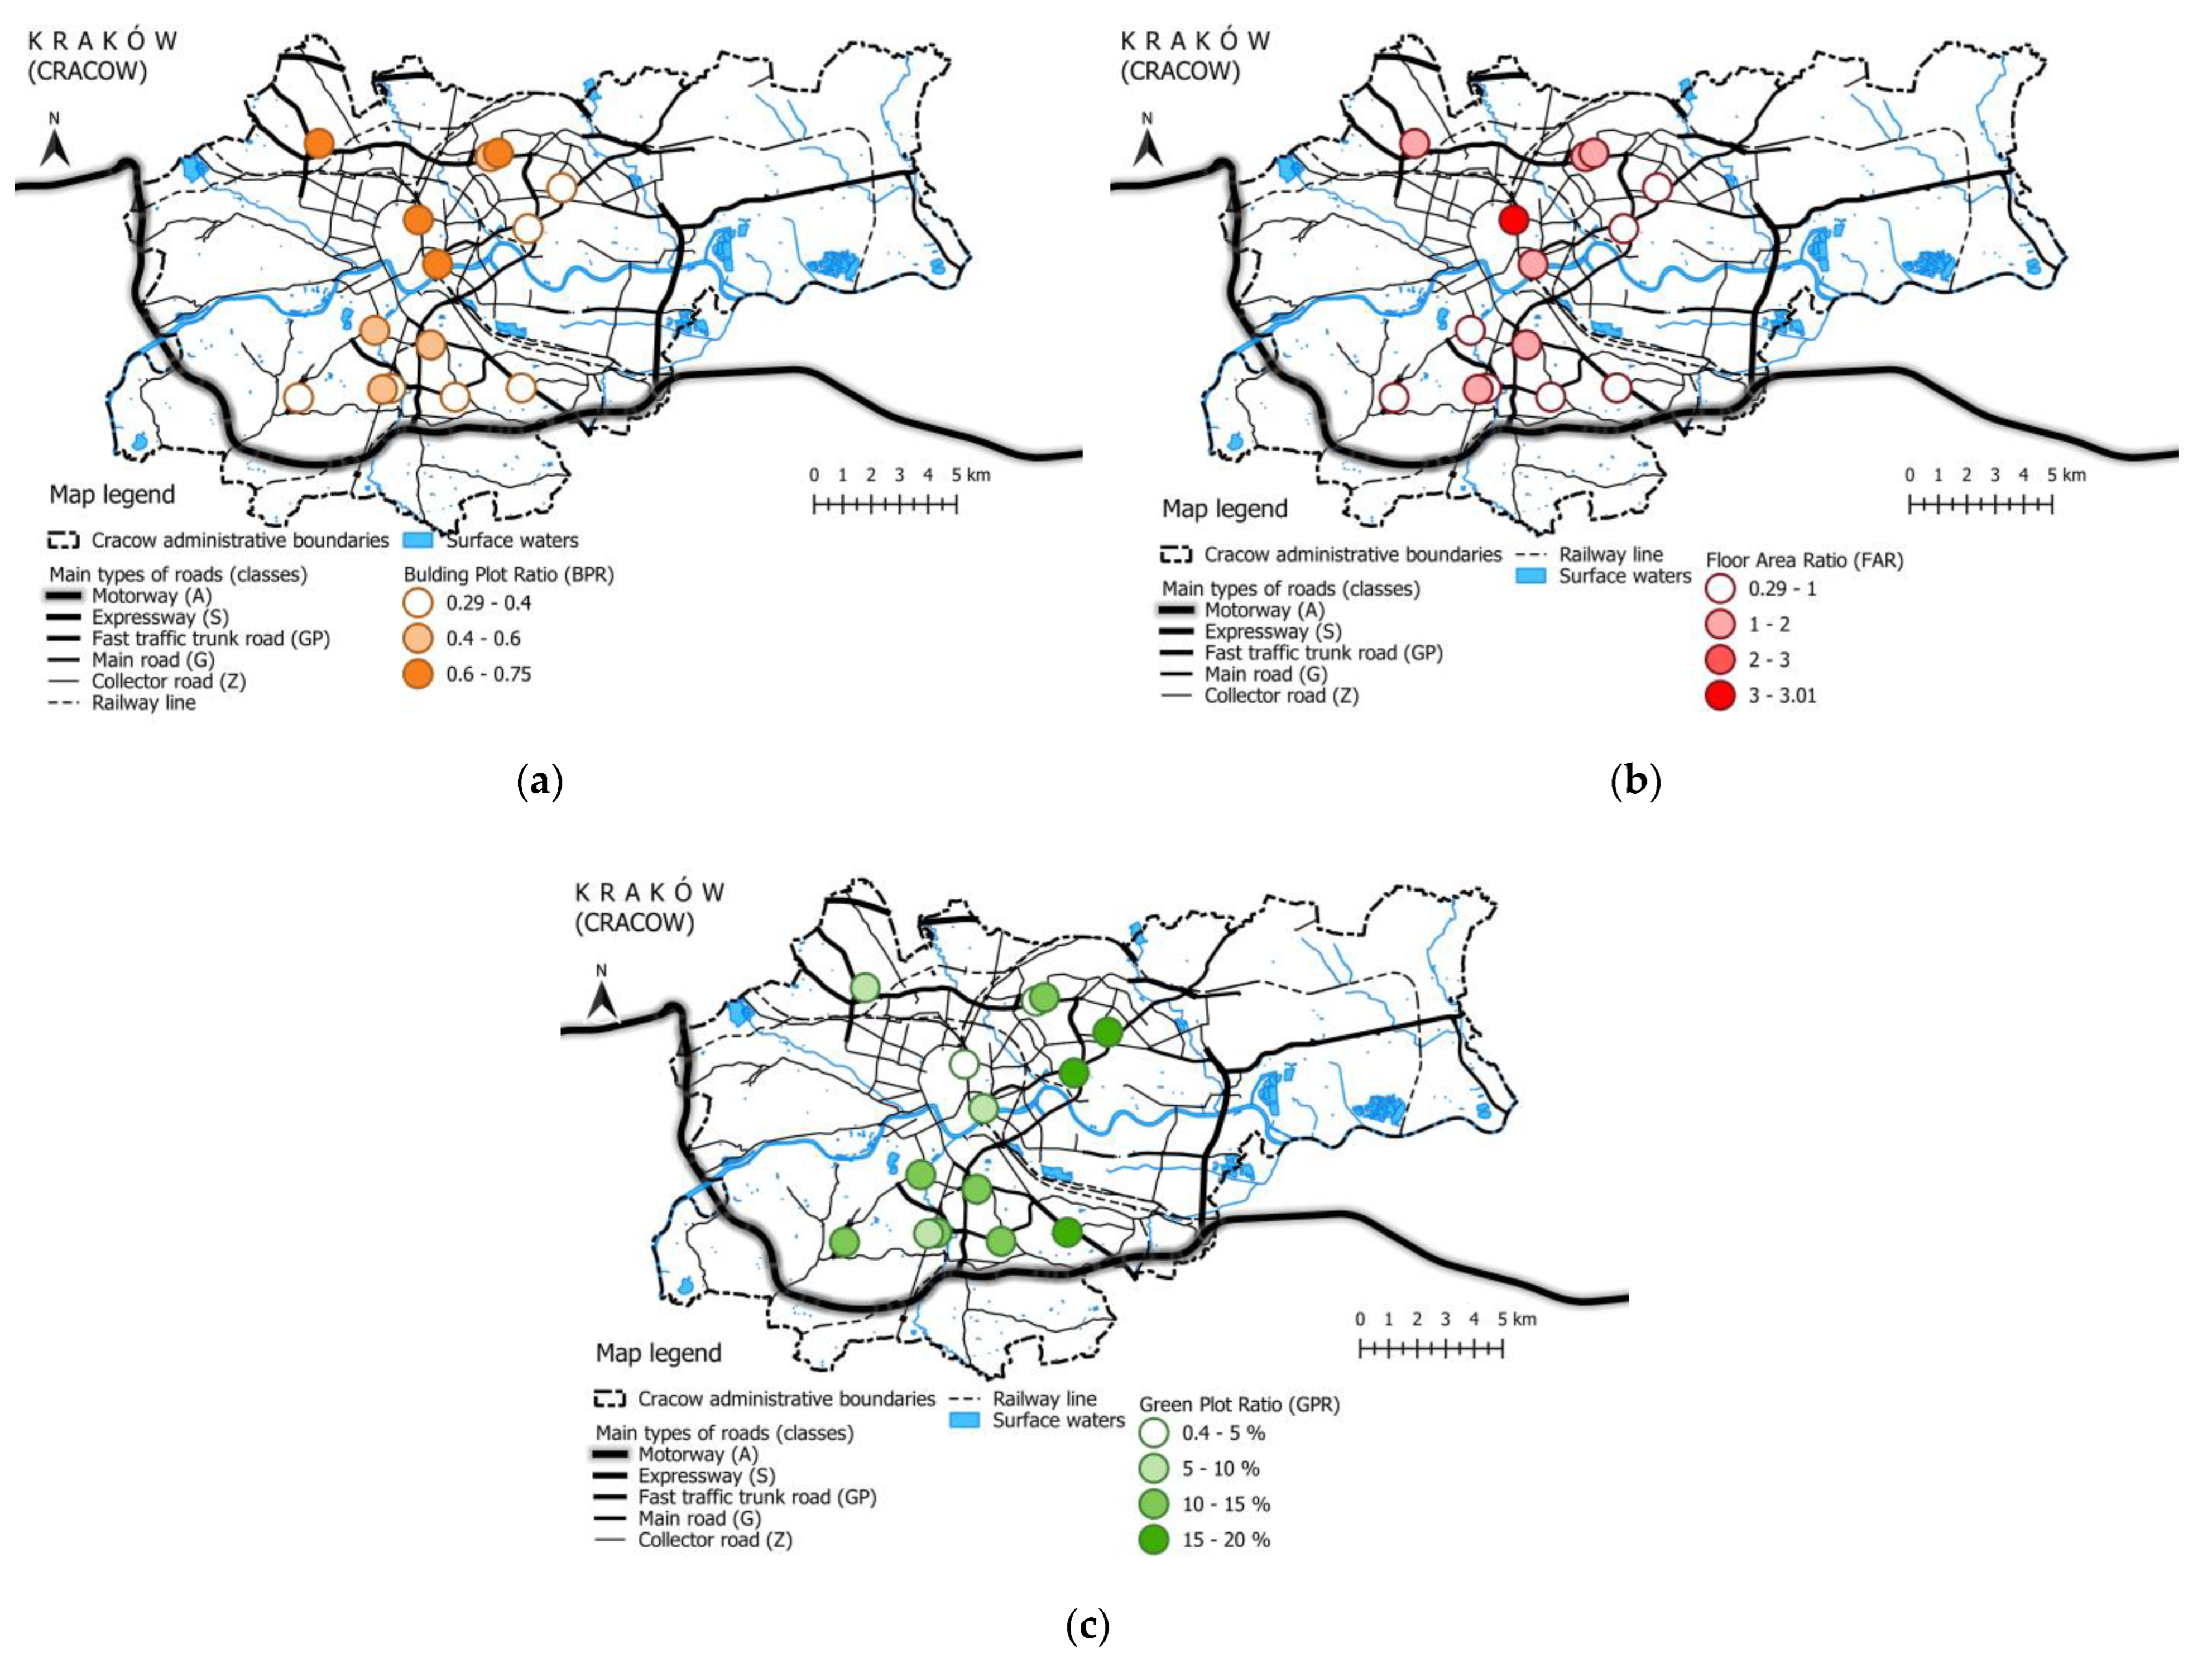
    4.1. Land Development Analysis

    The further part of the research concerns the tendencies in the way of developing the areas of shopping centers. For this purpose, three selected land development indicators were analyzed:
    • Building plot ratio (BPR);
    • Floor area ratio (FAR);
    • Green plot ratio (GPR).
    First, based on field research and analysis of satellite images and data from the national spatial information system (Geoportal), the areas of Kraków shopping centers were inventoried, defining the areas of investment area, buildings, green areas, and surface waters (Figure 9). With the use of GIS tools, individual indicators were calculated for each shopping center (Table 7).
    The analysis showed that the largest investment area was PH Zakopianka, while the Solvay Park has the smallest plot. The smallest shopping center in terms of floor area (FA) is Solvay Park with an area of 6174.00 m2, and the largest is Bonarka City Center with an area of 70,836.00 m2.
    Shopping centers in Kraków have an average BPR of 0.47, which means that nearly half of the investment area is built-up. The smallest index is about 1/3 of the plot, and the highest is 3/4 of the plot. A greater differentiation is visible in the case of the floor area ratio, the average value of which is 0.98. The highest index is three times the area of the investment area. Galeria Krakowska has the lowest rate of the green plot ratio. On the other hand, the highest rate—over 40%—concerns the case of Plaza Kraków. It is an exception due to the ecological site (Staw Dąbski) within the investment area. The average green plot ratio for all shopping centers is 12.92%. Without Plaza Kraków, average green plot ratio is 10.94%. This is a relatively low result because planning documents often provide its value at the level of 20% [5].
    Research on the land use of the areas of individual shopping centers also showed that in 40% of cases the built-up area covers more than half of the investment area (Figure 10). In 27% of the examples, the hardened area (parking lots, internal roads, pedestrian access, technical zone) constituted more than half of the investment area. A large proportion of the hardened area was related to the presence of a large-area ground level car park. Lower parameters were achieved in the case of multi-storey car parks. Then, however, a large part of the plot was occupied by the building of the shopping mall. In most cases, the total leaf area of greenery was a small part (less than 20%) of the shopping center area, regardless of the form of the car park.

    4.2. Development Indicators—Spatial Characteristics

    The analyses of the building plot ratio allowed for the classification of shopping centers into three groups (Table 8). Plaza Kraków was excluded from the analyses of spatial characteristics of development indicators, because it takes extreme values, especially green plot ratio. The most numerous were objects with BPR in the range 0.29–0.4. They did not form clusters, but were scattered in the southern and eastern parts of Kraków (Figure 11a). The centers achieving BPR of medium size are concentrated in the southern part of the city. On the other hand, a similar number of shopping centers had the highest index parameters (above 0.6) and are located in the northern area of Kraków.
    In the case of FAR, shopping centers with the lowest index—below 1—were similarly the most numerous group. They are located in the southern and eastern parts of the city (Figure 11b). Almost all facilities did not exceed an FAR of 2.0. Only Galeria Krakowska had an index of 3.01. It is the closest to the city center. The distribution of shopping centers in terms of FAR was similar to that of the BPR.
    Almost all shopping centers achieved GPR below 20% regardless of their location (Figure 11c). Only in the case of Plaza Kraków, the share of green areas exceeds 40%—that is why it was excluded from the analysis. This was because the ecological site Staw Dąbski belongs to the area of the shopping center. Green plot ratio for shopping centers is very low. This confirmed the general impression that paved surfaces, in particular those with a communication function, prevailed around such facilities.

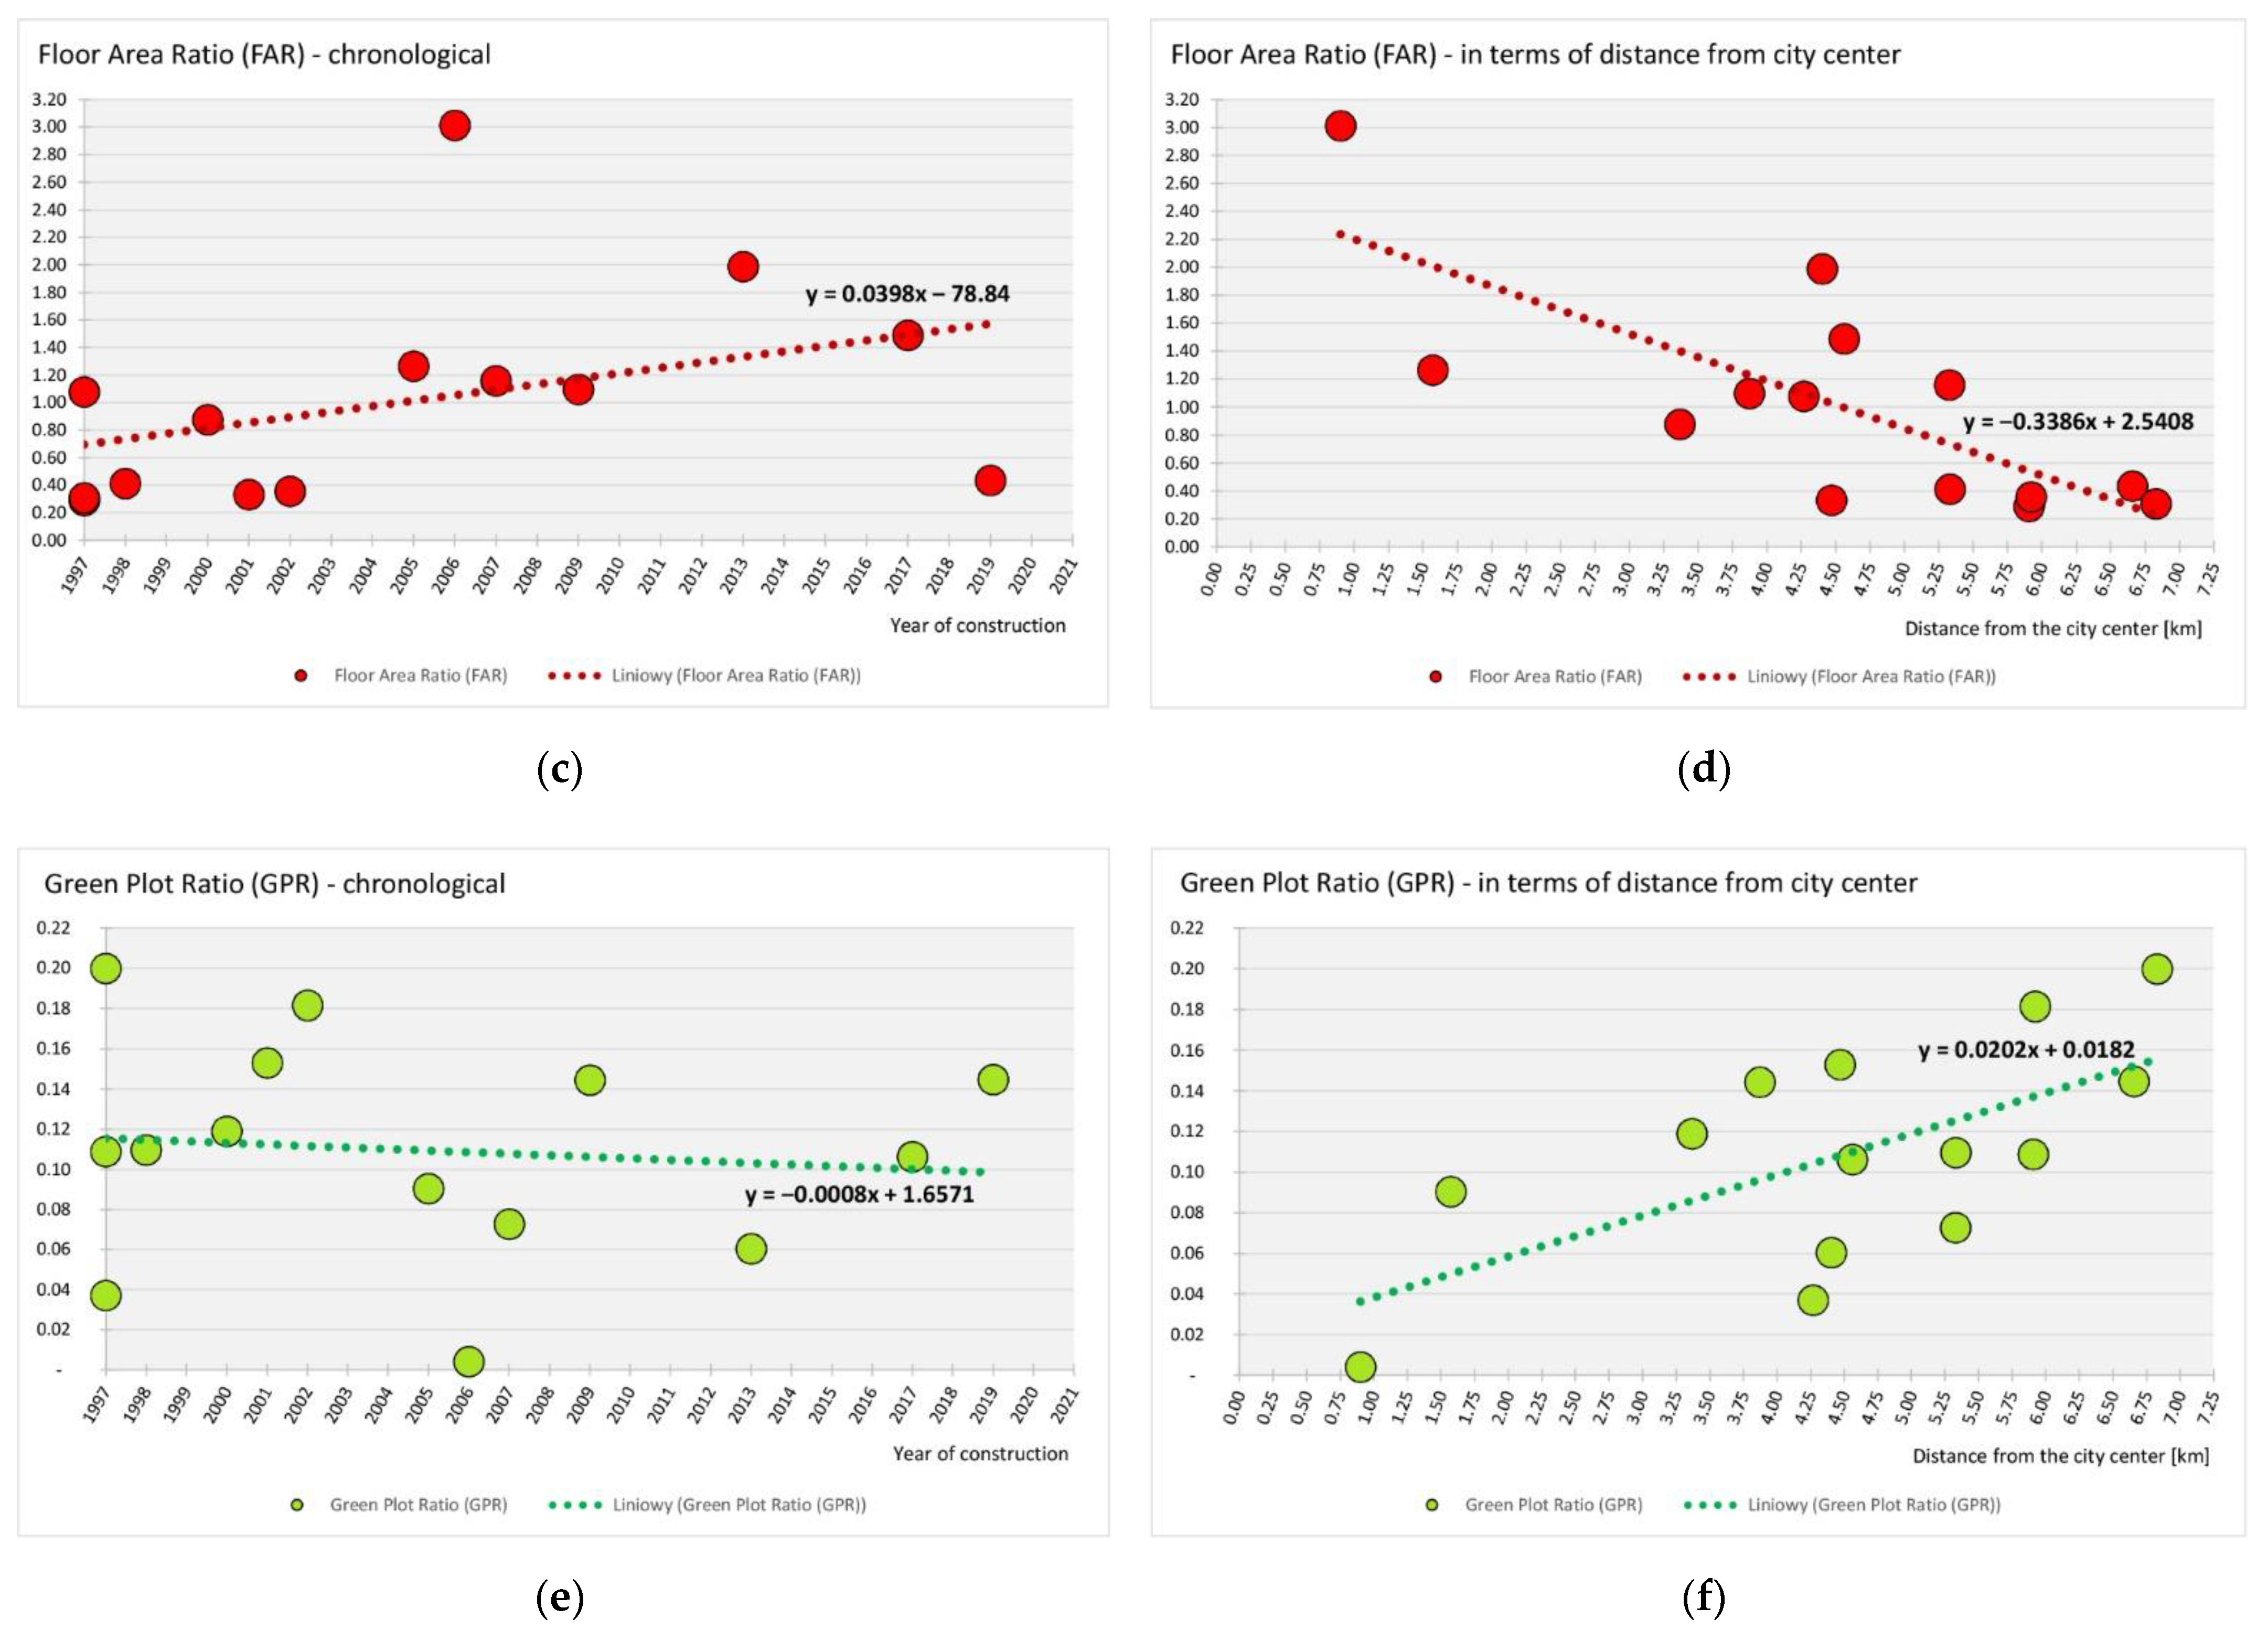
    5. Transformations of the Urban Tissue Related to the Construction of a Shopping Center—Development Trends

    The construction of a shopping center involves transformations of the urban fabric, including changes in the way of use or the communication system. The type and degree of these transformations may be related to the construction period of the facility and its location in the city. For this reason, the type of investment and land development indicators were analyzed in the context of changes in time and distance from the city center. Table 9 presents a chart of selected parameters of shopping centers, including year of construction, type of investment, distance from the city center, and analyzed land development indicators (BPR, FAR, and GPR). The oldest shopping centers are mainly brownfield investments, and their BPR is in the range of 0.29–0.52. Since 2005, this indicator has reached values greater than 0.55, with the exception of the last implementation. Galeria Krakowska, located closest to the city center, has the lowest GPR and at the same time the highest FAR. In turn, the farthest located shopping center has one of the lowest BPR and FAR ratios and one of the higher GPRs.
    The analysis of the relations of the type of investment on the construction period showed that in the first years of the development of shopping centers in Kraków, these facilities were brownfield investments. Then there were implementations in previously undeveloped areas. However, the studies did not show a clear correlation with time (Figure 12a). Different types of investments were built at different time periods. It can be noticed that the recent projects were examples of greenfield investments.
    The research shows that brownfield investments were located closest to the city center (Figure 12b). On the other hand, with the distance from the central area, the types of investments occurred alternately. The farthest shopping centers were greenfield investments.
    Analyses of changes in the land use of shopping center areas over the years indicated a weak upward trend in the case of BPR and FAR (Figure 13a,c). Over time, subsequent shopping centers occupied an increasing part of the investment area, and their building plot ratio was growing. On the other hand, GPR showed a minimal downward trend with time (Figure 13e)—it should be noted that the pitch angle of the trend line was close to zero (Table 10). This meant that newer shopping centers were characterized by a slightly smaller share of green areas.
    Analogous analyses of changes in land development, depending on the location in relation to the city center, showed the opposite trend. Along with the increase in the distance of the shopping center from the central area of Kraków, a clear decline in BPR and FAR was observed (Figure 13b,d). Shopping centers located further and further from the downtown area occupied a smaller and smaller part of the investment plot, and their floor area ratio was decreasing. This could have been related to the gradual decrease in the floor area of the farthest buildings. The analyses also showed an upward trend in the GPR. (Figure 13f), which meant that the share of green areas around a shopping center increased with the distance from the city center. It should be also emphasized that the GPR constantly maintained very low values (below 20% of the investment area).
    Table 10 shows that the steepest slope of the trend line applies to FAR, both in the case of chronological rank order and in relation to the distance from the city center. Changes in the way shopping center areas are developed over the years show a positive tangent of an angle in the case of BPR and FAR indicators and a negative one for GPR. The inverse correlation occurs when the distance from the city center increases.

    6. Discussion and Conclusions

    Over the last 30 years, there has been an intensive development of shopping centers in Poland. These facilities are still being implemented, but their dynamics are gradually declining. The phenomenon of collapse and closure of this type of investment, such as Plaza Kraków in Kraków or Sukcesja in Łódź, is also slowly being observed. It is a characteristic stage in the life cycle of shopping centers [59], noticed for a long time, especially in the United States. Already at the beginning of the 21st century, city planners drew attention to the problem of their collapse and the need for re-use [60].
    More shopping centers are planned in Kraków, with the pace of their growth decreasing in recent years. The conducted research has shown that Kraków’s facilities are being developed both as brownfield and greenfield investments. Construction projects implemented in post-industrial areas are scattered along the north–south axis of the city, while greenfield investments are located further away from its central area. In a broader aspect, it manifests itself in taking good-quality land for shopping centers on the outskirts of the city (the so-called greenfield) [61], and at the same time striving to locate smaller premises in the very center or in its immediate vicinity as part of the brownfield investment [62]. The analyzed facilities are most often located in already urbanized areas or in the area of developing complexes of buildings, both residential and commercial. The location of new shopping centers in Kraków means that their center of gravity is closer to the central area. A similar trend was observed in Shanghai [35]. The analysis of the dispersion of the examined shopping centers showed that over the years they were gradually concentrated, but still characterized by their dispersion (NNI = 1.4). From the point of view of planning the location of this type of investment, this is a favorable indication, because it limits the possibility of competition, and as a result, for example, the need to close nearby facilities. This indicator shows a certain tendency in the scale of the whole city; therefore, it does not explain the case of Plaza Kraków. Looking at the local scale, it can be noticed that Plaza Kraków is located relatively close to M1 Kraków—the distance between the buildings is approximately 1 km. The competition of large-scale commercial facilities may not be the only reason for their closure. The following are of great importance: the size of the population, location in relation to major traffic flows, distance from other shopping centers, and residential areas [63].
    An important observed trend, in terms of social and environmental aspects, is the search for land for new commercial facilities closer to the downtown area and the shifting of the commercial service center closer to the real city center (Figure 8). This model seems to be a more advantageous way of linking retail trade with sustainable spatial development of cities [38,64].
    The results of analyses of changes in the development of shopping center areas indicate that over the years there has been a discrete trend of building facilities occupying an increasing part of the investment plot. On the other hand, the share of the total leaf area of greenery is slightly decreasing, the indicator of which remains at a relatively low level—on average at the level of approximately 13% of the investment area (without Plaza Kraków at the level of almost 11%). This is an unfavourable phenomenon in the context of sustainable development and environmental quality in the city. Currently, in Poland, there are no generally applicable standards regarding the size of land development indicators of shopping centers. In the current planning documents of Kraków, building plot ratio is less and less often used in favor of floor area ratio. The size of FAR is variously determine in the case of large-format commercial facilities, in the range of 0.1–6.5. On the other hand, green plot ratio is most often determined at the level of min. 20% of the plot area. Against this background, results of the research show that the average GPR size is clearly lower than assumed in the planning documents.
    The protection of green areas and the creation of new ones, even of a small scale, such as pocket parks, is an important direction of spatial policy, aimed at increasing the accessibility of public spaces and improving environmental conditions [65,66]. On the other hand, as the distance from the city center increases, the indicators for the floor area and groos floor area of shopping centers development are clearly decreasing. Moreover, the share of green areas is growing moderately, although this indicator remains at a level not exceeding 20%. These results show the need to take actions to enforce a greater share of green areas within shopping center areas and the need to care for the quality of their surroundings. The aim of such activities is not only to improve the living conditions in the city but also to possibly enable more efficient adaptation of large-scale commercial facilities to other functions. It is related to the problem of using dead shopping centers.

    Author Contributions

    Conceptualization, R.Ł.; methodology, R.Ł.; software, R.Ł.; formal analysis, R.Ł.; investigation, R.Ł.; resources, R.Ł. and R.B.; data curation, R.Ł.; writing—original draft preparation, R.Ł.; writing—review and editing, R.B. and R.Ł.; visualization, R.Ł.; supervision, R.B. All authors have read and agreed to the published version of the manuscript.

    Funding

    This research received no external funding.

    Institutional Review Board Statement

    Not applicable.

    Informed Consent Statement

    Not applicable.

    Data Availability Statement

    The datasets used and analyzed during the current study are available from the corresponding author on reasonable request.

    Conflicts of Interest

    The authors declare no conflict of interest.

    References

    1. Colemann, P. Shopping Environments. Evolution, Planning and Design; Architectural Press: Oxford, UK, 2006. [Google Scholar]
    2. Kramer, A. Retail Development; Urban Land Institute (ULI): Washington, DC, USA, 2008; Available online: https://gradstudents.wpcarey.asu.edu (accessed on 14 March 2022).
    3. American Society of Planning Officials. PAS Information Report No. 59 Site Design, Parking and Zoning for Shopping Centers. APA’s Planning Advisory Service 1954. Available online: https://www.planning.org/pas/reports/report59.htm (accessed on 21 February 2022).
    4. Lambert, J. One Step Closer to a Pan-European Shopping Center Standard. Illustrating the New Framework with Examples. Features Res. Rev. 2006, 13, 35–40. [Google Scholar]
    5. Łabuz, R. Shopping Centre as an Impulse for the Development of the Urban Structure of the City. Case of Krakow. [Centrum Handlowe Jako Impuls Rozwoju Struktury Urbanistycznej Miasta. Przykład Krakowa]. Ph.D. Dissertation, Cracow University of Technology, Krakow, Poland, 2021. [Google Scholar]
    6. Wall, A. Victor Gruen: From Urban Shop to New City; Actar: Barcelona, Spain, 2005. [Google Scholar]
    7. De la Cal, P. Greenfield/Brownfield: Two Sides of the Same Coin. In Urban Visions: From Planning Culture to Landscape Urbanism; Díez Medina, C., Monclús, J., Eds.; Springer: Cham, Switzerland, 2018; pp. 299–308. [Google Scholar] [CrossRef]
    8. Cao, K.; Guan, H. Brownfield redevelopment toward sustainable urban land use in China. Chin. Geogr. Sci. 2007, 17, 127–134. [Google Scholar] [CrossRef]
    9. Thornton, G.; Franz, M.; Edwards, D.; Pahlen, G.; Nathanail, P. The challenge of sustainability: Incentives for brownfield regeneration in Europe. Environ. Sci. Policy 2007, 10, 116–134. [Google Scholar] [CrossRef]
    10. Tonin, S.; Bonifaci, P. Assessment of brownfield redevelopment opportunities using a multi-tiered approach: A case in Italy. Socio-Econ. Plan. Sci. 2020, 71, 100812. [Google Scholar] [CrossRef]
    11. Greenberg, M.; Lowrie, K.; Mayer, H.; Miller, K.T.; Solitare, L. Brownfield redevelopment as a smart growth option in the United States. Environmentalist 2001, 21, 129–143. [Google Scholar] [CrossRef]
    12. Zhu, Y.; Hipel, K.W.; Ke, G.Y.; Chen, Y. Establishment and optimization of an evaluation index system for brownfield redevelopment projects: An empirical study. Environ. Model. Softw. 2015, 74, 173–182. [Google Scholar] [CrossRef]
    13. Liu, Y.; Zhu, A.-X.; Wang, J.; Li, W.; Hu, G.; Hu, Y. Land-use decision support in brownfield redevelopment for urban renewal based on crowdsourced data and a presence-and-background learning (PBL) method. Land Use Policy 2019, 88, 104188. [Google Scholar] [CrossRef]
    14. Longo, A.; Campbell, D. The Determinants of Brownfields Redevelopment in England. Environ. Resour. Econ. 2017, 67, 261–283. [Google Scholar] [CrossRef] [Green Version]
    15. Lin, H.; Zhu, Y.; Ahmad, N.; Han, Q. A scientometric analysis and visualization of global research on brownfields. Environ. Sci. Pollut. Res. 2019, 26, 17666–17684. [Google Scholar] [CrossRef]
    16. Green, T.L. Evaluating predictors for brownfield redevelopment. Land Use Policy 2018, 73, 299–319. [Google Scholar] [CrossRef]
    17. Lehigha, G.; Wells, C.; Diaz, D. Evidence-Informed strategies for promoting equitability in brownfields redevelopment. J. Environ. Manag. 2020, 261, 110–150. [Google Scholar] [CrossRef] [PubMed]
    18. Turk, S.S.; Korthals Altes, W.K. Institutional capacities in the land development for housing on greenfield sites in Istanbul. Habitat Int. 2010, 34, 183–195. [Google Scholar] [CrossRef]
    19. Spatial Planning and Land Development Act of 27 March 2003 [Ustawa z Dnia 27 Marca 2003 r. o Planowaniu i Zagospodarowaniu Przestrzennym]. Dz.U. 2003 Nr 80 poz. 717. Available online: https://isap.sejm.gov.pl/isap.nsf/DocDetails.xsp?id=WDU20030800717 (accessed on 7 February 2022).
    20. American Society of Planning Officials. PAS Information Report No. 111 Floor Area Ratio. APA’s Planning Advisory Service 1958. Available online: https://www.planning.org/pas/reports/report111.htm (accessed on 14 March 2022).
    21. Ong, B. Green plot ratio: An ecological measure for architecture and urban planning. Landsc. Urban Plan. 2003, 63, 197–211. [Google Scholar] [CrossRef]
    22. Wang, J.G.; Zhang, Y.; Feng, H. A decision-making model of development intensity based on similarity relationship between land attributes intervened by urban design. Sci. China Tech. Sci. 2010, 53, 1743–1754. [Google Scholar] [CrossRef]
    23. Kono, T.; Kaneko, T.; Morisugi, H. Necessity of minimum floor area ratio regulation: A second-best policy. Ann. Reg. Sci. 2010, 44, 523–539. [Google Scholar] [CrossRef]
    24. Gruen, V.; Smith, L. Shopping Towns USA. The Planning of Shopping Centers; Rainhold Publishing Corporation: New York, NY, USA; Amsterdam, The Netherlands; London, UK, 1967. [Google Scholar]
    25. Hardwick, M.J. Mall Maker: Victor Gruen, Architect of an American Dream; University of Pennsylvania Press: Philadelphia, PA, USA, 2004. [Google Scholar]
    26. Cheng, E.; Li, H.; Yu, L. A GIS approach to shopping mall location selection. Build. Environ. 2007, 42, 884–892. [Google Scholar] [CrossRef]
    27. Ertekin, O.; Dokmeci, V.; Unlukara, T.; Ozus, E. Spatial Distribution of Shopping Malls and Analysis of their Trade Areas in Istanbul. Eur. Plan. Stud. 2008, 16, 143–155. [Google Scholar] [CrossRef]
    28. Kunc, J.; Reichel, V.; Novotná, M. Modelling frequency of visits to the shopping centres as a part of consumer’s preferences: Case study from the Czech Republic. Int. J. Retail Distrib. Manag. 2020, 48, 985–1002. [Google Scholar] [CrossRef]
    29. Makowski, G. Temple of Consumption. The Genesis and Social Importance of the Shopping Center; Świątynia konsumpcji. Geneza i społeczne znaczenie centrum handlowego; TRIO: Warszawa, Poland, 2004. [Google Scholar]
    30. Racoń-Leja, K. Shaping Contemporary, Covered Public Spaces, their Importance in the Process of Revitalisation of Urban Spaces. Kształtowanie współczesnych, przekrytych przestrzeni publicznych, ich znaczenie w procesie rewitalizacji przestrzeni miejskich. Ph.D. Dissertation, Cracow University of Technology, Krakow, Poland, 2003. [Google Scholar]
    31. Twardzik, M. A Shopping Center in the Process of Shaping the City Structure; Centrum Handlowe w Procesie Kształtowania Struktury Miasta; Wydawnictwo Uniwersytetu Ekonomicznego: Katowice, Poland, 2018. [Google Scholar]
    32. Heffner, K.; Twardzik, M. (Eds.) The Impact of Shopping Malls on the Outer Metropolitian Zones (the Example of the Silesian Voivodeship); Polish Academy of Sciences; Committee for Spatial Economy and Regional Planning: Warsaw, Poland, 2013. [Google Scholar]
    33. Rochmińska, A. The Attractiveness of Lodz Shopping Centers as Well as the Purchasing and Spatial Behavior of Their Customers; Atrakcyjność łódzkich centrów handlowych oraz zachowania nabywcze i Przestrzenne ich klientów; Łodz University Publishing: Łodz, Poland, 2013. [Google Scholar]
    34. Ledwoń, S. The Influence of Contemporary Commercial Facilities on the Structure of Downtowns. [Wpływ Współczesnych Obiektów Handlowych na Strukturę Sródmieść]. Ph.D. Dissertation, Gdansk University of Technology, Gdansk, Poland, 2008. [Google Scholar]
    35. Shi, Y.; Wu, J.; Wang, S. Spatio-temporal features and the dynamic mechanism of shopping center expansion in Shanghai. Appl. Geogr. 2015, 65, 93–108. [Google Scholar] [CrossRef]
    36. Dudek-Mańkowska, S.; Križan, F. Shopping Centres in Warsaw and Bratislava: A Comparative Analysis. Misc. Geogr. 2010, 14, 229–239. [Google Scholar] [CrossRef] [Green Version]
    37. Padilla, A.O.; Blanco, J.C. Shopping centre clusters: Competition or synergies? The case of the region of murcia (Spain). J. Retail. Consum. Serv. 2020, 52, 101867. [Google Scholar] [CrossRef]
    38. Križan, F.; Kunc, J.; Bilková, K.; Novotná, M. Transformation and Sustainable Development of Shopping Centers: Case of Czech and Slovak Cities. Sustainability 2022, 14, 62. [Google Scholar] [CrossRef]
    39. RetailMAP. Available online: https://www.retailmap.pl/pl/centra-handlowe/ (accessed on 28 April 2018).
    40. Polish Council of Shopping Centres. Available online: https://prch.org.pl/pl/ (accessed on 28 April 2018).
    41. The City. Available online: http://www.thecity.com.pl/Publikacje/Almanach-Centrow-Handlowych (accessed on 21 November 2020).
    42. Municipal Spatial Information System Krakow. Available online: https://msip.krakow.pl/ (accessed on 30 June 2019).
    43. OpenStreetMap. Available online: https://www.openstreetmap.org/copyright (accessed on 7 February 2022).
    44. Witkowski, K.; Mrówczyńska, M.; Bazan-Krzywoszańska, A.; Skiba, M. Methods for Determining Potential Sites for the Location of Logistics Centres on the Basis of Multicriteria Analysis. LogForum 2018, 14, 279–292. [Google Scholar] [CrossRef]
    45. Suchecka, J. (Ed.) Spatial Statictics: Methods of Analyzing Spatial Structures; Statystyka przestrzenna. Metody analiz struktur przestrzennych; C.H. Beck: Warszawa, Poland, 2014. [Google Scholar]
    46. Moore, T.W.; McGuire, M.P. Using the standard deviational ellipse to document changes to the spatial dispersion of seasonal tornado activity in the United States. npj Clim. Atmos. Sci. 2019, 2, 21. [Google Scholar] [CrossRef]
    47. Gesler, W. The uses of spatial analysis in medical geography: A review. Soc. Sci. Med. 1986, 23, 963–973. [Google Scholar] [CrossRef]
    48. Rahman, M.S.; Yang, R.; Di, L. Clustering Indian Ocean Tropical Cyclone Tracks by the Standard Deviational Ellipse. Climate 2018, 6, 39. [Google Scholar] [CrossRef] [Green Version]
    49. Rogerson, P.A. Historical change in the large-scale population distribution of the United States. Appl. Geogr. 2021, 136, 102563. [Google Scholar] [CrossRef]
    50. Litasari, U.C.N.; Widiatmaka; Munibah, K.; Machfud. Spatial Pattern Changing Analysis of Built-up Due to The New Era of Aerotropolis in Kulon Progo, D.I. Yogyakarta. IOP Conf. Ser. Earth Environ. Sci. 2022, 950, 012100. Available online: https://iopscience.iop.org/article/10.1088/1755-1315/950/1/012100 (accessed on 25 January 2022). [CrossRef]
    51. Murad, A.A. Creating a GIS Application for Retail Facilities Planning in Jeddah City. J. Comput. Sci. 2011, 7, 902–908. [Google Scholar] [CrossRef] [Green Version]
    52. Levine, N. CrimeStat: A Spatial Statistical Program for the Analysis of Crime Incidents. In Encyclopedia of GIS; Shekhar, S., Xiong, H., Eds.; Springer: Boston, MA, USA, 2008. [Google Scholar] [CrossRef]
    53. Clark, P.J.; Evans, F.C. Distance to Nearest Neighbour as a Measure of Spatial Relationships in Populations. Ecology 1954, 35, 445–453. [Google Scholar] [CrossRef]
    54. Philo, C.; Philo, P. 2.15 or Not 2.15? An Historical-Analytical Inquiry into the Nearest-Neighbor Statistic. Geogr. Anal. 2021, 54, 333–356. [Google Scholar] [CrossRef]
    55. Suchecki, B. (Ed.) Spatial Econometrics: Methods and Models of Spatial Data Analysis; Ekonometria przestrzenna. Metody i modele analizy danych przestrzennych; C.H. Beck: Warszawa, Poland, 2010. [Google Scholar]
    56. Pommerening, A.; Szmyt, J.; Zhang, G. A new nearest-neighbour index for monitoring spatial size diversity: The hyperbolic tangent index. Ecol. Model. 2020, 435, 109232. [Google Scholar] [CrossRef]
    57. Fang, Y.; Mao, J.; Liu, Q.; Huang, J. Exploratory space data analysis of spatial patterns of large-scale retail commercial facilities: The case of Gulou District, Nanjing, China. Front. Archit. Res. 2021, 10, 17–32. [Google Scholar] [CrossRef]
    58. Łabuz, R. Shopping Centre vs. Railway Station. Selected Examples in Poland. IOP Conf. Ser. Mater. Sci. Eng. 2019, 603, 032007. Available online: https://iopscience.iop.org/article/10.1088/1757-899X/603/3/032007 (accessed on 21 February 2022). [CrossRef] [Green Version]
    59. Lowry, J.R. The life cycle of shopping centers. Bus. Horiz. 1997, 40, 77–86. [Google Scholar] [CrossRef]
    60. Sobel, L.S.; Greenberg, E.; Bodzin, S. Greyfields into Goldfields: Dead Malls become Living Neighborhoods; Congress for the New Urbanism: San Francisco, CA, USA, 2002. [Google Scholar]
    61. Spilková, J.; Šefrna, L. Uncoordinated new retail development and its impact on land use and soils: A pilot study on the urban fringe of Prague, Czech Republic. Landsc. Urban Plan. 2010, 94, 141–148. [Google Scholar] [CrossRef]
    62. Frantál, B.; Kunc, J.; Nováková, E.; Klusáček, P.; Martinát, S.; Osman, R. Location matters! Exploring brownfields regeneration in a spatial context (A case study of the South Moravian Region, Czech Republic). Morav. Geogr. Rep. 2013, 21, 5–19. [Google Scholar] [CrossRef]
    63. Mohamad, M.Y.; Al Katheeri, F.; Salam, A. A GIS Application for Location Selection and Customers’ Preferences for Shopping Malls in Al Ain City; UAE. Am. J. Geogr. Inf. Syst. 2015, 4, 76–86. [Google Scholar] [CrossRef]
    64. Newmark, G.L.; Plaut, P.O.; Garb, Y. Shopping travel behaviors in an era of rapid economic transition: Evidence from newly built malls in Prague, Czech Republic. Transport. Res. Rec. 2004, 1898, 165–174. [Google Scholar] [CrossRef] [Green Version]
    65. Łabuz, R. Pocket Park-A New Type of Green Public Space in Kraków (Poland). IOP Conf. Ser. Mater. Sci. Eng. 2019, 471, 112018. [Google Scholar] [CrossRef]
    66. Wu, C.; Li, J.; Wang, C.; Song, C.; Haase, D.; Breuste, J.; Finka, M. Estimating the Cooling Effect of Pocket Green Space in High Density Urban Areas in Shanghai, China. Front. Environ. Sci. 2021, 9, 657969. [Google Scholar] [CrossRef]
    Figure 1. The dynamics of the development of shopping centers in Poland [5].
    Figure 1. The dynamics of the development of shopping centers in Poland [5].
    Sustainability 14 07539 g001
    Figure 2. Distribution of shopping centers in Poland as of May 2020 [5].
    Figure 2. Distribution of shopping centers in Poland as of May 2020 [5].
    Sustainability 14 07539 g002
    Figure 3. Illustration of the nearest neighbor method.
    Figure 3. Illustration of the nearest neighbor method.
    Sustainability 14 07539 g003
    Figure 4. Location of shopping centers in Kraków. Shopping centers: 1. Atut Ruczaj, 2. Bonarka City Center, 3. Carrefour Witosa, 4. Galeria Bronowice, 5. Galeria Kazimierz, 6. Galeria Krakowska, 7. Plaza Kraków, 8. Krokus, 9. M1 Kraków, 10. Nowe Czyżyny, 11. PH Zakopianka, 12. Serenada, 13. Solvay Park, 14. Tesco Kapelanka, 15. Tesco Wielicka.
    Figure 4. Location of shopping centers in Kraków. Shopping centers: 1. Atut Ruczaj, 2. Bonarka City Center, 3. Carrefour Witosa, 4. Galeria Bronowice, 5. Galeria Kazimierz, 6. Galeria Krakowska, 7. Plaza Kraków, 8. Krokus, 9. M1 Kraków, 10. Nowe Czyżyny, 11. PH Zakopianka, 12. Serenada, 13. Solvay Park, 14. Tesco Kapelanka, 15. Tesco Wielicka.
    Sustainability 14 07539 g004
    Figure 5. Analysis of the distance of Kraków’s shopping centers from the city center.
    Figure 5. Analysis of the distance of Kraków’s shopping centers from the city center.
    Sustainability 14 07539 g005
    Figure 6. Chronology of the construction of shopping centers in Kraków.
    Figure 6. Chronology of the construction of shopping centers in Kraków.
    Sustainability 14 07539 g006
    Figure 7. Analysis of the standard deviation ellipse of Kraków shopping centers divided into brownfield and greenfield investments.
    Figure 7. Analysis of the standard deviation ellipse of Kraków shopping centers divided into brownfield and greenfield investments.
    Sustainability 14 07539 g007
    Figure 8. Analysis of the standard deviation ellipse of Kraków shopping centers in relation to the implementation periods of individual investments in the years: (a) 2000, (b) 2005, (c) 2010, (d) 2020, and (e) combined.
    Figure 8. Analysis of the standard deviation ellipse of Kraków shopping centers in relation to the implementation periods of individual investments in the years: (a) 2000, (b) 2005, (c) 2010, (d) 2020, and (e) combined.
    Sustainability 14 07539 g008aSustainability 14 07539 g008b
    Figure 9. Analysis of the development of the areas of Kraków shopping centers. Status for December 2021.
    Figure 9. Analysis of the development of the areas of Kraków shopping centers. Status for December 2021.
    Sustainability 14 07539 g009
    Figure 10. Percentage share of individual indicators in the area of the investment plot.
    Figure 10. Percentage share of individual indicators in the area of the investment plot.
    Sustainability 14 07539 g010
    Figure 11. Spatial patterns of shopping centers in Kraków by: (a) building plot ratio (BPR), (b) floor area ratio (FAR), (c) green plot ratio (GPR) without Plaza Kraków.
    Figure 11. Spatial patterns of shopping centers in Kraków by: (a) building plot ratio (BPR), (b) floor area ratio (FAR), (c) green plot ratio (GPR) without Plaza Kraków.
    Sustainability 14 07539 g011
    Figure 12. Type of investment by: (a) construction year (chronologically), (b) distance from the city center.
    Figure 12. Type of investment by: (a) construction year (chronologically), (b) distance from the city center.
    Sustainability 14 07539 g012
    Figure 13. Land development indicators —without Plaza Kraków: (a) BPR by year of construction (chronologically), (b) BPR by distance from the city center, (c) FAR by year of construction (chronologically), (d) FAR by distance from the city center, (e) GPR by year of construction (chronologically), (f) GPR according to distance from the city center.
    Figure 13. Land development indicators —without Plaza Kraków: (a) BPR by year of construction (chronologically), (b) BPR by distance from the city center, (c) FAR by year of construction (chronologically), (d) FAR by distance from the city center, (e) GPR by year of construction (chronologically), (f) GPR according to distance from the city center.
    Sustainability 14 07539 g013aSustainability 14 07539 g013b
    Table 1. Number of shopping centers in selected large cities in Central and Eastern Europe in 2020 and * in 2017.
    Table 1. Number of shopping centers in selected large cities in Central and Eastern Europe in 2020 and * in 2017.
    CityCountryCity Population
    (2019/2020)
    Number of Shopping Centers (2020, * 2017)
    Warszawa (Capital)Poland1,769,52939
    Budapest (Capital)Hungary1,763,91318 *
    Prague (Capital)Czechia1,298,80424
    Bratislava (Capital)Slovakia432,50814
    KrakówPoland769,49815
    ŁodźPoland687,70214
    WrocławPoland639,25819
    Table 2. General location data of Kraków shopping centers. Status for July 2021.
    Table 2. General location data of Kraków shopping centers. Status for July 2021.
    No.Name of the Shopping CenterCracow DistrictUrbanization ZoneDistance from
    the City Center [km]
    1.Atut RuczajDistrict VIII DębnikiLow-urbanized6.66
    2.Bonarka City CenterDistrict XI Podgórze DuchackieLow-urbanized3.87
    3.Carrefour WitosaDistrict XI Podgórze DuchackieUrbanized5.91
    4.Galeria BronowiceDistrict IV Prądnik BiałyUrbanized4.40
    5.Galeria KazimierzDistrict II GrzegórzkiDowntown1.57
    6.Galeria KrakowskaDistrict I Stare MiastoDowntown0.90
    7.Plaza KrakówDistrict II GrzegórzkiUrbanized3.35
    8.KrokusDistrict XV MistrzejowiceUrbanized4.27
    9.M1 KrakówDistrict XIV CzyżynyLow-urbanized4.47
    10.Nowe CzyżynyDistrict XIV CzyżynyUrbanized5.92
    11.PH ZakopiankaDistrict IX Łagiewniki-Borek FałęckiUrbanized5.33
    12.SerenadaDistrict XV MistrzejowiceUrbanized4.56
    13.Solvay ParkDistrict IX Łagiewniki-Borek FałęckiUrbanized5.33
    14.Tesco KapelankaDistrict VIII DębnikiUrbanized3.37
    15.Tesco WielickaDistrict XII Bieżanów-ProkocimUrbanized6.83
    Table 3. Distinguishing parameters of SDE of brownfield and greenfield investments–results.
    Table 3. Distinguishing parameters of SDE of brownfield and greenfield investments–results.
    Length of Semi-Major Axis [km]Angle in Degrees Clockwise Relative to NorthEllipse Area [km2]Eccentricity
    SDE of brownfield investments5.5311.0026.650.96
    SDE of greenfield investments6.2239.3287.130.70
    Table 4. Distinguishing parameters of nearest neighbor analysis for brownfield and greenfield investment—results.
    Table 4. Distinguishing parameters of nearest neighbor analysis for brownfield and greenfield investment—results.
    N N ¯   [ m 2 ] r a n ¯   [ m 2 ] NNIX-Score
    Nearest neighbor method for brownfield investments2147.011096.101.964.49
    Nearest neighbor method for greenfield investments2779.731514.971.834.79
    Table 5. Distinguishing parameters of SDE of shopping centers in 2000, 2005, 2010, and 2020—results.
    Table 5. Distinguishing parameters of SDE of shopping centers in 2000, 2005, 2010, and 2020—results.
    Length of
    Semi-Major Axis [km]
    Angle in Degrees Clockwise Relative
    to North
    Ellipse Area [km2]Eccentricity
    SDE of 20005.9511.6765.060.81
    SDE of 20055.3425.8244.740.87
    SDE of 20105.0326.7440.340.86
    SDE of 20205.4326.0960.500.76
    Table 6. Distinguishing parameters of nearest neighbor analysis for shopping centers in 2000, 2005, 2010, and 2020.
    Table 6. Distinguishing parameters of nearest neighbor analysis for shopping centers in 2000, 2005, 2010, and 2020.
    N N ¯   [ m 2 ] r a n ¯   [ m 2 ] NNIZ-Score
    Nearest neighbor method for 20003262.771486.402.205.11
    Nearest neighbor method for 20052006.491241.551.623.54
    Nearest neighbor method for 20101602.541075.221.493.25
    Nearest neighbor method for 20201644.991173.491.402.98
    Table 7. Land development indicators for shopping centers in Kraków—results.
    Table 7. Land development indicators for shopping centers in Kraków—results.
    No.Shopping
    Center Name
    Number of BuildingsInvestment Area [ha]Floor Area (FA) [m2]BPRGross Floor Area of All Floors (GFA) [m2]FARTotal Leaf Area of Greenery [m2]GPR
    1.Atut Ruczaj22.216469.000.299620.000.443194.5914.47%
    2.Bonarka City Center112.9170,836.000.55141,672.001.1018,635.3214.44%
    3.Carrefour Witosa13.279490.270.299490.270.293556.5210.88%
    4.Galeria Bronowice17.4749,532.000.66148,596.001.994511.756.04%
    5.Galeria Kazimierz85.2233,045.000.6366,056.001.274717.779.04%
    6.Galeria Krakowska13.9629,847.000.75119,388.003.01161.820.41%
    7.Plaza Kraków17.5922,169.000.2944,338.000.5830,845.1240.64%
    8.Krokus47.2237,202.000.5277,907.001.082667.863.69%
    9.M1 Kraków118.1560,645.290.3360,645.290.3327,770.5615.30%
    10.Nowe Czyżyny29.8835,410.990.3635,410.990.3617,936.3318.15%
    11.PH Zakopianka1018.6366,962.600.3677,093.450.4120,417.4810.96%
    12.Serenada14.0029,759.000.7459,518.001.494248.7310.63%
    13.Solvay Park11.076174.000.5812,348.001.16774.367.27%
    14.Tesco Kapelanka15.5424,287.000.4448,574.000.886586.3111.89%
    15.Tesco Wielicka68.3325,659.740.3125,659.740.3116,648.2919.99%
    MIN.1.076174.000.299490.270.29161.820.41%
    MAX.18.6370,836.000.75148,596.003.0130,845.1240.64%
    MEAN7.7033,832.590.4762,421.120.9810,844.8512.92%
    MIN. (without Plaza Kraków)1.076174.000.299490.270.29161.820.41%
    MAX. (without Plaza Kraków)18.6370,836.000.75148,596.003.0127,770.5619.99%
    MEAN. (without Plaza Kraków)7.7034,665.710.4963,712.771.019416.2610.94%
    Table 8. The number of shopping centers in particular ranges according to the area development indicators (without Plaza Kraków).
    Table 8. The number of shopping centers in particular ranges according to the area development indicators (without Plaza Kraków).
    Building Plot Ratio (BPR)Floor Area Ratio (FAR)Green Plot Ratio (GPR)
    Index value (range)Number of
    shopping centers
    Index value (range)Number of
    shopping centers
    Index value (range)Number of
    shopping centers
    0.29–0.460.29–1.070.4–5%2
    0.4–0.641.0–2.065–10%3
    0.6–0.7542.0–3.0010–15%6
    --3.0–3.01115–20%3
    Table 9. Comparison of types of investments and land development indicators regarding the year of construction and the distance of the shopping center from the city center.
    Table 9. Comparison of types of investments and land development indicators regarding the year of construction and the distance of the shopping center from the city center.
    No.Shopping CenterYear of
    Construction
    Type of
    Investment
    Distance from the City Center [km]BPRFARGPR
    1.Atut Ruczaj2019greenfield6.660.290.4414.47%
    2.Bonarka City Center2009brownfield3.870.551.1014.44%
    3.Carrefour Witosa1997brownfield5.910.290.2910.88%
    4.Galeria Bronowice2013greenfield4.400.661.996.04%
    5.Galeria Kazimierz2005brownfield1.570.631.279.04%
    6.Galeria Krakowska2006brownfield0.900.753.010.41%
    7.Plaza Kraków2001greenfield3.350.290.5840.64%
    8.Krokus1997brownfield4.270.521.083.69%
    9.M1 Kraków2001greenfield4.470.330.3315.30%
    10.Nowe Czyżyny2002greenfield5.920.360.3618.15%
    11.PH Zakopianka1998brownfield5.330.360.4110.96%
    12.Serenada2017greenfield4.560.741.4910.63%
    13.Solvay Park2007greenfield5.330.581.167.27%
    14.Tesco Kapelanka2000greenfield3.370.440.8811.89%
    15.Tesco Wielicka1997greenfield6.830.310.3119.99%
    Table 10. Functions of the trend of indicators in the development of shopping center areas (without Plaza Kraków).
    Table 10. Functions of the trend of indicators in the development of shopping center areas (without Plaza Kraków).
    Characteristics of the TrendlineBPRFARGPR
    The trend line chronologically according to the year of construction tan α 0.01030.0398−0.0008
    Pitch angle  α   [ ° ] 0.592.280.05
    The trend line crescively according to the distance from the city center tan α −0.0697−0.33860.0202
    Pitch angle  α   [ ° ] 3.9918.711.16
    Publisher’s Note: MDPI stays neutral with regard to jurisdictional claims in published maps and institutional affiliations.

    Share and Cite

    MDPI and ACS Style

    Blazy, R.; Łabuz, R. Spatial Distribution and Land Development Parameters of Shopping Centers Based on GIS Analysis: A Case Study on Kraków, Poland. Sustainability 2022, 14, 7539. https://doi.org/10.3390/su14137539

    AMA Style

    Blazy R, Łabuz R. Spatial Distribution and Land Development Parameters of Shopping Centers Based on GIS Analysis: A Case Study on Kraków, Poland. Sustainability. 2022; 14(13):7539. https://doi.org/10.3390/su14137539

    Chicago/Turabian Style

    Blazy, Rafał, and Rita Łabuz. 2022. "Spatial Distribution and Land Development Parameters of Shopping Centers Based on GIS Analysis: A Case Study on Kraków, Poland" Sustainability 14, no. 13: 7539. https://doi.org/10.3390/su14137539

    Note that from the first issue of 2016, this journal uses article numbers instead of page numbers. See further details here.

    Article Metrics

    Back to TopTop