
Exploring the Driving Factors of Urban Music Festival Tourism and Service Development Strategies Using the Modified SIA-NRM Approach


Abstract
:1. Introduction
2. The Sustainable Development Driving Forces for Urban Music Festival Tourism
2.1. Events Image (EI)
2.2. Events Experience (EE)
2.3. Facilities Planning (FP)
2.4. Service Price (SP)
3. The Modified SIA-NRM Approach
3.1. Research Design and Reliability Analysis
3.2. The SIA (Satisfaction and Importance Analysis) Analysis
3.3. The NRM Analysis Based on the DEMATEL Approach
- Analyze the original average matrix.
- 2.
- Evaluate the direct influence matrix.
- 3.
- Evaluate the indirect influence matrix.
- 4.
- Evaluate the full influence matrix.
- 5.
- Determine the network relation map (NRM).
3.4. The Analysis of the SIA-NRM Approach
3.5. Establishment of the Suited Development Paths by SD and ID Ranking
4. The Empirical Study of Urban Music Festival Tourism Based on the Modified SIA-NRM Approach
4.1. Establishment of the Acceptation Strategy and Suited Development Paths
4.1.1. The EI (Events Image) Aspect
4.1.2. The EE (Events Experience) Aspect
4.1.3. The FP (Facilities Planning) Aspect
4.1.4. The SP (Service Price) Aspect
4.2. Discussion
4.2.1. EI (Events Image) Aspect
4.2.2. EE (Events Experience) Aspect
4.2.3. FP (Facilities Planning) Aspect
4.2.4. SP (Service Price) Aspect
5. Conclusions and Recommendations
5.1. Conclusions
5.2. Findings
5.3. Future Studies
Author Contributions
Funding
Institutional Review Board Statement
Informed Consent Statement
Data Availability Statement
Conflicts of Interest
References
- Getz, D.; Page, S.J. Progress and prospects for event tourism research. Tour. Manag. 2016, 52, 593–631. [Google Scholar] [CrossRef] [Green Version]
- Akhoondnejad, A. Loyalty formation process of tourists in sporting event: The case of Turkmen horse races. J. Hosp. Tour. Manag. 2018, 34, 48–57. [Google Scholar] [CrossRef]
- Kendall, G.; Chan, J.H.T.; Yeung, M.C.H.; Law, K.K. Do film festivals attract tourists? Curr. Issues Tour. 2021, 24, 1482–1486. [Google Scholar] [CrossRef]
- Qiu, Q.H.; Zuo, Y.F.; Zhang, M. Intangible Cultural Heritage in Tourism: Research Review and Investigation of Future Agenda. Land 2022, 11, 139. [Google Scholar] [CrossRef]
- Li, Y.; Wood, E.H.; Thomas, R. Innovation implementation: Harmony and conflict in Chinese modern music festivals. Tour. Manag. 2017, 63, 87–99. [Google Scholar] [CrossRef] [Green Version]
- Bennett, A. Popular music scenes and aging bodies. J. Aging Stud. 2018, 45, 49–53. [Google Scholar] [CrossRef]
- Nien-Te, K.; Cheng, Y.S.; Chang, K.C.; Hu, S.M. How social capital affects support intention: The mediating role of place identity. J. Hosp. Tour. Manag. 2021, 46, 40–49. [Google Scholar]
- Yang, J.; Luo, J.M.; Yao, R. How Fear of COVID-19 Affects the Behavioral Intention of Festival Participants-A Case of the HANFU Festival. Int. J. Environ. Res. Public Health 2022, 1, 2133. [Google Scholar] [CrossRef]
- Szmigin, I.; Bengry-Howell, A.; Morey, Y.; Griffin, C.; Riley, S. Socio-spatial authenticity at co-created music festivals. Ann. Tour. Res. 2017, 63, 1–11. [Google Scholar] [CrossRef]
- Semrad, K.J.; Rivera, M. Advancing the 5E’s in festival experience for the Gen Y framework in the context of eWOM. J. Destin. Mark. Manag. 2018, 7, 58–67. [Google Scholar] [CrossRef]
- Molina-Gomez, J.; Mercade-Mele, P.; Almeida-Garcia, F.; Ruiz-Berron, R. New perspectives on satisfaction and loyalty in festival tourism: The function of tangible and intangible attributes. PLoS ONE 2021, 16, e0246562. [Google Scholar] [CrossRef] [PubMed]
- Eluwole, K.K.; Banga, C.; Lasisi, T.T.; Ozturen, A.; Kilic, H. Understanding residents’ empowerment and community attachment in festival tourism: The case of Victoria Falls. J. Destin. Mark. Manag. 2022, 23, 100674. [Google Scholar] [CrossRef]
- Tanford, S.; Jung, S. Festival attributes and perceptions: A meta-analysis of relationships with satisfaction and loyalty. Tour. Manag. 2017, 61, 209–220. [Google Scholar] [CrossRef]
- Martinho, G.; Gomes, A.; Ramos, M.; Santos, P.; Gonçalves, G.; Fonseca, M.; Pires, A. Solid waste prevention and management at green festivals: A case study of the Andanças Festival, Portugal. Waste Manag. 2018, 71, 10–18. [Google Scholar] [CrossRef] [PubMed]
- Sun, H.; Wu, S.F.; Li, Y.N.; Dai, G.Q. Tourist-to-Tourist Interaction at Festivals: A Grounded Theory Approach. Sustainability 2019, 11, 4030. [Google Scholar] [CrossRef] [Green Version]
- Lin, C.L.; Chang, K.C. Establishing the service evaluation and selection system for emerging culture festival events using the hybrid MCDM technique. Curr. Issues Tour. 2020, 23, 2240–2272. [Google Scholar] [CrossRef]
- Kim, S.S.; Prideaux, B.; Chon, K. A comparison of results of three statistical methods to understand the determinants of festival participants’ expenditures. Int. J. Hosp. Manag. 2010, 29, 297–307. [Google Scholar] [CrossRef]
- Andersson, T.D.; Lundberg, E. Commensurability and sustainability: Triple impact assessments of a tourism event. Tour. Manag. 2013, 37, 99–109. [Google Scholar] [CrossRef]
- Kelly, D.M.; Fairley, S. What about the event? How do tourism leveraging strategies affect small-scale events? Tour. Manag. 2018, 64, 335–345. [Google Scholar] [CrossRef]
- Zou, Y.G.; Meng, F.; Bi, J.; Zhang, Q. Evaluating sustainability of cultural festival tourism: From the perspective of ecological niche. J. Hosp. Tour. Manag. 2021, 48, 191–199. [Google Scholar] [CrossRef]
- Hori, S.; Shimizu, Y. Designing methods of human interface for supervisory control systems. Control Eng. Pract. 1999, 7, 1413–1419. [Google Scholar] [CrossRef]
- Seyed-Hosseini, S.M.; Safaei, N.; Asgharpour, M.J. Reprioritization of failures in a system failure mode and effects analysis by decision making trial and evaluation laboratory technique. Reliab. Eng. Syst. Saf. 2006, 91, 872–881. [Google Scholar] [CrossRef]
- Tzeng, G.H.; Chiang, C.H.; Li, C.W. Evaluating intertwined effects in e-learning programs: A novel hybrid MCDM model based on factor analysis and DEMATEL. Expert Syst. Appl. 2007, 32, 1028–1044. [Google Scholar] [CrossRef]
- Liou, J.J.H.; Yen, L.; Tzeng, G.H. Building an effective safety management system for airlines. J. Air Transp. Manag. 2008, 14, 20–26. [Google Scholar] [CrossRef]
- Lin, C.L.; Tzeng, G.H. A value-created system of science (technology) park by using DEMATEL. Expert Syst. Appl. 2009, 36, 9683–9697. [Google Scholar] [CrossRef]
- Li, C.W.; Tzeng, G.H. Identification of a threshold value for the DEMATEL method using the maximum mean de-entropy algorithm to find critical services provided by a semiconductor intellectual property mall. Expert Syst. Appl. 2009, 36, 9891–9898. [Google Scholar] [CrossRef]
- Lin, C.L.; Hsieh, M.S.; Tzeng, G.H. Evaluating vehicle telematics system by using a novel MCDM techniques with dependence and feedback. Expert Syst. Appl. 2010, 37, 6723–6736. [Google Scholar] [CrossRef]
- Wang, W.C.; Lin, Y.H.; Lin, C.L.; Chung, C.H.; Lee, M.T. DEMATEL-based model to improve the performance in a matrix organization. Expert Syst. Appl. 2012, 39, 4978–4986. [Google Scholar] [CrossRef]
- Hsu, C.C.; Liou, J.J.H. An outsourcing provider decision model for the airline industry. J. Air Transp. Manag. 2013, 28, 40–46. [Google Scholar] [CrossRef]
- Wang, W.C.; Lin, C.L.; Wang, S.H.; Liu, J.J.; Lee, M.T. Application of importance-satisfaction analysis and influence-relations map to evaluate design delay factors. J. Civ. Eng. Manag. 2014, 20, 497–510. [Google Scholar] [CrossRef] [Green Version]
- Lin, C.L. A novel hybrid decision-making model for determining product position under consideration of dependence and feedback. Appl. Math. Model. 2015, 39, 2194–2216. [Google Scholar] [CrossRef]
- Lin, C.L.; Shih, Y.H.; Tzeng, G.H.; Yu, H.C. A service selection model for digital music service platforms using a hybrid MCDM approach. Appl. Soft Comput. 2016, 48, 385–403. [Google Scholar] [CrossRef]
- Mathiyazhagan, K.; Sengupta, S.; Poovazhagan, L. A decision making trial and evaluation laboratory approach to analyse the challenges to environmentally sustainable manufacturing in Indian automobile industry. Sustain. Prod. Consum. 2018, 16, 58–67. [Google Scholar] [CrossRef]
- Ferrell, O.C.; Harrison, D.E.; Ferrell, L.; Hair, J.F. Business ethics, corporate social responsibility, and brand attitudes: An exploratory study. J. Bus. Res. 2019, 95, 491–501. [Google Scholar] [CrossRef]
- Sufiyan, M.; Haleem, A.; Khan, S.; Khan, M.I. Evaluating food supply chain performance using hybrid fuzzy MCDM technique. Sustain. Prod. Consum. 2019, 20, 40–57. [Google Scholar] [CrossRef]
- Lin, C.L. The analysis of sustainable development strategies for industrial tourism based on IOA-NRM approach. J. Clean. Prod. 2019, 241, 118281. [Google Scholar] [CrossRef]
- Boral, S.; Howard, I.; Chaturvedi, S.K.; McKee, K.; Naikan, V.N.A. A novel hybrid multi-criteria group decision making approach for failure mode and effect analysis: An essential requirement for sustainable manufacturing. Sustain. Prod. Consum. 2020, 21, 14–32. [Google Scholar] [CrossRef]
- Lin, C.L. Establishing environment sustentation strategies for urban and rural/town tourism based on a hybrid MCDM approach. Curr. Issues Tour. 2020, 23, 2360–2395. [Google Scholar] [CrossRef]
- Li, Z.T.; Hu, M.M.; Li, M.; Jiao, M.Y.; Xia, B.C. Identification and countermeasures of limiting factors of regional sustainable development: A case study in the Pearl River Delta of China. Environ. Dev. Sustain. 2020, 22, 4209–4224. [Google Scholar] [CrossRef]
- Yin, S.; Zhang, N.; Li, B.Z. Enhancing the competitiveness of multi-agent cooperation for green manufacturing in China: An empirical study of the measure of green technology innovation capabilities and their influencing factors. Sustain. Prod. Consum. 2020, 23, 63–76. [Google Scholar] [CrossRef]
- Peng, L.P.; Wang, W.M. Hybrid Decision-Making Evaluation for Future Scenarios of Cultural Ecosystem Services. Land 2020, 9, 257. [Google Scholar] [CrossRef]
- Lin, S.H.; Wang, D.Y.; Huang, X.J.; Zhao, X.F.; Hsieh, J.Z.; Tzeng, W.S.; Li, J.H.; Chen, J.S. A multi-attribute decision-making model for improving inefficient industrial parks. Environ. Dev. Sustain. 2021, 23, 887–921. [Google Scholar] [CrossRef]
- Lin, C.L. Evaluating the urban sustainable development strategies and common suited paths considering various stakeholders. Environ. Dev. Sustain. 2022, 1–41. [Google Scholar] [CrossRef]
- Prentice, R.; Andersen, V. Festival as creative destination. Ann. Tour. Res. 2003, 30, 7–30. [Google Scholar] [CrossRef]
- Robinson, R.N.S.; Clifford, C. Authenticity and festival foodservice experiences. Ann. Tour. Res. 2012, 39, 571–600. [Google Scholar] [CrossRef]
- Getz, D. Tourist shopping villages: Development and planning strategies. Tour. Manag. 1993, 14, 15–26. [Google Scholar] [CrossRef]
- Vajirakachorn, T.; Chongwatpol, J. Application of business intelligence in the tourism industry: A case study of a local food festival in Thailand. Tour. Manag. Perspect. 2017, 23, 75–86. [Google Scholar] [CrossRef]


| Aspects/Criteria | Evaluation Criteria Description |
|---|---|
| 1. Events Image (EI) | |
| Renowned band (EI1) | Music festival organizers can invite well-known indie bands to enhance customers’ participation willingness. |
| Package service (EI2) | Music festival organizers can combine local tourism resources and music festival tourism to offer local festival tourism packages. |
| Promotion activities (EI3) | Music festival organizers can offer providers various special offers and special packages to satisfy participants’ diverse needs. |
| Peripheral products (EI4) | Music festival organizers can offer peripheral items (such as music albums, commemorative clothes) to satisfy the participants’ souvenir needs. |
| 2. Events Experience (EE) | |
| Internet propaganda (EE1) | Music festival organizers can offer event announcements, online consulting, and online booking services by integrating the service system. |
| Stage effect (EE 2) | Music festival organizers can create special stage effects for festival tourism through the festival theme plan. |
| Multiple characteristics (EE3) | Music festival organizers can attract different styles of indie bands to participate through diverse music preferences. |
| Field experience (EE4) | Music festival organizers can increase event participants’ service experiences through various stage displays and field experiences. |
| 3. Facilities Planning (FP) | |
| Exhibition planning (FP1) | Music festival event organizers can offer the entire stage configuration and exhibition line planning to reduce inconvenience. |
| Ancillary facilities (FP2) | Perfect guiding signs and ancillary facilities (such as parking lots, medical stations) can increase the convenience of event participants. |
| Vendor planning (FP3) | Diversified vendor planning can satisfy the event participants’ shopping needs and increase the convenience of event participants. |
| Accommodation service (FP4) | Perfect and convenient accommodation services can satisfy the convenience of accommodation and dining for event participants. |
| 4. Service Price (SP) | |
| Performance fees (SP1) | Music festival organizers can offer different styles of service packages to satisfy event participants’ various needs. |
| Accommodation fees (SP2) | A wide range of accommodation service options is available to meet the various needs of event participants. |
| Catering fees (SP3) | A wide range of food service options is available to meet the various needs of event participants. |
| Package offer (SP4) | A wide range of integrated package ticket fare options is available to meet the various needs of event participants. |
| Items | Aspects/Criteria | Alpha | Result |
|---|---|---|---|
| Satisfaction dimension | 0.965 | High | |
| Importance dimension | 0.946 | High | |
| Aspects of service system | 0.952 | High | |
| Criteria of aspects | Events Image (EI) | 0.940 | High |
| Events Experience (EE) | 0.967 | High | |
| Facilities Planning (FP) | 0.957 | High | |
| Service Price (SP) | 0.956 | High | |
| Aspects | SD | ID | (SD, ID) | ||
|---|---|---|---|---|---|
| MS | SS | MI | SI | ||
| Events Image (EI) | 7.203 | −1.273 | 6.856 | −1.396 | (L, L) |
| Events Experience (EE) | 7.362 | 1.079 | 7.475 | 0.719 | (H, H) |
| Facilities Planning (FP) | 7.275 | −0.216 | 7.478 | 0.729 | (L, H) |
| Service Price (SP) | 7.317 | 0.410 | 7.250 | −0.051 | (H, L) |
| Average | 7.289 | 0.000 | 7.265 | 0.000 | |
| Standard deviation | 0.067 | 1.000 | 0.293 | 1.000 | |
| Maximum | 7.362 | 1.079 | 7.478 | 0.729 | |
| Minimum | 7.203 | −1.273 | 6.856 | −1.396 | |
| Aspects | EI | EE | FP | SP | Total |
|---|---|---|---|---|---|
| Events Image (EI) | 0.000 | 2.552 | 2.610 | 2.564 | 7.727 |
| Events Experience (EE) | 2.669 | 0.000 | 2.640 | 2.547 | 7.855 |
| Facilities Planning (FP) | 2.692 | 2.721 | 0.000 | 2.599 | 8.012 |
| Service Price (SP) | 2.634 | 2.651 | 2.680 | 0.000 | 7.965 |
| Total | 7.994 | 7.924 | 7.930 | 7.709 | - |
| Aspects | EI | EE | FP | SP | Total |
|---|---|---|---|---|---|
| Events Image (EI) | 0.000 | 0.319 | 0.326 | 0.320 | 0.964 |
| Events Experience (EE) | 0.333 | 0.000 | 0.329 | 0.318 | 0.980 |
| Facilities Planning (FP) | 0.336 | 0.340 | 0.000 | 0.324 | 1.000 |
| Service Price (SP) | 0.329 | 0.331 | 0.335 | 0.000 | 0.994 |
| Total | 0.998 | 0.989 | 0.990 | 0.962 | - |
| Aspects | Sum of Row | Sum of Column | Sum of Row and Column | Importance of Influence |
|---|---|---|---|---|
| Events Image (EI) | 0.964 | 0.998 | 1.962 | 3 |
| Events Experience (EE) | 0.980 | 0.989 | 1.970 | 2 |
| Facilities Planning (FP) | 1.000 | 0.990 | 1.990 | 1 |
| Service Price (SP) | 0.994 | 0.962 | 1.956 | 4 |
| Aspects | EI | EE | FP | SP | Total |
|---|---|---|---|---|---|
| Events Image (EI) | 16.052 | 15.876 | 15.873 | 15.535 | 63.336 |
| Events Experience (EE) | 16.155 | 16.138 | 16.056 | 15.717 | 64.065 |
| Facilities Planning (FP) | 16.402 | 16.299 | 16.384 | 15.956 | 65.041 |
| Service Price (SP) | 16.346 | 16.244 | 16.242 | 15.978 | 64.809 |
| Total | 64.954 | 64.557 | 64.555 | 63.185 | - |
| Aspects | EI | EE | FP | SP | d |
|---|---|---|---|---|---|
| Events Image (EI) | 16.052 | 16.195 | 16.199 | 15.855 | 64.301 |
| Events Experience (EE) | 16.488 | 16.138 | 16.385 | 16.035 | 65.045 |
| Facilities Planning (FP) | 16.738 | 16.639 | 16.384 | 16.280 | 66.041 |
| Service Price (SP) | 16.675 | 16.575 | 16.577 | 15.978 | 65.804 |
| r | 65.952 | 65.547 | 65.545 | 64.147 | - |
| Aspects | {d} | {r} | {d + r} | {d − r} |
|---|---|---|---|---|
| Events Image (EI) | 64.301 | 65.952 | 130.253 | −1.651 |
| Events Experience (EE) | 65.045 | 65.547 | 130.592 | −0.501 |
| Facilities Planning (FP) | 66.041 | 65.545 | 131.585 | 0.496 |
| Service Price (SP) | 65.804 | 64.147 | 129.951 | 1.657 |
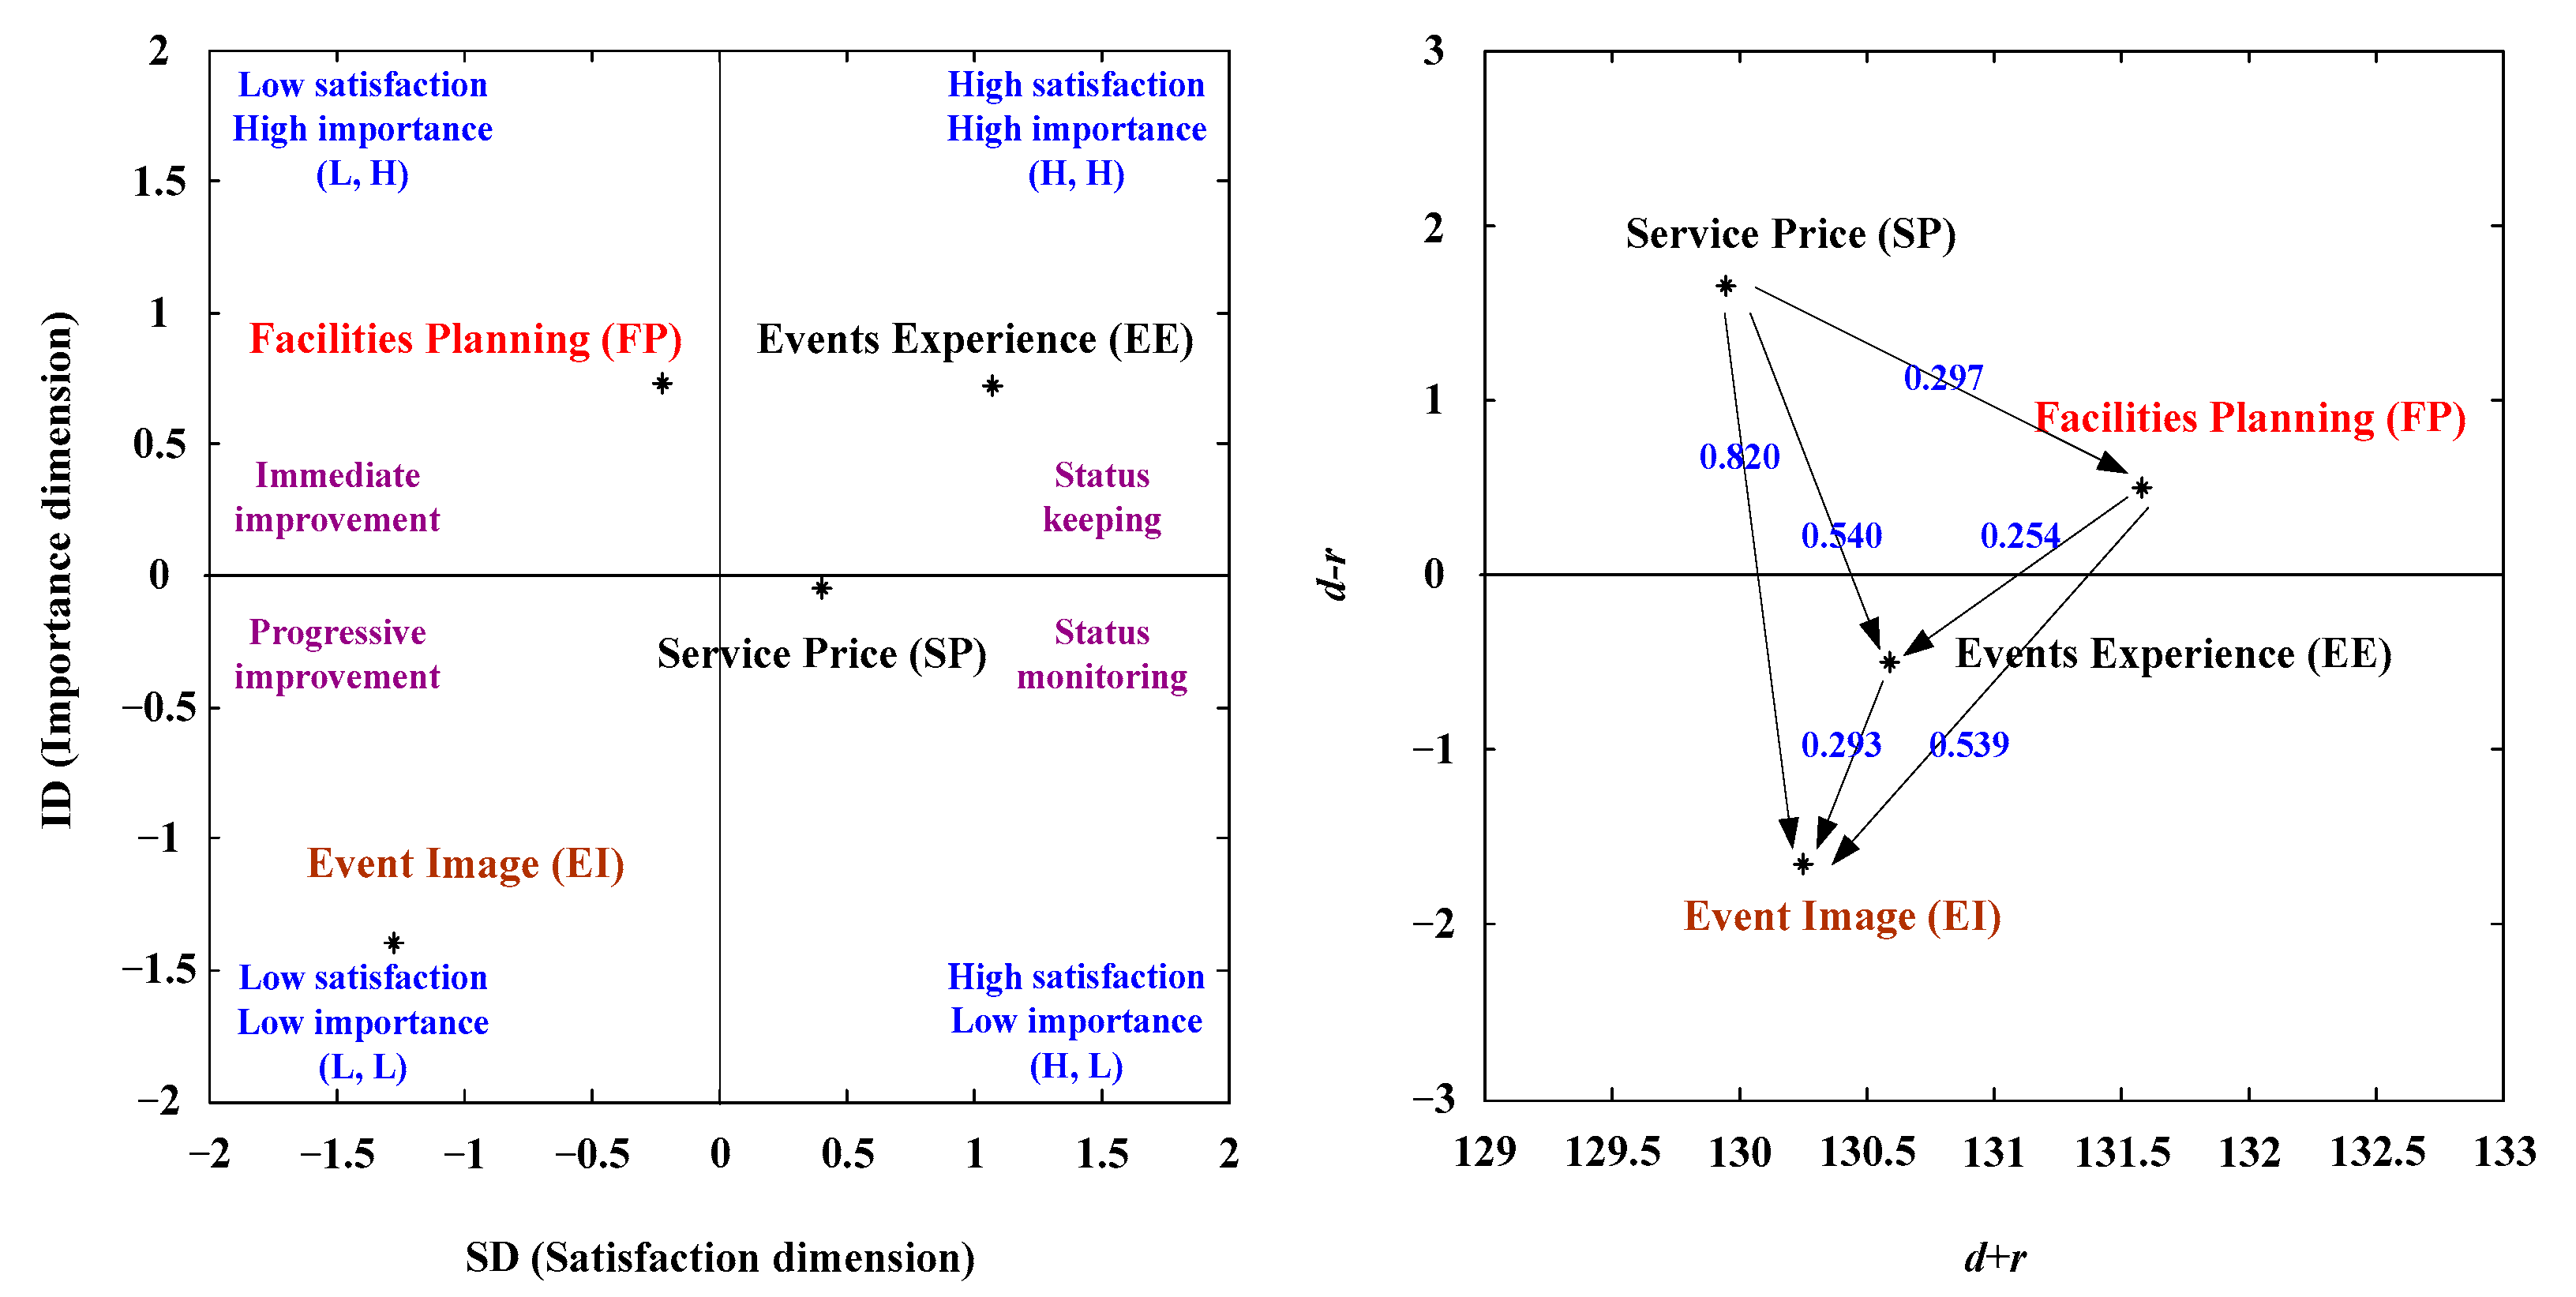
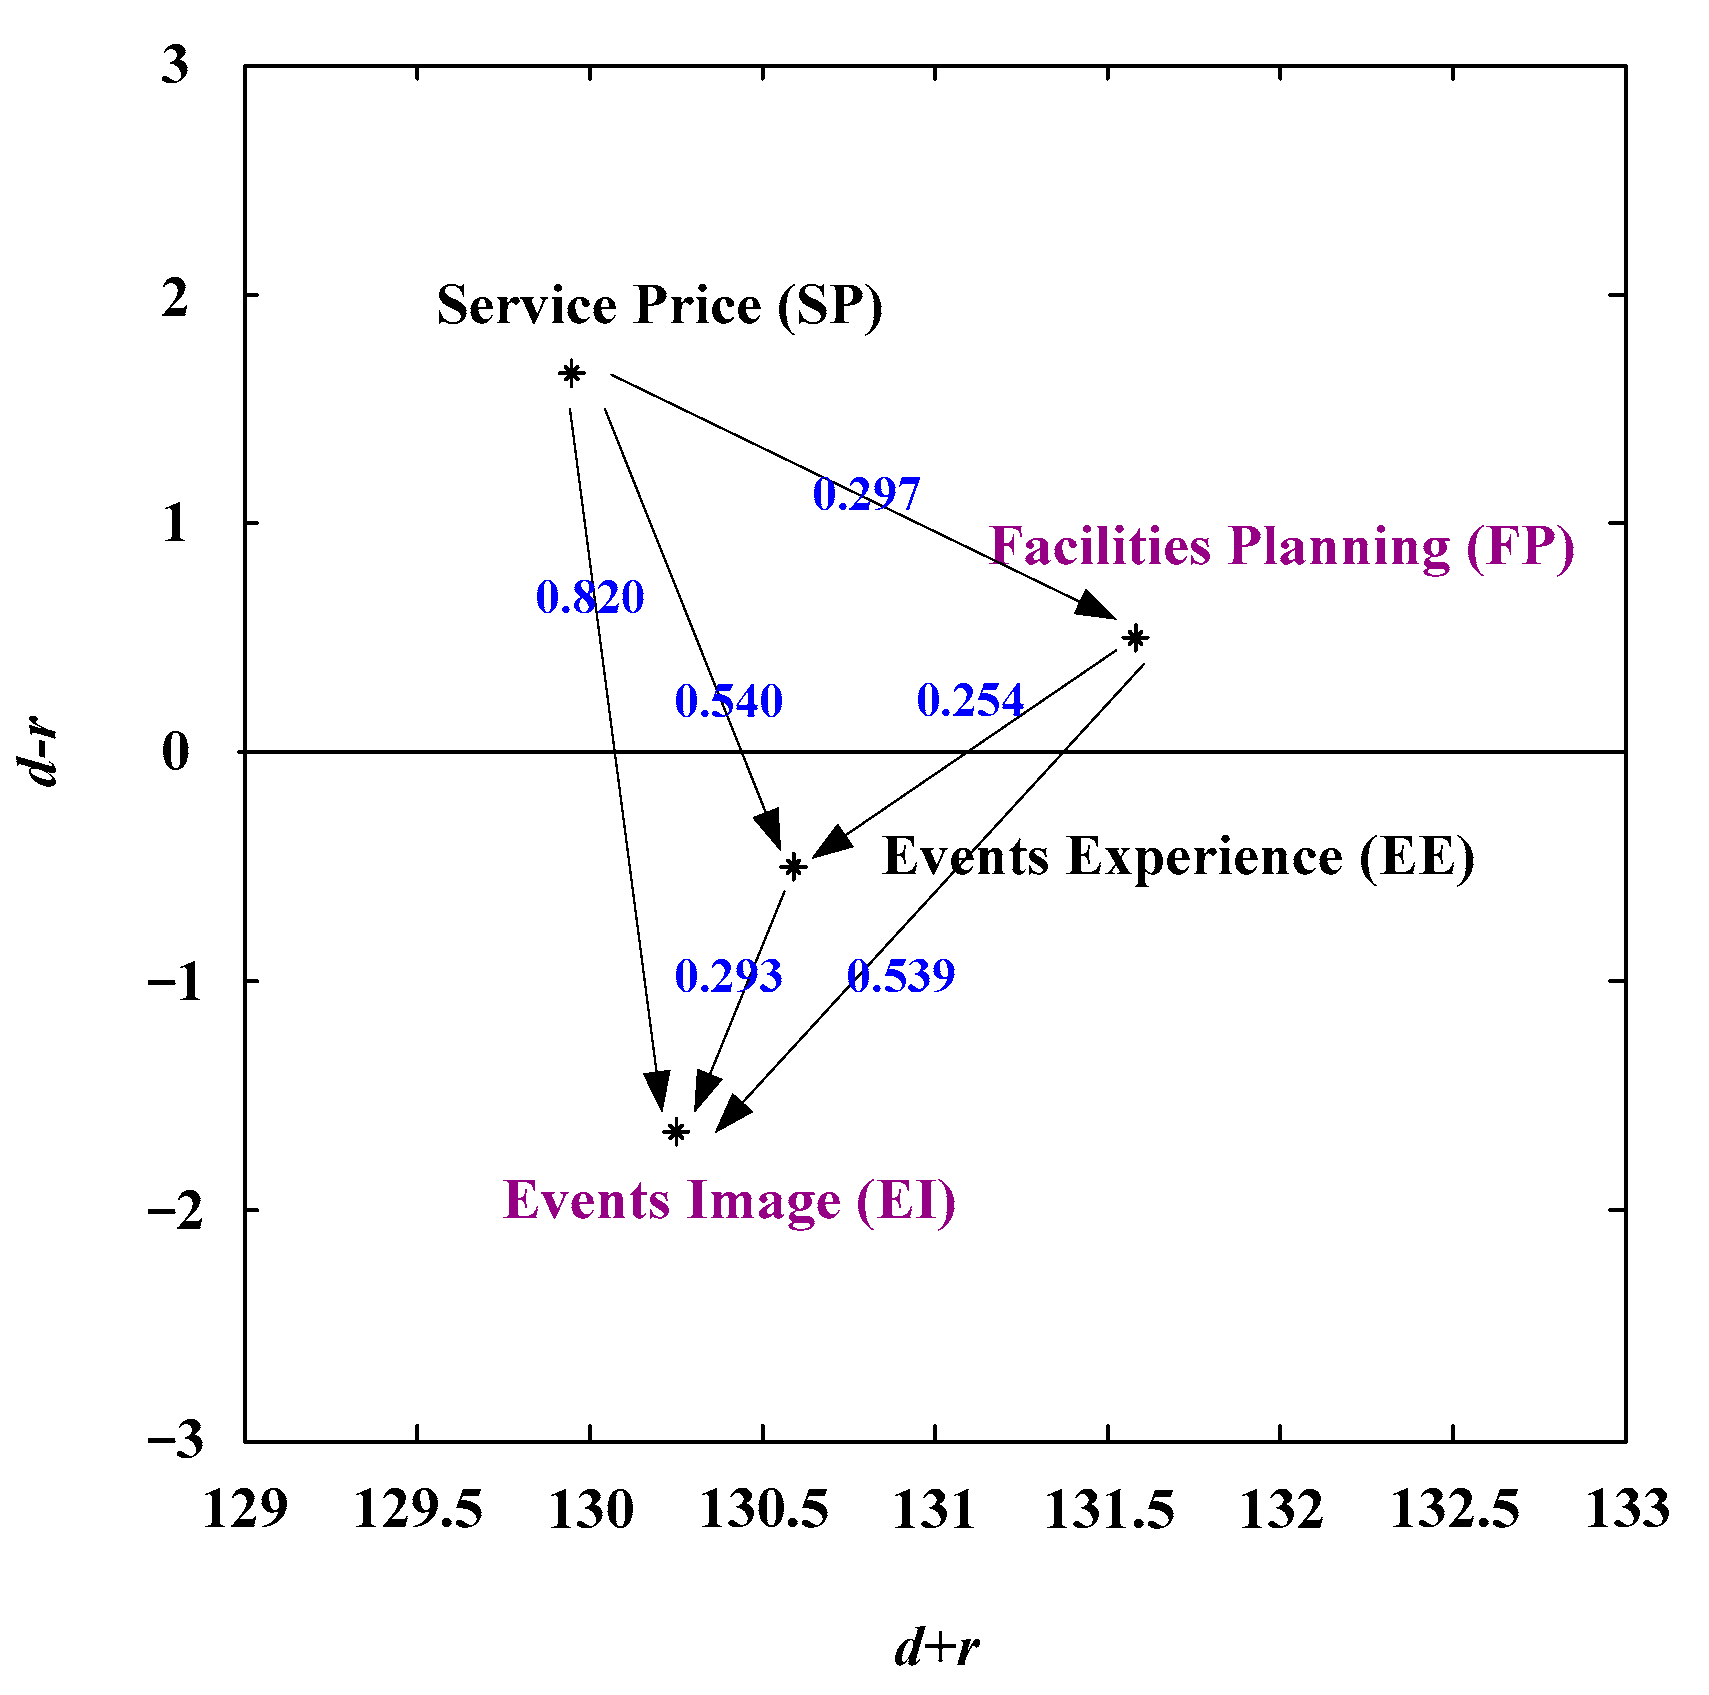
| Aspects | EI | EE | FP | SP |
|---|---|---|---|---|
| Events Image (EI) | - | |||
| Events Experience (EE) | 0.293 | - | ||
| Facilities Planning (FP) | 0.539 | 0.254 | - | |
| Service Price (SP) | 0.820 | 0.540 | 0.297 | - |
| Aspects | SIA | NRM | AS | ||||
|---|---|---|---|---|---|---|---|
| SD | ID | (SD, ID) | d + r | d – r | (R, D) | ||
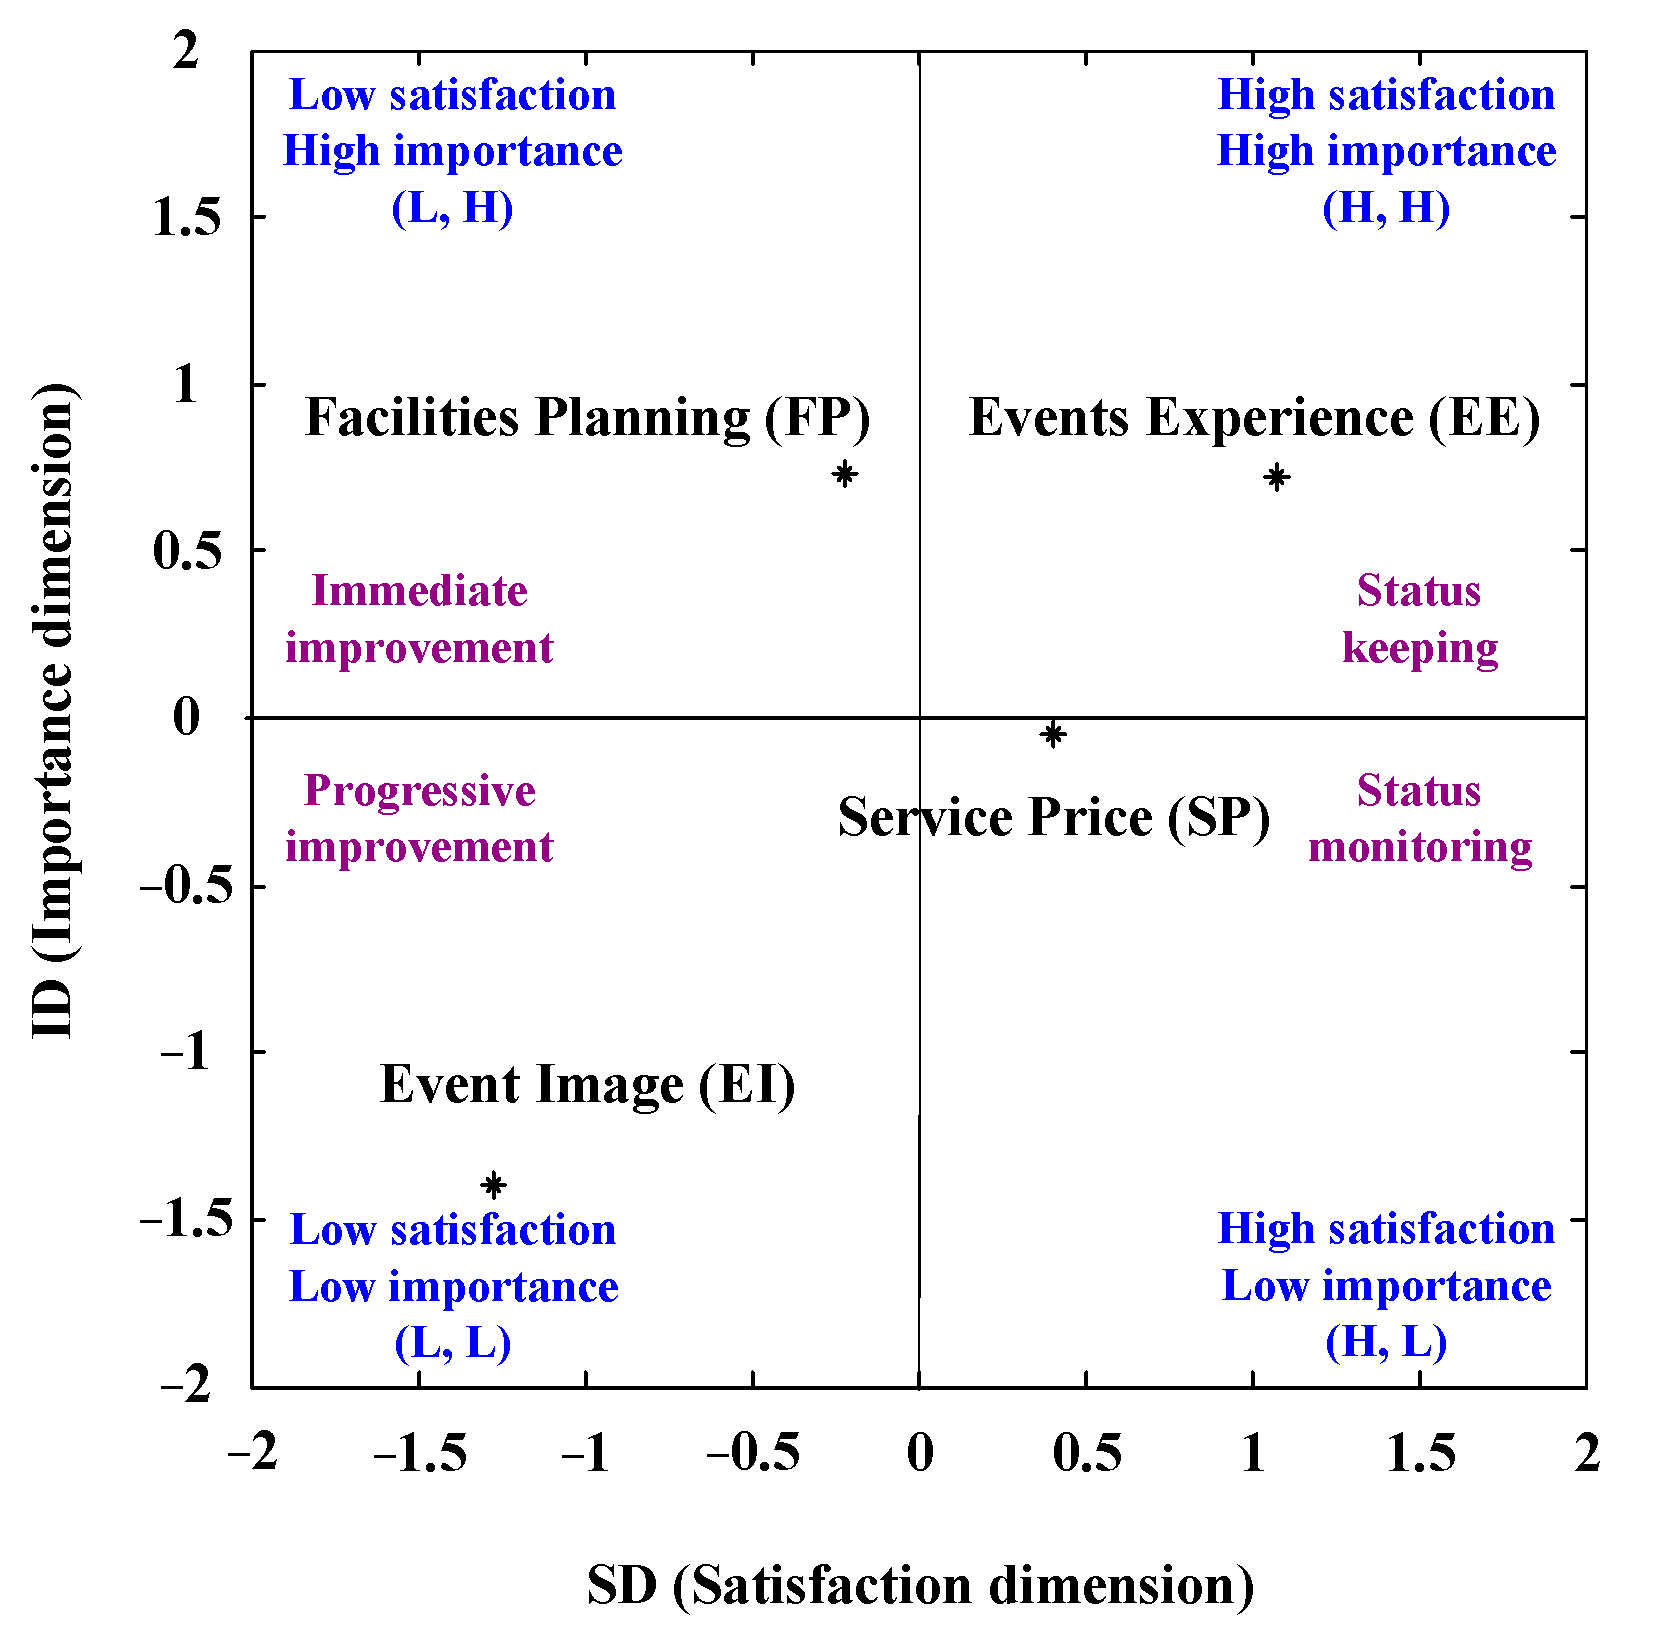
| Events Image (EI) | −1.273 | −1.396 | (L, L) | 130.253 | −1.651 | ID (+, −) | C |
| Events Experience (EE) | 1.079 | 0.719 | (H, H) | 130.592 | −0.501 | ID (+, −) | A |
| Facilities Planning (FP) | −0.216 | 0.729 | (L, H) | 131.585 | 0.496 | D (+, +) | B |
| Service Price (SP) | 0.410 | −0.051 | (H, L) | 129.951 | 1.657 | D (+, +) | D |
| SD (Satisfaction Dimension) | ID (Importance Dimension) | |
|---|---|---|
| Rank | EE [1] > SP [2] > FP [3] > EI [4] | FP [1] > EE [2] > SP [3] > EI [4] |
| Acceptation paths | 1. SP [2] → EI [4] {Y} 2. SP [2] → EE [1] → EI [4] {Y} 3. SP [2] → FP [3] → EI [4] {Y} 4. SP [2] → FP [3] → EE [1] → EI [4] {Y} | 1. SP [3] → EI [4] {Y} 2. SP [3] → EE [2] → EI [4] {Y} 3. SP [3] → FP [1] → EI [4] {Y} 4. SP [3] → FP [1] → EE [2] → EI [4] {Y} |
| Suited development paths | 1. SP → EI 2. SP → EE → EI 3. SP → FP → EI 4. SP → FP → EE → EI | |
| SIA | NRM | AS | |||||
|---|---|---|---|---|---|---|---|
| Aspects | SD | ID | (SD, ID) | d + r | d − r | (R, D) | |
| Renowned band (EI1) | 1.653 | 0.868 | (H, H) | 72.843 | −0.410 | ID (+, −) | A |
| Package service (EI2) | −0.446 | −1.921 | (L, L) | 71.353 | 0.833 | D (+, +) | C |
| Promotion activities (EI3) | 0.073 | −0.767 | (H, L) | 72.337 | −0.329 | ID (+, −) | D |
| Peripheral products (EI 4) | −2.612 | −2.286 | (L, L) | 70.523 | −0.094 | ID (+, −) | C |
| Aspects | EI1 | EI2 | EI3 | EI4 |
|---|---|---|---|---|
| Renowned band (EI1) | - | |||
| Package service (EI2) | 0.316 | - | ||
| Promotion activities (EI3) | 0.015 | −0.286 | - | |
| Peripheral products (EI4) | 0.079 | −0.232 | 0.058 | - |
| SD (Satisfaction Dimension) | ID (Importance Dimension) | |
|---|---|---|
| Rank | EI1 [1] > EI3 [2] > EI2 [3] > EI4 [4] | EI1 [1] > EI3 [2] > EI2 [3] > EI4 [4] |
| Acceptation paths | 1. EI2 [3] → EI1 [1] {N} 2. EI2 [3] → EI4 [4] → EI1 [1] {Y} 3. EI2 [3] → EI3 [2] → EI1 [1] {N} 4. EI2 [3] → EI4 [4] → EI3 [2] → EI1 [1] {Y} | 1. EI2 [3] → EI1 [1] {N} 2. EI2 [3] → EI4 [4] → EI1 [1] {Y} 3. EI2 [3] → EI3 [2] → EI1 [1] {N} 4. EI2 [3] → EI4 [4] → EI3 [2] → EI1 [1] {Y} |
| Suited development paths | 2. EI2 → EI4 → EI1 4. EI2 → EI4 → EI3 → EI1 | |
| SIA | NRM | AS | |||||
|---|---|---|---|---|---|---|---|
| Aspects | SD | ID | (SD, ID) | d + r | d − r | (R, D) | |
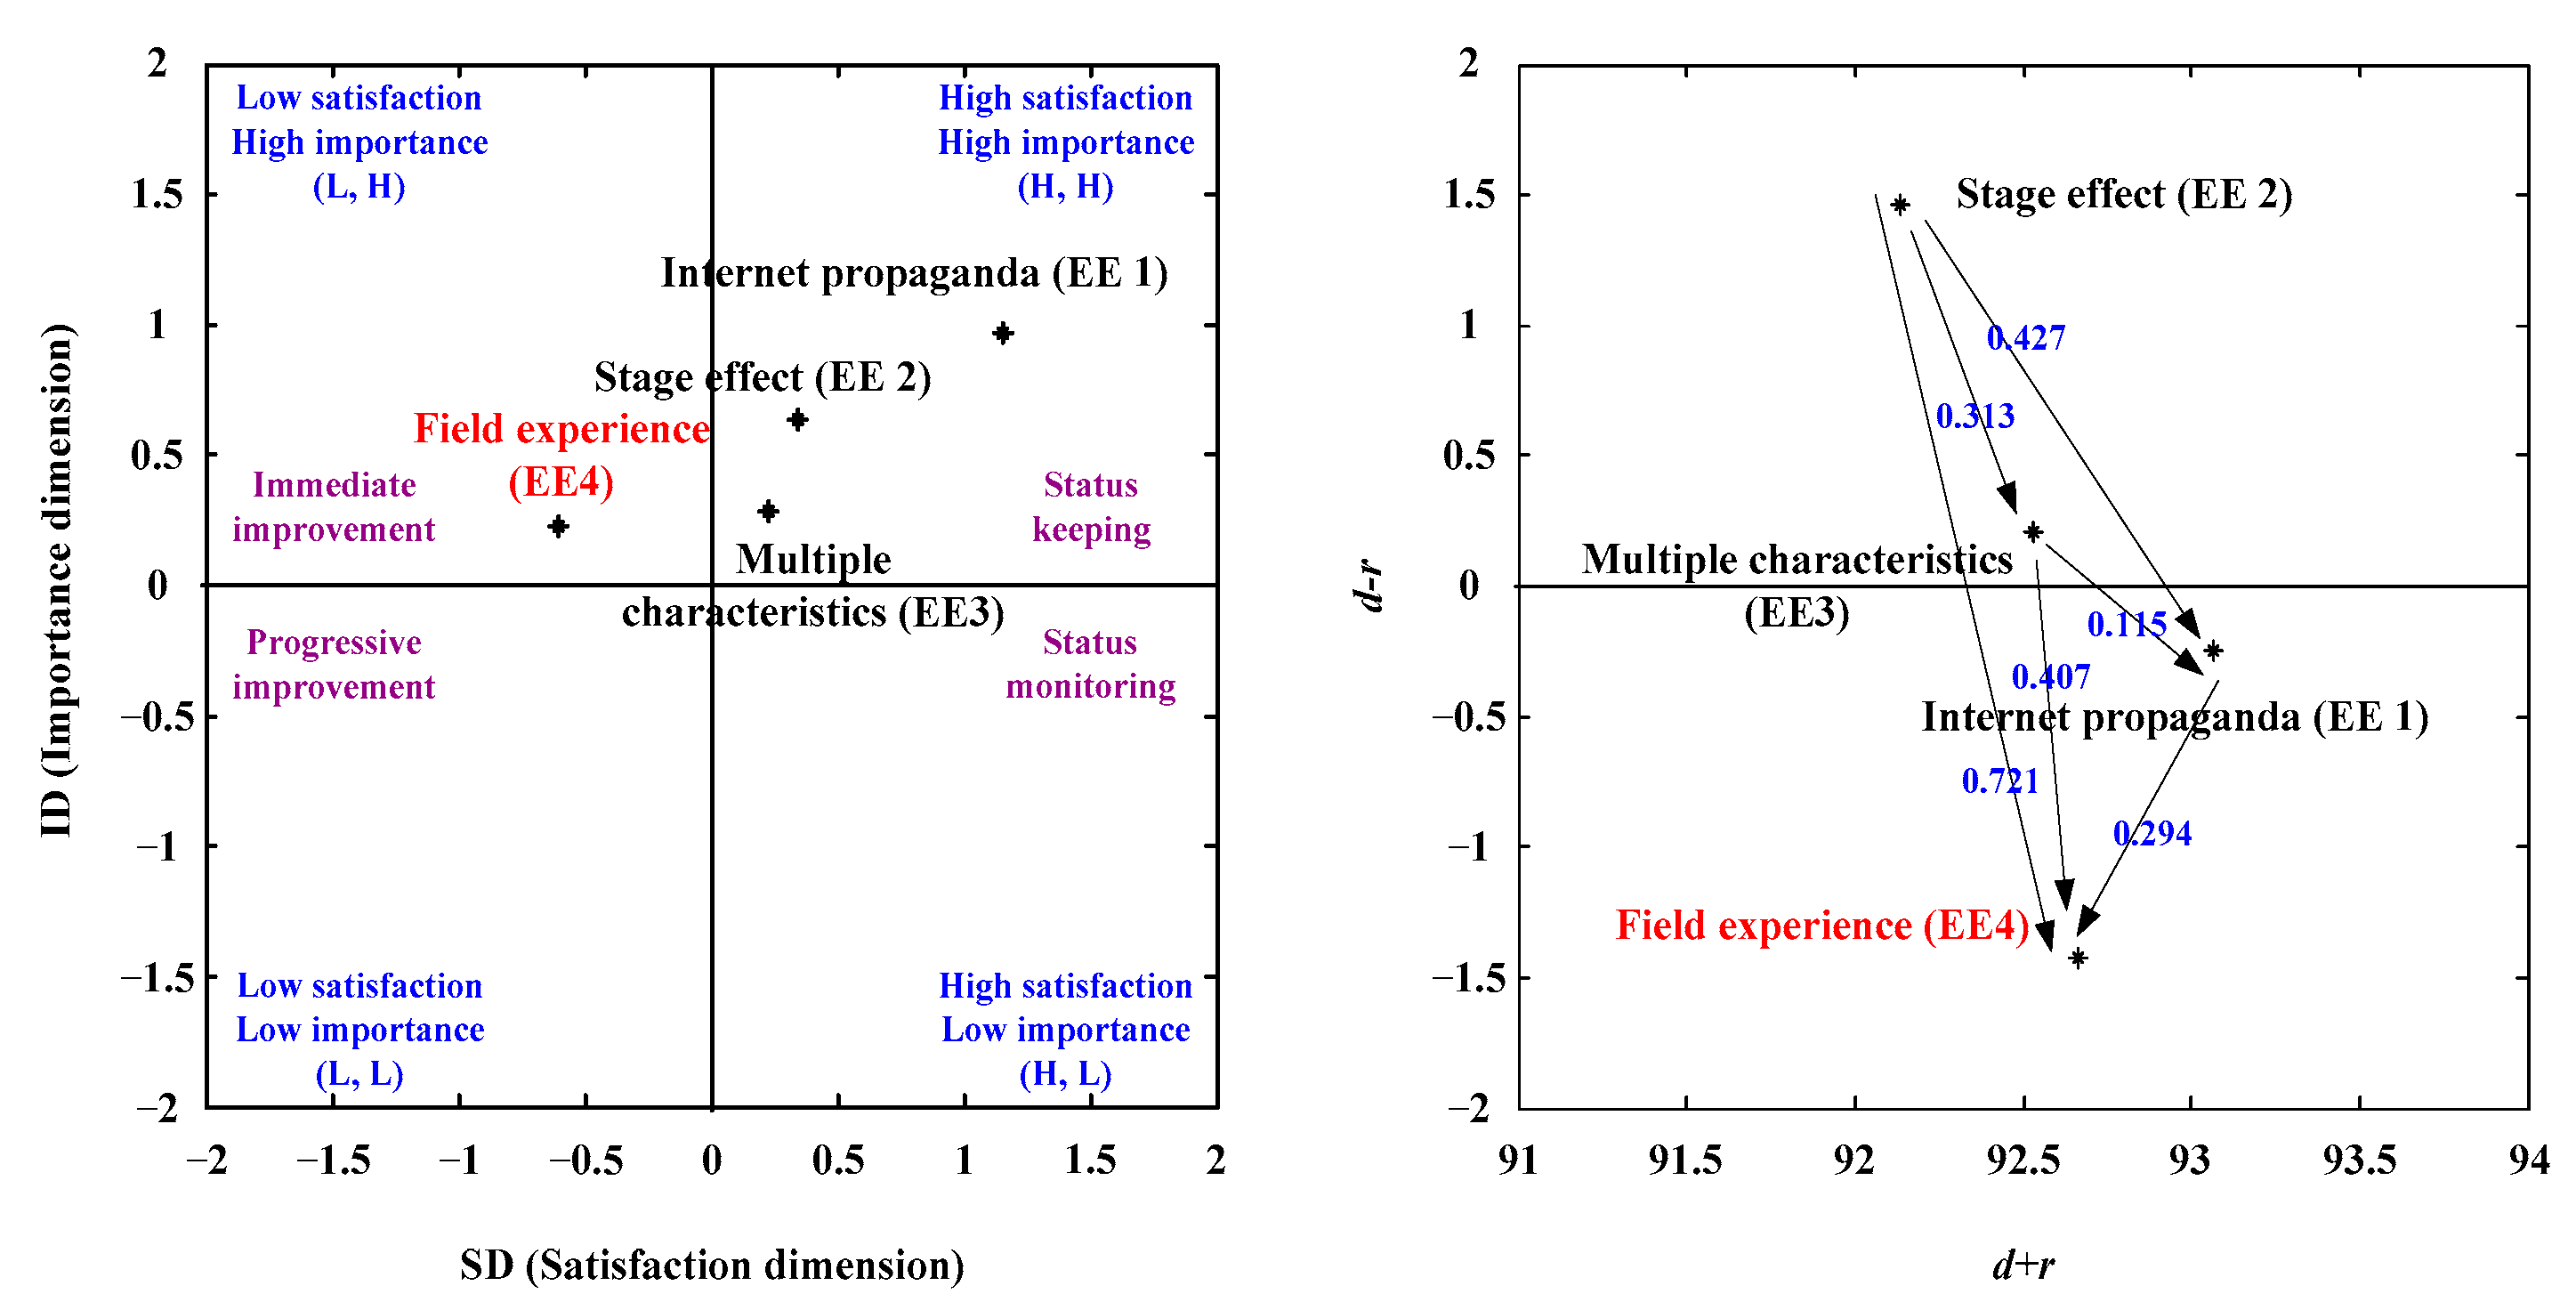
| Internet propaganda (EE 1) | 1.156 | 0.970 | (H, H) | 93.064 | −0.248 | ID (+, −) | A |
| Stage effect (EE 2) | 0.344 | 0.634 | (H, H) | 92.133 | 1.462 | D (+, +) | A |
| Multiple characteristics (EE3) | 0.231 | 0.284 | (H, H) | 92.531 | 0.209 | D (+, +) | A |
| Field experience (EE4) | −0.604 | 0.225 | (L, H) | 92.667 | −1.422 | ID (+, −) | B |
| Aspects | EI1 | EI2 | EI3 | EI4 |
|---|---|---|---|---|
| Internet propaganda (EE1) | - | |||
| Stage effect (EE2) | 0.427 | - | ||
| Multiple characteristics (EE3) | 0.115 | −0.313 | - | |
| Field experience (EE4) | −0.294 | −0.721 | −0.407 | - |
| SD (Satisfaction Dimension) | ID (Importance Dimension) | |
|---|---|---|
| Rank | EE1 [1] > EE2 [2] > EE3 [3] > EE4 [4] | EE1 [1] > EE2 [2] > EE3 [3] > EE4[4] |
| Acceptation paths | 1. EE2 [2] → EE4 [4] {Y} 2. EE2 [2] → EE1 [1] → EE4 [4] {Y} 3. EE2 [2] → EE3 [3] → EE4 [4] {Y} 4. EE2 [2] → EE3 [3] → EE1 [1] → EE4 [4] {Y} | 1. EE2 [2] → EE4 [4] {Y} 2. EE2 [2] → EE1 [1] → EE4 [4] {Y} 3. EE2 [2] → EE3 [3] → EE4 [4] {Y} 4. EE2 [2] → EE3 [3] → EE1 [1] → EE4 [4] {Y} |
| Suited development paths | 1. EE2 → EE4 2. EE2 → EE1 → EE4 3. EE2 → EE3 → EE4 4. EE2 → EE3 → EE1 → EE4 | |
| SIA | NRM | AS | |||||
|---|---|---|---|---|---|---|---|
| Aspects | SD | ID | (SD, ID) | d + r | d − r | (R, D) | |
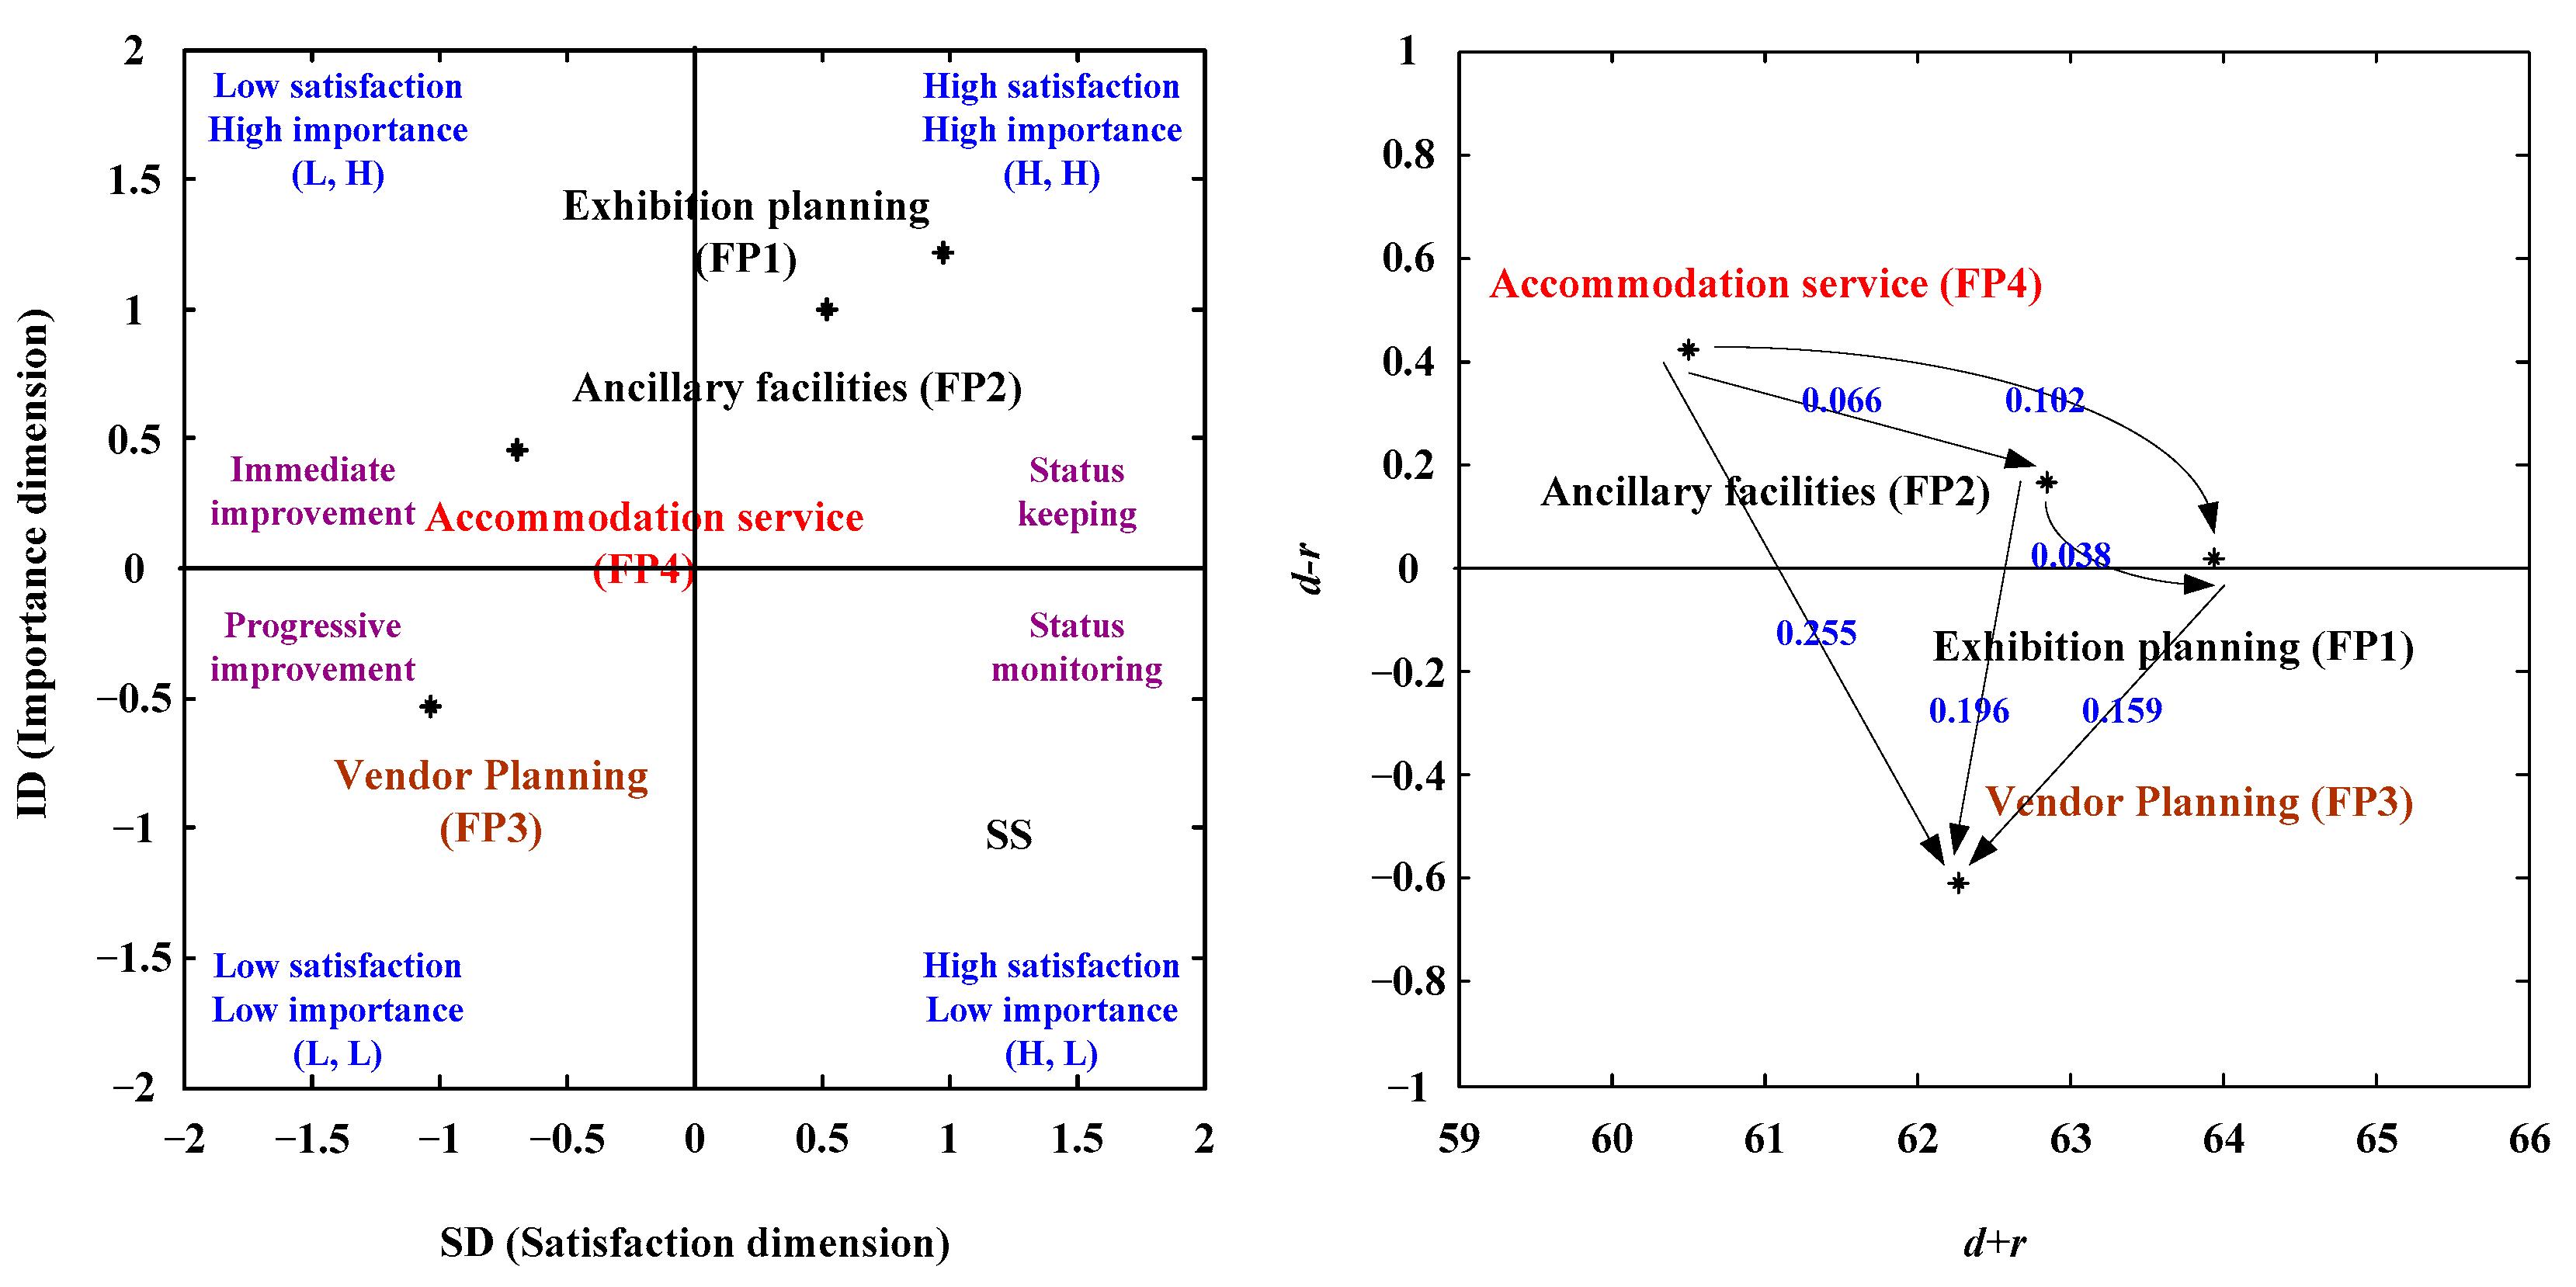
| Exhibition planning (FP1) | 0.976 | 1.218 | (H, H) | 63.938 | 0.018 | D (+, +) | A |
| Ancillary facilities (FP2) | 0.525 | 0.999 | (H, H) | 62.846 | 0.168 | D (+, +) | A |
| Vendor planning (FP3) | −1.032 | −0.534 | (L, L) | 62.275 | −0.609 | ID (+, −) | C |
| Accommodation service (FP4) | −0.694 | 0.459 | (L, H) | 60.513 | 0.423 | D (+, +) | B |
| Aspects | FP1 | FP2 | FP3 | FP4 |
|---|---|---|---|---|
| Exhibition planning (FP1) | - | |||
| Ancillary facilities (FP2) | 0.038 | - | ||
| Vendor planning (FP3) | −0.159 | −0.196 | - | |
| Accommodation service (FP4) | 0.102 | 0.066 | 0.255 | - |
| SD (Satisfaction Dimension) | ID (Importance Dimension) | |
|---|---|---|
| Rank | FP1 [1] > FP2 [2] > FP4 [3] > FP3 [4] | FP1 [1] > FP2 [2] > FP4 [3] > FP3 [4] |
| Acceptation paths | 1. FP4 [3] → FP3 [4] {Y} 2. FP4 [3] → FP2 [2] → FP3 [4] {Y} 3. FP4 [3] → FP1 [1] → FP3 [4] {Y} 4. FP4 [3] → FP2 [2] → FP1 [1] → FP3 [4] {Y} | 1. FP4 [3] → FP3 [4] {Y} 2. FP4 [3] → FP2 [2] → FP3 [4] {Y} 3. FP4 [3] → FP1 [1] → FP3 [4] {Y} 4. FP4 [3] → FP2 [2] → FP1 [1] → FP3 [4] {Y} |
| Suited development paths | 1. FP4 → FP3 2. FP4 → FP2 → FP3 3. FP4 → FP1 → FP3 4. FP4 → FP2 → FP1 → FP3 | |
| SIA | NRM | AS | |||||
|---|---|---|---|---|---|---|---|
| Aspects | SD | ID | (SD, ID) | d + r | d − r | (R, D) | |
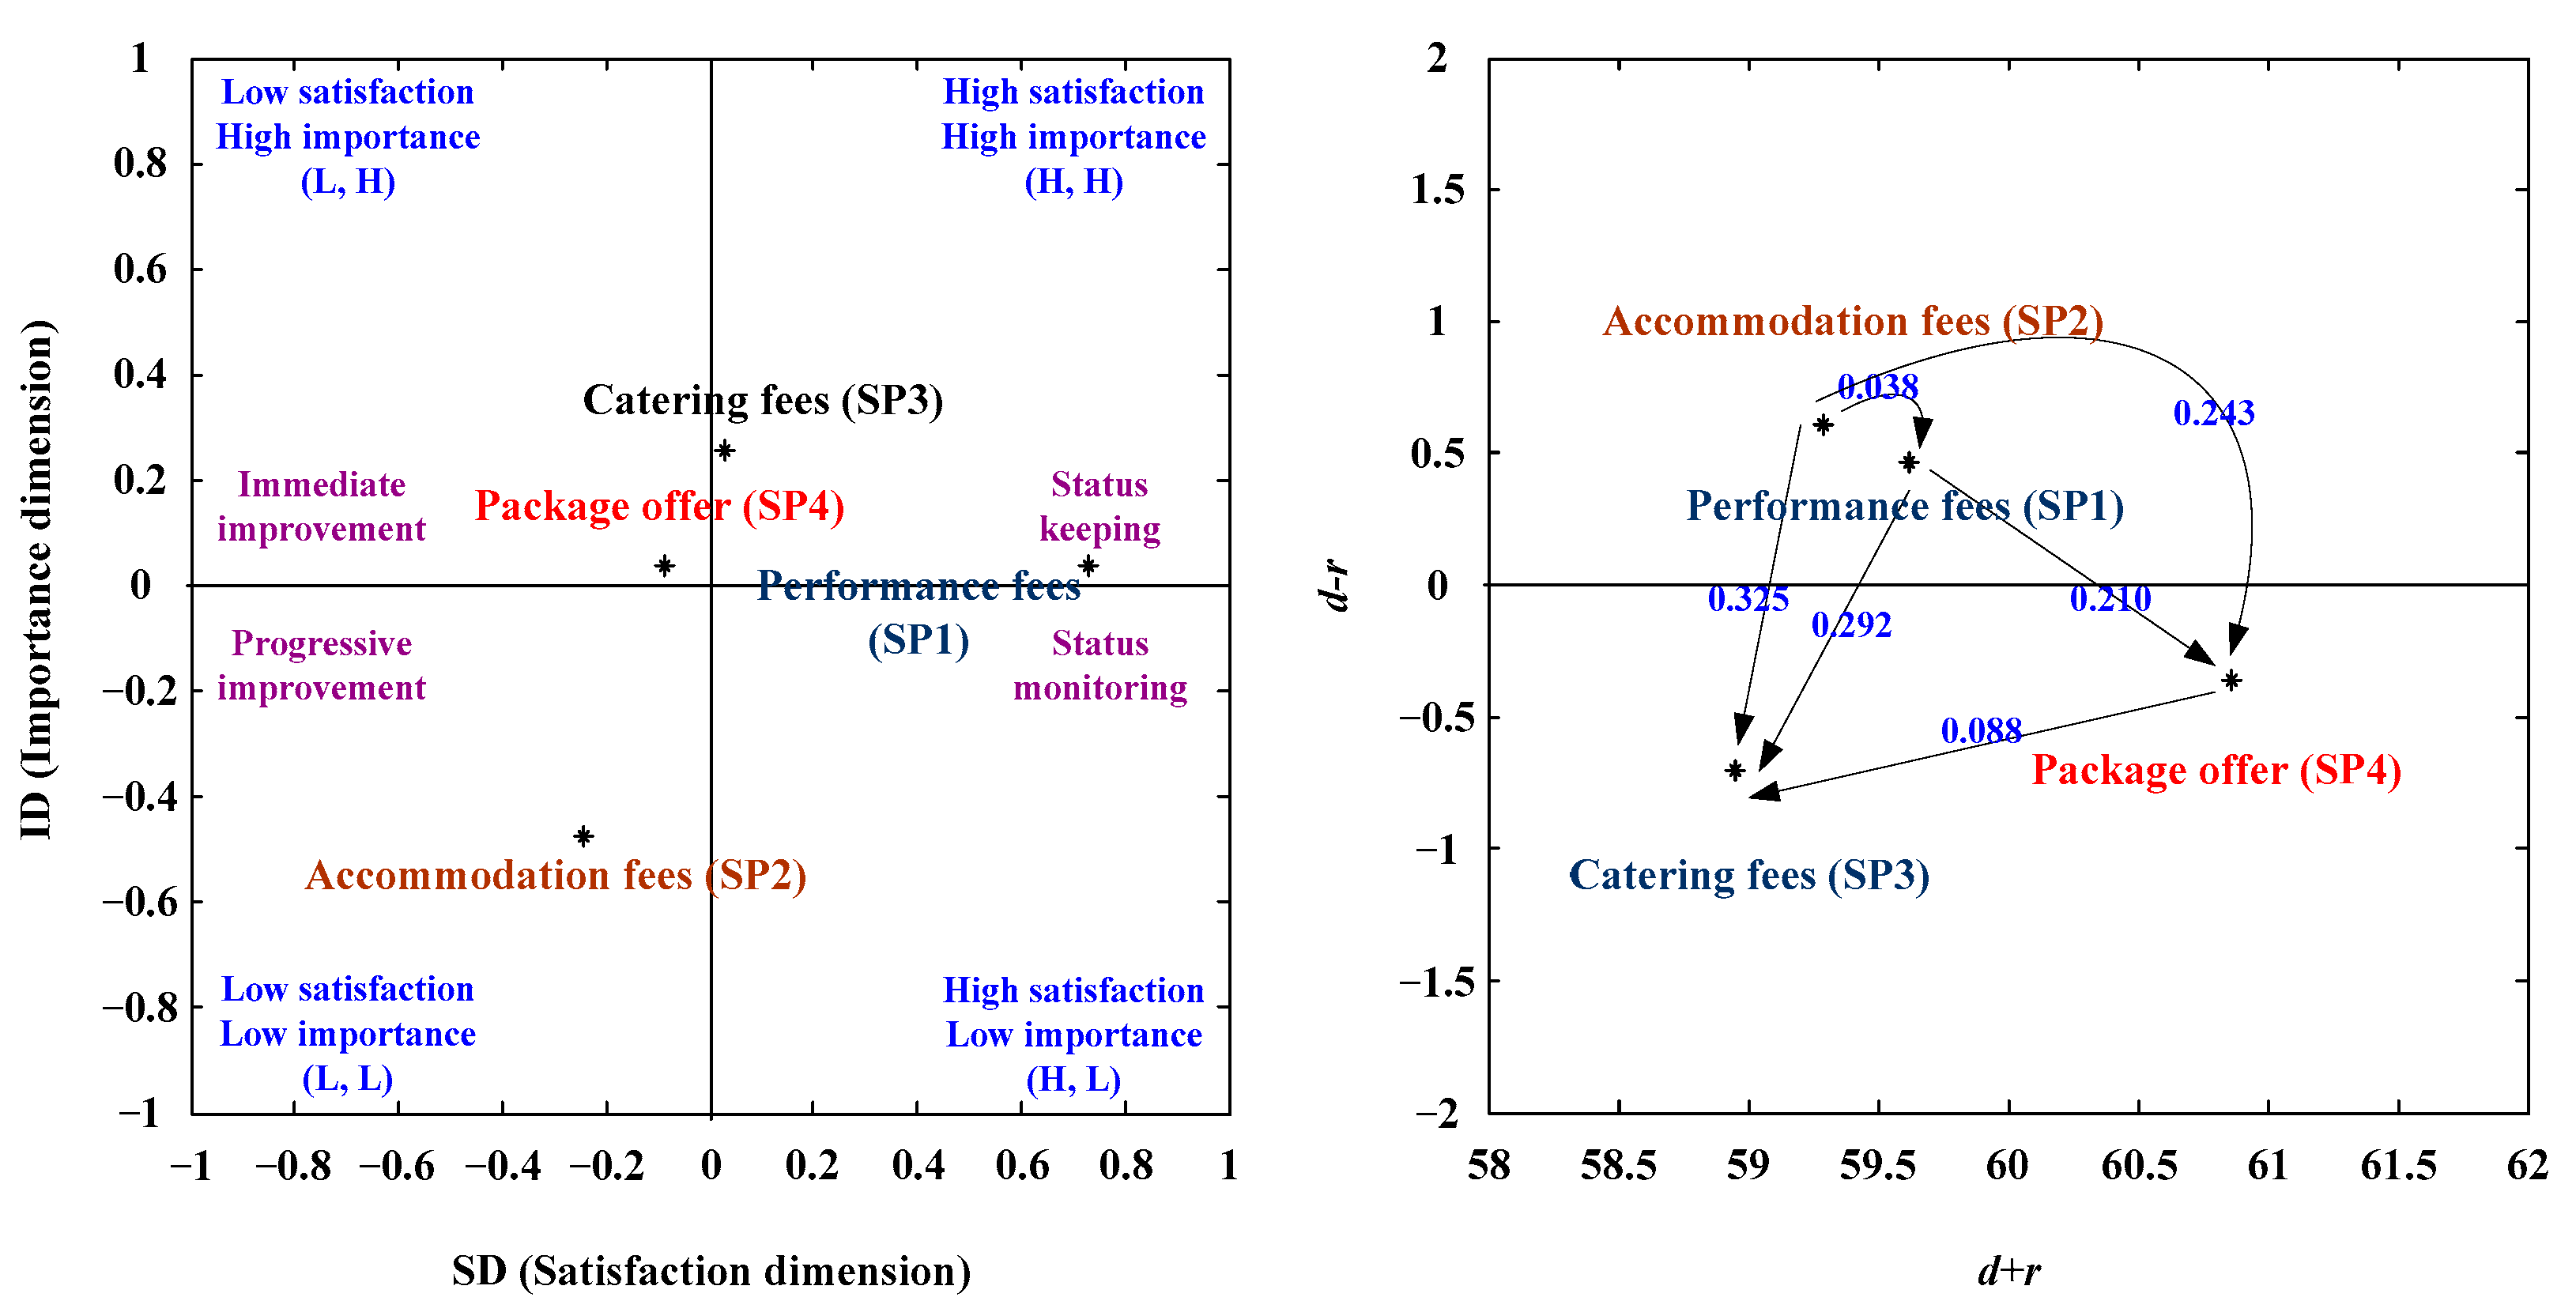
| Performance fees (SP1) | 0.728 | 0.036 | (H, H) | 59.624 | 0.464 | D (+, +) | A |
| Accommodation fees (SP2) | −0.243 | −0.475 | (L, L) | 59.291 | 0.605 | D (+, +) | C |
| Catering fees (SP3) | 0.028 | 0.255 | (H, H) | 58.955 | −0.705 | ID (+, −) | A |
| Package offer (SP4) | −0.085 | 0.036 | (L, H) | 60.861 | −0.364 | ID (+, −) | B |
| Aspects | SP1 | SP2 | SP3 | SP4 |
|---|---|---|---|---|
| Performance fees (SP1) | - | |||
| Accommodation fees (SP2) | 0.038 | - | ||
| Catering fees (SP3) | −0.292 | −0.325 | - | |
| Package offer (SP4) | −0.210 | −0.243 | 0.088 | - |
| SD (Satisfaction Dimension) | ID (Importance Dimension) | |
|---|---|---|
| Rank | SP1 [1] > SP3 [2] > SP4 [3] > SP2 [4] | SP3 [1] > SP1 [2] = SP4 [2] > SP2 [4] |
| Acceptation paths | 1. SP2 [4] → SP3 [2] {N} 2. SP2 [4] → SP1 [1] → SP3 [2] {Y} 3. SP2 [4] → SP4 [3] → SP3 [2] {N} 4. SP2 [4] → SP1 [1] → SP4 [3] → SP3 [2] {Y} | 1. SP2 [4] → SP3 [1] {N} 2. SP2 [4] → SP1 [2] → SP3 [1] {N} 3. SP2 [4] → SP4 [2] → SP3 [1] {N} 4. SP2 [4] → SP1 [2] → SP4 [2] → SP3 [1] {Y} |
| Suited development paths | 4. SP2 → SP1 → SP4 → SP3 | |
| Aspects | Suited Development Paths |
|---|---|
| Events image (EI) | 2. EI2 (package service) → EI4 (peripheral products) → EI1 (renowned band) 4. EI2 (package service) → EI4 (peripheral products) → EI3 (promotion activities) → EI1 (renowned band) |
| Events Experience (EE) | 1. EE2 (stage effect) → EE4 (field experience) 2. EE2 (stage effect) → EE1 (internet propaganda) → EE4 (field experience) 3. EE2 (stage effect) → EE3 (multiple characteristics) → EE4 (field experience) 4. EE2 (stage effect) → EE3 (multiple characteristics) → EE1 (internet propaganda) → EE4 (field experience) |
| Facilities Planning (FP) | 1. FP4 (accommodation service) → FP3 (vendor Planning) 2. FP4 (accommodation service) → FP2 (ancillary facilities) → FP3 (vendor Planning) 3. FP4 (accommodation service) → FP1 (exhibition planning) → FP3 (vendor Planning) 4. FP4 (accommodation service) → FP2 (ancillary facilities) → FP1 (exhibition planning) → FP3 (vendor Planning) |
| Service price (SP) | 4. SP2 (accommodation fees) → SP1 (performance fees) → SP4 (package offer) → SP3 (catering fees) |
Publisher’s Note: MDPI stays neutral with regard to jurisdictional claims in published maps and institutional affiliations. |
© 2022 by the authors. Licensee MDPI, Basel, Switzerland. This article is an open access article distributed under the terms and conditions of the Creative Commons Attribution (CC BY) license (https://creativecommons.org/licenses/by/4.0/).
Share and Cite
Chang, J.-J.; Chen, R.-F.; Lin, C.-L. Exploring the Driving Factors of Urban Music Festival Tourism and Service Development Strategies Using the Modified SIA-NRM Approach. Sustainability 2022, 14, 7498. https://doi.org/10.3390/su14127498
Chang J-J, Chen R-F, Lin C-L. Exploring the Driving Factors of Urban Music Festival Tourism and Service Development Strategies Using the Modified SIA-NRM Approach. Sustainability. 2022; 14(12):7498. https://doi.org/10.3390/su14127498
Chicago/Turabian StyleChang, Jung-Jung, Ruey-Feng Chen, and Chia-Li Lin. 2022. "Exploring the Driving Factors of Urban Music Festival Tourism and Service Development Strategies Using the Modified SIA-NRM Approach" Sustainability 14, no. 12: 7498. https://doi.org/10.3390/su14127498
APA StyleChang, J.-J., Chen, R.-F., & Lin, C.-L. (2022). Exploring the Driving Factors of Urban Music Festival Tourism and Service Development Strategies Using the Modified SIA-NRM Approach. Sustainability, 14(12), 7498. https://doi.org/10.3390/su14127498