Article

Spatiotemporal Variation and Driving Factors of Embodied Carbon in China-G7 Trade

China Institute for Studies in Energy Policy, Collaborative Innovation Center for Energy Economics and Energy Policy, School of Management, Xiamen University, Xiamen 361005, China
*
Author to whom correspondence should be addressed.
Sustainability 2022, 14(12), 7478; https://doi.org/10.3390/su14127478
Submission received: 22 May 2022 / Revised: 14 June 2022 / Accepted: 16 June 2022 / Published: 19 June 2022
(This article belongs to the Topic Climate Change and Environmental Sustainability)

Abstract

:
China and G7 countries contribute 70% global GDP and 55% global carbon emissions. The carbon leakage between China and G7 is a crucial issue in achieving the synergetic emission abatement globally. The motivation of this study is to evaluate the embodied carbon transfer between China and G7 in the trade between 2000 and 2014, and investigate the driving factors that impact the embodied carbon trend. A multiregional input–output (MRIO) model based on the WIOD database is constructed, and a structural decomposition analysis (SDA) is employed. The results indicate that China plays the role of net exporter of embodied carbon in trade with G7, which mainly flows to the US (5825.67 Mt), Japan (3170.36 Mt) and Germany (1409.93 Mt). However, China’s embodied carbon exports to the G7 show an inverted U-shaped trend with a turning point after financial crisis, while the G7’s embodied carbon exports to China continue to rise. The conclusion is that to achieve the climate goal of carbon neutrality, it is not enough to rely solely on the low-carbon transition on the production side, the demand side should also be adjusted.

1. Introduction

The climate crisis is a common challenge facing human society. In 2020, global carbon emissions 32.284 billion Tons even as the global economy was shattered by the COVID-19 pandemic [1]. In the future, the carbon emissions related to energy combustion will continue to increase for a long time [2]. International trade is an unignorable contributor of carbon emissions [3]. Over the past two decades, nearly a quarter of global carbon emissions have been exported [4]. The issue of carbon leakage embodied in the international trade not only undermines the effectiveness of global emission mitigation, but has also led to the unfair distribution of carbon reduction responsibilities. Peters et al. [4] found that the scale of embodied carbon exported by developing countries to developed countries from 1990 to 2008 exceeded that stipulated in the Kyoto protocol. The research of Kanemoto et al. [5] supports this view. The variation of embodied carbon is an essential constituent to achieving global synergetic emission reduction.
Rapid economic development has made constituent China the world’s largest trading country and the world’s largest carbon dioxide emitter [6]. In recent years, China’s export trade has grown steadily, and resource consumption and carbon emissions have increased significantly [7]. The G7 is composed of seven developed countries in the world, and carbon emissions have also attracted much attention (G7 are made up of the world’s seven largest developed countries, which include the US, Canada, UK, France, Germany, Italy and Japan). For example, Awaworyi Churchill et al. [8] used a nonparametric panel model to test the impact of R&D intensity on carbon dioxide emissions of the G7 since the 19th century. Chaudhry et al. [9] investigated the impact of carbon emissions of G7 countries on sovereign risk. G7 is an important trading partner of China. In 2020, China’s exports to G7 accounted for 33.36% of China’s total exports, and its imports to G7 accounted for 24.77% of China’s total imports. Since the 1990s, China and the G7 economies have generated about 60% of the global carbon emissions with a global economic share of about 70%. China and the G7 are the most influential countries in terms of economic and political status, and also the largest carbon dioxide emitters. It is very important to study the embodied carbon transfer in trade between China and the G7 for global cooperation in emission reduction [8]. Therefore, this paper takes the trade between China and G7 as an example to explore the evolution trend of “carbon leakage” between China and G7 and the driving factors behind the change.
Some researchers have tried to evaluate the amount and driving factors of embodied carbon in the international trade. The input–output analysis (IOA) and structural decomposition analysis (SDA) are the most widely adopted method. Most of the current literatures focus on the trade embodied carbon in the range of global [4], regional [10], bilateral trade [11] or a single country [12]. However, the studies focusing on the embodied carbon about the China-G7 trade are limited. Chen and Chen [13] divide the world into three supranational alliances, G7, BRICS and ROW, and use MRIO to measure the carbon embodied in international trade. However, their study covers only 2004 and does not reflect the latest developments in the world economy. Before and after the 2008 financial crisis, industrial carbon emissions showed different characteristics [14]. Meanwhile, the energy consumption and economic growth in China have shown a different trend since 2000 [15]. It is necessary to track the changing trend of embodied carbon in China–G7 trade.
This paper constructs a multiregional input–output (MRIO) model and adopts SDA to investigate the spatial-temporal variation and driving factors of the embodied carbon in the China–G7 trade. We find that China is a net exporter of embodied carbon and plays the role of a pollution haven in trade with G7 countries. The SDA decomposition results show that, in terms of the drivers of China’s exported embodied carbon emissions, export scale is the main reason for the growth of China’s exported embodied carbon, while carbon intensity is the inhibiting reason. The impact of China’s input structure on embodied carbon changed significantly in 2007 due to industrial restructuring. Additionally, the expansion of G7 members’ exports to China partially offset the amount of implied carbon in China’s exports.
The potential contribution of this study includes three aspects: First, the bidirectional flow trend of embodied carbon in China–G7 has been evaluated. China and G7 countries account for more than half of the world’s economic share and carbon emission share. The economic and trade exchanges between them have a significant impact on global emission reduction. This study reveals the current status and differences of embodied carbon flows between China and G7, which may bring the focal point to realize the collaborative emission eliminate in the field of trade.
Second, the heterogeneity of embodied carbon transfer before and after the financial crisis has been studied. Most of the current research adopts the samples updated to 2009, which is unable to deeply analyze the changes brought by the 2008 financial crisis to the global trade pattern. In this study, we find that the embodied carbon export of China displays an inverted-U curve after the financial crisis.
Third, in terms of research perspective, existing studies pay less attention to the impact of the economic development of trade embodied carbon source countries on embodied carbon importing countries. However, the economic and technological characteristics of importing countries will also have a significant impact on the trade embodied carbon emissions of exporting countries. Therefore, this paper also considers the bidirectional effects of both imports and exports.
The rest of this article is arranged as follows: Section 2 provides the literature review on trade embodied carbon; Section 3 constructs the MRIO model and SDA model; Section 4 presents empirical results and discussions. Finally, Section 5 concludes the work.

2. Literature Review
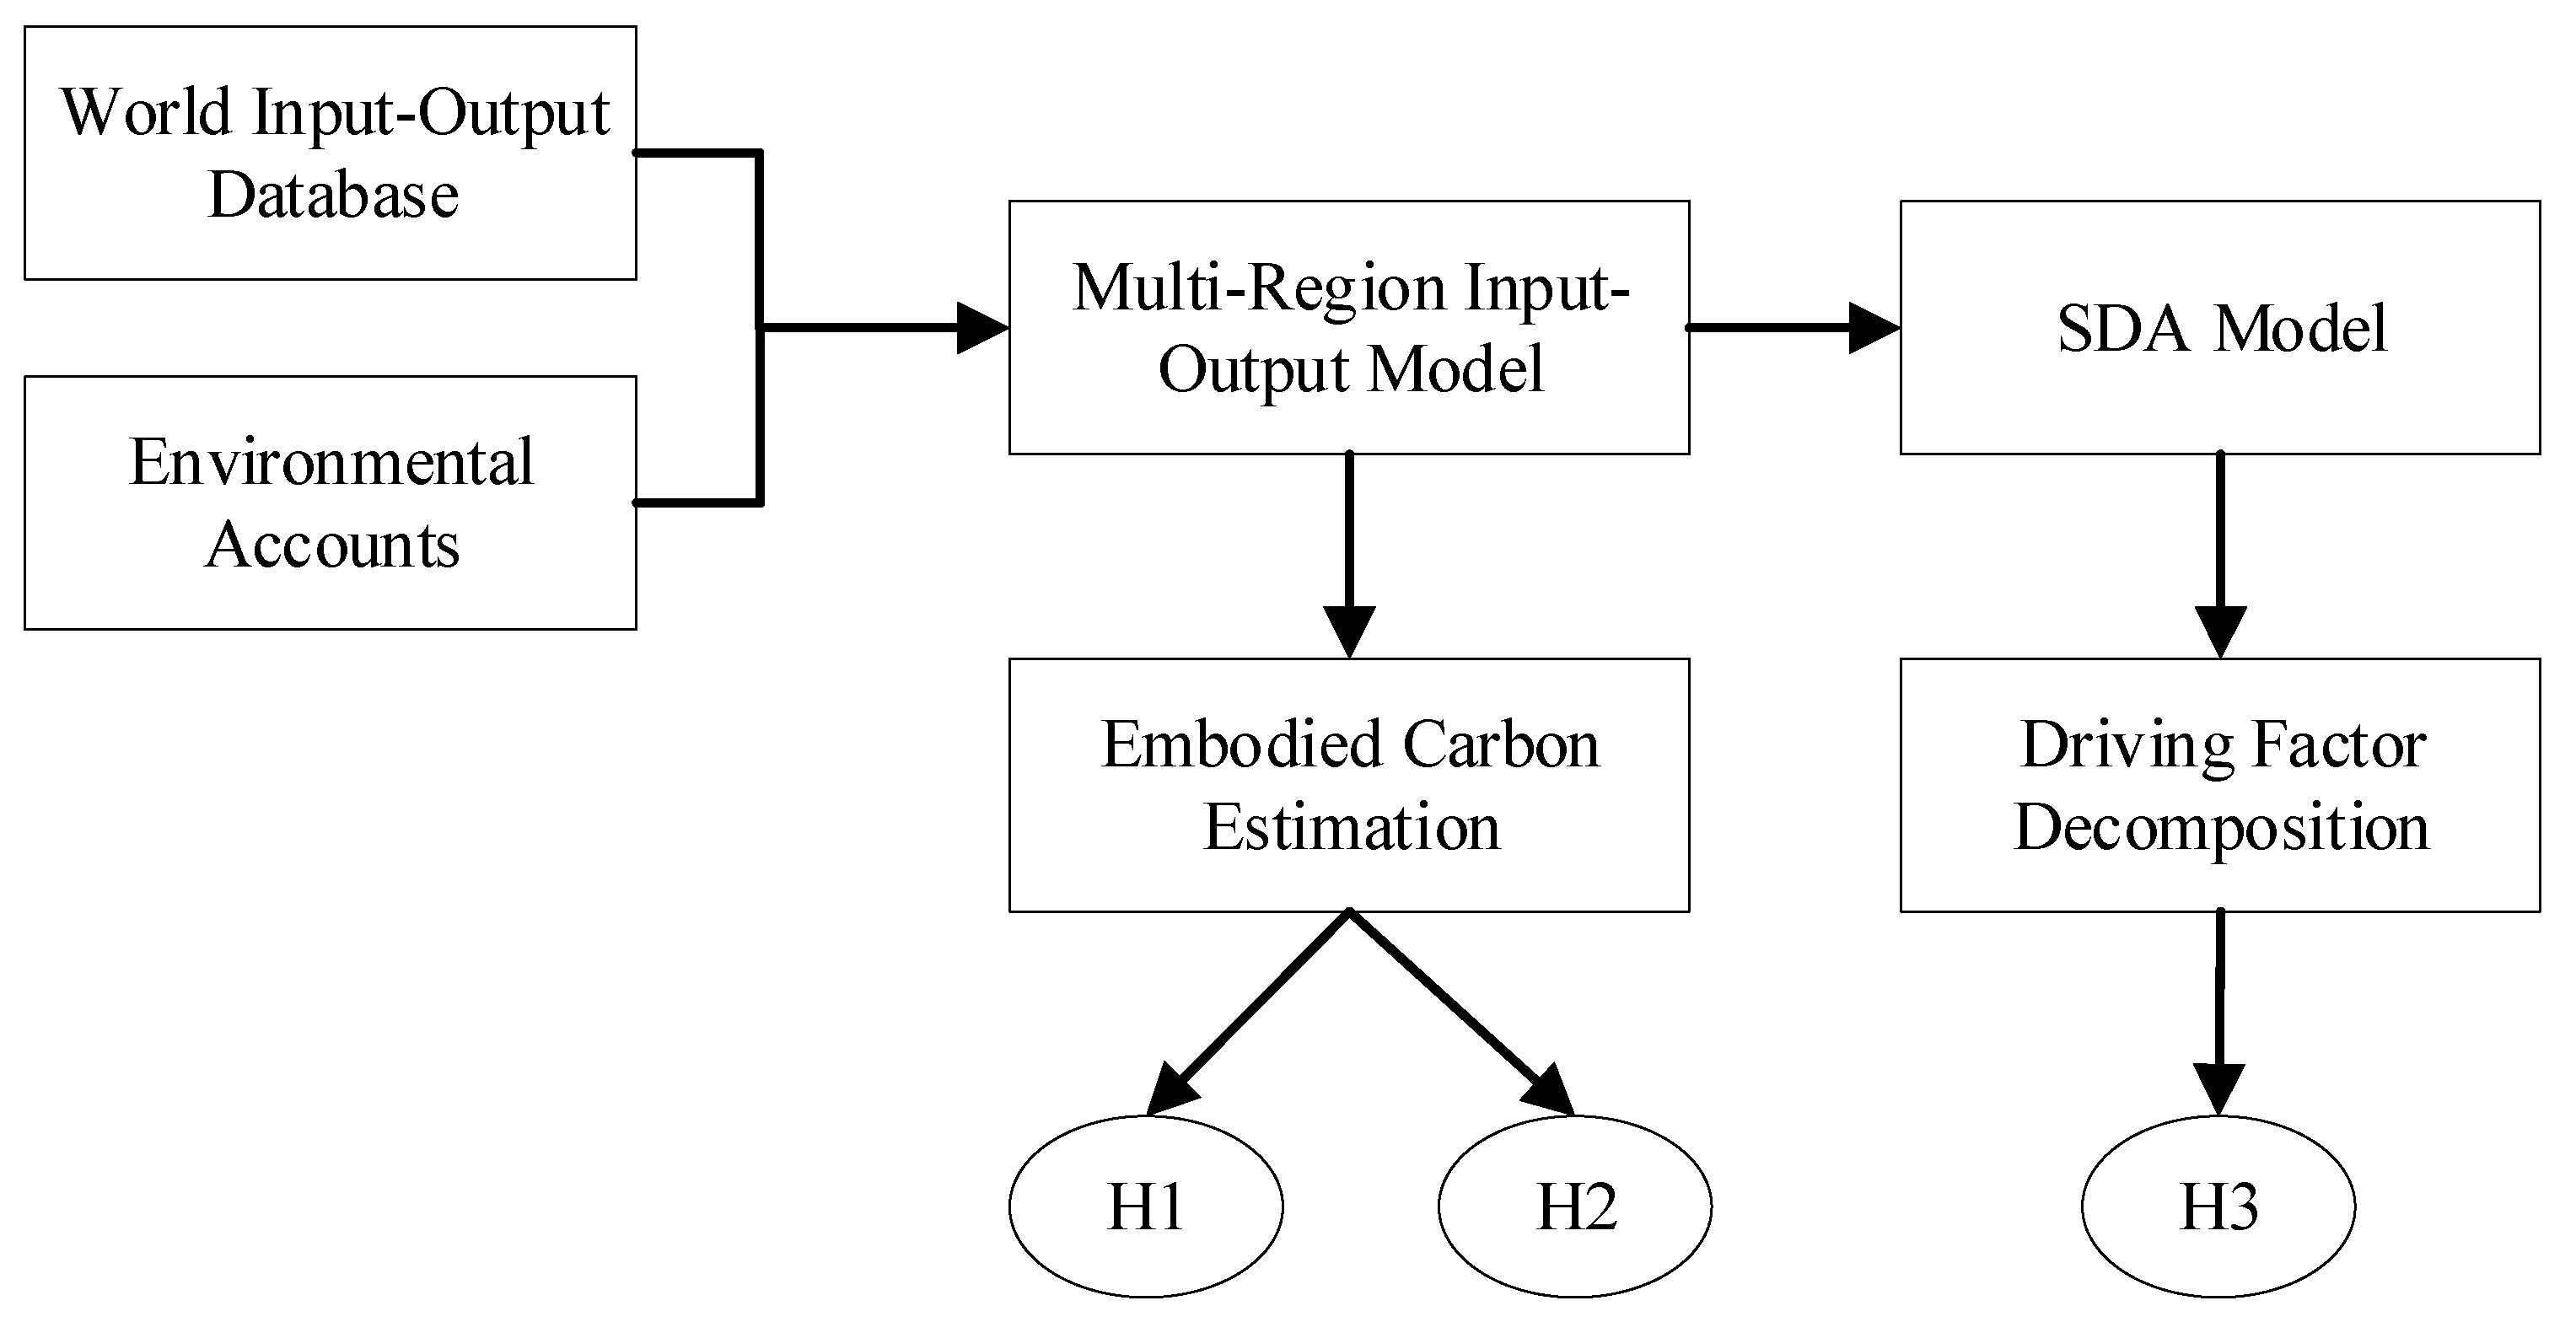
With the expansion of international trade, embodied carbon accounts for nearly 40% of global carbon emissions [16]. With this background, scholars pay more attention to the embodied carbon emission of trade. Some studies focus on the trade embodied carbon in the range of global, regional, bilateral trade or a single country. Peters et al. [4] investigated the trade in embodied carbon flow among 113 countries from 1990 to 2008, and found that the net emission transfer from developing countries to developed countries through international trade increased from 0.4GT CO2 in 1990 to 1.6GT CO2 in 2008. This increase even exceeded the emission reduction target of the “Kyoto Protocol”. Similar conclusions were obtained from the study of Xu and Dietzenbacher [17] and Deng and Xu [18] in different sample periods. In order to make the research more targeted, scholars have further investigated the embodied carbon flow between regions [10] and representative countries [19].
As the fastest growing economy in the world, China’s embodied carbon problem has attracted extensive attention. Considering that the US is China’s largest trading partner, Yu and Wang [20] and Xu et al. [21] investigated their embodied carbon from 1997 to 2002 and 2002 to 2007, respectively, and found that China’s embodied carbon export to the US showed an increasing trend. The above increase is mainly due to the expansion of trade scale [22]. In recent years, the embodied carbon in China–US trade has gradually become decoupled [23]. In addition to the US, Japan is also an important trading partner of China. Before the 21st century, although China was an embodied carbon exporter to Japan, China–Japan trade contributed to the realization of global carbon reduction [24]. However, as the sample period moves to the 21st century, Long et al. [6] found that the effect of the China–Japan trade on the global carbon emission had become an obstacle. In addition, some scholars have also studied the embodied carbon problems between China and the UK [25], Italy [26], Germany [27] and India [11].
No particular study has yet found embodied carbon in trade between China and France or Canada. In addition, the existing literature on embodied carbon emissions between EU members and China considered sample periods prior to 2009 and did not cover the post-financial-crisis period. After the financial crisis, developed countries attached importance to the development of real economy and implemented policies of reindustrialization. At the same time, China attaches importance to technological innovation and the optimization of investment structure and export structure. It is necessary to re-examine the embodied carbon emissions between China and EU representative countries to reflect the new circumstances. Whereas, most of the existing studies treat Europe as a whole to study the embodied carbon transfer between China and European countries. This may be because in international climate negotiations, compared with a single country, commitments committed by alliances with similar needs have higher reliability [28]. Although some works have studied the embodied carbon emissions between China and one of the G7 countries, there are few studies considering G7 as a whole. The new features after the financial crisis in 2008 have also been studied less.
From the perspective of research methods embodied carbon is measured by a bottom-up life cycle assessment (LCA) [29] or a top-down input–output analysis (IOA). However, the life cycle method is not widely applied in practice due to the high requirement for data, time-consuming calculation, and truncation error issue [30]. The input–output (IO) method proposed by Leontief [31] has been used since the 1960s to describe and analyze economic-environmental relationships [13]. Input–output analysis can be further divided into Single-Region Input–Output (SRIO) [32], Bilateral Trade Input–Output (BTIO) [24], and the Multi-Regional Input–Output [33]. The key differences between the three models are mainly related to the technical level setting and the handling of imported intermediate products. SRIO and BTIO were widely used in the study of trade embodied carbon in the early years. However, they could not distinguish the nature of imported goods and clearly show the carbon emission caused by the flow of intermediate products between countries. The MRIO model has improved on this shortcoming and is considered a sound approach to account for trade-related impacts at the national and supranational levels [34]. Therefore, this paper selects the MRIO model to calculate the trade embodied carbon between China and G7.
The driver decomposition can further explore the causes of carbon emission changes. In the aspect of driver decomposition, index decomposition analysis (IDA) [35] and structure decomposition analysis (SDA) are usually applied in the existing research. Using IDA, Yang et al. [36] pointed out that export scale, carbon intensity and export structure are the factors that influence the amount of China’s embodied carbon emission. Hoekstra and van den Bergh [37] compared SDA with IDA in terms of use condition and decomposition effect, and concluded that the SDA method based on input–output model has the advantages of well-grounded theory and analysis of direct and indirect effects. For these reasons, it has become the preferred method of many scholars and has been widely used in energy, economic development and environmental protection research [37]. Su and Thomson [38] used SDA to analyze the driving factors of China’s carbon emission changes from 2006 to 2012, regarding normal exports and processed exports. Zhao et al. [39] analyzed the embodied carbon of 28 industries in China from 2002 to 2018. At the early stage of research, the drivers of trade embodied carbon were generally divided into three categories: structure, scale and technological effect [40]. With the deepening of research, scholars began to examine the factors at home and abroad. Zhao et al. [41] divided the driving factors into seven categories, including energy emission coefficient, energy use structure, energy intensity, trade structure of intermediate products, production technology, export share of final products, and total demand. Wang et al. [27] divided the driving factors into five categories, including carbon emission coefficient, intermediate input structure, final demand country structure, final demand product structure and final demand scale. Typical research methods for embodied carbon emissions are summarized in Table 1.
Through the above analysis, we find that MRIO and SDA are widely used in the analysis of embodied carbon flows between multiple countries and the drivers behind them. Although some works have studied the embodied carbon emissions between China and one of the G7 countries, few studies consider G7 as a whole. Additionally, the new features after the financial crisis in 2008 have been less studied. The most relevant research is from Chen and Chen [13]) who constructed the MRIO model using the data provided by the GTAP database to measure the carbon embodied in trade among G7 economies, BRIC countries and ROW (the rest of the world) in 2004. However, China’s exports grew rapidly after joining the WTO in 2002, which also marked a period of rapid change in China’s industrial structure and technology. Therefore, we use the MRIO and SDA model to investigate the embodied carbon emissions and its driving factors of trade between China and G7. The possible innovation of this paper is that the structure effect is further divided into export structure effect and intermediate input structure effect. In addition, the relevant factors of exporting and importing countries were considered. That is, the impact of eight factors in four groups on China’s embodied carbon exports was considered. For a more detailed look, see Huang et al. [43]

3. Methodology

China and G7 countries are the world’s major carbon emitters, and they are also the world’s largest trade countries. Meanwhile, China is in the middle of the global industrial chain, and most of its export products are low-value-added and high-energy-intensity manufactured goods. In addition, after the financial crisis, China began to promote industrial upgrading and launched policies to control energy consumption and emissions. This study aims to contribute to these issues by exploring the following hypothesis: H1. There is a large scale of embodied carbon in the trade between China and G7 countries. H2. China might play a net exporter of embodied carbon. H3. China’s embodied carbon exports may grow nonlinear and might be restrained by industrial upgrading and technological progress. In order to test these hypotheses this paper constructs a multiregional input–output model to study the evolution trend of embodied carbon flow. Furthermore, this study adopts a structural decomposition model to investigate the driving factors for the carbon embodied variation in trade. The specific study flowchart is presented in Figure 1.

3.1. MRIO Model Construction

The embodied carbon export between two countries can be calculated by Equation (1). Where E C E C 1 C 2 ( t ) represents the amount of embodied carbon exported from country C 1 to country C 2 , the carbon intensity C I C 1 ( t ) is a 1 × m vector, which means the carbon emissions generated for each unit of product supplied by various sectors of the exporting country. B ¯ C 1 is the Leontief inverse matrix of the exporting country, i.e., the total demand of end-use change for the output of each sector. E X C 1 C 2 is a m × 1 vector of the quantity of goods to be exported.
E C E C 1 C 2 ( t ) = C I C 1 ( t ) B ¯ C 1 ( t ) E X C 1 C 2 ( t )
The carbon intensity C I C 1 ( t ) of each sector can be estimated according to Equation (2), where C E C 1 ( t ) represents the direct carbon emission of each sector in the exporting country. X C 1 ( t ) represents the total output of each sector in the exporting country.
C I C 1 ( t ) = C E C 1 ( t ) / X C 1 ( t )
The Leontief inverse matrix is a m × m matrix, which can be calculated according to Equation (3). The element b ¯ i j of the Leontief inverse matrix is named the Leontief inverse coefficient, which represents the sum of the direct and indirect consumption of the products of sector i for each unit of end-use provided by sector j . In Equation (3), a i j is the direct consumption coefficient of A C 1 , which represents the value of goods directly consumed by sector i for each unit of total output added by sector j in the production process. The direct consumption coefficient can be calculated according to Equation (4), where X j represents the total input of department j , and x i j represents the commodity quantity of department i directly consumed in the production process of department j .
B ¯ C 1 ( t ) = ( I A C 1 ) 1
a i j = x i j / X j
The quantity of export commodities can be expressed by export structure and total export, as shown in Equation (5). λ C 1 C 2 is the column vector composed of the proportion of different commodities exported from C 1 to C 2 . E X T C 1 C 2 is the total amount of exports from C 1 to C 2 .
E X C 1 C 2 ( t ) = λ C 1 C 2 ( t ) E X T C 1 C 2 ( t )
Based on the above, the calculation of embodied carbon export can be written in Equation (6). Since the carbon embodied in the import of one country equals the carbon embodied in other countries’ export, the specific calculation formula of the carbon embodied in the import is not listed this time.
E E C 1 C 2 ( t ) = C I C 1 ( t ) B ¯ C 1 ( t ) λ C 1 C 2 ( t ) E X T C 1 C 2 ( t )

3.2. SDA Model Construction

Based on the measurement of trade embodied carbon by IO, SDA is often further employed to analyze the driving factors of trade embodied carbon variation, which can support the formulation of trade policy. Four modes are usually adopted in the decomposition of SDA models. The first type is the decomposition with the retention of cross terms. The second type does not retain the cross terms, but allocates the cross terms to their respective variables. The third type is treated by the weighted average method during decomposition. The fourth is bipolar decomposition. Dietzenbacher and Los [44] point out that the bipolar decomposition method could obtain a better approximate solution.
In this paper, the bipolar decomposition method of the SDA model is used to analyze the structural decomposition of the embodied carbon emissions of trade between China and G7 countries to analyze the contribution degree of each factor to the change of embodied carbon emissions. Based on Equation (6), the decomposition result of embodied carbon can be expressed as Equation (7), in which t 0 represent the benchmark year and t is the decomposition year.
Δ E C C 1 C 2 ( t ) = Δ C I C 1 B ¯ C 1 ( t 0 ) λ C 1 C 2 ( t 0 ) E X T C 1 C 2 ( t 0 ) + C I C 1 ( t 0 ) Δ B ¯ C 1 λ C 1 C 2 ( t 0 ) E X T C 1 C 2 ( t 0 ) + C I C 1 ( t 0 ) B ¯ C 1 ( t 0 ) Δ λ C 1 C 2 E X T C 1 C 2 ( t 0 ) + C I C 1 ( t 0 ) B ¯ C 1 ( t 0 ) λ C 1 C 2 ( t 0 ) Δ E X T C 1 C 2
Taking the reporting period as the decomposition basis, the decomposition result can be organized as in Equation (8):
Δ E C C 1 C 2 ( t ) = Δ C I C 1 B ¯ C 1 ( t 1 ) λ C 1 C 2 ( t 1 ) E X T C 1 C 2 ( t 1 ) + C I C 1 ( t 1 ) Δ B ¯ C 1 λ C 1 C 2 ( t 1 ) E X T C 1 C 2 ( t 1 ) + C I C 1 ( t 1 ) B ¯ C 1 ( t 1 ) Δ λ C 1 C 2 E X T C 1 C 2 ( t 1 ) + C I C 1 ( t 1 ) B ¯ C 1 ( t 1 ) λ C 1 C 2 ( t 1 ) Δ E X T C 1 C 2
Combining Equations (7) and (8), the change of embodied carbon export can be decomposed into four factors, namely, Δ E E C 1 C 2 ( t ) = ( a ) + ( b ) + ( c ) + ( d ) . Among them, factor ( a ) reflects the impact of carbon intensity changes on the export of embodied carbon, which can also be interpreted in the improvement of domestic carbon emission efficiency. Factor ( b ) reflects the impact of the change of input structure and industrial structure. Factor ( c ) reflects the influence of the change of export structure, and factor ( d ) reflects the influence of the change of export scale. The calculation of each factor is shown in Equations (9)–(12).
( a ) = Δ C I C 1 B ¯ C 1 ( t 0 ) λ C 1 C 2 ( t 0 ) E X T C 1 C 2 ( t 0 ) / 2 + Δ C I C 1 B ¯ C 1 ( t 1 ) λ C 1 C 2 ( t 1 ) E X T C 1 C 2 ( t 1 ) / 2
( b ) = C I C 1 ( t 0 ) Δ B ¯ C 1 λ C 1 C 2 ( t 0 ) E X T C 1 C 2 ( t 0 ) / 2 + C I C 1 ( t 1 ) Δ B ¯ C 1 λ C 1 C 2 ( t 1 ) E X T C 1 C 2 ( t 1 ) / 2
( c ) = K C 1 ( t 0 ) B ¯ C 1 ( t 0 ) Δ λ C 1 C 2 E X T C 1 C 2 ( t 0 ) / 2 + K C 1 ( t 1 ) B ¯ C 1 ( t 1 ) Δ λ C 1 C 2 E X T C 1 C 2 ( t 1 ) / 2
( d ) = K C 1 ( t 0 ) B ¯ C 1 ( t 0 ) λ C 1 C 2 ( t 0 ) Δ E X T C 1 C 2 / 2 + K C 1 ( t 1 ) B ¯ C 1 ( t 1 ) λ C 1 C 2 ( t 1 ) Δ E X T C 1 C 2 / 2

3.3. Data

In this paper, the WIOD 2016 Release (WIOD 2016 Release: https://www.rug.nl/ggdc/valuechain/wiod/wiod-2016-release accessed on 2 April 2022) database is adopted as the based data to construct the MRIO model. The WIOD 2016 release database covering 44 countries and regions for the period 2000–2014. The data set contain 56 sectors according to the International Standard Industrial Classification revision [45]. The emission data source from the Environmental Accounts (Enviromental Accounts: https://joint-research-centre.ec.europa.eu/scientific-activities-z/economic-environmental-and-social-effects-globalisation_en accessed on 3 April 2022) consistent with WIOD [46]. To eliminate the impact of price factors, we flatten all the value data to the year 2000 based on the GDP deflator released by World Bank Open Data.

4. Results and Discussion

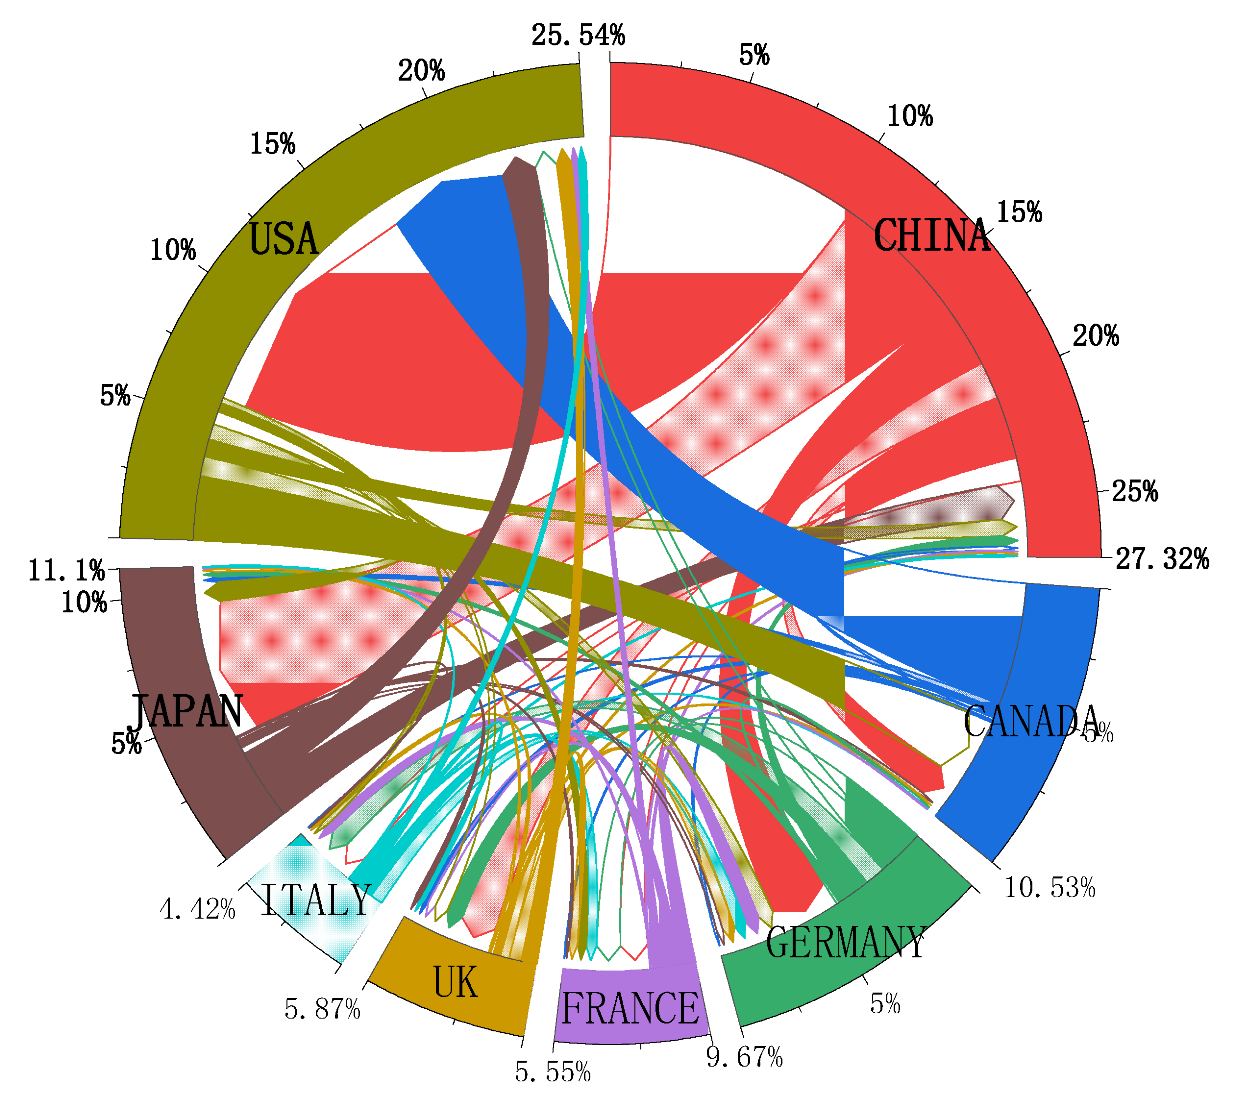
4.1. Embodied Carbon Flow Overview

The scale of embodied carbon flow among China and G7 from 2000 to 2014 is shown in Figure 2. The results verify our Hypothesis 1 which states that the embodied carbon in the trade between China and G7 countries is gargantuan. China accounts for 27.32% of the total embodied carbon flow in the eight countries on the studied interval. China is a net exporter of trade embodied carbon, which mainly flows to the US (5825.67 Mt), Japan (3170.36 Mt) and Germany (1409.93 Mt). The amount of embodied carbon that flowed to the other four countries was relatively small, from largest to smallest, UK (856.77 Mt), Canada (770.33 Mt), France (660.82 Mt) and Italy (542.60 Mt). This is consistent with our Hypothesis 2 that China is the embodied carbon outflow country for most countries, and most of it flows to the US. Small amounts of embodied carbon were imported from Japan (832.31 Mt), the US (394.44 Mt) and Germany (251.09 Mt). The US is the second-largest country in embodied carbon flows, accounting for 25.54% of the total trade embodied carbon flow in the eight countries, represent by trade embodied net carbon inflow. The US mainly absorbed the embodied carbon from China (5825.67 Mt), Canada (2816.12 Mt) and Japan (803.16 Mt), and exported a small amount to Canada (1468.72 Mt), Japan (461.91 Mt) and China (394.44 Mt).
Although G7 is generally at the consumption side of the value chain, there are many differences among G7 member countries, such as energy endowment, consumption habits, production technology, consumer behavior, climate differences, cultural differences, etc. This makes the situation of trade embodied carbon show different characteristics in each country [47]. Multilateral trade between China and G7 countries involves 64 pairs of trade relations, which is difficult to analyze one by one. Therefore, the remainder of this paper will focus on the analysis of the embodied carbon between China and the G7 countries. The embodied carbon relationship among G7 countries will be refined in the future work.

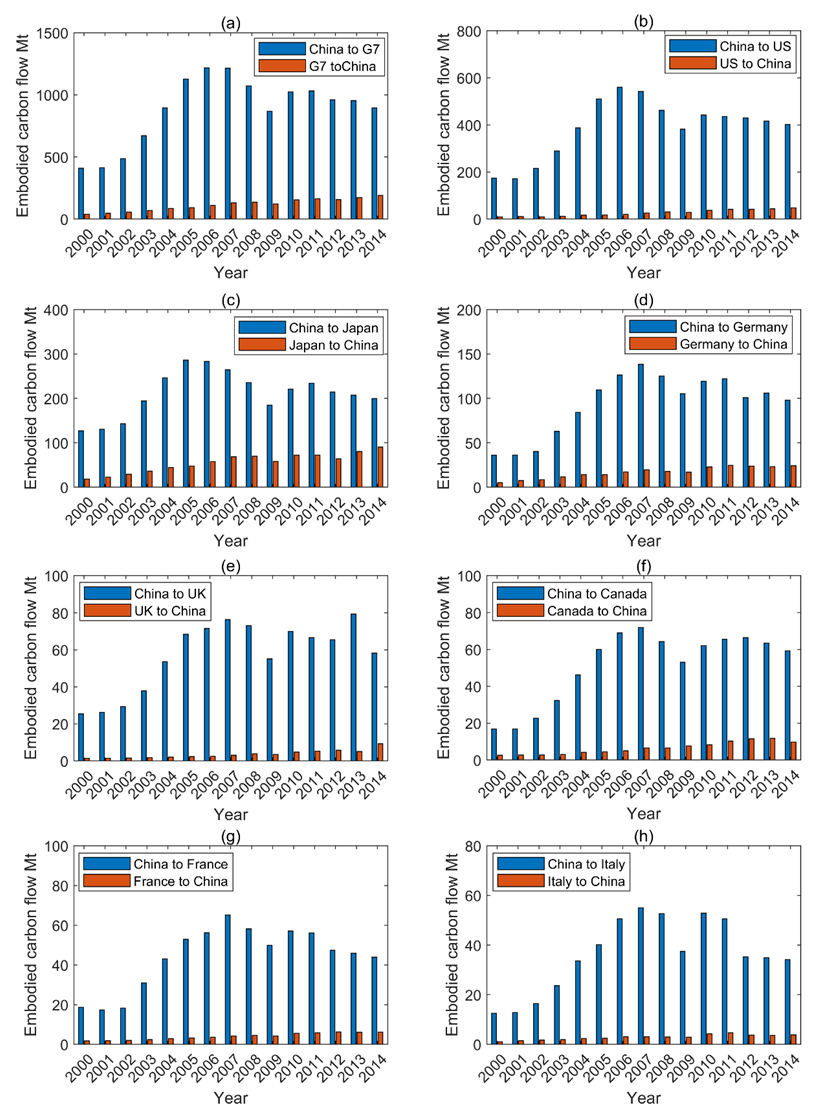
4.2. The Embodied Carbon Emissions from China to G7

According to the calculation results of MRIO model, the embodied carbon flow between China and G7 is shown in Figure 3. We analyze it according to the ranking of emissions scale.

4.2.1. Embodied Carbon between China and G7

Figure 3a takes G7 countries as a whole and provides the embodied carbon flow between China and G7. From 2000 to 2014, China’s embodied carbon exports to G7 showed a characteristic of double peak, and the second peak was lower than the first one. China’s embodied carbon exports to G7 are increased from 409.76 Mt in 2000 to 1216.88 Mt in 2006 which is mainly due to China’s accession to the WTO in 2002 and the export scale fast expand since then. It should be noted that before the outbreak of the global financial crisis in 2007, China’s export embodied carbon to G7 stopped growing, which is due to the decline of carbon intensity of Chinese products and the optimization of export structure, such as increasing the restrictions on the export of resource-dependent products. The outbreak of the subprime crisis has restrained the growth of international trade scale. China’s embodied carbon exports to G7 began to decline in 2008 and decreased to 867.86 Mt in 2009. With the gradual recovery of the global economy, the embodied carbon of China’s exports to G7 also rebounded. However, after 2011, due to the optimization of export structure and carbon intensity, although China’s export scale is expanding, the export embodied carbon shows a steady decline.
The reason why the embodied carbon export of G7 to China is far less than that of China to G7 is that the position of G7 is different from that of China in the global industrial chain. G7 countries are on the right side of the smile curve of the value chain, and their exports are mainly high-tech and high-value-added commodities. China is at the bottom of the value chain in the middle of the smile curve, and most of its products are mainly intermediate manufactured with high embodied carbon content. and the high value-added commodities exported by G7 to China account for a large proportion. On the other hand, there is a trade deficit between G7 and China. It should be noted that the overall trend of G7 towards China’s embodied carbon exports has been on the rise. Although the financial crisis causes the declined in embodied carbon exports from G7 to China in 2008–2009, it has started to pick up again since 2010. This is partly because of the growing scale of G7 exports to China, and G7 has been pushing hard on the real domestic economy since the 2008 financial crisis, encouraging a return of manufacturing.

4.2.2. Embodied Carbon between China and the US

China has the largest embodied carbon flow with the US in its trade with G7 (Figure 3a). Between 2000 and 2014, China’s embodied carbon exports to the US reached 5.83 billion tons, compared with 394.43 Mt for the US to China. One of the reasons for the embodied carbon emissions gap in China’s trade is that China has a large export surplus with the US. However, the trade surplus explanation alone is inadequate. For example, the value of Chinese exports to the US during the sample period was 2136.15 billion USD (All the trade amounts in the paper are adjusted by the year 2000 constant prices), while the value of American exports to China was 598.53 billion USD, the difference in the amount of value of goods is much smaller than the discrepancy in the amount of carbon embodied in trade. The deeper reason is that China and the US are in different positions in the global industrial chain. China’s exports to the US are dominated by textiles and industrial intermediate product goods with low-value-added and high energy intensity. High-value-added industrial products and services dominate the US exports to China, and the overall energy intensity of these products is low. In 2014, for example, the carbon intensity of China’s electrical and electronic equipment industry, the largest embodied carbon exporter to the US, was 1.58 tons/thousand USD, while the carbon intensity of the product produced in the US is only 0.20 tons/thousand USD.

4.2.3. Embodied Carbon between China and Japan

China and Japan are Asia’s largest developing and developed countries, respectively, and play a pivotal role in development in Asia and beyond [6]. China is also Japan’s largest trading partner. Between 2000 and 2014, China’s embodied carbon emissions to Japan were 3.17 billion tons, while Japan to China were 832.32 Mt. In the same period, China’s exports to Japan totaled 1145.61 billion USD, while Japan’s exports to China totaled 995.48 billion USD. As illustrated in Appendix A, the carbon intensity in China’s exports is much higher than that of Japan, which is due to the high carbon intensity of China’s domestic production and the different export structure between China and Japan. China’s embodied carbon exports to Japan are mainly concentrated in chemical products, basic metals, electrical equipment, machinery and equipment, which produce higher CO2 emission. Although Japan’s exports to China are also mainly manufactured products, the lower CO2 intensity industries account for a higher proportion.
It is worth noting that in China’s embodied carbon export to Japan there has been a drop since 2005 due to the decline of China’s export carbon intensity. Meanwhile, Japan’s embodied carbon exports to China are still on the rise. On the one hand, they are affected by the expansion of the trade scale. On the other hand, they are caused by the rapid growth of Japan’s exports to China’s metal products industry in recent years, which has a higher carbon intensity.

4.2.4. Embodied Carbon between China and Germany

Germany is China’s largest trading partner in Europe. China–Germany trade accounts for 30% of China–Europe trade and is equivalent to China’s total trade with the UK, France and Italy [27]. Between 2000 and 2014, China exported 1409.93 Mt of embodied carbon to Germany, while Germany exported 251.09 Mt of embodied carbon to China. Similar to the China–US trade and China–Japan trade, the embodied carbon exports from China to Germany rose from 2000 to 2007 and declined after 2007. Although Germany’s exports of embodied carbon to China are small, they are increasing year by year. China and Germany are both manufacturing countries. The difference is that the embodied carbon of China’s exports to Germany is mainly concentrated in equipment manufacturing industries such as metal products, electrical equipment, and mechanical equipment. In contrast, the embodied carbon of Germany’s exports to China mainly comes from automobiles and mechanical equipment.

4.2.5. Embodied Carbon between China and Other G7 Countries

The UK, Canada, France and Italy are trading on a smaller scale. From 2000 to 2014, the total amount of embodied carbon exported by China to these four countries was 856.78 Mt, 770.34 Mt, 660.82 Mt and 542.60 Mt, respectively, while the total amount of embodied carbon exported by the four countries to China was 53.8 Mt, 97.34 Mt, 60.3 Mt and 42.93 Mt, respectively. The industrial structure of these four countries has a similar characteristic, that is, the service industry dominates the domestic industry of these countries, and the proportion of their manufacturing industry is relatively low. As a result, China exports a lot of embodied carbon to these countries, mainly from manufacturing products. China imports less of the embodied carbon from these countries, and the tertiary industry accounts for a large proportion. The only particular case is Canada, which accounts for a large share of the embodied carbon in food production, mining, wood products, and paper products in the export structure.
In general, in bilateral trade between China and G7 members, the scale of China’s trade and the embodied carbon trade has been in a net export state. That is, China’s economic development has been achieved at the expense of resources and the environment. G7 members transfer the responsibility of CO2 emission reduction to China. Moreover, China’s exports of carbon intensity remained much higher than those of G7 members between 2000 and 2014, therefore, although China’s imports from G7 members have increased significantly, the growth of the embodied carbon in imports has been relatively slow. In addition, due to the enormous difference in carbon intensity between China and G7 members, China’s large-scale exports are not conducive to global CO2 emission reduction. With the improvement of China’s production technology and the emphasis on environmental protection, the decline in the embodied carbon intensity of China’s exports during the sample period has achieved remarkable results. After 2010, although the scale of China’s exports has been expanding, the carbon embodied in exports has gradually declined, which has alleviated the environmental pressure brought by China’s economic development.

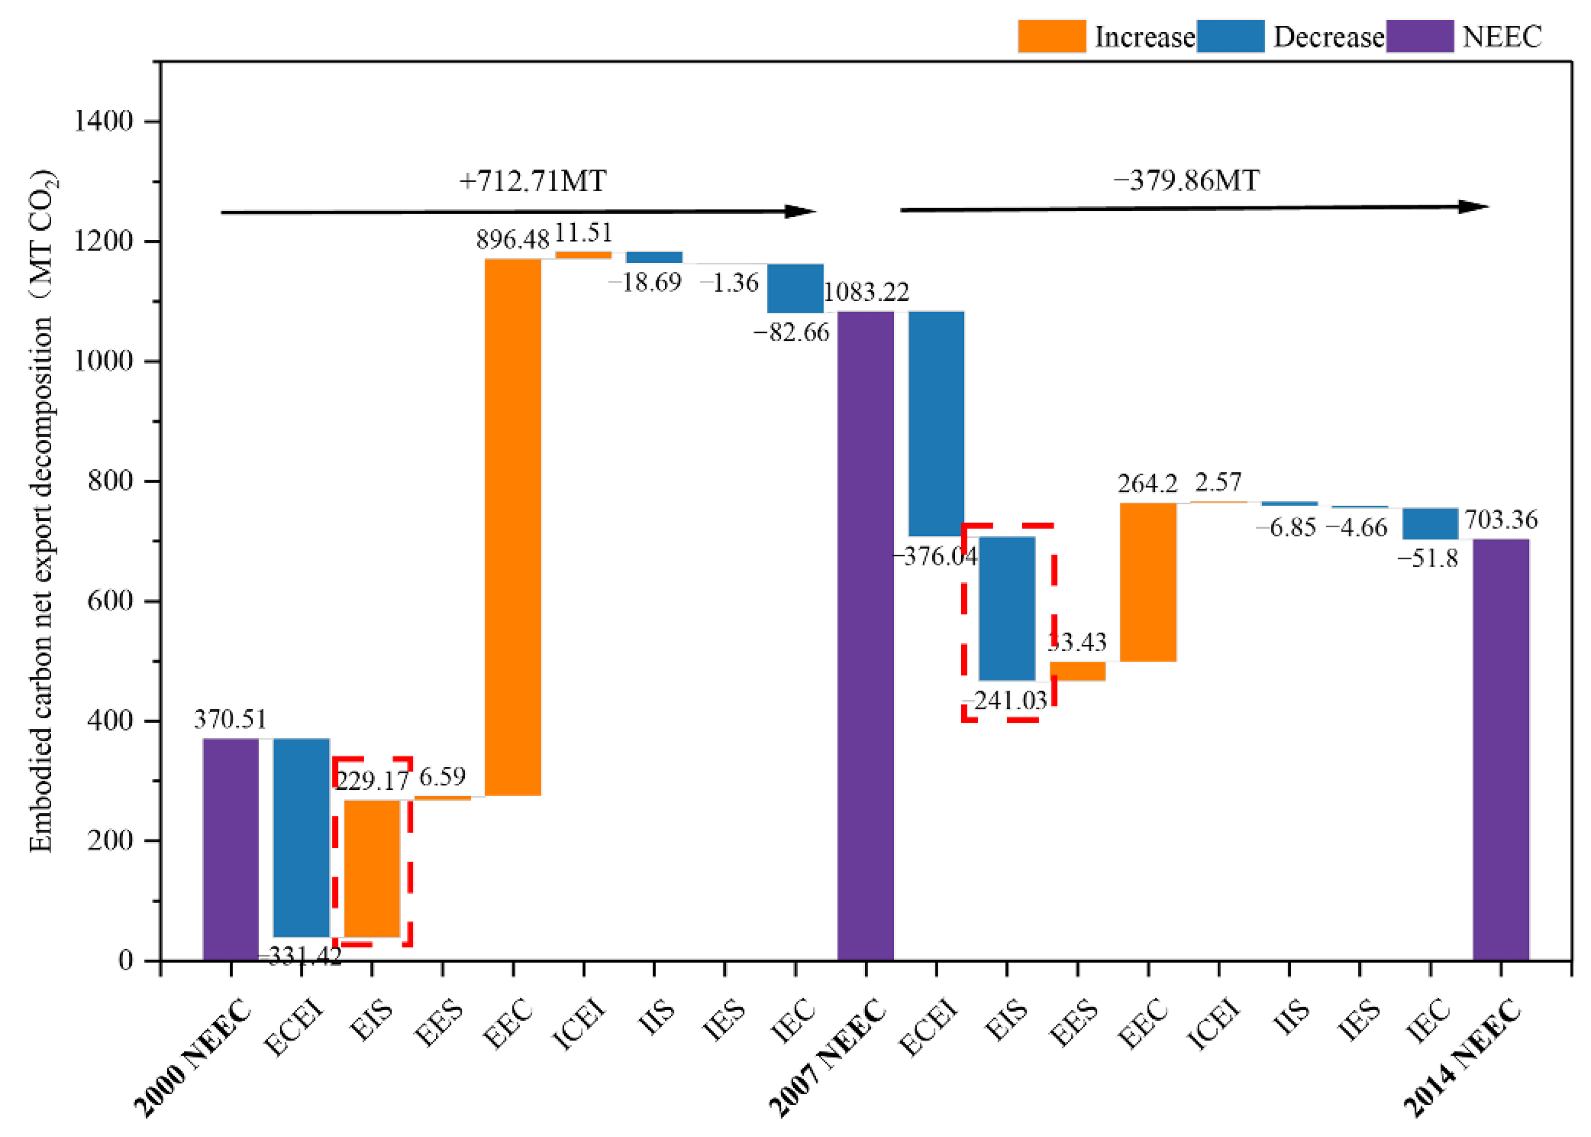
4.3. The SDA of China-G7 Trade Embodied Carbon Net Export

According to Section 4.2, China’s trade with G7 members has a difference in embodied carbon emissions with 2007 as the breakpoint. With the economic development, China’s net trade embodied carbon export first increased rapidly and then decreased slowly, showing an obvious “inverted U-shape”. The changing trend is similar to the Environmental Kuznets curve (EKC). With the improvement of economic development level, export embodied carbon has also been effectively restrained. In order to analyze this phenomenon, we use SDA to calculate the driving factors of the changes of China’s net export embodied carbon in the two ranges of 2000–2007 and 2007–2014. The results are illustrated in Figure 4. The main features are as follows:
Firstly, the decline in China’s domestic carbon intensity has played a crucial role in reducing trade embodied carbon exports, totaling 707.46 Mt between 2000 and 2014. The decline of China’s carbon intensity is mainly due to the decline of energy intensity and the improvement of energy structure. From 2000 to 2014, China’s energy consumption per unit of GDP at constant prices decreased by 21.9%, the proportion of natural gas in the primary energy structure increased by 3.4%, and the proportion of low-carbon power, such as water, nuclear, wind and photovoltaic, increased by 4.0%. As the cost of new energy technologies such as photovoltaics and wind power decline persistently, China can continue to reduce embodied carbon through energy structure transformation in the future.
Secondly, the impact of input structure is different before and after 2007. The input structure reflects the change of economic structure. From 2000 to 2007, China was in rapid industrialization, undertaking high energy-consuming industries in developed countries. The domestic industrial structure shifted to energy-intensive industries such as the heavy chemical industry, which has increased the proportion of high-carbon industries in China’s economic structure. After 2007, China began to enter the post-industrialization stage. The economic development model changed, as a result of which performance that the proportion of tertiary industry and high-end manufacturing industry in GDP increased, and the embodied carbon content of intermediate inputs continued to decline. This also brings inspiration for developing countries to accelerate industrialization and industrial upgrading to achieve clean development.
Thirdly, the increase of export scale is the main reason to promote China’s embodied carbon export. After China joined the WTO in 2001, it quickly integrated into the global industrial division, resulting in a significant increase in China’s export scale and export embodied carbon emissions. However, after 2007, with the slowdown of export growth, the impact of export scale growth is also weakening. It needs to be emphasized that this might not be a positive sign because the restraint of trade might distort resource allocation and cause welfare losses.
Finally, the expansion of G7 members’ exports to China has also reduced the embodied carbon of China’s net exports. Interestingly, the input structure and export structure of G7 members have a weak negative impact on China’s net export embodied carbon. There are two main reasons for this: on the one hand, G7 are industrialized countries and the space for industrial structure adjustment is limited; in addition, China’s position in the global industrial chain has changed, which has pushed up the proportion of G7 commodities with high carbon intensity in China’s exports.
The result of SDA proves Hypothesis 3 that China’s embodied carbon exports may grow in a nonlinear way and might be restrained by industrial upgrading and technological progress

5. Conclusions

China and G7 account for more than half of the world’s GDP and carbon emissions, and their carbon embodied in trade accounts for 30% of the total carbon emissions. It is essential to study the trend and driving factors of carbon embodied in trade between China and G7 members. This study constructs an MRIO and an SDA model to calculate the scale and driving factors of embodied carbon transfer in the two-way trade between China and the G7 from 2000 to 2014. The results show that:
(1) China plays the role of pollution paradise in trade with G7 countries. The embodied carbon outflow scale in the sample period accounts for 27.32% of all countries. By country, China’s embodied carbon exports are mainly concentrated in the USA (5825.67 Mt), Japan (3170.36 Mt) and Germany (1409.93 Mt), while imports are mainly from Japan (832.31 Mt) and the UK (394.44 Mt). The status of different countries in the global value chain determines this phenomenon. At the initial stage of industrialization, China undertook the industrial transfer of developed countries, and China exported a high proportion of energy intensive products. However, the carbon transfer trend of emerging economies between China and the G7 shows different characteristics. China’s embodied carbon exports to the G7 are large, showing an inverted U-shaped trend, and a turning point occurred in 2006. In contrast, the carbon content of G7 exports to China is small but continues to grow;
(2) The driving factors of embodied carbon export from China to G7 presents different features before and after the financial crisis. The expansion of export scale is the main driving force for China’s specific carbon export growth, contributing 896.48 Mt of implied carbon from 2000 to 2007. However, there was a significant slowdown after 2007, which was only 264.2 Mt. Meanwhile, the decline in direct carbon intensity during the production process continues to inhibit China’s embodied carbon exports (before 2007, it was 331.42 Mt, and since then, it has become −376.04 Mt). With China’s efforts to strengthen energy conservation and low-carbon transformation, this impact has continuously strengthened. From the perspective of imports, the decline in the export scale of importing countries is an important reason to restrain the scale of China’s embodied carbon net exports. During the sample period, it led to a 134.46 Mt decline in China’s embodied carbon net exports during the sample period;
(3) It is notable that the impact of China’s input structure has been reversed by the financial crisis. Before 2007, China was in the stage of rapid industrialization, and the increase in the proportion of energy-intensive products in the input structure push up the embodied carbon exports (+229.17 Mt). After 2007, China promoted the upgrading of economic structure, and the effect on implied carbon export was −241.03 Mt.
Based on the result of this study, some valuable policy implications can be proposed.
On the one hand, China’s carbon intensity is still higher than that of G7 countries, which is the main reason for the large scale of embodied carbon exports. In the future, China should continue to strengthen independent innovation of green and low-carbon technologies. We should promote the upgrading of domestic industrial system and the adjustment of product structure, and formulate policies to reduce carbon emissions from the global supply chain perspective [48]. At the same time, we should establish a perfect national carbon emission trading market as soon as possible. The carbon market should be used to force domestic energy structure optimization. In addition, the elimination of climate change requires enhanced international cooperation. As far as China is concerned, it should not only strengthen exchanges and consultations with developed countries, but also strengthen complementary trade with developing countries, and strengthen the breadth and depth of South–South cooperation through green investment and financing and green technology trade. It is also essential for developed countries to transfer low-carbon technologies to developing countries.
On the other hand, the final demand is the essence of embodied carbon transfer. Considering that international trade is a way to realize the effective allocation of resources on a global scale, it is impossible to reduce the implied carbon by reducing the scale of trade. However, the implicit carbon reduction can be realized through the transformation of import trade structure. In other words, in order to achieve the climate goal of carbon neutrality, it is not enough to rely only on low-carbon transformation in production, and the demand should also be adjusted. We should promote the transformation of global consumption structure to clean products and pay attention to the carbon footprint of products. Among all the products, we should attach great importance to the transformation of energy electrification and power regeneration.

Author Contributions

Conceptualization, W.W.; methodology, Y.H.; software, W.W.; validation, Y.H.; formal analysis, Y.H.; investigation, Y.H.; resources, W.W.; data curation, W.W.; writing—original draft preparation, Y.H.; writing—review and editing, Y.H.; visualization, Y.H.; supervision, W.W.; project administration, W.W.; funding acquisition, W.W. All authors have read and agreed to the published version of the manuscript.

Funding

This research was funded by [National Natural Science Foundation of China] grant number [72104206], [MOE (Ministry of Education in China) Project of Humanities and Social Sciences] grant number [20YJC790148], [Innovation Strategy Research Foundation of Fujian] grant number [2021R0006], [Fundamental Research Funds for the Central Universities] grant number [20720201019] and [National Energy Group] grant number [GJNY-21-143].

Institutional Review Board Statement

Not applicable.

Informed Consent Statement

Not applicable.

Data Availability Statement

In this study, the data were mainly obtained from World Input-Output Database, Environmental Accounts WIOD 2016 Release and World Bank Open Data.

Acknowledgments

The authors would like to thank the editor and the anonymous referees for their comments and suggestions which were most useful in revising the paper.

Conflicts of Interest

The authors declare no conflict of interest.

Appendix A

Table A1. Embodied carbon emissions of China, G7 and China–G7 (Mt, %).
YearChina’s Trade Embodied Carbon EmissionsG7’s Trade Embodied Carbon EmissionsChina–G7 Trade Embodied Carbon Emissions
ExportImportNet ExportRatioExportImportNet ImportRatioExportImportNet ExportRatio
2000845.62336.54509.0813.882139.513826.271686.7616.54409.7639.25370.5110.10
2001863.38387.98475.4012.262110.813726.381615.5715.86412.6847.92364.759.41
20021053.13475.82577.3113.772048.613734.651686.0416.82486.0655.87430.1910.26
20031443.96647.54796.4116.442056.114070.382014.2719.87671.5969.75601.8312.42
20041961.23813.281147.9620.572146.274524.302378.0323.42894.9386.54808.3814.49
20052443.22928.091515.1424.142222.394880.982658.5826.141127.8692.061035.7916.50
20062838.861133.601705.2624.602343.155203.792860.6428.501216.88110.471106.4115.96
20073022.791192.521830.2724.302517.385140.412623.0425.871213.87130.641083.2214.38
20082791.721342.841448.8818.862442.954949.942506.9925.611071.25135.52935.7312.18
20092273.001210.651062.3512.901879.143969.722090.5823.04867.86122.55745.329.05
20102759.291518.831240.4613.842156.914499.392342.4824.761024.46155.03869.439.70
20112929.761785.561144.1911.682273.084755.632482.5526.801031.31164.28867.038.85
20122827.251792.311034.9410.312232.444615.522383.0926.12959.54156.95802.588.00
20132858.621838.171020.449.682237.454453.062215.6024.00953.49173.77779.737.39
20142717.361768.76948.609.012305.454453.302147.8423.52894.95191.59703.366.68
Sum33629.1717172.4816456.69-33111.6566803.7133692.06-13236.471732.2011504.27-
Aver2241.941144.831097.1115.752207.444453.582246.1423.12882.43115.48766.9511.03
Table A2. Embodied carbon emissions in China–US, Japan, Germany (Mt, %).
YearEmbodied Carbon Emissions for China–USEmbodied Carbon Emissions for China–JapanEmbodied Carbon Emissions for China–Germany
ExportImportNet ExportExportImportNet ExportExportImportNet Export
2000173.588.84164.74126.7918.42108.3735.955.2330.71
2001172.4310.35162.08130.8722.82108.0436.187.3528.83
2002216.239.83206.40142.9329.37113.5740.178.6031.57
2003289.7612.41277.34194.1736.51157.6662.8411.6551.20
2004388.0316.69371.35246.1344.27201.8684.2114.1470.07
2005510.8917.82493.07285.8647.44238.42109.4914.2195.28
2006560.5121.09539.42282.9257.77225.15126.1717.32108.84
2007542.5625.57517.00264.3868.78195.60138.4219.55118.87
2008462.2730.25432.02235.5869.69165.89125.1817.65107.53
2009382.0729.26352.80184.9358.17126.76105.2916.9688.34
2010442.2437.31404.93220.8472.07148.77119.3722.7996.58
2011436.1541.40394.75234.1572.22161.93122.1124.6297.50
2012429.9541.92388.03214.1964.03150.16100.8323.6577.18
2013416.9243.58373.34207.1680.48126.67105.7923.0982.70
2014402.0748.11353.96199.4590.28109.1797.9324.2873.65
Sum5825.67394.445431.233170.36832.312338.041409.93251.091158.84
Aver388.3826.30362.08211.3655.49155.8794.0016.7477.26
Table A3. Embodied carbon emissions in China–UK, Canada, France, Italy trade (Mt).
YearEmbodied Carbon for China–UKEmbodied Carbon for China–CanadaEmbodied Carbon for China–FranceEmbodied Carbon for China–Italy
ExportImportNet ExportExportImportNet ExportExportImportNet ExportExportImportNet Export
200025.451.3424.1116.832.6014.2318.631.7616.8712.521.0511.47
200126.211.4224.7916.872.7514.1217.291.7915.5012.831.4411.39
200229.331.5627.7722.732.8219.9018.261.9916.2716.411.6914.72
200337.901.7536.1632.323.1129.2230.942.3928.5523.651.9521.70
200453.672.0951.5846.244.2042.0443.062.8340.2333.592.3331.26
200568.432.3866.0560.114.5155.6052.903.2549.6540.182.4537.73
200671.562.5469.0168.965.0663.9056.203.6552.5550.563.0347.52
200776.433.1073.3371.916.4865.4465.164.1461.0255.003.0351.98
200873.083.8369.2564.366.5657.8058.174.5753.6052.622.9749.65
200955.163.5351.6253.087.6145.4749.894.1545.7437.452.8634.59
201069.914.7965.1262.128.2153.9257.165.5951.5752.814.2848.52
201166.655.3261.3365.5610.3055.2656.065.7350.3350.624.6945.93
201265.465.8159.6566.4411.5854.8647.396.2441.1435.283.7331.56
201379.315.0774.2563.5511.8351.7245.856.0639.7934.923.6631.26
201458.239.2748.9659.269.7249.5343.866.1637.7034.163.7730.39
Sum856.7753.79802.98770.3397.33673.00660.8260.30600.52542.6042.93499.67
Aver57.123.5953.5351.366.4944.8744.054.0240.0336.172.8633.31
Table A4. China and G7 countries export carbon intensity (tons per thousand US dollars).
YearChinaUSJapanGermanyUKCanadaFranceItaly
20003.290.710.640.610.421.090.350.45
20013.070.650.720.570.430.930.340.42
20023.120.590.770.550.451.000.320.43
20033.430.650.730.520.481.000.300.40
20043.630.660.720.500.420.970.300.39
20053.700.630.730.500.430.970.320.41
20063.510.590.800.500.430.940.330.40
20073.170.640.900.450.420.960.310.35
20082.680.690.870.360.460.880.300.33
20092.500.620.810.340.480.980.320.32
20102.440.690.780.370.520.900.360.39
20112.330.710.800.350.500.880.370.38
20122.110.670.810.360.470.870.390.37
20132.000.641.050.340.360.880.350.33
20141.780.671.090.310.530.850.320.32
Aver2.850.650.820.440.450.940.330.38
Table A5. SDA of embodied carbon from China’s to G7.
Influencing FactorGrowth of Embodied Carbon Emissions (Mt)Contribution (%)
2000–20072008–20102000–20072008–2010
China–USCarbon intensity−146.51−163.85−39.87116.66
Input structure100.10−105.1827.2474.89
Export structure−4.0517.59−1.10−12.53
Export scale417.91110.99113.73−79.02
SUM367.45−140.45100100
China–JapanCarbon intensity−82.65−84.70−60.34130.20
Input structure61.61−51.0944.9878.54
Export structure9.874.347.21−6.67
Export scale148.1566.40108.15−102.07
SUM136.98−65.05100100
China–GermanyCarbon intensity−35.08−41.20−34.38101.36
Input structure22.35−29.5321.9072.66
Export structure−1.624.54−1.58−11.17
Export scale116.3825.55114.06−62.85
SUM102.04−40.65100100
China–UKCarbon intensity−19.88−26.74−39.15145.74
Input structure13.72−15.9127.0186.74
Export structure0.632.981.23−16.22
Export scale56.3321.33110.91−116.26
SUM50.78−18.35100100
China–CanadaCarbon intensity−17.80−24.60−32.44193.72
Input structure12.10−13.9222.04109.60
Export structure−1.493.71−2.71−29.24
Export scale62.0822.11113.11−174.08
SUM54.89−12.70100100
China–FranceCarbon intensity−16.16−19.17−34.8789.76
Input structure10.57−13.7822.8064.53
Export structure1.391.193.00−5.58
Export scale50.5610.40109.07−48.71
SUM46.36−21.35100100
China–ItalyCarbon intensity−13.33−15.78−31.5075.54
Input structure8.74−11.6220.6455.63
Export structure1.86−0.934.394.43
Export scale45.087.44106.47−35.60
SUM42.34−20.89100100
Table A6. SDA of embodied carbon emissions from G7 to China.
Influencing FactorGrowth of Embodied Carbon Emissions (Mt)Contribution (%)
2000–20072008–20102000–20072000–2007
US–ChinaCarbon intensity−2.82−1.62−16.95−7.20
Input structure1.04−2.936.21−13.04
Export structure1.055.736.3125.47
Export scale17.4121.32104.4394.76
SUM16.6722.50100.00100.00
Japan–ChinaCarbon intensity3.015.605.9826.23
Input structure13.8610.1327.5747.44
Export structure−2.40−0.40−4.77−1.88
Export scale35.826.0371.2228.22
SUM50.2921.36100100
Germany–ChinaCarbon intensity−7.52−4.73−52.69−100.72
Input structure2.96−1.4320.70−30.53
Export structure0.73−1.535.10−32.60
Export scale18.1112.40126.90263.85
SUM14.274.70100100
UK–ChinaCarbon intensity−0.66−0.71−37.48−11.53
Input structure0.170.349.405.53
Export structure0.461.8225.9229.44
Export scale1.804.74102.1576.57
SUM1.766.19100100
Canada–ChinaCarbon intensity−0.97−0.24−25.09−7.32
Input structure0.050.131.403.95
Export structure0.52−0.9013.54−27.61
Export scale4.264.25110.16130.99
SUM3.873.24100100
France–ChinaCarbon intensity−1.44−0.36−60.64−17.68
Input structure0.270.1711.458.57
Export structure0.850.1735.808.46
Export scale2.692.03113.39100.66
SUM2.372.01100100
Italy–ChinaCarbon intensity−1.11−0.51−56.13−69.18
Input structure0.340.4417.2359.42
Export structure0.15−0.247.68−32.22
Export scale2.581.05131.21141.98
SUM1.970.74100100

References

  1. BP (British Petroleum). BP Statistical Review of World Energy; BP: London, UK, 2021; Available online: https://www.bp.com/en/global/corporate/energy-economics/statistical-review-of-world-energy.html (accessed on 22 May 2022).
  2. Javanmard, M.E.; Ghaderi, S.F. A Hybrid Model with Applying Machine Learning Algorithms and Optimization Model to Forecast Greenhouse Gas Emissions with Energy Market Data. Sustain. Cities Soc. 2022, 82, 103886. [Google Scholar] [CrossRef]
  3. Jiang, S.; Chishti, M.Z.; Rjoub, H.; Rahim, S. Environmental R&D and trade-adjusted carbon emissions: Evaluating the role of international trade. Environ. Sci. Pollut. Res. 2022, Online ahead of print. [Google Scholar] [CrossRef]
  4. Peters, G.P.; Minx, J.C.; Weber, C.L.; Edenhofer, O. Growth in emission transfers via international trade from 1990 to 2008. Proc. Natl. Acad. Sci. USA 2011, 108, 8903–8908. [Google Scholar] [CrossRef] [PubMed] [Green Version]
  5. Kanemoto, K.; Moran, D.; Lenzen, M.; Geschke, A. International trade undermines national emission reduction targets: New evidence from air pollution. Glob. Environ. Chang. 2014, 24, 52–59. [Google Scholar] [CrossRef]
  6. Long, R.; Li, J.; Chen, H.; Zhang, L.; Li, Q. Embodied carbon dioxide flow in international trade: A comparative analysis based on China and Japan. J. Environ. Manag. 2018, 209, 371–381. [Google Scholar] [CrossRef]
  7. Wang, S.; Tang, Y.; Du, Z.; Song, M. Export trade, embodied carbon emissions, and environmental pollution: An empirical analysis of China’s high-and-new-technology industries. J. Environ. Manag. 2020, 276, 111371. [Google Scholar] [CrossRef]
  8. Churchill, S.A.; Inekwe, J.; Smyth, R.; Zhang, X. R&D intensity and carbon emissions in the G7: 1870–2014. Energy Econ. 2019, 80, 30–37. [Google Scholar] [CrossRef]
  9. Chaudhry, S.M.; Ahmed, R.; Shafiullah, M.; Duc Huynh, T.L. The impact of carbon emissions on country risk: Evidence from the G7 economies. J. Environ. Manag. 2020, 265, 110533. [Google Scholar] [CrossRef]
  10. Steen-Olsen, K.; Weinzettel, J.; Cranston, G.; Ercin, A.E.; Hertwich, E.G. Carbon, Land, and Water Footprint Accounts for the European Union: Consumption, Production, and Displacements through International Trade. Environ. Sci. Technol. 2012, 46, 10883–10891. [Google Scholar] [CrossRef]
  11. Wang, Q.; Yang, X. Imbalance of carbon embodied in South-South trade: Evidence from China-India trade. Sci. Total Environ. 2020, 707, 134473. [Google Scholar] [CrossRef]
  12. Lin, B.; Sun, C. Evaluating carbon dioxide emissions in international trade of China. Energy Policy 2010, 38, 613–621. [Google Scholar] [CrossRef]
  13. Chen, Z.M.; Chen, G.Q. Embodied carbon dioxide emission at supra-national scale: A coalition analysis for G7, BRIC, and the rest of the world. Energy Policy 2011, 39, 2899–2909. [Google Scholar] [CrossRef]
  14. Adedoyin, F.F.; Agboola, P.O.; Ozturk, I.; Bekun, F.V.; Agboola, M.O. Environmental consequences of economic complexities in the EU amidst a booming tourism industry: Accounting for the role of brexit and other crisis events. J. Clean. Prod. 2021, 305, 127117. [Google Scholar] [CrossRef]
  15. Wang, N.; Fu, X.; Wang, S. Economic growth, electricity consumption, and urbanization in China: A tri-variate investigation using panel data modeling from a regional disparity perspective. J. Clean. Prod. 2021, 318, 128529. [Google Scholar] [CrossRef]
  16. Wu, X.D.; Guo, J.L.; Li, C.; Chen, G.Q.; Ji, X. Carbon emissions embodied in the global supply chain: Intermediate and final trade imbalances. Sci. Total Environ. 2020, 707, 134670. [Google Scholar] [CrossRef]
  17. Xu, Y.; Dietzenbacher, E. A structural decomposition analysis of the emissions embodied in trade. Ecol. Econ. 2014, 101, 10–20. [Google Scholar] [CrossRef]
  18. Deng, G.; Xu, Y. Accounting and structure decomposition analysis of embodied carbon trade: A global perspective. Energy 2017, 137, 140–151. [Google Scholar] [CrossRef]
  19. Chen, B.; Li, J.S.; Wu, X.F.; Han, M.Y.; Zeng, L.; Li, Z.; Chen, G.Q. Global energy flows embodied in international trade: A combination of environmentally extended input-output analysis and complex network analysis. Appl. Energy 2018, 210, 98–107. [Google Scholar] [CrossRef]
  20. Yu, H.; Wang, L. Carbon emission transfer by international trade: Taking the case of Sino—US merchandise trade as an example. J. Resour. Ecol. 2010, 1, 155–163. [Google Scholar] [CrossRef]
  21. Xu, M.; Allenby, B.; Chen, W. Energy and air emissions embodied in China-US trade: Eastbound assessment using adjusted bilateral trade data. Environ. Sci. Technol. 2009, 43, 3378–3384. [Google Scholar] [CrossRef]
  22. Du, H.; Guo, J.; Mao, G.; Smith, A.M.; Wang, X.; Wang, Y. CO2 emissions embodied in China–US trade: Input–output analysis based on the emergy/dollar ratio. Energy Policy 2011, 39, 5980–5987. [Google Scholar] [CrossRef]
  23. Wang, Q.; Han, X. Is decoupling embodied carbon emissions from economic output in Sino-US trade possible? Technol. Forecast. Soc. Chang. 2021, 169, 120805. [Google Scholar] [CrossRef]
  24. Dong, Y.; Ishikawa, M.; Liu, X.; Wang, C. An analysis of the driving forces of CO2 emissions embodied in Japan–China trade. Energy Policy 2010, 38, 6784–6792. [Google Scholar] [CrossRef]
  25. Li, Y.; Hewitt, C.N. The effect of trade between China and the UK on national and global carbon dioxide emissions. Energy Policy 2008, 36, 1907–1914. [Google Scholar] [CrossRef]
  26. Andreoni, V.; Duriavig, M. The responsibility of CO2 embodied in Italy? China trade: A consumption-based approach. Int. J. Sustain. Econ. 2011, 3, 44–62. [Google Scholar] [CrossRef]
  27. Wang, Q.; Liu, Y.; Wang, H. Determinants of net carbon emissions embodied in Sino-German trade. J. Clean. Prod. 2019, 235, 1216–1231. [Google Scholar] [CrossRef]
  28. Peters, G.P.; Hertwich, E.G. CO2 embodied in international trade with implications for global climate policy. Environ. Sci. Technol. 2008, 42, 1401–1407. [Google Scholar] [CrossRef] [Green Version]
  29. Sato, M. Embodied carbon in trade: A survey of the empirical literature. J. Econ. Surv. 2014, 28, 831–861. [Google Scholar] [CrossRef]
  30. Suh, S.; Lenzen, M.; Treloar, G.J.; Hondo, H.; Horvath, A.; Huppes, G.; Jolliet, O.; Klann, U.; Krewitt, W.; Moriguchi, Y. System boundary selection in life-cycle inventories using hybrid approaches. Environ. Sci. Technol. 2004, 38, 657–664. [Google Scholar] [CrossRef]
  31. Leontief, W.W. Quantitative input and output relations in the economic systems of the United States. Rev. Econ. Stat. 1936, 18, 105–125. [Google Scholar] [CrossRef] [Green Version]
  32. Yunfeng, Y.; Laike, Y. China’s foreign trade and climate change: A case study of CO2 emissions. Energy Policy 2010, 38, 350–356. [Google Scholar] [CrossRef]
  33. Zhao, H.; Chen, H.; He, L. Embodied Carbon Emissions and Regional Transfer Characteristics—Evidence from China. Sustainability 2022, 14, 1969. [Google Scholar] [CrossRef]
  34. Wiedmann, T. A review of recent multi-region input–output models used for consumption-based emission and resource accounting. Ecol. Econ. 2009, 69, 211–222. [Google Scholar] [CrossRef]
  35. Jiang, L.; He, S.; Tian, X.; Zhang, B.; Zhou, H. Energy use embodied in international trade of 39 countries: Spatial transfer patterns and driving factors. Energy 2020, 195, 116988. [Google Scholar] [CrossRef]
  36. Yang, W.; Gao, H.; Yang, Y. Analysis of Influencing Factors of Embodied Carbon in China’s Export Trade in the Background of “Carbon Peak” and “Carbon Neutrality”. Sustainability 2022, 14, 3308. [Google Scholar] [CrossRef]
  37. Hoekstra, R.; van den Bergh, J.C.J.M. Comparing structural decomposition analysis and index. Energy Econ. 2003, 25, 39–64. [Google Scholar] [CrossRef]
  38. Su, B.; Thomson, E. China’s carbon emissions embodied in (normal and processing) exports and their driving forces, 2006–2012. Energy Econ. 2016, 59, 414–422. [Google Scholar] [CrossRef]
  39. Zhao, Y.; Ma, L.; Li, Z.; Ni, W. A Calculation and Decomposition Method Embedding Sectoral Energy Structure for Embodied Carbon: A Case Study of China’s 28 Sectors. Sustainability 2022, 14, 2593. [Google Scholar] [CrossRef]
  40. Liu, X.; Ishikawa, M.; Wang, C.; Dong, Y.; Liu, W. Analyses of CO2 emissions embodied in Japan–China trade. Energy Policy 2010, 38, 1510–1518. [Google Scholar] [CrossRef] [Green Version]
  41. Zhao, Y.; Wang, S.; Zhang, Z.; Liu, Y.; Ahmad, A. Driving factors of carbon emissions embodied in China–US trade: A structural decomposition analysis. J. Clean. Prod. 2016, 131, 678–689. [Google Scholar] [CrossRef]
  42. Duarte, R.; Pinilla, V.; Serrano, A. Factors driving embodied carbon in international trade: A multiregional input–output gravity model. Econ. Syst. Res. 2018, 30, 545–566. [Google Scholar] [CrossRef]
  43. Huang, L.; Kelly, S.; Lv, K.; Giurco, D. A systematic review of empirical methods for modelling sectoral carbon emissions in China. J. Clean. Prod. 2019, 215, 1382–1401. [Google Scholar] [CrossRef]
  44. Dietzenbacher, E.; Los, B. Structural decomposition techniques: Sense and sensitivity. Econ. Syst. Res. 1998, 10, 307–324. [Google Scholar] [CrossRef]
  45. Timmer, M.P.; Dietzenbacher, E.; Los, B.; Stehrer, R.; de Vries, G.J. An Illustrated User Guide to the World Input–Output Database: The Case of Global Automotive Production. Rev. Int. Econ. 2015, 23, 575–605. [Google Scholar] [CrossRef]
  46. Corsatea, T.D.; Lindner, S.; Arto, I.; Román, M.V.; Rueda-Cantuche, J.M.; Velázquez Afonso, A.; Amores, A.F.; Neuwahl, F. World Input-Output Database Environmental Accounts. Update 2000–2016; Publications Office of the European Union: Luxembourg, 2019; ISBN 978-92-79-64439-9. [Google Scholar] [CrossRef]
  47. Peters, G.P. Carbon footprints and embodied carbon at multiple scales. Curr. Opin. Environ. Sustain. 2010, 2, 245–250. [Google Scholar] [CrossRef]
  48. Jiang, M. Locating the Principal Sectors for Carbon Emission Reduction on the Global Supply Chains by the Methods of Complex Network and Susceptible–Infective Model. Sustainability 2022, 14, 2821. [Google Scholar] [CrossRef]
Figure 1. The flowchart of model design.
Sustainability 14 07478 g001
Figure 2. Export transfer of embodied carbon emissions between China and G7 from 2000 to 2014.
Sustainability 14 07478 g002
Figure 3. Embodied carbon flow between China and G7 from 2000 to 2014: (a) Embodied carbon between China and G7; (b) Embodied carbon between China and US; (c) Embodied carbon between China and Japan; (d) Embodied carbon between China and Germany; (e) Embodied carbon between China and UK; (f) Embodied carbon between China and Canada; (g) Embodied carbon between China and France; (h) Embodied carbon between China and Italy.
Sustainability 14 07478 g003
Figure 4. SDA for the trade embodied carbon. Note: NEEC is net export embodied carbon; ECEI, EIS, EES and EEC are carbon intensity, input structure, export structure and export scale of exporting country, respectively; ICEI, IIS, IES and IEC are the carbon intensity, input structure, export structure and export scale of the importing country, respectively.
Sustainability 14 07478 g004
Table 1. Research on embodied carbon emissions.
MethodAuthorObjectDataContent
MRIOChen and Chen [13]Global
(2004)
GTAPThe world was divided into three supranational alliances (G7, BRIC and Row) to study the carbon trade imbalance.
MRIOLong et al. [6]China and Japan (2000–2014)WIODThe MRIO model was used to analyze the implied carbon of China and Japan in 2000 and 2014, and the rest of the world was used as a control group.
MRIOWu et al. [16]Global
(2012)
EORAThe transfer of carbon emissions and related trade imbalances in the global supply chain were examined.
BTIO + IDADong et al. [24]China and Japan (1990–2000)JETROThe driving factors were divided into three parts: trade scale, trade structure and trade carbon intensity.
MRIO + SDAZhao et al. [41]China and the USA
(1995–2009)
WIODThe driving factors were divided into 7 groups (14 in total): energy emission coefficient, energy use structure, energy intensity, trade structure of intermediate products, production technology, export share of final products, and total demand.
MRIO + SDAWang et al. [27]China and Germany
(1995–2009)
WIODThe driving factors were divided into 5 groups (10 in total): carbon emission coefficient, intermediate input structure, final demand country structure, final demand product structure and final demand scale.
MRIO + Gravity modelDuarte et al. [42]Global
(1995–2009)
WIODThe driving factors were investigated using the gravity model.
Publisher’s Note: MDPI stays neutral with regard to jurisdictional claims in published maps and institutional affiliations.

