Article

Influence of Rice Husk Biochar and Lime in Reducing Phosphorus Application Rate in Acid Soil: A Field Trial with Maize

by
Mehnaz Mosharrof
1,2,
Md. Kamal Uddin
1,*,
Shamim Mia
3,
Muhammad Firdaus Sulaiman
1,
Shordar M. Shamsuzzaman
4 and
Ahmad Numery Ashfaqul Haque
1
1
Department of Land Management, Faculty of Agriculture, Universiti Putra Malaysia, Serdang 43400, Malaysia
2
Soil Resource Development Institute (SRDI), Krishi Khamar Sharak, Dhaka 1215, Bangladesh
3
Department of Agronomy, Patuakhali Science and Technology University, Patuakhali 8602, Bangladesh
4
Divisional Laboratory, Soil Resource Development Institute (SRDI), Krishi Khamar Sharak, Dhaka 1215, Bangladesh
*
Author to whom correspondence should be addressed.
Sustainability 2022, 14(12), 7418; https://doi.org/10.3390/su14127418
Submission received: 2 December 2021 / Revised: 23 January 2022 / Accepted: 25 January 2022 / Published: 17 June 2022
(This article belongs to the Special Issue Soil Fertility and Plant Nutrition for Sustainability)

Abstract

:
Biochar has been suggested for application in acidic soils for increasing agricultural productivity, as it may result in the benefits of sustainable carbon offset into soils and of increasing soil fertility improvement. However, the role of biochar in enhancing nutrient bioavailability and plant performance is manifested through the complex interactions of biochar-soil-plant. Moreover, it is not yet known how a crop-residue-derived biochar would perform in acidic soil when applied with a reduced rate of lime and phosphorus. Here, we examined the performance of maize with different combinations of biochar, lime, and phosphorus (P) application rates under field conditions. Specifically, rice husk biochar (10 t ha−1) was applied with 75% of the required lime and three rates of phosphorus fertilizer (100%, 75%, and 50%). The results showed that incorporation of biochar and lime, irrespective of the rates of P application, significantly increased soil nutrient (nitrogen and P) availability, while aluminum (Al) and iron (Fe) concentrations in soil were reduced. Furthermore, when biochar was combined with a lower amount of lime (75% of the recommended amount) and half of the required P, maize production increased by 62.38% compared to the control. Similarly, nutrient uptake in plants increased significantly in the same treatment (e.g., P uptake increased by 231.88%). However, soil respiration (CO2 emission) increased with lime only and the combined application of lime with biochar compared to the control; these treatments resulted in a higher carbon loss, as CO2 from the soil (84.94% and 67.50% from only lime treatment (T2), and rice husk biochar (RHB) and lime with 50% triple superphosphate (TSP) (T5), respectively). Overall, our findings imply that biochar application may sustain productivity in acid soils even when lime and P fertilizer applications are made at a reduced rate.

1. Introduction

Maize is one of the multipurpose crops used as food for humans, fodder for animals, and raw materials for industries throughout the world [1]. In tropical and subtropical zones, maize cultivation is largely hampered by acidic soil, since high rainfall occurs in this region [2]. Soil acidification can be both natural and anthropogenic, through changes in land use and application of chemical fertilizers [3]. While the extent of acidified soil is quite large, estimated at 30% of the global land area and 50% of arable lands, its coverage may increase in the future. Therefore, soil acidification can be one of the major limitations responsible for poor soil fertility and agriculture productivity, consequently reducing crop yield and profitability [4]. When soil pH is below the crop critical limits, it can affect plant performance in multiple ways. There are several ways, such as (a) changing the nutrient dynamics in soil, including P and base cation deficiency, (b) increasing the toxicity of Al, Fe, and Mn, and (c) enhancing soil compaction [2]. As a result, soils with high acidity are poor and infertile, and plant development suffers. Specifically, root development is severely affected by Al and Fe toxicity and deficiency of P and other elements when the soil pH becomes less than 5.5 [5]. Therefore, the remediation of acid soils is of prime importance for ensuring food security.
The most effective farming technique to alleviate soil acidity is liming [4]. However, the correction of soil acidity through liming can often create other problems, including accelerated loss of soil nitrogen (N) through nitrification and soil carbon [6]. Moreover, over-liming or liming for a long period can cause leaching loss of nutrient elements from the soil surface, while re-acidification may occur when the effect of the lime levels off [7,8]. Therefore, as an alternative to liming, organic amendments, including biochar, have been suggested [9].
Biochar is a carbonaceous, organic substance. It is made by pyrolyzing biomass [10,11] and used for sequestering carbon and reducing emissions of greenhouse gas from the soil. Biochar, which is produced at a higher temperature during pyrolysis, contains more base cations and thus has a higher pH due to the concentration of original biomass. At the same time, feedstock also determines liming effects, since the mineral content in the original biomass varies (i.e., manure-based biomass contains more minerals than lignin/cellulose-rich biomass) [11,12]. Thus, biochar has a greater capacity to neutralize soil acidity, although these effects may be short-lived [13]. Another important element of buffering soil acidity is neutralizing protons by their functional groups (carboxylic and phenolic). However, this effect may be minimal for freshly prepared biochars, since fresh biochars may have fewer carboxylic and phenolic groups, and their dissociation is pH-dependent [14,15]. Previously, many researchers reported the consequence of applying biochar on soil fertility, nutrient-poor soil, agricultural output [16,17,18], carbon sink [19], and the availability of nutrients [20,21]. Biochar could minimize the toxicity of Al. The reduction of Al concentration can even be larger when biochar with greater CEC is applied, provided functional groups are dissociated [22]. Additionally, biochar can prevent nutrient loss through leaching and make it available to plants [23,24], promoting plant development in a range of soils [25]. This suggests that, in acidic soil, the application of biochar could help to increase soil pH, mitigating the toxicity of Al through the mechanisms discussed above. The effects of biochar with the lime application could be further enhanced, since the acidic functional groups in biochar could be dissociated with liming. These dissociated functional groups could retain cations [14]. However, the soil pH could radically increase in the rhizosphere just after biochar application, leading to nitrification and volatilization of N [12]. Moreover, previous researchers also reported that lime application in acid soil increases soil pH while enhancing soil CO2 emission [26,27]. For large-scale field biochar applications, the rates of biochar and lime application need to be determined.
Phosphorus fixation is another limiting factor that constrains crop growth in acidic soils [28]. Zhang et al. [29] stated that around 30% of the world’s arable cropland is influenced by phosphorus deficiency due to its smaller availability in the soil. There are two principal mechanisms for bringing the fixed phosphate to the soil solutions. First, a rise in soil pH may reduce the positive surfaces of soil through the neutralization of proton binding sites on the mineral surface. Second, intensification of the competitive interactions between fixed phosphate and other competing soil components (e.g., organic matter, negatively charged nutrients, etc.) may also bring fixed phosphate to the soil solution [30,31]. Biochar application could help both of the processes and thus promote P bioavailability and plant P uptake.
Previously, studies have been conducted to evaluate the biochar-mediated effects on soil acidity and plant performance [32,33]. These studies reported significant effects of biochar and lime on maize productivity [34]. However, these studies were conducted in pots with a small amount of soil and only a few plants. Since the interactions of biochar and lime with soils in field conditions can be quite different than pot culture due to the interactions of biochars and plants with a large volume of soil, changes in nutrient inputs and outputs, and environmental conditions, it is important to examine the combined application of biochar under field conditions. Therefore, the study aimed to examine the performance of maize after the application of biochar with lime and with variable rates of P fertilizer. Moreover, we also present data on changes in soil property and the emission of CO2.

2. Materials and Methods

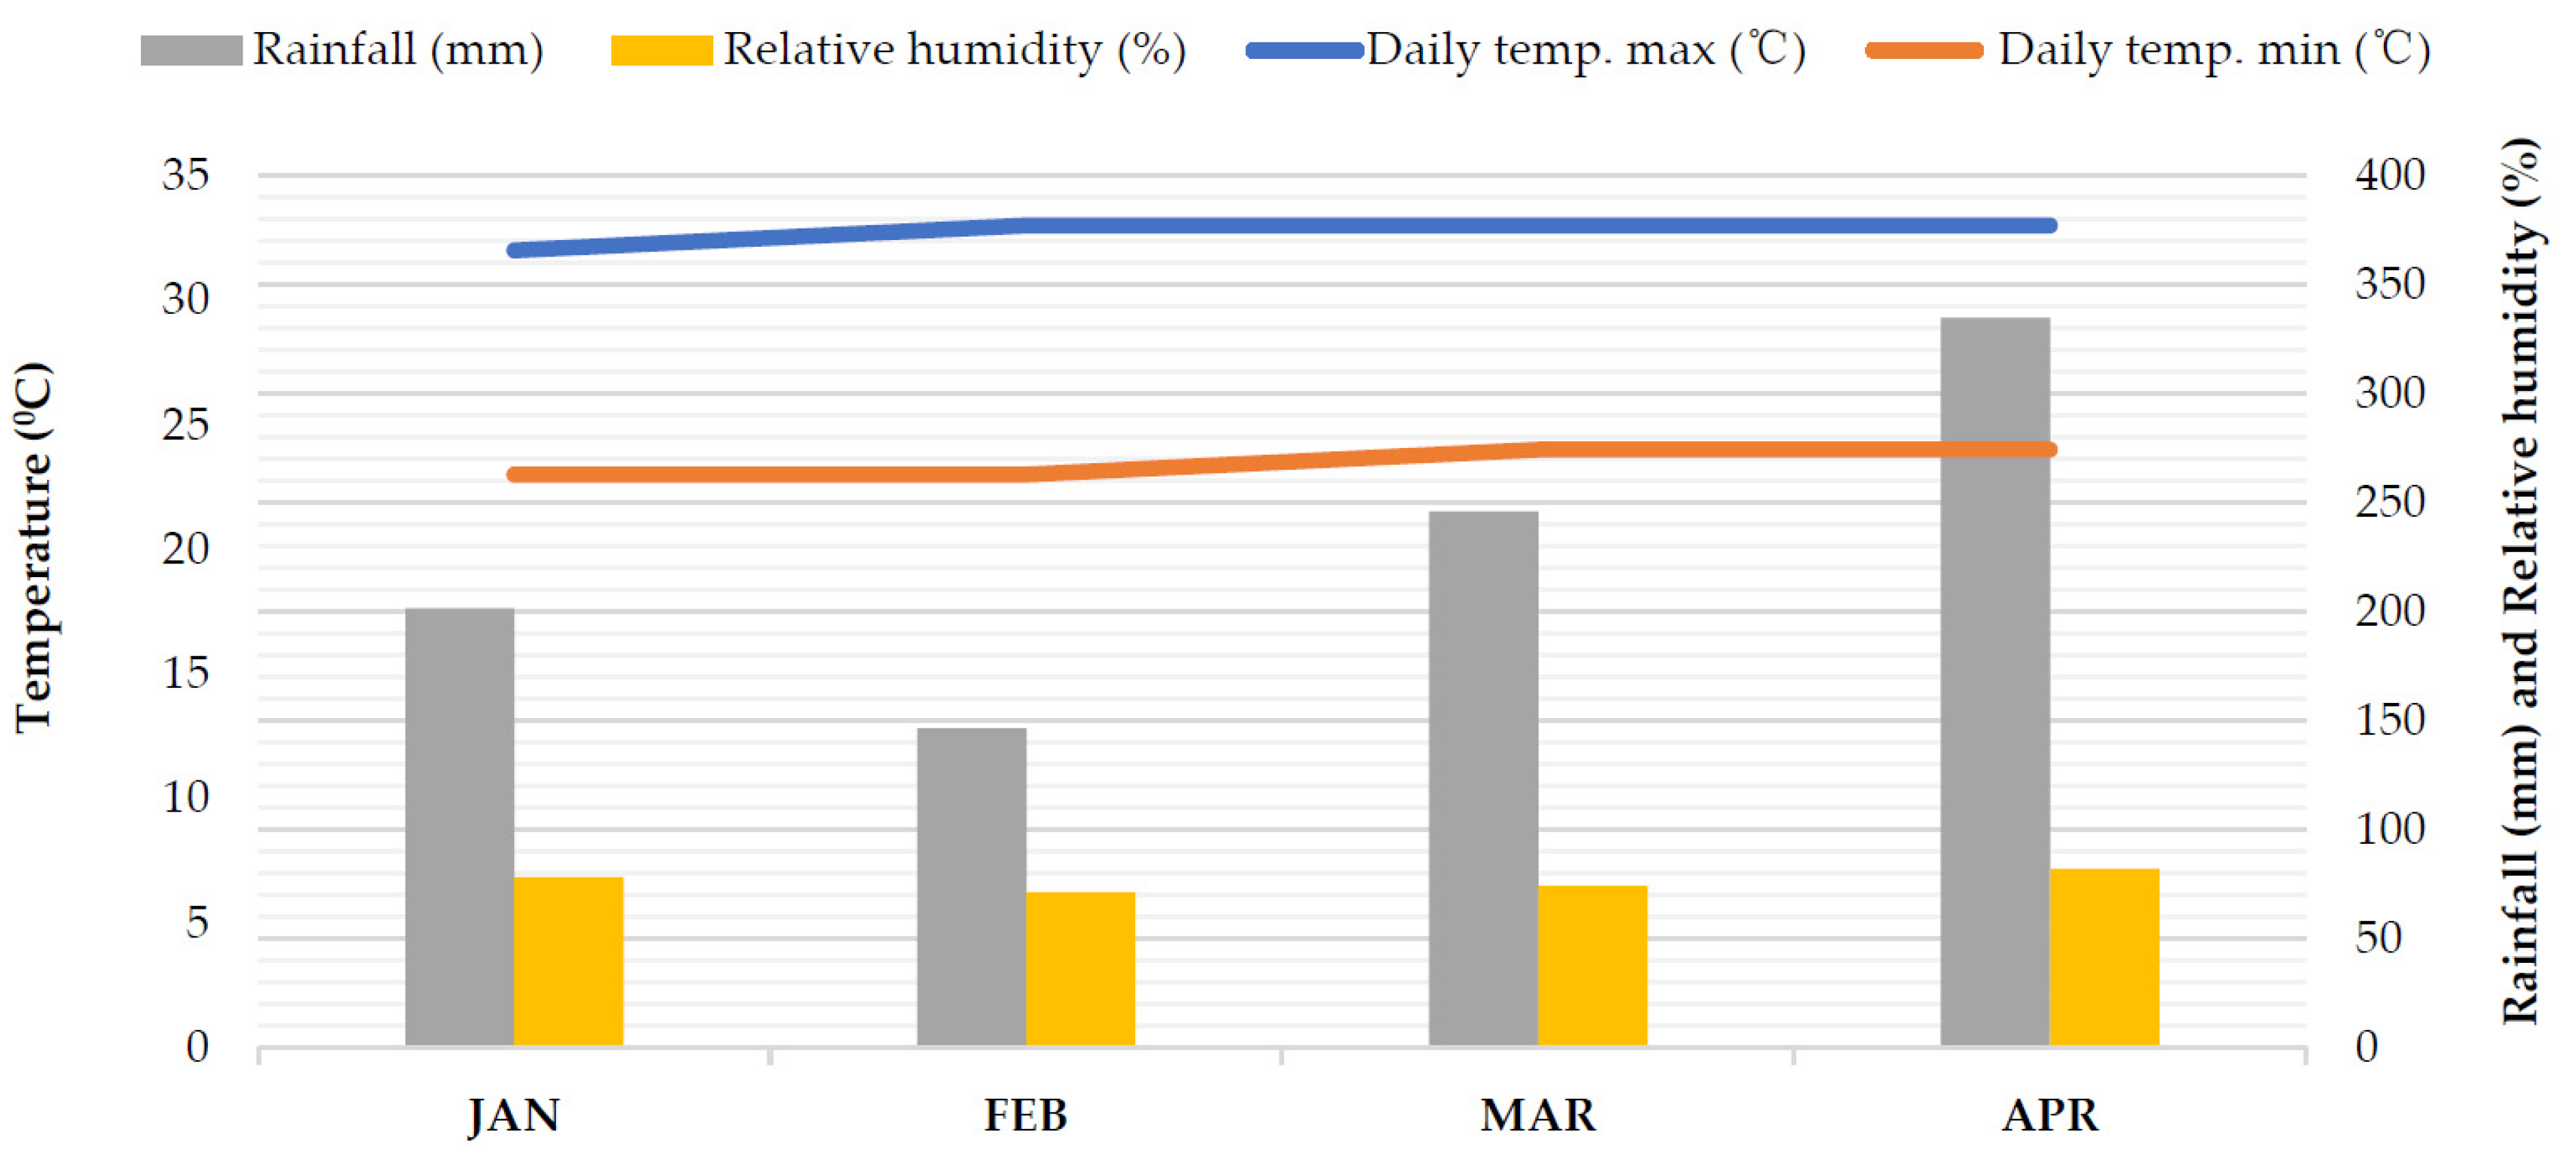
2.1. Experimental Site

The research was performed at Universiti Putra Malaysia, Serdang, Selangor, from January 2021 to April 2021. The study location was 2°98′57.5″ N latitude and 101°73′56.7″ E longitude. According to the United States Department of Agriculture (USDA) soil classification system, the research site’s soil was designated as a sandy clay texture (sand 50%, silt 14%, and clay 36%), and soil particle-size distribution was examined by the hydrometer technique [35]. It was fine, kaolinitic, isohyperthermic, typic Paleudult, Order: Ultisol, and belongs to the Bungor Series. The climate is tropical, hot, and humid in the region. The average temperature for the experimental time was 28 °C, the monthly average rainfall was 241.42 mm, and the relative humidity was 78% (Figure 1).

2.2. Soil Properties

The initial and final soil samples were collected before applying the treatments and after harvesting, respectively, and then air-dried at room temperature. Then, they were crushed and sieved to less than 2 mm, prior to chemical characterization.
Soil pH was recorded using a glass electrode pH meter in a 1:2.5 (weight/volume basis) soil: distilled water proportion [36]. A LECO TrueSpec CNS auto analyzer was utilized to measure soil’s total carbon, nitrogen, and sulfur content through the dry combustion method, using air-dried and ground soil. The exchangeable cations K, Ca, and Mg were extracted using a 1:5, soil: ammonium acetate (NH4OAc) buffered solution at pH 7 [37], and their concentrations were evaluated using inductively coupled plasma optical emission spectroscopy (PerkinElmer, Inc., Waltham, MA, USA). Soil exchangeable Al was subsequently extracted using 1 M KCl [38], and ICP-OES was used for analyzing the extract. An atomic absorption spectrometer (AAS) was used to determine the concentrations of Fe and Mn in the soil sample, which was extracted using Mehlich No. 1 double acid [39]. Available P was analyzed by the Bray and Kurtz II method [40]. The collected soil sample had a moisture content of 25.71% (by mass), a soil pH of 4.56, total carbon (TC) of 1.05%, total nitrogen (TN) of 0.08%, exchangeable K, Ca, Mg, and Al of 0.34, 0.97, 0.41, and 2.63 cmolc kg−1, respectively, available P of 3.68 mg kg−1, extractable Fe of 128.45 mg kg−1, and extractable Mn of 2.71 mg kg−1.

2.3. Characteristics of Rice Husk Biochar (RHB)

In this trial, the rice husk biochar was collected from Sendi Enterprise (Sungai Burong, Selangor, Malaysia), which was pyrolyzed from rice husk at 300 °C. First, the RHB pH was determined using a 1:2.5 ratio of air-dried biochar sample to distilled water [41]. Next, biochar’s total C and total N content were measured by a TrueMac CNS analyzer, biochar’s CEC, base cations were determined using 1 M NH4OAc buffered solution at pH 7 [39], and the K, Ca, and Mg extraction was analyzed using AAS. Next, biochar’s total P content was determined by the dry ash method, followed by ICP-OES [42]. Finally, the dry combustion technique was used to determine the ash content of RHB. The collected RHB had an ash content of 32.40%, with a pH of 8.15, CEC of 48.12 cmolc kg−1, total carbon and nitrogen of 24.86% and 1.13%, respectively, exchangeable K, Ca, and Mg of 17.45 cmolc kg−1, 19.46 cmolc kg−1, and 13.96 cmolc kg−1, respectively, total P of 3098.40 mg kg−1, and extractable Fe and Mn of 43.06 mg kg−1 and 23.51 mg kg−1, respectively.

2.4. Experimental Layout and Treatment

The experiment was conducted in a randomized complete block design with four replications. The detailed treatments were as follows:
T1 = Control (Recommended rate of NPK).
T2 = 100% dolomitic limestone + Recommended rate of NPK.
T3 = 75% dolomitic limestone + 10 t ha−1 rice husk biochar + 100% Triple superphosphate + Recommended rate of NK.
T4 = 75% dolomitic limestone + 10 t ha−1 rice husk biochar + 75% Triple superphosphate + Recommended rate of NK.
T5 = 75% dolomitic limestone + 10 t ha−1 rice husk biochar + 50% Triple superphosphate + Recommended rate of NK.
The chemical fertilizers were applied in all treatments by following the recommendation rate of Pedram [43]. Urea, triple superphosphate (TSP), and muriate of potash (MoP) were used at 140 kg ha−1 N, 100 kg ha−1 P2O5, and 120 kg ha−1 K2O, respectively. Based on the recommendation rate, urea, TSP, and MoP were scaled and applied at 304.35 g, 217.39 g, and 200.00 g per plot. Further, the amount of P fertilizer was lowered to 75% (163.04 g) and 50% (108.70 g) and applied to the respective treatment combination. On the day before sowing, the entire dose of P and potassium (K) based chemical fertilizer was administered as a baseline dose in all treatments. The N fertilizer was applied in two equal portions at 10 and 28 days after planting to prevent nutrient loss through volatilization and leaching. Biochar at the amount of 10 kg (10 t ha−1) and dolomitic limestone at 1.70 kg and 1.28 kg (1.28 t ha−1) were applied on plots. The lime rates corresponded to 100 and 75% of the dose established by the lime requirement test [44].

2.5. Agronomic Practice

After ploughing to a depth of 30 cm, the cultivated area was rotovated. The total area was 200 m2 (40 m × 5 m), with four replicates, and each sub-plot was 10 m2 (4 m × 2.5 m). The RHB and dolomitic limestone were applied once into the soil, mixed thoroughly, and moistened with water to 60% of the maximum water holding capacity before 14 days of the maize seeds sowing. The maize variety of F1 hybrid sweet corn (Zea mays L.) seeds were soaked with water for 10 to 12 h before sowing for good germination. After two weeks of biochar and lime treatment, on 3 February 2021, two seeds were manually sown in holes at 25 cm plant-to-plant and 75 cm row-to-row distance, and then all the holes were filled with loose soil. Later, the plant was thinned to one after one week of planting. Pre-emergence herbicide Adol (metolachor, 960 g/L), and post-emergence herbicide, Kenbast (glufosinate-ammonium), were applied manually for weed control. Pegasus (diafenthiuron, 250 g/L) was used as an insecticide to protect plants from insects. Water supply to plants was maintained by a sprinkler irrigation system when necessary.

2.6. Plant Analysis

On 18 April 2021, maize was harvested and sampled for nutrient analysis. Five plants were taken from the center row of every plot. The plant was cut above the soil surface, partly placed in an envelope, and dried in the oven for 72 h at 60 °C [45]. The elements of the grain were extracted using the single dry ashing process [42]. An AAS was used to determine the concentration of P, K, Ca, and Mg. Total N was analyzed by the TrueMac CNS analyzer. After the determination of nutrient concentration, the value of grain uptake was found using the following calculation [46]:
Grain   uptake   ( kg   ha 1 ) = Nutrient   Concentration   ( % )   ×   Grain   Yield   ( kg   ha 1 ) 100
A portable chlorophyll meter (SPAD-502 Konica Minolta, Inc., Tokyo, Japan) was utilized to measure the leaf chlorophyll content. The average of five SPAD measurements from completely expanded leaves was calculated for each plant [47]. The maize plant’s third fully expanded leaf was carefully chosen to measure photosynthetic rate, stomatal conductance, and transpiration rate by LICOR LI-6400XT Portable Photosynthesis System (Li-Cor, Inc., Lincoln, NE, USA). Two plants per plot were used for measurement in the morning. The readings were taken automatically by the device. At harvest, dried biomass (g), cob length (cm), number of grains per cob, and other yield components were also measured.

2.7. Determination of Protein Content

The protein content was determined from the percent N determined in the grain [48].
Protein   content   ( % )   =   N   content   ( % )   ×   6.25

2.8. Soil CO2 Gas Measurement

Soil CO2 emission was analyzed with a portable LI-8100 automated soil CO2 flux system (LI-COR Biosciences, Lincoln, NE, USA), started on 21 January 2021 as day 1, and it continued on days 2, 3, 4, 5, 6, 8, 10, 15, 20, 25, 30, 35, 40, 45, 50, 55, 60, 65, 70, and 75. To avoid the disturbance to the soil surface, the chamber of the instrument device was placed on the polyvinyl chloride (PVC) cylinder, which had a height of 11.5 cm and a diameter of 20 cm, and was inserted 7 to 8 cm into the soil one day before the first measurement and left throughout the whole experiment. In each plot, there were three PVC collars installed. To minimize gas leakage, the soil along the outer side of the PVC collars was compacted thoroughly. The measurement of soil CO2 flux was monitored from 9:00 a.m. to 11:00 a.m. [49]. Cumulative soil CO2 emission was calculated by linear interpolation [50].

2.9. Statistical Analysis

The data were assessed by SAS 9.4 software (SAS Institute Inc., Cary, NC, USA), and the statistical difference between the treatments was verified using analysis of variance. In addition, Tukey’s Honestly Significant Difference (HSD) test was performed to separate the treatment means at a 5% level of confidence. To better understand the interactions and implications of various factors in maize productivity, principal component analysis (PCA) was used.

3. Results

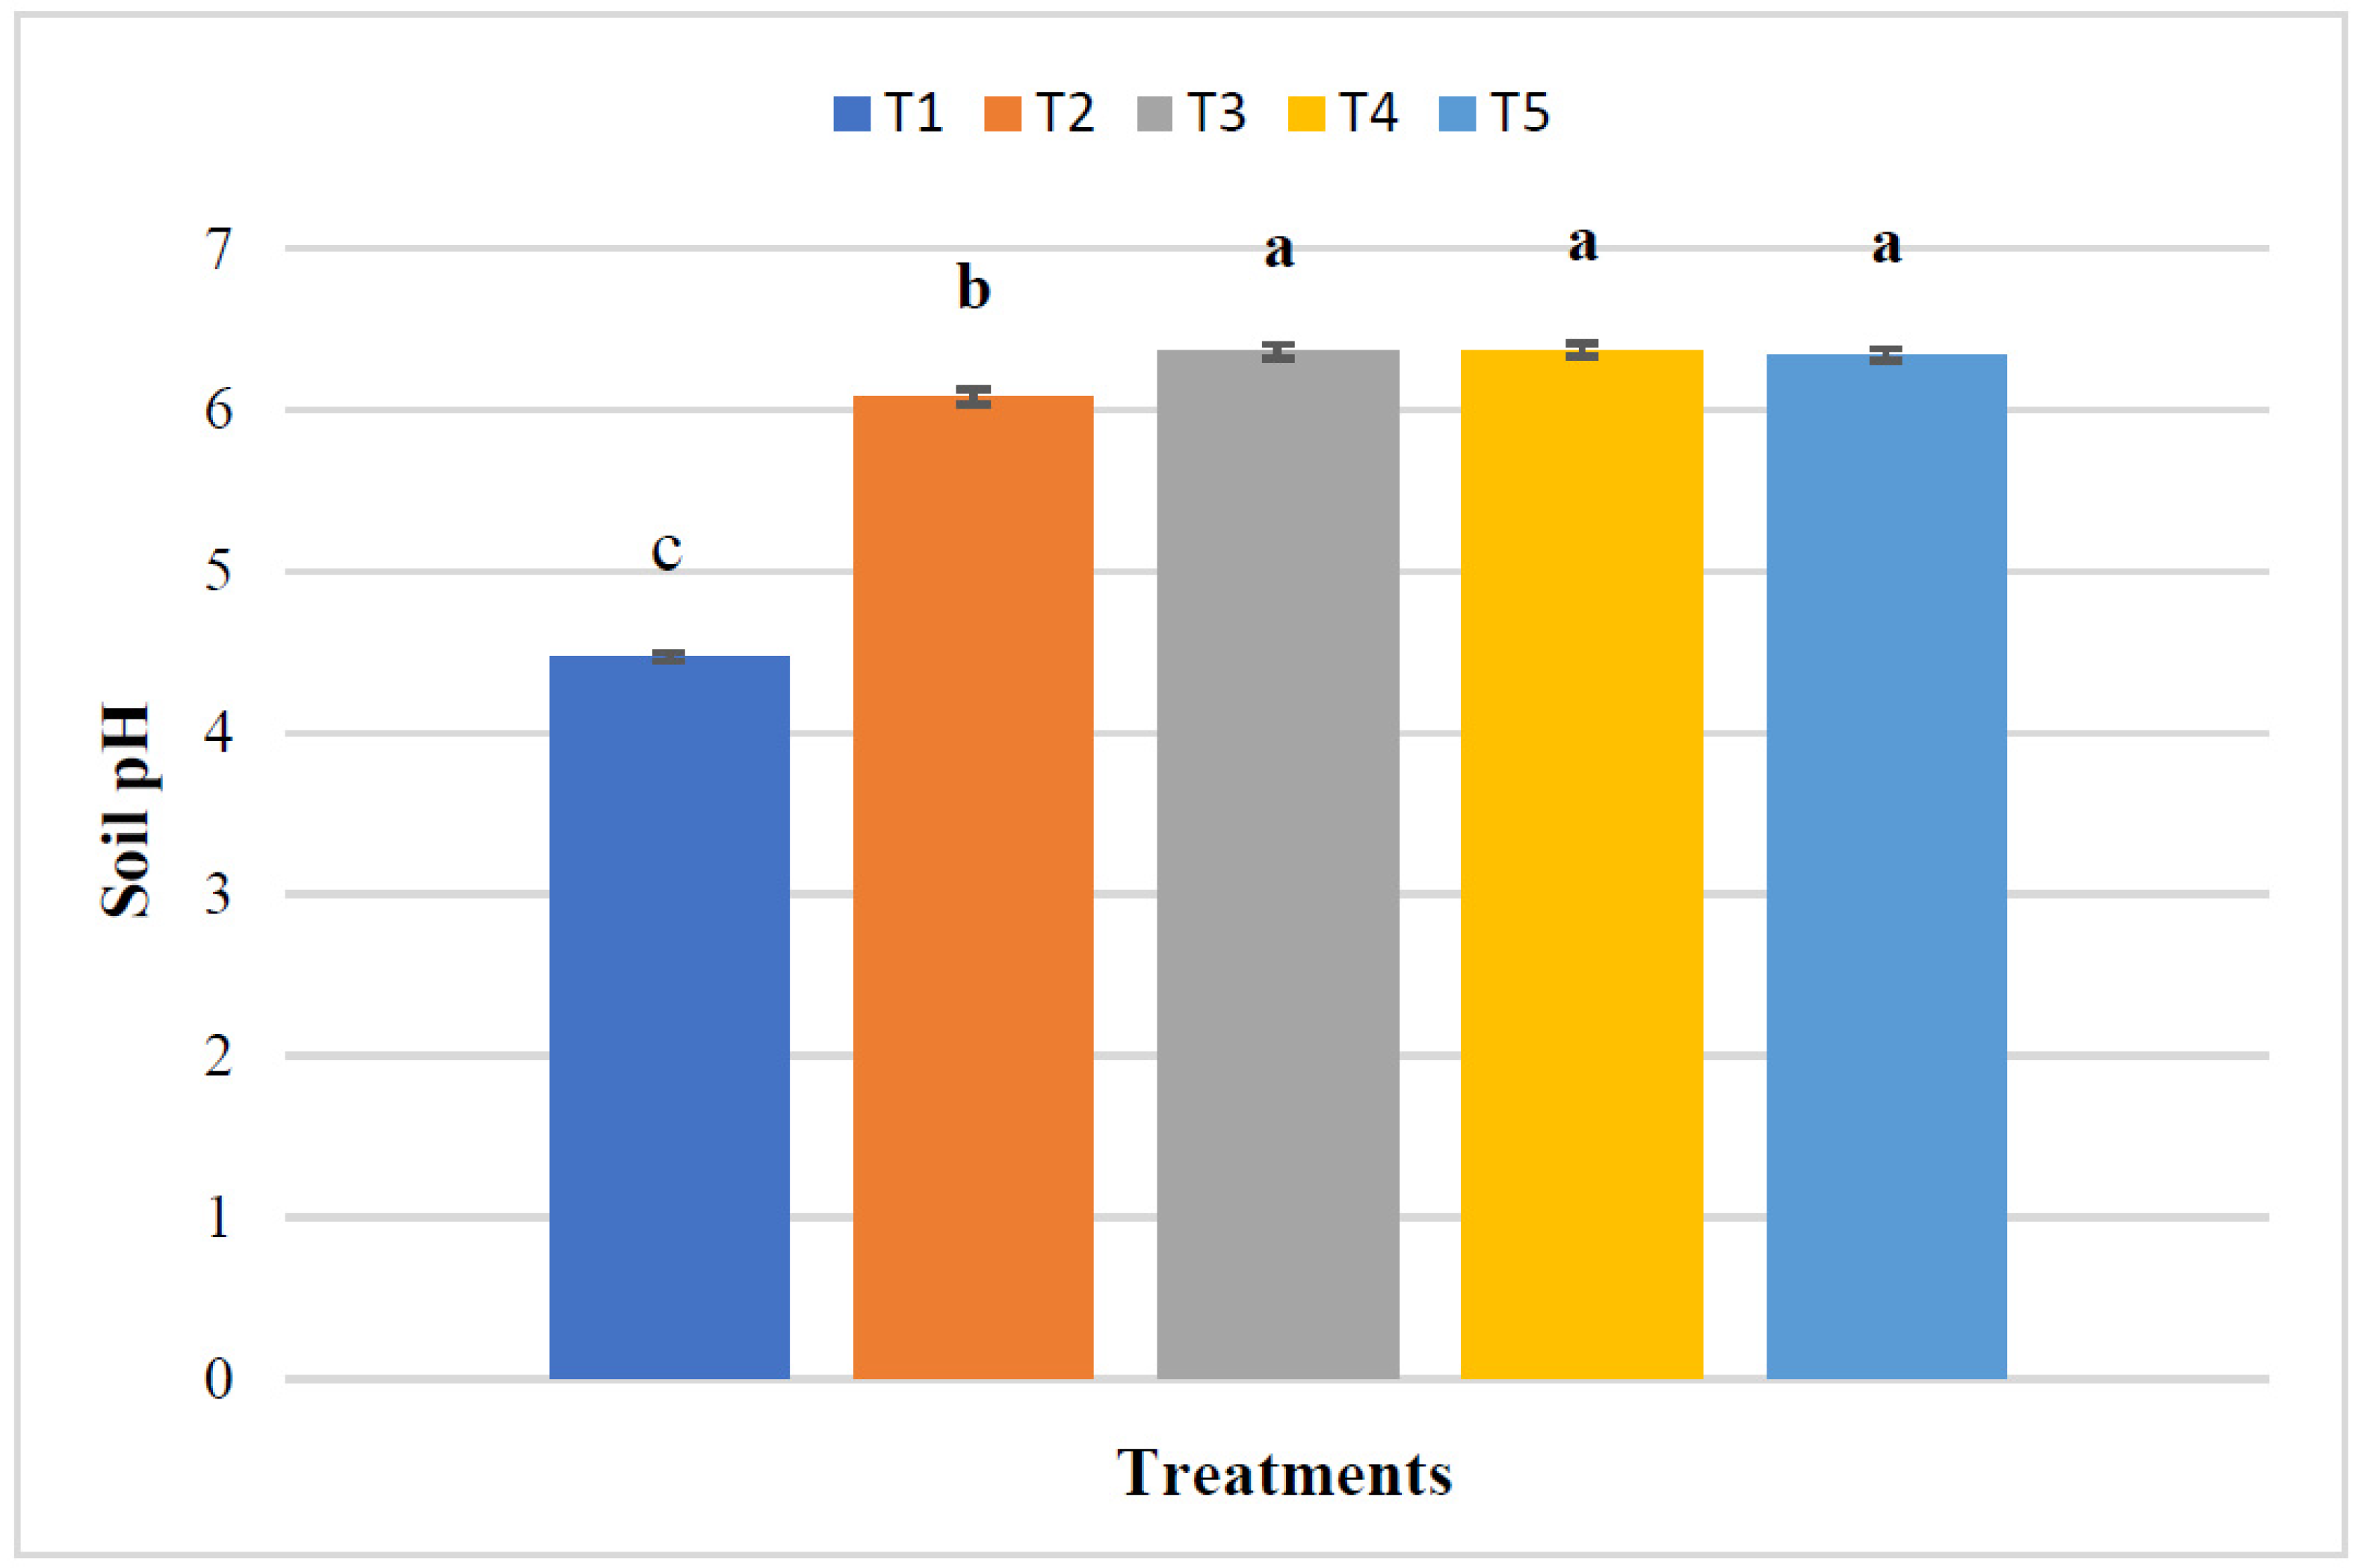
3.1. Effect of RHB, Lime, and Varying Doses of Phosphorus on Soil Properties at Harvest

The pH of the post-harvest soil varied significantly for various treatments (Figure 2). The maximum soil pH (6.37) was noted from T4. The pH was increased by 1.90 units in this treatment compared to the control treatment. However, soil pH was similar in T3, T4, and T5 treatments.
Soil available phosphorus was significantly increased by adding RHB, dolomitic limestone, and varying rates of TSP compared to the control treatment (Table 1). However, the available soil P was statistically similar in the T3, T4, and T5 treatments, although it was increased 291.53% in the T5 compared to the control.
At harvest, the highest soil exchangeable K (1.32 cmolc kg−1) was observed in T4, estimated at a 428% increase compared to the control. The highest soil exchangeable Ca (3.32 cmolc kg−1) was exhibited in T3, and T4. The values were greater by 257% compared to the control treatment. However, in both cases, there were no significant differences among T3, T4, and T5.
The RHB, lime, and varying rates of P fertilizer significantly decreased the exchangeable Al. In comparison to the control (T1), there were statistical changes in T3, T4, and T5; however, there were no significant differences among T3, T4, and T5. By applying treatments, the lowest soil exchangeable Al, 0.07 cmolc kg−1, was determined in T4. At harvest, the minimum Fe (71.50 mg kg−1) was recorded in T5, which was 71.19% lower than the control. The maximal Mn concentration (4.84 mg kg−1) was found in T3 and T5, although T3, T4, and T5 had no significant differences.

3.2. Effect of RHB, Lime, and Varying Doses of Phosphorus on the Growth and Yield Components of Maize

The plant height, stem diameter, and dry biomass of maize were enhanced significantly by various treatments (Table 2). A longer but statistically similar plant was observed in T3, T4, and T5 (up to 233.85 cm), while the shortest plant was observed in T1 (190.30 cm). The maximum stem diameter and dry biomass were noted in T4 (2.81 cm and 93.79 g, respectively), while the control treatment provided the lowest value.
There were significant increments in cob length, fresh cob weight, No. of grains per cob, and yield of maize in T3, T4, and T5 compared to T1 and T2 (Table 2). The highest cob length (24.88 cm), fresh cob weight (360.13 g), and the No. of grains per cob (644) were obtained from T3. The greater and identical cob yield produced by T3, T4, and T5 (up to 19.21 t ha−1) was 62.38% higher than control, i.e., T1 (11.83 t ha−1).

3.3. Effect of RHB, Lime, and Varying Doses of Phosphorus on Concentration and Nutrient Uptake by Maize

The RHB, dolomitic limestone, and TSP fertilizer application had a significant increase in concentration and nutrient uptake by maize (Table 3 and Table 4). The maximal nitrogen concentration (0.45%), uptake (86.06 kg ha−1), and protein content (2.83%) of maize were recorded in T4, the highest phosphorus concentration (0.175%) and uptake (33.42 kg ha−1) and potassium concentration (0.177%) and uptake (34.17 kg ha−1) were from T3, and the highest calcium concentration (0.235%) and uptake (44.81 kg ha−1) and magnesium concentration (0.115%) and uptake (21.95 kg ha−1) were from T5. However, there were no statistical differences for T3, T4, and T5 for all the parameters, except P uptake by maize.

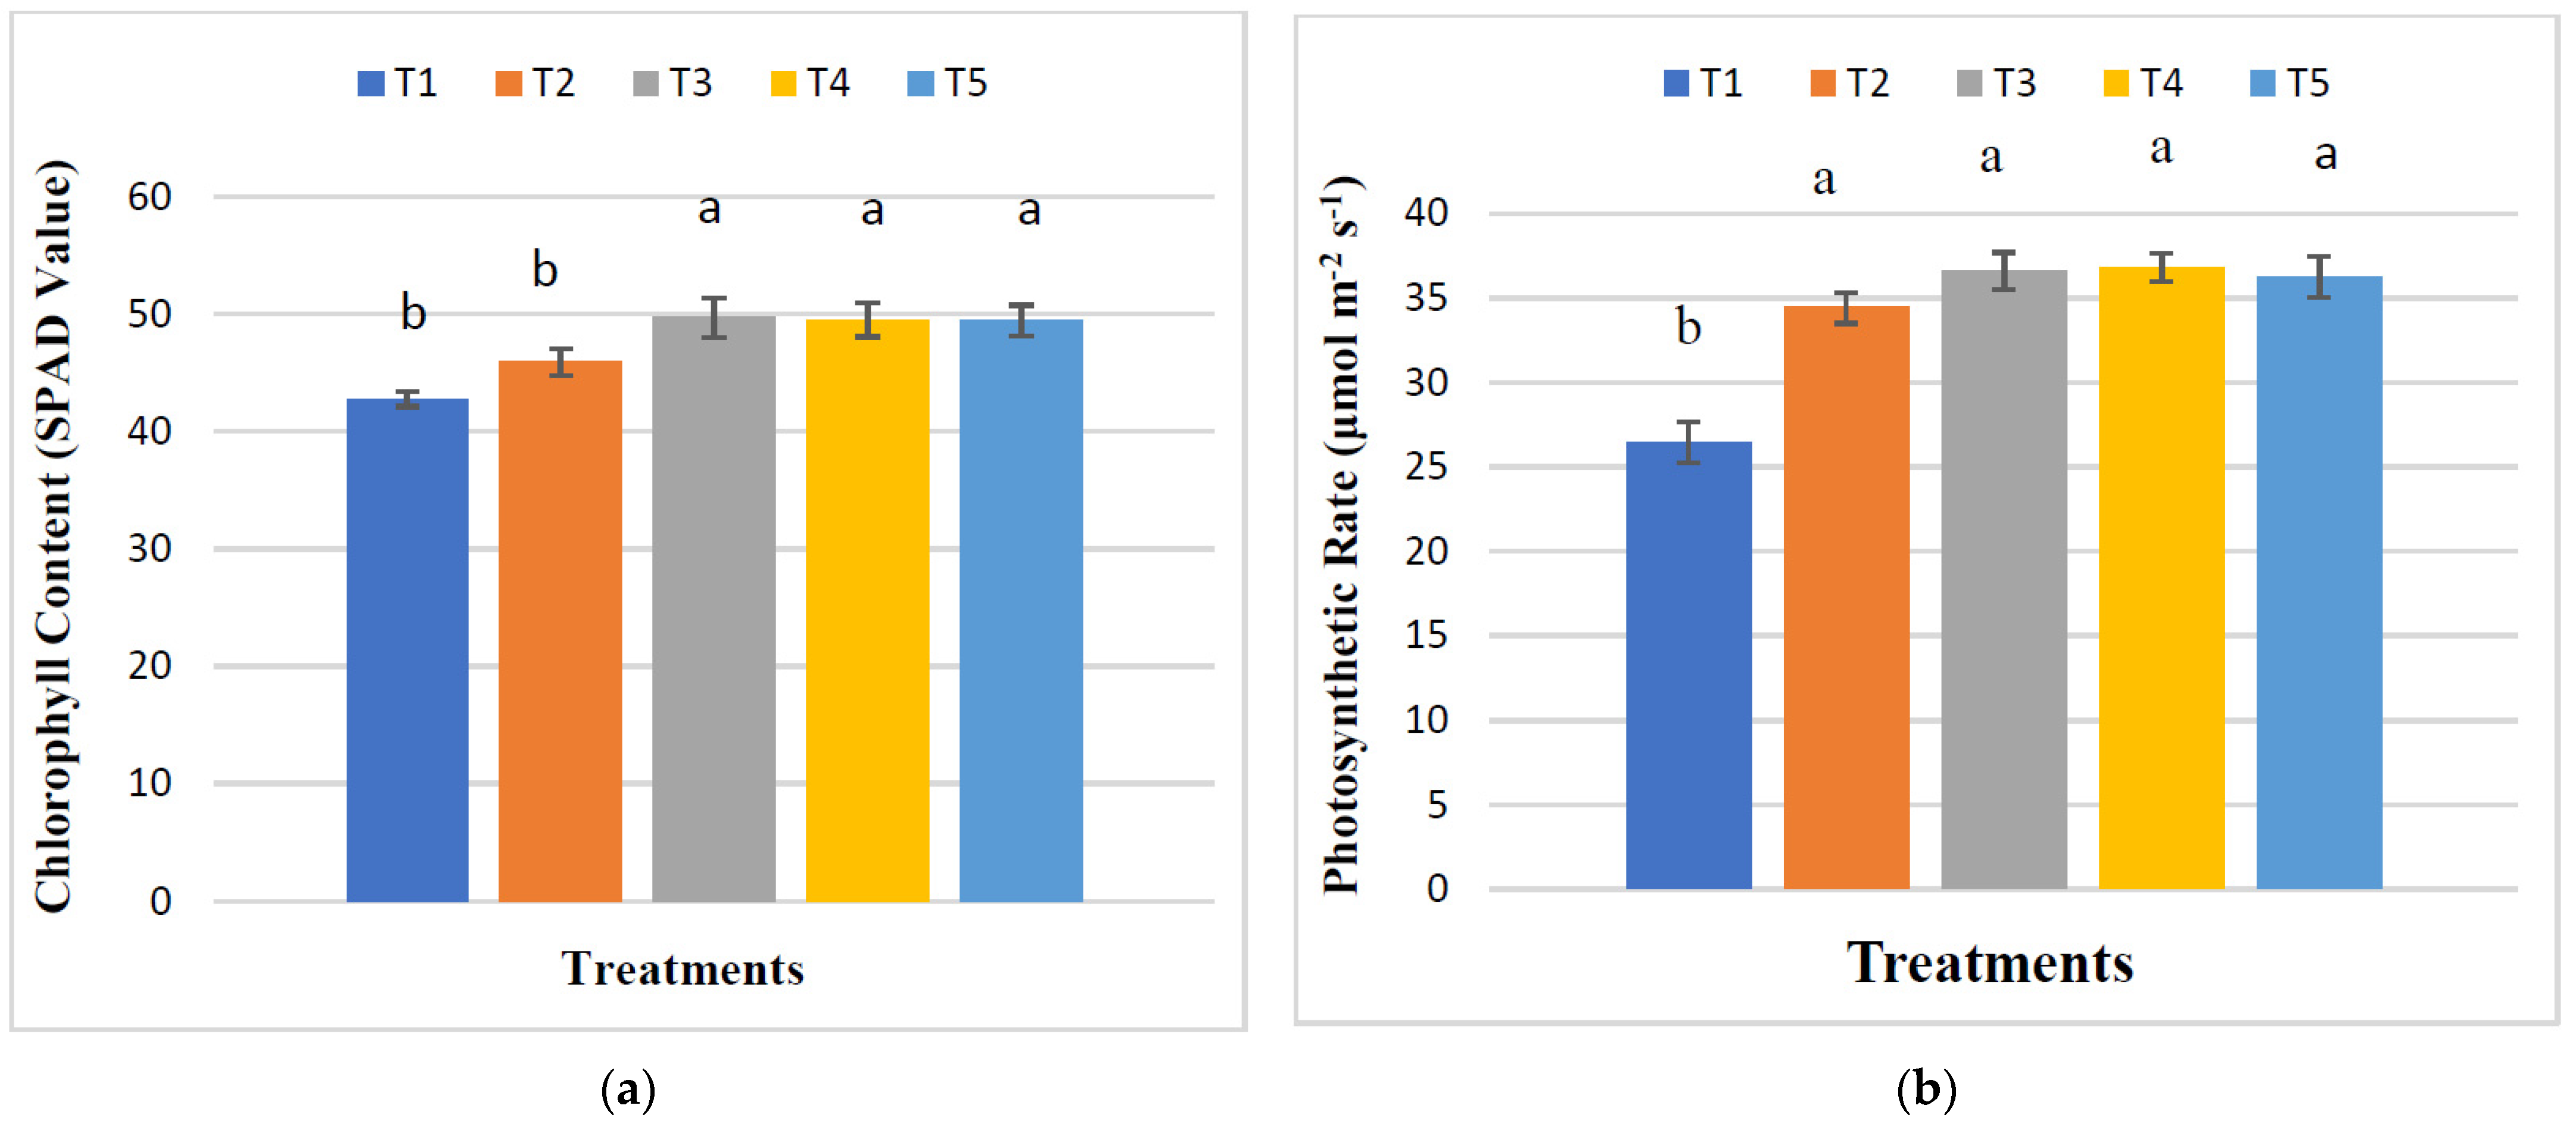
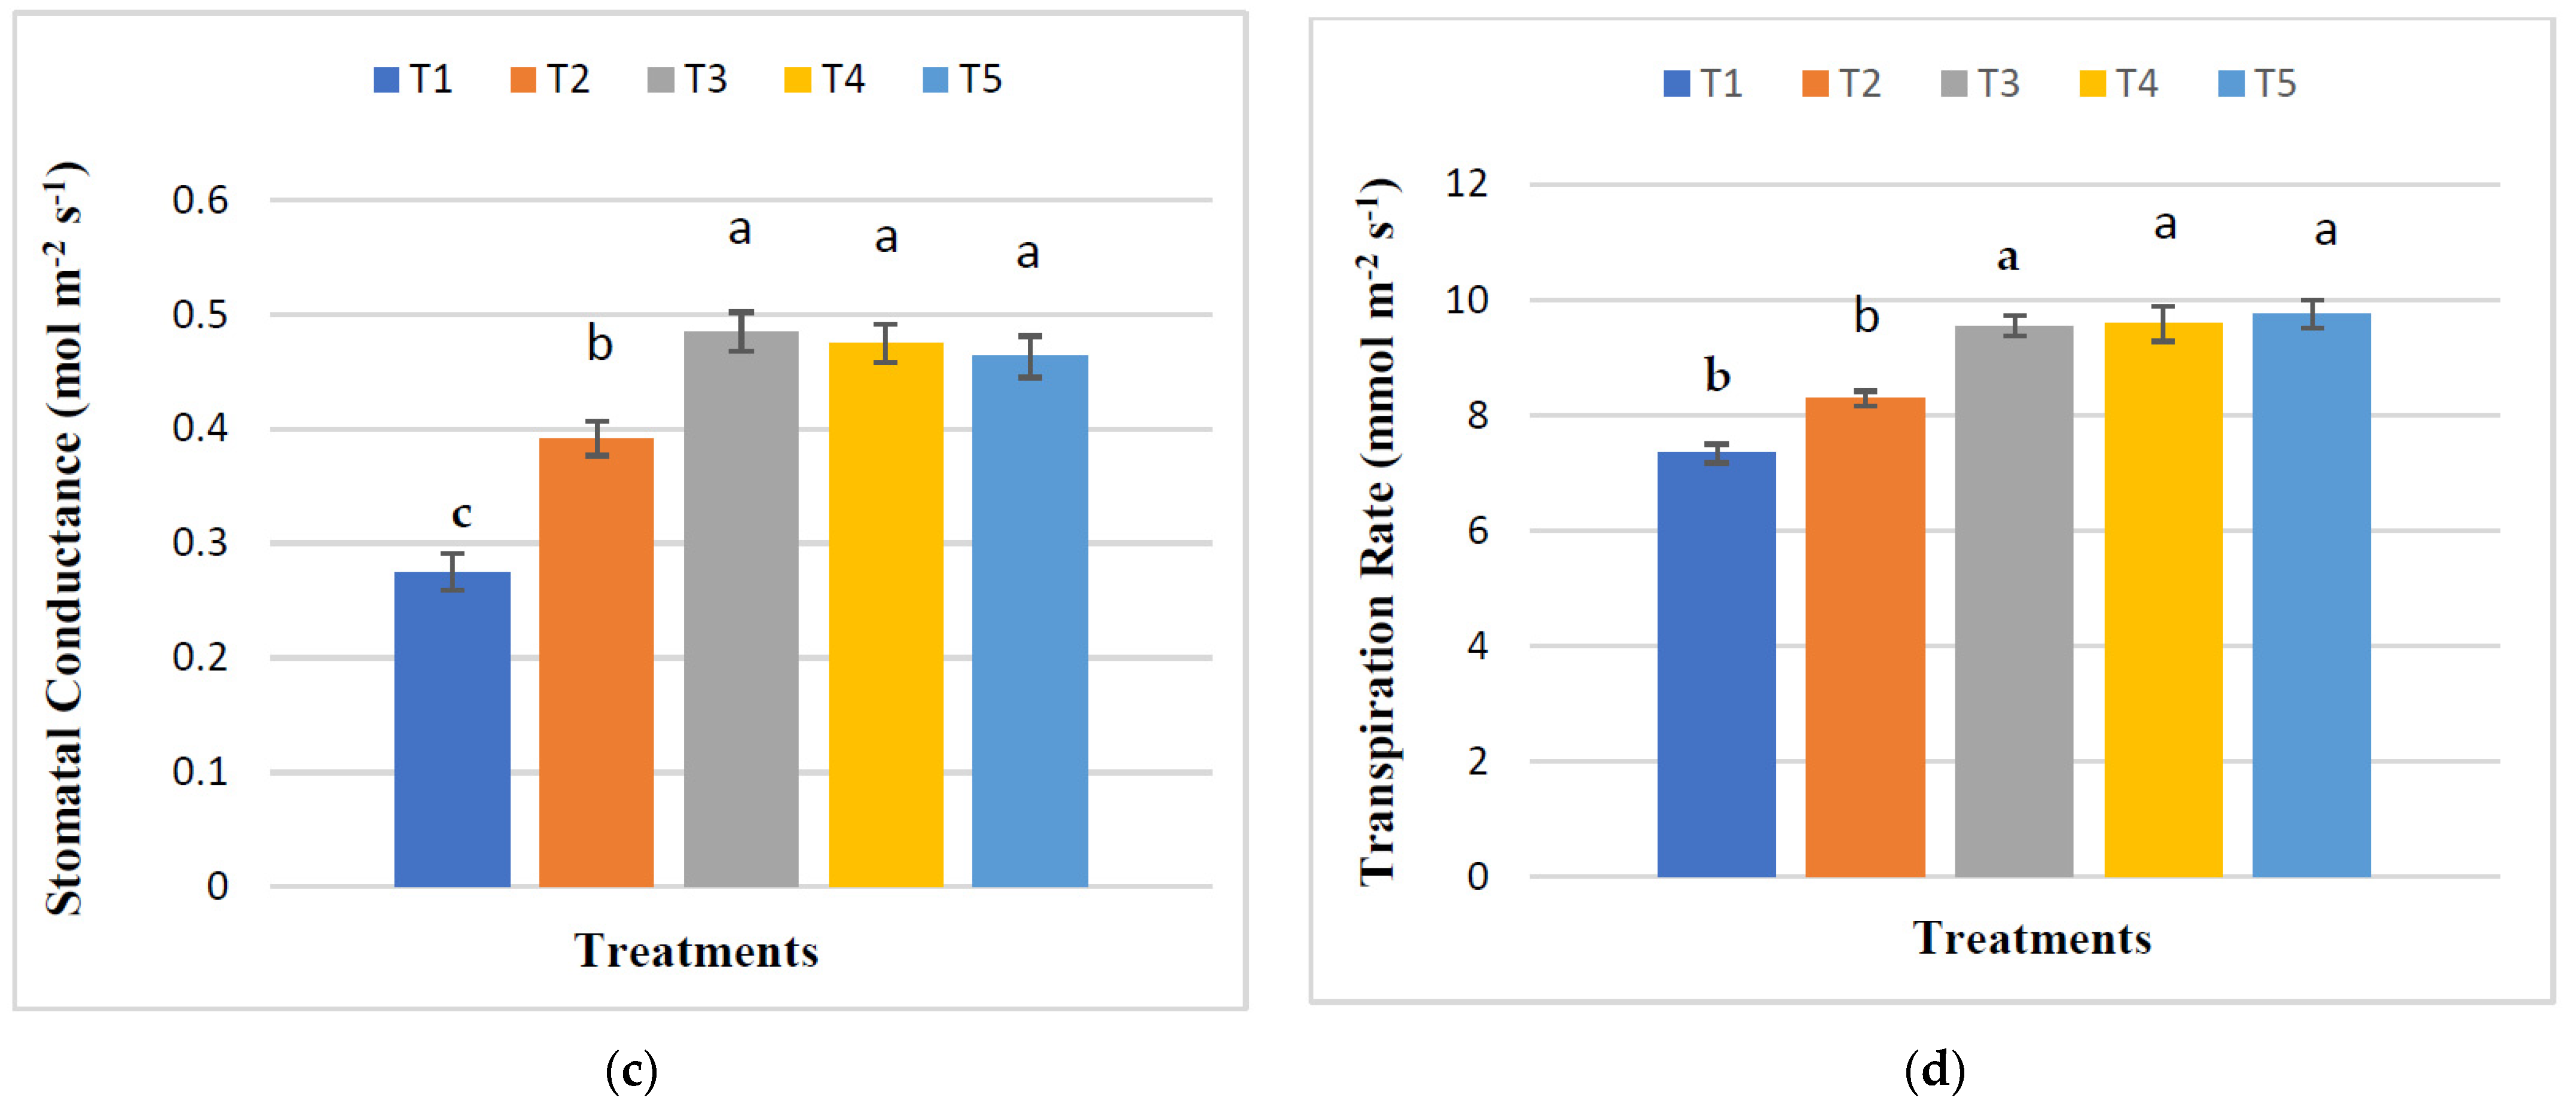
3.4. Effect of RHB, Lime, and Varying Doses of Phosphorus on the Physiological Parameters of Maize

The influence of treatments on the relative chlorophyll content (SPAD), photosynthetic rate, stomatal conductance, and transpiration rate of maize plants in the maturing stage revealed significant differences (Figure 3). The maximum SPAD value (49.68) was found from T3, indicating a maximum increase of 16.21% relative to control. The highest photosynthetic rate (36.81 μmol m−2 s−1) was observed in T4, which increased 39.17% compared to the control. The highest stomatal conductance (0.49 mol m−2 s−1) and transpiration rate (9.75 mmol m−2 s−1) of maize plants were obtained from T3 and T5, respectively. There were no significant alterations in SPAD value, photosynthetic rate, stomatal conductance, and transpiration rate among the treatments of T3, T4, and T5.

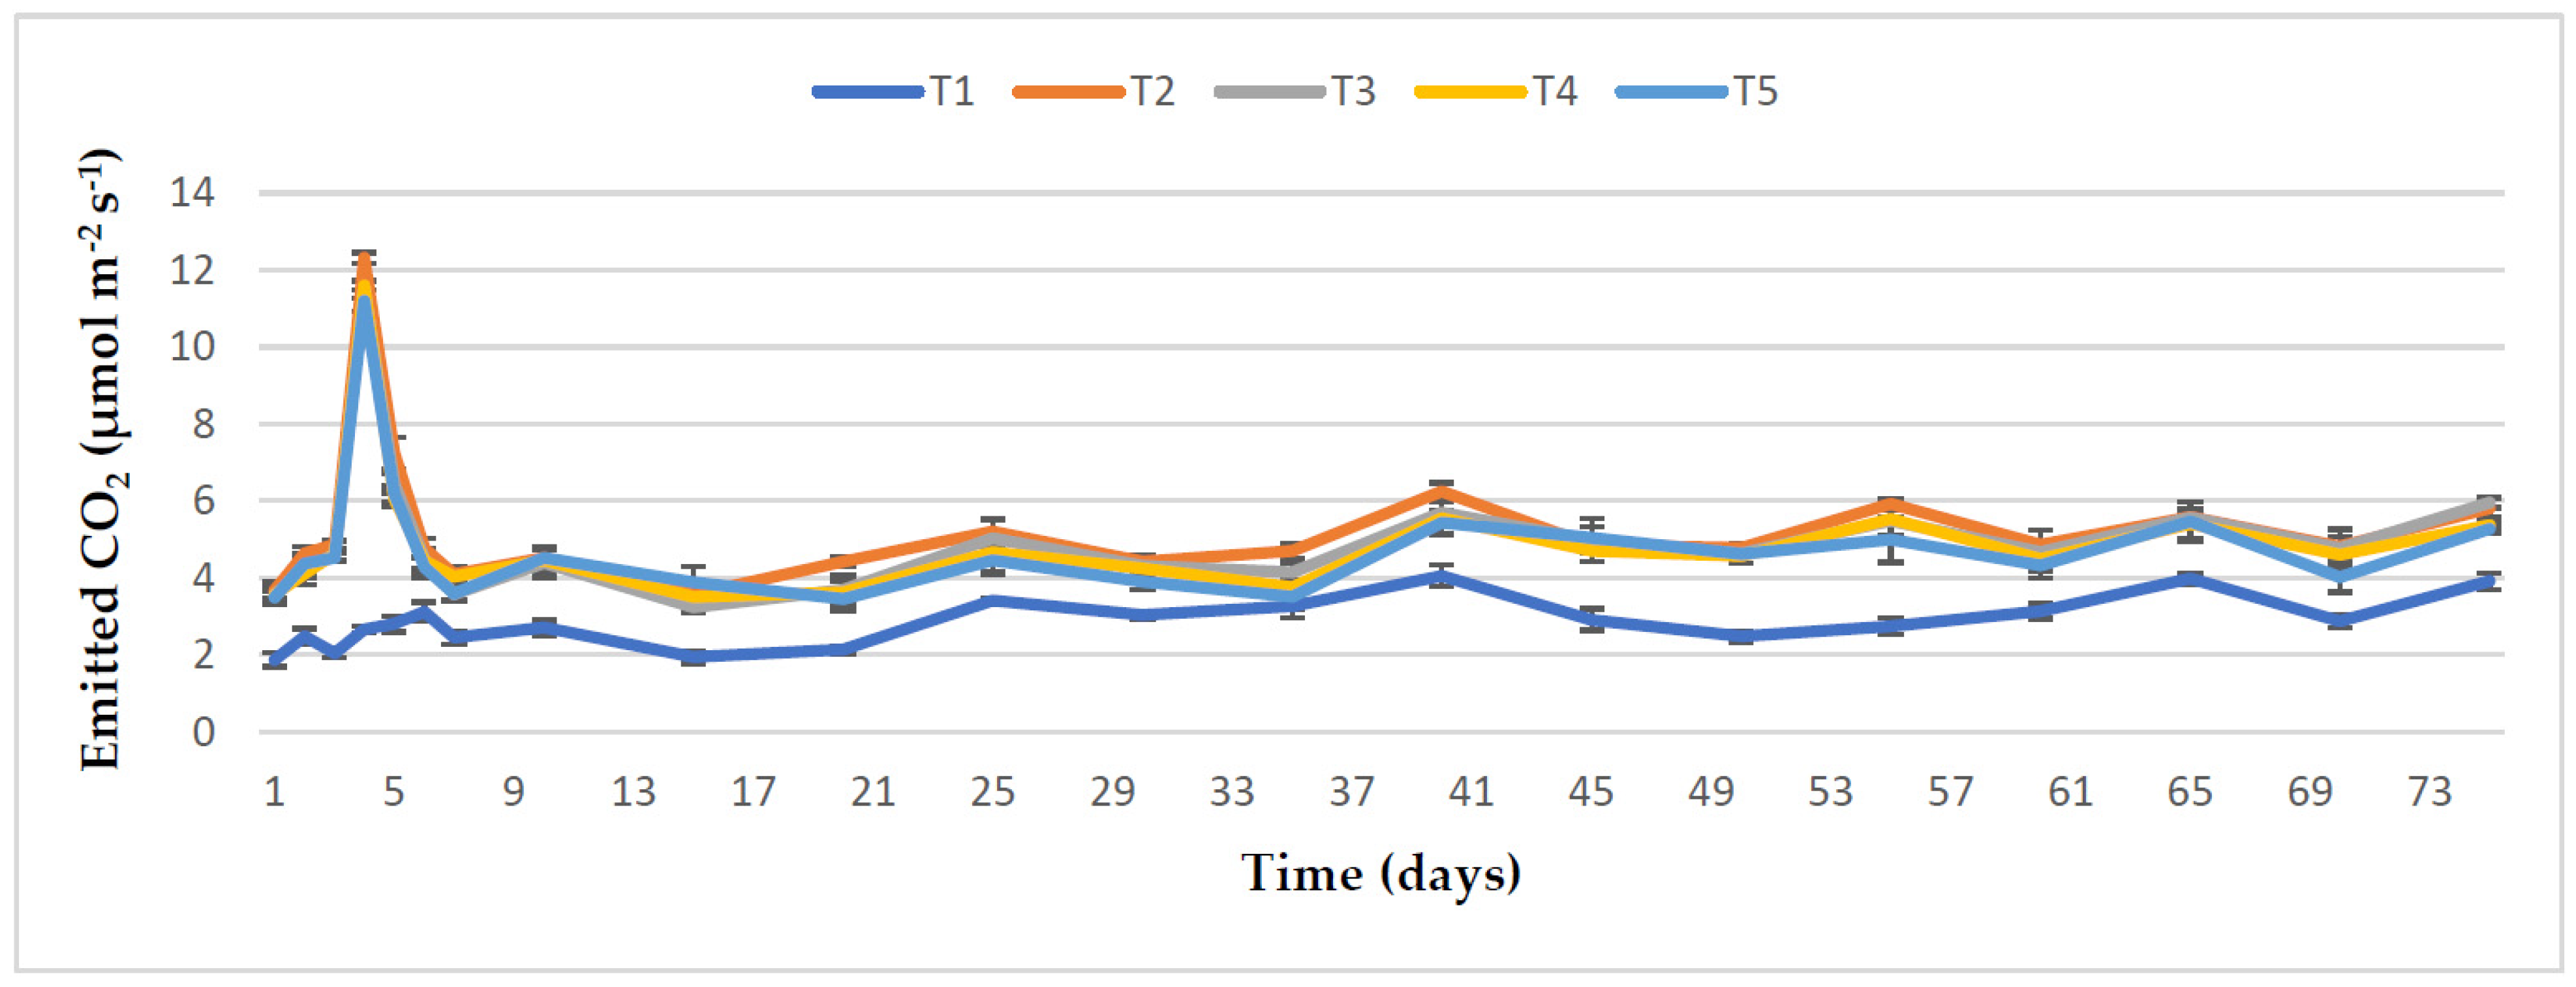
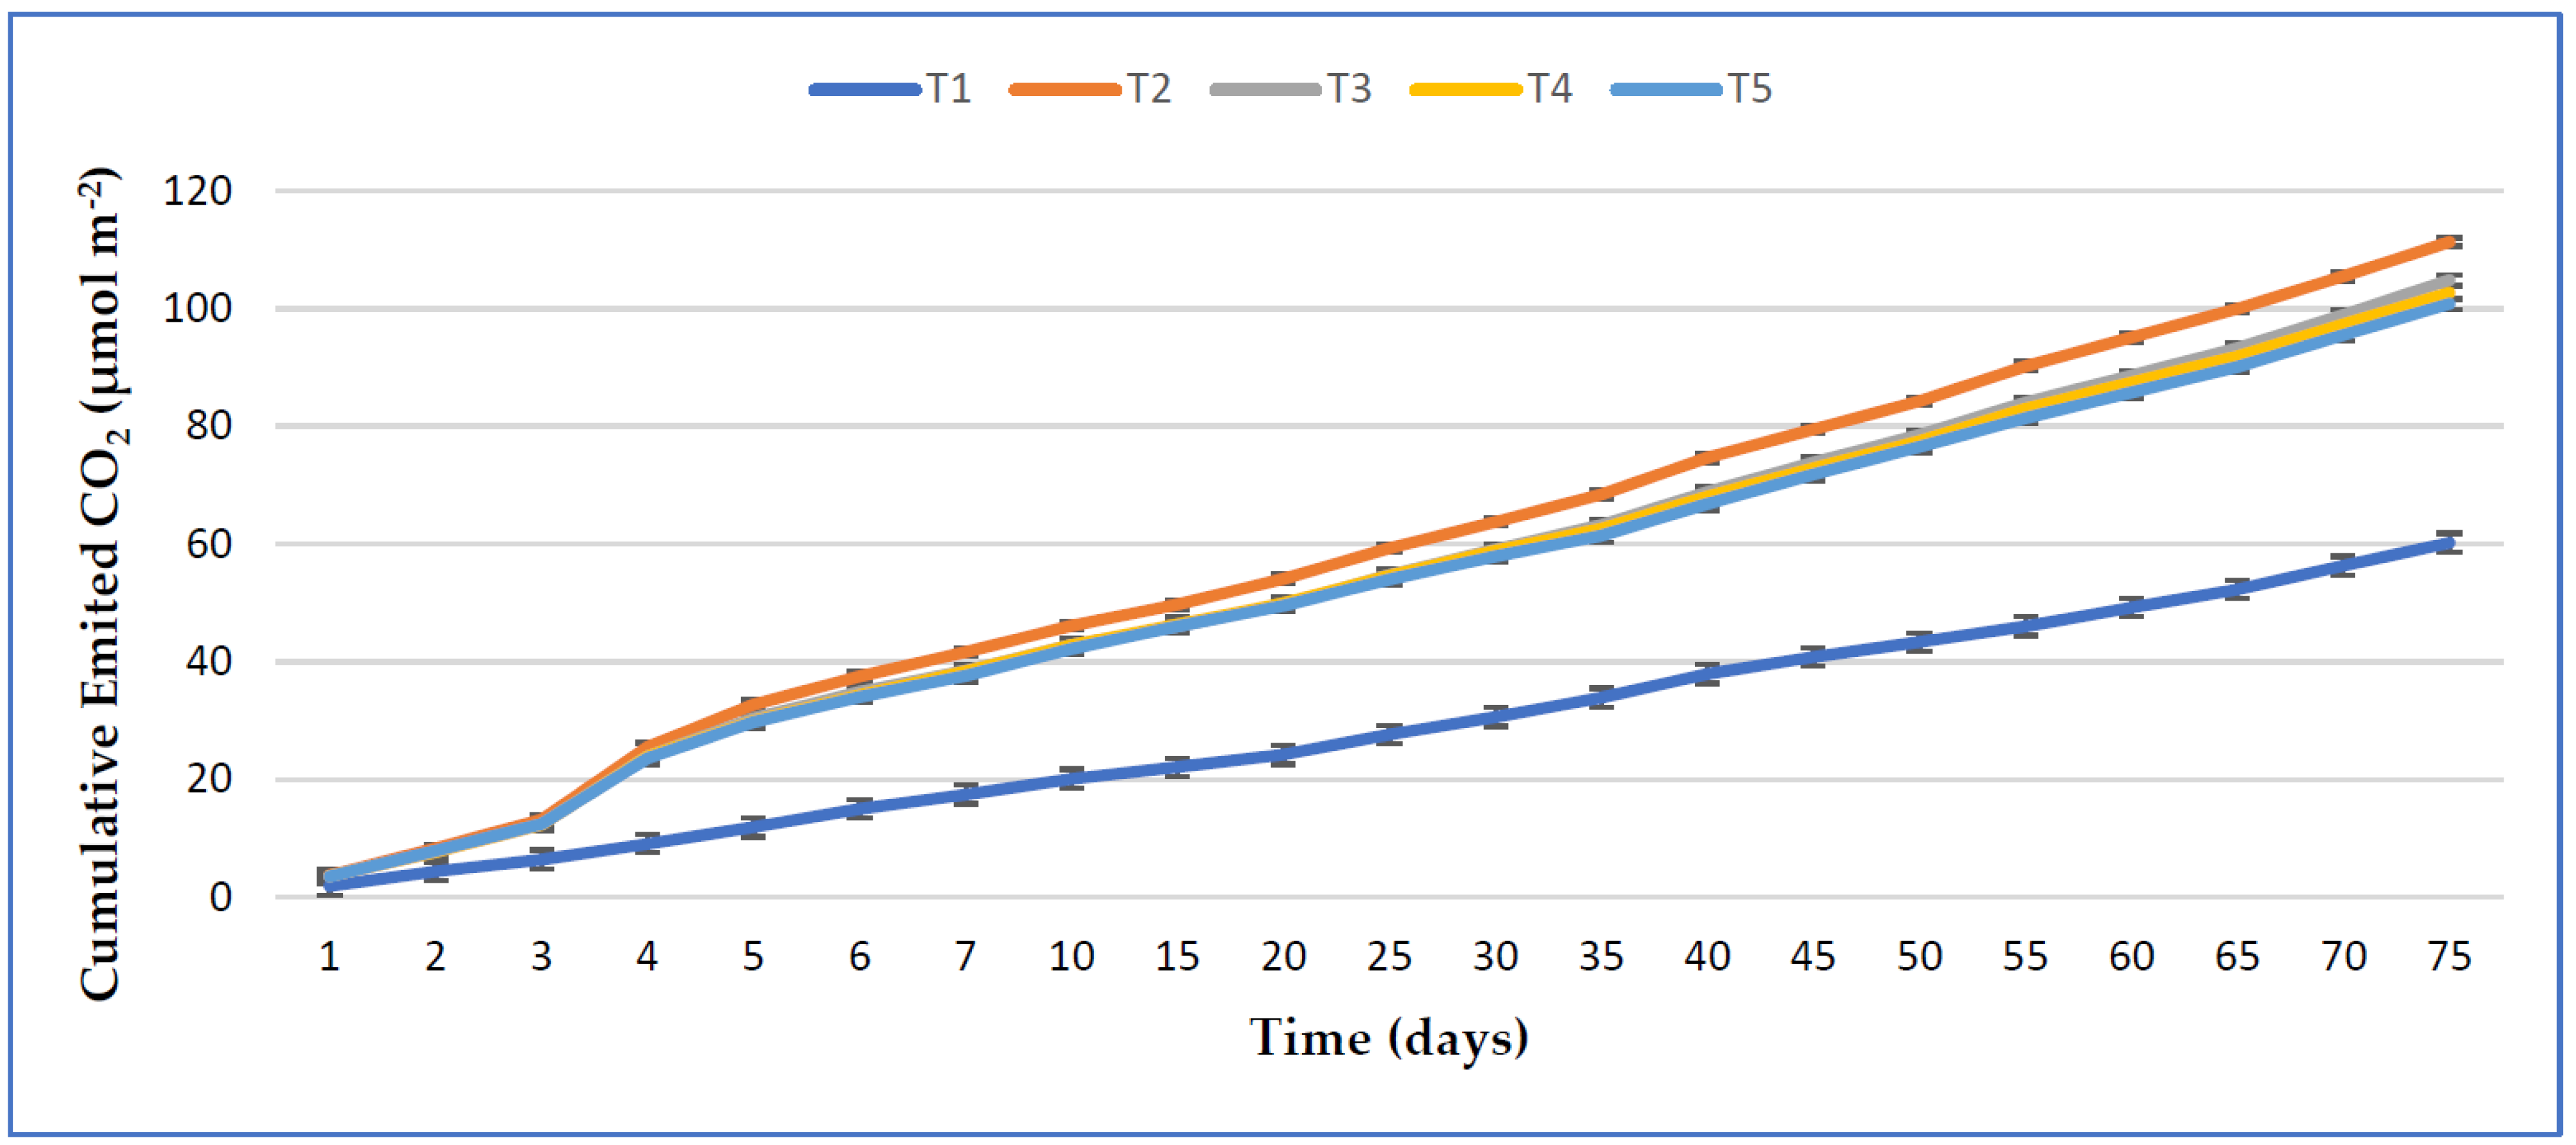
3.5. Effect of RHB, Lime, and Varying Doses of Phosphorus on Soil CO2 Emission from the Maize Field

The effect of treatments on daily emission rates of soil CO2 and their cumulative emissions are presented in Figure 4; Figure 5, respectively. It can be observed that adding dolomitic limestone (T2) into the soil showed the highest cumulative soil CO2 emission compared to adding organic amendments with lime (T3, T4, and T5) or the control soil (T1). The soil CO2 flux emission was significantly increased on day 4 in the amended treatments. However, no significant differences were observed in the cumulative CO2 emission of T3, T4, and T5. The highest magnitude (12.32 μmol CO2 m−2 s−1) and cumulative CO2 flux (111.37 μmol CO2 m−2) were noted in T2. A moderate CO2 emission was seen from all the amended treatments from 15 days after sowing (DAS), and it continued up to the last measurement. Compared to the control, the cumulative CO2 emission was significantly increased by 84.94%, 74.19%, and 67.50% from only lime treatment (T2), RHB and lime with 100% TSP amended soil (T3), and RHB and lime with 50% TSP amended soil (T5), respectively, but T3, T4, and T5 showed the same statistical values.

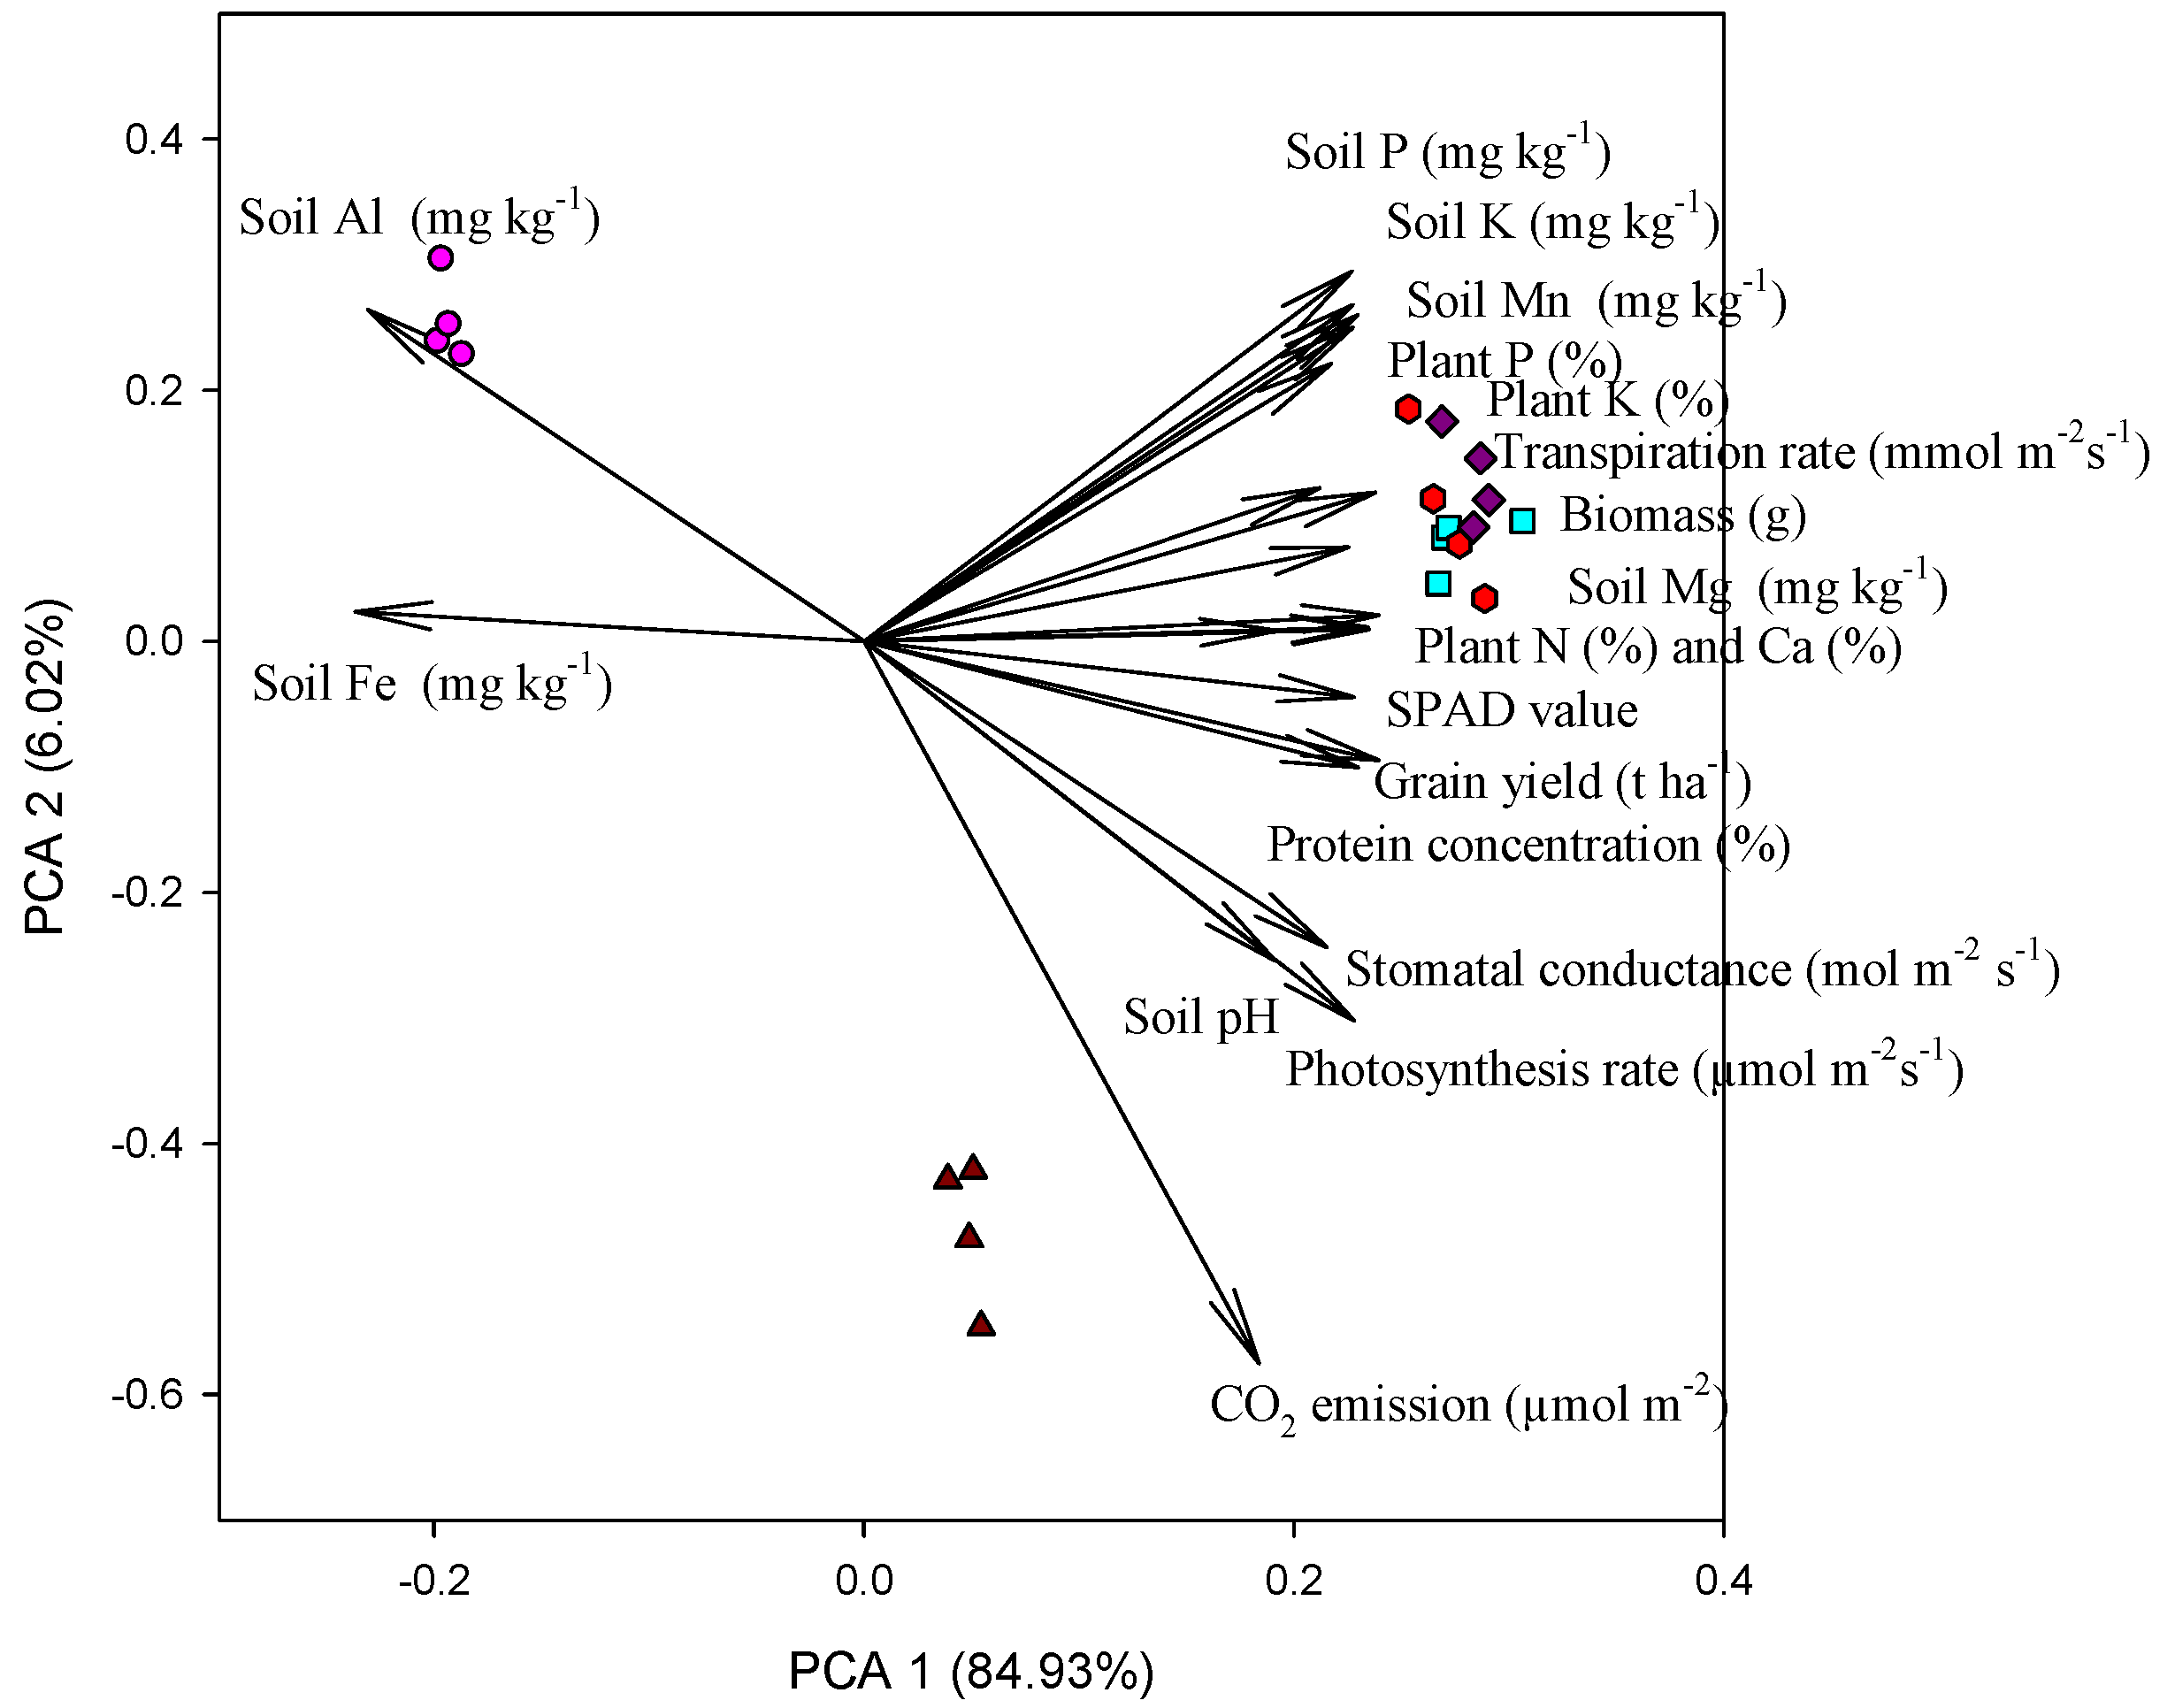
3.6. Principal Component Analysis

The principal component analysis (PCA) of different variables is presented in Figure 6. The first and second PCA explained most of the variations of the variables, estimated at 84% and 6%, respectively. All variables had positive loading on the first component, except soil Al and Fe, while variables varied along with positive and negative loading. As a result, the association between variables was created. Specifically, grain yield and biomass production were closely associated with plant nitrogen (i.e., protein and chlorophyll) and Ca concentration. Moreover, biochar and lime treatments were closely associated with most of the plant parameters.

4. Discussion

4.1. Impact of RHB, Lime, and Different Doses of Phosphorus on Soil Nutrients

The application of lime and biochar can buffer soil pH [51]. In our study, mixed application of RHB (10 t ha−1) and lime (75%) increased soil pH compared to the control and 100% lime treatment (Table 1). These results suggest that biochar amendment at 10 t ha−1 is more effective than 25% lime application in increasing soil pH.
The proton consumption after biochar application might be the reason for the increased value of soil pH [32,52]. As the RHB is alkaline (pH = 8.15), and there is a huge amount of ash in RHB (~32%), during the hydrolysis process, it releases OH by its base cations, which may assist in increasing soil pH [53]. Furthermore, the presence of acid functional groups on biochar’s surface may also contribute to the proton consumption [31], since the CEC of biochar was relatively high at ~48 cmolc kg−1 biochar. Panhwar et al. [54] also reported the same finding, where they used RHB and bio-fertilizer of 4 t ha−1 each, and soil pH increased by 1.39 units. However, biochar’s immediate impacts on soil pH might be short-lived, since the basic cations in the biochar’s ash can be lost from the soil through different mechanisms, particularly by leaching in areas with high rainfall levels. In contrast, pH buffering through oxygenated functional groups of biochar may increase with time, suggesting a long-term effect of biochar.
In acidic soil, applying soil amendments, including lime and biochar, can increase nutrient availability [55,56]. In this study, the highest available P (17.11 mg kg−1) was observed in T3 (75% lime + 10 t ha−1 RHB + 100% TSP), representing a three-fold rise in P in comparison to the control. Moreover, it was significantly higher than 100% lime treatment. However, all the biochar and lime-receiving treatments had similar P concentrations, although they received variable amounts of P, ranging from 50 to 100% of the recommended rate. These findings imply that the application of RHB with lime can significantly increase P bioavailability, and this is more pronounced when the P application rate is low. We believe that these changes mostly occurred due to an increase in soil pH, and the addition of P from biochar, while P bioavailability might have increased due to the replacement of fixed phosphate with biochar-derived small molecules [30]. Furthermore, since the CEC of the biochar was high, its role in the competitive interactions may be significant. Incorporating biochar into the soil can also function as a phosphate adsorbent and a source of readily accessible phosphorus [14,28,57]. However, these roles of biochar may be minimal, since the anion exchange capacity of our biochar may be low [28]. Nevertheless, our findings were consistent with Panhwar et al. [55], who reported a 99.82% increase of available P using biochar and bio-fertilizer.
Applying biochar or lime can increase the availability of nutrients in acidic soil [56,57,58]. Compared to the control treatment, the exchangeable cations (Ca2+, Mg2+, and K+) increased significantly after the addition of soil amendments in our study (Table 1). Several experiments have reported an enhancement of exchangeable bases considering the use of biochar and lime in tandem [59,60]. In addition, lime may increase Ca and Mg concentration in the soil [56]. On the other hand, the inclusion of RHB added Ca2+, Mg2+, and K+. As a result, biochar reduces soil acidity, hence increasing the supply of vital plant nutrients [51]. Moreover, biochar may increase the retention of these nutrients in its ion exchange sites [61,62].
In acidic soils, biochar can minimize Al toxicity in various ways, including Al adsorption, absorption, complexation, cation exchange, and electrostatic interactions [63]. In this study, the exchangeable Al significantly decreased when using RHB and lime in combination with various P fertilizer rates compared to the control and sole lime treatment (T1 and T2). The use of biochar and lime to elevate the soil’s pH might help reduce the toxicity of Al [64]. Moreover, biochar-mediated complexation of Al may also have contributed to reducing Al toxicity [65]. Our result is consistent with Ch’ng et al. [64], who reported reduced Al concentration with increased pH by adding chicken litter biochar in acid soil.

4.2. Impact of RHB, Lime, and Different Doses of Phosphorus on Plant Growth Variables

The plant dry weight of control and only lime treatments (T1 and T2) were significantly lower than the biochar amended treatments (T3, T4, and T5). Due to the lack of enough nutrient supply in the control soil, the growth and development of the plant were reduced. Al toxicity, as well as a lack of Ca, Mg, and P in acidic soil, can limit plant development and productivity [66]. According to Akinrinde et al. [67], usually in acid soil, the hydroxide of Al and Fe fixes P, which is responsible for poor plant development. Moreover, soil pH is an essential means for growing plants [68]. Applying biochar, lime, and chemical fertilizer increased plant growth, root development, cob length, fresh cob weight, grain per cob, and maize yield due to biochar’s ability to improve the bioavailability of essential nutrients and their uptake by the maize plant. This outcome is compatible with the findings of Ndor et al. [69] and Gandahi et al. [70], who investigated the influence of biochar on maize plant growth, nutrient uptake, and yield with RHB.

4.3. Impact of RHB, Lime, and Different Doses of Phosphorus on Plant Nutrient Concentration and Grain Uptake

Applying RHB, lime, and various levels of TSP considerably increased the maize plant nutrient concentration and uptake over the control treatment and lime-only treatment (T1 and T2). Specifically, the relative chlorophyll content (SPAD) of the maize plant significantly changed by applying organic amendments relative to control treatment. We believe that applying RHB, lime, and different rates of P enhanced the N concentration in the plant (Table 3), since SPAD values were higher in these treatments and were also associated with plant N concentration in the PCA analysis (Figure 6). This higher concentration of N was then partitioned to the grain, providing a higher protein concentration (Table 3). Similarly, concentrations and uptakes of other nutrients, including P, K, Ca, and Mg, were significantly increased when biochar was mixed with lime, irrespective of P treatments. In addition, Al3+ toxicity, one of the common problems identified in the acid soil associated with the root zone, resulted in poor plant development and reduced uptake of essential nutrients in the plot that received biochar and lime treatments [71]. Our findings are consistent with Ndor et al. [69], who obtained increased nutrient uptake and yield of maize by applying rice husk and sawdust biochar. Furthermore, biochar’s high surface area and the functional carboxylic and phenolic group binds with ions, preventing the leaching loss of the nutrients [62]. Subsequently, it helps to increase the nutrient uptake by maize.
In this study, the relative chlorophyll content (SPAD) of the maize plant significantly changed by applying organic amendments relative to the control. The SPAD value is an important biochemical indicator for identifying the plant’s development and yield parameter [72], where a higher value may indicate the higher yield of crops [73] and also a higher photosynthetic rate [74]. Furthermore, the enrichment of essential nutrients to the acid soil may result in a significant increase in the SPAD value, which may later exhibit proper plant development and growth rate along with chlorophyll content [75,76].

4.4. Impact of RHB, Lime, and Different Rates of Phosphorus on Soil CO2 Emission

Applying biochar has a considerable impact on the soil organic matter mineralization and CO2 emissions. In our field research, the emission of soil CO2 gas was influenced by RHB, lime, and different rates of P fertilizer. Higher soil CO2 emissions were noted with only lime treatment (T2) because of the dissociation of carbonates [77] and mineralization of organic carbon enhanced by the microbial communities [78,79,80].
In general, the rise in soil CO2 emissions due to biochar addition could be described by the increase of labile soil organic carbon (SOC) pools from the biochar addition and mineralization of biochar-induced priming of native SOC [81]. This increase may also have been accelerated by the stimulated growth of soil microorganisms [78]. Although it has been reported that soil CO2 emissions may be suppressed by applying biochar, as biochar may inhibit or reduce the C-degrading enzymatic activity [82] and precipitation of CO2 onto the biochar surface [83], we did not observe these phenomena in our experiment. Possibly, the CO2 production was much higher than the trapping capacity of biochar, while biochar’s pores might have filled with clay minerals in our soil for CO2 adsorption.
Our findings reveal that the lime-C was reduced from the treatment with co-application of RHB and lime (T3, T4, and T5) compared with the lime-only treatment (T2), which may be explained as more sequestration of lime-C into the soil in the organic amended treatment [84]. Furthermore, biochar’s aromatic compounds are mostly chemically stable, and it has high resistance to decomposition [85,86]. Consequently, biochar can remain in the soil for centuries or millennia [87].

5. Conclusions

Our findings demonstrate that using RHB and lime in combination with a P fertilizer boosts the soil available P, nutrient uptake, and maize production. This occurred as a result of a rise in soil pH and reduction of the Al toxicity through organic modifications and using lime. Additionally, the combined application of RHB, lime, and varying rates of chemical P fertilizer resulted in enhanced soil nutrients, P-use efficiency, and dry matter yield of maize compared to the control treatment. Biochar application at 10 t ha−1 with 75% lime application provided a similar harvest in a range of P applications from 50 to 100%, whereas the emission of CO2 gas increased 74.19% and 67.50% from 75% lime + 10 t ha−1 RHB + 100% TSP (T3) and 75% lime + 10 t ha−1 RHB + 50% TSP (T5), respectively. Therefore, our results suggest that 75% lime + 10 t ha−1 RHB + 50% TSP (T5) can be one of the sustainable means for maize cultivation in acidic soil conditions, since it can be more profitable to farmers while reducing total soil CO2 emission compared to a lime-only treatment.

Author Contributions

Conceptualization, M.K.U. and M.F.S.; experiment design, data collection, statistical analysis, M.M. and M.F.S.; validation, M.K.U. and M.F.S.; writing—original draft preparation, M.M.; writing—review and editing, M.K.U., S.M. and S.M.S.; visualization, M.M., S.M. and A.N.A.H.; supervision, M.K.U. and M.F.S. All authors have read and agreed to the published version of the manuscript.

Funding

This work was funded by Universiti Putra Malaysia (Vote No. 6282512-10201), Fundamental Research Grant Scheme (FRGS 1/2020/WAB04/Vote no 5540389), and National Agricultural Technology Program (NATP): Phase- II Project, Bangladesh Agricultural Research Council (BARC).

Institutional Review Board Statement

Not applicable.

Informed Consent Statement

Not applicable.

Data Availability Statement

Not applicable.

Acknowledgments

We are grateful to the Bangladesh Agricultural Research Council for funding, and the Universiti Putra Malaysia, Malaysia, for the technical facilities.

Conflicts of Interest

The authors declare no conflict of interest.

References

  1. Reddy, Y.R.; Ravi, D.; Reddy, C.H.R.; Prasad, K.V.S.V.; Zaidi, P.H.; Vinayan, M.T.; Blümmel, M. A note on the correlations between maize grain and maize stover quantitative and qualitative traits and the implications for whole maize plant optimization. Field Crops Res. 2013, 153, 63–69. [Google Scholar] [CrossRef]
  2. von Uexküll, H.R.; Mutert, E. Global extent, development and economic impact of acid soils. Plant Soil 1995, 171, 1–15. [Google Scholar] [CrossRef]
  3. Guo, J.; Liu, X.; Zhang, Y.; Shen, J.; Han, W.; Zhang, W.; Christie, P.; Goulding, K.W.T.; Vitousek, P.M.; Zhang, F. Significant acidification in major Chinese croplands. Science 2010, 327, 1008–1010. [Google Scholar] [CrossRef] [PubMed] [Green Version]
  4. Ryan, P.R. Assessing the role of genetics for improving the yield of Australia’s major grain crops on acid soils. Crop Pasture Sci. 2018, 69, 242–264. [Google Scholar] [CrossRef]
  5. Abreha, K.; Heluf, G.; Tekalign, M.; Kindie, T. Wheat crop response to liming materials and N and P fertilizers in acidic soils of Tsegede highlands, northern Ethiopia. Agric. For. Fish. 2013, 2, 126–135. [Google Scholar] [CrossRef]
  6. Butterly, C.R.; Costello, B.; Lauricella, D.; Sale, P.; Li, G.; Tang, C. Alkalinity movement down acid soil columns was faster when lime and plant residues were combined than when either was applied separately. Eur. J. Soil Sci. Adv. 2021, 72, 313–325. [Google Scholar] [CrossRef]
  7. Wang, M.; Xian-Jun, J. Effects of applying lime and calcium montmorillonite on nitrification dynamics in acidic soil. J. Agric. Resour. Environ. 2017, 34, 47–53. [Google Scholar] [CrossRef]
  8. Huber, C.; Baier, R.; Göttlein, A.; Weis, W. Changes in soil, seepage water and needle chemistry between 1984 and 2004 after liming an N-saturated Norway spruce stand at the Höglwald, Germany. For. Ecol. Manag. 2006, 233, 11–20. [Google Scholar] [CrossRef]
  9. Wu, S.; Zhang, Y.; Tan, Q.; Sun, X.; Wei, W.; Hu, C. Science of the Total Environment Biochar is superior to lime in improving acidic soil properties and fruit quality of Satsuma mandarin. Sci. Total Environ. 2020, 714, 136722. [Google Scholar] [CrossRef]
  10. Lustosa Carvalho, M.; Tuzzin de Moraes, M.; Cerri, C.E.P.; Cherubin, M.R. Biochar amendment enhances water retention in a tropical sandy soil. Agriculture 2020, 10, 62. [Google Scholar] [CrossRef] [Green Version]
  11. Uslu, O.S.; Babur, E.; Alma, M.H.; Solaiman, Z.M. Walnut Shell Biochar Increases Seed Germination and Early Growth of Seedlings of Fodder Crops. Agriculture 2020, 10, 427. [Google Scholar] [CrossRef]
  12. Dai, Z.; Zhang, X.; Tang, C.; Muhammad, N.; Wu, J.; Brookes, P.C.; Xu, J. Potential role of biochars in decreasing soil acidification—A critical review. Sci. Total Environ. 2017, 581–582, 601–611. [Google Scholar] [CrossRef] [PubMed]
  13. Yuan, J.H.; Xu, R.K. The amelioration effects of low temperature biochar generated from nine crop residues on an acidic Ultisol. Soil Use Manag. 2011, 27, 110–115. [Google Scholar] [CrossRef]
  14. Mia, S.; Dijkstra, F.A.; Singh, B. Aging induced changes in biochar’s functionality and adsorption behavior for phosphate and ammonium. Environ. Sci. Technol. 2017, 51, 8359–8367. [Google Scholar] [CrossRef] [PubMed]
  15. Silber, A.; Levkovitch, I.; Graber, E.R. pH-Dependent Mineral Release and Surface Properties of Cornstraw Biochar: Agronomic Implications. Environ. Sci. Technol. 2010, 44, 9318–9323. [Google Scholar] [CrossRef] [PubMed]
  16. Agegnehu, G.; Srivastava, A.K.; Bird, M.I. The role of biochar and biochar-compost in improving soil quality and crop performance: A review. Appl. Soil Ecol. 2017, 119, 156–170. [Google Scholar] [CrossRef]
  17. Palansooriya, K.N.; Ok, Y.S.; Awad, Y.M.; Lee, S.S.; Sung, J.-K.; Koutsospyros, A.; Moon, D.H. Impacts of biochar application on upland agriculture: A review. J. Environ. Manag. 2019, 234, 52–64. [Google Scholar] [CrossRef]
  18. Yu, H.; Zou, W.; Chen, J.; Chen, H.; Yu, Z.; Huang, J.; Tang, H.; Wei, X.; Gao, B. Biochar amendment improves crop production in problem soils: A review. J. Environ. Manag. 2019, 232, 8–21. [Google Scholar] [CrossRef]
  19. Sarfraz, R.; Hussain, A.; Sabir, A.; Ben Fekih, I.; Ditta, A.; Xing, S. Role of biochar and plant growth promoting rhizobacteria to enhance soil carbon sequestration-a review. Environ. Monit. Assess. 2019, 191, 251. [Google Scholar] [CrossRef]
  20. Solaiman, Z.M.; Shafi, M.I.; Beamont, E.; Anawar, H.M. Poultry litter biochar increases mycorrhizal colonisation, soil fertility and cucumber yield in a fertigation system on sandy soil. Agriculture 2020, 10, 480. [Google Scholar] [CrossRef]
  21. Liu, L.Y.; Tan, Z.X.; Gong, H.B.; Huang, Q.Y. Migration and transformation mechanisms of nutrient elements (N, P, K) within biochar in straw-biochar-soil-plant systems: A review. ACS Sustain. Chem. Eng. 2019, 7, 22–32. [Google Scholar] [CrossRef]
  22. Lin, Q.; Zhang, L.; Riaz, M.; Zhang, M.; Xia, H.; Lv, B.; Jiang, C. Assessing the potential of biochar and aged biochar to alleviate aluminum toxicity in an acid soil for achieving cabbage productivity. Ecotoxicol. Environ. Saf. 2018, 161, 290–295. [Google Scholar] [CrossRef] [PubMed]
  23. Gul, S.; Whalen, J.K. Biochemical cycling of nitrogen and phosphorus in biochar-amended soils. Soil Biol. Biochem. 2016, 103, 1–15. [Google Scholar] [CrossRef]
  24. Zhao, Y.H.; Zhao, L.; Mei, Y.Y.; Li, F.Y.; Cao, X.D. Release of nutrients and heavy metals from biochar-amended soil under environmentally relevant conditions. Environ. Sci. Pollut. Res. 2018, 25, 2517–2527. [Google Scholar] [CrossRef] [PubMed]
  25. Mete, F.Z.; Mia, S.; Dijkstra, F.A.; Abuyusuf, M.; Hossain, A.S.M.I. Synergistic effects of biochar and NPK fertilizer on soybean yield in an alkaline soil. Pedosphere 2015, 25, 713–719. [Google Scholar] [CrossRef]
  26. Kemmitt, S.J.; Wright, D.; Goulding, K.W.T.; Jones, D.L. pH regulation of carbon and nitrogen dynamics in two agricultural soils. Soil Biol. Biochem. 2006, 38, 898–911. [Google Scholar] [CrossRef]
  27. Kirkham, J.; Rowe, B.; Doyle, R. Persistent improvements in the structure and hydraulic conductivity of a ferrosol due to liming. Aust. J. Soil Res. 2007, 45, 218–223. [Google Scholar] [CrossRef]
  28. Gomes, E.A.; Lana, U.G.P.; Quensen, J.F.; de Sousa, S.M.; Oliveira, C.A.; Guo, J.; Guimarães, L.J.; Tiedje, J.M. Root-associated microbiome of maize genotypes with contrasting phosphorus use efficiency. Phytobiomes 2018, 2, 129–137. [Google Scholar] [CrossRef] [Green Version]
  29. Zhang, H.Z.; Chen, C.R.; Gray, E.M.; Boyd, S.E.; Yang, H.; Zhang, D.K. Roles of biochar in improving phosphorus availability in soils: A phosphate adsorbent and a source of available phosphorus. Geoderma 2016, 276, 1–6. [Google Scholar] [CrossRef]
  30. Hiemstra, T.; Mia, S.; Duhaut, P.B.; Molleman, B. Natural and pyrogenic humic acids at goethite and natural oxide surfaces interacting with phosphate. Environ. Sci. Technol. 2013, 47, 9182–9189. [Google Scholar] [CrossRef]
  31. Mia, S.; Singh, B.; Dijkstra, F.A. Chemically oxidized biochar increases ammonium-15 N recovery and phosphorus uptake in a grassland. Biol. Fertil. Soils 2019, 55, 577–588. [Google Scholar] [CrossRef]
  32. Chintala, R.; Mollinedo, J.; Schumacher, T.E.; Malo, D.D.; Julson, J.L. Effect of Biochar on Chemical Properties of Acidic Soil. Arch. Agron. Soil Sci. 2014, 60, 393–404. [Google Scholar] [CrossRef]
  33. Lehmann, J.; da Silva, J.P.; Steiner, C.; Nehls, T.; Zech, W.; Glaser, B. Nutrient availability and leaching in an archaeological Anthrosol and a Ferralsol of the Central Amazon basin: Fertilizer, manure and charcoal amendments. Plant Soil 2003, 249, 343–357. [Google Scholar] [CrossRef]
  34. Mosharrof, M.; Uddin, M.K.; Sulaiman, M.F.; Mia, S.; Shamsuzzaman, S.M.; Haque, A.N.A. Combined Application of Rice Husk Biochar and Lime Increases Phosphorus Availability and Maize Yield in an Acidic Soil. Agriculture 2021, 11, 793. [Google Scholar] [CrossRef]
  35. Bouyoucos, G.J. Hydrometer method improved for making particle size analysis of soils. Agron. J. 1962, 54, 464–465. [Google Scholar] [CrossRef]
  36. Benton, J.J. Laboratory Guide for Conducting Soil Tests and Plant Analysis; CRC Press: Boca Raton, FL, USA, 2001; ISBN 9780429132117. [Google Scholar]
  37. Schollenberger, C.J.; Simon, R.H. Determination of exchange capacity and exchangeable bases in soil-ammonium acetate method. Soil Sci. 1945, 59, 13–24. [Google Scholar] [CrossRef]
  38. Elisa, A.A.; Ninomiya, S.; Shamshuddin, J.; Roslan, I. Alleviating aluminum toxicity in an acid sulfate soil from Peninsular Malaysia by calcium silicate application. Solid Earth 2016, 7, 367–374. [Google Scholar] [CrossRef] [Green Version]
  39. Tan, K.H. Soil and plant test. In Soil Sampling, Preparation, and Analysis, 2nd ed.; Tan, K.H., Ed.; CRC Press Taylor & Francis Group: Boca Raton, FL, USA, 2005; pp. 98–134. [Google Scholar]
  40. Bray, R.H.; Kurtz, L.T. Determination of total, organic, and available forms of phosphorus in soils. Soil Sci. 1945, 59, 39–46. [Google Scholar] [CrossRef]
  41. Ahmedna, M.; Marshall, W.E.; Rao, R.M. Production of granular activated carbon from select agricultural by-products and evaluation of their physical, chemical, and adsorption properties. Bioresour. Technol. 1998, 71, 113–123. [Google Scholar] [CrossRef]
  42. Cottenie, A. Soil testing and plant testing as a basis of fertilizer recommendation. FAO Soil Bull. 1980, 38, 70–73. [Google Scholar]
  43. Pedram, K. Genetic Potential of Selected Sweet Corn Inbred Lines and Analysis of Their Combining Ability Assisted by Microsatellite DNA Markers. Ph.D. Thesis, Universiti Putra Malaysia, Seri Kembangan, Malaysia, 2012. [Google Scholar]
  44. Mosharrof, M.; Uddin, M.K.; Jusop, S.; Sulaiman, M.F.; Shamsuzzaman, S.M.; Haque, A.N.A. Changes in Acidic Soil Chemical Properties and Carbon Dioxide Emission Due to Biochar and Lime Treatments. Agriculture 2021, 11, 219. [Google Scholar] [CrossRef]
  45. Lija, M.; Ahmed, O.H.; Susilawati, K. Maize (Zea mays L.) nutrient use efficiency as affected by formulated fertilizer with Clinoptilolite Zeolite. Emir. J. Food Agric. 2014, 26, 284–292. [Google Scholar] [CrossRef]
  46. Fageria, N.K.; Baligar, V.C.; Jones, C. Growth and Mineral Nutrition of Field Crops, 2nd ed.; Marcel Dekker, Inc.: New York, NY, USA, 1997; p. 494. [Google Scholar]
  47. Yuan, Z.; Cao, Q.; Zhang, K.; Ata-Ul-Karim, S.T.; Tian, Y.; Zhu, Y.; Cao, W.; Liu, X. Optimal leaf positions for SPAD meter measurement in rice. Front. Plant Sci. 2016, 7, 719. [Google Scholar] [CrossRef] [PubMed] [Green Version]
  48. Gezahegn, A.M. Integrated Nutrient Management for Maize-Soybean Cropping System. Ph.D. Thesis, Universiti Putra Malaysia, Seri Kembangan, Malaysia, 2016. [Google Scholar]
  49. Iqbal, J.; Hu, R.G.; Feng, M.; Lin, S.; Malghani, S.; Ali, I.M. Microbial biomass, and dissolved organic carbon and nitrogen strongly affect soil respiration in different land uses: A case study at Three Gorges Reservoir Area, South China. Agric. Ecosyst. Environ. 2010, 137, 294–307. [Google Scholar] [CrossRef]
  50. Shen, Y.; Zhu, L.; Cheng, H.; Yue, S.; Li, S. Effects of biochar application on CO2 emissions from a cultivated soil under semiarid climate conditions in Northwest China. Sustainability 2017, 9, 1482. [Google Scholar] [CrossRef] [Green Version]
  51. Masud, M.M.; Abdulaha-Al Baquyb, M.; Akhtera, S.; Sena, R.; Barmana, A.; Khatuna, M.R. Liming effects of poultry litter derived biochar on soil acidity amelioration and maize growth. Ecotoxicol. Environ. Saf. 2020, 202, 110865. [Google Scholar] [CrossRef]
  52. Shi, R.Y.; Ni, N.; Nkoh, J.N.; Li, J.Y.; Xu, R.K.; Qian, W. Beneficial dual role of biochars in inhibiting soil acidification resulting from nitrification. Chemosphere 2019, 234, 43–51. [Google Scholar] [CrossRef]
  53. Eduah, J.O.; Nartey, E.K.; Abekoe, M.K.; Henriksen, S.W.; Andersen, M.N. Mechanism of orthophosphate (PO4-P) adsorption onto different biochars. Environ. Technol. Innov. 2020, 17, 100572. [Google Scholar] [CrossRef]
  54. Panhwar, Q.A.; Naher, U.A.; Shamshuddin, J.; Ismail, M.R. Effects of biochar and ground magnesium limestone application, with or without bio-Fertilizer addition, on biochemical properties of an acid sulfate soil and rice yield. Agronomy 2020, 10, 1100. [Google Scholar] [CrossRef]
  55. Islam, M.R.; Akter, A.; Hoque, M.A.; Farzana, S.; Uddin, S.; Talukder, M.M.H.; Alsanie, W.F.; Gaber, A.; Hossain, M.A. Lime and Organic Manure Amendment: A Potential Approach for Sustaining Crop Productivity of the T. Aman-Maize-Fallow Cropping Pattern in Acidic Piedmont Soils. Sustainability 2021, 13, 9808. [Google Scholar] [CrossRef]
  56. Islam, M.R.; Jahan, R.; Uddin, S.; Harine, I.J.; Hoque, M.A.; Hassan, S.; Hassan, M.M.; Hossain, M.A. Lime and Organic Manure Amendment Enhances Crop Productivity of Wheat–Mungbean–T. Aman Cropping Pattern in Acidic Piedmont Soils. Agronomy 2021, 11, 1595. [Google Scholar] [CrossRef]
  57. Dari, B.; Nair, V.D.; Harris, W.G.; Nair, P.K.R.; Sollenberger, L.; Mylavarapu, R. Relative influence of soil vs. biochar properties on soil phosphorus retention. Geoderma 2016, 280, 82–87. [Google Scholar] [CrossRef] [Green Version]
  58. Piash, M.I.; Iwabuchi, K.; Itoh, T.; Uemura, K. Release of essential plant nutrients from manure and wood-based biochars. Geoderma 2021, 397, 115100. [Google Scholar] [CrossRef]
  59. Pandit, N.R.; Mulder, J.; Hale, S.E.; Martinsen, V.; Schmidt, H.P.; Cornelissen, G. Biochar improves maize growth by alleviation of nutrient stress in a moderately acidic low-input Nepalese soil. Sci. Total Environ. 2018, 625, 1380–1389. [Google Scholar] [CrossRef]
  60. Rabileh, M.A.; Shamshuddin, J.; Panhwar, Q.A.; Rosenani, A.B.; Anuar, A.R. Effects of biochar and/or dolomitic limestone application on the properties of Ultisol cropped to maize under glasshouse conditions. Can. J. Soil Sci. 2015, 95, 37–47. [Google Scholar] [CrossRef]
  61. Mia, S.; Dijkstra, F.; Singh, B. Long-term aging of biochar: A molecular understanding with agricultural and environmental implications. Adv. Agron. 2017, 141, 1–51. [Google Scholar] [CrossRef]
  62. Cheng, C.H.; Lehmann, J.; Thies, J.E.; Burton, S.D.; Engelhard, M.H. Oxidation of black carbon by biotic and abiotic processes. Org. Geochem. 2006, 37, 1477–1488. [Google Scholar] [CrossRef]
  63. Shetty, R.; Vidya, C.S.N.; Prakash, N.B.; Lux, A.; Vaculík, M. Aluminum toxicity in plants and its possible mitigation in acid soils by biochar: A review. Sci. Total Environ. 2021, 765, 142744. [Google Scholar] [CrossRef]
  64. Ch’ng, H.Y.; Ahmed, O.H.; Majid, N.M.A.; Jalloh, M.B. Improving soil phosphorus availability and yield of Zea mays L. using biochar and compost derived from agro-industrial waste. Ital. J. Agron. 2019, 14, 1107. [Google Scholar] [CrossRef] [Green Version]
  65. Sasmita, K.D.; Iswandi, A.; Syaiful, A.; Sudirman, Y.; Gunawan, D. Application of biochar and organic fertilizer on acid soil as growing medium for Cacao (Theobroma cacao L.) seedlings. Int. J. Sci. Basic Appl. Res. 2017, 36, 261–273. [Google Scholar]
  66. Fageria, N.K.; Baligar, V.C. Ameliorating soil acidity of tropical Oxisols by liming for sustainable crop production. Adv. Agron. 2008, 99, 345–399. [Google Scholar] [CrossRef]
  67. Akinrinde, E.A. Strategies for improving crops’ use-effciencies of fertilizer nutrients in sustainable agricultural systems. Pak. J. Nutr. 2006, 5, 185–193. [Google Scholar] [CrossRef] [Green Version]
  68. Steiner, C.; Teixeira, W.G.; Lehmann, J.; Nehls, T.; Vasconcelos de Macêdo, J.L.; Blum, W.E.H.; Zech, W. Long-term effect of manure, charcoal and mineral fertilization on crop production and fertility on highly weathered central amazonian upland soil. Plant Soil 2007, 291, 275–290. [Google Scholar] [CrossRef] [Green Version]
  69. Ndor, E.; Jayeoba, J.O.; Asadu, C.L.A.; Iheshiulo, E.M.-A. Growth, nutrient uptake and dry matter yield of maize (Zea mays L.) grown in soil amended with rice husk and sawdust biochar. Int. J. Sci. Res. Agric. Sci. 2016, 3, 99–103. [Google Scholar] [CrossRef]
  70. Gandahi, A.W.; Baloch, F.B.; Sarki, M.S.; Gandahi, R.; Lashari, M.S. Impact of Rice Husk Biochar and Macronutrient Fertilizer on Fodder Maize and Soil Properties. Int. J. Biosci. 2015, 7, 12–21. [Google Scholar] [CrossRef]
  71. Nekesa, A.O.; Okaebo, J.R.; Otheno, C.O.; Thuita, M.N.; Kipsat, M.; Batiano, A.; Sanginga, N.; Kimettu, J.; Vanlauwe, B. The potential of Minjingu phosphate rock from Tanzania as a liming material: Effect on maize and bean intercrop on acid soils of western Kenya. Afr. Crop Sci. Conf. Proc. 2005, 7, 1121–1128. [Google Scholar]
  72. Liu, B.; Yue, Y.M.; Li, R.; Shen, W.J.; Wang, K.L. Plant leaf chlorophyll content retrieval based on a field imaging spectroscopy system. Sensors 2014, 14, 19910–19925. [Google Scholar] [CrossRef] [Green Version]
  73. Parthasarathi, T.; Vanitha, K.; Lakshamanakumar, P.; Kalaiyarasi, D. Aerobic rice-mitigating water stress for the future climate change. Int. J. Agron. Plant Prod. 2012, 3, 241–254. [Google Scholar]
  74. Anjum, S.A.; Xie, X.Y.; Wang, L.C.; Saleem, M.F.; Man, C.; Lei, W. Morphological, physiological and biochemical responses of plants to drought stress. Afr. J. Agric. Res. 2011, 6, 2026–2032. [Google Scholar] [CrossRef]
  75. Panhwar, Q.; Naher, U.; Radziah, O.; Shamshuddin, J.; Razi, I.M. Bio-fertilizer, ground magnesium limestone and basalt applications may improve chemical properties of Malaysian acid sulfate soils and rice growth. Pedosphere 2014, 24, 827–835. [Google Scholar] [CrossRef]
  76. Cao, Y.; Ma, Y.; Guo, D.; Wang, Q.; Wang, G. Chemical properties and microbial responses to biochar and compost amendments in the soil under continuous watermelon cropping. Plant Soil Environ. 2017, 63, 1–7. [Google Scholar] [CrossRef] [Green Version]
  77. Moreno-Cornejo, J.; Zornoza, R.; Faz, A. Carbon and nitrogen mineralization during decomposition of crop residues in a calcareous soil. Geoderma 2014, 230–231, 58–63. [Google Scholar] [CrossRef]
  78. El-Naggar, A.H.; Usman, A.R.A.; Al-Omran, A.; Yong, S.O.; Ahmad, M.; Al-Wabel, M.I. Carbon mineralization and nutrient availability in calcareous sandy soils amended with woody waste biochar. Chemosphere 2015, 138, 67–73. [Google Scholar] [CrossRef] [PubMed]
  79. Madiba, O.F.; Solaiman, Z.M.; Carson, J.K.; Murphy, D.V. Biochar increases availability and uptake of phosphorus to wheat under leaching conditions. Biol. Fertil. Soils 2016, 52, 439–446. [Google Scholar] [CrossRef]
  80. Islam, M.R.; Bilkis, S.; Hoque, T.S.; Uddin, S.; Jahiruddin, M.; Rahman, M.M.; Rahman, M.M.; Alhomrani, M.; Gaber, A.; Hossain, M.A. Mineralization of Farm Manures and Slurries for Successive Release of Carbon and Nitrogen in Incubated Soils Varying in Moisture Status under Controlled Laboratory Conditions. Agriculture 2021, 11, 846. [Google Scholar] [CrossRef]
  81. Reed, E.Y.; Chadwick, D.R.; Hill, P.W.; Jones, D.L. A critical comparison of the impact of biochar and wood ash on soil organic matter cycling and grassland productivity. Soil Biol. Biochem. 2017, 110, 134–142. [Google Scholar] [CrossRef] [Green Version]
  82. Ameloot, N.; Sleutel, S.; Case, S.D.C.; Alberti, G.; McNamara, N.P.; Zavalloni, C.; Vervisch, B.; DelleVedove, G.; De Neve, S. C mineralization and microbial activity in four biochar field experiments several years after incorporation. Soil Biol. Biochem. 2014, 78, 195–203. [Google Scholar] [CrossRef]
  83. Case, S.D.C.; Mcnamara, N.P.; Reay, D.S.; Whitaker, J. Can biochar reduce soil greenhouse gas emissions from a Miscanthus bioenergy crop? GCB Bioenergy 2014, 6, 76–89. [Google Scholar] [CrossRef] [Green Version]
  84. West, T.O.; McBride, A.C. The contribution of agricultural lime to carbon dioxide emissions in the United States: Dissolution, transport, and net emissions. Agric. Ecosyst. Environ. 2005, 108, 145–154. [Google Scholar] [CrossRef]
  85. Brassard, P.; Godbout, S.; Raghavan, V. Soil biochar amendment as a climate change mitigation tool: Key parameters and mechanisms involved. J. Environ. Manag. 2016, 181, 484–497. [Google Scholar] [CrossRef]
  86. Fang, Y.Y.; Singh, B.P.; Luo, Y.; Boersma, M.; Van Zwieten, L. Biochar carbon dynamics in physically separated fractions and microbial use efficiency in contrasting soils under temperate pastures. Soil Biol. Biochem. 2018, 116, 399–409. [Google Scholar] [CrossRef]
  87. Fang, Y.; Singh, B.P.; Singh, B. Temperature sensitivity of biochar and native carbon mineralization in biochar-amended soils. Agric. Ecosyst. Environ. 2014, 191, 158–167. [Google Scholar] [CrossRef]
Figure 1. Monthly average rainfall (mm), relative humidity (%), and daily minimum and maximum temperature (°C) during the experimental period (January to April 2021) at the Faculty of Agriculture, UPM’s experimental field area.
Sustainability 14 07418 g001
Figure 2. Soil reaction (pH) at the harvest of maize. The means with the same letters above the bars are not significantly different. The standard error of four replications is shown by bar errors.
Sustainability 14 07418 g002
Figure 3. Selected physiological indices of maize ((a) = chlorophyll content, (b) = photosynthetic rate, (c) = stomatal conductance, and (d) = transpiration rate). The means with the same letters above the bars are not significantly different. The standard error of four replications is shown by bar errors.
Sustainability 14 07418 g003aSustainability 14 07418 g003b
Figure 4. Flux emission of CO2 from the soil during the vegetation of maize. The standard error of four replications is shown by bar errors.
Sustainability 14 07418 g004
Figure 5. Cumulative soil CO2 flux emission from the soil during the vegetation of maize. The standard error of four replications is shown by bar errors.
Sustainability 14 07418 g005
Figure 6. Principal component analysis (PCA) of experimental variables determined under various rates of biochar, lime, and phosphorus. T1 = circle, T2 = triangle, T3 = diamond, T4 = square, and T5 = hexagon.
Sustainability 14 07418 g006
Table 1. Concentration of soil nutrients at harvest of maize.
TreatmentP
(mg kg−1)
K
(cmolc kg−1)
Ca
(cmolc kg−1)
Mg
(cmolc kg−1)
Al
(cmolc kg−1)
Fe
(mg kg−1)
Mn
(mg kg−1)
T14.37b ± 0.240.25b ± 0.0260.93c ± 0.0190.36c ± 0.0222.64a ± 0.019122.40a ± 1.712.54b ± 0.074
T26.89b ± 0.600.42b ± 0.0401.61b ± 0.0750.91b ± 0.0330.55b ± 0.03794.33b ± 1.782.86b ± 0.052
T317.11a ± 0.661.31a ± 0.0563.32a ± 0.0581.47a ± 0.0470.08c ± 0.01672.61c ± 2.344.84a ± 0.099
T416.22a ± 0.731.32a ± 0.0493.32a ± 0.0561.46a ± 0.0540.07c ± 0.01872.97c ± 1.464.81a ± 0.074
T515.39a ± 0.451.31a ± 0.0563.31a ± 0.0691.48a ± 0.0560.09c ± 0.01771.50c ± 2.254.84a ± 0.089
Means within the same column followed by the same letter are not significantly different at p ≤ 0.05; (Tukey’s HSD test). The column presents the mean values ± standard error.
Table 2. Plant and yield parameters of maize.
TreatmentPlant Height
(cm)
Stem Diameter
(cm)
Dry Biomass
(g)
Fresh Cob Weight
(g)
No. of Grain Cob−1Cob Length
(cm)
Cob Yield
(t ha−1)
T1190.30c ± 2.452.10c ± 0.02442.30c ± 1.61221.85c ± 2.17443c ± 3.4218.55c ± 0.42711.83c ± 0.116
T2216.48b ± 1.702.36b ± 0.02260.48b ± 1.03307.63b ± 4.00514b ± 3.2823.25b ± 0.47716.41b ± 0.213
T3233.85a ± 1.522.79a ± 0.01892.03a ± 1.55360.13a ± 2.13644a ± 3.9724.88a ± 0.24619.21a ± 0.114
T4232.05a ± 2.072.81a ± 0.01793.79a ± 1.43357.05a ± 3.27643a ± 3.3824.35ab ± 0.24719.04a ± 0.176
T5232.36a ± 2.632.80a ± 0.01790.71a ± 1.68357.50a ± 1.69635a ± 3.5924.23ab ± 0.23219.07a ± 0.091
Means within the same column followed by the same letter are not significantly different at p ≤ 0.05; (Tukey’s HSD test). The column presents the mean values ± standard error.
Table 3. Nutrient concentration by maize.
TreatmentN (%)P (%)K (%)Ca (%)Mg (%)
T10.29c ± 0.0040.085d ± 0.0060.106b ± 0.0040.135c ± 0.010.063b ± 0.009
T20.36b ± 0.0060.105c ± 0.0030.12b ± 0.0040.168b ± 0.0090.096a ± 0.005
T30.44a ± 0.0090.175a ± 0.0030.177a ± 0.0020.208a ± 0.0090.108a ± 0.009
T40.45a ± 0.0080.15b ± 0.0040.167a ± 0.0020.225a ± 0.0060.105a ± 0.006
T50.42a ± 0.0140.14b ± 0.0040.176a ± 0.0020.235a ± 0.0120.115a ± 0.006
Means within the same column followed by the same letter are not significantly different at p ≤ 0.05; (Tukey’s HSD test). The column presents the mean values ± standard error.
Table 4. Nutrient uptake and protein content by maize.
Total Uptake (kg ha−1)
TreatmentNPKCaMgProtein Content in Maize (%)
T134.15c ± 0.7410.07d ± 0.6612.54c ± 0.4415.96c ± 1.177.37c ± 0.961.81c ± 0.03
T259.72b ± 1.2117.39c ± 0.4719.39b ± 0.6027.50b ± 1.5315.97b ± 0.582.28b ± 0.04
T384.79a ± 1.5433.42a ± 0.5634.17a ± 0.8039.83a ± 1.4920.67ab ± 1.722.76a ± 0.05
T486.06a ± 1.0128.39b ± 0.4331.87a ± 0.9742.83a ± 1.1320.02ab ± 1.382.83a ± 0.04
T580.70a ± 2.7526.66b ± 0.7634.11a ± 0.5144.81a ± 2.3521.95a ± 1.242.65a ± 0.08
Means within the same column followed by the same letter are not significantly different at p ≤ 0.05; (Tukey’s HSD test). The column presents the mean values ± standard error.
Publisher’s Note: MDPI stays neutral with regard to jurisdictional claims in published maps and institutional affiliations.

