1. Introduction
Problems become priorities in the policy-making process when they are critical and can create a sense of urgency in the public eyes [
1]. A significant societal dilemma can gain the elites’ attention, turn into a potential focusing event (i.e., a harmful and uncommon event that gets the public and policy-makers’ attention in a focused geographical boundary), and subsequently an institutional plan [
2,
3]. However, a focusing event should be sudden, periodic, and harmful, revealing the possibility of more significant future harms, to become the center of public interest and policy-makers’ debates [
4]. Extreme events can produce a sense of urgency and become a focusing event, creating opportunities for essential policy reforms to address environmental problems overlooked in normal times [
5]. Thus, despite their imminent and high costs, extreme natural events can raise a sense of urgency and fear, leading to reduced disaster harm increased resilience of natural-human systems in the long run. Here, we empirically investigate whether extreme natural events—in the OECD countries—have led to the implementation of policy reforms and more stringent regulations to protect the environment. It is worth mentioning that extreme events can directly impact policies for managing and reducing the risk of disasters. Such risks can impact land use, socioeconomic conditions, governance, and environmental and natural resources. In this analysis, due to data limitation, we only focus on the environmental part. The supportive intuition is that if policymakers come to believe that the intensification of climate change and extreme events are due to the emissions from economic activities and fossil fuel energy consumption, they may impose stricter environmental policies to reduce emissions.
To examine the impact of natural events on environmental policies, we include a few relative elements that can influence environmental decisions. By doing so, we control their effects on environmental policies and, therefore, try to decrease the bias in our estimation. There is strong evidence linking institutional policies to energy efficiencies and reforms [
6,
7,
8], and the connections between economic activities and environmental pollution due to energy usage have been already established [
9]. Another crucial factor is technology. Higher levels of development and technological innovations raise environmental awareness, leading to more environmentally-friendly policies, changing the economy’s composition towards more information-intensive services, which reduce environmental degradation [
1,
10].
On the other hand, to promote and facilitate environmental innovations, one needs more stringent green policies [
11,
12]. Horbach et al. [
13] believe that eco-innovation can improve environmental performance by increasing material efficiency and reducing energy and waste consumption. They conclude that government policies are the primary motivational elements for the firms to follow that direction.
This analysis explores whether extreme natural events have urged policymakers to shape and redirect the environmental regulations and standards during the past decades by imposing more stringent environmental policies. It is specifically challenging for the politicians with limited access to resources and concerns about getting reelected to focus on critical long-term problems that the public does not recognize as urgent during their political terms [
14]. The current crisis brought by COVID-19—which wiped out more than six million lives [
15]—is a fitting example of how we redistribute the resources toward the challenge with the highest relative importance and urgency. Extreme environmental phenomena are among the problems that require urgent attention. While people may value sustainable development and environmental conservation for future generations, they generally care more about their current economic and living conditions and basic needs such as income, employment, and housing [
16]. Even though allocating resources to deal with extreme natural phenomena is recognized as a critical planning action, policymakers do not consistently allocate much effort and resources to mitigating and adapting to such extreme events, unless they pose high costs (such as casualties) and turn into an urgent issue. This is more evident in weaker economies that struggle with addressing their people’s basic needs [
17].
In the first step, we discuss a conceptual model structurally linking extreme events to the environmental policies and economic factors. Our proposed conceptual model—a causal loop diagram—can explain the plausible relationships among the main study variables and their causal flows. We apply the empirical model, a fixed effect panel analysis, to identify the impact of extreme climatic event—such as storms, floods, total number of events, and death rates—on the environmental policy reforms in 38 OECD countries.
2. Methods
2.1. Conceptual Model
Environmental policies are essential to establish and maintain a healthy interaction between humans and nature. First, we discuss a conceptual model that can explain the causal flow from extreme natural events to the environmental policies, including the side effects of the primary components, which play a vital role in shaping these policies.
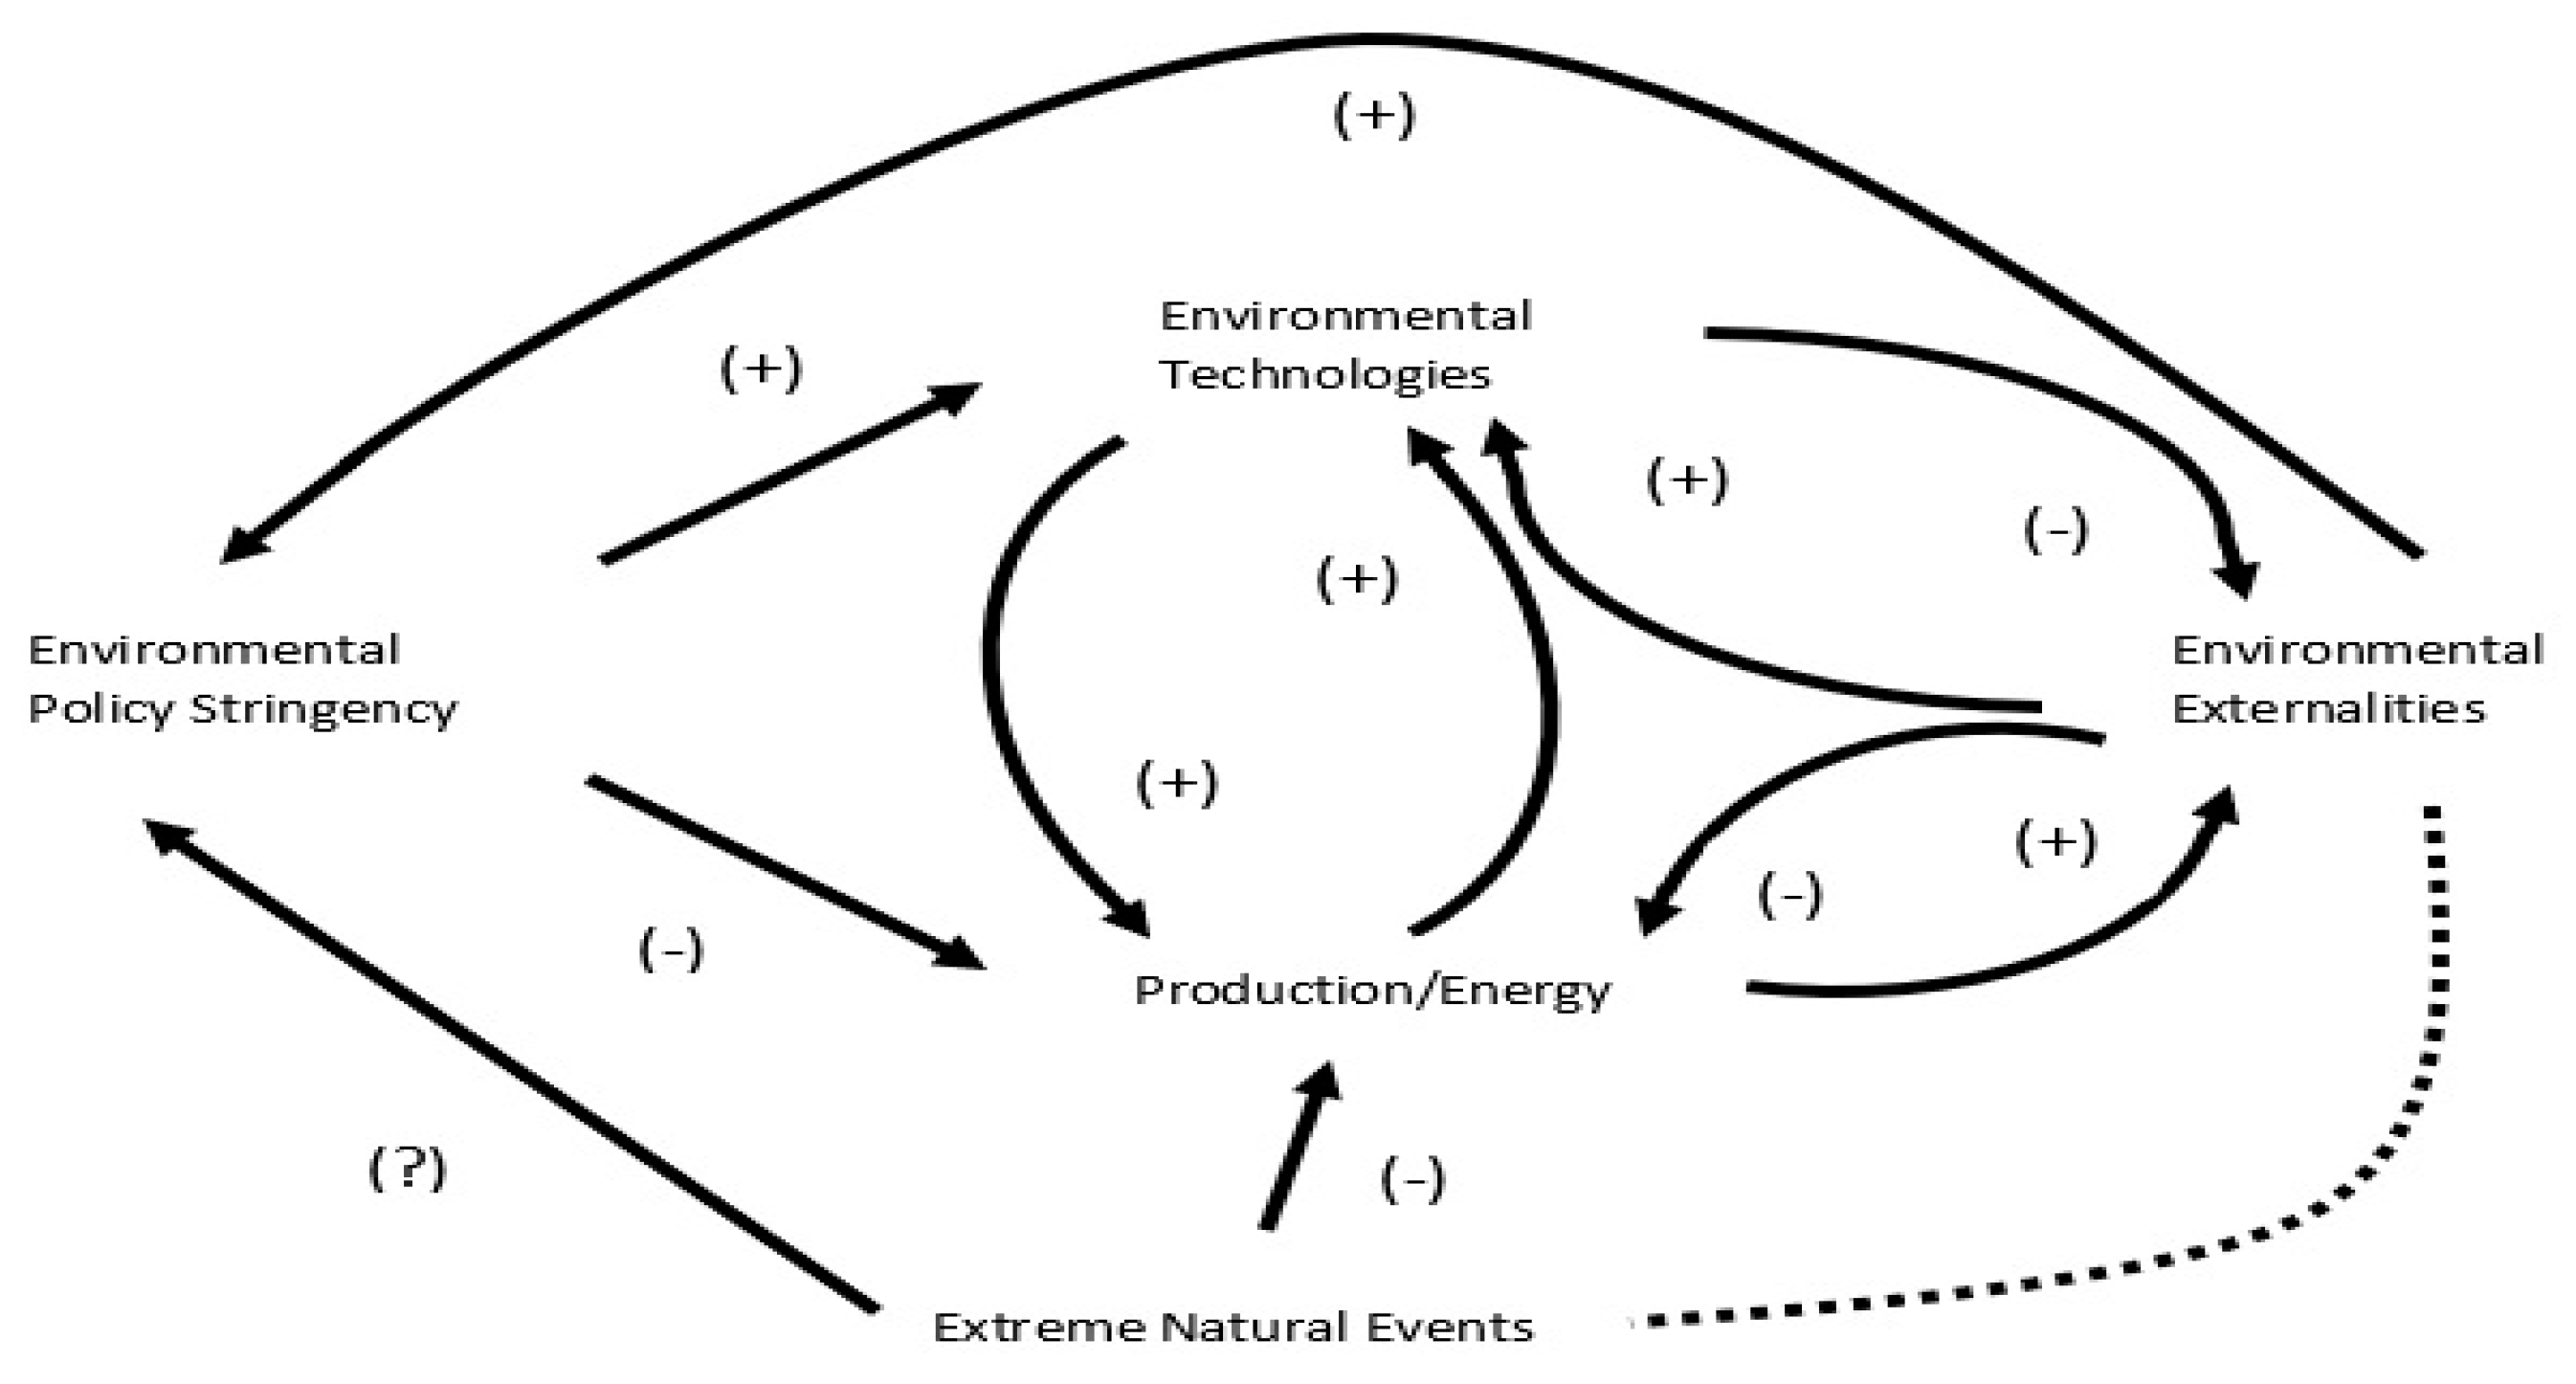
Figure 1 summarizes the general overview of an intuitive flow diagram. We portray that the environmental policies can affect negative externalities via two channels (For simplicity, here, we only consider air pollution and waste generation as examples); First, by incentivizing the improvement of environmental technologies, which could diminish environmental degradation; second, by limiting the total production that uses existing resources (by raising the costs), restricting the externalities. Besides, there are four different internal loops in this causal illustration.
The first is the reinforcing loop between environmental technologies and the production process. Technology can enhance productivity in general, and investment is needed to develop new technology; and the investment itself is a function of income, thus, production. We have two balancing loops. The first one is between environmental technologies and environmental externalities. Environmentally friendly technologies decrease carbon emission and waste production. These externalities, accompanied by enforcement regulation, can motivate firms to develop new technologies. The other balancing loop connects production and negative externalities. The production process, in general, can degrade the environment (or at least create a tradeoff by generating wastes and greenhouse gas emissions). However, when the environment gets contaminated, it makes land less fertile and recreational sites less desirable. Therefore, it decreases productivity and, thus, GDP and income level. The last reinforcing loop is between three elements. Rising externalities incentivize new technologies (and the discovery of new resources), boosting production.
There exists a reverse causality between environmental policies and the environmental externalities. As the environment becomes polluted, policymakers are motivated to impose more stringent environmental standards to mitigate it and reduce its side effects—such as health implications. Extreme natural events (that can induce disasters) are external and independent phenomena that give us an unbiased explanation of the policy changes in the empirical section. To establish a clear identification for the analysis, we need to control the primary elements that impact environmental policy. There is an unclear link between human-made externalities and natural phenomena (as shown in
Figure 1). However, we can still rely on extreme event as the only exogenous phenomenon in this model. It must be noted that the primary objective of this analysis is to examine if extreme events have motivated policy makers to make enforce more stringent environmental regulations. So, this analysis does not whether the extreme events were driven by anthropogenic or natural climatic changes.
The sole purpose of this illustration is to highlight the potential connections among the societal-environmental-economic variables. However, we do not seek to present all these linkages in our exploratory analysis. Instead, we aim to justify the urgency for controlling and including these elements in the empirical section.
2.2. Data
We use the OECD database to collect the annual data for 38 countries on carbon emissions and total waste production as environmental externalities. We also utilize the data on GDP as proxy for production, total patents, environmental patents, Environmental Policy Stringency Index (EPS) as a proxy for environmental policies, and total energy consumption, all retrieved from the OECD website. EPS is a degree to which environmental policies put an implicit or explicit price on environmentally harmful behavior such as pollution. This index is aggregated using both market-based and non-market-based approaches, equally-weighted; procedures such as taxation (on pollutants), trading schemes (on CO2 and renewable energies), R&D subsidies (on renewable energies), and standards (emission/contamination limits). Even though most of these policies are pollution-related, they directly impact fossil fuel-based energy consumption, which is known as the primary drivers of climate change.
The study period is 1990 to 2017. We collected and merged the data for the extreme climatic extreme events from the international disaster database. Since the information on field patents have been available since 2008, we replaced environmental patents with the total number of patents as a proxy to increase the number of observations and analysis power.
2.3. Empirical Model
This study’s central question is to verify if the natural events induce policymakers to set and impose stricter environmental restrictions on the economic activities to mitigate the environmental externalities that can exacerbate the impact or raise the frequency of the extreme climatic/natural events. We can take advantage of the number of natural events that happened in the past years to study whether policymakers have become more stringent on environmental standards or not. It should be noted that the delicate connection between environmental externalities and natural events has been neglected in this research. We want to detect whether these phenomena have affected environmental regulations in the studied countries. We constructed the following base model for the start:
In this model, are the country and time fixed effects. Fixed effect models allow us to control the countries’ unobservable and hidden characteristics and structural differences among the studied countries. Suppose country A has an incompatible and unique attribute compared to country B, and that feature is hidden in the dataset. In that case, a fixed dummy variable is created (across the studied years) and added to the model to control such heterogeneity. EV is an extreme natural event variable in each analysis. In total, we analyze four independent variables: total death caused by the extreme event, the cumulative number of incidents, total number of storms, and floods.
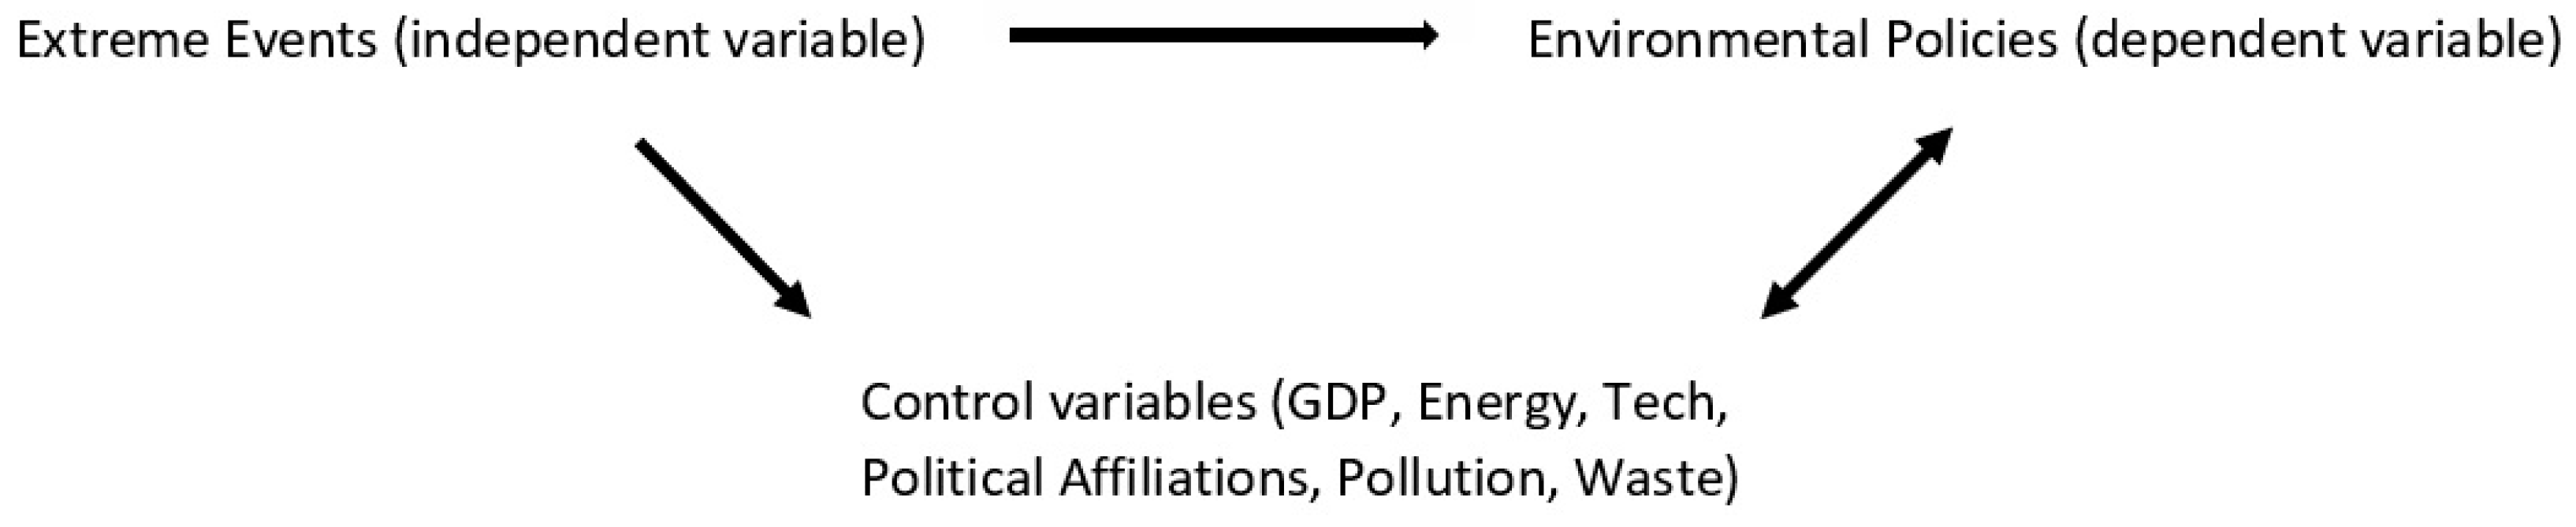
Xijts are the covariates/mechanisms controlled for such as countries’ production level (GDP), energy use, number of patents, total population, political affiliation, and environmental externalities (air pollution and waste generation). Including the control variables is solely to reduce the omitted variable’s bias in this analysis. We do not seek to estimate the impact of such variables on each other, as we illustrated in
Figure 1, but only show the utility of adding them to our estimation to capture the impact of EV (extreme natural events) on EPS (environmental policy stringency).
Figure 2 shows the basis of the econometrics model used here.
The figure above shows the relationship of different variables of the empirical model. This setup includes control variables to reduce the biases due to omitted variables. Still, capturing their exact impacts is not the purpose of this study and requires a separate investigation and answering different questions than we are looking for in this brief analysis. EPS is the index for environmental policy stringency that shows how strict the countries implement environmental policies. After testing different models and criteria to calibrate the model estimation (such as the Dickey-Fuller unit root test, autocorrelations, partial autocorrelations tests, Ng-Perron, minimum of MC and MAIC criteria, and analysis of the model using different time series functional forms), we use the first difference and the lag of the variables to make the analysis stationary and take care of autocorrelations since the analyzed data is in form of time series. However, we use the second lag only for GDP because of the high correlation of this variable with its previous values.
3. Results
Table 1 summarizes the main analysis results. Column one shows the impact of death, caused by extreme events, on the environmental stringency index. When this number rises, countries impose more rigid environmental standards. Based on this index, for every 10,000 deaths (the death rates range between 1 to 166,000) brought by the complications due to extreme events, the index value increases by almost half a percent on average. In the dataset, the death rates are normalized to 10,000. Thus, when this coefficient increases by one (death rates increase by 10,000), the EPS index increases by 0.02. EPS ranges between 0.2 to 4.1. So, 0.02 translates to half a percent. The second column shows the effect of the total number of major disasters, including drought, flood, storm, tornado, and wildfire, regardless of their severity, on the EPS index. Even though the impact is not statistically significant, its magnitude is positive. Columns three and four show the effect of floods and storms on the index.
Table 2 shows the results of the same analysis when the non-European OECD countries were excluded. The results in this Table are in line with the idea that policymakers are forced to step in only when the threat becomes tangible by killing humans. Without a death toll, much action cannot be expected even when the increase if the frequency of extreme events is clear.
4. Discussion
Our observation is in line with Scanlon et al.’s [
18], argument that policymakers should take an all-hazard plan for dealing with mass death. Their analysis suggests that regardless of the cause of mass death (i.e., disaster, catastrophe, or pandemic) all public agencies need to coordinate to address the mass death crisis. In a recent study, Nohrstedt et al. [
19] showed no meaningful association between the frequency of natural hazard events and disaster reduction risk policies. It is essential to point out that during their research period (2007 to 2015) most countries prioritized their focus on addressing the financial crisis, undermining the environmental issues. Their analysis included 85 developed and underdeveloped countries with diverse disaster response strategies, including those which acted progressively and those that were hesitant to develop new environmental policies that could affect economic progress in the short term. When the heterogeneity in the socio-economic conditions of the countries increases, finding a common behavioral trend in policy actions could be harder.
When we repeated the analysis with the OCED countries in Europe, we got the same results (
Table 2). But since the number of observations dropped, the policy reaction to the death rates due to climatic extreme events become stricter by 25% with an increased confidence level. This shows that the European countries, compared to other OECD countries in our dataset, are more responsive to climatic events and waste generation, Our analysis results also suggest that as waste generations escalate in the European countries, governments impose stricter environmental standards (this is not the case for air pollution). However, this effect is not statistically significant. Countries’ aggregate energy use levels appear to have negative influences, but not substantial, on the environmental policy index, suggesting nations may prioritize affordable energy choices over environmental protection.
We also conducted an overfitting test which showed 20% overfitting. We used cross-validation (focusing only on European countries) and tested different modeling features (GLM, other control functions) to check the validity of the results. Accordingly,
Table 3 shows the robustness check results for more functional forms and GLM estimation validating our initial claim. Under extended scenarios, we can see that the leading coefficient (death rates impact) remains the same. The GLM-panel model gives us much higher confidence (at 99%), confirming that increasing death rates lead to more rigorous environmental policies. In addition, we perform a selection test to measure the impact of unobserved variables on the primary coefficient of this study, proposed by Altonji et al. [
20]. The results are shown in
Table 4.
Table 4 shows when all the control variables are added to the model, the R-square changes much more than the coefficient. This indicates that if we had all the omitted variables, still the impact of death rates on the EPS would not be zero, which gives us more certainty about the existing relationship between extreme events and environmental policies. An absolute value of delta (in
Table 4) greater than 1, would have implied a significant impact [
21].
5. Conclusions
This primary intention of this basic analysis was to explore whether environmental policies have been affected by rising extreme natural events. More stringent actions can mitigate carbon emission and waste generation—which negatively impact life on the Earth. First, we developed a conceptual model that explains the potential relationships among the study’s primary elements in a causal loop diagram. Using the panel fixed-effect model, we took advantage of the available data to perform a basic statistical analysis testing such a hypothesis in the next step. This abstract analysis aimed to initially validate the existence of such a relationship, not precisely measuring the point estimate between extreme events and environmental policies. We pointed out that imposing more strict environmental policies can reduce growth in the short run while simultaneously diminishing pollution and waste production, paving the way for green production (a more circular economy) and environmental protection in the long run More strict environmental regulations also incentivize investments in green innovation to increase less environmentally harmful production creating a more healthy balance between human activities and the environment.
Our preliminary results suggest that policymakers in more economically advanced nations have a stronger tendency to implement environmental reforms. But these reforms are implemented only when human lives are in imminent danger and the threat is undeniable, not as the result of increased extreme events. In other words, what incentivizes and justifies news decisions is the number of people being killed by extreme events, not the increase in the frequency of extreme events. This is discouraging as unless people are not killed or seriously affected, change of business-as-usual and reforms are unlikely. This means that what kills some of us, makes the rest of us stronger!
Governments’ reactive (as opposed to proactive) environmental decision-making is due to the trade-off between enhancing the environment and the short-term economic costs such as unemployment. Yet, science suggests that enhancing environmental quality and improving the economy are possible with the right compromise and creating harmony between humans and nature. As an example, stricter regulation on waste segregation can induce composting. Composting decreases greenhouse gases, replaces chemical fertilizer (leading to less soil and water contamination), and creates more jobs versus buried or burned approaches: one stone and two birds. In the end, investing in (environmental) innovation/patents reduce the political cost for the legislators to impose more strict environmental policies since new inventions increase productivity, offsetting the possible burden imposed on economic activities due to such policies.


