
Measuring Urban Sustainability over Time at National and Regional Scale for Addressing United Nations Sustainable Development Goal (SDG) 11: Iran and Tehran as Case Studies


Abstract
:1. Introduction
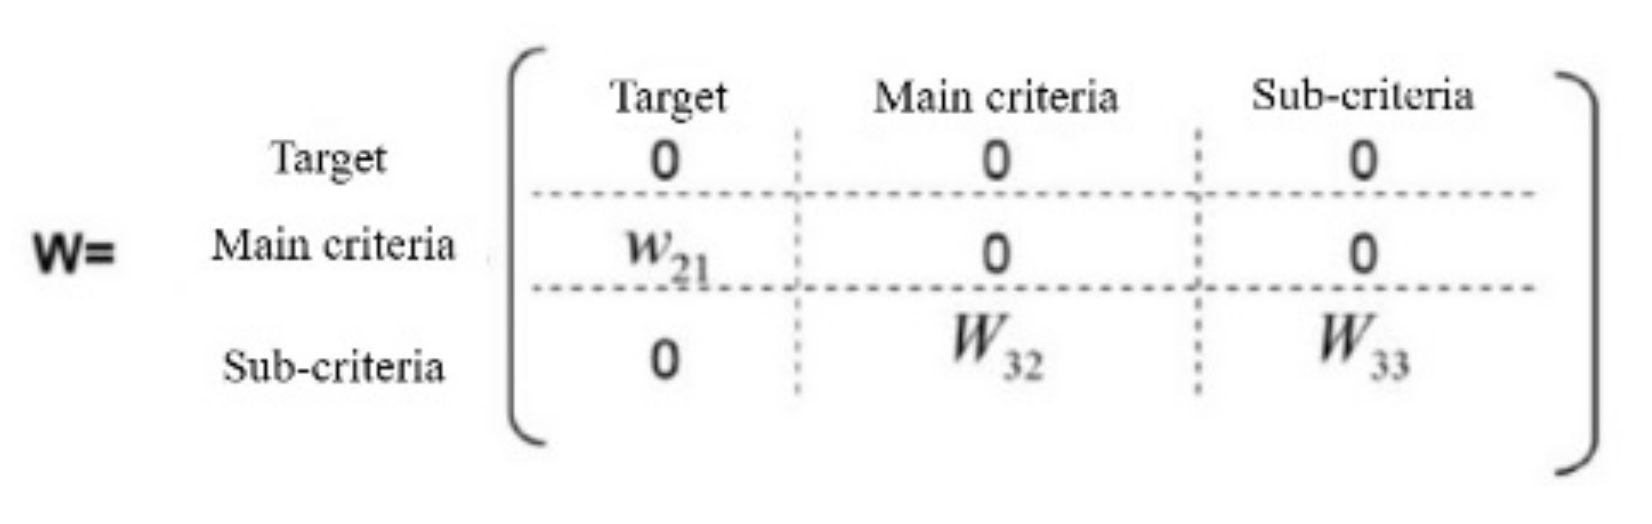
2. Materials and Methods
3. Results
4. Discussion and Conclusions
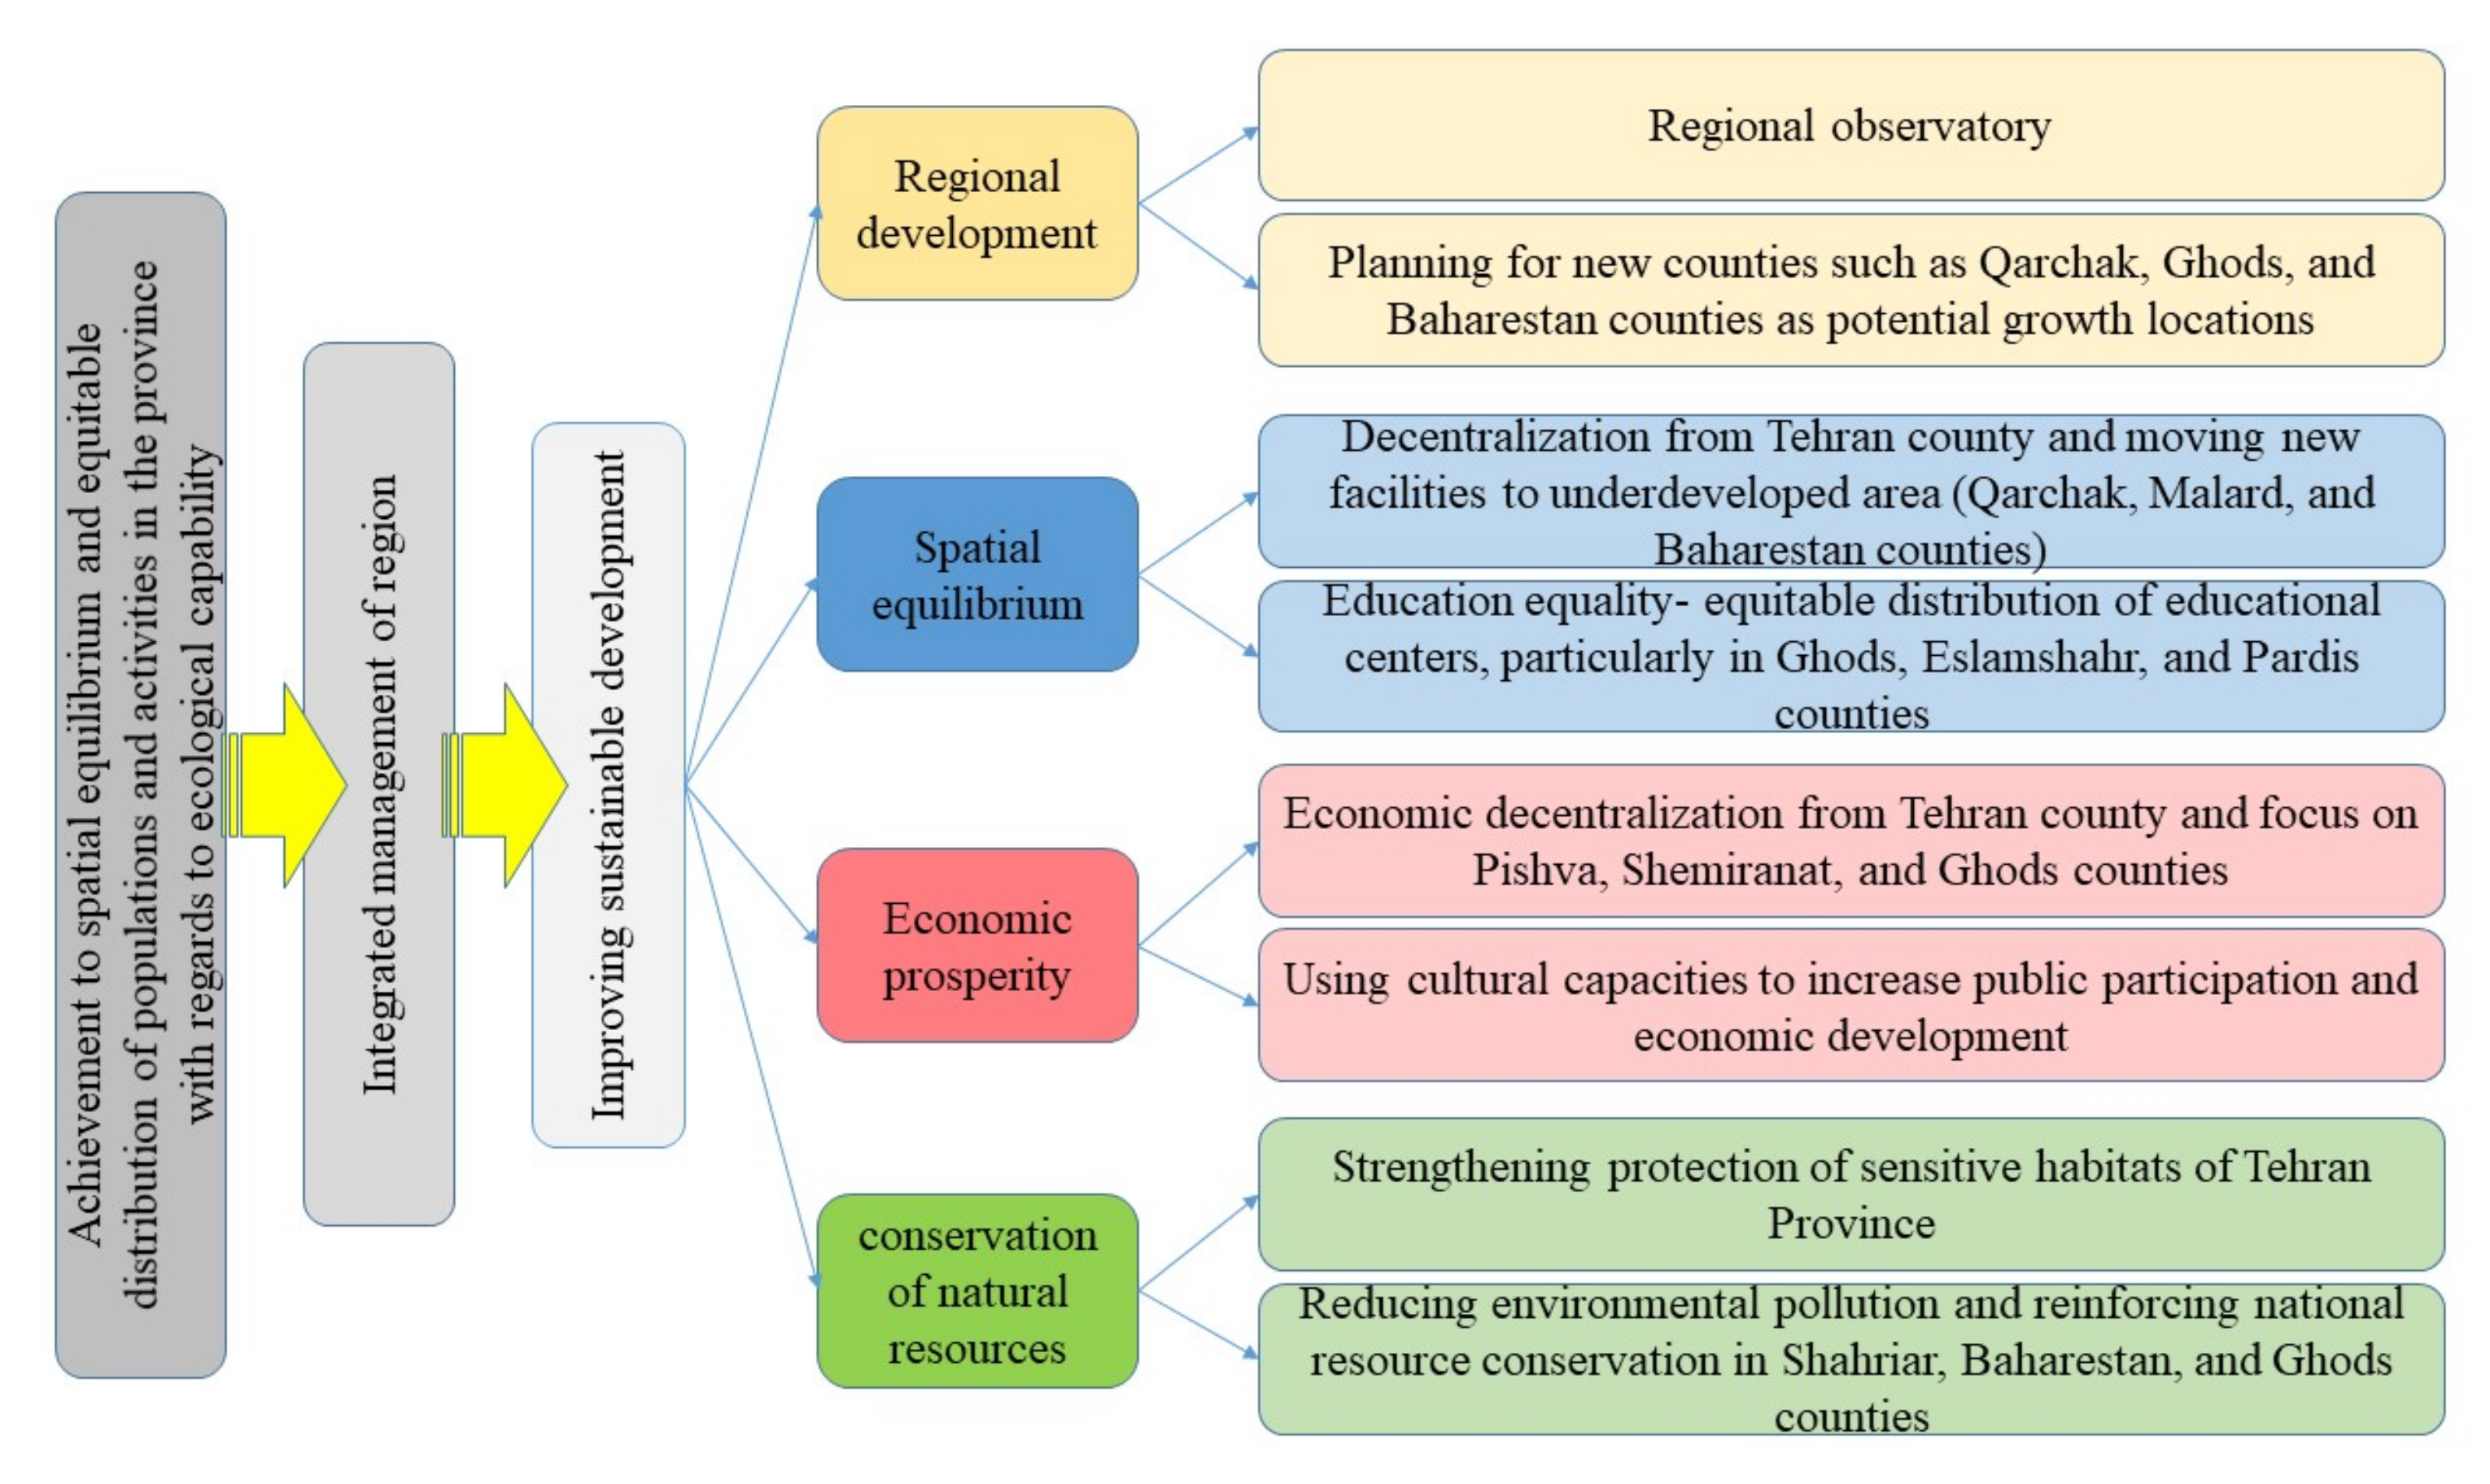
Guidelines and Policies to Promote Sustainability in Tehran Province
- Regional observatory;
- Planning for new counties such as Qarchak, Ghods, and Baharestan counties as potential growth locations;
- Reducing environmental pollution and reinforcing national resource conservation in Shahriar, Baharestan, and Ghods counties;
- Economic decentralization from Tehran County and focus on Pishva, Shemiranat, and Ghods counties;
- Decentralization from Tehran County and moving new facilities to underdeveloped areas (Qarchak, Malard, and Baharestan counties);
- Strengthening the protection of sensitive habitats of Tehran Province;
- Using cultural capacities to increase public participation and economic development;
- Education equality—equitable distribution of educational centers, particularly in Ghods, Eslamshahr, and Pardis counties.
Author Contributions
Funding
Institutional Review Board Statement
Informed Consent Statement
Data Availability Statement
Conflicts of Interest
References
- Firoozi, M.; Dehcheshme, M.; Chelcheleh, S. Studying the Inequality of Region in Khuzestan Province. Geogr. Reg. Dev. 2017, 29, 217–240. [Google Scholar]
- Pawłowski, A. How Many Dimensions Does Sustainable Development Have? Sustain. Dev. 2007, 16, 81–90. Available online: www.interscience.wiley.com (accessed on 2 February 2020). [CrossRef]
- Dehcheshme, M.; Alizadeh, M. Measurement of Sustainable Development Indices in the West Azerbaijan Province by Exploiting The Model of Detection and Fuzzy Indicators. Reg. Econ. Dev. 2014, 7, 52–76. [Google Scholar]
- Barrett, B. Environmentalism in periods of rapid societal transformation: The legacy of the Industrial Revolution in the United Kingdom and the Meiji Restoration in Japan. Sustain. Dev. 1999, 7, 178–190. [Google Scholar] [CrossRef]
- Nazmfar, H.; Hamidi, S.M.; Akbari, M. Studying The Inequality of Development in The Province in Order to Achieve Sustainable Development. Congr. Strategy Q. 2017, 94, 298–339. [Google Scholar]
- Nijman, J.N.; Wei, Y.D. Urban inequalities in the 21st century economy. Appl. Geogr. 2020, 117, 102188. [Google Scholar] [CrossRef]
- Massey, D.; Amin, A.; Thrift, N. Decentering the Nation: A Radical Approach to Regional Inequality; Catalyst: London, UK, 2003. [Google Scholar]
- Zebardast, E.; Haghroosta, S. Comparative Analysis of Regional Disparities Between Provinces, The Case Study: Hamedan and Markazi provinces. Q. Rev. Art 2014. Available online: http://Journal.art.ac.ir (accessed on 2 February 2020).
- Rezende, J.; Sinay, M. Methodology for leading indicators on sustainable regional development. Rev. Adm. Pública 2016, 50, 395–423. [Google Scholar] [CrossRef]
- Meyer, L.; Pölzler, T. Basic Needs and Sufficiency: The Foundations of Intergenerational Justice. In The Oxford Handbook of Intergenerational Ethics; Oxford University Press: Oxford, UK, 2020. [Google Scholar]
- Hudrlikova, L.; Kramulova, J.; Zeman, J. Measuring Sustainable Development at the Lower Regional Level in the Czech Republic based on Composite Indicators. Reg. Stat. 2013, 3, 117–140. [Google Scholar] [CrossRef]
- Omrani, H.; Valipour, M.; Emrouznejad, A. Using Weighted Goal Programming Model for Planning Regional Sustainable Development to Optimal Workforce Allocation: An Application for Provinces of Iran. Soc. Indic. Res. 2019, 141, 1007–1035. [Google Scholar] [CrossRef] [Green Version]
- Mederly, P.; Novacek, P.; Topercer, J. Sustainable development assessment: Quality and sustainability of life indicators at global, national and regional level. Foresight 2003, 5, 42–49. [Google Scholar] [CrossRef]
- Shi, Y.; Ge, X.; Yuan, X.; Wang, Q.; Kellett, J.; Li, F.; Ba, K. An Integrated Indicator System and Evaluation Model for Regional Sustainable Development. Sustainability 2019, 11, 2183. [Google Scholar] [CrossRef] [Green Version]
- Wang, X.; Gao, P.; Song, C.; Cheng, C. Use of Entropy in Developing SDG-based Indices for Assessing Regional Sustainable Development: A Provincial Case Study of China. Entropy 2020, 22, 406. [Google Scholar] [CrossRef] [PubMed] [Green Version]
- Fearnside, P. Sustainable Challenges for sustainable development in Brazilian Amazonia. Sustain. Dev. 2019; in press. [Google Scholar] [CrossRef]
- Oral, H. Sustainable Development. In The Palgrave Encyclopedia of Global Security Studies; Springer Nature: Geneva, Switzerland, 2020. [Google Scholar]
- Chen, S.; Huang, Q.; Liu, Z.; Meng, S.; Yin, D.; Zhu, L.; He, C. Assessing the Regional Sustainability of the Beijing-Tianjin-Hebei Urban Agglomeration from 2000 to 2015. Sustainability 2019, 11, 3160. [Google Scholar] [CrossRef] [Green Version]
- Jovovic, R.; Draskovic, M.; Delibasic, M.; Jovovic, M. Thr concept of sustainable regional development—Institutional aspects, policies and prospects. J. Int. Stud. 2017, 10, 255–266. [Google Scholar] [CrossRef] [Green Version]
- Rahma, H.; Fauzi, A.; Juanda, B.; Widjojanto, B. Development of a Composite Measure of Regional Sustainable Development in Indonesia. Sustainability 2019, 11, 5861. [Google Scholar] [CrossRef] [Green Version]
- Abdollahzadeh, G.; Sharifzadeh, A. Regional development in Iran. Urban Reg. Stud. 2012, 13, 41–62. [Google Scholar]
- Roberts, P. Evaluating regional sustainable development: Approaches, methods and the politics of analysis. J. Environ. Plan. Manag. 2007, 49, 515–532. [Google Scholar] [CrossRef]
- Soares, J.; Marques, M.; Monteiro, C. A multivariate methodology to uncover regional disparities: A contribution to improve European Union and governmental decisions. Eur. J. Oper. Res. 2001, 145, 121–135. [Google Scholar] [CrossRef]
- Theodoropoulou, H.; Mitoula, R.; Vamvakari, M. Sustainable Regional Development. J. Soc. Sci. 2009, 5, 80–84. [Google Scholar]
- Dehcheshmeh, M.; Alizadeh, H. Assessing regional sustainable development in the West Azarbaijan county. J. Reg. Dev. Econ. 2014, 7, 51–76. [Google Scholar]
- Mabudi, M.; Hakimi, H. Evaluating uneven regional development in South East of Iran (Case study: Sistan province). Dev. Strateg. 2015, 48, 103–121. [Google Scholar]
- Tret’yakova, E.A.; Osipova, M. Evaluation of Sustainable Development Indicators for Regions of Russia. Stud. Russ. Econ. Dev. 2018, 29, 124–134. [Google Scholar] [CrossRef]
- Mally, K. Rgional differences in SLOVENIA from the viewpoint of achieving Europiae’s sustainable development. Acta Geogr. Slov. 2018, 58, 31–46. [Google Scholar]
- Farinha, F.; Oliveira, M.J.; Silva, E.M.J.; Lança, R.; Pinheiro, M.D.; Miguel, C. Selection Process of Sustainable Indicators for the Algarve Region—OBSERVE Project. Sustainability 2019, 11, 444. [Google Scholar] [CrossRef] [Green Version]
- Garoui, N.; Mohamed, E.B. Sustainable Development. Agrociaencia 2020, 54. Available online: https://www.researchgate.net/publication/339096590_Sustainable_Development (accessed on 26 April 2022).
- Sueyoshi, T.; Du, Z.; Wang, D. Regional Sustainable Development with Environmental Performance: Measuring Growth Indexes on Chinese Provinces. Energies 2020, 13, 2047. [Google Scholar] [CrossRef] [Green Version]
- Xu, Z.; Chau, S.N.; Chen, X.; Zhang, J.; Li, Y.; Dietz, T.; Wang, J.; Winkler, J.A.; Fan, F.; Huang, B.; et al. Assessing progress towards sustainable development over space and time. Nature 2020, 577, 74–78. [Google Scholar] [CrossRef]
- UNDP. Human Development Report 1990: Concept and Measurement of Human Development; United Nations Development Programme: New York, NY, USA, 1990. [Google Scholar]
- Center for International Earth Science Information Network. Environmental Sustainability Index 2006; Columbia University: New York, NY, USA, 2006. [Google Scholar]
- Center for Global Development. The Commitment to Development Index; Center for Global Development: Washington, DC, USA, 2006. [Google Scholar]
- Cobb, C. The Index of Sustainable Economic Welfare. In For the Common Good; Daly, H.E., Cobb, J.B., Eds.; Beacon Press: Boston, MA, USA, 1989; pp. 401–455. [Google Scholar]
- Wackernagel, M.; Rees, W. Our Ecological Footprint: Reducing Human Impact on the Earth; New Society Publishers: Gabriola Island, BC, Canada, 1995. [Google Scholar]
- United Nation. The Millennium Development Goals Report; United Nation: New York, NY, USA, 2005. [Google Scholar]
- United Nation. CSD Indicators of Sustainable Development; United Nation: New York, NY, USA, 2007. [Google Scholar]
- United Nation. Sustainable Development Goals and Policy of the Agenda 2030; United Nation: New York, NY, USA, 2015. [Google Scholar]
- Van de Kerk, G.; Manuel, A.R. A comprehensive index for a sustainable society: The SSI—The Sustainable Society Index. Ecol. Econ. 2008, 66, 228–242. [Google Scholar] [CrossRef]
- Gallego-Álvarez, I.; Galindo-Villardón, M.P.; Rodríguez-Rosa, M. Analysis of the Sustainable Society Index Worldwide: A Study from the Biplot Perspectiv; Springer: Berlin/Heidelberg, Germany, 2014; pp. 31–65. [Google Scholar]
- Census Data. Statistic Center of Iran. 2006, 2011 and 2016. Available online: https://www.amar.org.ir/ (accessed on 1 May 2020).
- Zebardast, E. Constructing a social vulnerability index to earthquake hazards using a hybrid factor analysis and analytic network process (F’ANP) model. Nat. Hazards 2012, 65, 1331–1359. [Google Scholar] [CrossRef]
- Hamidi, S.M.; Sobhani, S. Sustainable development in middle-east with focus on Iran. Spat. Geogr. 2016, 4, 99–114. [Google Scholar]
- Yasori, M.; Sojodi, M. Regional Development Strategy for Equitable Regional Development (Case study: Rasht city). Reg. Dev. 2018, 29, 93–106. [Google Scholar]
- Touratier-Muller, N.; Jaussaud, J. Development of Road Freight Transport Indicators Focused on Sustainability to Assist Shippers: An Analysis Conducted in France through the FRET 21 Programme. Sustainability 2021, 13, 9641. [Google Scholar] [CrossRef]
- Dingil, A.E.; Schweizer, J.; Rupi, F.; Stasiskiene, Z. Transport indicator analysis and comparison of 151 urban areas, based on open source data. Eur. Transp. Res. Rev. 2018, 10, 58. [Google Scholar] [CrossRef] [Green Version]
- Sangachin, F.; Asadi, R. Principles, goals and indicators of sustainable development. Deputy Economic Affairs and Plan Co-ordination of Planning and Budget Planning. Spat. Plan. Environ. 2017, 23, 52–78. [Google Scholar]
- Zarabi, A.; Izadi, M. Analysis of regional development of Iran’s regions. Spat. Plan. 2013, 1, 101–116. [Google Scholar]
- Kirk, K.; Tableporter, J.; Senn, A.; Day, J.; Cao, J.; Fan, Y.; Slotterback, C.; Goetz, E. Framework for Measuring Sustainable Regional Development for the Twin Cities Region. In The McKnight Foundation by the Center for Urban and Regional Affairs and the Center for Transportation Studies; Center for Transportation Studies: Minneapolis, MN, USA, 2010. [Google Scholar]
- Karimi Moghari, Z.; Barati, J. Evaluating regional uneven development of Iran’s provinces. Econ. Growth 2017, 26, 49–70. [Google Scholar]
- Wright, B. Care in the Country: A Historical Case Study of Long-Term Sustainability in 4 Rural Health Centers. Am. J. Public Health 2009, 99, 1612–1618. [Google Scholar] [CrossRef]
- De Wit, L.; Putman, K.; Dejaeger, E.; Baert, I.; Berman, P.; Bogaerts, K.; Brinkmann, N.; Connell, L.; Feys, H.; Jenni, W.; et al. Use of time by stroke patients: A comparison of four European rehabilitation centers. Stroke 2005, 36, 1977–1983. [Google Scholar] [CrossRef] [Green Version]
- Favez, L.; Zúñiga, F.; Sharma, N.; Blatter, C.; Simon, M. Assessing Nursing Homes Quality Indicators’ Between-Provider Variability and Reliability: A Cross-Sectional Study Using ICCs and Rankability. Int. J. Environ. Res. Public Health 2020, 17, 9249. [Google Scholar] [CrossRef] [PubMed]
- Horsley, J.; Prout, S.; Tonts, M.; Ali, S. Sustainable livelihoods and indicators for regional development in mining economies. livelihoods and indicators for regional development in mining economies. Extr. Ind. Soc. 2015, 2, 368–380. [Google Scholar]
- Embleton, L.; Ayuku, D.; Kamanda, A.; Atwoli, L.; Ayaya, S.; Vreeman, R.; Braitstein, P. Models of care for orphaned and separated children and upholding children’s rights: Cross-sectional evidence from western Kenya. BMC Int. Health Hum. Rights 2014, 14, 1–18. [Google Scholar] [CrossRef] [PubMed] [Green Version]
- UNESCO. Education Indicators Technical Guidelines; United Nations Educational Scientific and Cultural Organization: Paris, Frence, 2009. [Google Scholar]
- Li, Z.; Tang, D.; Han, M.; Bethel, B.J. Comprehensive Evaluation of Regional Sustainable Development Based on Data Envelopment Analysis. Sustainability 2018, 10, 3897. [Google Scholar] [CrossRef] [Green Version]
- Lu, X. Development of theaters and the city in Beijing: The 1950s and post-1980s. In Grand Theater Urbanism; Springer: Singapore, 2019; pp. 1–30. [Google Scholar]
- Badri-Koohi, B.; Tavakkoli-Moghaddam, R.; Asghari, M. Optimizing Number and Locations of Alternative-Fuel Stations Using a Multi-Criteria Approach. Eng. Technol. Appl. Sci. Res. 2019, 9, 3715–3720. [Google Scholar] [CrossRef]
- Shrestha, D.K. Sustainability approaches in rural infrastructure development. In The Perspective of Labor Based Bridges in Nepal; Dr. K.N. Modi University: Rajasthan, India, 2014. [Google Scholar]
- Yao, J.; Zhang, X.; Murray, A.T. Location optimization of urban fire stations: Access and service coverage. Comput. Environ. Urban Syst. 2018, 73, 184–190. [Google Scholar] [CrossRef]
- Chen, Y.; Lin, N.; Wu, Y.; Ding, L.; Pang, J.; Lv, T. Spatial equity in the layout of urban public sports facilities in Hangzhou. PLoS ONE 2021, 16, e0256174. [Google Scholar] [CrossRef]
- Zhao, W. The evolution process and the cause of the spatial distribution of cinemas in the Shanghai settlements (1919–1943). Urban Hist. 2020, 49, 149–170. [Google Scholar] [CrossRef]
- The Goverment of the Republic of Korea. Year One of Implementing the SDGs in the Republic of Korea; National Voluntary Review; The Goverment of the Republic of Korea: Seoul, Korea, 2016.
- Xu, X.; Wang, Y.; Tao, L. Comprehensive Evaluation of Sustainable Development of Regional Construction Industry in China. J. Clean. Prod. 2018, 211, 1078–1087. [Google Scholar] [CrossRef]
- Tica, S.; Živanović, P.; Bajčetić, S.; Milovanović, B.; Nađ, A. Study of the fuel efficiency and ecological aspects of CNG buses in urban public transport in Belgrade. J. Appl. Eng. Sci. 2019, 17, 65–73. [Google Scholar] [CrossRef]
- Rivas, A.I.M.; Álvarez, C.C.; Díaz, J.D.G.; Garcia, C.G.; Ruiz, L.V.; Garcia, J.L. Sensitivity of Mexico’s farmers: A sub national assessment of vulnerability to climate change. In Climate Change: Socioeconomic Effects; InTech Open: Rijeka, Croatia, 2011; p. 325. [Google Scholar] [CrossRef]
- Ramankutty, N.; Evan, A.T.; Monfreda, C.; Foley, J.A. Farming the planet: 1. Geographic distribution of global agricultural lands in the year 2000. Glob. Biogeochem. Cycles 2008, 22. [Google Scholar] [CrossRef]


| Authors | Location | Indicators | Method |
|---|---|---|---|
| Soares et al. (2001) [23] | 4 subnational regions in Portugal | 33 indicators in various dimensions | Cluster Analysis |
| Theodoropoulou et al. (2009) [24] | Methoni, Koroni, Pilos in Greece | Employment and literature rate, and different infrastructure indicators | Using questionnaire and Regression Method |
| Abdollahzadeh & Sharifzadeh (2012) [21] | Iran’s provinces | 14 social, 13 economic, and 14 infrastructure indicators | Comparative technique based on AHP |
| Dehcheshmeh & Alizadeh (2014) [25] | West Azarbaijan counties | 40 indicators in economic, social, health, transportation, and infrastructure sections | FTOPSIS |
| Zebardast & Haghroosta (2014) [8] | Hamedan and Arak provinces (Iran) | Regional uneven development, 50 indicators | Factor and Cluster Analysis |
| Mabudi & Hakimi (2015) [26] | Sistan and Baloochestan counties | 29 indicators in education, social, health, and infrastructure dimensions | VIKOR method |
| Hudrlikova et al. (2013) [11] | LAU region Prague (Czech Republic) | 13 economic, 17 social, and 13 environmental | Cluster Analysis |
| Firoozi et al. (2017) [1] | Khoozestan province (Iran) | 104 indicators | Vicor and Topsis models |
| Tret’yakova & Osipva (2018) [27] | Perm krai, Bashkortostan, Nizhny Novgorod oblast, Samara, Sverdlovsk, Tatarstan, Chelyabinsk | 11 economic, 12 social, and 8 environmental indicators | Dynamic Standards |
| Mali et al. (2018) [28] | 12 regions of Slovenia | 32 economic, social, and environmental indicators | Thematic Model |
| Farinha et al. (2019) [29] | Algarve region in Portugal | Assessing different social, cultural, and environmental indicators | Surveys and Regression Methods |
| Shi et al. (2019) [14] | 17 regions of Shandong province (China) | 13 economic, 26 social, and 20 environmental | AHP and ANP |
| Garoui, Ezzeddin (2020) [30] | 13 regions in Saudi Arabia | Green economic indicators | MICMAC analysis |
| Sueyoshi et al. (2020) [31] | China regions | National and human resources | DEA |
| Xu et al. (2020) [32] | China regions | 17 United Nations Sustainable Development Goals include 119 indicators | Arithmetic means |
| Method | Author(s) | Year | Indicators | Limitation |
|---|---|---|---|---|
| HDI [33] | UNDP | 1990 | Life expectancy, Literature rate, GDP | Cover limited aspects of sustainability |
| Environmental Sustainable Index [34] | Columbia and Yale university | 2006 | 16 indicators in 6 dimensions such as health, environment, biodiversity, energy, water resources, quality of air, and resource management | Overconcentration on environmental indicators |
| Commitment to Development Index [35] | Center for Global Development | 2006 | Financial aids, transactions rate, investment, immigration, environment, and security | Cover limited aspects of sustainability |
| Index of Sustainable Economic Welfare [36] | Daly and Cobb | 1989 | Countries expenditures on different sections such as environmental pollution, national resources, and transportation accidents | No comprehensive assessment framework |
| Ecological footprints [37] | Wackernagel and Rees | 1996 | Energy consumption per capita, housing, transportation, and leisure expenses | Cover limited aspects of sustainability |
| Millennium Development Indicators [38] | United Nations | 2005 | Millennium targets | Cover limited aspects of sustainability |
| CSD indicators [39] | United Nations | 2007 | 50 indicators in 14 different socioeconomic aspects | Does not focus on gender equity and accessibility to food |
| Sustainable Development Goals and Policy of the Agenda 2030 [40] | United Nations | 2015 | 17 targets in environmental, social, and economic dimensions. It has 231 unique indicators. |
| Dimension | SSI Indicators | Project Indicators |
|---|---|---|
| Basic needs |
|
|
| Health |
|
|
| Social development |
|
|
| Natural resources |
|
|
| Energy consumption and climate |
|
|
| Agriculture |
|
|
| Economic |
|
|
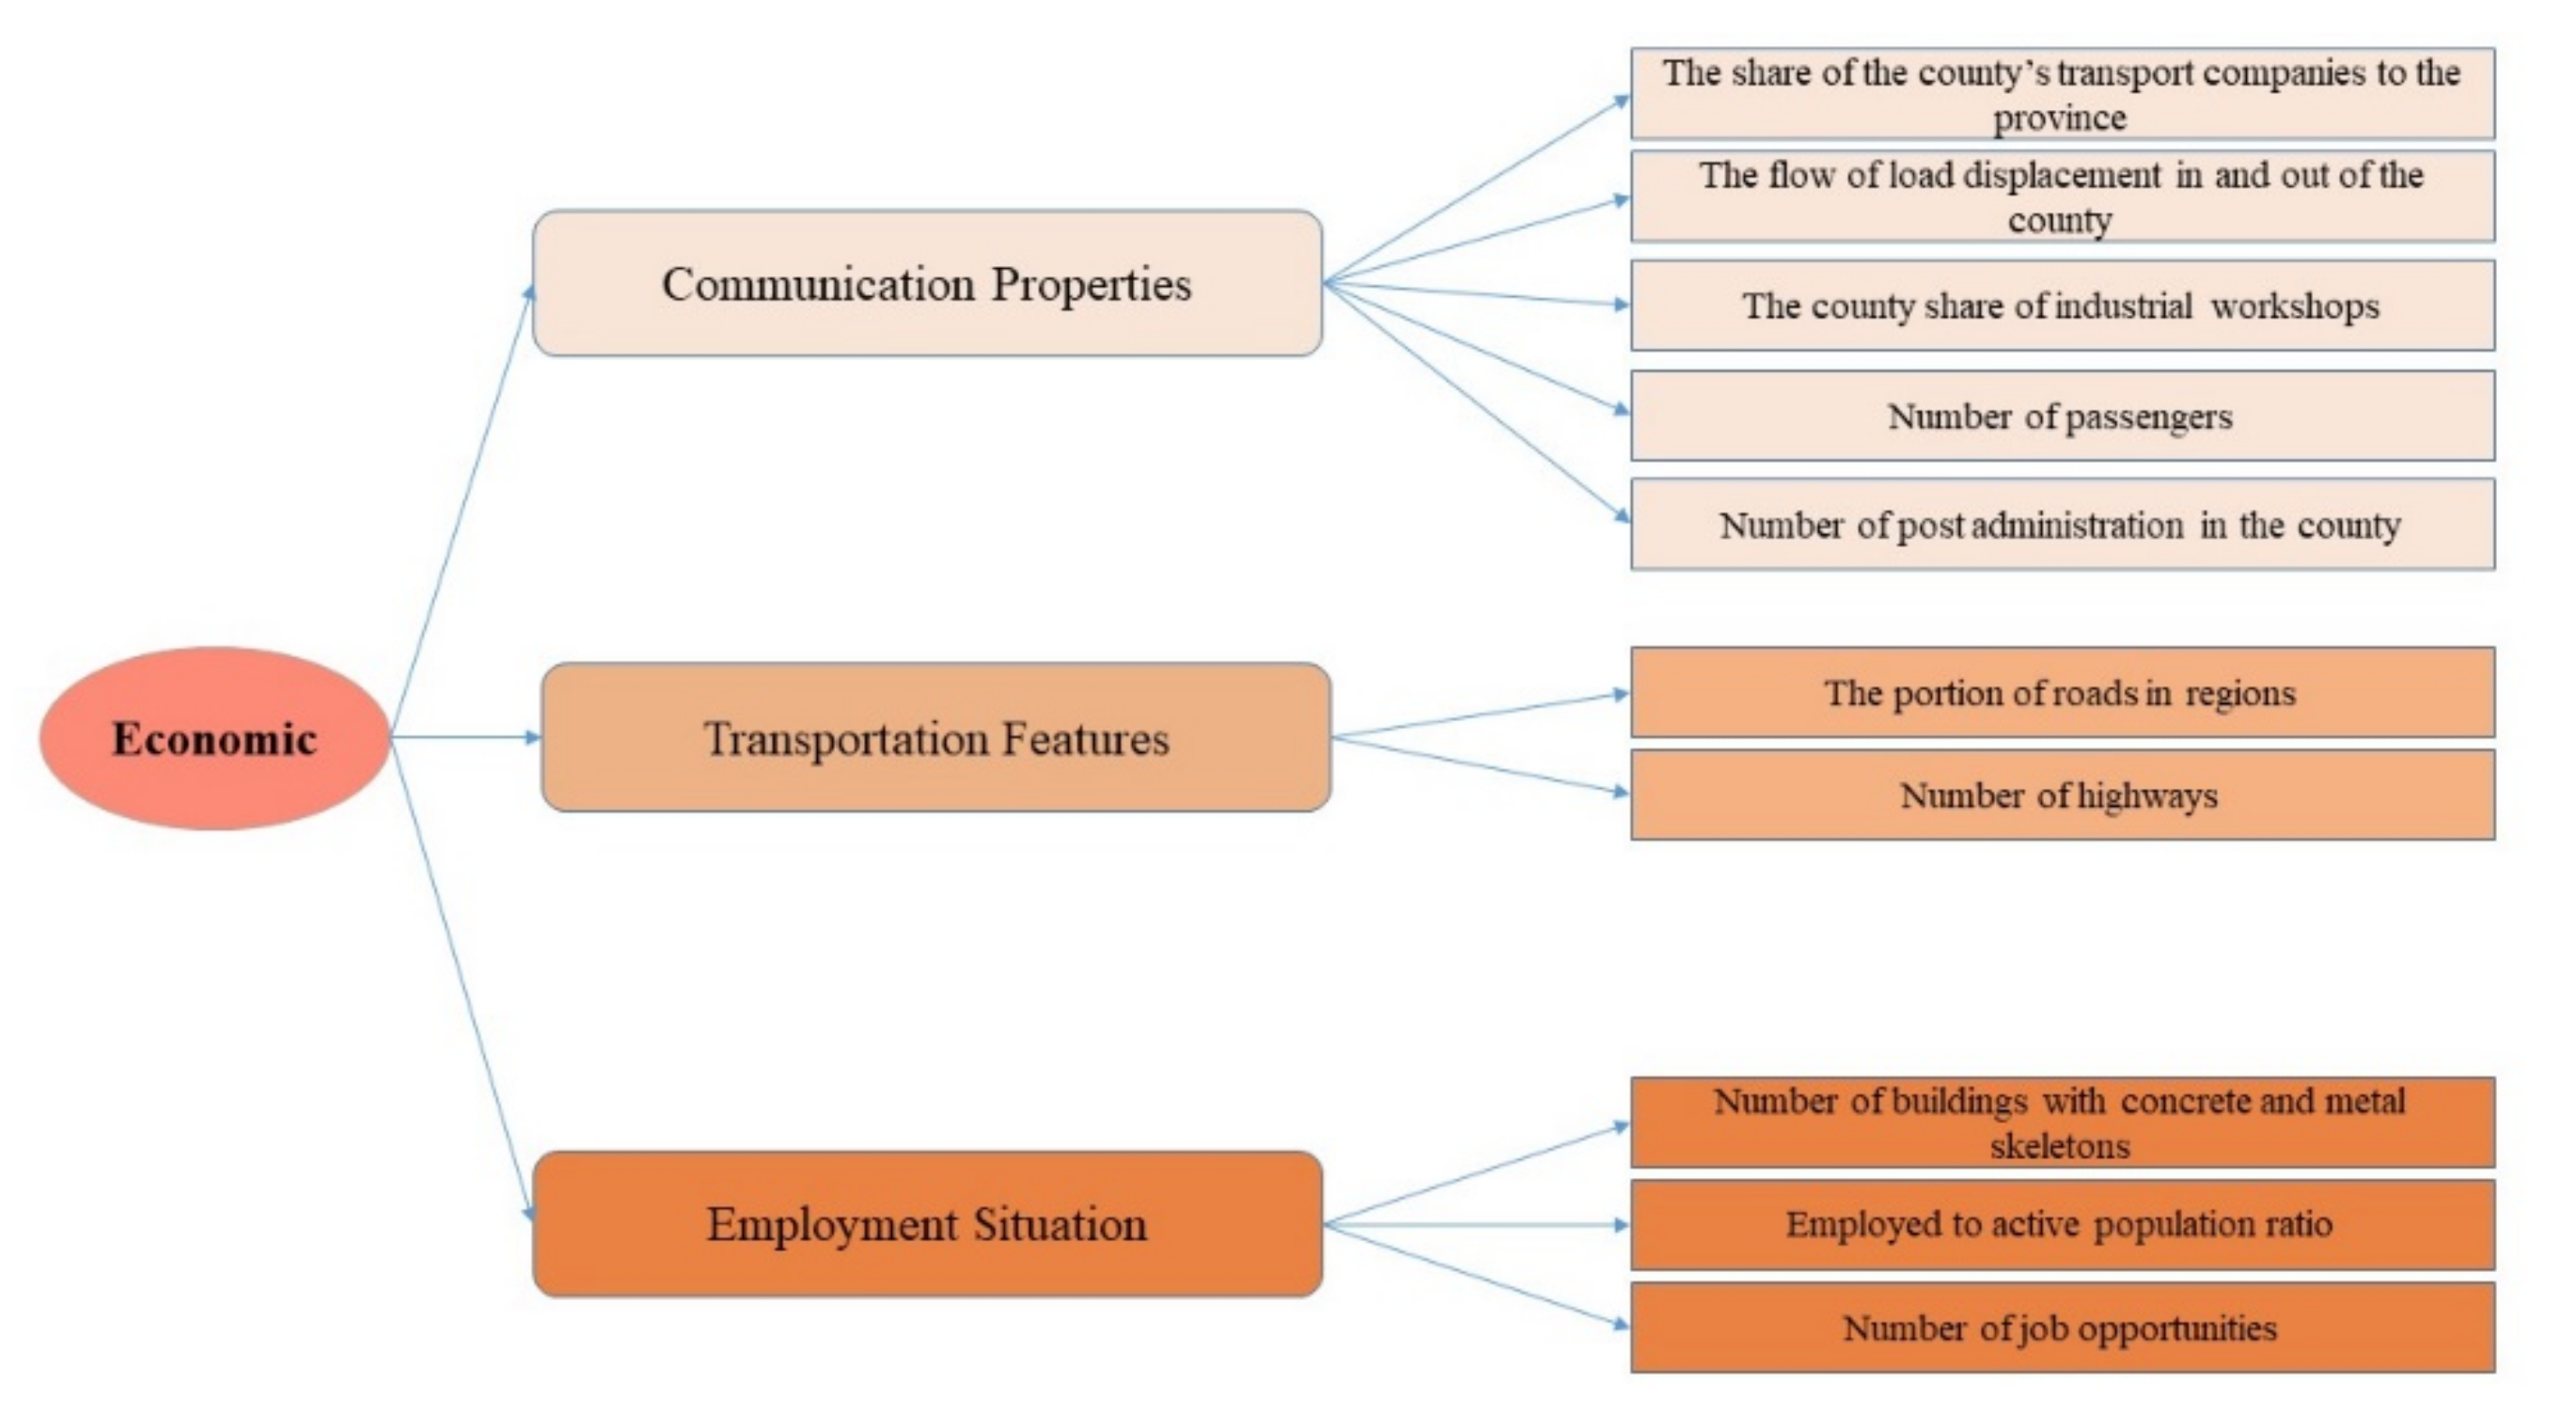
| Economic | |
|---|---|
| Indicators | Reference |
| Employed to active population ratio | [1,12,26,27,45] |
| The county’s share of industrial workshops | [3,9,13,46] |
| The share of the county’s transport companies to the province | [47] |
| The portion of roads in regions | [48] |
| Number of highways | [48] |
| Number of passengers | [1,23] |
| The flow of load displacement in and out of the county | [1,23] |
| Number of post administration in the county | [21,26,28,46,49,50] |
| Number of buildings with concrete and metal skeletons | |
| Number of job opportunities | [8,29,51,52] |
| Health | |
| Number of hospitals | [3,23] |
| Number of hospitals beds | [1,8,23,26,28,29,46,51,52] |
| Number of health centers per capita | [1,23] |
| Number of rural health centers per capita | [1,53] |
| Number of pharmacies per capita | [1,3] |
| Number of laboratories per capita | [1,3] |
| Number of rehabilitation centers per capita | [1,54] |
| Number of doctors per 1000 people | [1,3,13,14,26,28,46,50,52] |
| Number of nurses per 1000 people | [1,26] |
| Social Services | |
| Number of centers to serve the disabled | [21,51] |
| The ratio of the marriage loan to its number | [1] |
| The ratio of the number of nursing centers to the number of elderly | [55] |
| The proportion of the insured to the county population | [21,56] |
| Court per capita | [13,27,29,51,52] |
| The number of orphan care centers | [57] |
| The number of homeless household support centers | [57] |
| Number of centers to serve the disabled who need help | [21,51] |
| Number of Imam Khomeini centers to serve people | |
| Number of kindergartens | [1,58] |
| The ratio of the number of classes to the number of exceptional students | [1,58] |
| Education | |
| Number of public libraries | [1,23,26,28,50] |
| The number of the members of the library to the population of the county | [1,28] |
| The ratio of the number of education staff to the number of students | [58] |
| The ratio of the number of trainers to the trainees | [1,58] |
| The ratio of books to public libraries | [1,3,14,28] |
| The ratio of the number of classes to the number of students | [1,36] |
| The ratio of the number of elementary classes to the number of students | [1,15,59] |
| The ratio of the number of secondary classes to the number of students | [1,23] |
| The ratio of the number of high school classes to the number of students | [1,23] |
| The ratio of the theaters to the number of theater programs | [60] |
| Infrastructure | |
| Coverage of sewage networks | [1,14] |
| The ratio of sewage bifurcation in the county | [1,14] |
| The number of phones per capita | [18,21,28,49] |
| Number of fuel stations | [61] |
| Number of electricity customers | [18,21,28,49] |
| County’s share of water network | [8,26,49,62] |
| The number of slaughterhouses in the county | [1] |
| The number of fire stations per 1000 people | [1,63] |
| The number of cities with gas facilities to all the cities of province | [14,21,28,50] |
| The number of rural areas with gas facilities to all the rural areas of province | [14,21,28,50] |
| County’s share of sports facilities | [64] |
| The county’s share of the number of workshops covered by social security insurance | [21,56] |
| The proportion of cinemas to the number of spectators | [3,65] |
| The proportion of forest areas to county area | [13,15,49,56,64,66] |
| The ratio of transportation waste to population of county | [12,15,26,27,52,62,67] |
| The ratio of CNG consumption to population of county | [68] |
| Gas consumption per capita | [12,14,18,61,63] |
| Water consumption per capita | [15,23,30,59,62,66] |
| Electricity consumption per capita | [18,21,28,49] |
| Number of greenhouses | [69] |
| Environment | |
| The proportion of forest lands to the area of the province | [13,15,49,56,62,66] |
| Range of land area to county area | [14,49] |
| County’s share of the number of frosty days | [29,51] |
| County’s share of sunny hours | [29,62] |
| County’s share of public parks | [1,3,29] |
| Green space per capita | [1,3,15,28,29,46,59,62] |
| The proportion of agricultural lands to the area of the province | [70] |
| The proportion of farmlands to the area of the province | [13,15,28,29,49] |
| The proportion of garden lands to the area of the province | [13,15,28,29,49] |
| County’s share of greenhouse area | [14,49] |
| 2006 | 2011 | 2016 |
|---|---|---|
| Eslamshahr | Eslamshahr | Eslamshahr |
| Pakdasht | Baharestan | Baharestan |
| Tehran | Pakdasht | Pakdasht |
| Damavand | Pishva | Pardis |
| Robat Karim | Tehran | Pishva |
| Rey | Damavand | Tehran |
| Savojbolagh | Robat Karim | Damavand |
| Shemiranat | Rey | Robat Karim |
| Shahriar | Shemiranat | Rey |
| Firuzkuh | Shahriar | Shemiranat |
| Karaj | Firuzkuh | Shahriar |
| Nazar abad | Ghods | Firuzkuh |
| Varamin | Malard | Ghods |
| Varamin | Qarchak | |
| Malard | ||
| Varamin |
| Counties |
|---|
| Eslamshahr |
| Pakdasht |
| Tehran |
| Damavand |
| Robat Karim |
| Rey |
| Shemiranat |
| Shahriar |
| Firuzkuh |
| Varamin |
| Kaiser–Meyer–Olkin Measure of Sampling Adequacy | 0.790 | |
| Bartlett’s Test of Sphericity | Approx. Chi-Square | 262.596 |
| df | 45 | |
| Sig. | 0.000 | |
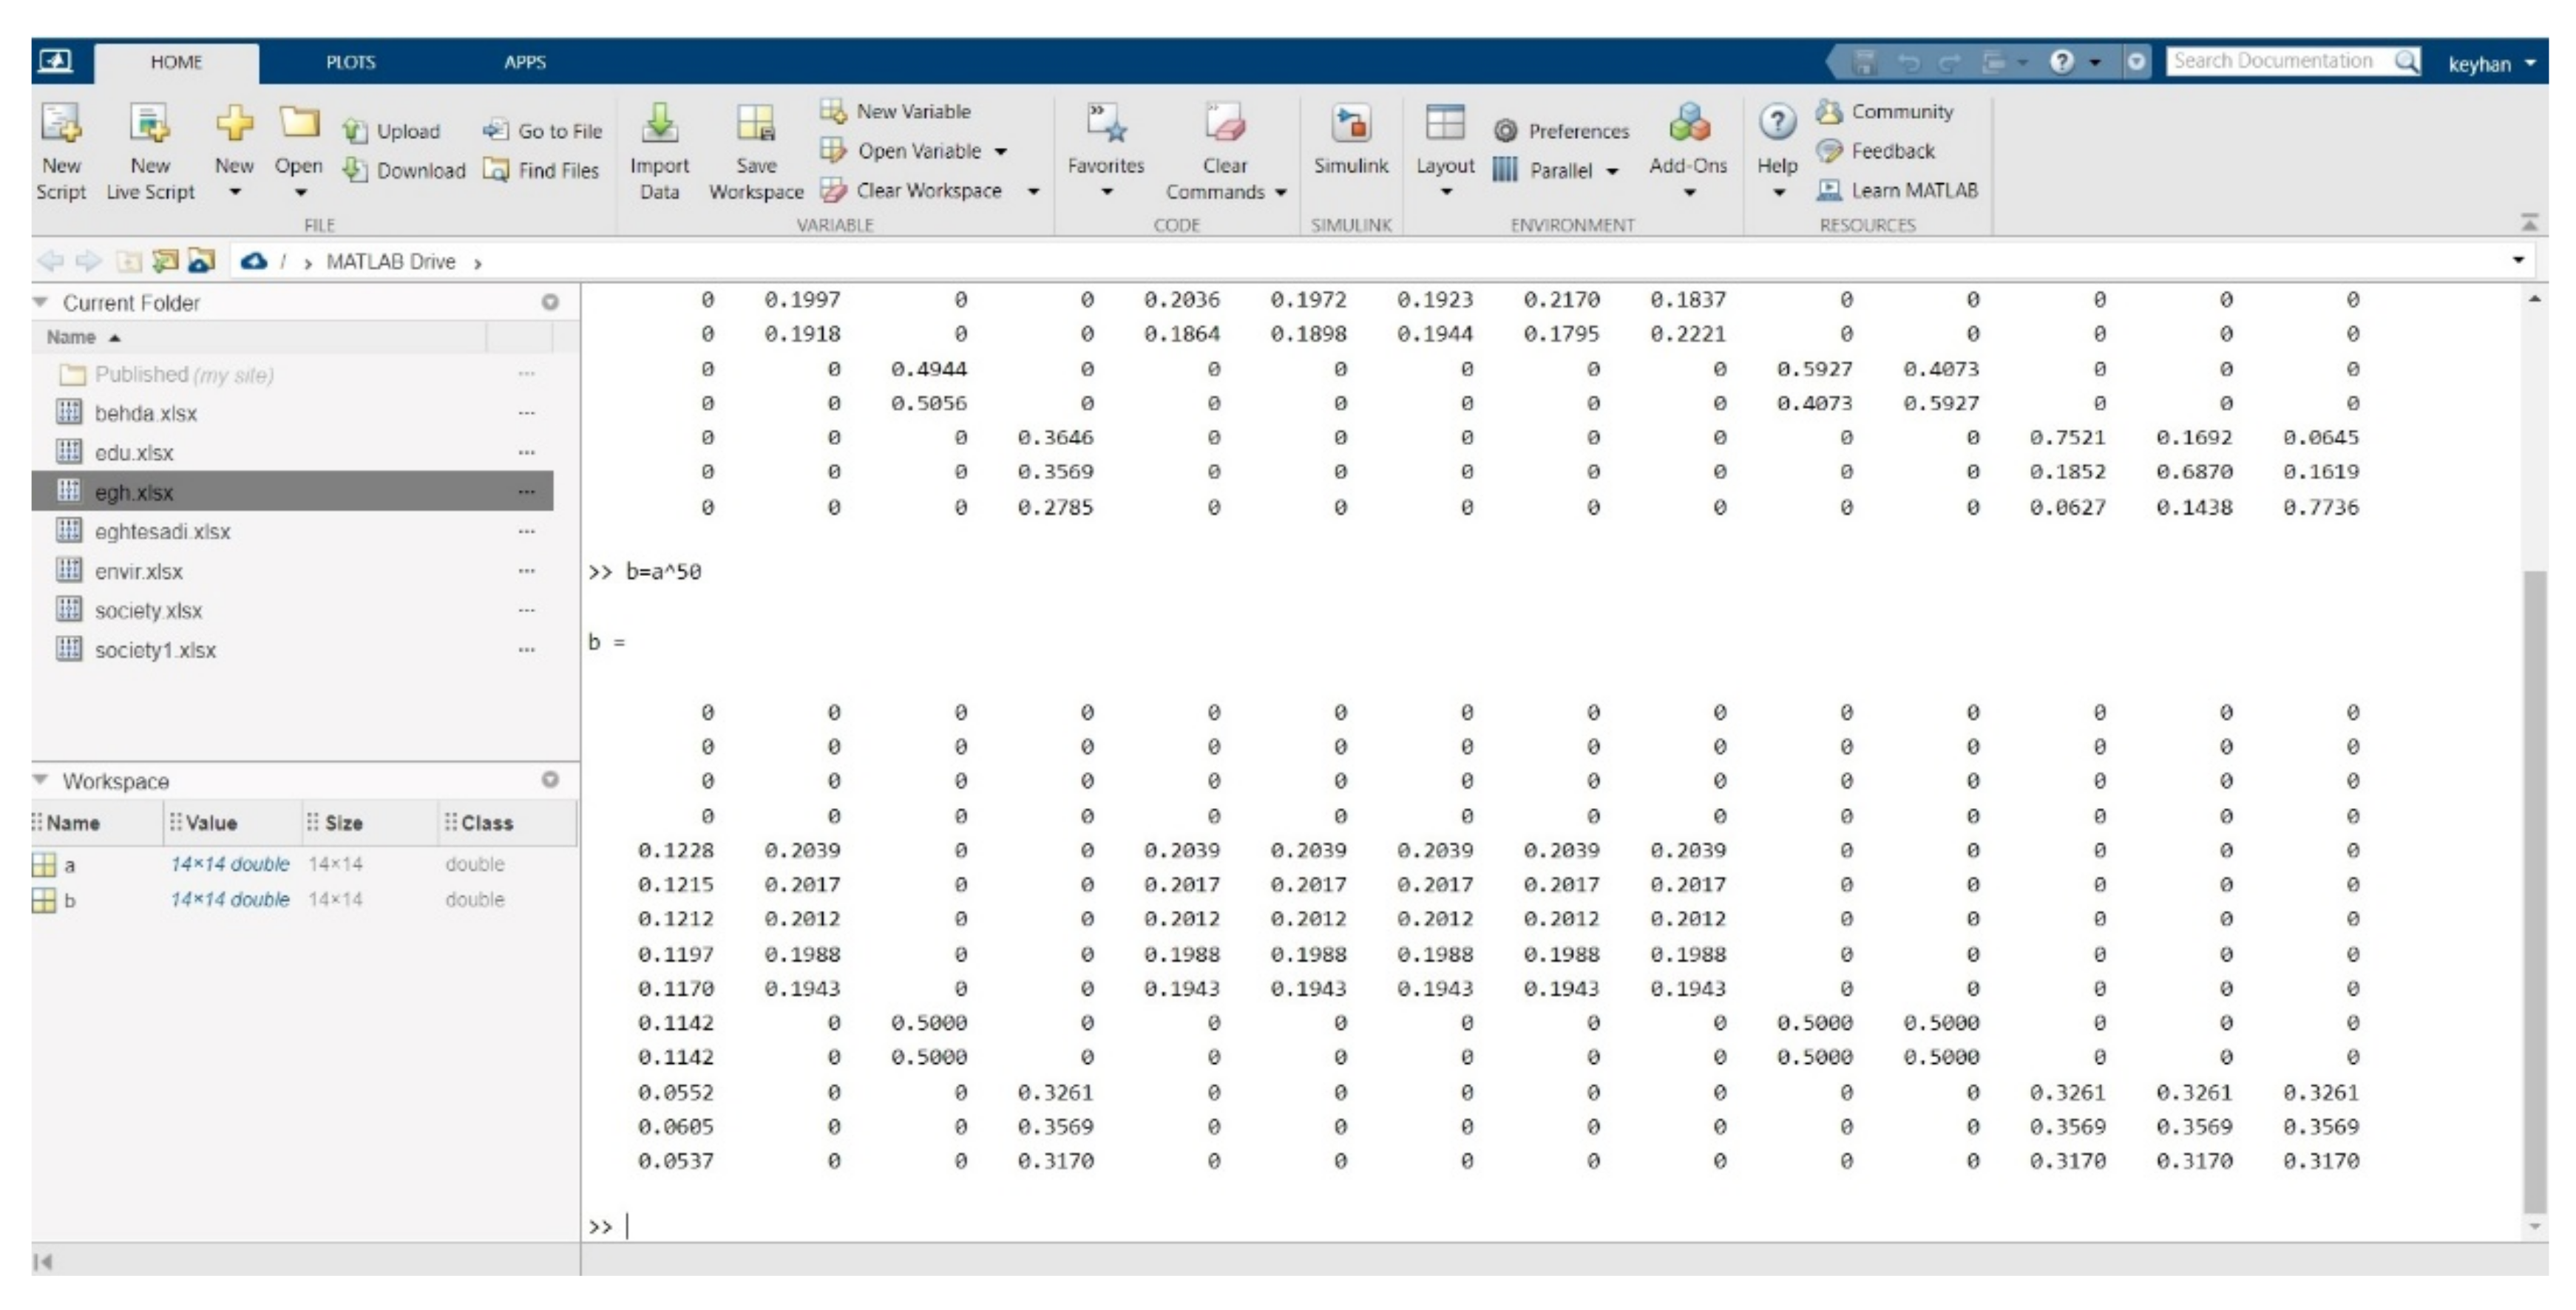
| Goal | F1 | F2 | F3 | Haml | Barbu | Sanat | Jabja | Post | Azadbzr | Kolrah | Flz | Shagh | Work | |
|---|---|---|---|---|---|---|---|---|---|---|---|---|---|---|
| Goal | 0 | 0 | 0 | 0 | 0 | 0 | 0 | 0 | 0 | 0 | 0 | 0 | 0 | 0 |
| F1 | 0 | 0 | 0 | 0 | 0 | 0 | 0 | 0 | 0 | 0 | 0 | 0 | 0 | 0 |
| F2 | 0 | 0 | 0 | 0 | 0 | 0 | 0 | 0 | 0 | 0 | 0 | 0 | 0 | 0 |
| F3 | 0 | 0 | 0 | 0 | 0 | 0 | 0 | 0 | 0 | 0 | 0 | 0 | 0 | 0 |
| Haml | 0.1228 | 0.2039 | 0 | 0 | 0.2039 | 0.2039 | 0.2039 | 0.2039 | 0.2039 | 0 | 0 | 0 | 0 | 0 |
| Barbu | 0.1215 | 0.2017 | 0 | 0 | 0.2017 | 0.2017 | 0.2017 | 0.2017 | 0.2017 | 0 | 0 | 0 | 0 | 0 |
| Sanat | 0.1212 | 0.2012 | 0 | 0 | 0.2012 | 0.2012 | 0.2012 | 0.2012 | 0.2012 | 0 | 0 | 0 | 0 | 0 |
| Jabja | 0.1197 | 0.1988 | 0 | 0 | 0.1988 | 0.1988 | 0.1988 | 0.1988 | 0.1988 | 0 | 0 | 0 | 0 | 0 |
| Post | 0.117 | 0.1943 | 0 | 0 | 0.1943 | 0.1943 | 0.1943 | 0.1943 | 0.1943 | 0 | 0 | 0 | 0 | 0 |
| Azadbzr | 0.1142 | 0 | 0.5 | 0 | 0 | 0 | 0 | 0 | 0 | 0.5 | 0.5 | 0 | 0 | 0 |
| Kolrah | 0.1142 | 0 | 0.5 | 0 | 0 | 0 | 0 | 0 | 0 | 0.5 | 0.5 | 0 | 0 | 0 |
| Flz | 0.0552 | 0 | 0 | 0.3261 | 0 | 0 | 0 | 0 | 0 | 0 | 0 | 0.3261 | 0.3261 | 0.3261 |
| Shagh | 0.605 | 0 | 0 | 0.3569 | 0 | 0 | 0 | 0 | 0 | 0 | 0 | 0.3569 | 0.3569 | 0.3569 |
| Work | 0.0537 | 0 | 0 | 0.317 | 0 | 0 | 0 | 0 | 0 | 0 | 0 | 0.317 | 0.317 | 0.317 |
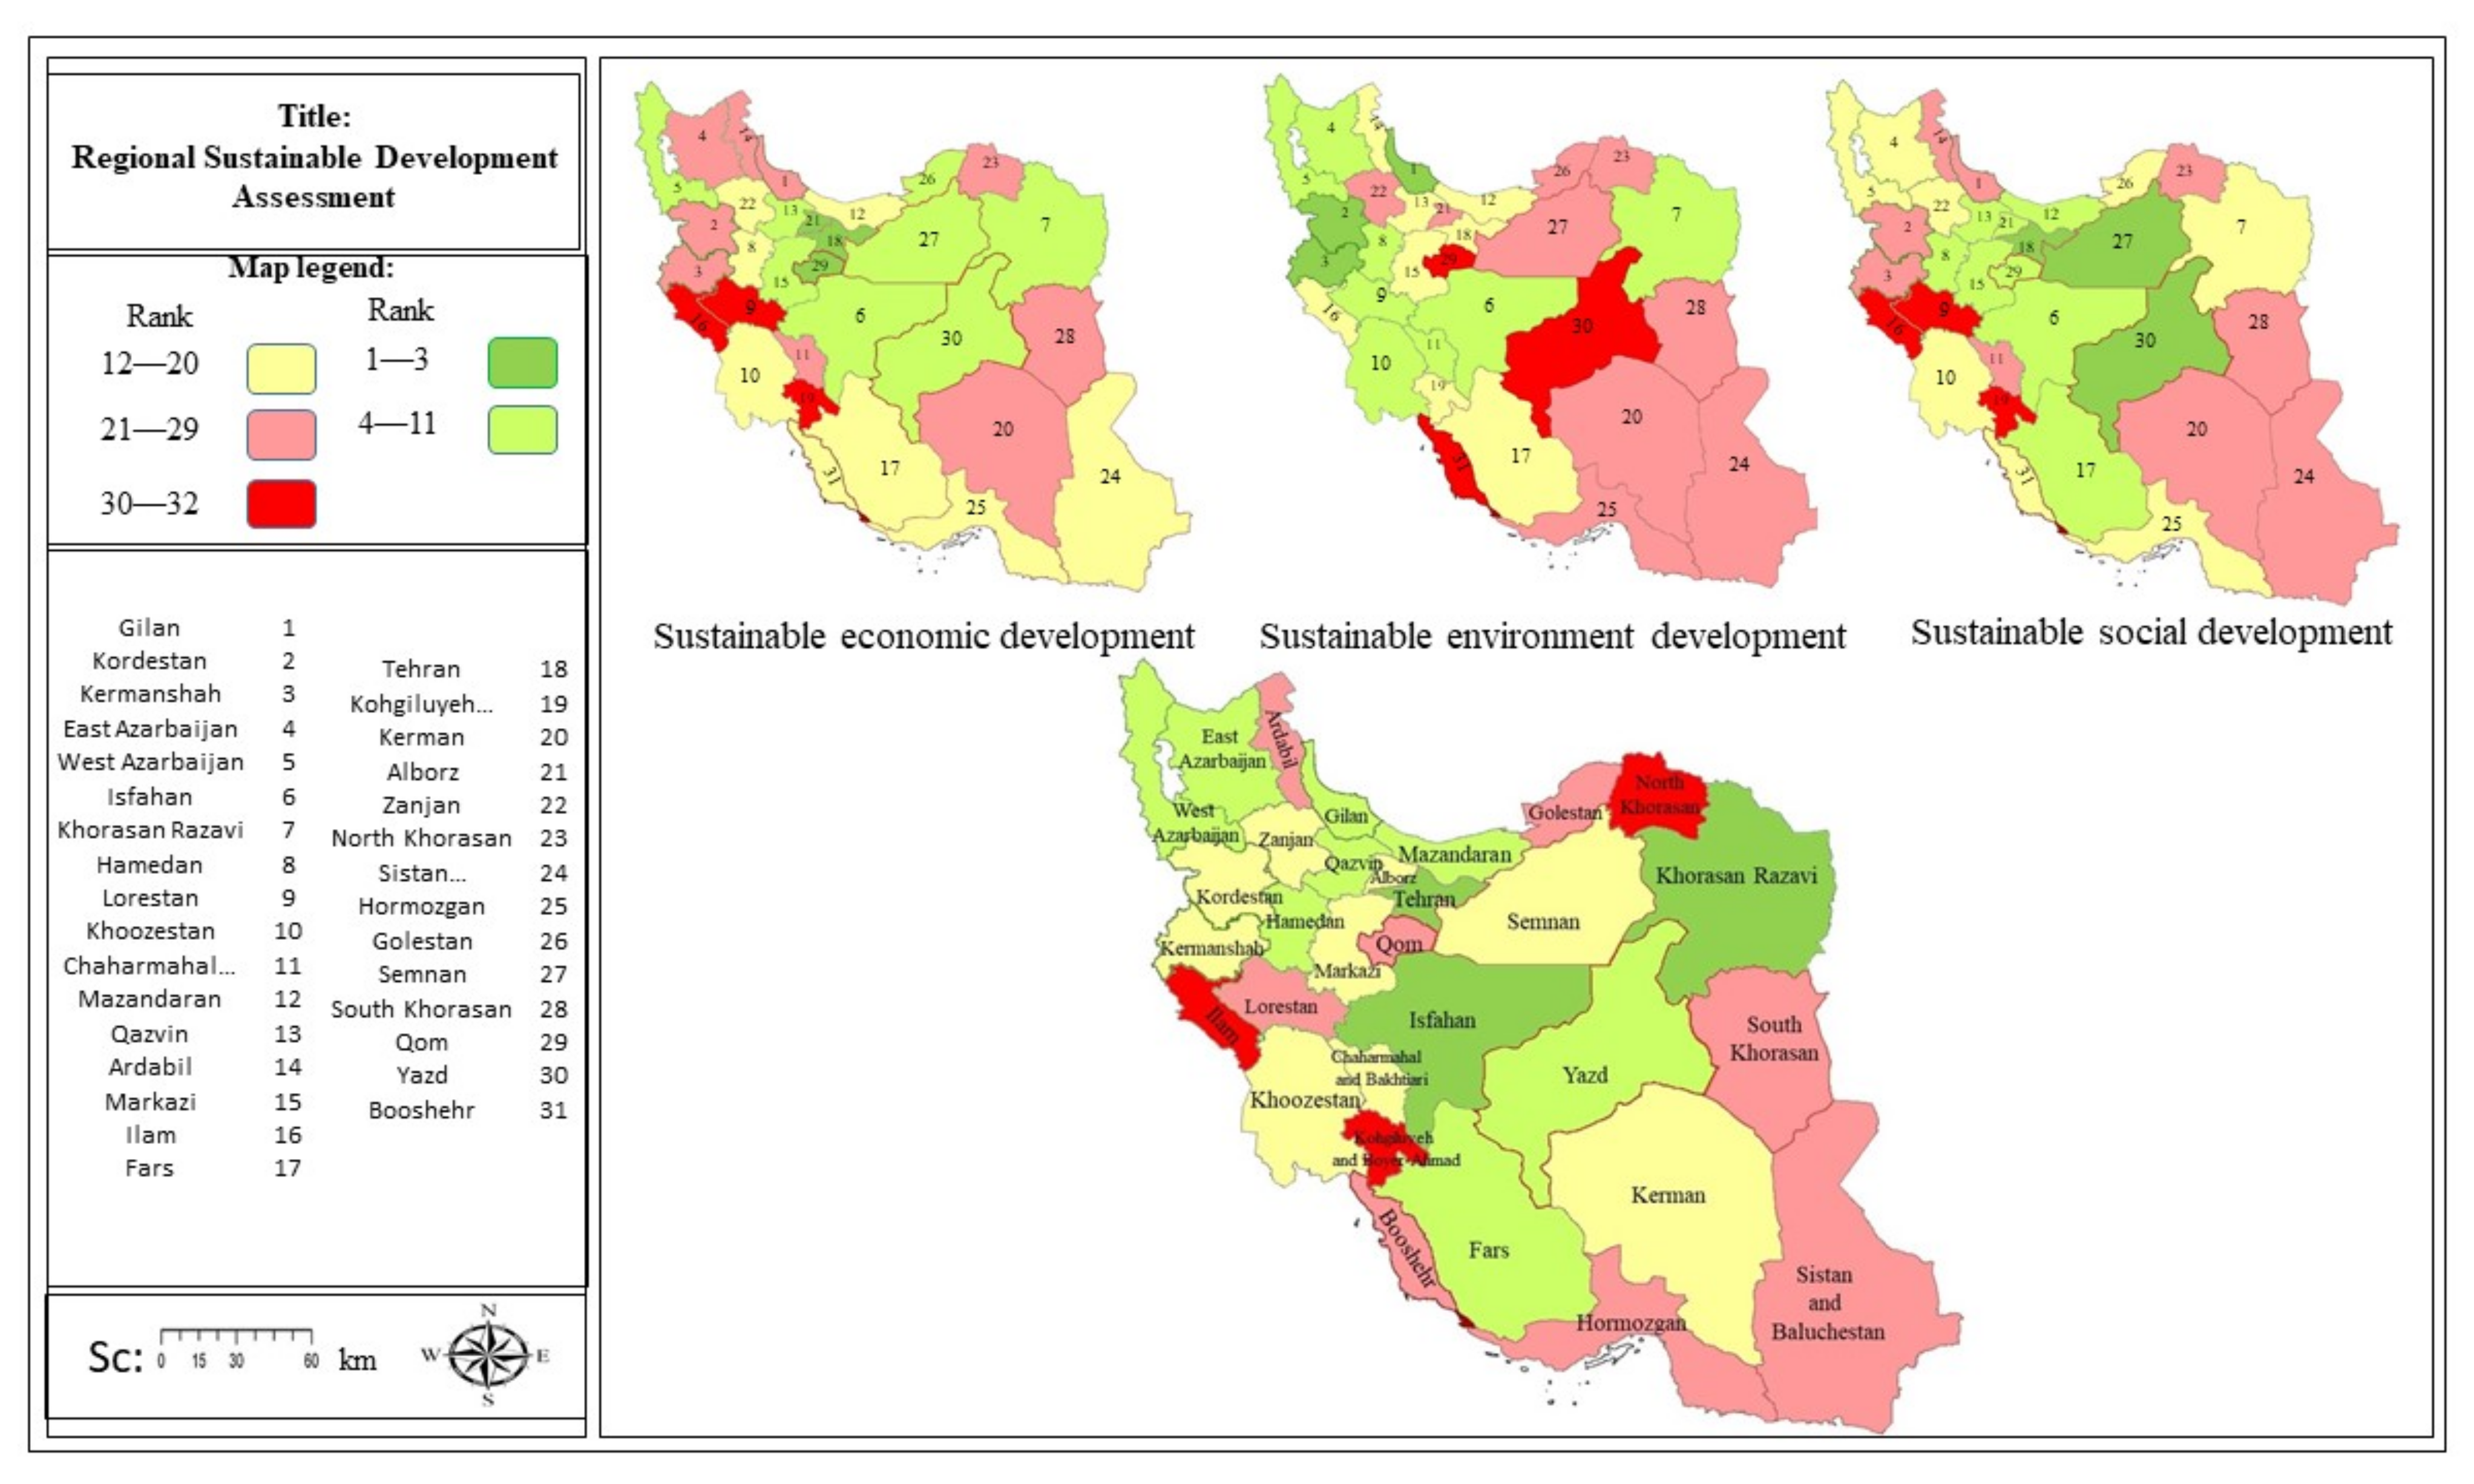
| Environment | Fanp Results | Economic | Fanp Results | Social | Fanp Results |
|---|---|---|---|---|---|
| Gilan | 0.615 | Tehran | 0.896 | Yazd | 2.006 |
| Kordestan | 0.539 | Alborz | 0.863 | Tehran | 1.984 |
| Kermanshah | 0.539 | Qom | 0.777 | Semnan | 1.800 |
| East Azarbaijan | 0.524 | Yazd | 0.713 | Isfahan | 1.795 |
| West Azarbaijan | 0.498 | Markazi | 0.637 | Mazandaran | 1.753 |
| Isfahan | 0.473 | Isfahan | 0.618 | Fars | 1.747 |
| Khorasan Razavi | 0.444 | Qazvin | 0.600 | Alborz | 1.729 |
| Hamedan | 0.423 | West Azarbaijan | 0.592 | Qazvin | 1.687 |
| Lorestan | 0.408 | Khorasan Razavi | 0.569 | Markazi | 1.659 |
| Khoozestan | 0.405 | Golestan | 0.563 | Qom | 1.658 |
| Chaharmahal and Bakhtiari | 0.392 | Semnan | 0.552 | Hamedan | 1.643 |
| Mazandaran | 0.384 | Hormozgan | 0.547 | Golestan | 1.640 |
| Qazvin | 0.374 | Khoozestan | 0.546 | Zanjan | 1.633 |
| Ardabil | 0.353 | Booshehr | 0.530 | Booshehr | 1.616 |
| Markazi | 0.337 | Fars | 0.518 | Hormozgan | 1.608 |
| Ilam | 0.305 | Sistan and Baluchestan | 0.496 | Khorasan Razavi | 1.596 |
| Fars | 0.299 | Mazandaran | 0.460 | East Azarbaijan | 1.560 |
| Tehran | 0.294 | Zanjan | 0.457 | Khoozestan | 1.551 |
| Kohgiluyeh and Boyer-Ahmad | 0.255 | Hamedan | 0.427 | West Azarbaijan | 1.550 |
| Kerman | 0.253 | Kermanshah | 0.419 | Kerman | 1.527 |
| Alborz | 0.229 | Gilan | 0.409 | Chaharmahal and Bakhtiari | 1.526 |
| Zanjan | 0.228 | East Azarbaijan | 0.407 | Gilan | 1.486 |
| North Khorasan | 0.212 | Kerman | 0.389 | Sistan and Baluchestan | 1.473 |
| Sistan and Baluchestan | 0.207 | South Khorasan | 0.365 | South Khorasan | 1.438 |
| Hormozgan | 0.202 | Kordestan | 0.335 | Kermanshah | 1.397 |
| Golestan | 0.195 | Chaharmahal and Bakhtiari | 0.320 | Kordestan | 1.331 |
| Semnan | 0.189 | Ardabil | 0.312 | Ardabil | 1.314 |
| South Khorasan | 0.183 | North Khorasan | 0.296 | North Khorasan | 1.264 |
| Qom | 0.162 | Lorestan | 0.287 | Ilam | 1.227 |
| Yazd | 0.160 | Ilam | 0.175 | Lorestan | 1.101 |
| Booshehr | 0.124 | Kohgiluyeh and Boyer-Ahmad | 0.154 | Kohgiluyeh and Boyer-Ahmad | 0.899 |
| Sustainability | Results |
|---|---|
| Tehran | 2.006 |
| Isfahan | 1.984 |
| Khorasan Razavi | 1.800 |
| Mazandaran | 1.795 |
| East Azarbaijan | 1.753 |
| Yazd | 1.747 |
| Fars | 1.729 |
| Gilan | 1.687 |
| West Azarbaijan | 1.659 |
| Qazvin | 1.658 |
| Hamedan | 1.643 |
| Markazi | 1.640 |
| Khoozestan | 1.633 |
| Alborz | 1.616 |
| Semnan | 1.608 |
| Kermanshah | 1.596 |
| Chaharmahal and Bakhtiari | 1.560 |
| Kordestan | 1.551 |
| Zanjan | 1.550 |
| Kerman | 1.527 |
| Golestan | 1.526 |
| Qom | 1.486 |
| Ardabil | 1.473 |
| Booshehr | 1.438 |
| Hormozgan | 1.397 |
| Sistan and Baluchestan | 1.331 |
| South Khorasan | 1.314 |
| Lorestan | 1.264 |
| North Khorasan | 1.227 |
| Ilam | 1.101 |
| Kohgiluyeh and Boyer-Ahmad | 0.899 |
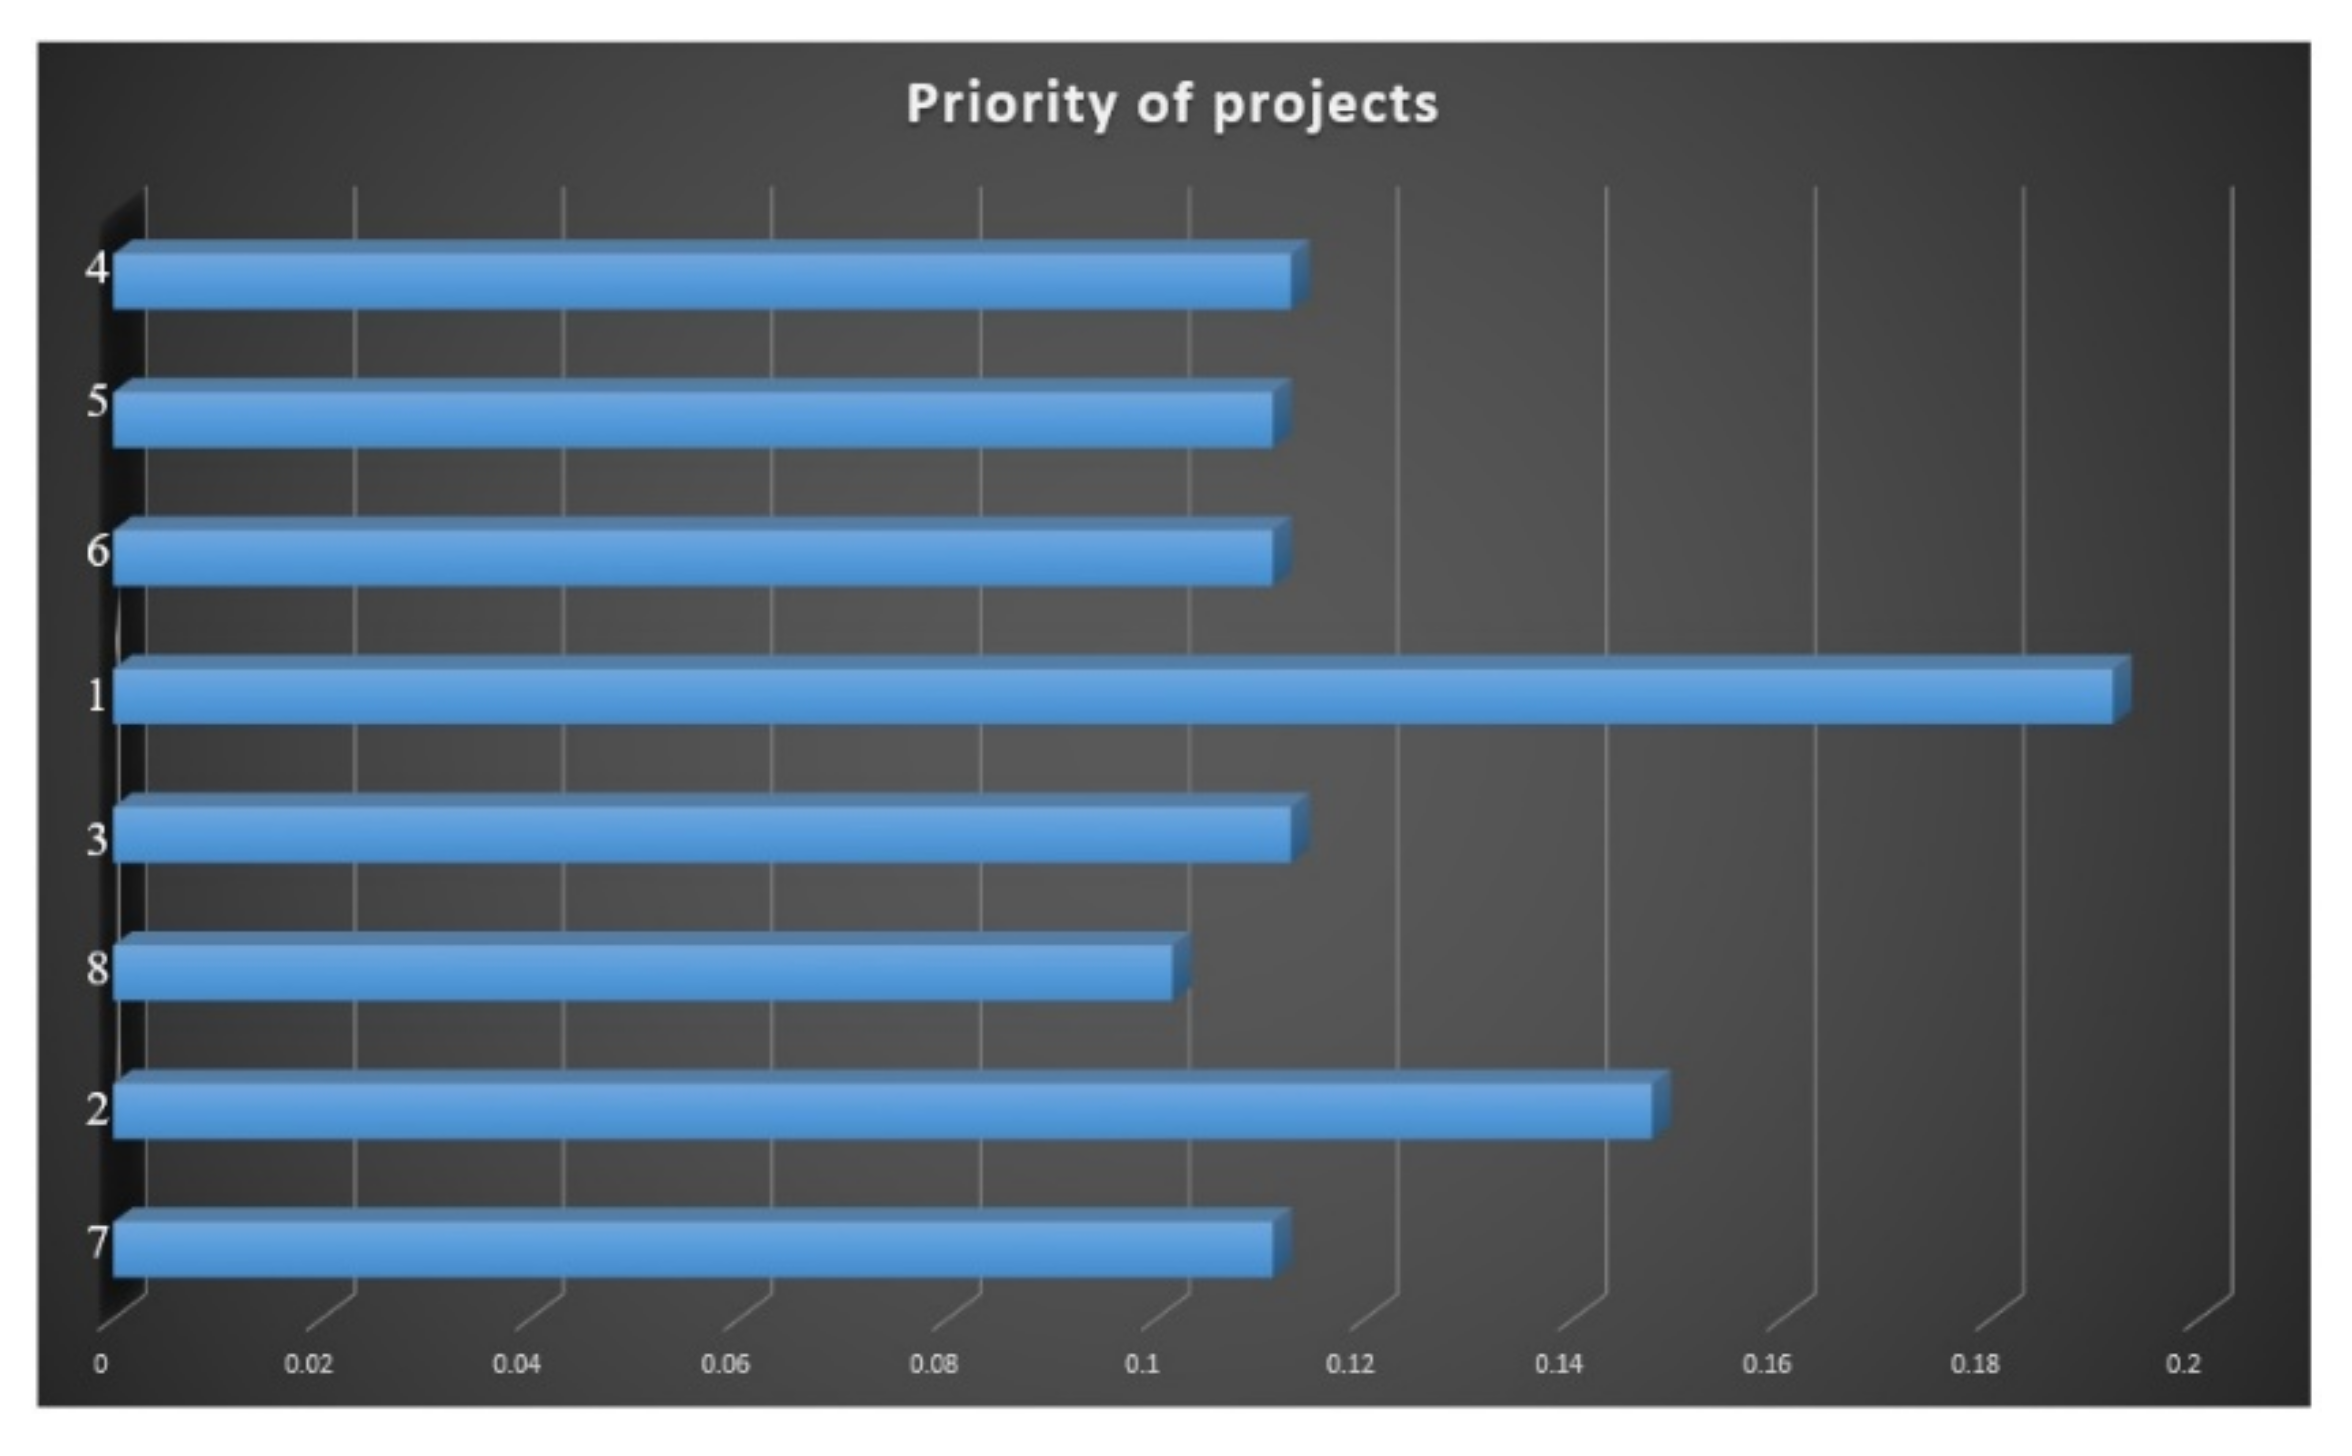
| Indicators | Importance of Indicators |
|---|---|
| The share of the county’s transport companies to the province | 0.1228 |
| The flow of load displacement in and out of the county | 0.1215 |
| The county’s share of industrial workshops | 0.1212 |
| Number of passengers and holiday-makers | 0.1197 |
| Number of post administration in the county | 0.1170 |
| Number of highways | 0.1142 |
| The portion of roads in regions | 0.1142 |
| Number of building with concrete and metal skeleton | 0.0552 |
| Employed to active population ratio | 0.0605 |
| Number of job opportunities | 0.0537 |
| Legend | 2006 | 2011 | 2016 | |||
|---|---|---|---|---|---|---|
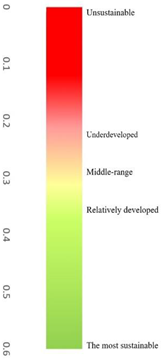 | County | FANP Result | County | FANP Result | County | FANP Result |
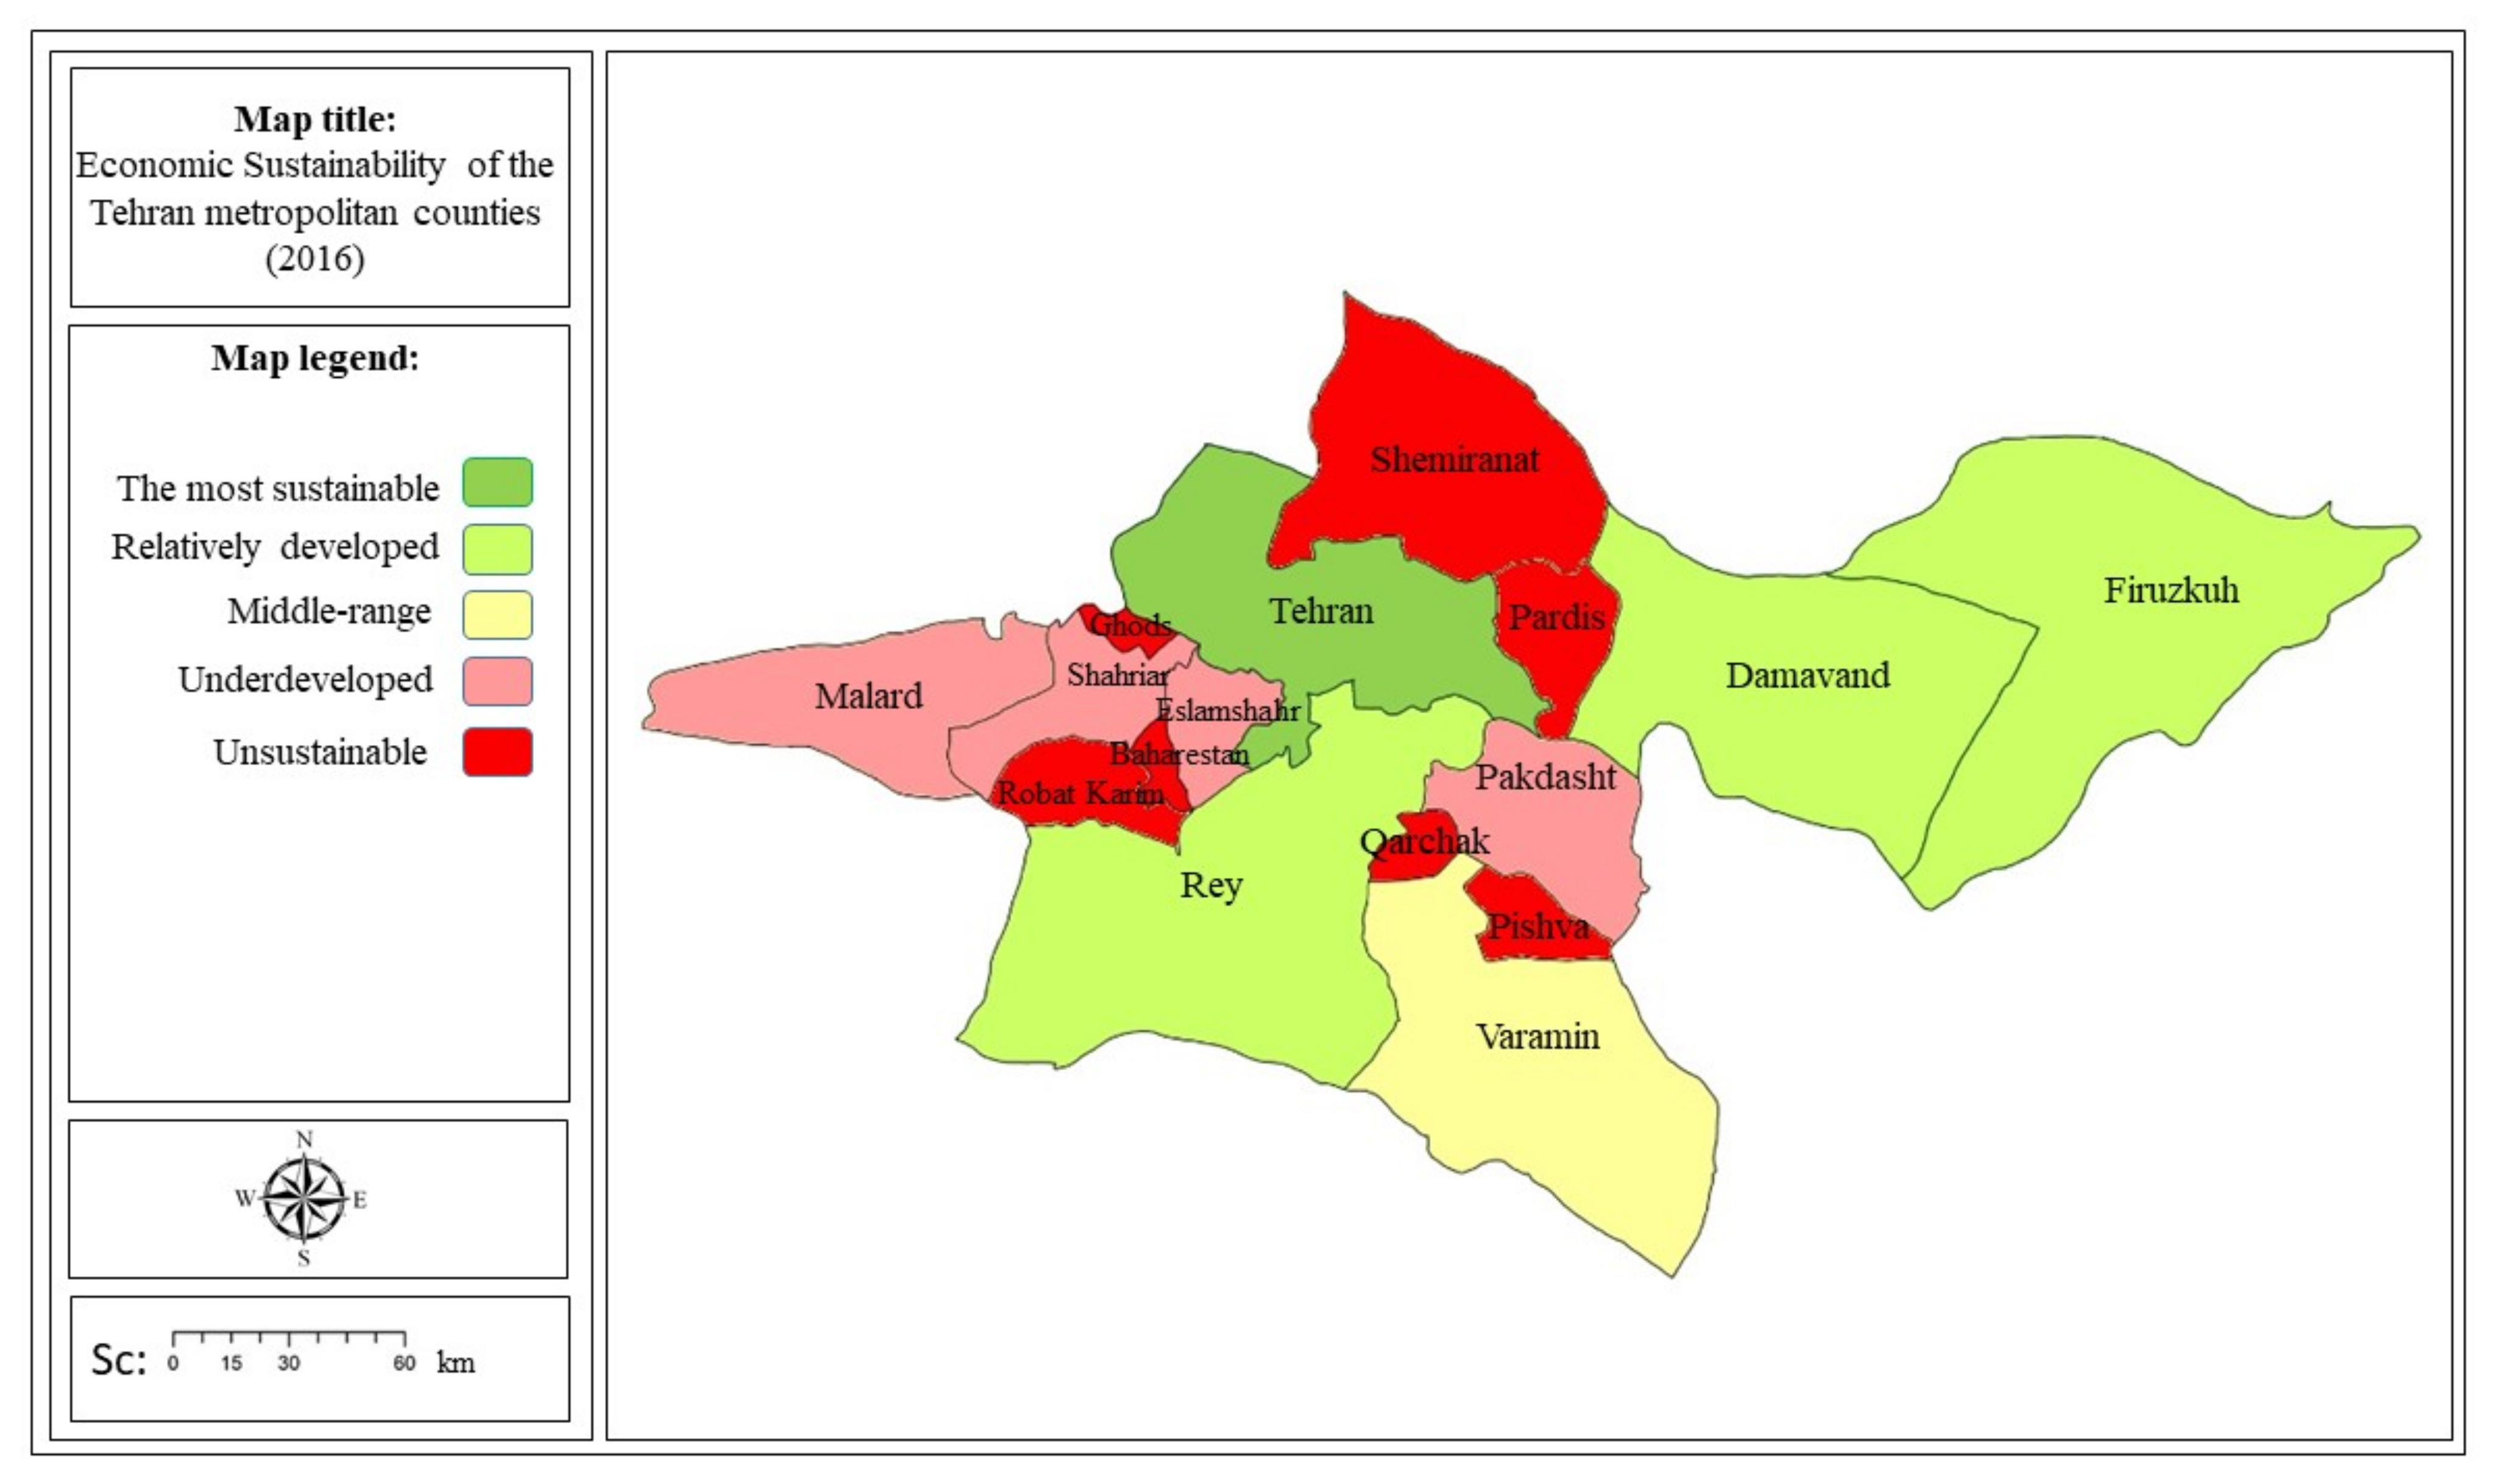
| Tehran | 0.724 | Tehran | 0.811 | Tehran | 0.886 | |
| Karaj | 0.353 | Rey | 0.401 | Rey | 0.386 | |
| Rey | 0.347 | Damavand | 0.305 | Firuzkuh | 0.359 | |
| Damavand | 0.293 | Pakdasht | 0.215 | Damavand | 0.308 | |
| Pakdasht | 0.208 | Shahriar | 0.209 | Varamin | 0.254 | |
| Shahriar | 0.206 | Robat Karim | 0.188 | Eslamshahr | 0.227 | |
| Robat Karim | 0.183 | Firuzkuh | 0.184 | Pakdasht | 0.224 | |
| Savojbolagh | 0.18 | Shemiranat | 0.176 | Shahriar | 0.216 | |
| Varamin | 0.176 | Varamin | 0.175 | Malard | 0.208 | |
| Shemiranat | 0.148 | Baharestan | 0.114 | Pardis | 0.197 | |
| Firuzkuh | 0.147 | Eslamshahr | 0.113 | Baharestan | 0.196 | |
| Eslamshahr | 0.141 | Pishva | 0.092 | Robat Karim | 0.189 | |
| Nazar Abad | 0.036 | Malard | 0.091 | Pishva | 0.151 | |
| Ghods | 0.058 | Qarchak | 0.138 | |||
| Shemiranat | 0.137 | |||||
| Ghods | 0.087 | |||||
| Education | Health | Infrastructure | Social Service |
|---|---|---|---|
| F1—Accessibility to education infrastructure F2—Accessibility to education services F3—Accessibility to basic education centers F4—Cultural features F5—Educational capacities | F1—Health infrastructure F2—Accessibility of health care centers F3—Access to medical experts | F1—Social service properties F2—Access to electric and gas infrastructures F3—Energy consumption and waste production F4—Access to environmental infrastructure F5—Infrastructure properties | F1—Support services F2—The properties of the welfare organization F3—Access to social services F4—The infrastructure of support agencies |
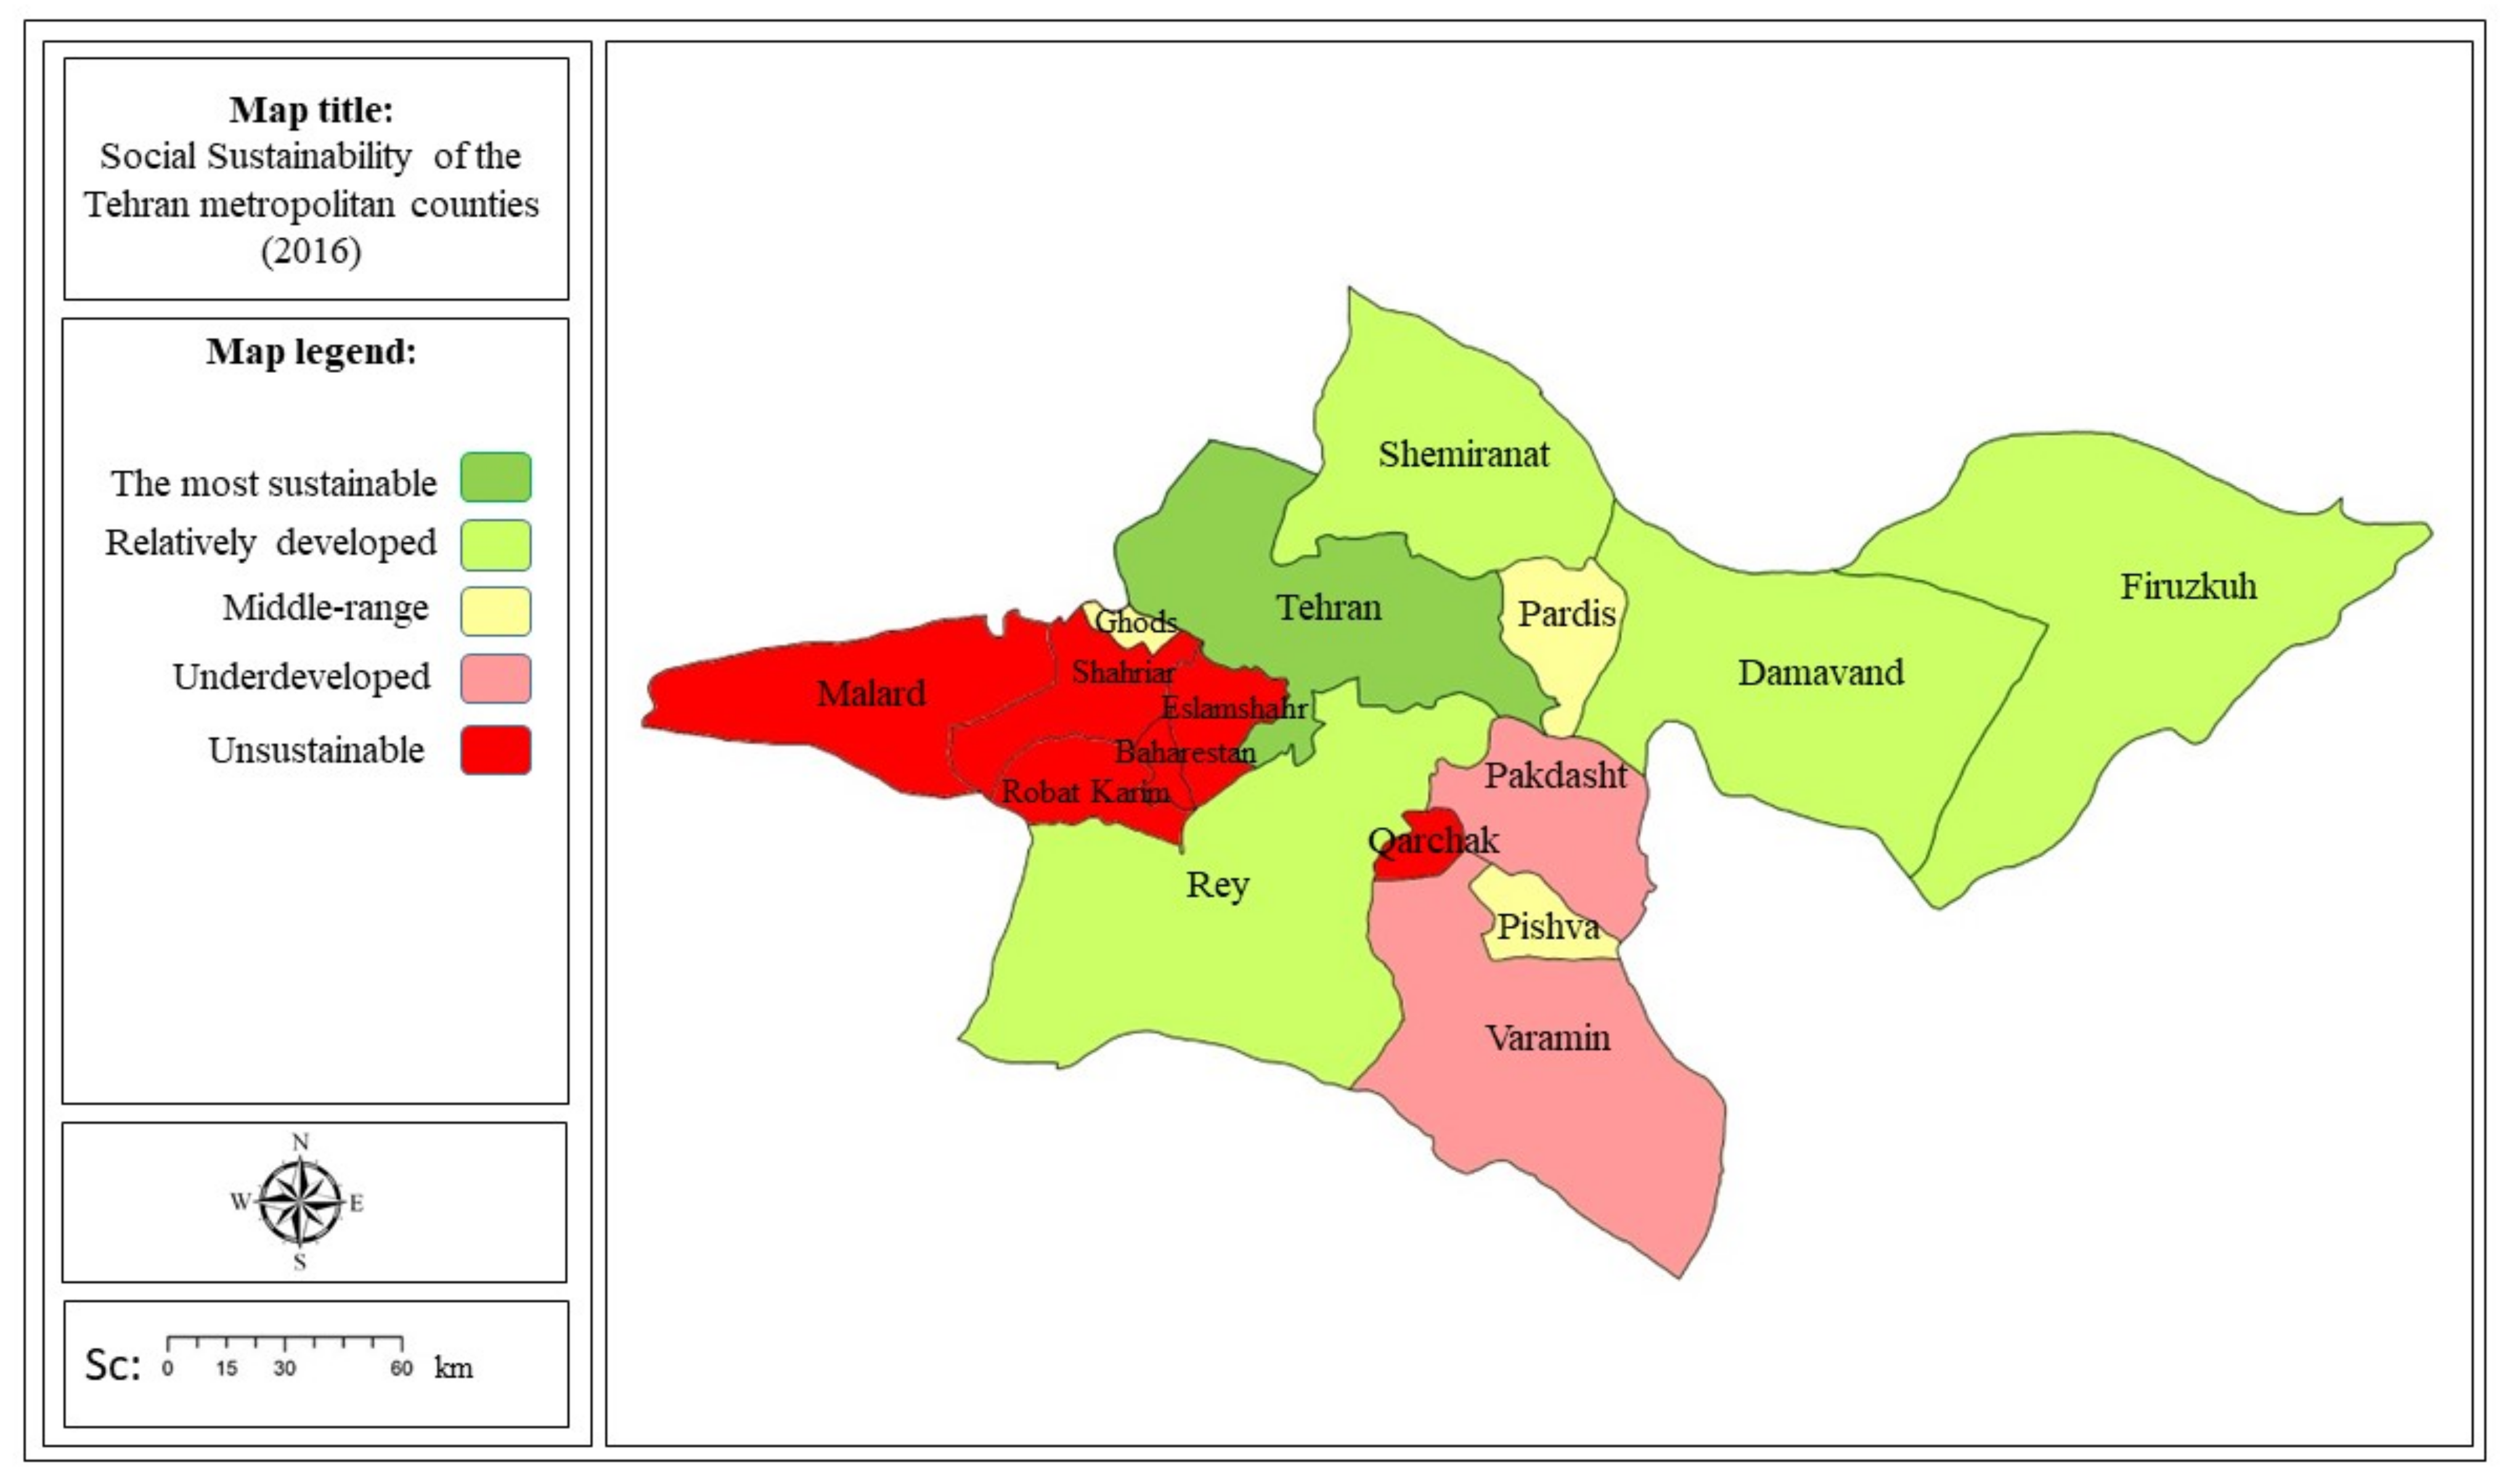
| Legend | 2006 | 2011 | 2016 | |||
|---|---|---|---|---|---|---|
 | County | FANP Result | County | FANP Result | County | FANP Result |
| Shemiranat | 0.448 | Tehran | 0.48 | Tehran | 0.499 | |
| Tehran | 0.396 | Shemiranat | 0.377 | Shemiranat | 0.384 | |
| Damavand | 0.31 | Damavand | 0.375 | Rey | 0.358 | |
| Damavand | 0.227 | Firuzkuh | 0.335 | Firuzkuh | 0.325 | |
| Karaj | 0.188 | Rey | 0.273 | Damavand | 0.31 | |
| Shahriar | 0.187 | Pishva | 0.234 | Pishva | 0.265 | |
| Savojbolagh | 0.183 | Pakdasht | 0.229 | Pardis | 0.249 | |
| Varamin | 0.178 | Varamin | 0.209 | Ghods | 0.241 | |
| Rey | 0.173 | Robat Karim | 0.204 | Varamin | 0.212 | |
| Firuzkuh | 0.165 | Eslamshahr | 0.176 | Pakdasht | 0.211 | |
| Pakdasht | 0.147 | Shahriar | 0.173 | Shahriar | 0.191 | |
| Nazar Abad | 0.14 | Malard | 0.135 | Robat Karim | 0.178 | |
| Robat Karim | 0.136 | Ghods | 0.093 | Eslamshahr | 0.175 | |
| Baharestan | 0.085 | Qarchak | 0.161 | |||
| Malard | 0.158 | |||||
| Baharestan | 0.104 | |||||
| Environment | |
|---|---|
| The proportion of forest lands to the area of the province | 0.0509 |
| Range of land area to county area | 0.1738 |
| County’s share of the number of frosty days | 0.1550 |
| County’s share of sunny hours | 0.1171 |
| County’s share of public parks | 0.0481 |
| Green space per capita | 0.0462 |
| The proportion of agricultural lands to the area of the province | 0.1593 |
| The proportion of farmlands to the area of the province | 0.0662 |
| The proportion of garden lands to the area of the province | 0.1171 |
| County’s share of greenhouse area | 0.0662 |
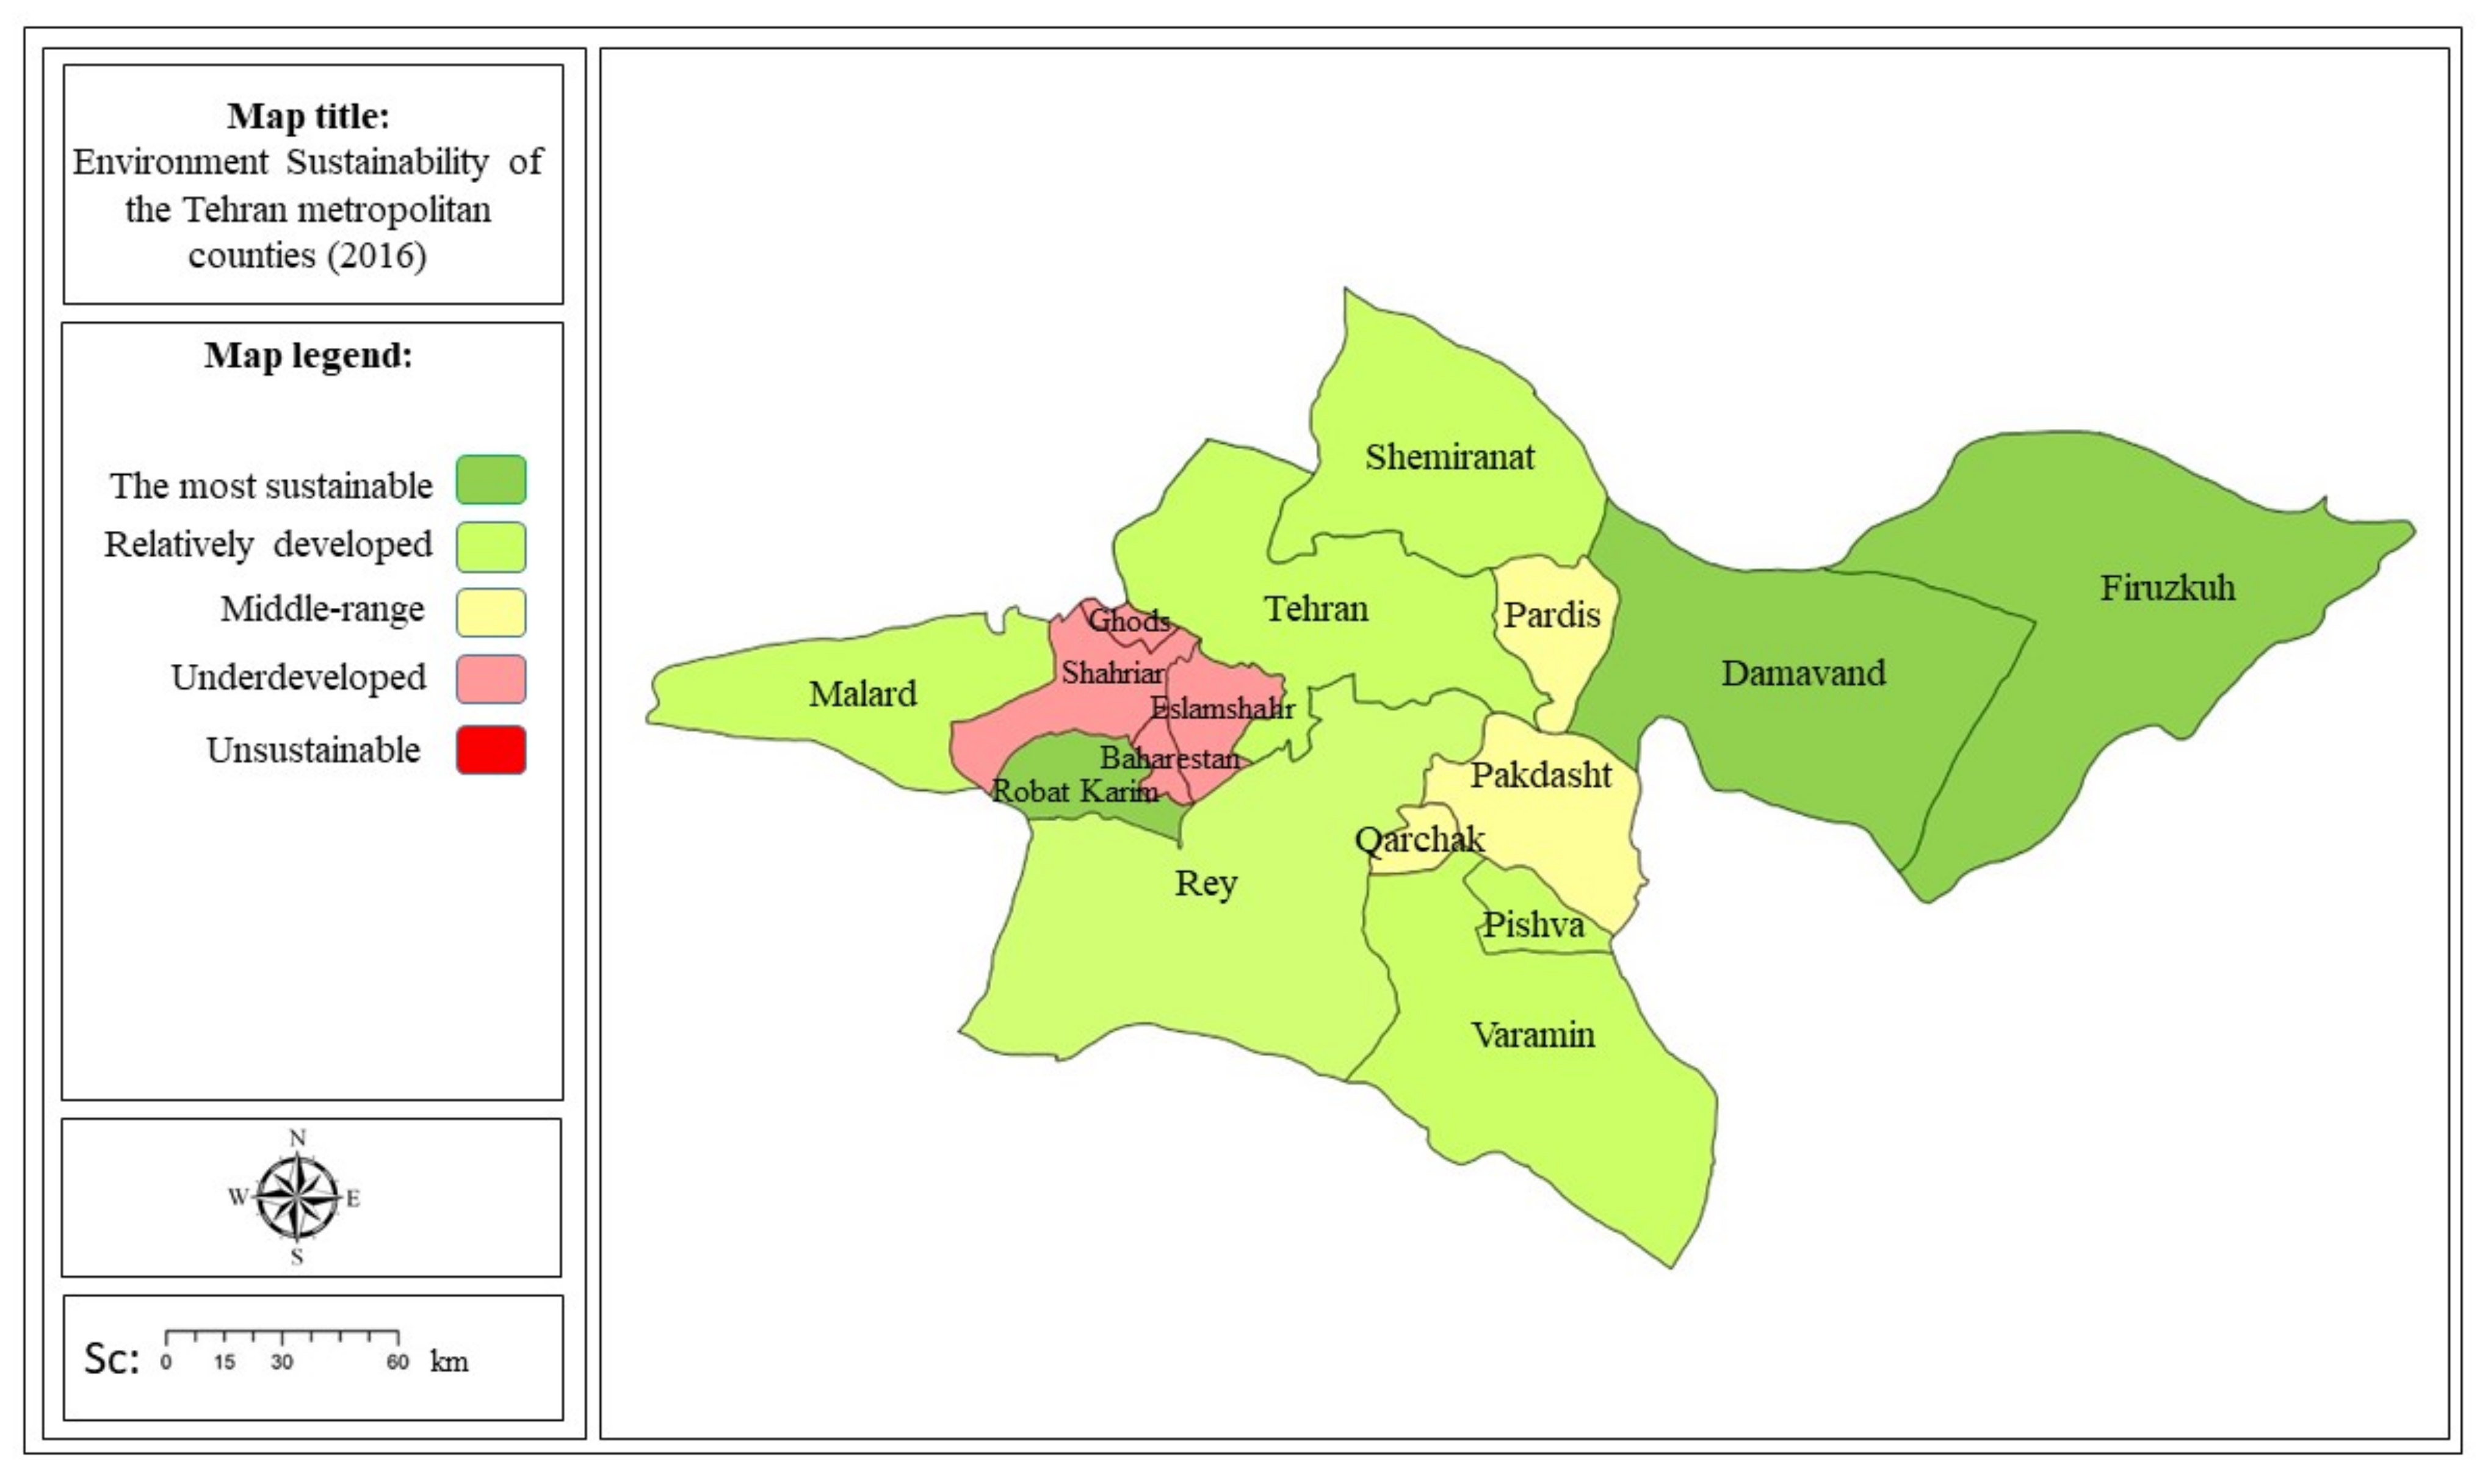
| Legend | 2006 | 2011 | 2016 | |||
|---|---|---|---|---|---|---|
 | County | FANP Result | County | FANP Result | County | FANP Result |
| Shahriar | 0.583 | Firuzkuh | 0.495 | Firuzkuh | 0.483 | |
| Eslamshahr | 0.329 | Damavand | 0.463 | Damavand | 0.475 | |
| Rey | 0.394 | Varamin | 0.437 | Robat Karim | 0.405 | |
| Varamin | 0.385 | Pishva | 0.43 | Shemiranat | 0.368 | |
| Damavand | 0.377 | Malard | 0.403 | Tehran | 0.357 | |
| Pakdasht | 0.338 | Shahriar | 0.393 | Malard | 0.345 | |
| Tehran | 0.326 | Pakdasht | 0.335 | Varamin | 0.345 | |
| Firuzkuh | 0.316 | Tehran | 0.312 | Pishva | 0.34 | |
| Robat Karim | 0.291 | Rey Karim | 0.297 | Rey | 0.335 | |
| Nazar Abad | 0.283 | Shemiranat | 0.276 | Qarchak | 0.281 | |
| Shemiranat | 0.2 | Ghods | 0.271 | Pardis | 0.279 | |
| Savojbolagh | 0.189 | Eslamshahr | 0.271 | Pakdasht | 0.261 | |
| Karaj | 0.102 | Robat Karim | 0.269 | Eslamshahr | 0.221 | |
| Baharestan | 0.234 | Shahriar | 0.208 | |||
| Baharestan | 0.204 | |||||
| Ghods | 0.2 | |||||
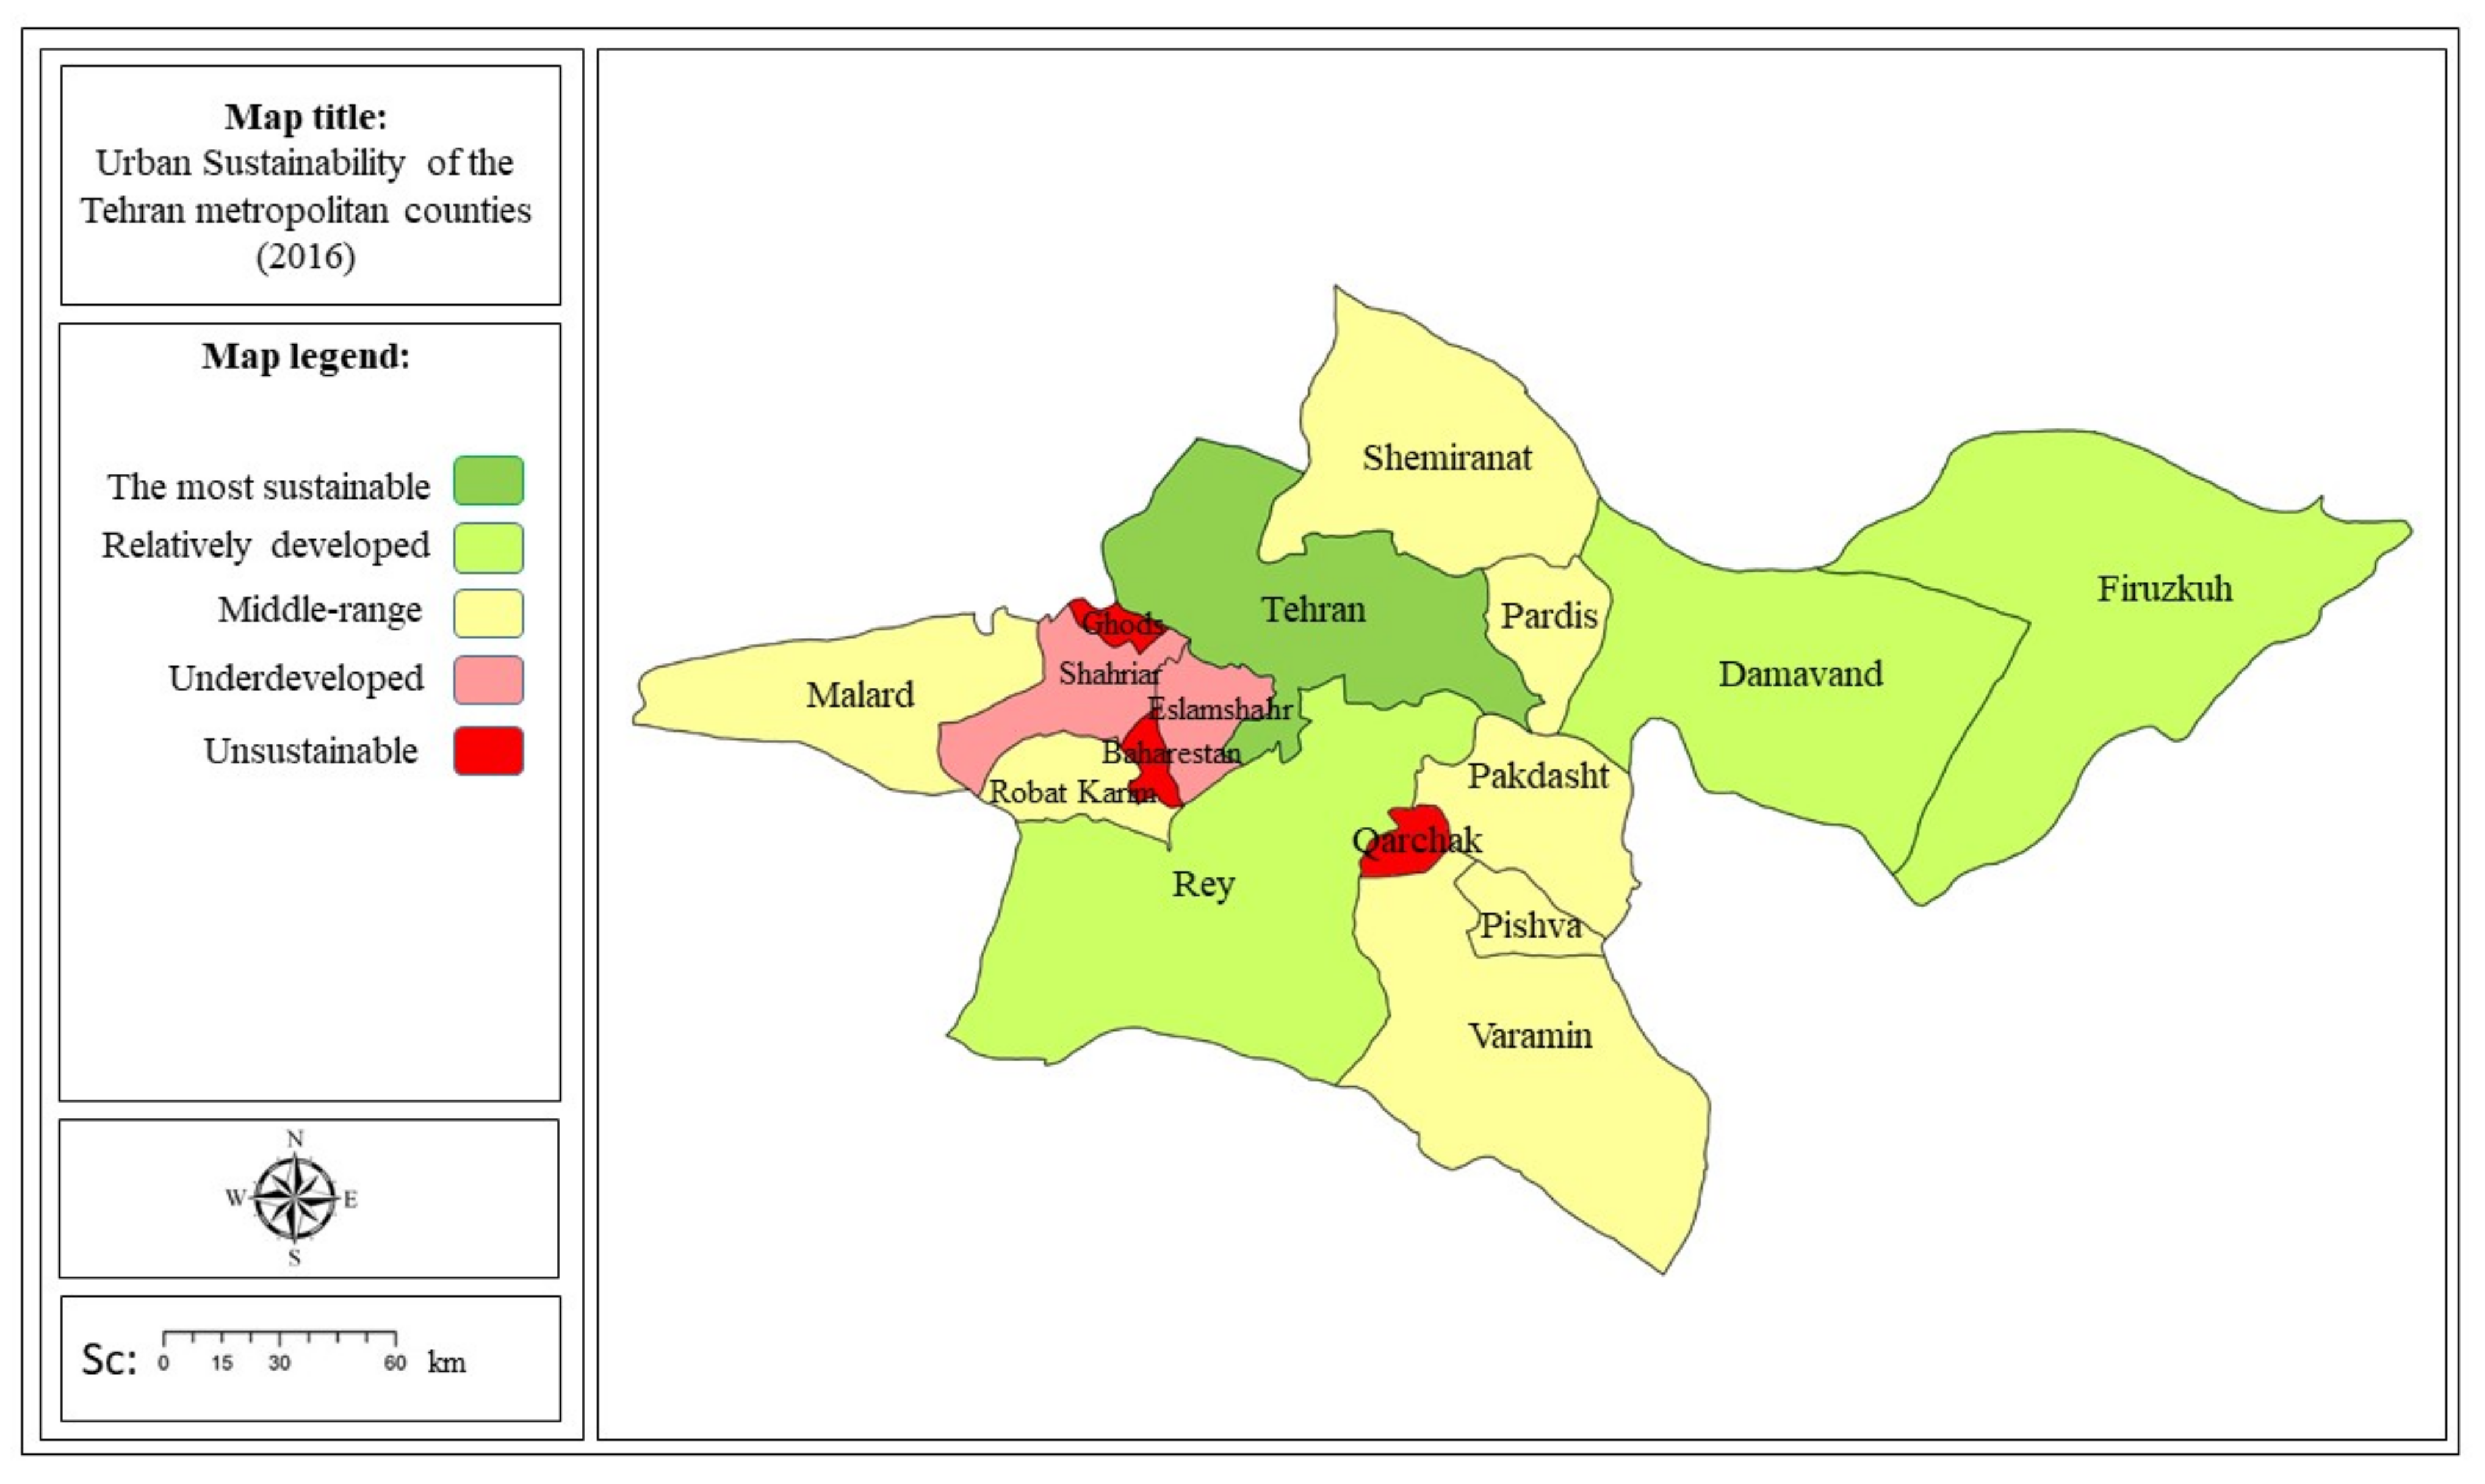
| Legend | 2006 | 2011 | 2016 | |||
|---|---|---|---|---|---|---|
 | County | FANP Result | County | FANP Result | County | FANP Result |
| Tehran | 0.482 | Tehran | 0.534 | Tehran | 0.58 | |
| Shahriar | 0.339 | Firuzkuh | 0.381 | Firuzkuh | 0.389 | |
| Damavand | 0.327 | Damavand | 0.338 | Damavand | 0.364 | |
| Rey | 0.305 | Rey | 0.324 | Rey | 0.36 | |
| Shemiranat | 0.265 | Shemiranat | 0.276 | Shemiranat | 0.297 | |
| Varamin | 0.246 | Varamin | 0.274 | Varamin | 0.27 | |
| Pakdasht | 0.231 | Robat Karim | 0.26 | Robat Karim | 0.257 | |
| Eslamshahr | 0.219 | Pishva | 0.258 | Pishva | 0.252 | |
| Karaj | 0.214 | Pardis | 0.252 | Pardis | 0.242 | |
| Firuzkuh | 0.209 | Malard | 0.22 | Malard | 0.237 | |
| Robat Karim | 0.203 | Pakdasht | 0.21 | Pakdasht | 0.232 | |
| Savojbolagh | 0.184 | Eslamshahr | 0.186 | Eslamshahr | 0.207 | |
| Nazar Abad | 0.153 | Shahriar | 0.144 | Shahriar | 0.205 | |
| Ghods | 0.141 | Qarchak | 0.193 | |||
| Ghods | 0.176 | |||||
| Baharestan | 0.168 | |||||
| Sustainability Transition | |
|---|---|
| County | Trend |
| Tehran |  |
| Firuzkuh |  |
| Damavand |  |
| Rey |  |
| Shemiranat |  |
| Varamin |  |
| Robat Karim |  |
| Pishva |  |
| Pardis |  |
| Malard |  |
| Pakdasht |  |
| Eslamshahr |  |
| Shahriar |  |
| Qarchak |  |
| Ghods |  |
| Baharestan |  |
| Legend | |
 | Progression in sustainability |
 | Stay untouched |
 | Regression in sustainability |
Publisher’s Note: MDPI stays neutral with regard to jurisdictional claims in published maps and institutional affiliations. |
© 2022 by the authors. Licensee MDPI, Basel, Switzerland. This article is an open access article distributed under the terms and conditions of the Creative Commons Attribution (CC BY) license (https://creativecommons.org/licenses/by/4.0/).
Share and Cite
Hassanzadehkermanshahi, K.; Shirowzhan, S. Measuring Urban Sustainability over Time at National and Regional Scale for Addressing United Nations Sustainable Development Goal (SDG) 11: Iran and Tehran as Case Studies. Sustainability 2022, 14, 7402. https://doi.org/10.3390/su14127402
Hassanzadehkermanshahi K, Shirowzhan S. Measuring Urban Sustainability over Time at National and Regional Scale for Addressing United Nations Sustainable Development Goal (SDG) 11: Iran and Tehran as Case Studies. Sustainability. 2022; 14(12):7402. https://doi.org/10.3390/su14127402
Chicago/Turabian StyleHassanzadehkermanshahi, Keihan, and Sara Shirowzhan. 2022. "Measuring Urban Sustainability over Time at National and Regional Scale for Addressing United Nations Sustainable Development Goal (SDG) 11: Iran and Tehran as Case Studies" Sustainability 14, no. 12: 7402. https://doi.org/10.3390/su14127402
APA StyleHassanzadehkermanshahi, K., & Shirowzhan, S. (2022). Measuring Urban Sustainability over Time at National and Regional Scale for Addressing United Nations Sustainable Development Goal (SDG) 11: Iran and Tehran as Case Studies. Sustainability, 14(12), 7402. https://doi.org/10.3390/su14127402