Article

Estimation of Terrestrial Net Primary Productivity in the Yellow River Basin of China Using Light Use Efficiency Model

National Climate Center, China Meteorological Administration, 46 Zhonguancun South Avenue, Beijing 100081, China
*
Author to whom correspondence should be addressed.
Sustainability 2022, 14(12), 7399; https://doi.org/10.3390/su14127399
Submission received: 8 May 2022 / Revised: 12 June 2022 / Accepted: 14 June 2022 / Published: 16 June 2022

Abstract

:
The net primary productivity (NPP) of vegetation is an essential factor of ecosystem functions, including the biological geochemical carbon cycle, which is often impacted by climate change and human activities. It plays a significant role in comprehending the nature of carbon balance in an ecosystem and demonstrates the global and regional carbon cycle dynamics. The present study used an upgraded CASA model to calculate the NPP in the Yellow River Basin (YRB), China. The model’s simulation ability was improved by changing the model parameters. Further, the CASA model was validated by comparing with MODIS-NPP and in situ observed NPP, wherein the accuracy of the CASA model estimation was found satisfactory to estimate NPP changes in the study area. The simulated results of the improved CASA model showed that the mean annual NPP value of vegetation in the YRB was 283.4 gC m–2 a–1 from 2001 to 2020, with a declining trend in spatial distribution from south to north. In contrast, the NPP appeared as an increasing trend in the YRB temporally from 212 gC m–2 a–1 in 2001 to 342 gC m–2 a–1 in 2020, with a mean annual growth rate of 4.6 gC m–2 a–1. The total NPP in the YRB increased by 40,088.3 GgC between 2001 and 2020, from 226.06 TgC to 266.15 TgC. This rise can be attributed to the increase in forests. The average grassland area has reduced by 4651 km2 during the last two decades, significantly impacting the total NPP of grasslands. Although the increase in NPP in wetlands was minimal, accounting for 815.53 GgC, the highest change percentage of 79.78%, could be observed among the six vegetation types due to the anthropogenic influences and climate change. The conditions favorable for vegetation growth and a sustained environment were enhanced by the increased precipitation and temperature and the reinforced ecological protection by the government.

1. Introduction

Dry matter estimation is essential for determining the status and flux of biological materials in an ecosystem and for understanding the dynamics of the ecosystem [1,2]. The total amount of photosynthetic carbon ingestion by a green canopy is regarded as terrestrial net primary productivity (NPP) [3,4]. NPP plays an important role in the global and regional carbon cycle dynamics and is widely used to understand the nature of carbon balance [5]. NPP is an integral part of the carbon biological geochemical cycle connecting the atmospheric CO2 and terrestrial ecosystem [6,7,8,9]. NPP is often used to evaluate herbivory consumption as a structural and functional indicator of an ecosystem. It reflects energy and matter in an ecosystem and is a basic indicator of ecosystem stability and ecological balance [10,11].
The NPP of vegetation is an essential factor and ecological index that can directly reflect changes in an ecosystem and a regional carbon budget [12,13]. The basis of ecosystem energy flow and the material cycle is vegetation productivity, the total amount of dry matter that green plants can fix per unit time and unit area, directly related to an ecosystem carbon sink, is known as NPP [14]. It can be used to estimate the support capacity of the earth system quantitatively and assess the level of stable development of the ecosystem [15,16].
Light use efficiency (LUE)-based models such as CASA, GLOPEM, and TURK have been widely used to calculate NPP using remote sensing data at various scales and may be useful for the future predictions regarding the dry matter dynamics of the specific ecosystems [17,18,19]. The Carnegie–Ames–Stanford-Approach (CASA) model, developed by Potter et al. (1993) and Field et al. (1995), is an enhanced LUE model, which derives NPP from vegetation indices derived from remote sensing data, field NPP observations, and climatic parameters such as solar radiation, temperature, and precipitation [20,21]. This type of model can be used to examine and calculate NPP on a global and regional basis [22,23,24,25]. The present study uses an upgraded CASA model to simulate the NPP in the YRB, adjusts and optimizes model parameters, assesses the impact of climate change and human interferences on NPP, and thereby analyzes the accessibility of the CASA model in the YRB China.
The widely available remote sensing images were used in the CASA model to estimate the NPP in the basin. The performance of the CASA model was evaluated by comparing the MODIS-NPP and in situ NPP. Hence, the objectives of this research were to (1) evaluate the consistency and uncertainty in estimating terrestrial ecosystem productivity, (2) validate the NPP with the in situ measurements and multi-model estimation, (3) assess the spatiotemporal variations in NPP and the total Carbon in the YRB, and (4) analyze the influence factors on NPP changes.

2. Materials and Methods

2.1. Study Area

The Yellow River flows through nine provinces, including Qinghai, Sichuan, Ningxia, Gansu, Inner Mongolia, Shanxi, Shaanxi, Henan, and Shandong, and begins on the Qinghai Tibet Plateau. It is the secondly longest river in China after the Yangtze River, with a length of 5464 km. The geographical coordinates of the basin are 95°35′ to 119°05′ E and 32°10′ to 41°50′ N, with east–west and north–south distances of 1900 km and 1100 km, respectively, and a drainage area of about 794,500 km2. The runoff of the Yellow River accounts for 2% of that of the country. The entire population of the provinces in the basin is 420 million, which is 30.3% of the national population of China, while the regional GDP of the basin is estimated as 23.9 trillion yuan, which is 26.5% of the national GDP.
The YRB is divided into several climatic zones based on its diverse climate patterns, including the plateau sub-cold zone, the temperate plateau zone, the middle temperate zone, the warm temperate zone, and the north subtropical zone. The elevation of the basin terrain ranges from 0 to 6133 m, with higher and lower values in the eastern and western parts, respectively, dividing the basin into three categories (Figure 1).
The first category has an altitude of 3000~5000 m and is located toward the northeast of the Qinghai-Tibet Plateau, a glacier landform where perennial snow covers the mountain top. The second category is characterized by an altitude of 1000~2000 m and is constituted by the Yellow River Hetao Plain, the Ordos Plateau, the Loess Plateau, Qinling Mountain, and Taihang Mountain, bounding on the east by Taihang Mountain. The third category has an altitude of 0–500 m and extends from the east of Taihang Mountain to the seashore, with a few mountains rising above 1000 m. The basin’s physiognomies are diverse and complex, with plains, deserts, gobi, loess plateau, wavy plateau, tableland, hills and mountains, riverine land, and so on. The vegetation growth has strong relationship between soil types [26,27]. From the original area of Yellow River to Longqing Gorge, the soil types are alpine cold desert soil, alpine meadow soil, and alpine grassland soil. Most of the Loess Plateau is covered by loess, which is the most concentrated and thickest area of loess in the world. The areas below Taohua Valley are mainly brown soil, cinnamon soil, and Chao soil [28].
The YRB is mostly arid and semi-arid, wherein the west to east section is occupied by plateau mountainous climate zones, temperate continental climate zones, and temperate monsoon climate zones across the country. The light, heat, water, and other natural resources are unevenly distributed across the country. The basin climate has changed significantly in response to global warming, evidenced by a generally warm and wet trend towards the upper reaches and a warm and dry trend toward the middle and lower reaches. The basin’s annual average temperature, precipitation, and evapotranspiration are 9.5 °C, 466.5 mm, and 653.6 mm, respectively [29].

2.2. Data Preparation and Processing

The current study relied on data from the remote sensing, land cover, and climate. NASA’s EOS/MODIS portal provided access to remote sensing data of mod17A3 yearly NPP and monthly mod13A2 Normalized Difference Vegetation Index (NDVI) of China land vegetation from 2001 to 2020. The vegetation NPP data of MOD17A2 and MOD17A3 are large-scale application at global and regional scales [30,31]. The generated annual NPP data have a spatial resolution of 1 km and is further verified independently to evaluate the accuracy [32,33]. The NDVI data were downloaded from the moderate-resolution imaging spectroradiometer (MODIS) data of NASA. The generated NDVI data also have a spatial resolution of 1 km and represent the monthly cumulative value [34]. The atmospherically corrected bidirectional surfaces that have been hidden for the shadows of water bodies, clouds, heavy aerosols, and clouds relative to red light are used to generate normalized difference vegetation index products.
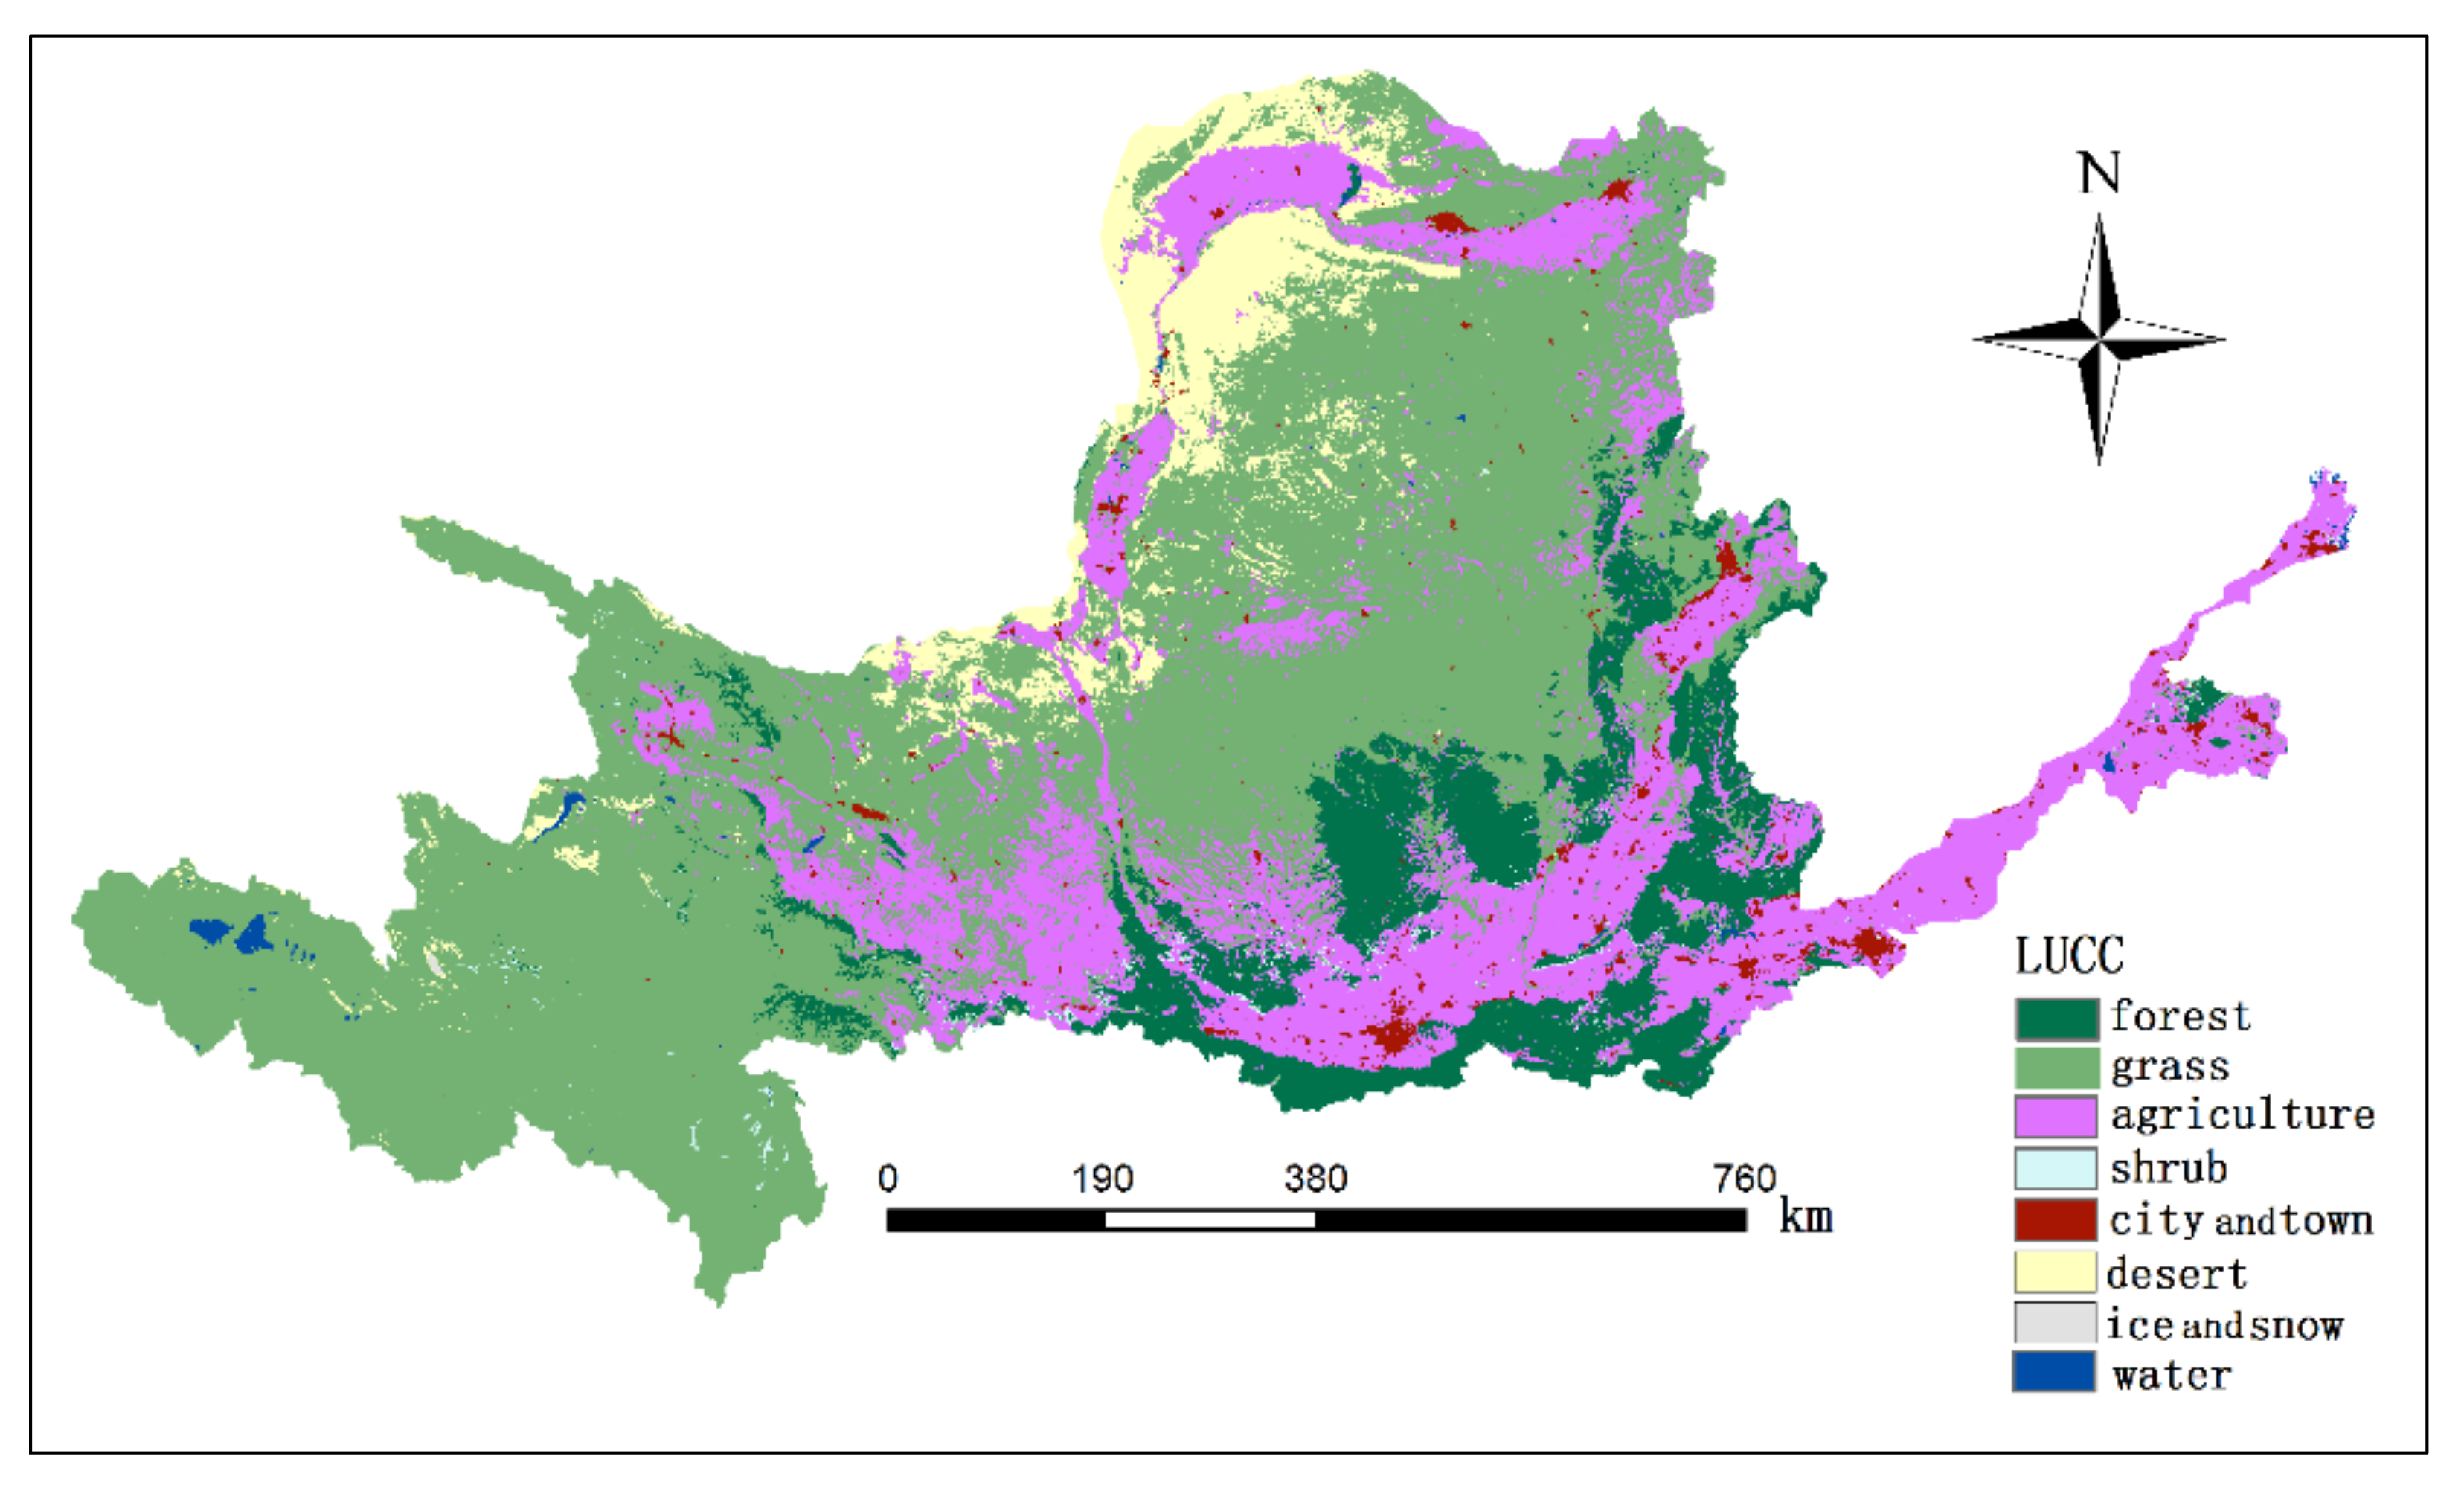
The land cover of the area, generated from EOS/MODIS data, was re-classified into 8 categories, viz., forest, grassland, agriculture, shrub, city and town, desert, ice and snow, water, based on the MCD12Q1 grades of IGBP classification scheme, and Figure 2 indicates the land cover pattern.
MRT software was used to convert the HDF to TIFF, and to re-project SIN to the WGS84/Albert equal-area conic. The quality control document (NPP QC) recommends collecting high-quality NDVI and NPP data over failed inversion and less reliable data.
The climatic data of the area were downscaled using the monthly mean temperature, monthly average precipitation, and radiation data, generated using the climatic dataset downloaded from CNIC (Chinese Meteorological Information Center). The average, maximum, and minimum temperatures were derived and normalized to match the spatial resolution of 1 km.

2.3. Simulation of NPP

2.3.1. Analytical Framework

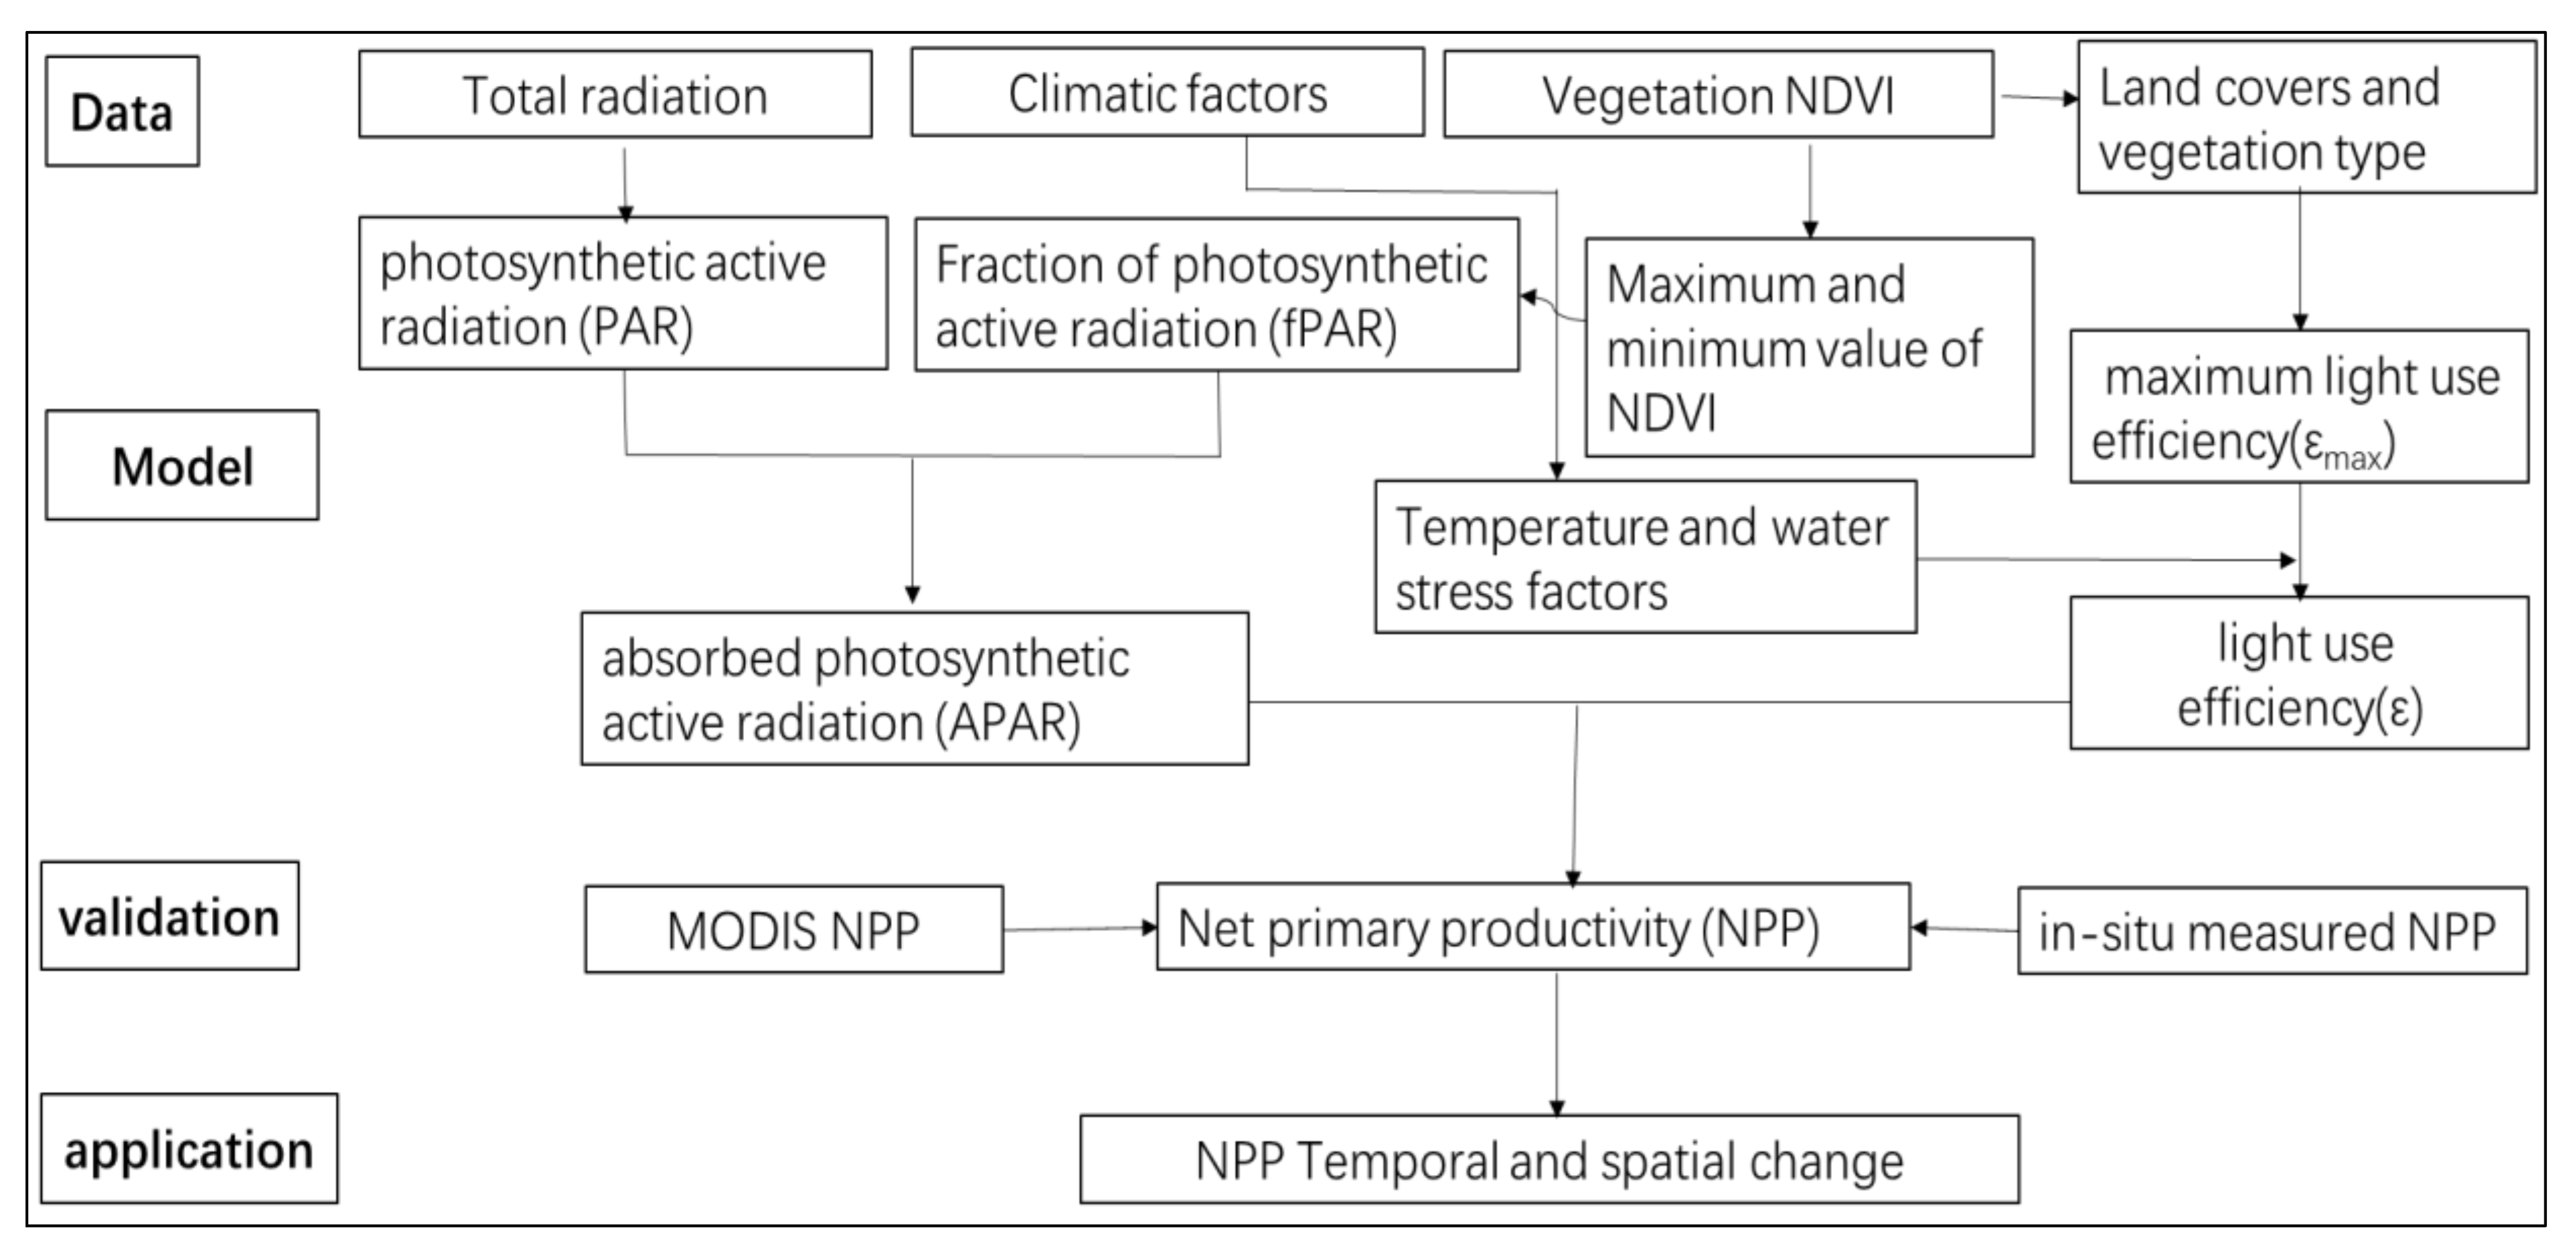
CASA model is a vegetation NPP mechanism model based on the physiological process of vegetation, which is widely used in large-scale vegetation NPP simulation and global carbon cycle study. In present study, the CASA model is used to simulate NPP. In order to increase the simulation ability of the model, its parameters should be optimized. The input data include climate data and satellite remote sensing data. The model works in an ENVI5 environment, and with ArcGIS 10.0, it can process remote sensing and climate data. It generates grid data through ArcGIS interpolation. The key model parameter, the maximum LEU rate, is established according to different vegetation types, which improves the simulation performance of the model. The model results are compared with MODIS-NPP and measured NPP. Then the model is used to simulate the inter-annual and spatial dynamic changes of NPP in the YRB and analyze the reasons of NPP changes. All NPP were quantified and mapped at 1000 m resolution from 2000 to 2010. MS Excel was used for correlation, trend, and statistical analyses, and the flow chart is shown in Figure 3.

2.3.2. Simulation of NPP

CASA model estimates the monthly NPP and gross primary productivity (GPP) using various aspects such as satellite data, monthly precipitation, monthly temperature, and soil characteristics [11,35,36]. It is a satellite-based LUE model that estimates NPP at monthly intervals using absorbed photosynthetically active radiation (APAR) and LUE. The plant APAR and actual LUE are used to calculate NPP using the following relation:
N P P   ( x , t ) = A P A R   ( x , t ) × ε ( x , t )
where APAR(x,t) is the photosynthetically effective radiation absorbed by pixel x in the month t, and ε(x,t) represents the actual LUE of pixel x in the month t.

2.3.3. APAR Estimation

The effective solar radiation absorbed by plant and the absorption rate of the plant to the incident photosynthetically active radiation are utilized to calculate APAR, using the following equation:
A P A R   ( x , t ) = S O L   ( x , t ) × F P A R   ( x , t ) × 0.5
where SOL(x,t) is the total solar radiation at pixel x in month t and FPAR(x,t) indicates the absorption rate of plant to the incident photosynthetic effective radiation.

2.3.4. FPAR Estimation

FPAR, an important variable proposed by the Global Climate Observation System (GCOS), refers to the ratio of photosynthetically effective radiation (PAR) absorbed by vegetation, which generally ranges in wavelength from 400 to 700 nm to all the effective radiation reaching the top of the canopy. It indicates the capacity of vegetation to absorb photosynthetically effective radiation and is closely associated with the vegetation structure. FPAR is a widely used input parameter for calculating the GPP and NPP of terrestrial ecosystem vegetation using remote sensing. The maximum value and minimum value of NDVI and the corresponding maximum value and minimum value of FPAR are linearly connected, using the following relation.
F P A R   ( x , t ) = ( N D V I   ( x , t ) N D V I i , min ) ( N D V I i , max N D V I i , min ) × ( F P A R max F P A R min ) + F P A R min
where NDVIi,max and NDVIi,min, respectively, represent the maximum value and minimum value of NDVI of the ith vegetation type.
There is a robust linear relationship between FPAR and the ratio vegetation index (SR) [37], it can be expressed by the following equation:
F P A R ( x , t ) = ( S R ( x , t ) S R i , min ) ( S R i , max S R i , min ) × ( F P A R max F P A R min ) + F P A R min
where the values of FPARmin and FPARmax are 0.001 and 0.95, respectively, independent of vegetation type; SRi,max and SRi,min correspond to 95% and 5% lower percentile of NDVI of the ith vegetation type, respectively. SR(x,t) is expressed by the following equation:
S R ( x , t ) = 1 + N D V I ( x , t ) 1 N D V I ( x , t )
A comparative evaluation of the measured values and FPAR estimated by SR and NDVI appears that the FPAR calculated by NDVI is higher than the measured value. In contrast, the estimated FPAR is less than the measured value, with fewer errors observed in the latter when compared to the former. Hence, FPAR is defined as the weighted average or average value of the results of these two estimation approaches and can be represented by the following relation:
F P A R   ( x , t ) = α F P A R N D V I + ( 1 α ) F P A R S R

2.3.5. LUE Estimation

Environmental factors such as air temperature, soil moisture status, and the difference in atmospheric water and vapor pressures can affect vegetation NPP.
ε ( x , t ) = T ε 1 ( x , t ) × T ε 2 ( x , t ) × W ε ( x , t ) × ε max
where Tε1(x,t) and Tε2(x,t) indicates the stress effect of low temperatures and high temperatures on LUE; Wε(x,t) is the coefficient of water stress; εmax is the L U E max .
Monthly maximum LUE values vary significantly with vegetation types. The maximum LUE rate of global vegetation estimated by the CASA model is 0.389 gC MJ–1 [38,39,40] and employed the least square method to simulate the maximum light energy utilization (LUE) rate of typical vegetation in China based on the estimation methods of NPP using remote sensing and modeling. Comparing the simulation results of the LUE rate model with the physiological and ecological process model shows that the latter provide comparably higher-level reliability and stability. This article establishes the maximum LUE rate of typical vegetation types in China (Table 1).

2.3.6. Temperature Stress Factors Estimation

The stress effect of lower temperature on LUE, Tε1(x,t), is a measure of the internal biochemical activity of plants on photosynthesis at lower and higher temperatures, which reduces the primary productivity.
T ε 1 x , t = 0.8 + 0.02 × T o p t x 0.0005 × T o p t x 2
where Topt(x) indicates the optimum temperature for vegetation growth, it is the average monthly temperature as NDVI values come to the maximum in a growing season.
Tε1 indicates that as the ambient temperature deviates from the optimal temperature Topt(x) to higher and lower temperatures, the LUE rate of plants decreases gradually due to the minimal LUE rates in response to the high respiratory consumption rates. The LUE rate of vegetation decreases when they grow at temperatures other than optimal temperature.
T ε 2 ( x , t ) = 1.184 / { 1 + exp [ 0.2 × ( T o p t ( x ) 10 T ( x , t ) ) ] } ×   1 / { 1 + exp [ 0.3 × ( T o p t ( x ) 10 + T ( x , t ) ) ] }
When 10   ° C T x , t 13   ° C , then T (x,t) is equivalent to 2(x,t), and Topt(x) is equivalent to the half of 2(x,t).

2.3.7. Water Stress Factors Estimation

Water stress influence coefficient Wε(x,t) represents the impact of effective water conditions exposed by the vegetation on its LUE. With the increase in Wε(x,t) gradually increases with sufficient water in the environment, and its values range from 0.5 for extreme drought conditions to 1 for humid conditions.
W ε ( x , t ) = 0.5 + 0.5 × E E T   ( x , t ) / E P T   ( x , t )
where EET represents the actual evapotranspiration (mm), and EPT indicates the potential evapotranspiration (mm).

3. Results

3.1. Validation of CASA Model NPP

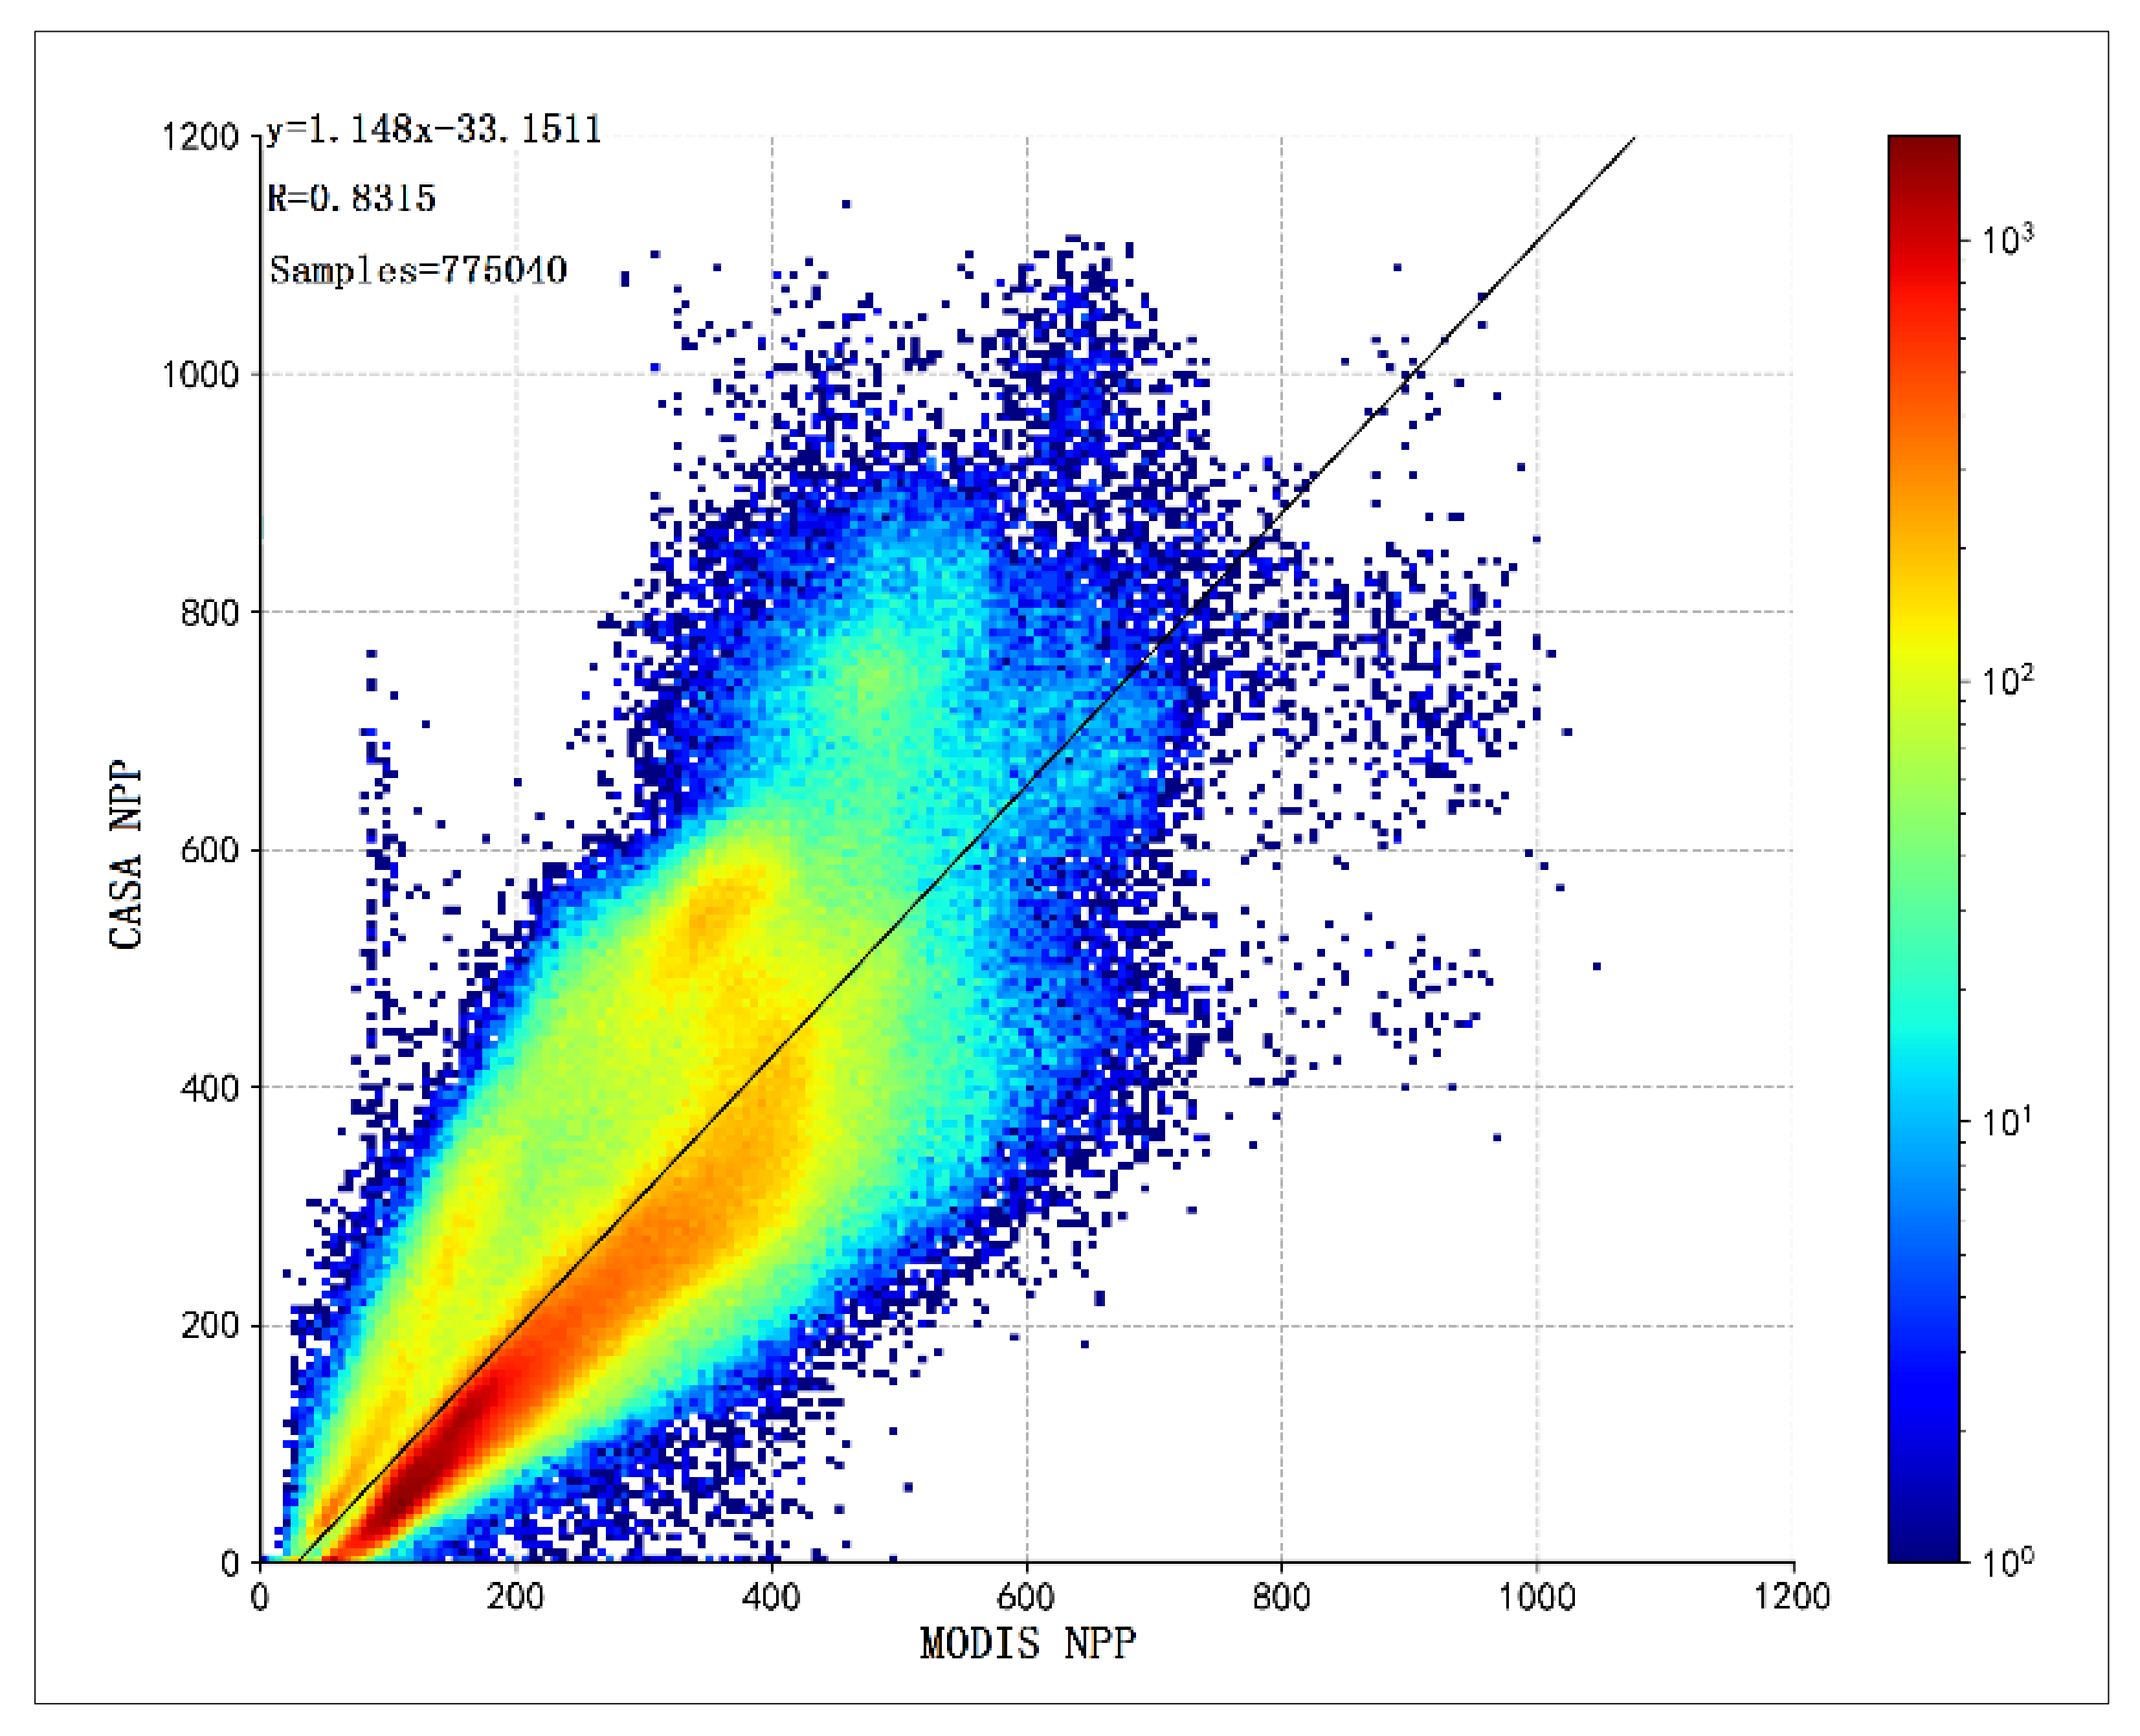
The NPP generated by the CASA model was validated by comparing its NPP values derived from MODIS, as shown in Figure 3. NPP is derived from the Mod17A3 NPP product dataset using the BIOME-BGC model and the LUE model. The former is a widely applied model for estimating the NPP of vegetation in ecological processes, and it simulates the daily biogeochemical cycle in terrestrial ecosystem vegetation and soil with comparable accuracy. The ecosystem carbon storage, the carbon balance among the atmosphere, community, and soil, and the circulation of nitrogen and water under different climatic conditions, can be calculated by the BIOME-BGC model. The product has been properly evaluated and is widely applied to determine vegetation growth status, biomass, environmental monitoring, carbon cycle, and global climate change [41,42]. The comparison of the results of NPP estimated using MODIS and that estimated by CASA model is shown in the scatter plot (Figure 4). The accuracy of CASA model estimation is satisfactory in investigating the spatiotemporal variations in NPP in the YRB, evidenced by a strong linear relationship with an R of 0.8315 and p-value < 0.01.
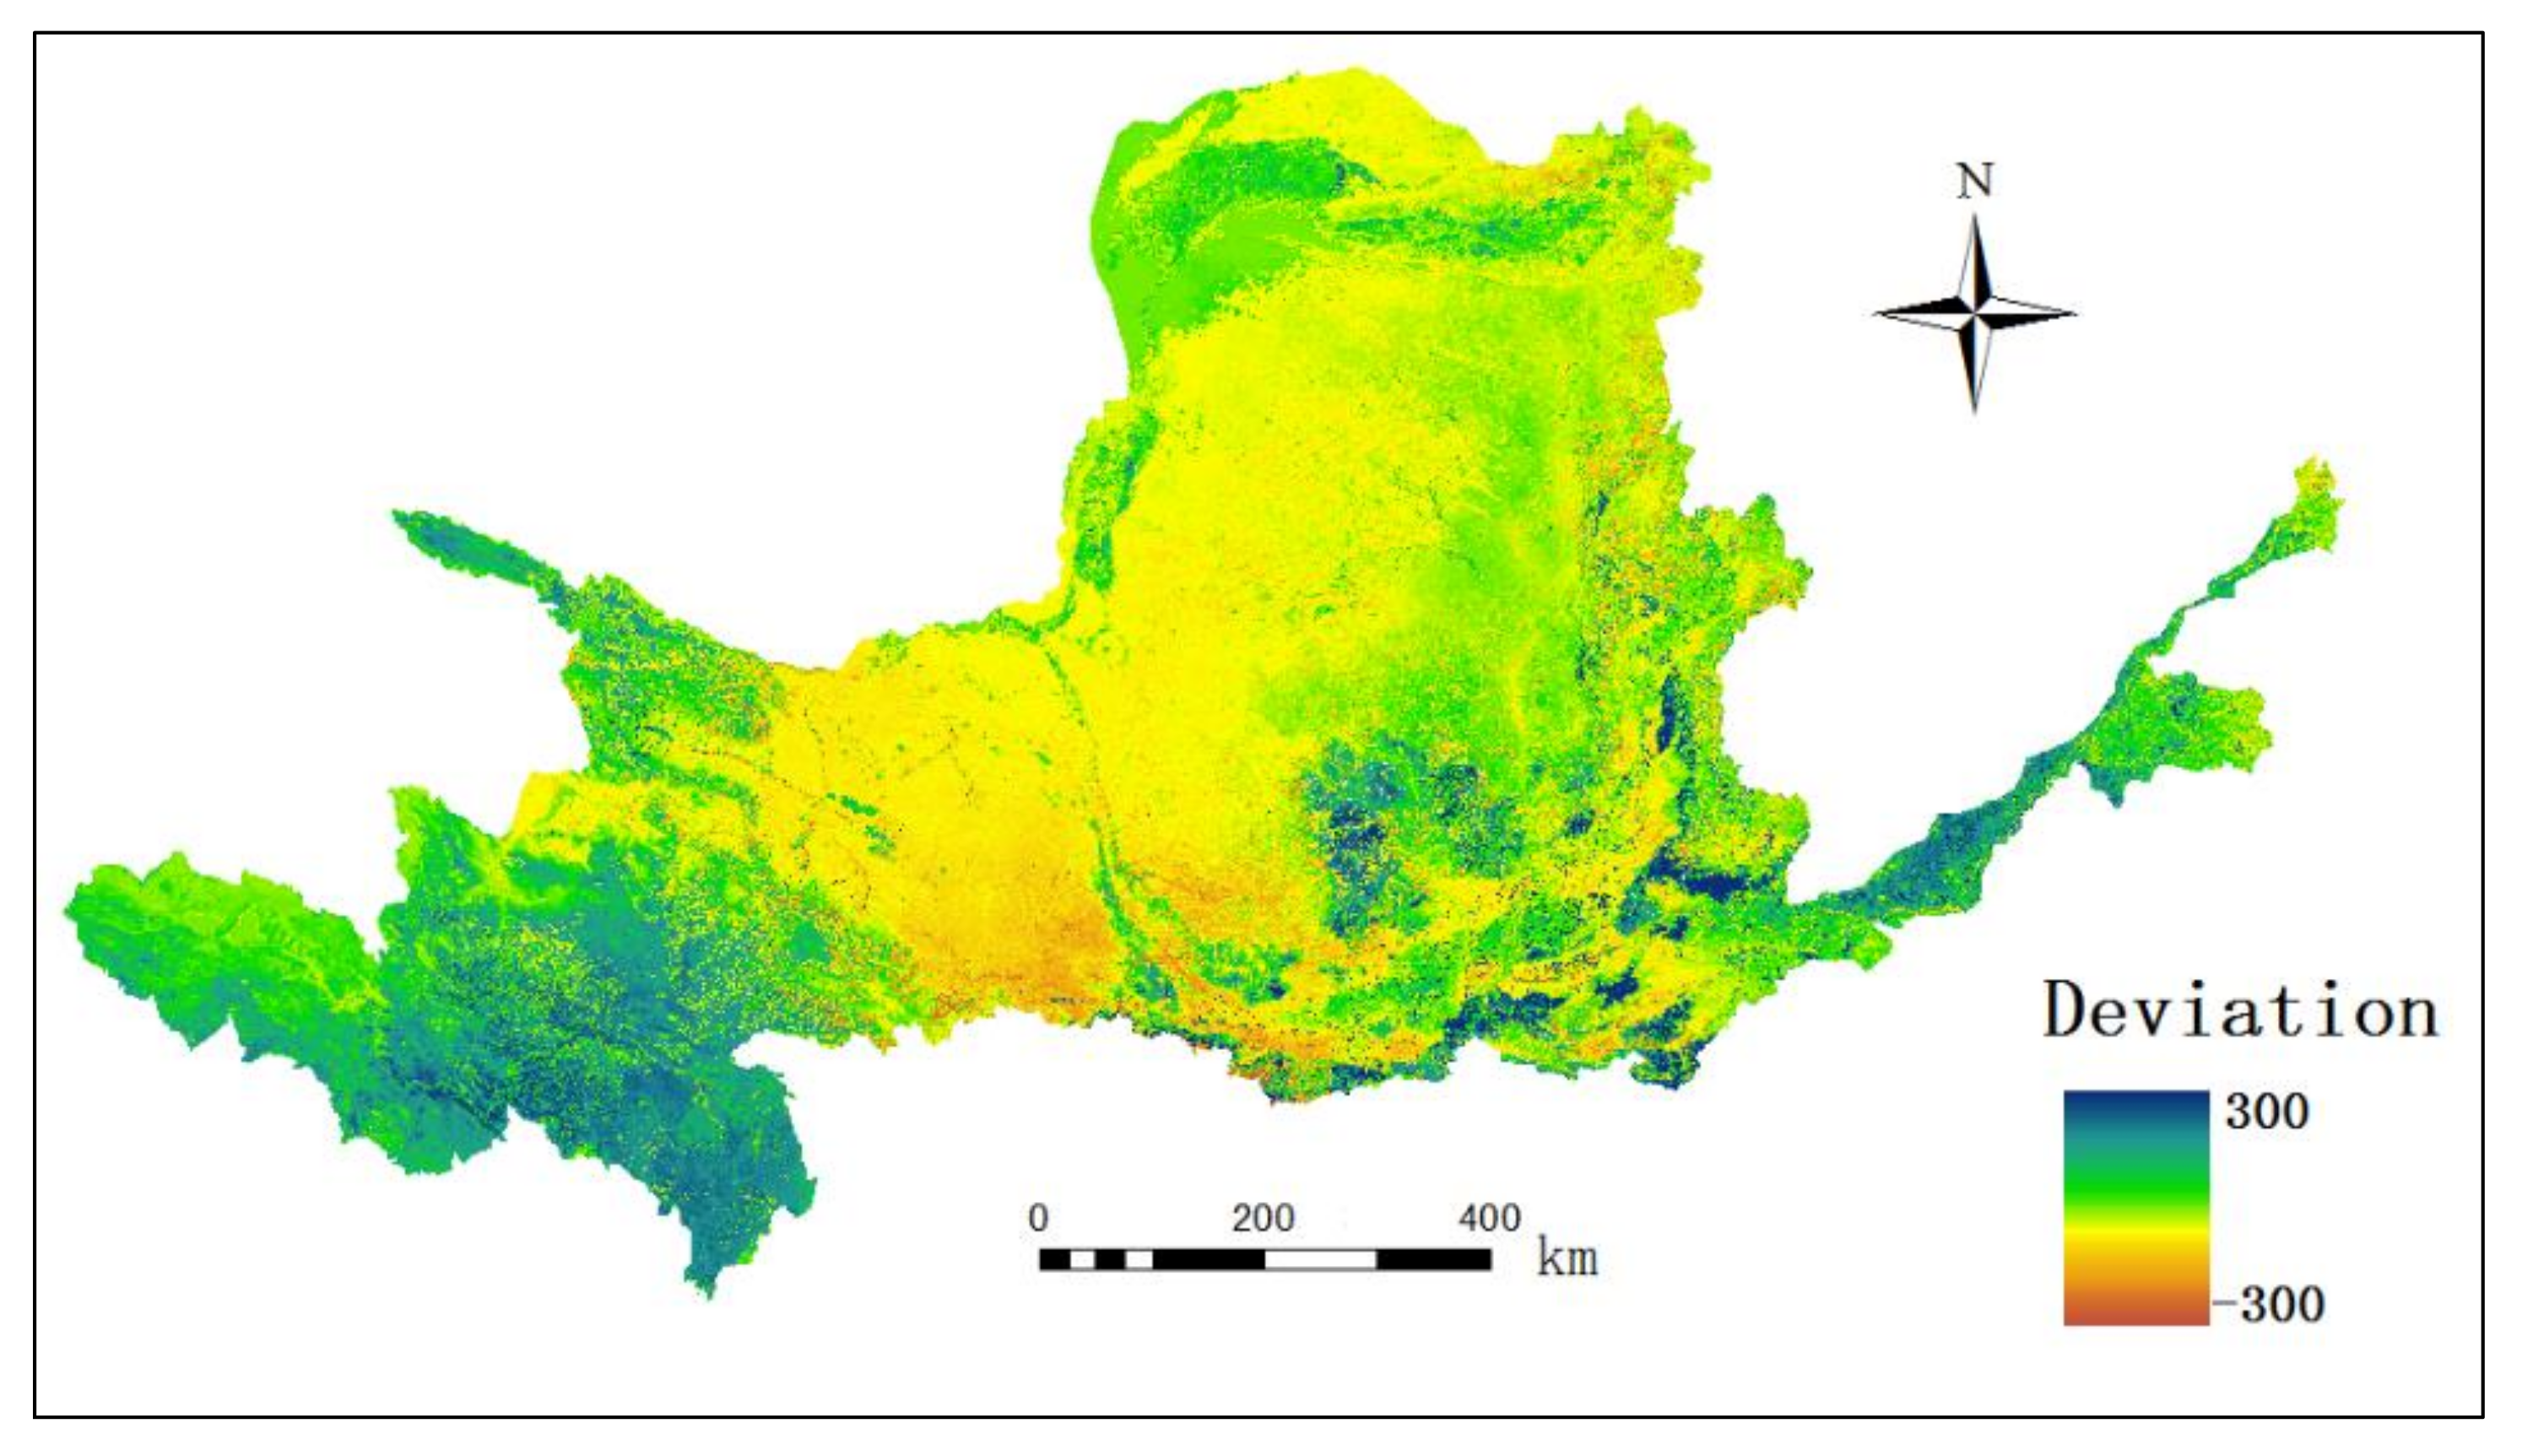
The final results of the simulations could be optimized based on the CASA model and MODIS model. The average NPP of the YRB estimated by MODIS is 275 gC m–2 a–1, while that simulated by the CASA model is 283.4 gC m–2 a–1, which is 3% higher than the former. The spatial distribution of the difference in NPP estimated by both the methods shows that the simulated NPP is comparably higher toward the western, eastern, and lower parts of the YRB, while the simulated values are less toward the western parts of the basin center (Figure 5) due to several factors, including vegetation type, precipitation, and temperature.
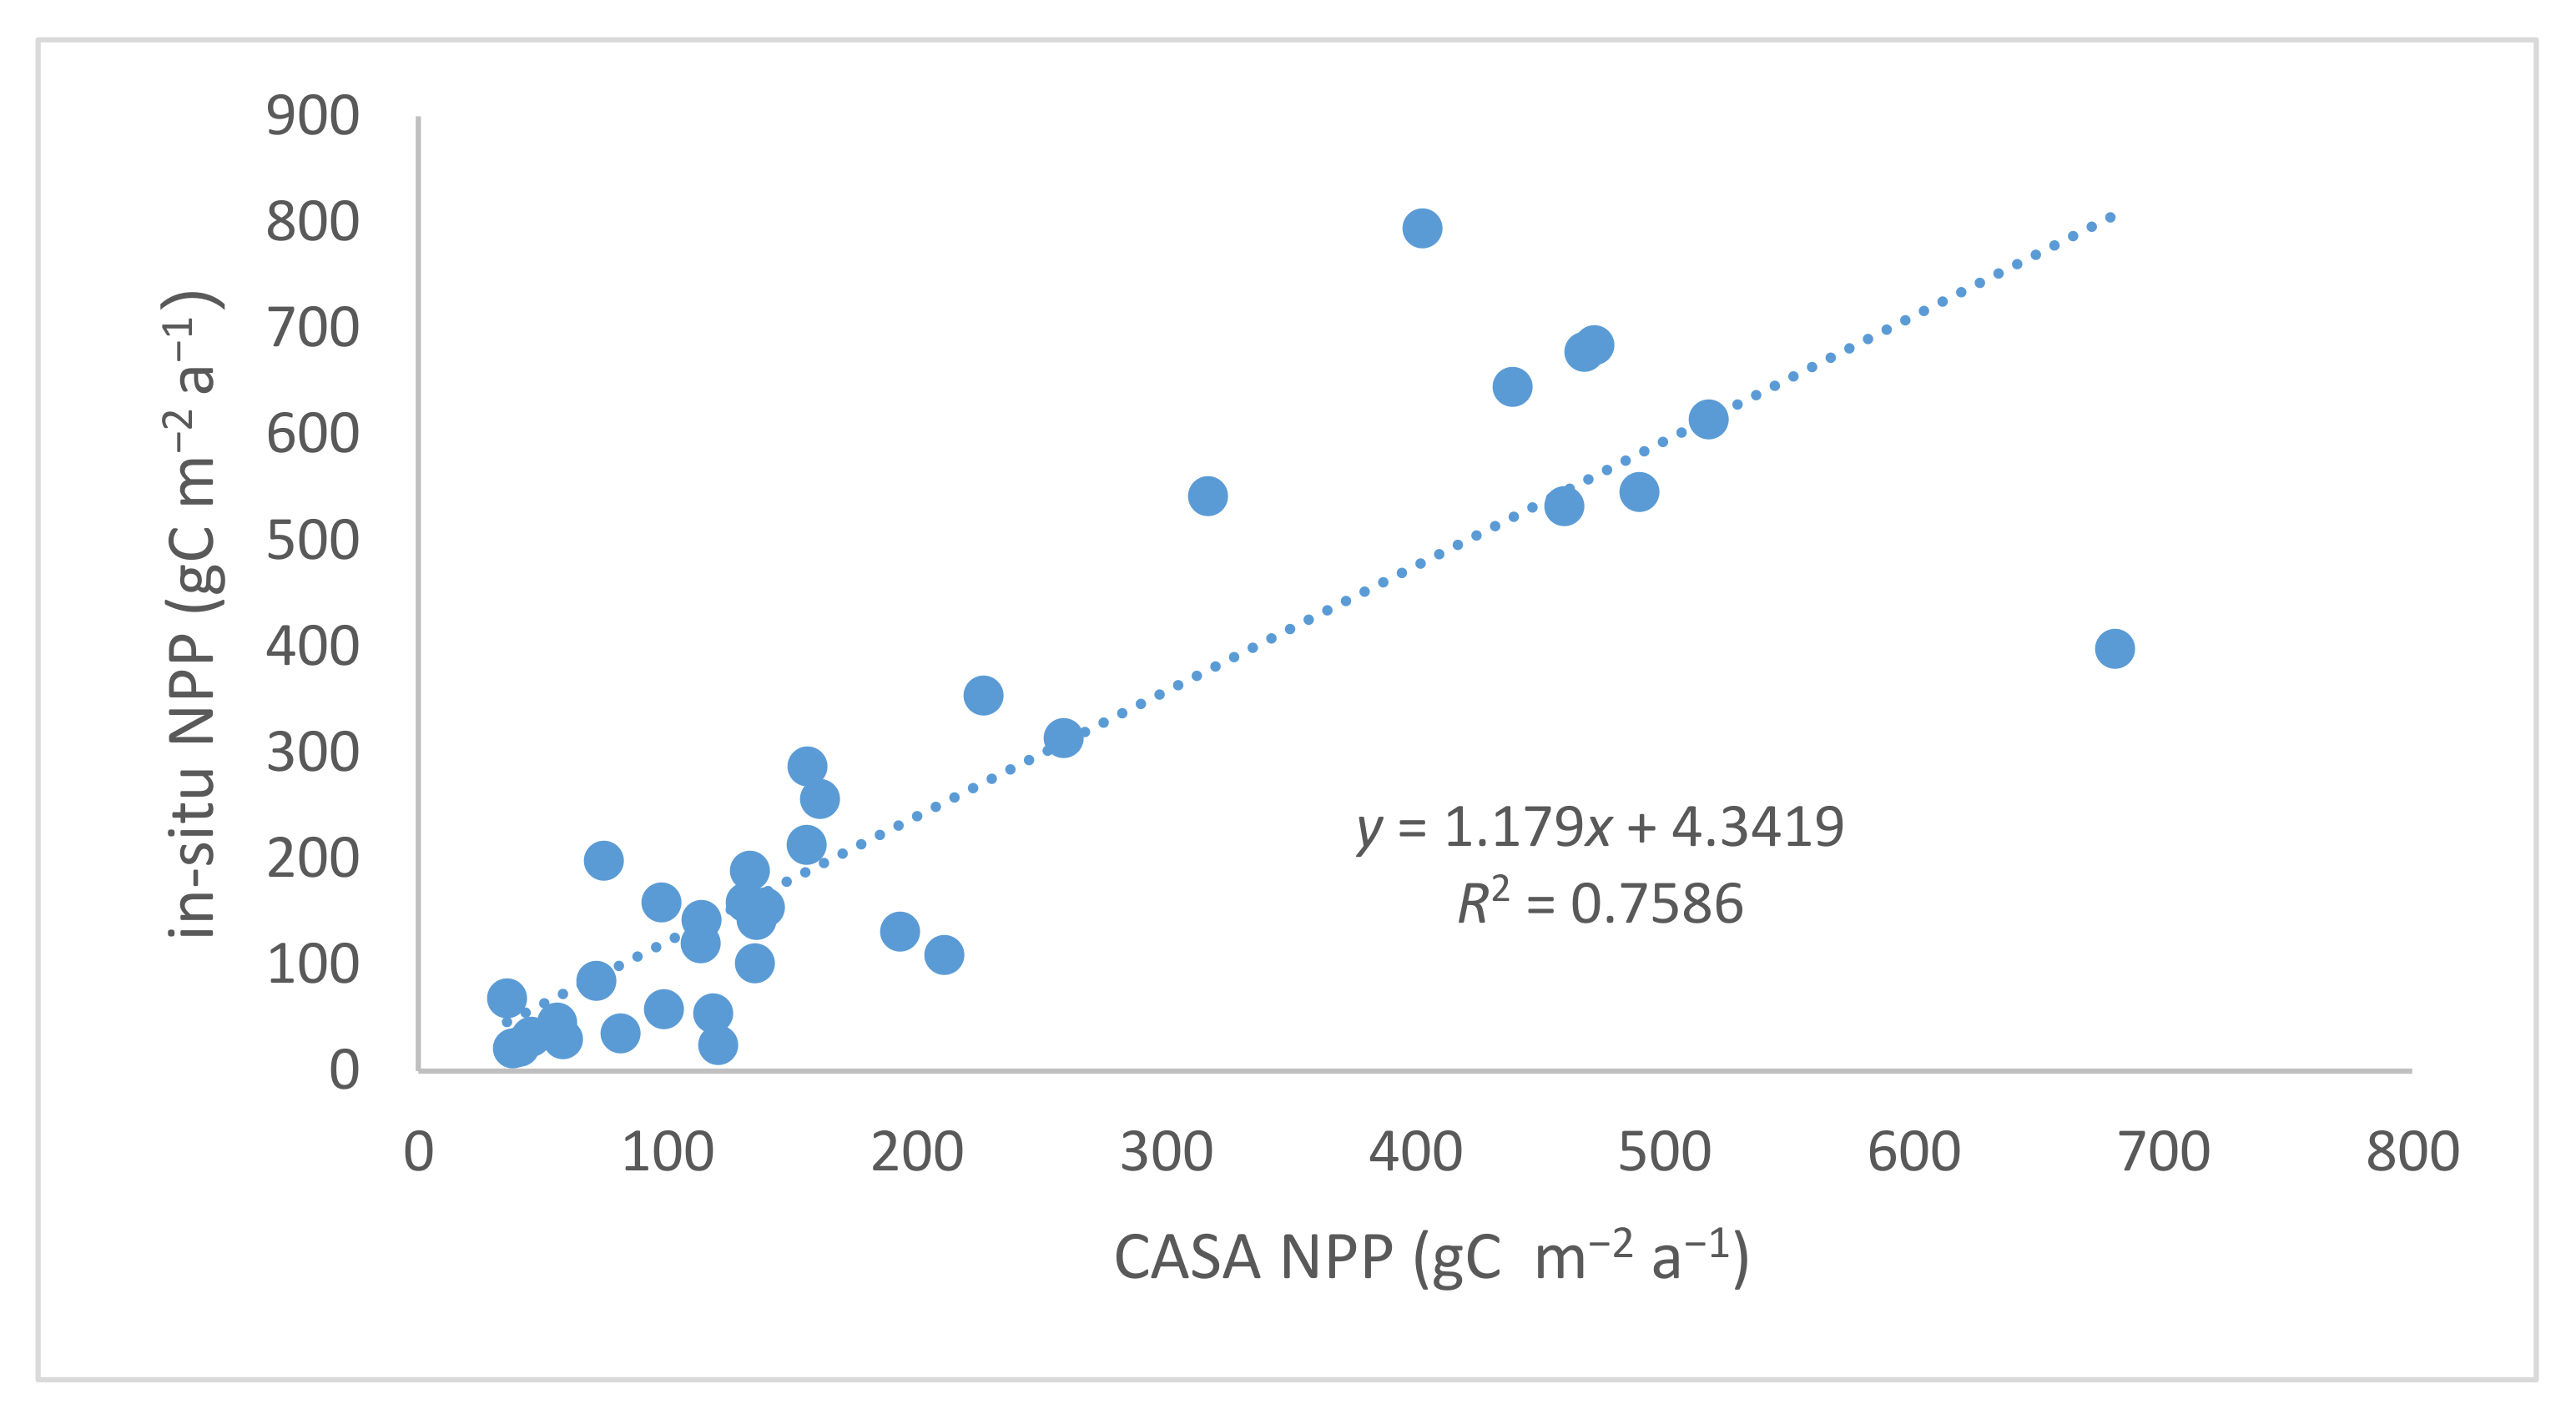
Further, the NPP estimated by the CASA model was compared with the observed NPP values reported by [43]. The model’s accuracy was verified by comparing the in situ observed NPP values for grass, shrub, and forest cover at 36 data points with the estimated results of the CASA model, as shown in Figure 6. The model is observed to provide satisfactory accuracy in investigating the temporal variations in NPP in the YRB, evidenced by an R2 value of 0.7586 and a p-value ≤ 0.01 in the scatter plot of simulated and measured NPP values (Figure 6).

3.2. Spatial Distribution of NPP in the YRB

The mean annual NPP of vegetation in the YRB for the 20 years from 2001 to 2020 was 283.4 gC m–2 a–1 and is spatially represented in Figure 7. The spatial distribution of average annual NPP of vegetation appears as a decreasing trend from south to north, with the lowest values observed towards the north, followed by the southwest, and the highest values observed towards the southeast. These spatial variations are caused by the basin’s diverse surface types and climatic conditions. Because of better hydrothermal conditions and vegetation structure, which is often forest and farmland, higher NPP values are observed in the Shaanxi Loess Plateau in the north, the Qinling Mountains in the central and southern parts, and the North China Plain in the southeast and the north. The NPP values of vegetation for the Maowusu Desert towards the middle and northern parts of the basin and Inner Mongolia towards the northern part of the basin are less due to poor natural conditions. The NPP values of vegetation for the Longzhong plateau, the Helan Mountain area, and the Qilian Mountain area in the central and western part of the basin are also more significant due to forest land planting. In contrast, the NPP values for the vast cultivated lands of the Hetao Plain are greater due to the favorable climate conditions. Similarly, the Qinghai Plateau and the Sanjiangyuan area in the western part of the basin are also found to have low vegetation NPP values due to the strong continental climate of the area, with sparse precipitation and coarse vegetation.
As part of this study, the NPP values of various ecosystems belonging to different land cover types were also calculated, and the results of the analysis are shown in Table 2. The NPP values of various land cover types, namely wetland, forest, farmland, grassland, and desert, gradually decrease (Table 2), with grassland having the highest NPP value, followed by farmland, forest, desert, and wetland. The annual NPP is estimated to be 220 TgC.
The increase in the yearly NPP of the study area is significantly affected by climate change, and hence, the relative effects of land cover and climate change on NPP were also evaluated as part of this study. Both land cover and climate change positively influenced NPP in YRB from 2001 to 2020 due to the ecological restoration projects of reforestation and forest protection, which could significantly enhance the productivity of ecosystem vegetation. Further, NPP of the ecosystem was also influenced by the temporal variations in land use patterns evidenced by an increase in forest area by 2698 km2, water body and wetlands by 2486 km2, and a reduction in grassland and deserts by 4651 km2 and 1596 km2, respectively. These variations in land-use types could significantly affect the NPP of the ecosystem.

3.3. Spatial and Temporal and Variation of NPP in the YRB

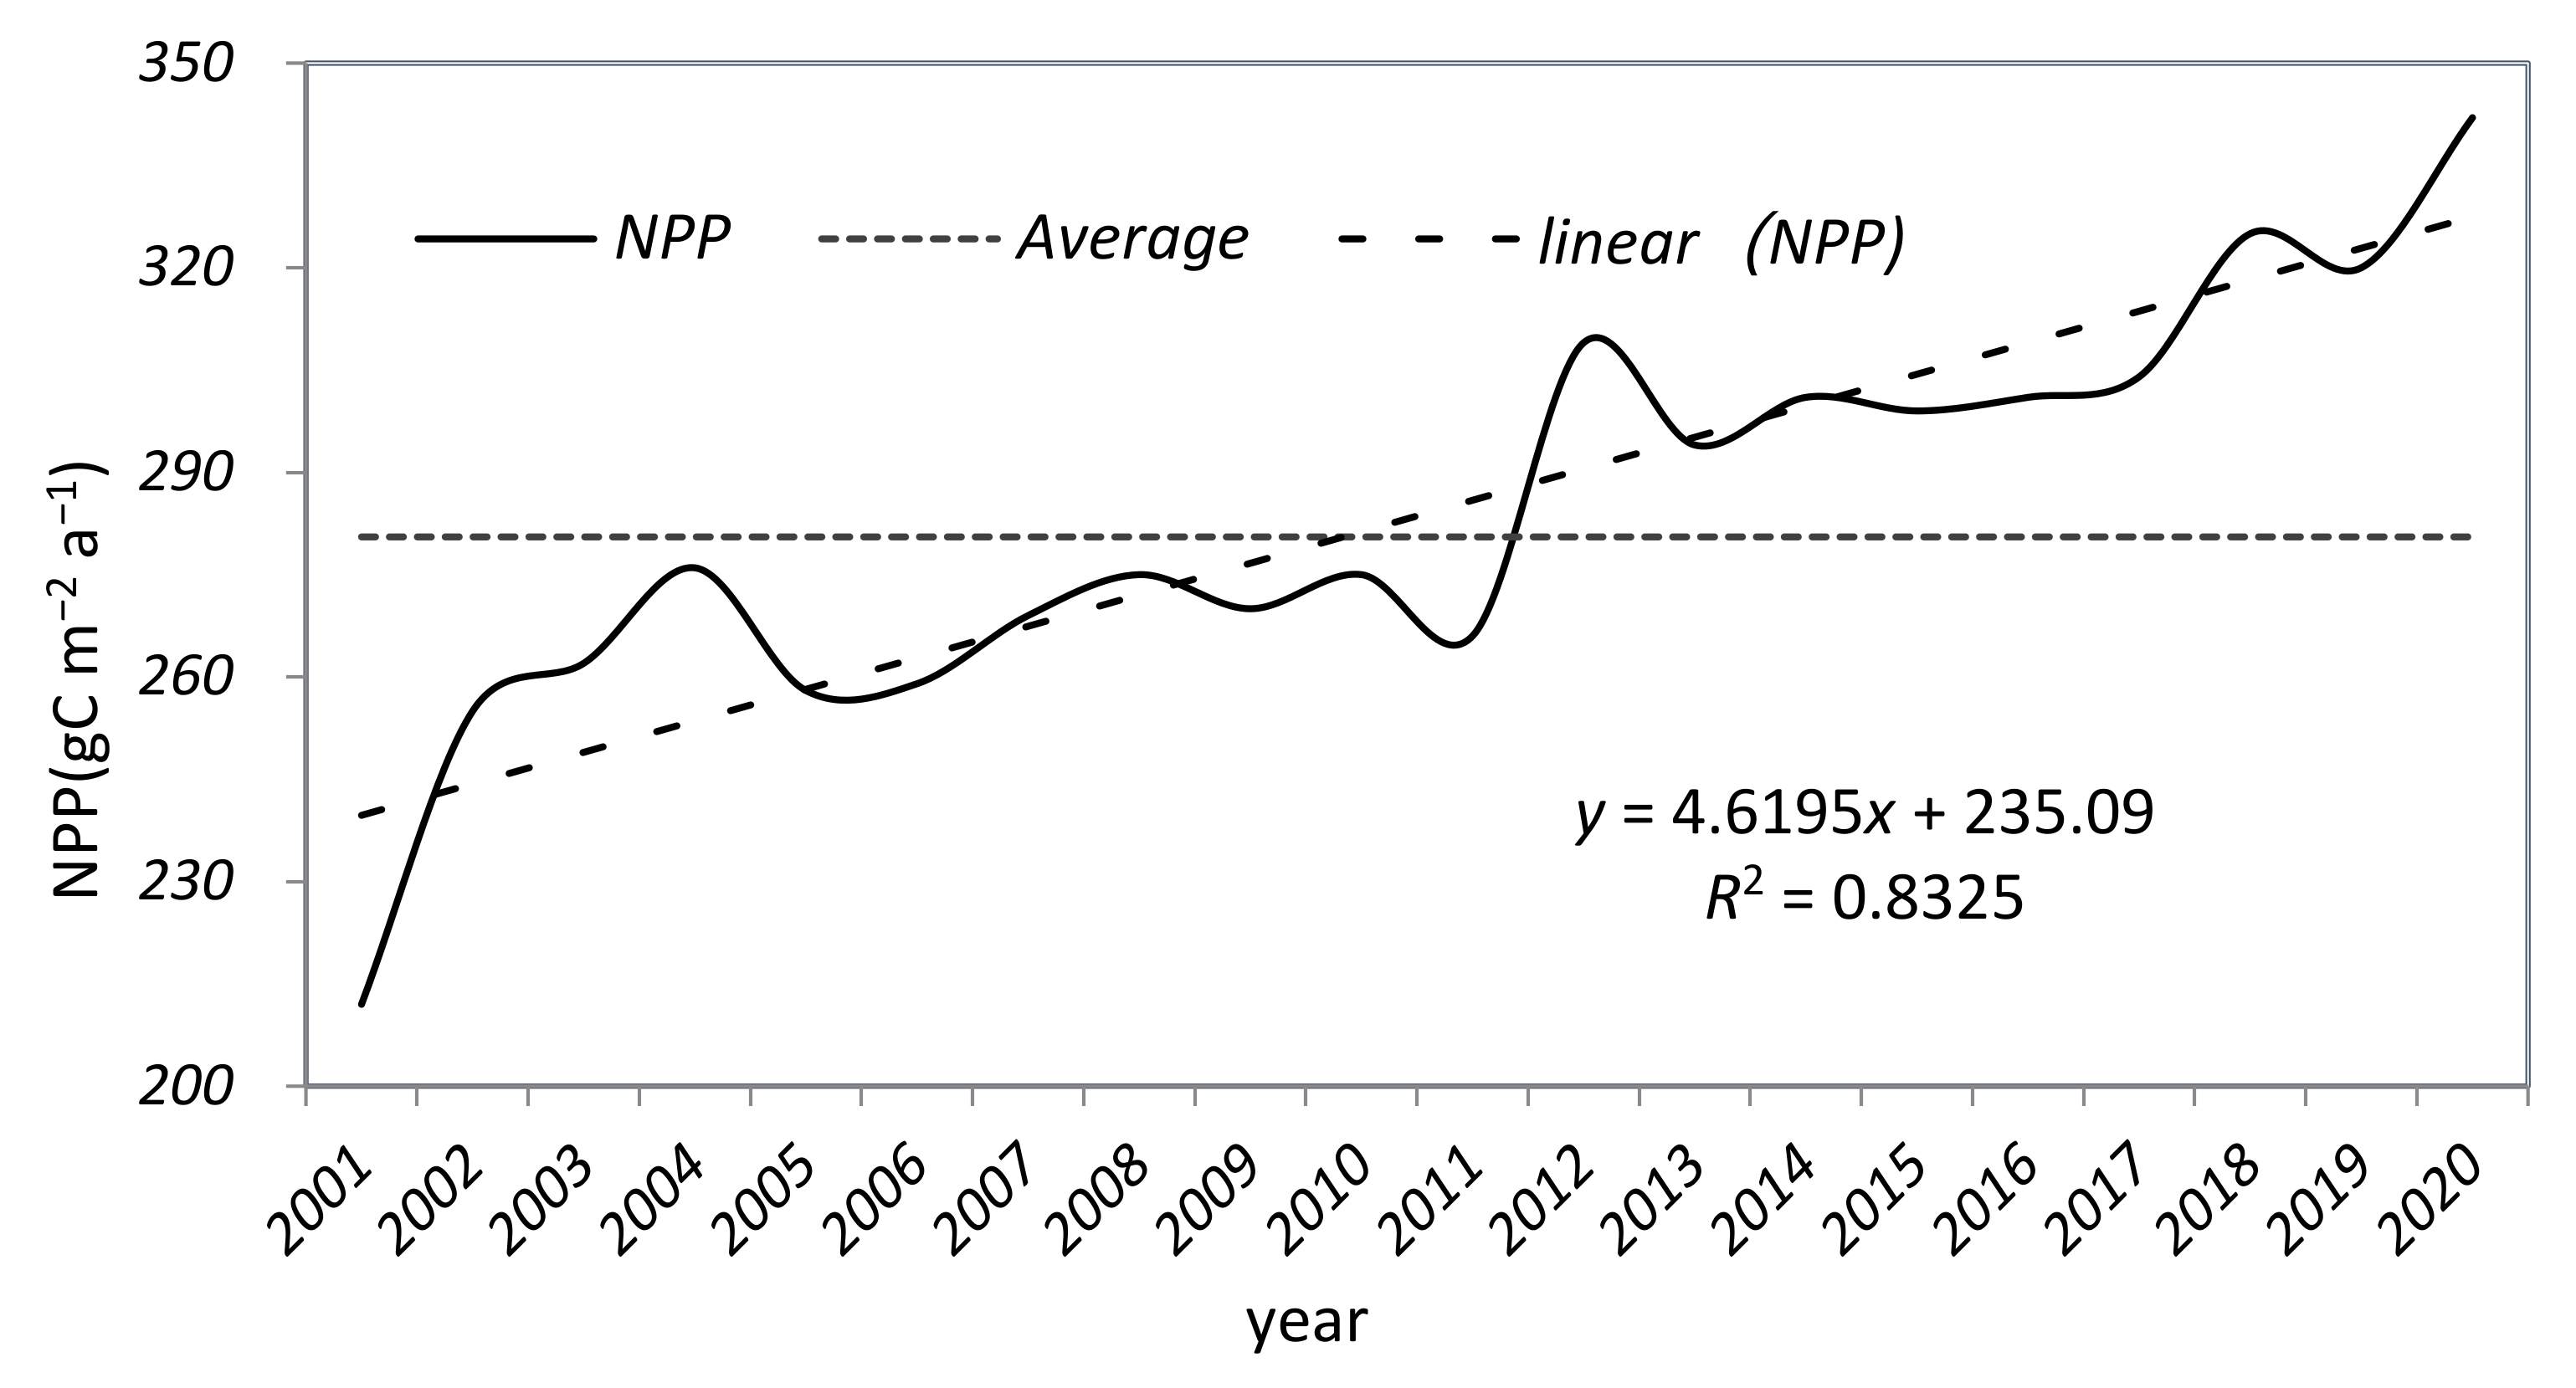
The NPP in the basin increased from 212 gC m–2 a–1 in 2001 to 342 gC m–2 a–1 in 2020 with a mean annual growth rate of gC m–2 a–1. The increasing trend is significant during 2001–2004, 2011–2014, and 2017–2020, with respective growth percentages of 30.2, 13.2, and 12.5. During the periods 2005–2010 and 2013–2017, the growth rates were 6.5 and 3.4, which are less than the other periods (Figure 8).
The overall NPP in the YRB is estimated in 2001 as 226.06 TgC and in 2020 266.15 TgC, representing an increase of 40,088.3 GgC. This spread can be mainly attributed to the expansion of forests. However, the reduction in grassland area by 4651 km2 during the past 20 years has greatly affected the overall NPP of grasslands.
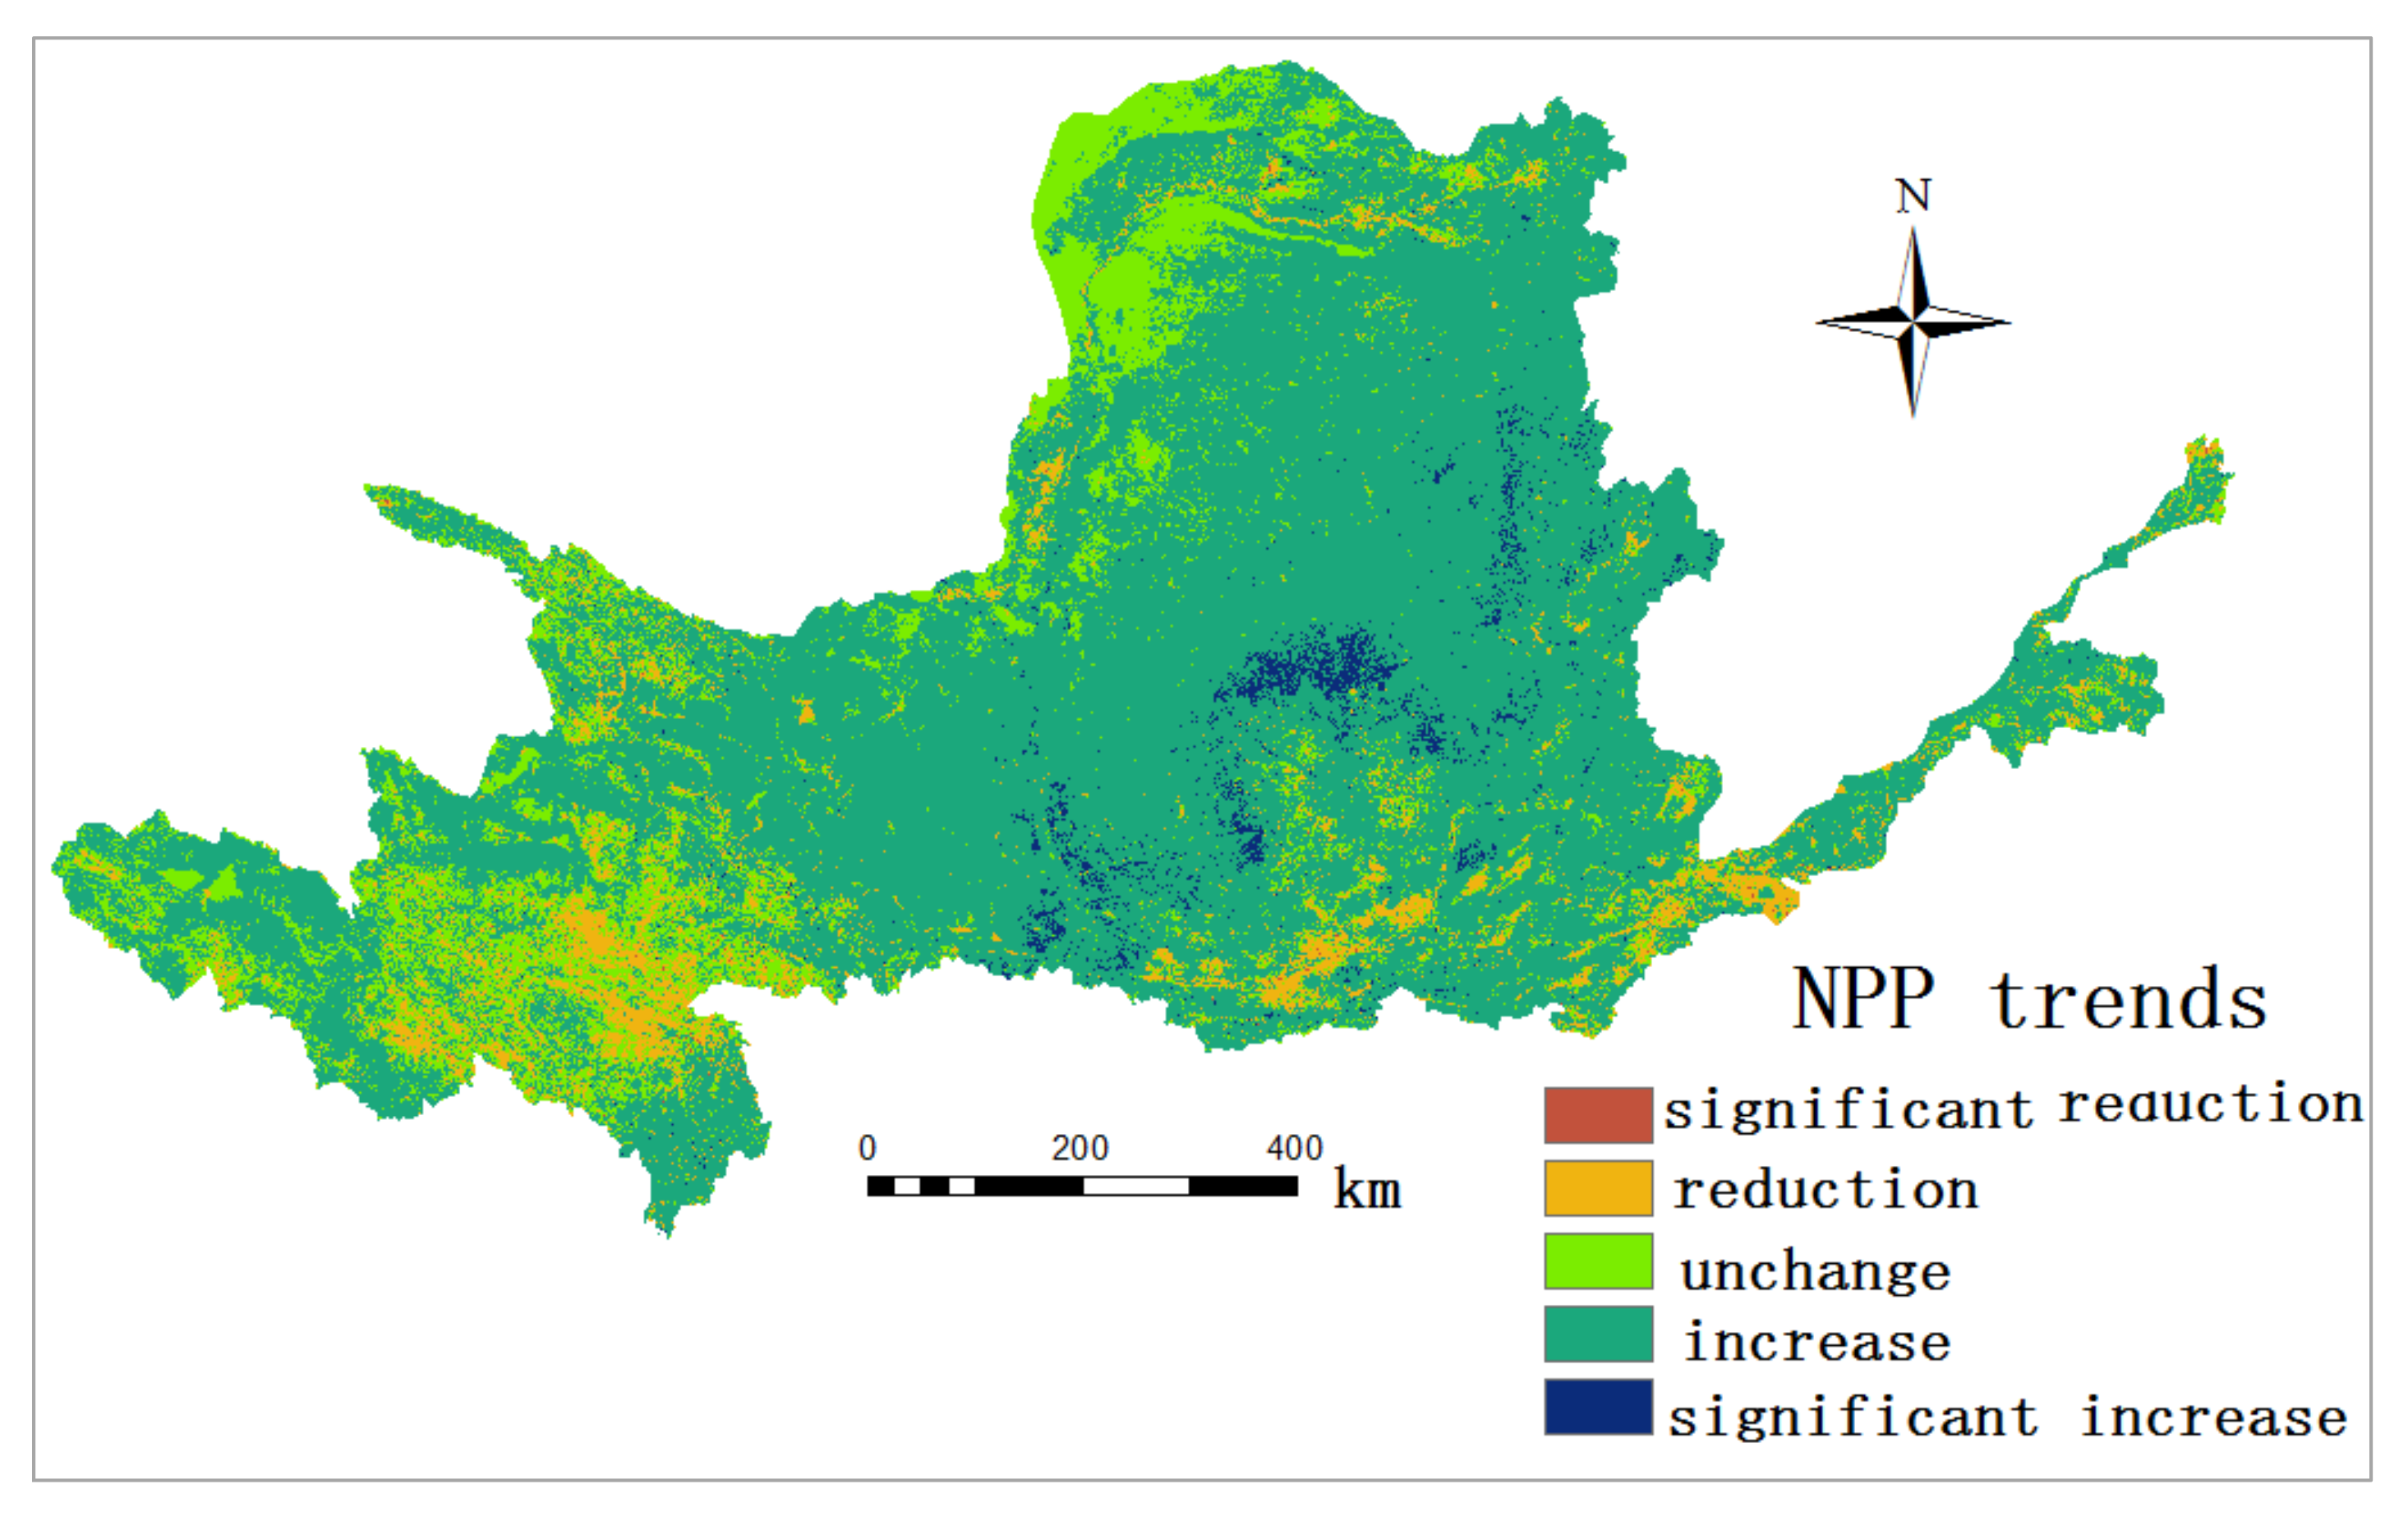
The spatial distribution of variations in the NPP in the YRB shows distinct zones where the NPP decreased, significantly decreased, maintained steady, increased, and significantly increased over areas of 46,815 km2, 72 km2, 136,870 km2, 625,182 km2, and 3088 km2, respectively (Figure 9). The reduction in NPP is mainly noticed in the southwestern and northern parts of the YRB.

4. Discussion

The regional NPP of an area is determined by comparing the simulation results with the measured biomass reported by in situ research. The estimated NPP by the CASA model was consistent with the NPP generated using MODIS ground monitoring data, with a root mean square error RMSE of 0.1482 in the spatial distribution. However, the accuracy of the NPP estimation varies across ecosystems due to a variety of factors influencing the NPP, such as climatic conditions, soil moisture content, vegetation types, and topographic positions. According to earlier studies [44,45], the productivity of the YRB is increasing, with a negligible inter-annual error, which is often within the acceptable range. Zhang et al. [46] estimated that the annual average NPP of vegetation in the YRB from 2001 to 2018 was 288.33 gC m–2 a–1.
Since 2012, the Chinese government has strengthened ecological and environmental protection through a variety of policies, such as afforestation and the conversion of farmland to forest and grassland. The North Shelterbelt Forest protection and forest resource protection project, ecological protection and restoration projects in ecologically important zones, and other recent ecological projects have a significant impact on ecosystem sustainability [47,48]. The ecological environment in the Yellow River’s middle and lower reaches is improved each year by expanding vegetation coverage and significantly increasing vegetation NPP [49]. The NPP shows a declining trend towards the upper reaches of the Yellow River, such as the Hetao Plain and the Ningxia Plain. The vegetation damage caused by urban expansion and infrastructure occupying much of the cultivated land, deforestation, and overgrazing of grassland [50,51].
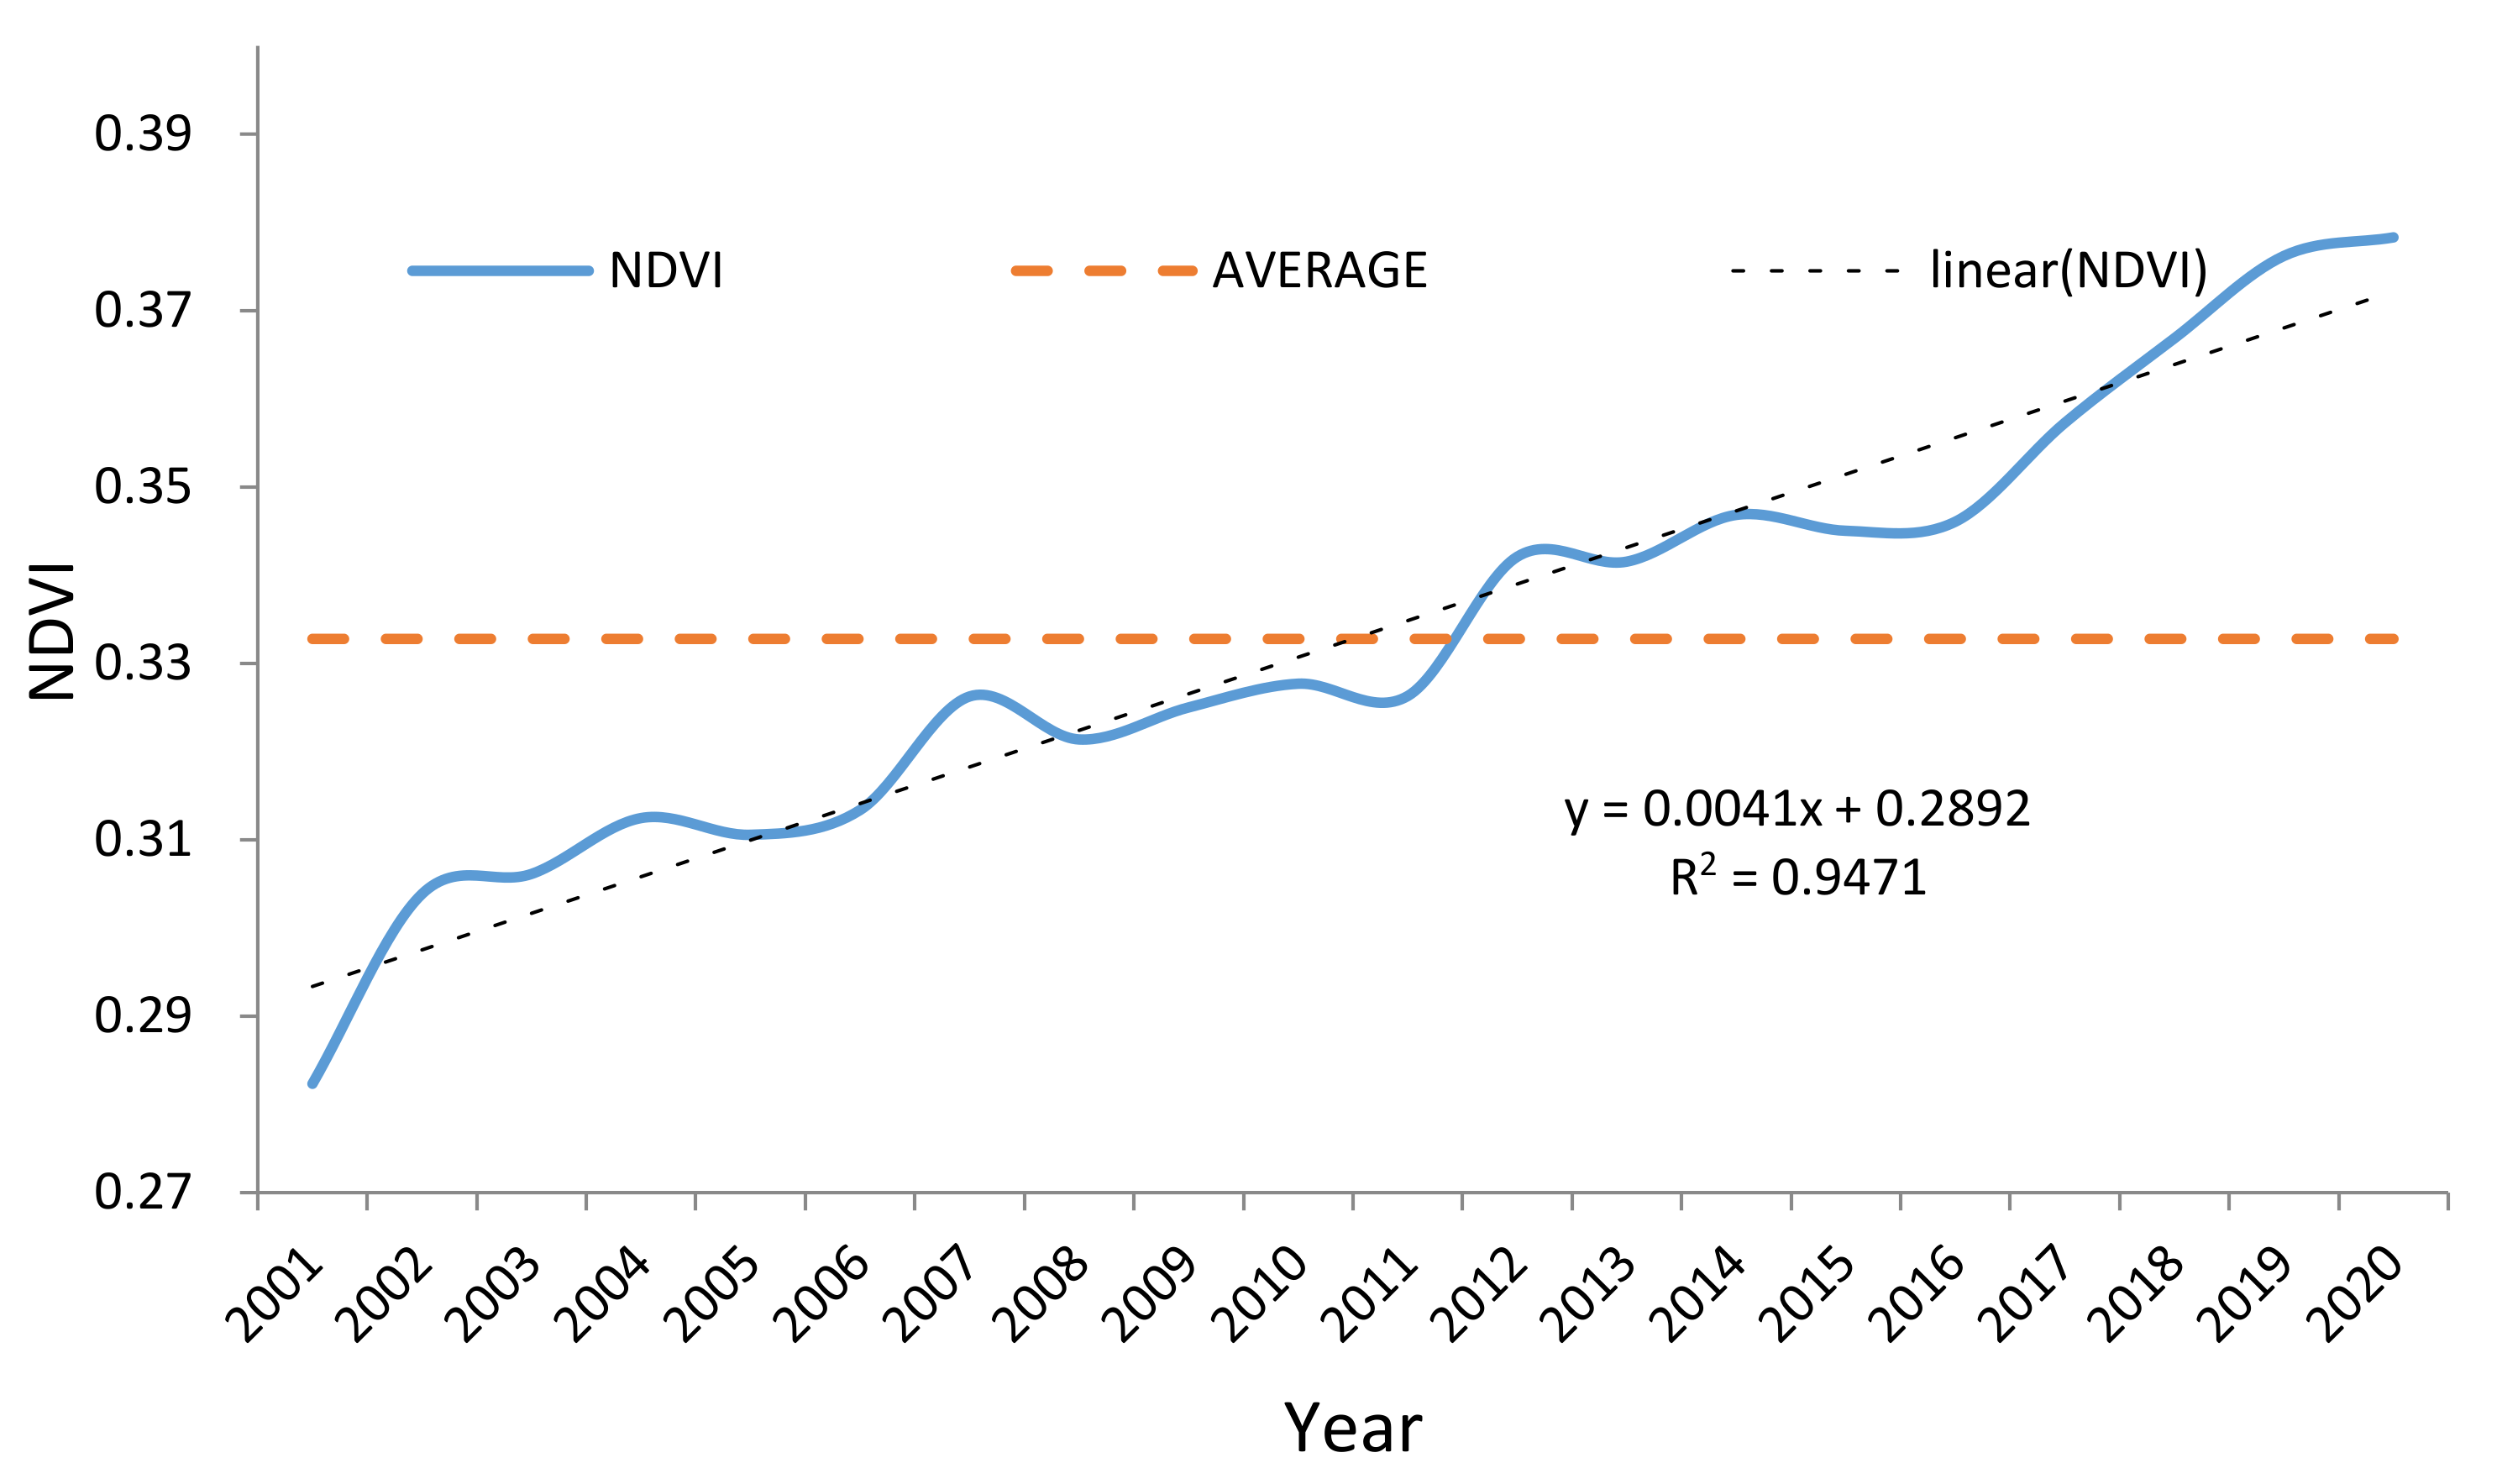
The temporal variation of annual NDVI in the vegetation-covered areas of the basin shows that the NDVI has had an increasing trend since 2001, with an overall increase of 32.7% in 2020 (Figure 10).
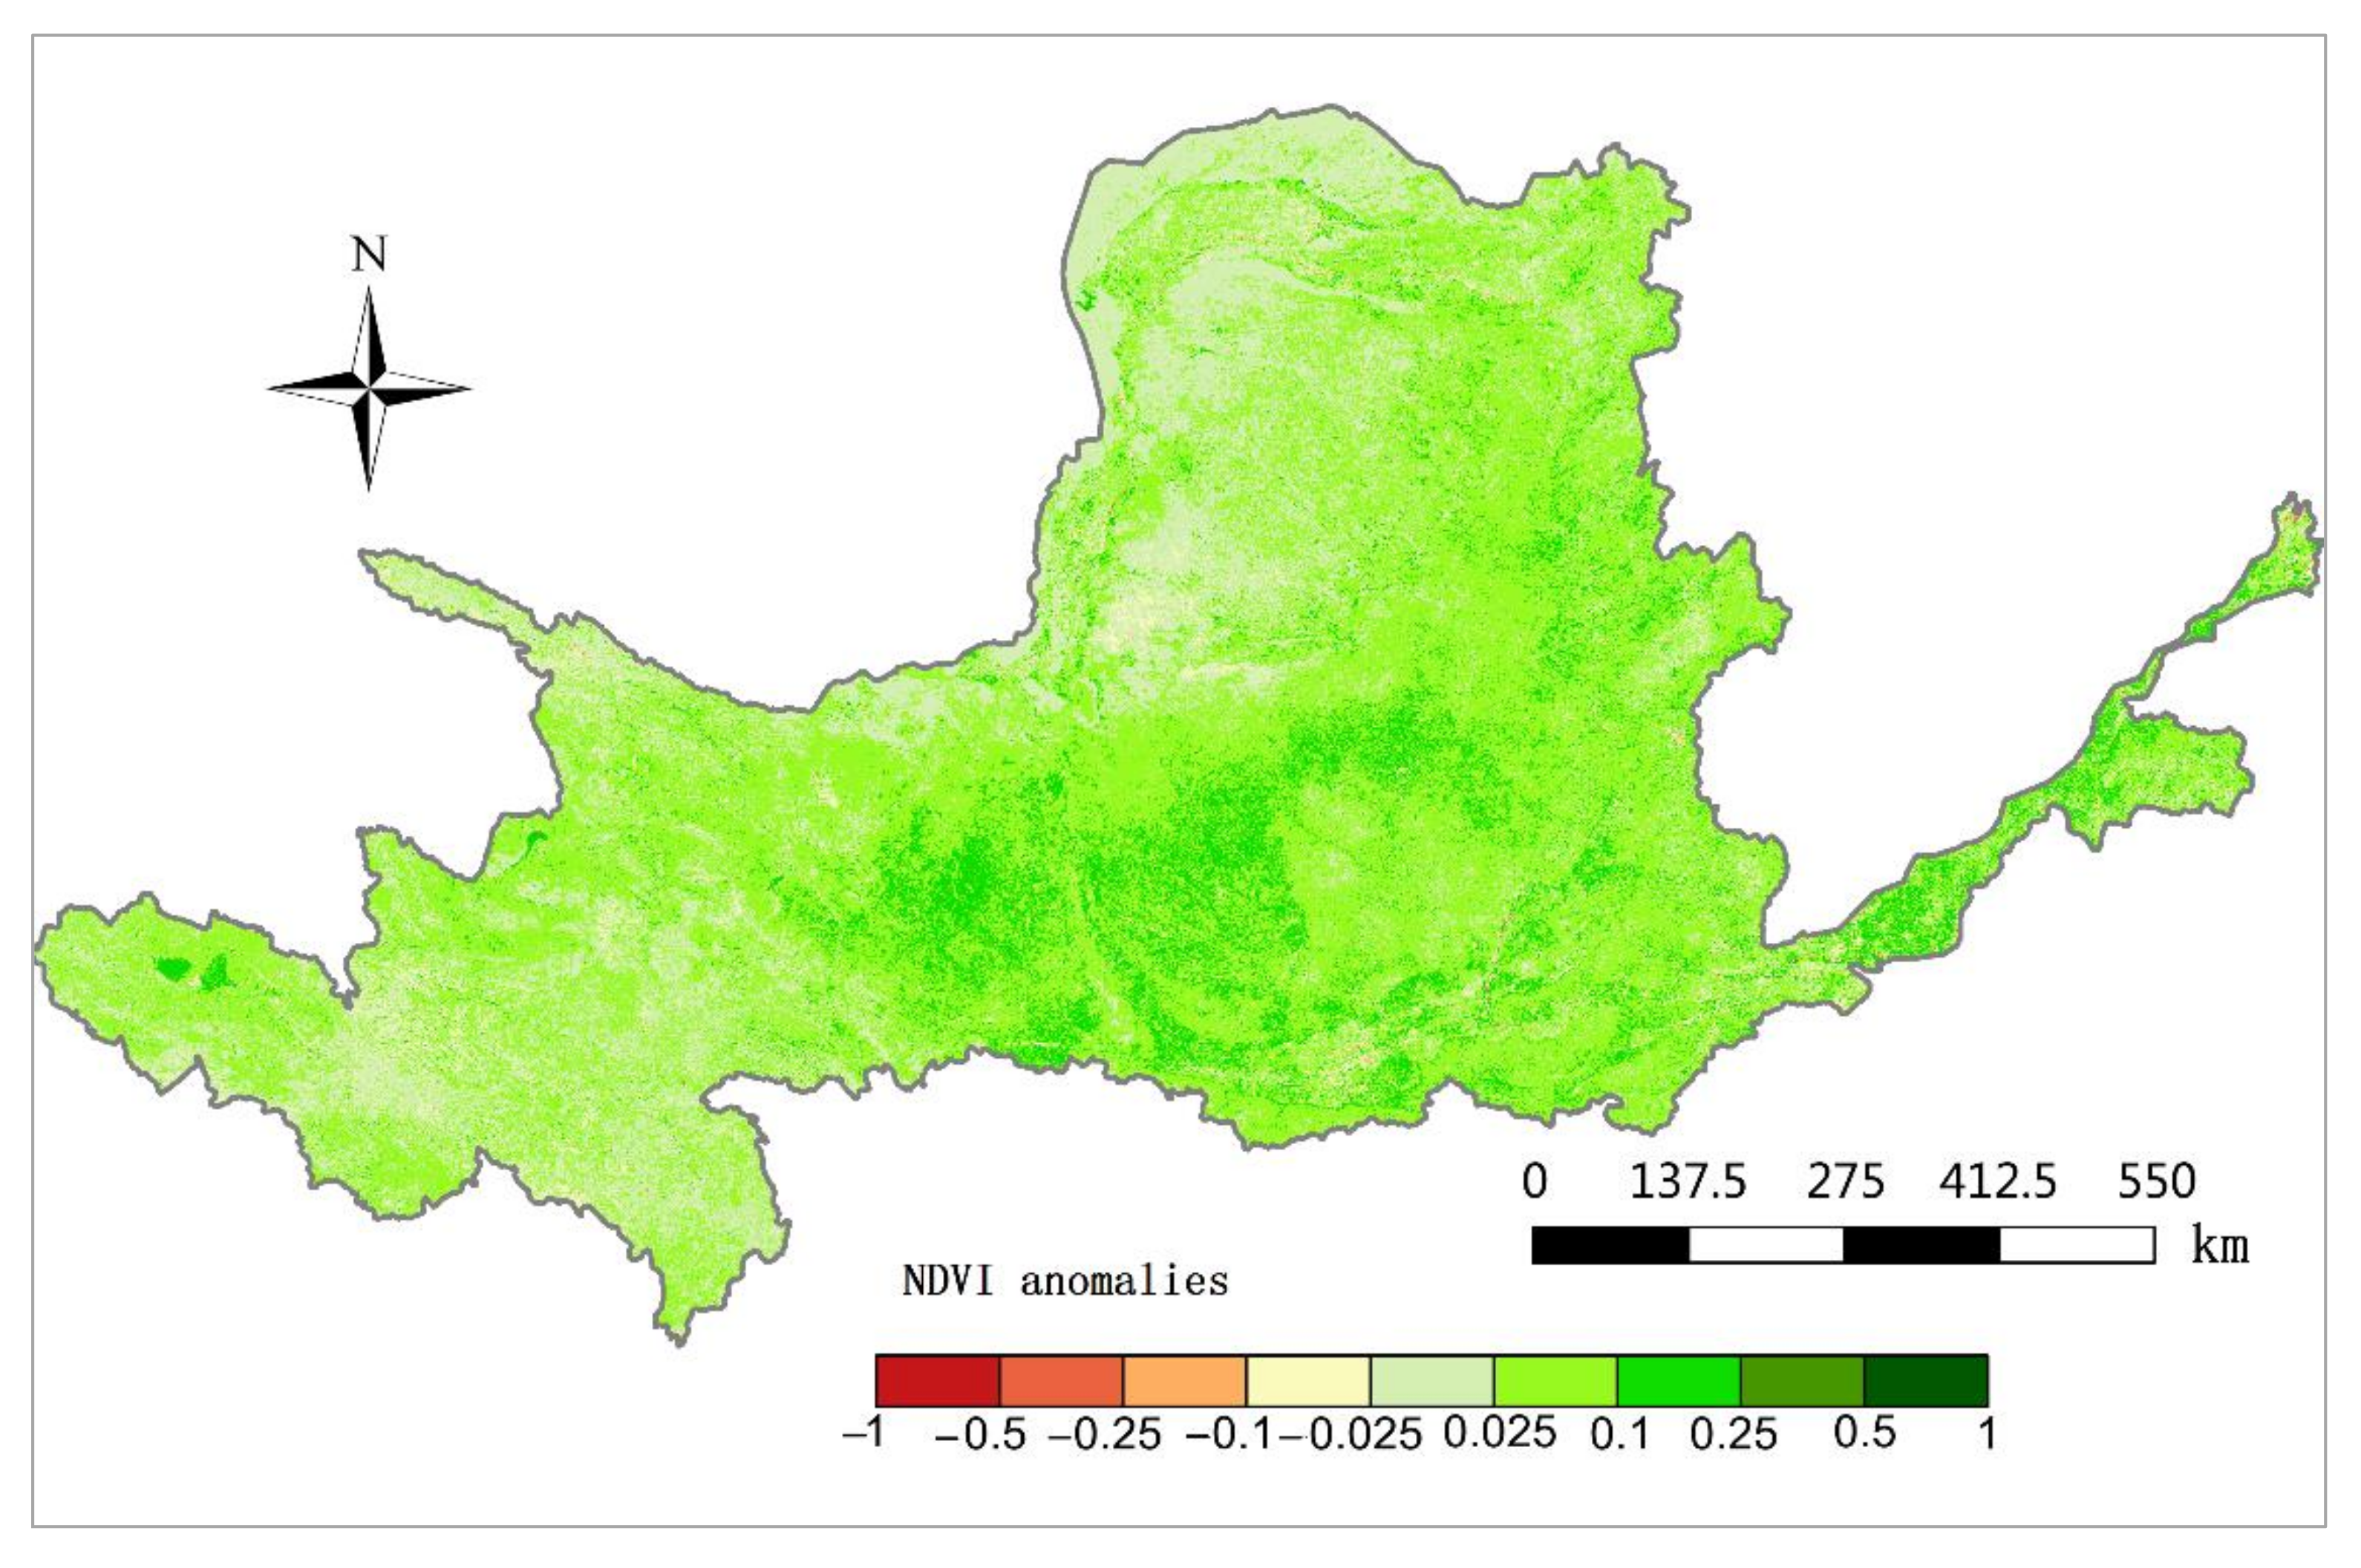
The spatial pattern of NDVI trends in the YRB shows that the areas with a higher NDVI anomaly occupy 90.8% of the vegetation-covered area. In comparison, the areas with less NDVI anomalies are occupied by 9.2% of the area, which causes the overall green color of the basin (Figure 11). The findings of the present study are in line with the earlier research reported by Yuan (2013) [52].
The ecological environment of the YRB has steadily improved in recent years, with an increase in the vegetation index and an improvement in the area’s vegetation condition. Over reclamation and grazing, which were common in the basin during the twentieth century, have done significant damage to the vegetation cover in this area. However, since the adoption of the national ecological protection policy in the area in 2001, the vegetation cover in agricultural and pastoral areas (cultivated land and grassland) has gradually recovered, and productivity has increased significantly [53,54]. In contrast, the protection of vegetation in urban areas is insufficient due to the prevalent human activities that have resulted in a considerable reduction in the forest land and wetland areas. The execution of returning farmland to forest and returning grassland to forest policies and the high stability of its ecosystems had little impact on the NPP of vegetation. Despite the improvements in the vegetation cover of desert areas, the NPP remains low [55,56]. During the study period, the forest area expanded by 2698 km2, the grassland area reduced by 4651 km2, the desert area reduced by 1596 km2, and the water body area and wetland area expanded by 2486 km2, and these variations in land use significantly affect the NPP of the ecosystem.
Furthermore, the warming and humidification of the basin, particularly the upper reaches of the Yellow River, as well as the increase in precipitation and temperature, have significantly improved the conditions for plant growth, which is another important factor in the increase in NPP. The temperature in the basin has grown significantly during the last five decades, with an average heating rate of 0.31 °C/10 a, which is almost double the global warming rate [57]. The rise in temperature and annual precipitation is significant in the upper reaches of the Yellow River, with a heating rate of 0.39 °C/10 a and a precipitation rate of 6.3 mm/10 a [29], which is slightly higher than the average growth rate of the basin (4.0 mm/10 a). The growth conditions of the vegetation have improved in response to the increase in temperature and precipitation of the area and subsequently increased the NPP of vegetation [22,58]. Correlation analysis of the NPP with the temperature and precipitation shows that the correlation coefficient between the NPP and the temperature is 0.2113, while that between NPP and precipitation is 0.3679, indicating an enhancement of the NPP with an increase in temperature and precipitation.

5. Conclusions

In this study, we estimated the Terrestrial NPP over a 20-year period from 2001–2020 in the YRB by using an upgraded CASA mode. The highest LUE was observed for various vegetation types, and the CASA model was validated by the NPP estimated from MODIS and measured the in situ biomass. During the study period, the average annual NPP value of vegetation in the basin was 283.4 gC m–2 a–1 with a decreasing trend in the spatial pattern from south to north. Further, the NPP in the basin temporally increased from 212 gC m–2 a–1 in 2001 to 342 gC m–2 a–1 in 2020, with an average annual growth rate of 4.6 gC m–2 a–1. The overall grassland area has reduced by 4651 km2 in the last 20 years, which has had a significant impact on the total NPP of the grassland. Although the overall increase in the NPP in wetlands was small, the change percentage was the highest among the six vegetation types. The NPP increase was attributed to the strengthening ecological and environmental protection policies of afforestation and returning farmland to forest and grassland. In addition, the climate change of warming and humidification also improved the vegetation growth. The research results show that the CASA model and the associated parameters are adequate for accurately predicting the NPP in the YRB, and thus the CASA model results can be used as credible NPP values in future research. Variations in vegetation NPP are influenced by natural climate and human social variables, how to explain the NPP variations should consider the climatic conditions and the impacts of human activities.

Author Contributions

F.X.: Conceptualization, methodology, writing-original draft, writing-review and editing; Q.L.: data analysis, software; Y.X.: validation, data curation. All authors have read and agreed to the published version of the manuscript.

Funding

This work was supported by the National Key Research and Development Plan Program (grant no. 2020YFE0201900), China Three Gorges Corporation (grant no. 0704182).

Institutional Review Board Statement

Not applicable.

Informed Consent Statement

Not applicable.

Data Availability Statement

Data are available from the authors upon reasonable request as the data need further use.

Conflicts of Interest

We declare that they have no known competing financial interests or personal relationships that could have influenced the work reported in this paper.

References

  1. Bargali, S.; Singh, S. Aspect of productivity and nutrient cycling in an 8-year old Eucalyptus plantation in a moist plain area adjacent to Central Himalaya, India. Can. J. For. Res. 1991, 21, 1365–1372. [Google Scholar] [CrossRef]
  2. Bargali, S.; Singh, S. dynamics, storage and flux of nutrients in an aged eucalypt plantation in Central Himalaya. Oecologia Mont. 1995, 4, 9–14. [Google Scholar]
  3. Odum, E. Fundamentals of Ecology; Saunders: Philadelphia, PA, USA, 1971. [Google Scholar]
  4. Liet, H.; Whittaker, R. Primary Productivity of Biosphere (Editors’ Preface); Springer: New York, NY, USA, 1975. [Google Scholar]
  5. Zhang, L.-X.; Zhou, D.-C.; Fan, J.-W.; Hu, Z.-M. Comparison of four light use efficiency models for estimating terrestrial gross primary production. Ecol. Model. 2015, 300, 30–39. [Google Scholar] [CrossRef] [Green Version]
  6. Srikanta, S. Modeling terrestrial ecosystem productivity of an estuarine ecosystem in the Sundarban Biosphere Region, India using seven ecosystem models. Ecol. Model. 2017, 356, 73–90. [Google Scholar]
  7. Liu, Z.; Wang, L.; Wang, S. Comparison of different GPP models in China using MODIS image and Chinaflux data. Remote Sens. 2014, 6, 10215–10231. [Google Scholar] [CrossRef] [Green Version]
  8. Ruimy, A.; Dedieu, G.; Saugier, B. TURC: A diagnostic model of continental gross primary productivity and net primary productivity. Glob. Biogeochem. Cycles 1996, 10, 269–285. [Google Scholar] [CrossRef]
  9. Dong, X.; Yang, W.; Ulgiati, U.; Yan, M.; Zhang, X. The impact of human activities on natural capital and ecosystem services of natural pastures in North Xinjiang, China. J. Ecol. Model. 2012, 225, 28–39. [Google Scholar] [CrossRef]
  10. Gignoux, J.; Fritz, H.; Abbadie, L.; Loreau, M. Which functional processes control the short-term effect of grazing on net primary production in grasslands? Oecologia 2001, 129, 114–124. [Google Scholar]
  11. Xu, Y.; Xiao, F.; Liao, Y. Assessment of grassland ecosystem service value in response to climate change in China. Diversity 2022, 14, 160. [Google Scholar] [CrossRef]
  12. Nemani, R.; Keeling, C.; Hashimoto, H. Climate driven increases in global terrestrial net primary production from 1982 to 1999. Science 2003, 300, 1560–1563. [Google Scholar] [CrossRef] [Green Version]
  13. Yang, B.; Li, X.; Xian, Y.; Chai, Y.; Li, M.; Yang, K.; Qiu, X. Assessing the Net Primary Productivity dynamics of the desert steppe in Northern China during the past 20 Years and its response to climate. Sustainability 2022, 14, 5581. [Google Scholar] [CrossRef]
  14. Matsushita, B.; Tamura, M. Integrating remotely sensed data with an ecosystem model to estimate net primary productivity in East Asia. Remote Sens. Environ. 2001, 81, 58–66. [Google Scholar] [CrossRef]
  15. Jones, M.; Running, S.; Kimball, J. Terrestrial primary productivity indicators for inclusion in the National Climate Indicators System. Clim. Chang. 2018, 15, 1855–1868. [Google Scholar] [CrossRef]
  16. Khalifa, M.; Elagib, N.; Ribbe, L. Spatio-temporal variations in climate, primary productivity and efficiency of water and carbon use of the land cover types in Sudan and Ethiopia. Sci. Total Environ. 2018, 624, 790–806. [Google Scholar] [CrossRef]
  17. Prince, S.; Goward, S. Global primary production: A remote sensing approach. J. Biogeog. 1995, 22, 815–835. [Google Scholar] [CrossRef]
  18. Li, T.; Li, M.; Ren, F.; Tian, L. Estimation and Spatio-Temporal Change Analysis of NPP in Subtropical Forests: A Case Study of Shaoguan, Guangdong, China. Remote Sens. 2022, 14, 2541. [Google Scholar] [CrossRef]
  19. Guo, B.; Wang, S.; Wang, M. Spatio-temporal variation of NPP from 1999 to 2015 in Zoige grassland wetland, China. J. Appl. Ecol. 2020, 31, 424–432. [Google Scholar]
  20. Potter, C.; Randerson, J.; Field, C.; Matson, P.; Vitousek, P.; Mooney, H.; Klooster, S. Terrestrial ecosystem production: A process model based on global satellite and surface data. Glob. Biogeochem. Cycles 1993, 7, 811–841. [Google Scholar] [CrossRef]
  21. Field, C.; Randerson, J.; Malmstrom, C. Global net primary production: Combining ecology and remote sensing. Remote Sens. Environ. 1995, 51, 74–88. [Google Scholar] [CrossRef] [Green Version]
  22. Piao, S.; Fang, J.; Zhou, L.; Zhu, B.; Tan, K.; Tao, S. Changes in vegetation net primary productivity from 1982 to 1999 in China. Glob. Biogeochem. Cycles 2005, 19, 20–27. [Google Scholar] [CrossRef] [Green Version]
  23. Ren, Z.; Zhu, H.; Shi, H.; Liu, X. Spatio-temporal distribution pattern of vegetation net primary productivity and its response to climate change in Buryatiya Republic, Russia. J. Resour. Ecol. 2011, 2, 257–265. [Google Scholar]
  24. Hao, L.; Wang, S.; Cui, X.; Zhai, Y. Spatiotemporal Dynamics of Vegetation Net Primary Productivity and Its Response to Climate Change in Inner Mongolia from 2002 to 2019. Sustainability 2021, 13, 13310. [Google Scholar] [CrossRef]
  25. Running, S.; Nemani, R.; Glassy, J. MODIS Daily Photosynthesis and Annual Net Primary Production Product (MOD17) Algorithm Theoretical Basis Document; Version 3.0; NASA: Washington, DC, USA, 1997; pp. 1–59.
  26. Manral, V.; Bargali, K.; Bargali, S.; Jhariya, M.; Padalia, K. Relationships between soil and microbial biomass properties and annual flux of nutrients in Central Himalayan forests, India. Land Degrad. Dev. 2002, 33, 1–12. [Google Scholar]
  27. Awasthi, P.; Bargali, K.; Bargali, S.; Jhariya, M. Structure and Functioning of Coriaria nepalensis Wall dominated Shrub lands in degraded hills of Kumaun Himalaya. I. Dry Matter Dynamics. Land Degrad. Dev. 2022, 33, 1474–1494. [Google Scholar] [CrossRef]
  28. Upper and Middle Yellow River Bureau. Introduction to Water and Soil Conservation in the Yellow River Basin; Yellow River Water Conservancy Press: Zhengzhou, China, 2011. [Google Scholar]
  29. Xiao, F.; Xu, Y.; Huang, D.; Liao, Y.; Yu, L. Impact of climate change on ecological security of the Yellow River Basin and its adaptation countermeasures. Ren. Yell. Riv. 2021, 43, 10–14. [Google Scholar]
  30. Zhao, M.; Heinsch, F.; Nemani, R. Improvements of the MODIS terrestrial gross and net primary production global data set. Remote Sens. Environ. 2005, 95, 164–176. [Google Scholar] [CrossRef]
  31. Turner, D.; Ritts, W.; Cohen, W. Evaluation of MODIS NPP and GPP products across multiple biomes. Remote Sens. Environ. 2006, 102, 282–292. [Google Scholar] [CrossRef]
  32. Liu, J.; Meng, B.; Ge, J. Spatio-temporal dynamic changes of grassland NPP in Gannan prefecture, as determined by the CASA model. Acta Pratacult. Sin. 2019, 28, 19–32. [Google Scholar]
  33. Liu, Y.; Zhou, R.; Ren, H. Evaluating the dynamics of grassland net primary productivity in response to climate change in China. Glob. Ecol. Conserv. 2021, 28, e01574. [Google Scholar] [CrossRef]
  34. Yang, H.; Zhong, X.; Deng, S.; Xu, H. Assessment of the impact of LUCC on NPP and its influencing factors in the Yangtze River Basin, China. CATENA 2021, 206, 105542. [Google Scholar] [CrossRef]
  35. Bo, Y.; Li, X.; Liu, K.; Wang, S.; Zhang, H.; Gao, X.; Zhang, X. Three Decades of Gross Primary Production (GPP) in China: Variations, Trends, Attributions, and Prediction Inferred from Multiple Datasets and Time Series Modeling. Remote Sens. 2022, 14, 2564. [Google Scholar] [CrossRef]
  36. Friedl, M.; Sulla-Menashe, D.; Tan, B.; Schneider, A.; Ramankutty, N.; Sibley, A.; Huang, X. MODIS Collection 5 global land cover: Algorithm refinements and characterization of new datasets. Remote Sens. Environ. 2010, 114, 168–182. [Google Scholar] [CrossRef]
  37. Zhu, W.; Pan, Y.; Zhang, J. Estimation of primary productivity of Chinese terrestrial vegetation on remote sensing. J. Plant Ecol. 2007, 31, 413–424. [Google Scholar]
  38. Ruimy, A.; Saugier, B.; Dedieu, G. Methodology for the estimation of terrestrial net primary production from remotely sensed data. J. Geophys. Res. Atmos. 1994, 99, 5263–5283. [Google Scholar] [CrossRef]
  39. Zhu, W.; Pan, Y.; He, H. Simulation of maximum light use efficiency for some typical vegetation types in China. Chin. Sci. Bull. 2006, 51, 457–463. [Google Scholar] [CrossRef]
  40. Wang, B.; Wang, J.; Yang, Y. Algorithm improvements for two important parameters of FPAR and maximum solar energy utilization efficiency. Acta Pratacult. Sin. 2013, 22, 220–228. [Google Scholar]
  41. Luo, T.; Pan, Y.; Ouyang, H. Leaf area index and net primary productivity along subtropical to alpine gradients in the Tibetan Plateau. Glob. Ecol. Biogeogr. 2004, 13, 345–358. [Google Scholar] [CrossRef]
  42. Zhao, M.; Running, S.; Nemani, R. Sensitivity of moderate resolution imaging spectroradiometer (MODIS) terrestrial primary production to the accuracy of meteorological reanalyses. J. Geophys. Res. Biogeosci. 2015, 111, 338–356. [Google Scholar] [CrossRef] [Green Version]
  43. Cheng, J.; Yang, X.; Liu, W.; Chen, F. Spatial distribution of carbon density in grassland vegetation of the Loess Plateau of China. Acta Ecol. Sin. 2012, 32, 0226–0237. [Google Scholar] [CrossRef] [Green Version]
  44. Sun, G.; Liu, X.; Wang, X.; Li, S. Changes in vegetation coverage and its influencing factors across the Yellow River Basin during 2001-2020. J. Desert Res. 2021, 41, 205–212. [Google Scholar]
  45. Li, D.; Fan, J.; Wang, J. Variation characteristics of vegetation net primary productivity in Shaanxi Province based on MO17A. Chin. J. Ecol. 2001, 30, 2776–2782. [Google Scholar]
  46. Zhang, Z.; Chang, J. Spatial-temporal differentiation and eco-economic coordination of vegetation NPP in the Yellow River Basin from 2001 to 2018. J. Huazhong Agri. Univ. 2021, 40, 166–177. [Google Scholar]
  47. Yang, Z.; Tian, J.; Li, W.; Su, W.; Guo, R.; Liu, W. Spatio-temporal pattern and evolution trend of ecological environment quality in the Yellow River Basin. Acta Ecol. Sin. 2021, 41, 7627–7636. [Google Scholar]
  48. Lv, M.; Ma, Z.; Peng, S. Responses of terrestrial water cycle components to afforestation within and around the Yellow River basin. Atmos. Ocean. Sci. Lett. 2019, 12, 116–123. [Google Scholar] [CrossRef] [Green Version]
  49. Yang, Y.; Wang, J.; Liu, P.; Lu, G.; Li, Y. Climatic Changes Dominant Interannual Trend in Net Primary Productivity of Alpine Vulnerable Ecosystems. J. Resour. Ecol. 2019, 10, 379–388. [Google Scholar]
  50. Zhang, Z.; Chang, T.; Qiao, X.; Yang, Y.; Guo, J.; Zhang, H. Eco-Economic Coordination Analysis of the Yellow River Basin in China: Insights from Major Function-Oriented Zoning. Sustainability 2021, 13, 2715. [Google Scholar] [CrossRef]
  51. Jiang, C.; Wang, D.; Luo, S.; Li, D.; Zhang, L.; Gao, Y. Ecosystem Status Changes and Attribution in the Three-River Headwaters Region. Res. Environ. Sci. 2017, 30, 10–19. [Google Scholar]
  52. Yuan, L.; Jiang, W.; Shen, W. The spatio-temporal variations of vegetation cover in the Yellow River Basin from 2000 to 2010. Acta Ecol. Sin. 2013, 33, 7798–7806. [Google Scholar]
  53. Chang, T.; Zhang, Z.; Qiao, X.; Zhang, Y. Land use transformation and its eco-environment effects of ecological- production-living spaces in Yellow River Basin. Bull. Soi. Wat. Cons. 2021, 41, 268–275. [Google Scholar]
  54. Yang, S.; Liu, C.; Sun, R. The vegetation covers over last 20 years in Yellow River Basin. Acta Geogr. Sin. 2002, 57, 679–684. [Google Scholar]
  55. Cheng, Q.; Chen, Y.; Wang, M. Change of vegetation net primary productivity in Yellow River watersheds from 2001 to 2010 and its climatic driving factors analysis. Chin. Appl. Ecol. 2014, 25, 2811–2818. [Google Scholar]
  56. Wang, P.; Xie, D.; Zhou, Y.; Youhao, E.; Zhu, Q. Estimation of net primary productivity using a process-based model in Gansu Province, Northwest China. Environ. Earth Sci. 2014, 71, 647–658. [Google Scholar] [CrossRef]
  57. Chao, Q.; Yan, Z.; Sun, Y. A recent scientific understanding of climate change in China. China Popul. Resour. Environ. 2020, 30, 1–9. [Google Scholar]
  58. Wu, G.; Wang, W. Regionalization and Revegetation in the Agricultural and Pasturing Interlaced Zone of China. J. Desert Res. 2022, 22, 439–442. [Google Scholar]
Figure 1. Location of Yellow River basin in China.
Sustainability 14 07399 g001
Figure 2. Major land cover types in Yellow River Basin.
Sustainability 14 07399 g002
Figure 3. Overall research process and model framework for NPP.
Sustainability 14 07399 g003
Figure 4. Graphs of the relationship between MODIS NPP and CASA model estimated NPP relationship.
Sustainability 14 07399 g004
Figure 5. The spatial deviation between CASA-estimated NPP and MODIS-NPP.
Sustainability 14 07399 g005
Figure 6. The comparison of the CASA NPP and the in situ NPP.
Sustainability 14 07399 g006
Figure 7. The spatial pattern of average NPP in the Yellow River Basin.
Sustainability 14 07399 g007
Figure 8. The change of average NPP in Yellow River Basin from 2001 to 2020.
Sustainability 14 07399 g008
Figure 9. The spatial distribution of NPP trends in the Yellow River Basin from 2001 to 2020.
Sustainability 14 07399 g009
Figure 10. The change of average NDVI in the Yellow River Basin from 2001 to 2020.
Sustainability 14 07399 g010
Figure 11. Spatial distribution of vegetation index anomalies in the Yellow River Basin in 2020.
Sustainability 14 07399 g011
Table 1. Maximum LUE for different vegetation types.
Vegetation TypeMaximum LUE εmax (gC MJ–1)
Evergreen coniferous forest0.389
Evergreen broad-leaved forests0.985
Deciduous, coniferous forest0.485
Deciduous broad-leaved forest0.692
Coniferous and broad-leaved mixed forest0.475
Evergreen, deciduous broad-leaved mixed forest0.768
Grassland0.542
Cultivated vegetation0.542
Shrub0.429
Other vegetation0.542
Table 2. Annual NPP for different ecosystems in the YRB from 2001 to 2020.
Ecosystem TypesArea
(km2)
NPP Mean
(gC m–2 a–1)
NPP Max
gC m–2 a–1)
NPP SD
(gC m–2 a–1)
NPP Total Annual
(TgC)
Forest105,778401.71124201.442.5
Grassland378,984276.01057185.8105
Farmland213,267303.91042130.764.8
Wetland7968498.1710192.83.96
Desert63,92070.982367.44.53
Total 283.41124182.2220
Publisher’s Note: MDPI stays neutral with regard to jurisdictional claims in published maps and institutional affiliations.