Article

Greenhouse Gas Emissions in the Industrial Processes and Product Use Sector of Saudi Arabia—An Emerging Challenge

by
Muhammad Muhitur Rahman
1,*,
Mohammad Shahedur Rahman
2,
Saidur R. Chowdhury
3,
Alaeldeen Elhaj
4,
Shaikh Abdur Razzak
5,6,
Syed Abu Shoaib
1,
Md Kamrul Islam
1,
Mohammed Monirul Islam
7,
Sayeed Rushd
8 and
Syed Masiur Rahman
4
1
Department of Civil and Environmental Engineering, College of Engineering, King Faisal University, Al-Ahsa 31982, Saudi Arabia
2
Civil Engineering Department, College of Engineering, Imam Mohammad Ibn Saud Islamic University, Riyadh 13318, Saudi Arabia
3
Department of Civil Engineering, College of Engineering, Prince Mohammad Bin Fahd University, P.O. Box 1664, Al Khobar 31952, Saudi Arabia
4
Applied Research Center for Environment & Marine Studies, King Fahd University of Petroleum & Minerals (KFUPM), Dhahran 31260, Saudi Arabia
5
Department of Chemical Engineering, King Fahd University of Petroleum & Minerals (KFUPM), Dhahran 31261, Saudi Arabia
6
Interdisciplinary Research Center for Membranes and Water Security, King Fahd University of Petroleum & Minerals (KFUPM), Dhahran 31261, Saudi Arabia
7
Department of Biomedical Sciences, College of Clinical Pharmacy, King Faisal University, Al-Ahsa 31982, Saudi Arabia
8
Department of Chemical Engineering, College of Engineering, King Faisal University, Al-Ahsa 31982, Saudi Arabia
*
Author to whom correspondence should be addressed.
Sustainability 2022, 14(12), 7388; https://doi.org/10.3390/su14127388
Submission received: 10 May 2022 / Revised: 6 June 2022 / Accepted: 12 June 2022 / Published: 16 June 2022
(This article belongs to the Special Issue Renewable Energy and Greenhouse Gas Emissions Reduction)

Abstract

:
The Kingdom of Saudi Arabia has been experiencing consistent growth in industrial processes and product use (IPPU). The IPPU’s emission has been following an increasing trend. This study investigated time-series and cross-sectional analyses of the IPPU sector. Petrochemical, iron and steel, and cement production are the leading source categories in the Kingdom. In recent years, aluminum, zinc, and titanium dioxide production industries were established. During the last ten years, a significant growth was observed in steel, ethylene, direct reduce iron (DRI), and cement production. The growth of this sector depends on many factors, including domestic and international demand, socioeconomic conditions, and the availability of feedstock. The emissions from IPPU without considering energy use was 78 million tons of CO2 equivalent (CO2eq) in 2020, and the cement industry was the highest emitter (35.5%), followed by petrochemical (32.3%) and iron and steel industries (16.8%). A scenario-based projection analysis was performed to estimate the range of emissions for the years up to 2050. The results show that the total emissions could reach between 199 and 426 million tons of CO2eq in 2050. The Kingdom has started initiatives that mainly focus on climate change adaptation and economic divergence with mitigation co-benefits. In general, the focus of such initiatives is the energy sector. However, the timely accomplishment of the Saudi Vision 2030 and Saudi Green Initiative will affect mitigation scenarios significantly, including in the IPPU sector. The mitigation opportunities for this sector include (i) energy efficiency, (ii) emissions efficiency, (iii) material efficiency, (iv) the re-use of materials and recycling of products, (v) intensive and longer use of products, and (vi) demand management. The results of this study will support the Kingdom in developing an appropriate climate change mitigation roadmap.

1. Introduction

The Kingdom of Saudi Arabia (KSA) is located in a hot and dry region with limited water resources and poor rainfall. It covers a region of about 2.25 million km2 and includes deserts, plains, plateaus, mountains, and lava flows. Surface water is confined to rainfall-runoff flowing across valleys because there are no perennial rivers [1]. The Kingdom’s population is expected to reach 34.81 million in 2021–2022, with a high population growth rate. Growth in energy demand (notably the demand for electricity, a rapidly growing manufacturing sector, and a high need for air conditioning systems during the hot season) has accelerated due to population growth [2]. As a result, Saudi Arabia is concerned about environmental issues and trying to devise strategies that promote economic growth while protecting environmental sustainability [2,3,4,5]. The literature suggests that per capita spending, foreign investment, and international trade significantly impact sustainable development at the national level [6,7]. Through Vision 2030, the Kingdom of Saudi Arabia sets a plan for a more inclusive development and social economic prosperity, which is associated with addressing environmental and socioeconomic aspects of Saudi society and green technology [8]. A green technology framework may shift one’s perception of changes in technology and industrial production features, thereby increasing citizen knowledge of sustainable advancement and showcasing the significance of integrating environmental and industrial factors into economic development models [9,10]. Saudi Arabia is the world’s largest producer and exporter of total petroleum liquids, as well as a major consumer of primary energy [4]. In 2017, it ranked sixth in terms of fuel use, with 3,328,000 barrels per day [11], and thirteenth in power consumption, with 295 billion kilowatt-hours [12]. The KSA has been experiencing consistent growth in industrial processes and product uses (IPPUs). Petrochemical, iron and steel, and cement production are the leading source categories of GHG emissions in the Kingdom from the IPPU sector [2]. This is one of the key sectors in the Kingdom, accounting for around 41% of total energy consumption, with 80% of energy utilized in the petrochemical, cement, and iron and steel industries [2]. The Kingdom’s rapid industrial growth has resulted in an increase in GHG emissions as well as the generation of energy for the country’s ever-growing household, tertiary, and industrial facilities. Although the IPPU sector is considered to be less significant than the energy sector [2], with the increase in the size of the industrial section in Saudi Arabia, the IPPU sector is a potential source of increased GHG emissions in the atmosphere. Analyses of sustainability in different industrial processes have been reported for some countries [13,14,15,16,17]; however, little information in terms of GHG emissions from this sector, in Saudi Arabia, is available in the open literature.
Regarding the GHG emissions, it is well known that due to the presence of these gases, which are spread over the Earth’s surface and able to absorb outgoing heat, some heat is trapped between the Earth’s surface and the low atmosphere level. GHGs include water vapor (H2O), carbon dioxide (CO2), methane (CH4), nitrous oxide (N2O), ozone (O3), and chlorofluorocarbons (CFCs). They absorb some of the heat radiation leaving the surface and radiate long-wave radiation in all directions, effectively acting as a partial blanket and keeping the Earth warm. Anthropogenic activities have resulted in increased emissions of four key GHGs in the post-industrial era: CO2, CH4, N2O, and O3. Some of these GHGs can stay in the atmosphere for hundreds of years after being released, making their accumulation almost irreversible. Among all GHGs, CO2 concentration is maximum (400 ppm) and lasts around 300 years with a high heat IR capacity [18]. Due to the enhanced lifetime of CO2 and overall increasing rate of production, CO2 accumulation is increasing and trapping more heat, which is a significant global warming threat. After water vapor (H2O(g)), CO2 and CH4 are the second and third most significant GHGs. These GHGs have a significant impact on the atmosphere’s radiative properties. The global averaged combined land and ocean surface temperature has increased by 0.90 ± 0.16 °C over the period of 1880–2020 due to this increase in atmospheric CO2 and CH4 concentration [19]. Since 1880, the tropospheric average annual temperature has risen at a pace of 0.07 °C (0.13 °F) per decade. Since 1981, it has increased at a more than doubled rate (+0.18 °C/+0.32 °F) [19]. Therefore, it is imperative for countries with growing industrialization, e.g., Saudi Arabia, to formulate carbon management strategies [20,21,22,23] and enforce mitigation measures to reduce GHG emissions from its industrial sources.
Economic growth, and thus industrialization, has a significant impact on the environment of a country like Saudi Arabia. The country is pursuing economic diversification through activities and programs that have co-benefits, such as GHG emission reduction and adaptation to climate change impacts. This would help the Kingdom to reach its vision for a green initiative and sustainable improvement goals. The Kingdom has taken initiatives to achieve its objectives: (i) initiatives for economic divergence with mitigating benefits; (ii) climate change adaptation activities, either on their own or in combination with mitigation benefits [24]. The public and private sectors, as well as Saudi individuals, have begun to emphasize climate change issues while maintaining their strong support for sustainable progress. The Kingdom confirmed the United Nations Framework Convention on Climate Change (UNFCCC) to limit the excess GHG emissions from their industrial or other activities and was a part of the Kyoto Protocol and Paris Agreement [2]. The country has shown a strong desire to actively participate in the increase in renewable energy sources (RES) and energy efficiency (RUE) [2,25]. In the Kingdom, there is also a process of environmental awakening. The uses and development of RES and RUE are expected to protect climate change.
In general, developing economies have been affected by a lack of relevant studies on which to base policy on quantifiable and empirical analyses. Saudi Arabia is no exception in this regard, particularly regarding the regulation of greenhouse gas emissions from the IPPU industry. This study has the potential to fill that gap in terms of policy implications for Saudi Arabia’s IPPU sector. The goal of this study is to investigate GHG emissions in the IPPU sectors. Furthermore, a scenario-based projection analysis was performed to estimate the range of emissions from the IPPU sector for the years up to 2050. The results of the future projections will support the Kingdom in developing an appropriate climate change mitigation roadmap. Thus, this work contributes to the literature in that it assumes that this is the first study to examine the growth of GHG emissions from the IPPU sector and assist policymakers in adopting a strategy, policy, and program for the Saudi Vision 2030.
The paper is arranged as follows: in Section 2, data sources and the methodology for calculating GHG emissions are described. Section 3 presents the historical evolution of the IPPU sector in KSA and the calculated amount of GHG emissions from different IPPU sectors. A prediction of future GHG emission scenarios is also discussed in this section. Finally, Section 4 and Section 5 complete the paper with a discussion on mitigation measures and conclusions, respectively.

2. Methodology

The steps involved in the growth dynamics analysis and projection of GHG emissions from the IPPU sector include collecting available data on different IPPU sectors and evaluating their growth rate. Then, GHG emissions were estimated using the emission factors proposed by IPCC 2006 [25]. Later, future emission scenarios were modeled and mitigation measures were proposed.

2.1. Data Sources

According to the 2006 IPCC Guidelines [25], the mining industry, chemical industry, and metal industry are among the industrial sectors involved in this paper. The industrial production data were obtained from the “Designated National Authority Kingdom of Saudi Arabia” [2], “General Authority for Statistics, Statistical Yearbooks” [26], “Gulf Petrochemicals and Chemicals Association” [27], “World Steel Association, Steel Statistical Yearbooks” [28], “U.S. Geological Survey Minerals Yearbooks” [29], “Glass Production Capacity” [30] and “Saudi Arabian Monetary Agency Annual Reports” [31]. The details of the data sources are shown in Table 1.

2.2. GHG Emission Estimation

As with the IPCC’s 2006 Guidelines for National Greenhouse Gas Inventories [34] and the IPCC Good Practice Guidance [35], the most common straightforward methodological approach is to combine information about the activity data (AD) with coefficients that quantify emission levels or removals per unit activity. These are referred to as emission factors (EF) [36]. The basic equation is, therefore:
GHG   Emission = Activity   Data × Emission   Factor
Although data on sectoral activity from official national statistics were utilized for many years, all emission factors were set to the default values specified in the 1996 and 2006 IPCC Guidelines [26,35]. This study employed the Tier 1 sectoral technique, which usually entails the most basic and lowest dispersed activity details, and the IPCC’s basic emission factors, to compute greenhouse gas emissions. Table 2 shows the EF used in this study.

3. Results

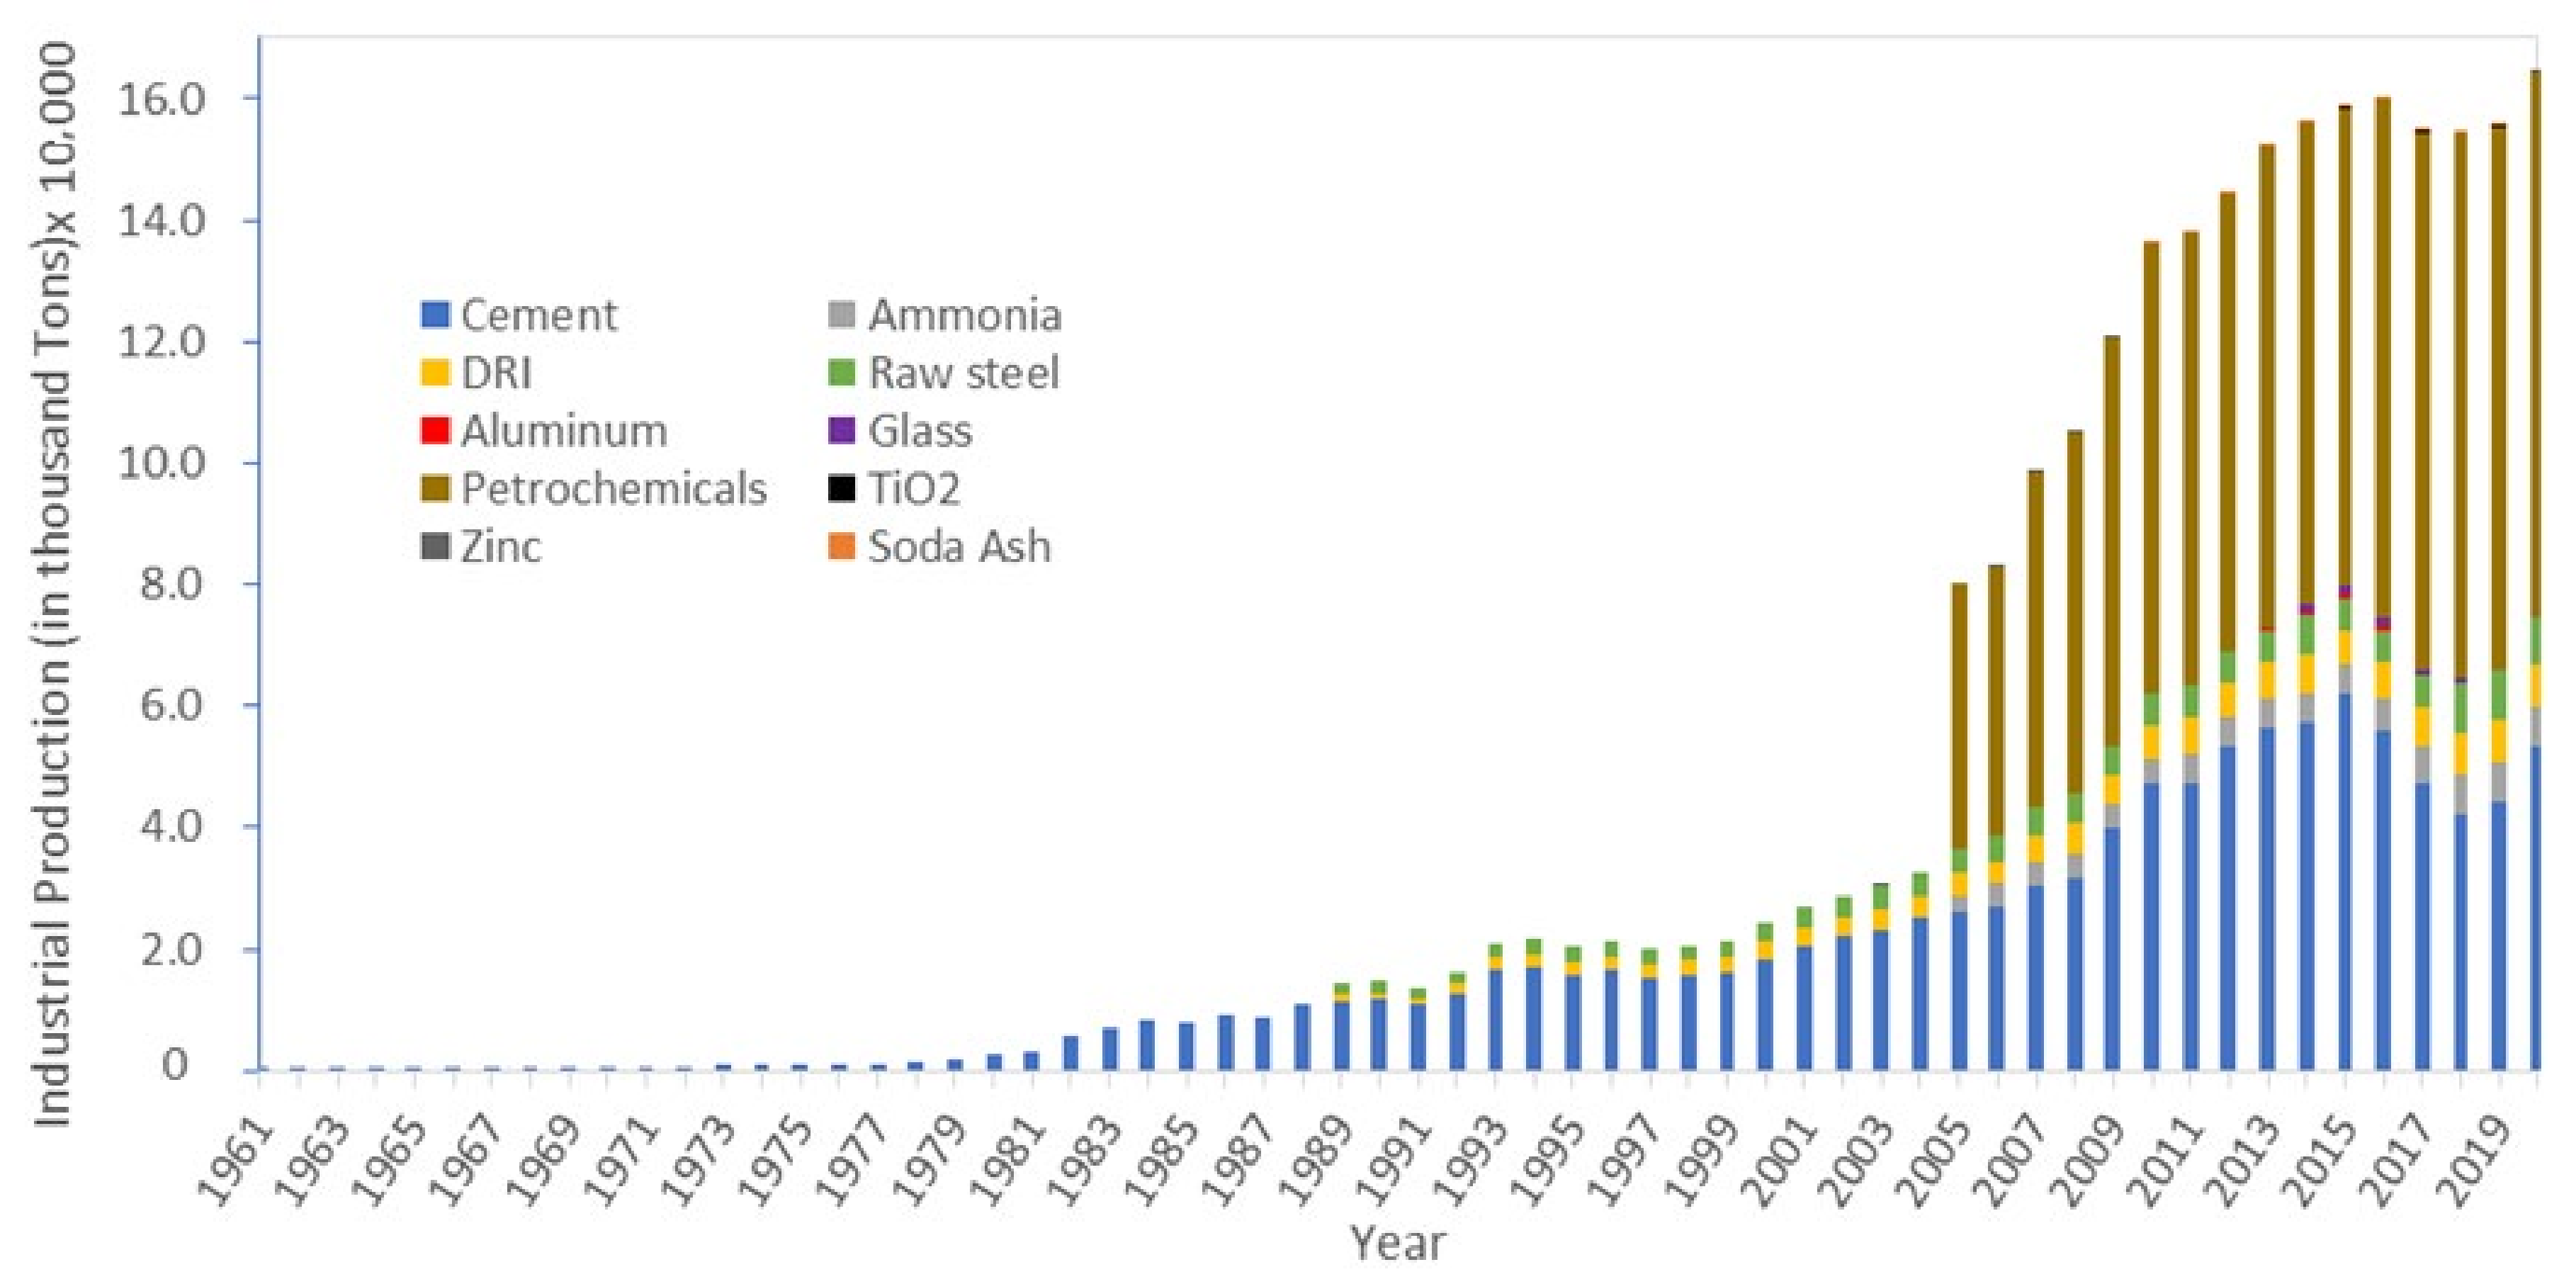
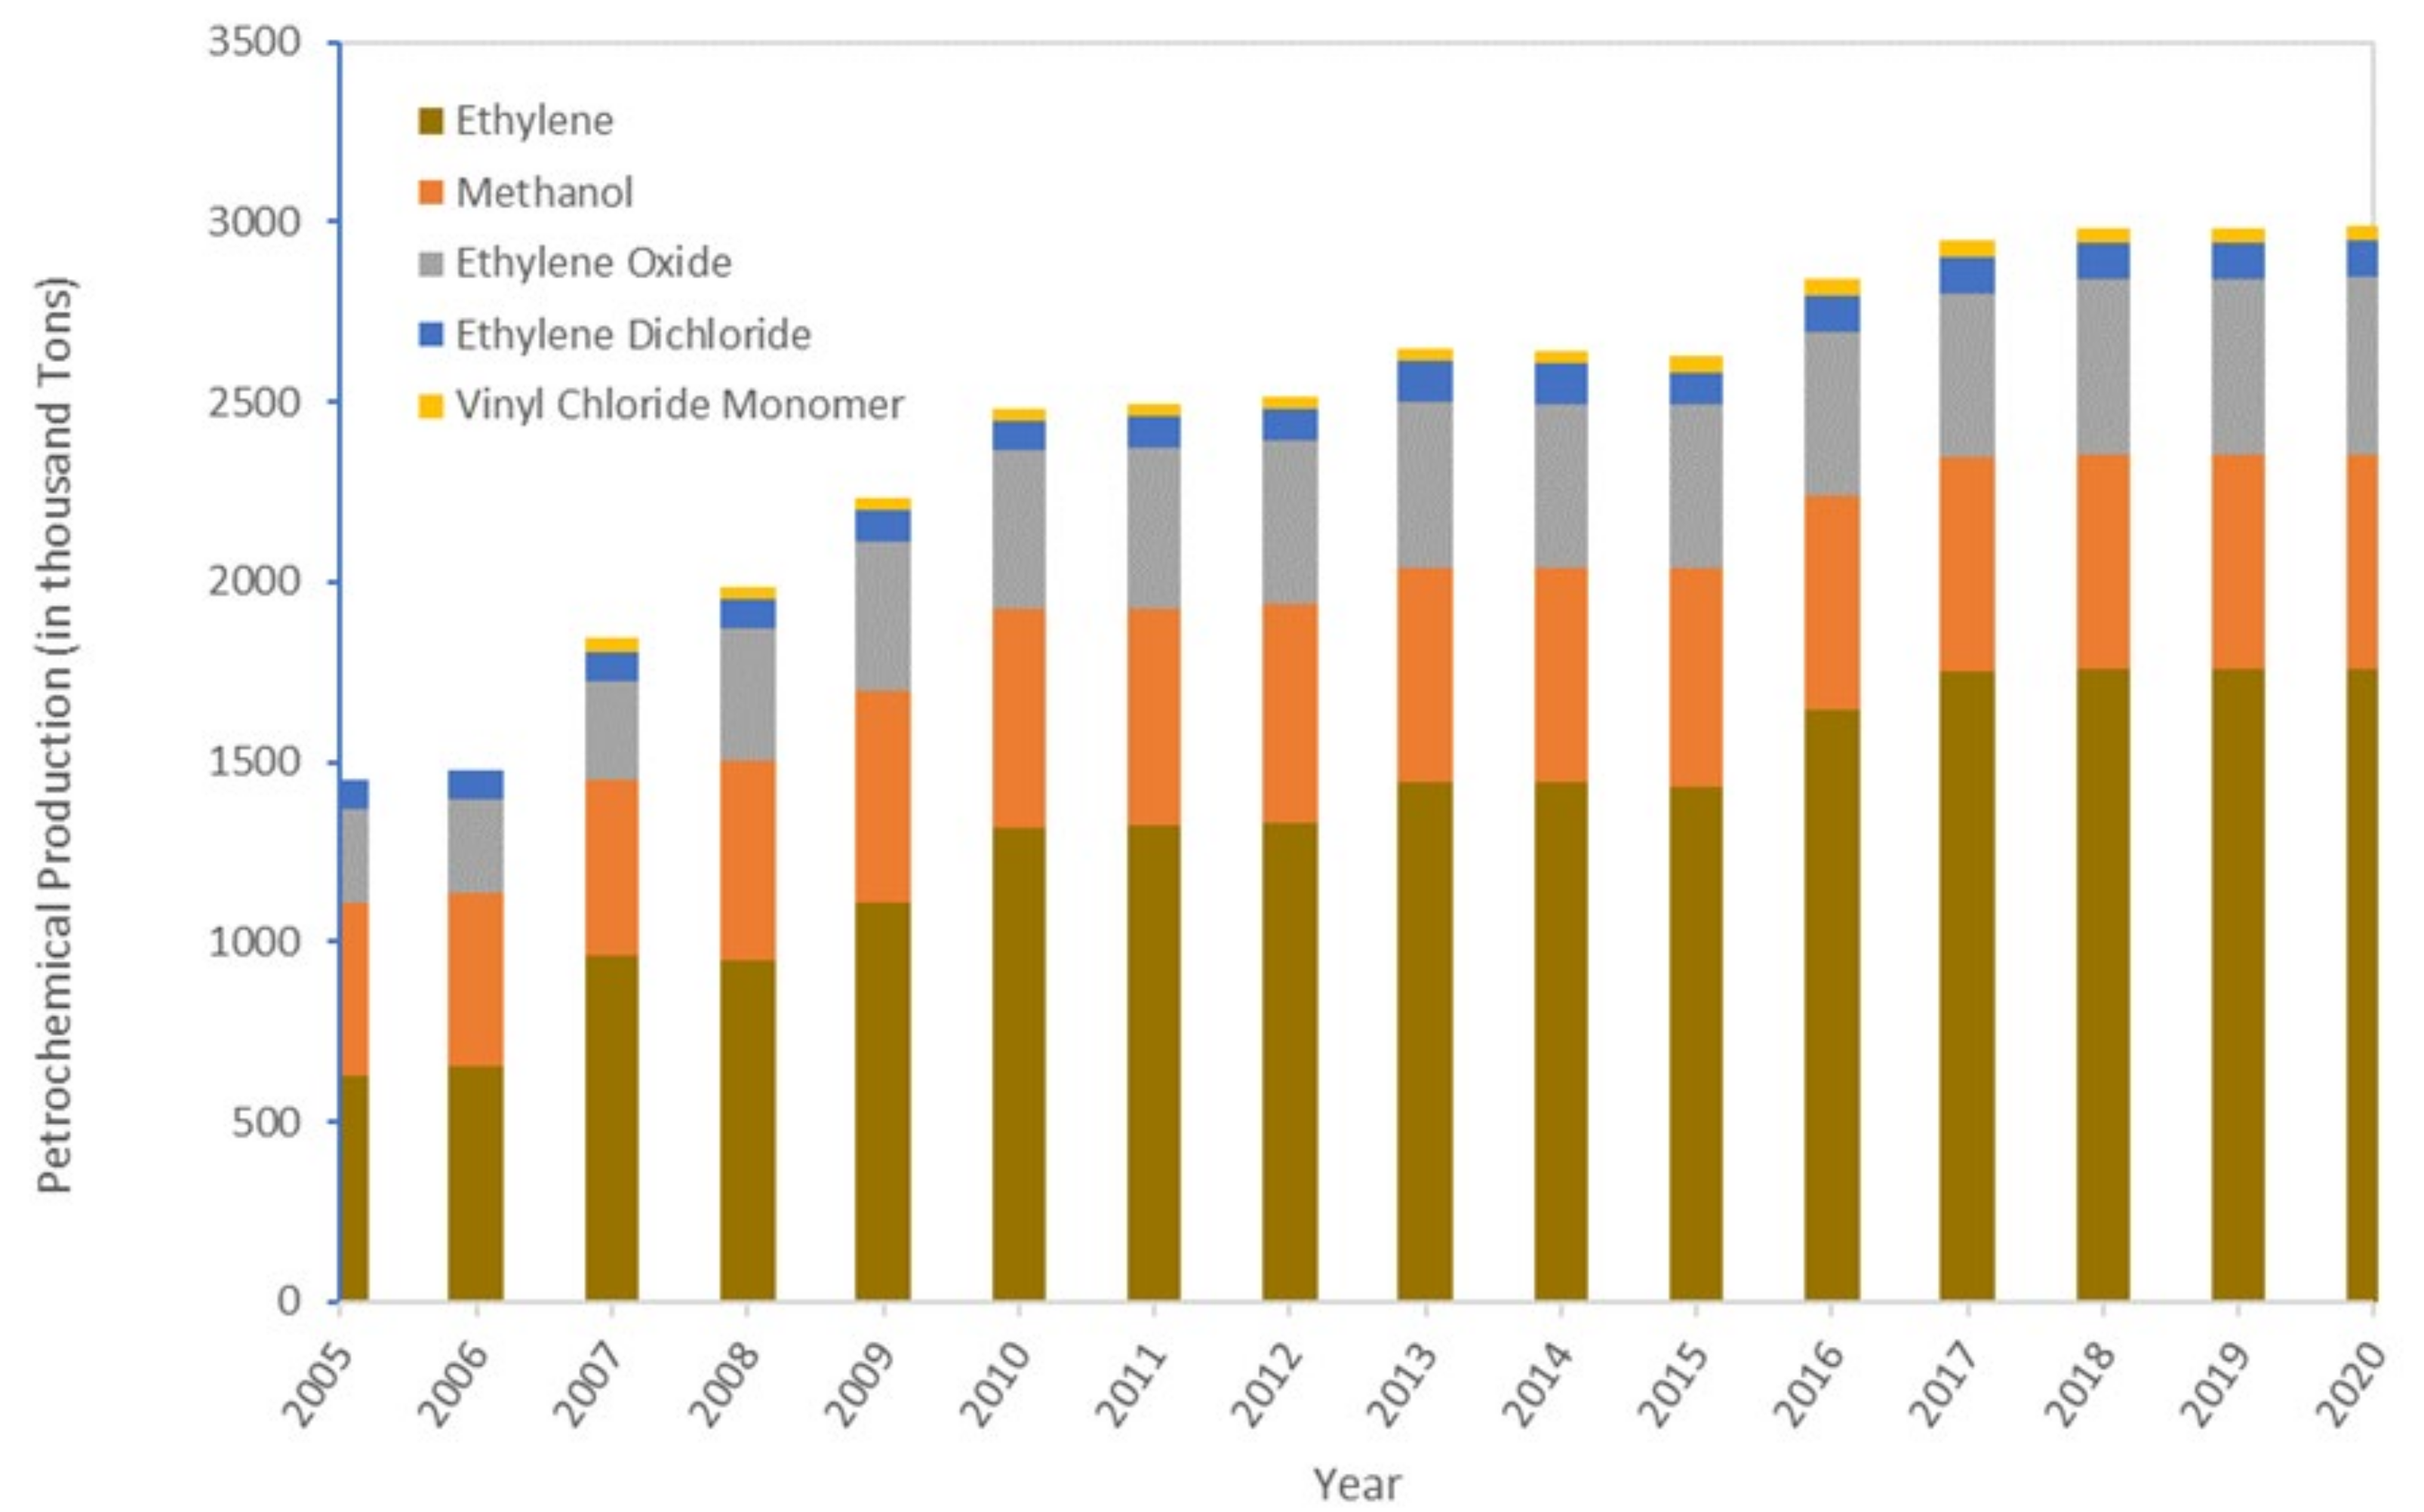
3.1. Evolution of the IPPU Sector

In Saudi Arabia, the major IPPU sectors that contribute to the Kingdom’s economy are cement, direct reduced iron (DRI), raw steel, petrochemicals, ammonia, aluminum, zinc, glass, titanium dioxide, and soda ash [24]. Some gold, bauxite, copper, and zinc are also produced from their mining sites located in Makkah, Qassim, and Eastern Province. As shown in Figure 1, among the IPPU sectors, cement, DRI, raw steel, and the petrochemical sectors are the most dominant.
For cement production, which began in 1961, the Kingdom gradually increased its output, eventually surpassing its Gulf Cooperation Council (GCC) counterparts in terms of production. However, the rate of manufacturing increase slowed. The average annual growth rate of cement output in the 1970s and 1990s was approximately 21% and 18%, respectively, before declining to 10% between 2001 and 2010. Saudi cement prices rose as a result of increased domestic use between 2001 and 2007, as well as the gradual expansion of local capacity. Consequently, in 2008, the government imposed a prohibition on the export of cement in an attempt to drive down prices and enhance local availability [37]. In 2016, demand fell and capacity remained idle, resulting in the lowest yearly growth rate in the Kingdom’s history between 2016 and 2018. In 2018, cement production was about 42.2 million tons compared to 61.9 million tons in 2015 (a staggering 46% decrease). Things appear to be improving gradually for the Saudi cement sector due to enormous investments in megaprojects such as new leisure cities and coastal development. In 2020, cement production in Saudi Arabia was recorded as 53.4 million tons, which is around a 21% increase on the previous year. This indicates that cement manufacturers consistently produced clinker throughout periods of declining demand and, maybe, in anticipation of the government raising national oil prices. Companies such as Yamama Cement Company chose to take advantage of the industry’s present excess capacity to retire outdated manufacturing lines to assure that every additional capacity is more fuel intensive and stays competitive. In 2017, the Yanbu Cement Company decommissioned its older manufacturing lines to make way for more advanced and effective lines. The availability of cement stocks ensures that they will never lose business as a result of the closure of ineffective plants.
Iron and steel production in Saudi Arabia is mainly managed by the Saudi Iron and Steel Company (Hadeed), a subsidiary company of the Saudi Basic Industries Company (SABIC). The average annual growth rate of DRI output in the 2000s and 2010s was approximately 12% and 7%, respectively, before declining to 2% between 2011 and 2020. For raw steel production, the average growth rate for the last three decades (1990–2020) was consistently about 6%.
The petrochemical industry in Saudi Arabia is another important IPPU sector. The average annual growth rate of petrochemical industry output between 2006 and 2010 was approximately 12% before declining to 2% between 2011 and 2020. In the years 2019 and 2020, no growth in this sector was observed. One of the factors contributing to this lack of growth in the petrochemical industry is the slowdown in economic growth in Saudi Arabia. As a result of the global lockdowns, demand in major consuming sectors such as automobiles and appliances, construction, and textiles has weakened. In the short–medium term, the appliance, textile, and construction sectors are likely to rebound, while the drop in demand for chemical products from the automobile and aviation industries is expected to become systemic [38]. A more detailed breakdown of petrochemical products in Saudi Arabia and their individual growth can be found in Figure 2.

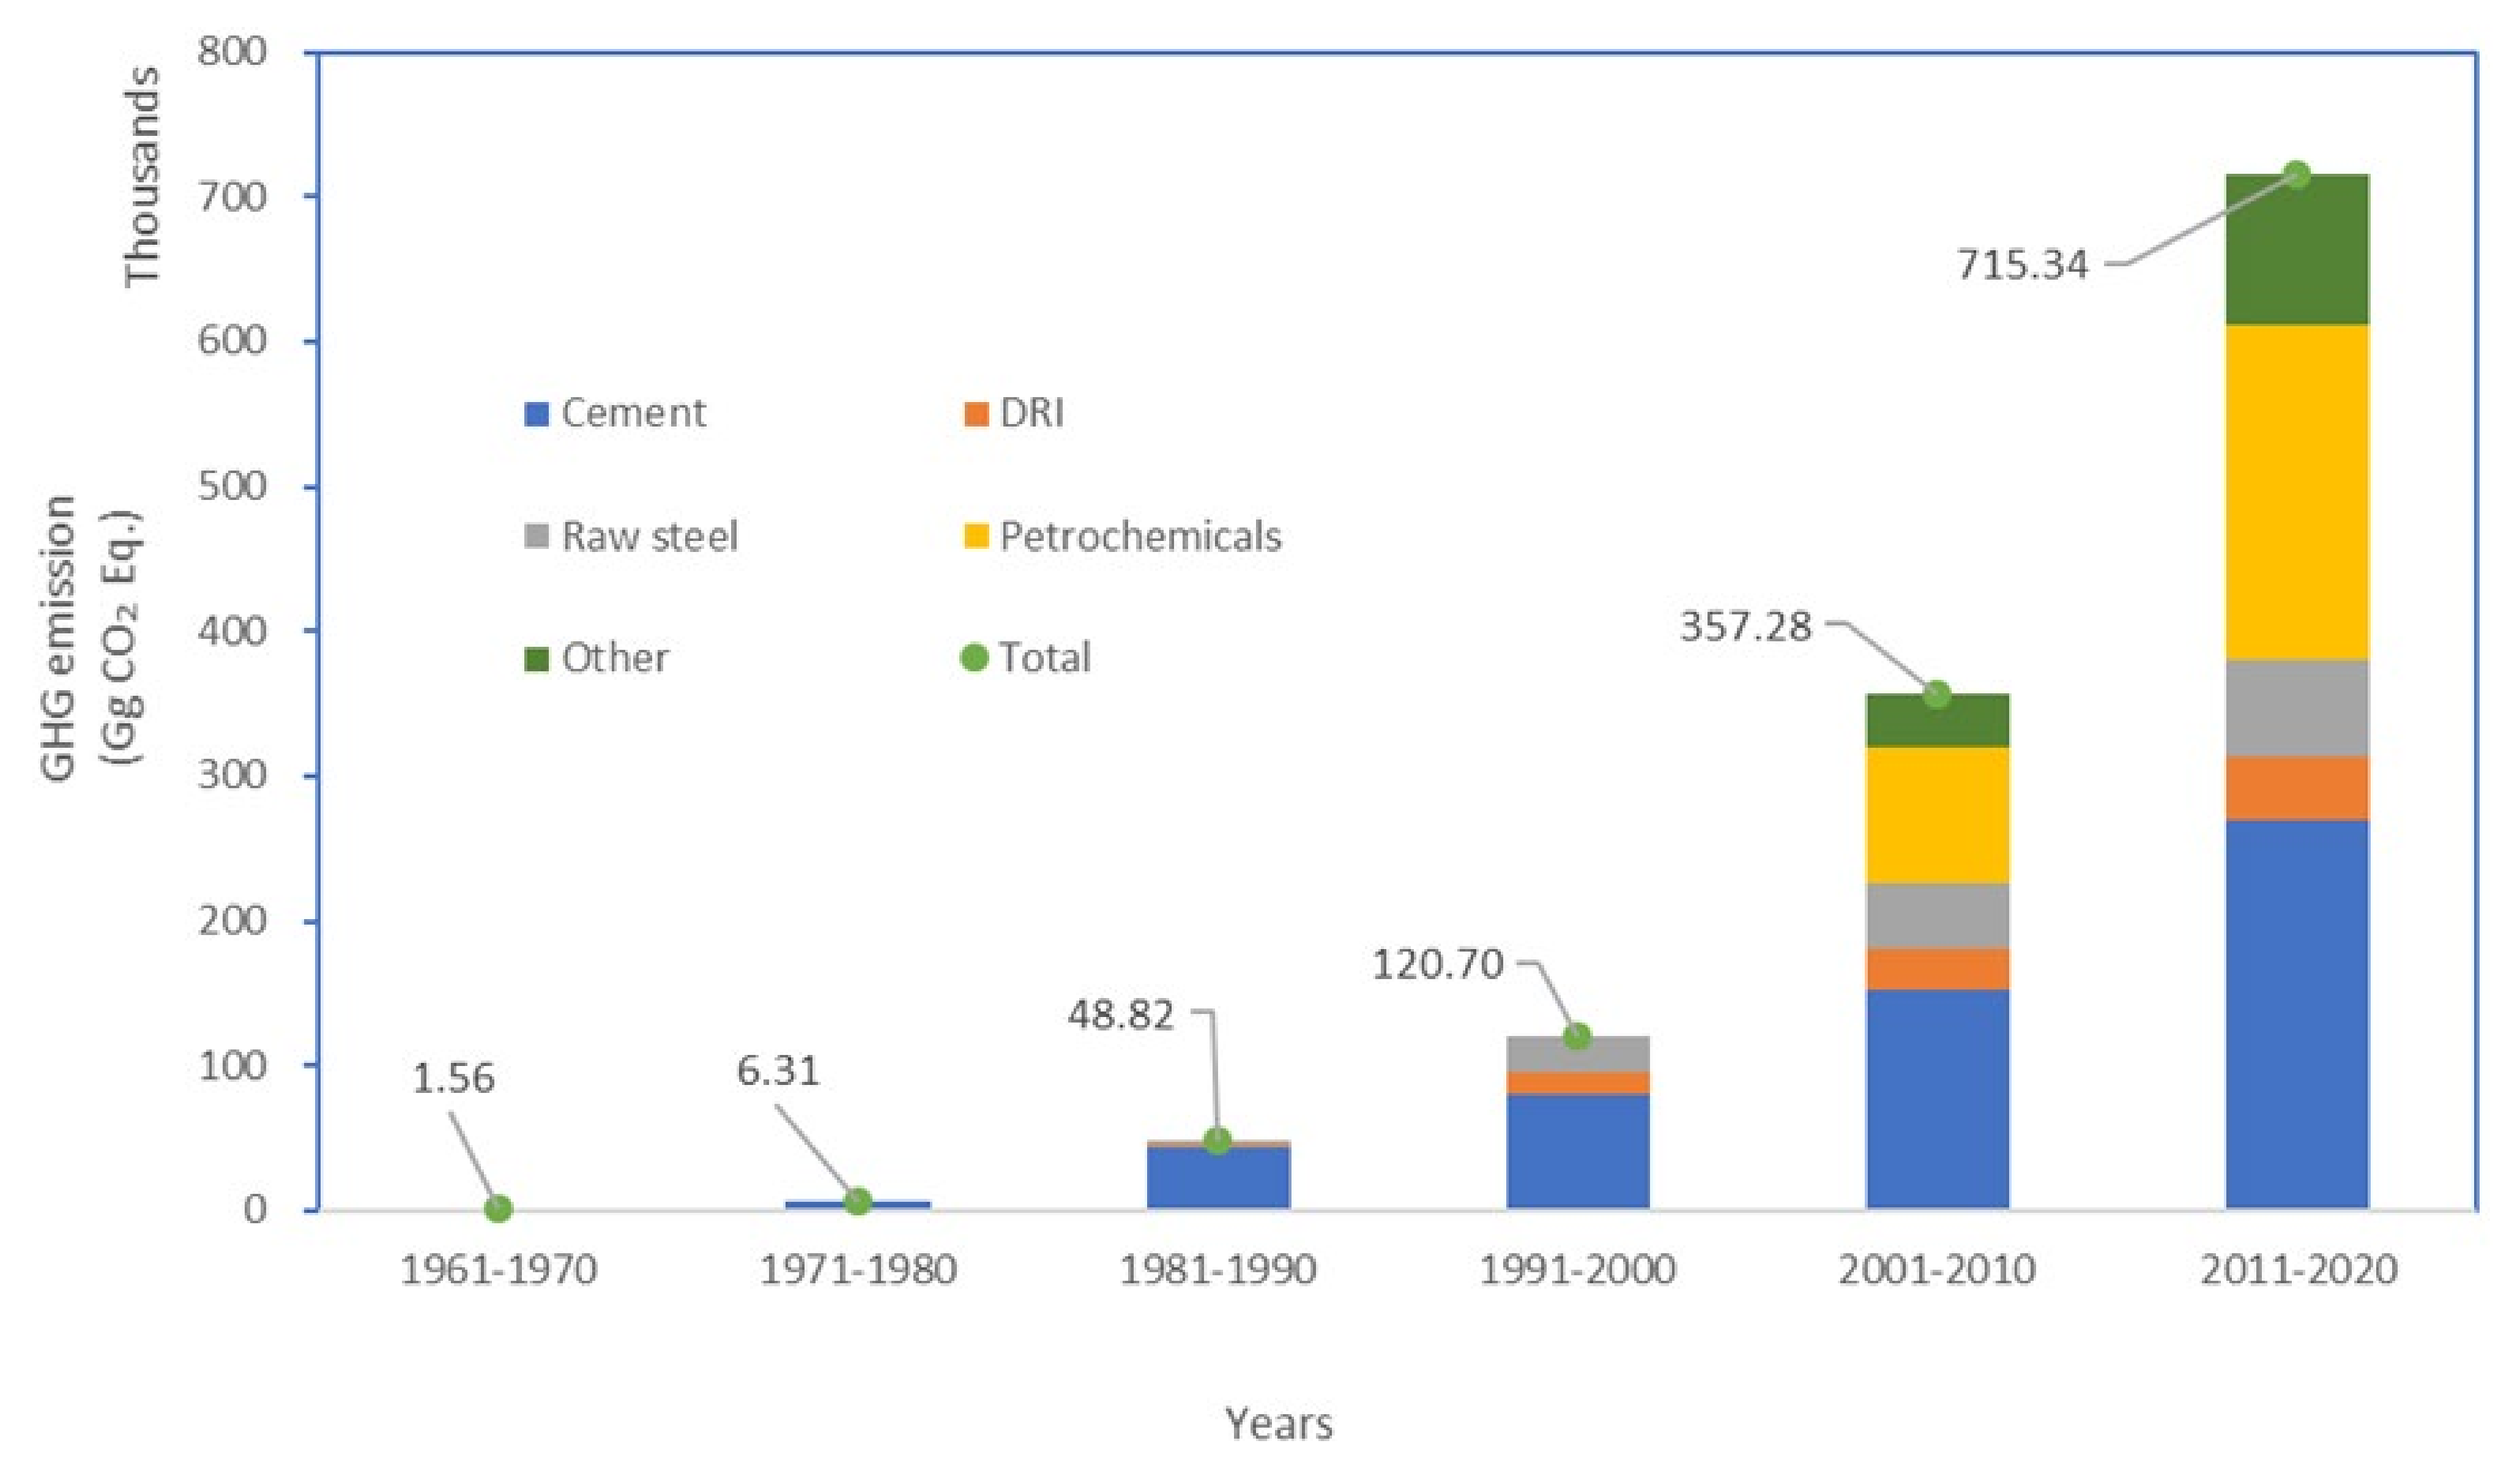
3.2. Historical GHG Emissions from the IPPU Sector

Greenhouse gas emission in terms of CO2-eq. is calculated for different sectors based on the methodology described in Section 2.2, and the result is presented in Figure 3. As can be seen, the total GHG emissions from major IPPU sectors have consistently increased over the last five decades. However, for almost all sectors, the rate of increase in emissions over the last decade has slowed. For example, the rate of increase in GHG emissions from the cement industry in the 2000s, 2010s, and 2020s was 85%, 90%, and 77%, respectively. For DRI, the rate of increase of emission slowed to 57% in the 2010s from 91% in the 2020s. A similar pattern was observed for raw steel. In the case of the petrochemical industry, only one decadal growth rate was observed (an increase of 146%), which was based on the publicly available data from 2005.
The Saudi Government’s decision to restrict the increase in GHG emissions while retaining a certain level of output growth could be one of the reasons for the slowdown in the increase in GHG emissions in IPPU sectors. Saudi Arabia’s Vision 2030, according to Howarth et al. [39], contributes to a “low carbon future” through its initiatives on economic transformation, clean energy, domestic energy price reform, and fuel combination changes, such as increasing natural gas consumption. The country’s increased use of renewable energy presents an opportunity to significantly reduce GHG emissions from the IPPU sector.

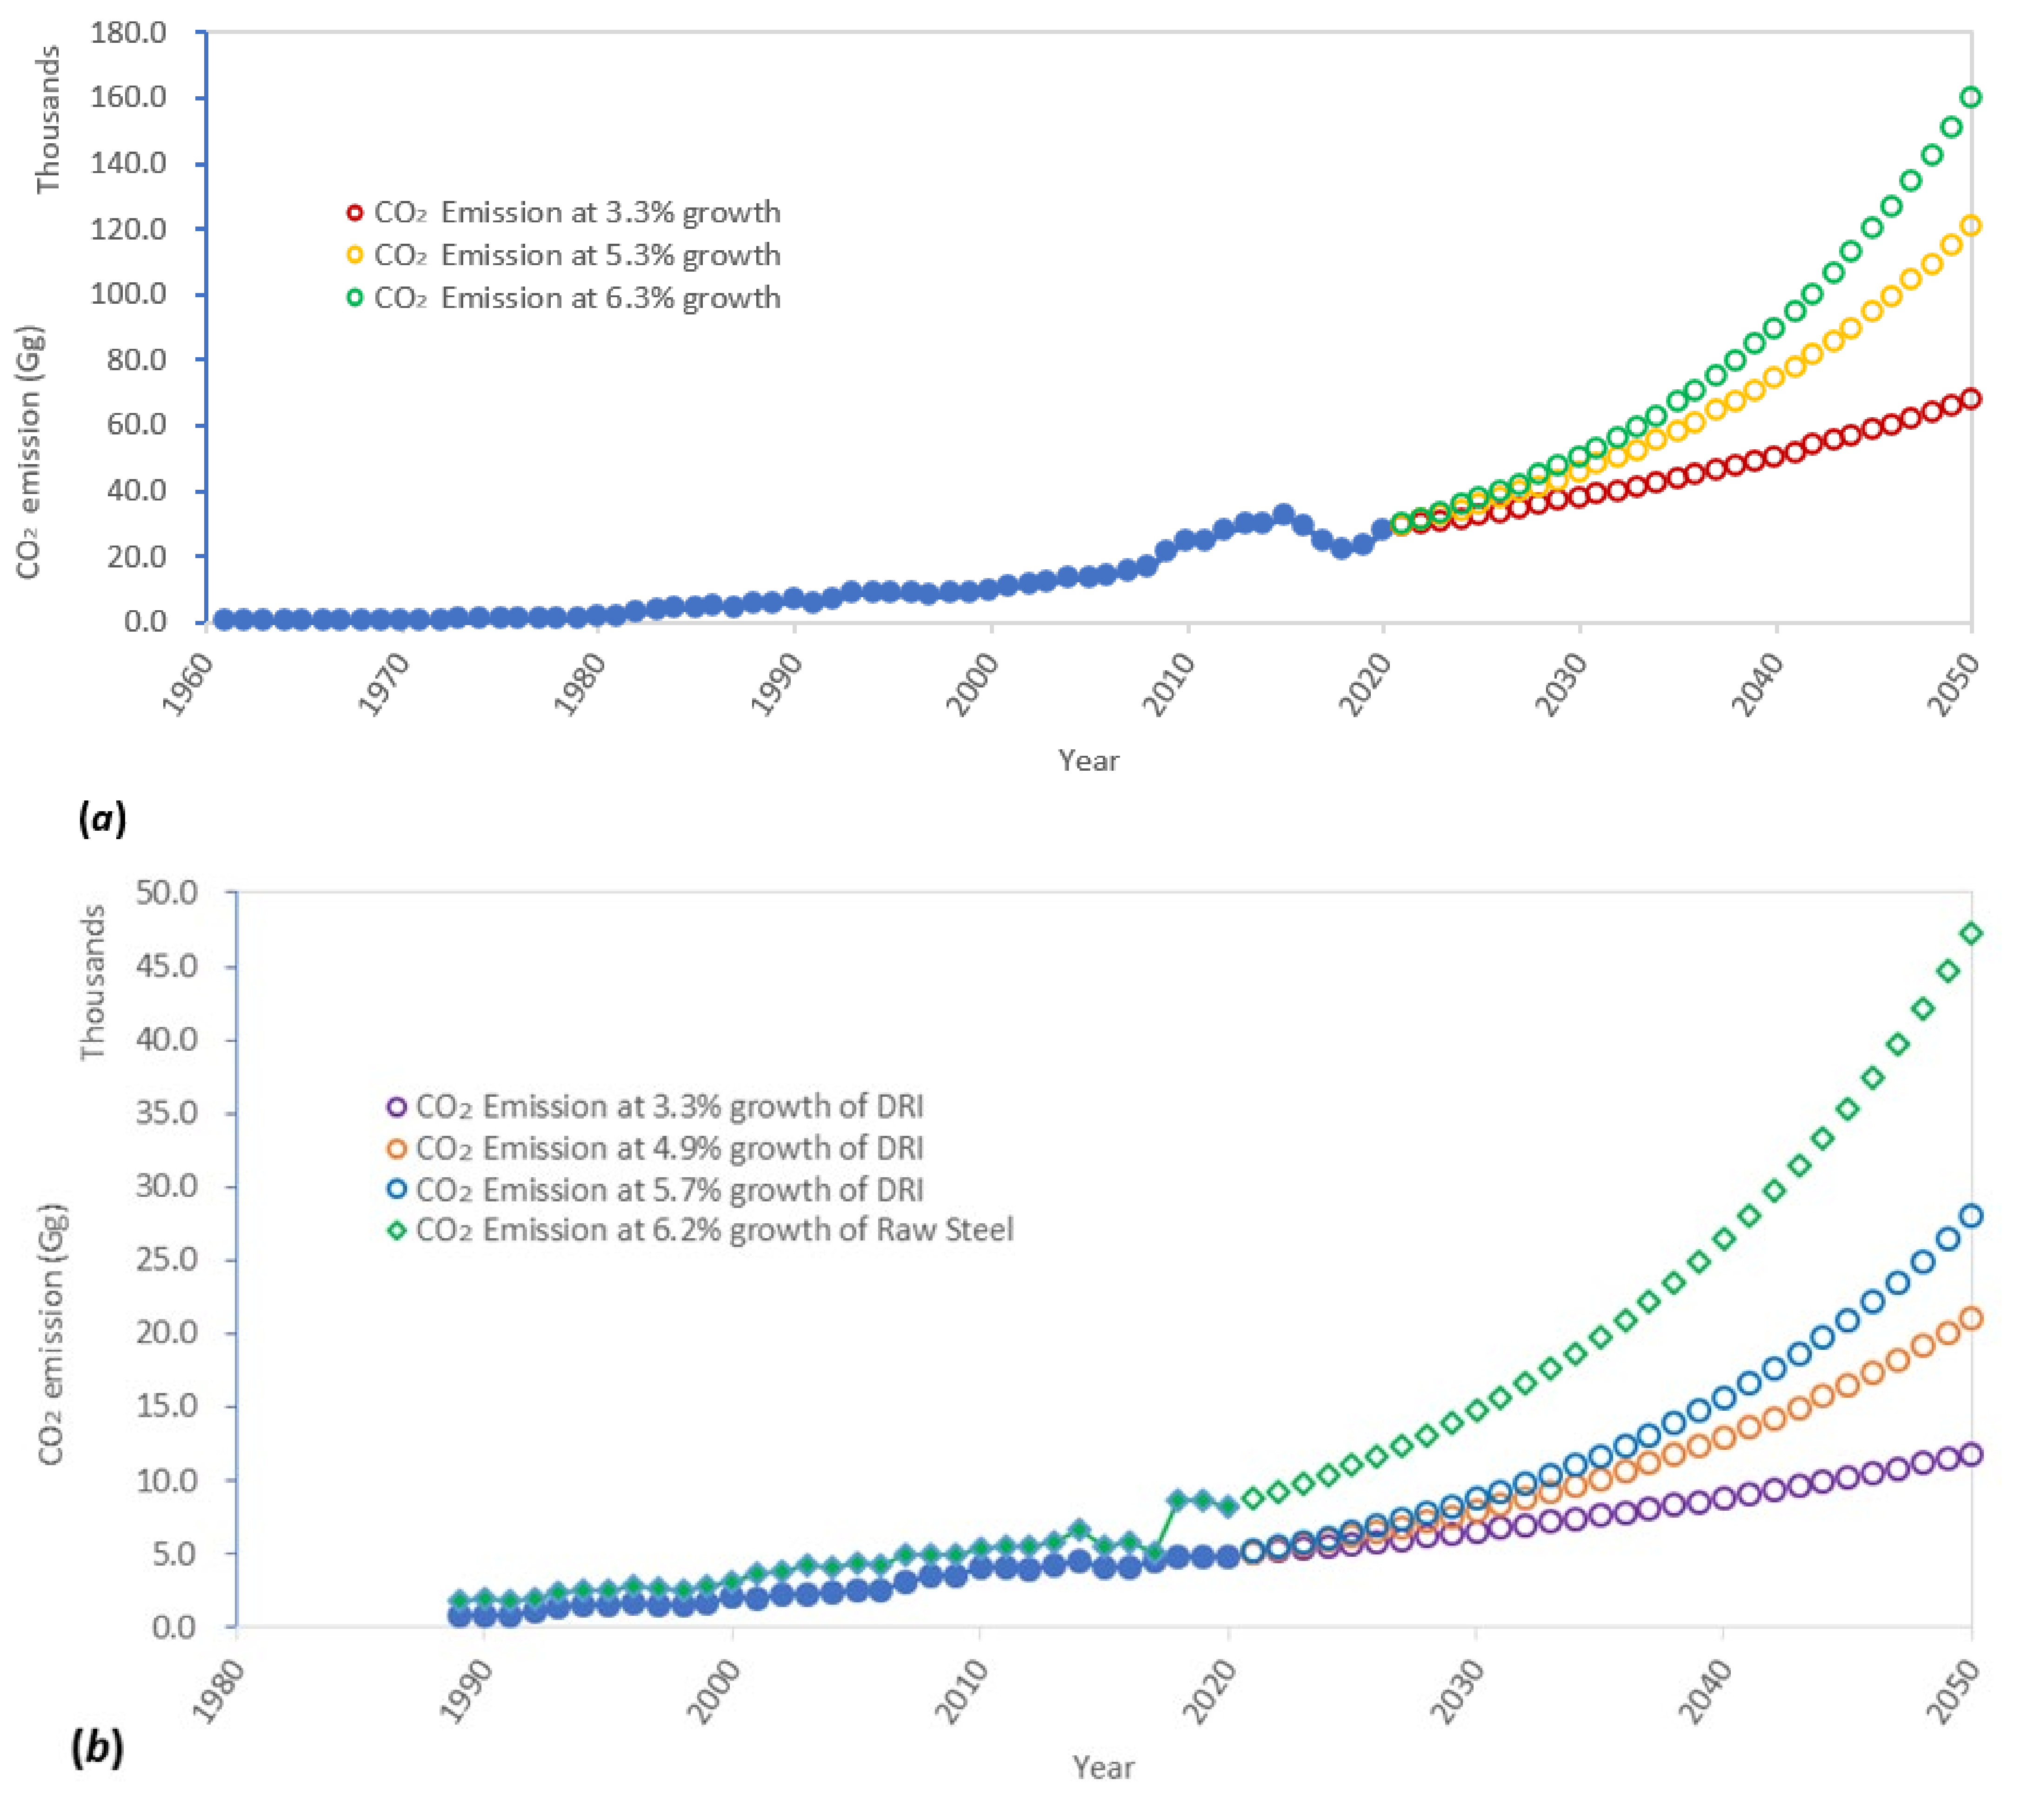
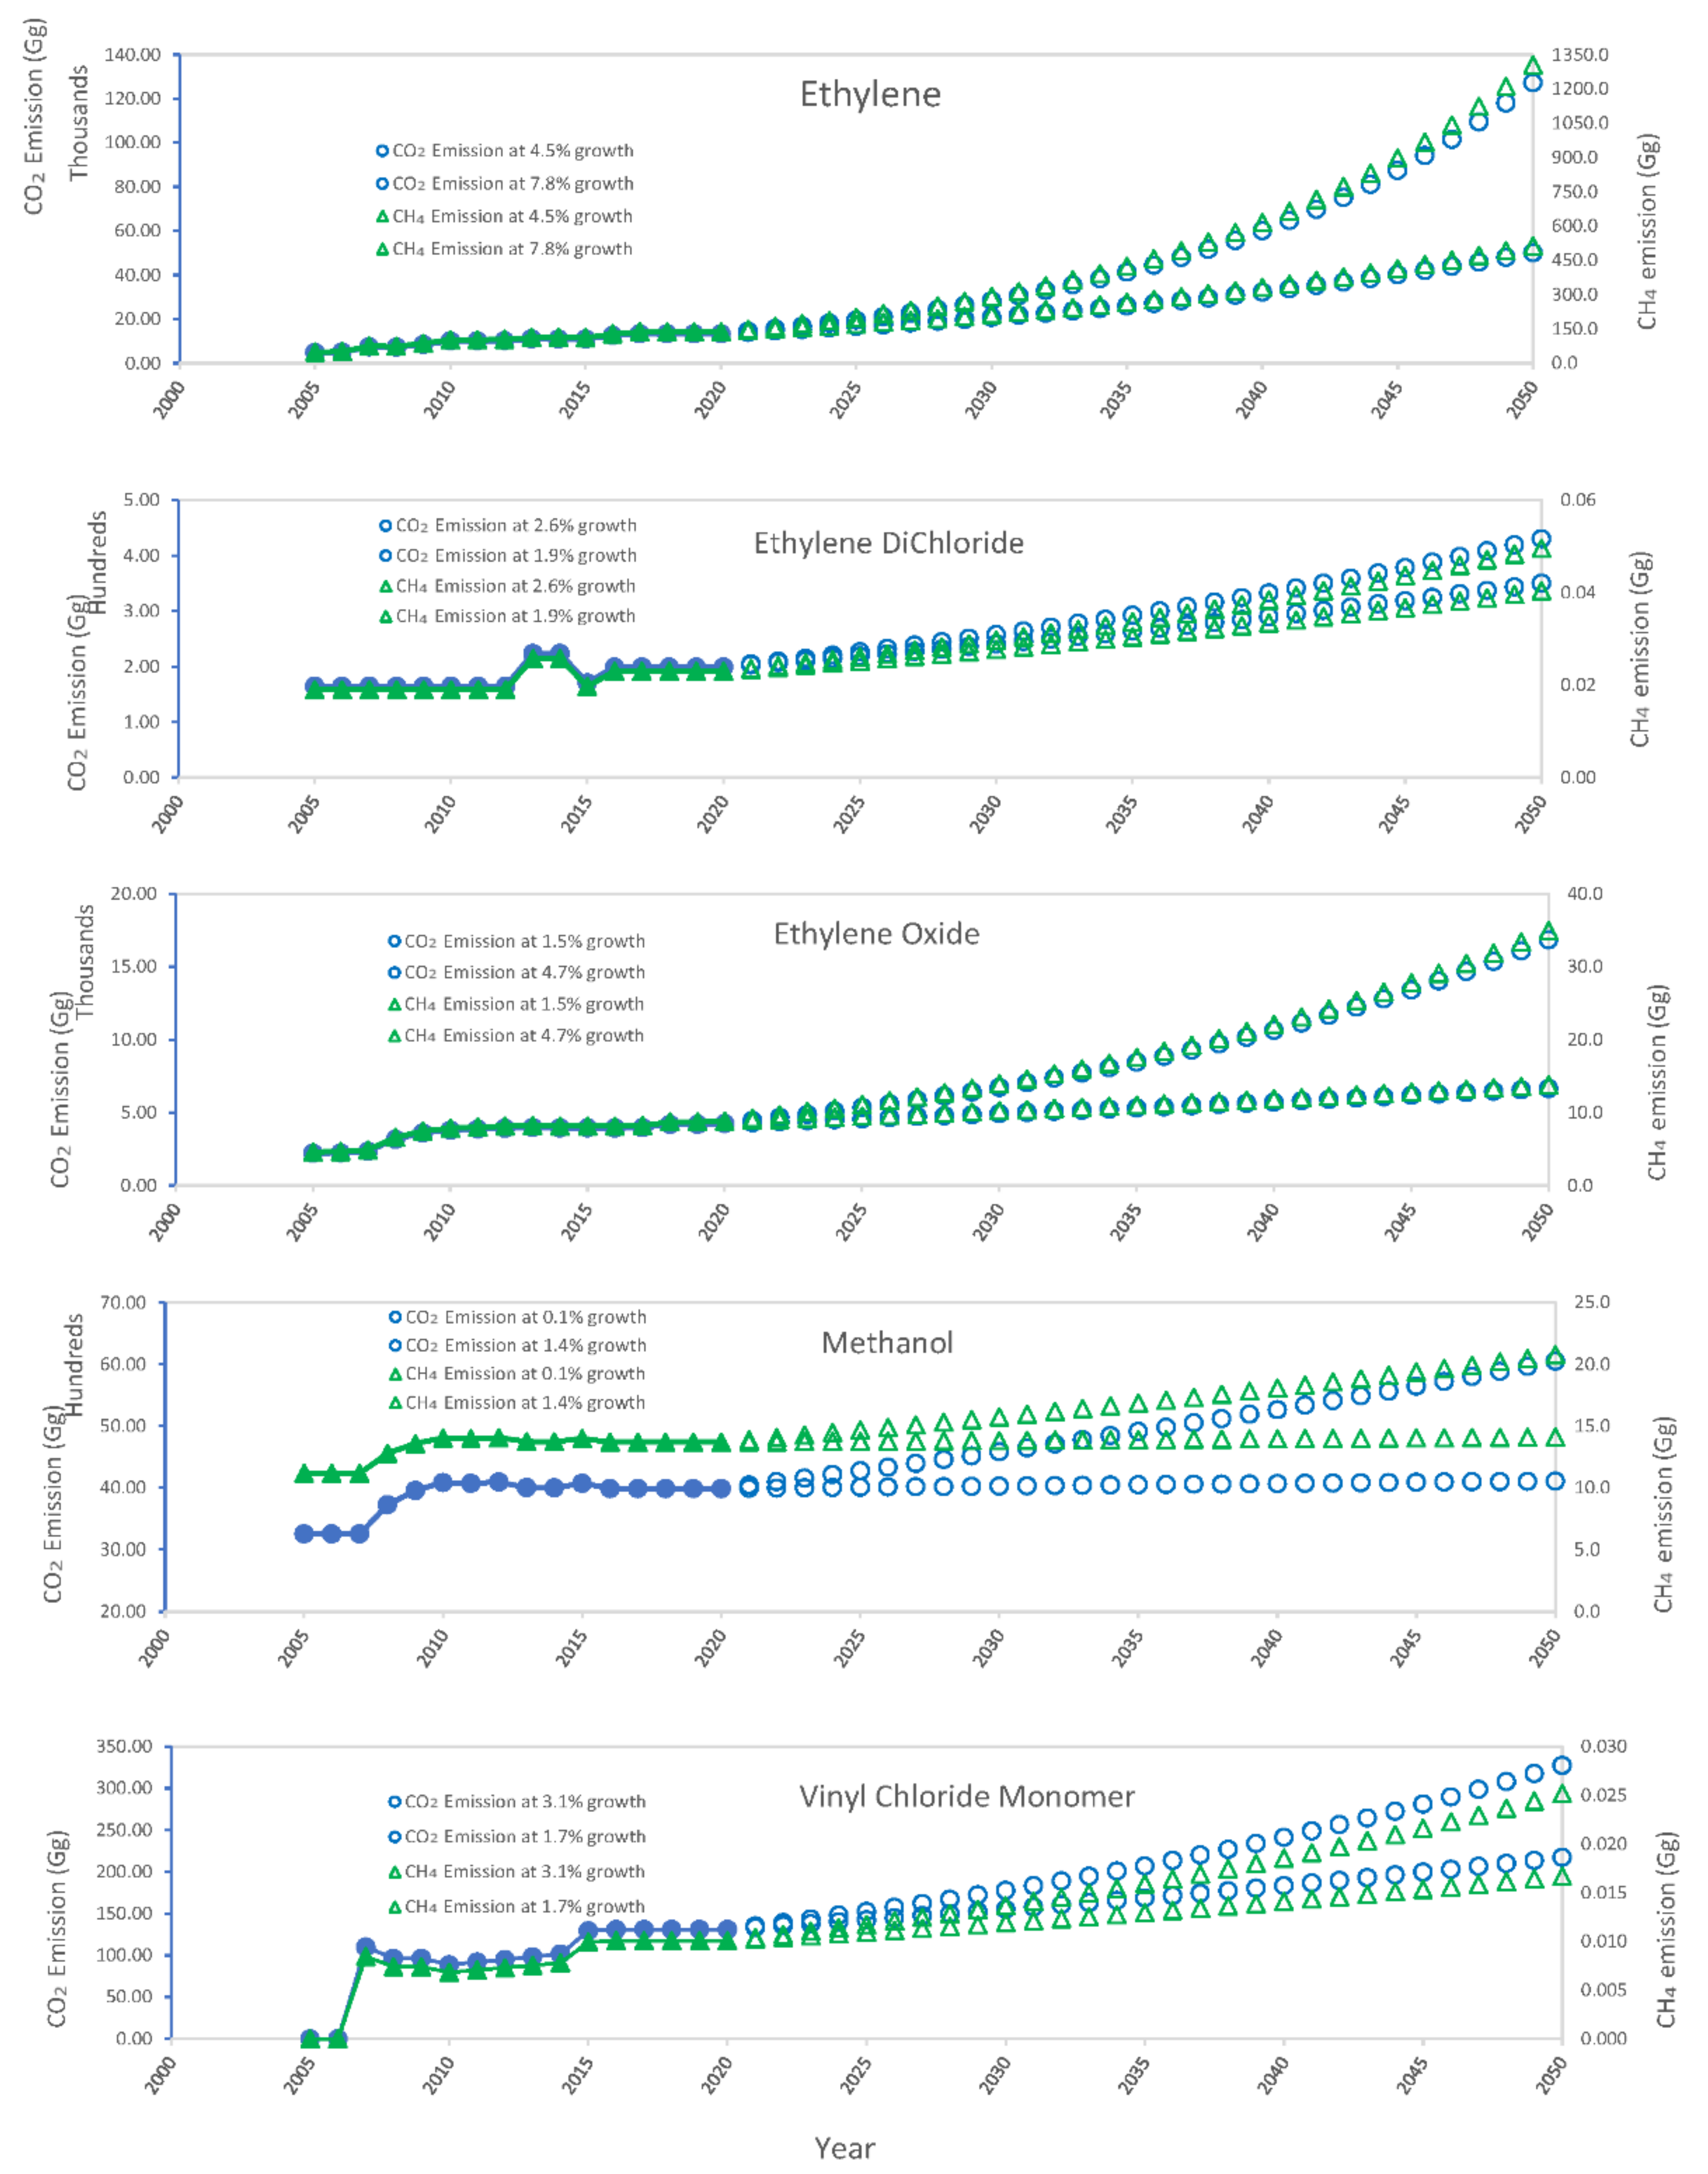
3.3. Prediction of GHG Emissions

GHG emissions from industrial operations are highly dependent on domestic and foreign demand, socioeconomic conditions, and feedstock supply. Each IPPU sector has a unique set of processes and is influenced by diverse economic considerations. Thus, forecasting future GHG emissions from each sector is only possible if all relevant economic, social, and feedstock data are available. To bypass this lengthy process, this analysis makes predictions based on the observed average annual growth rate of important IPPU industries. To achieve this, the 10-year, 15-year, and 20-year averages of cement, DRI, and steel production growth rates were determined (Table 3). For the petrochemical sector, distinct growth rates were noted for various chemicals, necessitating the determination of particular chemical production growth rates. This was also necessary due to the fact that each chemical has a unique GHG emission factor.
Predictions were made, based on the average Y/Y growth rate, for the GHG emissions from different IPPU source categories, which are presented in Figure 4 and Figure 5. In terms of GHG emissions from the cement industry (Figure 4a), even at the most conservative Y/Y growth rate of 3.3%, approximately 67,423 Gg of CO2 will be produced by 2050. It should be noted in this regard that the cement industry has experienced a slowdown in production over the last decade, with the lowest growth rate (in 2018) occurring during this period. As a result, a 3.3% growth rate (Table 3) can be assumed as a conservative growth rate for calculating CO2 emissions from this source category. Similarly, a growth rate of 6.3% can be considered ambitious, and the amount of GHG emissions calculated at this pace is 159,539 Gg. At this ambitious growth rate, the cement industry will produce 2.4 times the CO2 produced at the conservative growth rate and approximately 1.3 times the CO2 produced at a 5.3%growth rate by 2050.
For the DRI industry (Figure 4b), a conservative growth rate of 3.3% will produce approximately 16,935 Gg of CO2, and an ambitious growth rate of 4.9% will produce 40,072 Gg of CO2 by 2050. In the case of the steel industry, the 10-year, 15-year, and 20-year averages were close to a 6% growth rate; hence, a 6.2%average growth rate was used to forecast CO2 emissions. By 2050, this source category is expected to emit approximately 44,656 Gg of CO2. In the petrochemical industry, the biggest amount of expected GHG emissions (in terms of CO2 and CH4) is from ethylene production (Figure 5). By 2050, the ethylene industry will create 50,040 Gg of CO2 at a conservative growth rate of 4.5%and 127,172 Gg of CO2 at a more ambitious growth rate of 7.8%. With this ambitious growth rate, CO2 emissions are predicted to exceed those of the iron and steel industry. By 2050, the ethylene industry is expected to emit 514 Gg and 1305 Gg of CH4, respectively, at a growth rate of 4.5%and 7.8%. Other industries in the petrochemical source category will emit far fewer greenhouse gases than the ethylene industry, as illustrated in Figure 5.

4. Discussion

According to the analysis presented in the previous section, GHG emissions from almost all the source categories will significantly increase by 2050. To achieve an absolute decrease in industrial sector emissions, a diverse collection of mitigation approaches beyond present practices will be required. Mitigation measures, i.e., (i) energy efficiency, (ii) emissions efficiency (including fuel and feedstock switching, carbon dioxide capture and storage), (iii) material efficiency (for example, through reduced yield losses in production), (iv) re-use of materials and recycling of products, (v) more intensive and longer use of products, and (vi) reduced demand for product services are all potential options for reducing GHG emissions from industry.

4.1. Energy Efficiency

In industry, energy powers chemical reactions, generates heat, and drives machines. The required chemical processes are thermodynamically limited. Industrial energy efficiency has a long history of making investments and enforcing regulations on installed equipment for “best practice” [40]. For a variety of reasons, energy efficiency has traditionally been considered a critical strategy for the industrial sector.
Energy efficiency has improved in energy-intensive industries over the last four decades, yet the “best available technologies” are reaching their limitations. However, there are several opportunities to increase energy efficiency, and the difference between best practices and actual energy usage is still substantial in many industries and nations. Several reports estimated potential energy savings in industry to be up to 25% [41,42,43,44]. Some energy-intensive businesses may be able to reduce energy intensity by an additional 20% through innovation [41].
Industrial processes and systems such as steam, process heating (boilers and furnaces), and electric motors (e.g., pumps, air compressors, fans, refrigerators) all have energy efficiency potential. For small- and medium-sized businesses, electronic control systems could be used for the optimization of equipment and systems (e.g., motors, compressors, steam combustion, and heating systems), which would result in lower energy consumption and emissions [45]. Hot and cold gas exchange, enhanced insulation, heat storage in hot goods, electricity generation from exhaust heat, or lower temperature operations are all examples of improved heat management [46,47]. A minimum temperature differential of 200 °C is required for industrial heat exchangers. The difficulties of heat exchange out of solid materials and the low temperature of “waste heat” sometimes limit its utilization.
Recycling can help reduce energy consumption by making materials with less energy. Recycling bulk metals (such as copper, steel, and aluminum), glassware, and paper conserves energy by eliminating chemical processes that need more energy. In Europe, rates of plastic recycling are reported to exceed 33% [48], but glass recycling saves less energy due to the low reaction energy needed to melt the glass [49]. As a result of low collection rates for some materials (especially steel) and a lack of available scrap supply, recycling is used when economically feasible. However, crushed concrete can be reused as aggregates or designed fill. With less aggregate produced, this may raise emissions as a result of the energy required for concrete crushing and processing, together with the extra cement needed to achieve desired properties [50].
The KSA has invested in increasing the overall efficiency of power plants with combined-cycle technology. A heat-recovery steam generator extracts heat from exhaust gases and converts it to steam, which is used in turbines to create more energy in this system. Fuel consumption is reduced by converting single-cycle gas turbines with low efficiency to combined-cycle plants and by constructing new combined-cycle plants [51]. The number of combined-cycle power production units has been continuously growing in the KSA, from 35 in 2005 to 74 in 2014 [52].
Saudi Aramco (the Saudi oil producing company and the largest in the world) has been maintaining its environmental stewardship by implementing energy efficiency measures. According to Saudi Aramco, a barrel of oil equivalent product requires 4.56% less energy in 2013 than it did in 2012 [53]. The energy intensity of its operations [54] fell by 5.4% in 2014 compared to 2013. Saudi Aramco’s Energy Management Program began in 2000. From 2000 to 2010, this program saved 11,281,000 barrels of oil equivalent/day. Cogeneration facilities improved Saudi Aramco’s energy efficiency in 2013. It saved more than 170 million cubic feet of gas every day. Saudi Aramco is using net zero discharge technology to minimize flaring and hydrocarbon discharge at onshore and offshore well sites. Saudi Aramco decreased the flaring of natural gas production from 0.89%to 0.72% across all upstream units in 2013. In 2014, it recovered 2.6 billion cubic feet of gas and roughly 215,000 barrels of crude oil from 432 wells using net zero discharge technology [52]. Energy-saving efforts at Saudi Aramco helped the company reduce the energy intensity of its refining operations by 3% in 2014. On average, the firm saved 16,085,000 barrels of oil equivalent daily between 2002 and 2014 due to energy saving [54]. In 2014, Saudi Aramco attained about 90% self-sufficiency in the production of electrical energy. It completed the construction of a 420-megawatt cogeneration plant at Manifa, which will allow the facility to produce its own power [54]. Since 2002, Saudi Aramco has been working on projects to meet the facility’s goal of generating 4.4 million lb/h of steam and 1075 MW of energy. It also replaced almost half a million fluorescent lightbulbs with energy-efficient LED lightbulbs in 2014. Every year, this campaign saves around 30 million kilowatt hours [52].
The iron and steel industry in Saudi Arabia is one of the most significant contributors to the country’s greenhouse gas emissions. The COVID-19 problem has reverberated throughout global supply networks, resulting in a projected 5% drop in global crude steel output in 2020 compared to 2019. CO2 emissions from this source category are expected to continue increasing. To stay on track with the Paris Agreement’s goals, the steel industry’s direct CO2 emissions must decline by more than 50% by 2050 compared to now [55]. Energy efficiency may be improved by 15% to 20% in iron and steel manufacturing processes, according to recent research by Talaei et al. [56]. It is possible to reduce greenhouse gas emissions by enhancing energy efficiency, which can be accomplished through improved energy and heat recovery from process gases, products, and effluents; better fuel delivery through the use of pulverized coal injection; better design of furnaces and control systems; and reduced temperature cycles, which can be accomplished via improved system pairing, such as those in Endless Strip Production (ESP) [57]. It is envisaged that several developing technologies, including carbon capture and storage (CCS), hydrogen direct reduction [58], and iron ore electrolysis, would aid in the sector’s carbon decarbonization in the not-too-distant future [59]. Various energy efficiency technologies in combination with alternate iron and steel production pathways, such as smelter and direct reducing techniques [60,61], may reduce emissions to a significant extent.
The cement manufacturing process has a considerable environmental impact. It is a high-energy process that uses significant amounts of raw materials. The suitability of GHG mitigation alternatives in the cement industry is dependent on several criteria, including technological and economic performance, as well as the solutions’ efficacy in reducing GHG emissions [62]. In the cement production process, emissions are produced due to the combustion of fuel (which is required to heat limestone with sand and clay at 1450 °C) and the calcination reaction. Enhanced energy efficiency and switching to cleaner-burning fuel sources could reduce fuel emissions by about 40% [63]. Yanbu Cement Company (YCC) (one of the largest cement manufacturing companies in Saudi Arabia) has signed a contract for the installation of a 34 MW waste-heat-recovery (WHR) system. The facility is designed to reduce fuel usage and CO2 emissions by more than 0.1 million tons per year throughout the power-generating process. A major Saudi energy company has begun constructing an efficient power plant to achieve Rational Use of Energy (RUE) Source Energy. This plant will supply electricity and air conditioning to the King Road Tower. This project generates refrigeration by using absorption chillers that capture waste heat from the power plant. It is estimated to reduce annual CO2 emissions by 10,000 tons [52].
Aluminum is the most produced non-ferrous metal worldwide, with 56 million tonnes produced in 2009, 18 million tonnes of which were from recycling [64]. To reduce emissions, the marketing of inert anodes, multipolar electrolysis cells, and carbothermic processes in the aluminum manufacturing industry is necessary. According to the International Energy Agency, using the best available technology may cut energy consumption for aluminum manufacturers by 10% [65].

4.2. Emissions Efficiency

According to the International Energy Agency (IEA), coal and oil accounted for 42% of the industrial energy supply in 2008, gas contributed 20%, and electricity and renewable energy sources accounted for the remainder. By 2035, IEA predicts that these amounts would climb to 30% and 24%, respectively, due to fewer emissions per unit of energy [66]. Switching to natural gas also enhances energy efficiency in industrial Combined Heat and Power (CHP) systems [67,68]. With low-grade heat storage, CHP [69] can help balance loads from a range of renewable energy sources. The energy industry now uses waste and biomass in modest amounts, but this is likely to increase [70]. Increased electrification may assist in reducing emissions if electricity generation is decarbonized [70]. Solar thermal energy can also be used for drying, washing, and evaporation [63], though it is not implemented frequently [71].
CO2 use is now the focus of several industry-led R&D, demonstration, and diffusion (RD & DD) operations. Due to the high concentration of CO2 in vented gas (up to 85%), there may be new opportunities for carbon dioxide capture and storage (CCS) in gas processing [72]. An analysis of industrial CO2 stated that potential industrial CO2 use was restricted, and CO2 storage duration in industrial items was often quite short [73]. As a result, industrial CO2 usage is unlikely to significantly reduce climate change.
Process improvement and thermal destruction of hydrofluorocarbon (HFC-23) emissions generated during hydrochlorofluorocarbons’ (HCFC-22) manufacture can reduce non-CO2 emissions. Between 1990 and 2010, the use of thermal destruction and secondary catalysts reduced N2O emissions from adipic and nitric acid production by almost 50% [74]. Alternatives to HFCs can be used, such as refrigerants (such as HC, CO2, ammonia, hydrofluoro-olefins). Replacement can also reduce HFC emissions from solvents and foams (using alternative blowing agents). Recovering refrigerant, repairing leaks, and recycling with proper disposal can all reduce refrigerant emissions. Flat-panel display manufacturing is rapidly increasing PFC, SF6, and NF3 emissions. These emissions mostly originate from China [74] and can be reduced using catalytic technologies, fueled combustion, and plasma.
Direct reduced iron (DRI) systems based on natural gas, as well as oil and natural gas injection systems, should be adopted wherever it is economically and technically feasible. However, DRI production is currently carried out on a smaller scale than massive blast furnaces [75]. Any emissions gained using DRI are dependent on the emissions associated with the needed electric arc furnace (EAF) process. Charcoal is another coke substitute that is a strong potential alternative in iron production [76]. Ferro-coke as a reductant could also be used as another potential alternative [77]. Moreover, the replacement of coal with biomass and waste plastics [78] is also gaining momentum. If a low- or no-CO2-emitting electrical source is available, molten oxide electrolysis may reduce emissions [79]. However, this technology is still evolving, and discovering a suitable anode material is the main challenge.
Heat recovery is another strategy to improve thermal energy efficiency in cement production. Previous investigations [80] explored the recovery of radiation and convection heat losses from the kiln shell of the cement production process. Ref. [81] evaluated the potential of waste heat from the hot gas effluent of a cement plant for two applications: electric power production and drying limestone feedstock. CO2 capture and storage systems can be retrofitted into cement kilns; however, this has not been tested, and “commercial-grade CCS” in the cement industry is currently at an early stage [82]. Numerous developing technologies could be used to minimize emissions and energy use from this source category, but regulatory, supply chain, product trust, and technological challenges must be solved [83,84].
There are possibilities for improving the Haber–Bosch process for producing ammonia [85] during fertilizer production. Additionally, moving to a cleaner fuel source can result in substantial emissions reductions and energy savings. For example, ammonia production from natural gas results in a 36% reduction in emissions when compared to naphtha, a 47% reduction in emissions when compared to fuel oil, and a 58% reduction in emissions when compared to coal. The total amount of reduction that might be achieved by this fuel transition would be 27 MtCO2eq/year in terms of GHG emissions savings [64].
The production process of aluminum can create emissions with high global warming potential (GWP), including GHGs such as PFCs (i.e., CF4). This process can be reduced by monitoring and managing the process to avoid a dip in alumina concentrations that initiates the reaction [64].

4.3. Efficiency of Material in Production Process

Reducing the amount of fresh material used in services is an important way to reduce industrial emissions [86]. Two important solutions would greatly enhance existing product material efficiency:
  • Reducing material, manufacturing, and construction losses: Every year, about 10% of paper, 25% of steel, and 50% of aluminum is scrapped and recycled internally. Process changes and new design methodologies could reduce these losses [87].
  • Reusing previously used materials: A comprehensive research study [86] determined that there are no prohibitive technological hurdles to recycling structural steel in construction, that there is a revenue possibility, and that the prospective supply is growing.
Material efficiency can significantly reduce emissions and costs in the iron and steel industry. The authors in [42,88,89] evaluated the impact of losses from the steel supply chain and discovered that more than a quarter of worldwide liquid steel is lost as process waste, which could cause a 16% reduction in industrial CO2 emissions. According to Cooper and Allwood [89], over 30% of all steel produced could be repurposed in the future. As steel is relatively inexpensive in relation to labor in many economies, and because this gap is accentuated by tax policy, economic logic favors material inefficiency to lower labor costs [90].
Techniques are being developed to bind chip scrap created during aluminum extrusion machining processes [91] in the solid state to produce a better-quality product that could save up to 95% of energy compared to re-melting.

4.4. Material Efficiency in Product Design

By optimizing design and manufacturing methods, it is possible to reduce the weight of many products by one-third without compromising their performance in use [92]. While new steel and production techniques have resulted in a reduction in the relative weight of automobiles, automobiles continue to gain weight as they grow larger and more feature-laden. While material replacement is frequently technically achievable [93], its utility as a tool for reducing emissions is limited. Steel and cement production approach 200 and 380 kg/cap/year, respectively, on a worldwide scale, but no other substance capable of performing the same functions is accessible in similar quantities [93].
In comparison to a normal prismatic design, it has been stated that curved fabric molds may decrease concrete mass by 40% [94]. High-strength concrete saves material and cuts CO2 emissions by 40% [95].

4.5. Using Products More Intensively

The use of items over a prolonged length of time may reduce the need for replacement goods, which may result in a reduction in industrial emissions. [86]. New business tactics may encourage the dematerialization of products and the growing usage of such products. Food products, for example, are frequently used inefficiently. It is estimated that up to 67% of all food produced in rich nations is wasted, which represents a significant loss of resources [96]. This indicates how behavioral modification can significantly decrease the requirement for industrial output in the future.

4.6. Reducing Overall Demand for Product Services

To reduce industrial emissions, it is necessary to reduce the overall demand for goods and services [97]. For example, if the community chose to travel less (e.g., via higher domestic tourism or working remotely), warm or cool houses to only the extent required, or remove unnecessary consumption or products, industrial emissions could be reduced. The construction of commercial buildings in developed economies is often carried out with up to double the amount of steel required by safety regulations, with structures generally being rebuilt every 30 to 60 years [98,99,100]. If safety regulations were properly adhered to and structures were replaced less often, the same service could be supplied with one-quarter the steel, but only after 80 years of service. Concrete is used to construct buildings and infrastructure. Extending their lifespans or using them more intensively can reduce the demand for these products. However, if properly maintained, buildings and infrastructure can endure for over 200 years [99]. A decline in people living and working in every housing, as well as a reduction in per-capita demand for utilities (such as water and waste), might reduce the demand for construction and building services, which would eventually lead to a reduction in emissions. When a structure is demolished, aluminum building elements (e.g., cladding, window frames, and curtain walls) can be reused, but more modular designs allow for products with longer lives and a reduction in the overall need for new materials [89].

5. Conclusions

Saudi Arabia has been experiencing almost continuous expansion in industrial processes and product usage. This study assessed the present trend in emissions, predicted emissions under several scenarios, and identified several options for the Kingdom to mitigate climate change. Petrochemical, iron and steel, and cement manufacturing were identified as the primary emission sources. During the last five decades, the overall GHG emissions from major industries have increased significantly. However, the rate of emission growth has slowed in almost all source categories over the last decade. The total emissions from this sector reached 78.33 million tons of CO2 equivalent in 2020. A scenario-based projection analysis was used to determine the range of IPPU sector emissions for the years up to 2050. The range of emissions for 2050 will vary between 199.34 and 426.35 million tons of CO2 equivalent. This implies that the current trend of emissions from IPPU will create significant challenges to meeting the plan of net zero emissions by 2060 under the Saudi Green Initiative. However, this sector has several potential avenues to explore to reduce its impact. These include energy efficiency, emissions efficiency, material efficiency, the reuse of materials and recycling of products, intensive and longer use of products, and demand management.
The findings of this study will aid policymakers in comprehending the dynamics of driving forces and trace the contribution of industrial processes to national GHG inventories. The findings will aid in tracking national GHG emissions and prioritizing climate change mitigation initiatives. However, the research community should lead the way by performing proper quantitative evaluations examining a range of mitigating climate change strategies for supporting policymakers. This study intends to further research in this regard.

Author Contributions

Conceptualization, M.M.R. and S.M.R.; Data curation, A.E.; Formal analysis, M.M.R.; Funding acquisition, M.M.R.; Investigation, M.S.R. and M.M.I.; Methodology, A.E. and S.M.R.; Project administration, S.A.S.; Resources, S.R.C., A.E. and S.R.; Supervision, S.M.R. and M.M.R.; Visualization, M.K.I.; Writing—original draft, M.M.R., M.S.R., S.R.C. and S.A.R.; Writing—review & editing, M.M.R., M.S.R., S.R.C., S.A.R., S.A.S. All authors have read and agreed to the published version of the manuscript.

Funding

This work was financially supported by the Deanship of Scientific Research in the King Faisal University, Saudi Arabia, through the project number GRANT 656.

Institutional Review Board Statement

Not applicable.

Informed Consent Statement

Not applicable.

Data Availability Statement

The data that support the findings of this study are available from the corresponding author, M.M.R. ([email protected]), upon reasonable request.

Acknowledgments

The authors acknowledge the support received from Deanship of Scientific Research at King Faisal University (KFU), King Fahd University of Petroleum & Minerals (KFUPM), Al-Imam Mohammad Ibn Saud Islamic University, and Prince Mohammad Bin Fahd University, Saudi Arabia.

Conflicts of Interest

The authors declare no conflict of interests.

References

  1. Bob, M.; Rahman, N.; Elamin, A.; Taher, S. Rising groundwater levels problem in urban areas: A case study from the Central Area of Madinah City, Saudi Arabia. Arab. J. Sci. Eng. 2016, 41, 1461–1472. [Google Scholar] [CrossRef]
  2. DNA. First Biannual Update Report (BUR), Saudi Arabia. 2018. Available online: https://cdmdna.gov.sa/ (accessed on 3 February 2022).
  3. Alshammari, Y.; Sarathy, S. Achieving 80% greenhouse gas reduction target in Saudi Arabia under low and medium oil prices. Energy Policy 2017, 101, 502–511. [Google Scholar] [CrossRef]
  4. Rahman, S.; Khondaker, A. Mitigation measures to reduce greenhouse gas emissions and enhance carbon capture and storage in Saudi Arabia. Renew. Sustain. Energy Rev. 2012, 16, 2446–2460. [Google Scholar] [CrossRef]
  5. Rahman, M.M.; Rahman, S.M.; Rahman, M.S.; Hasan, A.; Shoaib, S.A.; Rushd, S. Greenhouse Gas Emissions from Solid Waste Management in Saudi Arabia—Analysis of Growth Dynamics and Mitigation Opportunities. Appl. Sci. 2021, 11, 1737. [Google Scholar] [CrossRef]
  6. Ikram, M.; Zhang, Q.; Sroufe, R.; Shah, S. Towards a sustainable environment: The nexus between ISO 14001, renewable energy consumption, access to electricity, agriculture and CO2 emissions in SAARC. Sustain. Prod. Consum. 2020, 22, 218–230. [Google Scholar] [CrossRef]
  7. Omri, A.; Euchi, J.; Hasaballah, A.; Al-Tit, A. Determinants of environmental sustainability: Evidence from Saudi Arabia. Sci. Total Environ. 2019, 657, 1592–1601. [Google Scholar] [CrossRef]
  8. Alshuwaikhat, H.; Mohammed, I. Sustainability matters in national development visions—Evidence from Saudi Arabia’s Vision for 2030. Sustainability 2017, 9, 408. [Google Scholar] [CrossRef] [Green Version]
  9. Ikram, M.; Ferasso, M.; Sroufe, R.; Zhang, Q. Assessing green technology indicators for cleaner production and sustainable investments in a developing country context. J. Clean. Prod. 2021, 322, 129090. [Google Scholar] [CrossRef]
  10. Kyriakopoulos, L.; Ikram, M.; Sroufe, R.; Awan, U.; Abid, N. Enabling progress in developing economies: A novel hybrid decision-making model for green technology planning. Sustainability 2021, 14, 258. [Google Scholar] [CrossRef]
  11. Akadiri, A.; Akadiri, S.S.; Gungor, H. The role of natural gas consumption in Saudi Arabia’s output and its implication for trade and environmental quality. Energy Policy 2019, 129, 230–238. [Google Scholar] [CrossRef]
  12. USEIA. U.S. Energy Information Administration. 2020. Available online: https://www.eia.gov/international/data/world#/?tl_type=p&tl_id=2-A&pa=0000000000002&ct=0&ord=SA&c=ruvvvvvfvtvnvv1urvvvvfvvvvvvfvvvou20evvvvvvvvvnvvuvo&f=A (accessed on 3 February 2022).
  13. Liu, Z.; Dong, H.; Geng, Y.; Lu, C.; Ren, W. Insights into the regional greenhouse gas (GHG) emission of industrial processes: A case study of Shenyang, China. Sustainability 2015, 6, 3669–3685. [Google Scholar] [CrossRef] [Green Version]
  14. Dong, X.; Guo, J.; Höök, M.; Pi, G. Sustainability assessment of the natural gas industry in China using principal component analysis. Sustainability 2008, 7, 6102–6118. [Google Scholar] [CrossRef] [Green Version]
  15. Arruda, L.R.; de Jesus Lameira, V.; Quelhas, O.L.G.; Pereira, F.N. Sustainability in the Brazilian heavy construction industry: An analysis of organizational practices. Sustainability 2013, 5, 4312–4328. [Google Scholar] [CrossRef] [Green Version]
  16. Dentoni, V.; Grosso, B.; Massacci, G. Environmental sustainability of the alumina industry in Western Europe. Sustainability 2014, 6, 9477–9493. [Google Scholar] [CrossRef] [Green Version]
  17. Duan, Y.; Mu, H.; Li, N.; Rosen, M.A.; Wang, B.; Zhang, N. Analysis of the relationship between China’s IPPU CO2 emissions and the industrial economic growth. Sustainability 2016, 8, 426. [Google Scholar] [CrossRef] [Green Version]
  18. Ussiri, D.A.N.; Lal, R. Carbon Sequestration for Climate Change Mitigation and Adaptation; Springer International Publishing: Berlin/Heidelberg, Germany, 2017. [Google Scholar]
  19. NCEI. Global Climate Report-September 2021. Available online: https://www.ncei.noaa.gov/news/global-climate-202112 (accessed on 15 March 2022).
  20. Cadez, S.; Czerny, A. Carbon management strategies in manufacturing companies: An exploratory note. J. East Eur. Manag. Stud. 2010, 15, 348–360. [Google Scholar] [CrossRef] [Green Version]
  21. Cadez, S.; Czerny, A. Climate change mitigation strategies in carbon-intensive firms. J. Clean. Prod. 2016, 112, 4132–4143. [Google Scholar] [CrossRef]
  22. Cadez, S.; Guilding, C. Examining distinct carbon cost structures and climate change abatement strategies in CO2 polluting firms. Account. Audit. Account. J. 2017, 30, 1041–1064. [Google Scholar] [CrossRef]
  23. Cadez, S.; Czerny, A.; Letmathe, P. Stakeholder pressures and corporate climate change mitigation strategies. Bus. Strategy Environ. 2019, 28, 1–14. [Google Scholar] [CrossRef]
  24. UNFCC. The Intended Nationally Determined Contributions of the Kingdom of Saudi Arabia under the UNFCCC, Submitted to the UNFCCC Secretariat. Available online: https://andp.unescwa.org/sites/default/files/2021-10/KSA-INDCs%20English%5B1%5D.pdf (accessed on 15 March 2022).
  25. IPCC. 2006 IPCC Guidelines for National Greenhouse Gas Inventories. Available online: https://www.ipcc-nggip.iges.or.jp/public/2006gl/index.html (accessed on 15 March 2022).
  26. GASTAT (General Authority of Statistics). Kingdom of Saudi Arabia. Statistical Yearbooks. 2018. Available online: https://www.stats.gov.sa/en/46 (accessed on 15 March 2022).
  27. GPCA (Gulf Petrochemicals and Chemicals Association). 2020. Available online: https://www.gpca.org.ae/ (accessed on 15 March 2022).
  28. World Steel Association. Steel Statistical Yearbooks. 2020. Available online: https://worldsteel.org/steel-by-topic/statistics/steel-statistical-yearbook/ (accessed on 15 March 2022).
  29. USGS. U.S. Geological Survey-Africa and the Middle East. 2016. Available online: https://www.usgs.gov/centers/national-minerals-information-center/africa-and-middle-east#sa (accessed on 15 March 2022).
  30. Glass International. Glass Industry Worldwide-Statistics & Facts-Statista. 2018. Available online: https://www.statista.com/topics/4108/glass/#dossierKeyfigures (accessed on 15 March 2022).
  31. SAMA (Saudi Arabian Monetary Agency). 2020. Available online: https://sama.gov.sa/en-US/EconomicReports/Pages/AnnualReport.aspx (accessed on 15 March 2022).
  32. GASTAT (General Authority for Statistics). Statistical Year Books. 2019. Available online: https://www.stats.gov.sa/en/46 (accessed on 15 March 2022).
  33. CEIC. Saudi Arabia Cement Production. 2022. Available online: https://www.ceicdata.com/en/saudi-arabia/cement-production (accessed on 15 March 2022).
  34. IPCC. Revised 1996 IPCC Guidelines for National Greenhouse Gas Inventories. Available online: https://ci.nii.ac.jp/naid/10017506839/ (accessed on 15 March 2022).
  35. GPG. Good Practice Guidance and Uncertainty Management in National Greenhouse Gas Inventories. 2000. Available online: https://www.ipcc-nggip.iges.or.jp/public/gp/english/index.html (accessed on 15 March 2022).
  36. IPCC. 2006 IPCC Guidelines for National Greenhouse Gas Inventories Volume 3 Industrial Processes and Product Use. Available online: https://www.ipcc-nggip.iges.or.jp/public/2006gl/vol3.html (accessed on 15 March 2022).
  37. Roychoudhury, J. Saudi Arabian Cement Companies: Upgrading through Leveraging Overcapacity. 2020. Available online: https://www.kapsarc.org/research/publications/saudi-arabian-cement-companies-upgrading-through-leveraging-overcapacity/ (accessed on 15 March 2022).
  38. KAPSARC. The Future of the Petrochemicals Industry and Sino-Saudi Cooperation; KAPSARC: Riyadh, Saudi Arabia, 2020. [Google Scholar]
  39. Howarth, N.; Lanza, A.; AlShehri, T. Saudi Arabia’s 2018 CO2 Emissions Fall Faster Than Expected; KAPSARC: Riyadh, Saudi Arabia, 2020. [Google Scholar]
  40. Dasgupta, S.P.P.; Roy, J.; Bera, A.; Sharma, A. Growth accounting for six energy intensive industries in India. J. Ind. Stat. 2012, 1, 1–15. [Google Scholar]
  41. Allwood, J.M.; Cullen, J.M.; Milford, R.L. Options for achieving a 50% cut in industrial carbon emissions by 2050. Environ. Sci. Technol. 2010, 44, 1888–1894. [Google Scholar] [CrossRef] [PubMed]
  42. Schafer, A. Structural Change in Energy Use. Energy Policy 2005, 33, 429–437. [Google Scholar] [CrossRef]
  43. Saygin, D.; Patel, M.K.; Worrell, E.; Tam, C.; Gielen, D.J. Potential of best practice technology to improve energy efficiency in the global chemical and petrochemical sector. Energy 2011, 36, 5779–5790. [Google Scholar] [CrossRef]
  44. Gutowski, T.G.; Sahni, S.; Allwood, J.M.; Ashby, M.F.; Worrell, E. The energy required to produce materials: Constraints on energy-intensity improvements, parameters of demand. Philos. Trans. R. Soc. A Math. Phys. Eng. Sci. 2013, 371, 20120003. [Google Scholar] [CrossRef] [PubMed]
  45. Masanet, E.R. Energy benefits of electronic controls at small and medium sized U.S. manufacturers. J. Ind. Ecol. 2010, 14, 696–702. [Google Scholar] [CrossRef]
  46. DoE, U. Waste Heat Reduction and Recovery for Improving Furnace Efficiency, Productivity and Emissions Performance. Available online: https://www.energy.gov/sites/prod/files/2014/05/f15/35876.pdf (accessed on 2 February 2022).
  47. DoE, U. Waste Heat Recovery: Technology Opportunities in the US Industry. Available online: https://www1.eere.energy.gov/manufacturing/intensiveprocesses/pdfs/waste_heat_recovery.pdf (accessed on 2 February 2022).
  48. Plastics Europe. Plastics—The Facts 2021. Available online: https://plasticseurope.org/wp-content/uploads/2021/12/Plastics-the-Facts-2021-web-final.pdf (accessed on 2 February 2022).
  49. Sardeshpande, V.; Gaitonde, U.N.; Banerjee, R. Model based energy benchmarking for glass furnace. Energy Convers. Manag. 2007, 48, 2718–2738. [Google Scholar] [CrossRef]
  50. Dosho, Y. Sustainable concrete waste recycling. Proc. Ice-Constr. Mater. 2008, 161, 47–62. [Google Scholar] [CrossRef]
  51. Matar, W.; Murphy, F.; Pierru, A.; Rioux, B.; Wogan, D. Efficient industrial energy use: The first step in transitioning Saudi Arabia’s energy mix. Energy Policy 2017, 105, 80–92. [Google Scholar] [CrossRef]
  52. DNA (Saudi Designated National Authority). Third National Communication of Saudi Arabia. Available online: https://unfccc.int/files/national_reports/non-annex_i_natcom/application/pdf/saudi_arabia_nc3_22_dec_2016.pdf (accessed on 2 February 2022).
  53. Saudi Aramco. Citizenship Report. Available online: http://argaamplus.s3.amazonaws.com/3cf5161a-240e-4aa0-adc5-a16c618a2ab5.pdf (accessed on 2 February 2022).
  54. Saudi Aramco. Annual Review. Available online: https://www.aramco.com/-/media/publications/corporate-reports/ar-2014-saudiaramco-english-full.pdf (accessed on 3 February 2022).
  55. IEA. Iron and Steel Technology Roadmap. 2020. Available online: https://www.oecd-ilibrary.org/energy/iron-and-steel-technology-roadmap_3dcc2a1b-en (accessed on 3 February 2022).
  56. Talaei, A.; Ahiduzzaman, M.; Davis, M.; Gemechu, E.; Kumar, A. Potential for energy efficiency improvement and greenhouse gas mitigation in Canada’s iron and steel industry. Energy Effic. 2020, 13, 1213–1243. [Google Scholar] [CrossRef]
  57. Arvedi, G.; Mazzolari, F.; Bianchi, A.; Holleis, G.; Siegl, J.; Angerbauer, A. The Arvedi Endless Strip Production line (ESP): From liquid steel to hot-rolled coil in seven minutes. Rev. Métallurgie 2008, 105, 398–407. [Google Scholar] [CrossRef]
  58. Vogl, V.; Åhman, M.; Nilsson, L.J. Assessment of hydrogen direct reduction for fossil-free steelmaking. J. Clean. Prod. 2018, 203, 736–745. [Google Scholar] [CrossRef]
  59. Fischedick, M.; Marzinkowski, J.; Winzer, P.; Weigel, M. Techno-economic evaluation of innovative steel production technologies. J. Clean. Prod. 2014, 84, 563–580. [Google Scholar] [CrossRef] [Green Version]
  60. Hasanbeigi, A.; Price, L.K.; McKane, A.T. The State-of-the-Art Clean Technologies (SOACT) for Steelmaking Handbook. Available online: https://www.jisf.or.jp/business/ondanka/eco/docs/SOACT-Handbook-2nd-Edition.pdf (accessed on 3 February 2022).
  61. Hasanbeigi, A.; Arens, M.; Price, L. Alternative emerging ironmaking technologies for energy-efficiency and carbon dioxide emissions reduction: A technical review. Renew. Sustain. Energy Rev. 2014, 33, 645–658. [Google Scholar] [CrossRef]
  62. Talaei, A.; Pier, D.; Iyer, A.V.; Ahiduzzaman, M.; Kumar, A. Assessment of long-term energy efficiency improvement and greenhouse gas emissions mitigation options for the cement industry. Energy 2019, 170, 1051–1066. [Google Scholar] [CrossRef]
  63. IEA (International Energy Agency). Energy Technology Transitions for Industry. Strategies for the Next Industrial Revolution; IEA: Paris, France, 2009. [Google Scholar] [CrossRef]
  64. IPCC. Climate Change 2014 Mitigation of Climate Change. Working Group III Contribution to the Fifth Assessment Report of the Intergovernmental Panel on Climate Change Ottmar; IPCC: Geneva, Switzerland, 2014; ISBN 9781107654815. [Google Scholar]
  65. IEA (International Energy Agency). Energy Technology Perspectives 2012: Pathways to a Clean Energy System. Available online: https://www.iea.org/reports/energy-technology-perspectives-2012 (accessed on 3 February 2022).
  66. IEA (International Energy Agency). Are We Entering A Golden Age of Gas? Available online: https://www.iea.org/reports/weo-special-report-are-we-entering-a-golden-age (accessed on 3 February 2022).
  67. IEA (International Energy Agency). Combined Heat & Power and Emissions Trading: Options for Policy Makers. Available online: https://iea.blob.core.windows.net/assets/633211a0-259d-4964-b549-6bdeb62f9345/CombinedHeatPowerandEmissionsTrading.pdf (accessed on 3 February 2022).
  68. IEA (International Energy Agency). Sustainable Energy Technologies for Today …and Tomorrow; IEA: Paris, France, 2009. [Google Scholar] [CrossRef]
  69. IEA (International Energy Agency). Solutions for a low-carbon energy future. Int. Energy Agency 2011, 1, 1–35. [Google Scholar]
  70. IEA (International Energy Agency). Scenarios & Strategies To 2050; IEA: Paris, France, 2008. [Google Scholar] [CrossRef]
  71. Sims, R.; Mercado, P.; Krewitt, W.; Bhuyan, G.; Flynn, D.; Holttinen, H.; Jannuzzi, G.; Khennas, S.; Liu, Y.; Nilsson, L.J.; et al. Integration of Renewable Energy into Present and Future Energy Systems. Renew. Energy Sources Clim. Chang. Mitig. 2011, 8, 609–706. [Google Scholar] [CrossRef] [Green Version]
  72. Kuramochi, T.; Ramírez, A.; Turkenburg, W.; Faaij, A. Comparative assessment of CO2 capture technologies for carbon-intensive industrial processes. Prog. Energy Combust. Sci. 2012, 38, 87–112. [Google Scholar] [CrossRef]
  73. Zhang, Y.; Lu, X.; Ji, X. Carbon Dioxide Capture; World Meteorological Organization: Geneva, Switzerland, 2019. [Google Scholar] [CrossRef]
  74. EPA. Global Anthropogenic Non-CO2 Greenhouse Gas Emissions: 1990–2030 How to Obtain Copies How to Obtain the Data For Further Information; Office Atmospheric Programs Climate Change Division U.S. Environmental Protection Agency: Washington, DC, USA, 2011. [Google Scholar]
  75. Cullen, J.M.; Allwood, J.M.; Bambach, M.D. Mapping the Global Flow of Steel: From Steelmaking to End-Use Goods. Environ. Sci. Technol. 2012, 46, 13048–13055. [Google Scholar] [CrossRef]
  76. Henriques, M.F.; Dantas, F.; Schaeffer, R. Potential for reduction of CO2 emissions and a low-carbon scenario for the Brazilian industrial sector. Energy Policy 2010, 38, 1946–1961. [Google Scholar] [CrossRef]
  77. Takeda, K.; Anyashiki, T.; Sato, T.; Oyama, N.; Watakabe, S.; Sato, M. Recent Developments and Mid- and Long-Term CO2 Mitigation Projects in Ironmaking. Steel Res. Int. 2011, 82, 512–520. [Google Scholar] [CrossRef]
  78. IEA (International Energy Agency). Implementing Energy Efficiency Policies: Are IEA Member Countries on Track? IEA: Paris, France, 2009. [Google Scholar]
  79. Wang, D.; Gmitter, A.; Sadoway, D. Production of Oxygen Gas and Liquid Metal by Electrochemical Decomposition of Molten Iron Oxide. J. Electrochem. Soc. 2011, 158, 512–520. [Google Scholar] [CrossRef]
  80. Mittal, A.; Rakshit, D. Energy audit and waste heat recovery from kiln hot shell surface of a cement plant. Therm. Sci. Eng. Prog. 2020, 19, 100599. [Google Scholar] [CrossRef]
  81. Fierro, J.J.; Escudero-Atehortua, A.; Nieto-Londoño, C.; Giraldo, M.; Jouhara, H.; Wrobel, L.C. Evaluation of waste heat recovery technologies for the cement industry. Int. J. Thermofluids 2020, 7–8, 100040. [Google Scholar] [CrossRef]
  82. Naranjo, M.; Brownlow, D.T.; Garza, A. CO2 capture and sequestration in the cement industry. Energy Procedia 2011, 4, 2716–2723. [Google Scholar] [CrossRef] [Green Version]
  83. Hasanbeigi, A.; Menke, C.; Therdyothin, A. Technical and cost assessment of energy efficiency improvement and greenhouse gas emission reduction potentials in Thai cement industry. Energy Effic. 2011, 4, 93–113. [Google Scholar] [CrossRef]
  84. Van Deventer, J.S.J.; Provis, J.L.; Duxson, P. Technical and commercial progress in the adoption of geopolymer cement. Miner. Eng. 2012, 29, 89–104. [Google Scholar] [CrossRef]
  85. Erisman, J.W.; Sutton, M.A.; Galloway, J.; Klimont, Z.; Winiwarter, W. How a century of ammonia synthesis changed the world. Nat. Geosci. 2008, 1, 636–639. [Google Scholar] [CrossRef]
  86. Allwood, J.M.; Cullen, J.M.; Carruth, M.A. Sustainable Materials with Both Eyes Open; Gabriel Thoumi Sustainability Collection; UIT Cambridge Limited: Cambridge, UK, 2012; ISBN 9781906860073. [Google Scholar]
  87. Milford, R.L.; Allwood, J.M.; Cullen, J.M. Assessing the potential of yield improvements, through process scrap reduction, for energy and CO2 abatement in the steel and aluminium sectors. Resour. Conserv. Recycl. 2011, 55, 1185–1195. [Google Scholar] [CrossRef]
  88. Roy, J.; Dasgupta, S.; Chakravarty, D. Energy Efficiency: Technology, Behavior, and Development. In The Handbook of Global Energy Policy; Wiley: Hoboken, NJ, USA, 2013; pp. 282–302. [Google Scholar]
  89. Cooper, D.R.; Allwood, J.M. Reusing Steel and Aluminum Components at End of Product Life. Environ. Sci. Technol. 2012, 46, 10334–10340. [Google Scholar] [CrossRef]
  90. Skelton, A.; Allwood, J. The incentives for supply chain collaboration to improve material efficiency in the use of steel: An analysis using input output techniques. Ecol. Econ. 2013, 89, 33–42. [Google Scholar] [CrossRef]
  91. Tekkaya, A.E.; Schikorra, M.; Becker, D.; Biermann, D.; Hammer, N.; Pantke, K. Hot profile extrusion of AA-6060 aluminum chips. J. Mater. Process. Technol. 2009, 209, 3343–3350. [Google Scholar] [CrossRef]
  92. Carruth, M.; Allwood, J.; Moynihan, M. The technical potential for reducing metal requirements through lightweight product design. Resour. Conserv. Recycl. 2011, 57, 48–60. [Google Scholar] [CrossRef]
  93. Ashby, M.F. Materials and the Environment, 2nd ed.; Butterworth-Heinemann: Boston, MA, USA, 2013; ISBN 978-0-12-385971-6. [Google Scholar]
  94. Orr, J.; Darby, A.; Tim, I.; Mark, E.; Otlet, M. Concrete structures using fabric formwork. Struct. Eng. 2011, 89, 20–26. [Google Scholar] [CrossRef]
  95. Müller, N.; Harnisch, J. A Blueprint for a Climate Friendly Cement industry. WWF–Lafarge Conservation Partnership. Available online: https://awsassets.panda.org/downloads/englishsummary__lr_pdf.pdf (accessed on 3 February 2022).
  96. Gustavsson, J.; Cederberg, C.; Sonesson, U. Global Food Losses and Food Waste. Save Food Interpack Düsseldorf Ger. Available online: https://www.fao.org/3/i2697e/i2697e.pdf (accessed on 3 February 2022).
  97. Kainuma, M.; Miwa, K.; Ehara, T.; Akashi, O.; Asayama, Y. A low-carbon society: Global visions, pathways, and challenges. Clim. Policy 2013, 13, 5–21. [Google Scholar] [CrossRef]
  98. Michaelis, P.; Jackson, T. Material and energy flow through the UK iron and steel sector. Part 1: 1954–1994. Resour. Conserv. Recycl. 2000, 29, 131–156. [Google Scholar] [CrossRef]
  99. Hatayama, H.; Daigo, I.; Matsuno, Y.; Adachi, Y. Outlook of the World Steel Cycle Based on the Stock and Flow Dynamics. Environ. Sci. Technol. 2010, 44, 6457–6463. [Google Scholar] [CrossRef]
  100. Pauliuk, S.; Wang, T.; Müller, D.B. Moving Toward the Circular Economy: The Role of Stocks in the Chinese Steel Cycle. Environ. Sci. Technol. 2012, 46, 148–154. [Google Scholar] [CrossRef] [Green Version]
Figure 1. Major industrial production sectors in Saudi Arabia.
Sustainability 14 07388 g001
Figure 2. Breakdown of the growth of different petrochemical products in Saudi Arabia.
Sustainability 14 07388 g002
Figure 3. Historical GHG emissions from different source categories.
Sustainability 14 07388 g003
Figure 4. Future emission scenarios for (a) cement (b) DRI and raw steel.
Sustainability 14 07388 g004
Figure 5. Future emission scenarios for petrochemical source category.
Sustainability 14 07388 g005
Table 1. Sources of data.
Industry TypeInformation SourcePeriodReference
Cement ProductionGeneral Authority for Statistics, Statistical Yearbooks1965–2013, 2019[2,27,32,33]
Designated National Authority Kingdom of Saudi Arabia2014–2018
CEICdata2020
Soda Ash ProductionGeneral Authority for Statistics, Statistical Yearbooks 2010–2019[26]
Ammonia ProductionGulf Petrochemicals and Chemicals Association2005–2020[27]
Titanium DioxideGulf Petrochemicals and Chemicals Association 2009–2020
Petrochemicals ProductionGulf Petrochemicals and Chemicals Association 2005–2020
Iron and Steel ProductionWorld Steel Association, Steel Statistical Yearbooks1989–2020[28]
U.S. Geological Survey Minerals Yearbook
Aluminum ProductionU.S. Geological Survey Minerals Yearbook 2013–2016[29]
Glass ProductionGlass Production Capacity, Glass International2014–2018[30]
Zinc ProductionSaudi Arabian Monetary Agency2003–2020[31]
Table 2. CO2 and CH4 emission factor (EF) for IPPU sector [21,34].
IPPU SectorGreenhouse Gas Name Carbon Emissions Factor (Tons CO2/Tons Produced)
Raw SteelCO21.060
Direct Reduced SteelCO20.700
CementCO20.520
Soda AshCO20.415
AmmoniaCO21.694
Titanium DioxideCO21.430
Primary Aluminum (Prebake)CO21.600
GlassCO20.200
ZincCO23.660
EthyleneCO20.760
CH46.000
Ethylene DichlorideCO20.196
CH40.0226
MethanolCO20.670
CH42.300
Ethylene OxideCO20.863
CH41.790
Vinyl Chloride MonomerCO20.294
CH40.023
Table 3. Average Y/Y growth rate of major IPPU source categories used to predict future GHG emissions.
Range of YearsY/Y Growth Rate (%)
CementDRISteelPetrochemical
EthyleneEthylene DichlorideMethanolEthylene OxideVinyl Chloride Monomer
2010–2020 (10 yrs)3.33.36.54.52.60.11.53.1
2005–2020 (15 yrs)5.34.95.77.81.91.44.71.7
2000–2020 (20 yrs)6.35.76.4
Publisher’s Note: MDPI stays neutral with regard to jurisdictional claims in published maps and institutional affiliations.

