Article

Comprehensive Fracture Model of Reservoir Ice Layers in the Northeastern Cold Region of China

1
College of Civil Engineering and Architecture, Quzhou University, Quzhou 324000, China
2
Advanced and Sustainable Infrastructure Materials Group, School of Transportation, Civil Engineering and Architecture, Foshan University, Foshan 528000, China
3
State Key Laboratory of Coastal and Offshore Engineering, Dalian University of Technology, Dalian 116024, China
*
Author to whom correspondence should be addressed.
These authors contributed equally to this work.
Sustainability 2022, 14(12), 7326; https://doi.org/10.3390/su14127326
Submission received: 30 April 2022 / Revised: 30 May 2022 / Accepted: 8 June 2022 / Published: 15 June 2022
(This article belongs to the Special Issue Sustainability in Geology and Civil Engineering)

Abstract

:
Meteorological and hydrological changes have an important influence on the ice formation mechanism and the detailed structure of ice materials in cold reservoirs, and directly determine the mechanical properties of ice materials. Based on long-term meteorological and hydrological monitoring data, and detailed structural evolution analysis of ice materials, combined with fracture mechanics and energy methods, a comprehensive fracture model of ice materials in cold regions is established. At the same time, the fracture mechanics test results and simulation results of ice materials are compared, and the model is finally optimized accurately to provide theoretical support for the study of the mechanical mechanism of ice materials.

1. Introduction

Ice is a beautiful and unique natural material, and its physical and mechanical properties are gradually receiving attention from researchers [1,2,3]. Ice is a crystal formed by the orderly arrangement of water molecules. The water molecules are connected by hydrogen bonds to form a very loose (low density) rigid structure with a certain bearing capacity. Therefore, natural ice sheets are often used as winter roads, airport runways and natural artificial islands for various ice projects on rivers, lakes and seas, especially for the development of marine resources in polar regions [4,5,6,7,8]. For engineering safety, it is necessary to predict the ultimate load-carrying capacity (fracture toughness) of ice during different periods of ice formation. The typical failure process of ice materials involves the generation of multiple radial cracks from a point of action as a load increases. For thick ice, these radial cracks partially penetrate the ice surface [9,10,11,12]. When a crack group extends to a certain length, a circumferential crack around the end of a radial crack occurs, and the maximum damage load finally causes the ice to completely lose its bearing capacity [13,14,15,16,17,18]. Research on ice materials has a wide range of applications because all ice activities, including ice transport, ice fishing, ice travel, ice sports, and ice picking, depend on the fracture toughness conditions of ice. Simultaneously, a dam body and the slope protection of cold area reservoirs (especially plain reservoirs) are also generally damaged by ice loads [19,20,21,22]. The horizontal thrust of the ice cover itself under the limit of fracture failure produces a large ice pressure on the dam body and the slope protection structure, causing safety concerns for buildings and structures [23,24,25,26].
Currently, theoretical and experimental research on the fracture toughness of ice materials based on the combination of fracture mechanics and on-site detection is one of the more effective research methods compared to other methods [27,28,29,30,31,32]. Liu and Li [33] used the principle of energy conservation to establish a fracture model of ice materials for the analysis of ice pressure and ice toughness in three provinces of China. Kusumoto [34,35] analysed the fracture toughness of coarse ice and the effect of the sample size on the results. Wang [36] investigated the condition of river ice based on artificial neural networks and mechanical mechanisms. Li [37,38,39] analysed the relationship between bubbles and the ice intensity of ice, and determined the mechanics and reliability of an ice material by improving the Brazilian method. However, the natural environment plays a decisive role in the moulding process of ice materials. Therefore, the theoretical fracture model of ice materials cannot fully consider natural environment factors, such as the gas phase environment (temperature, humidity, weather type), water grain environment (flow rate, sediment content), and geographical environment (geological type, age), which produces a general lack of consensus in estimating the mechanical behaviour of ice materials.
The objective of this research is to fill these research gaps by investigating the fracture model of an ice material prepared from the Shifosi reservoir in northeastern China combined with long-term monitoring (environment and hydrology) analysis and in-lab mechanical testing. A new fracture model describing the fracture toughness or crack development of the ice material is presented based on a comprehensive range of disciplines and foundations such as hydrology, meteorological environment models, and mechanics. Finally, theoretical calculations (numerical simulations) for the fracture toughness of ice materials are performed by the new model and compared with the experimental results.

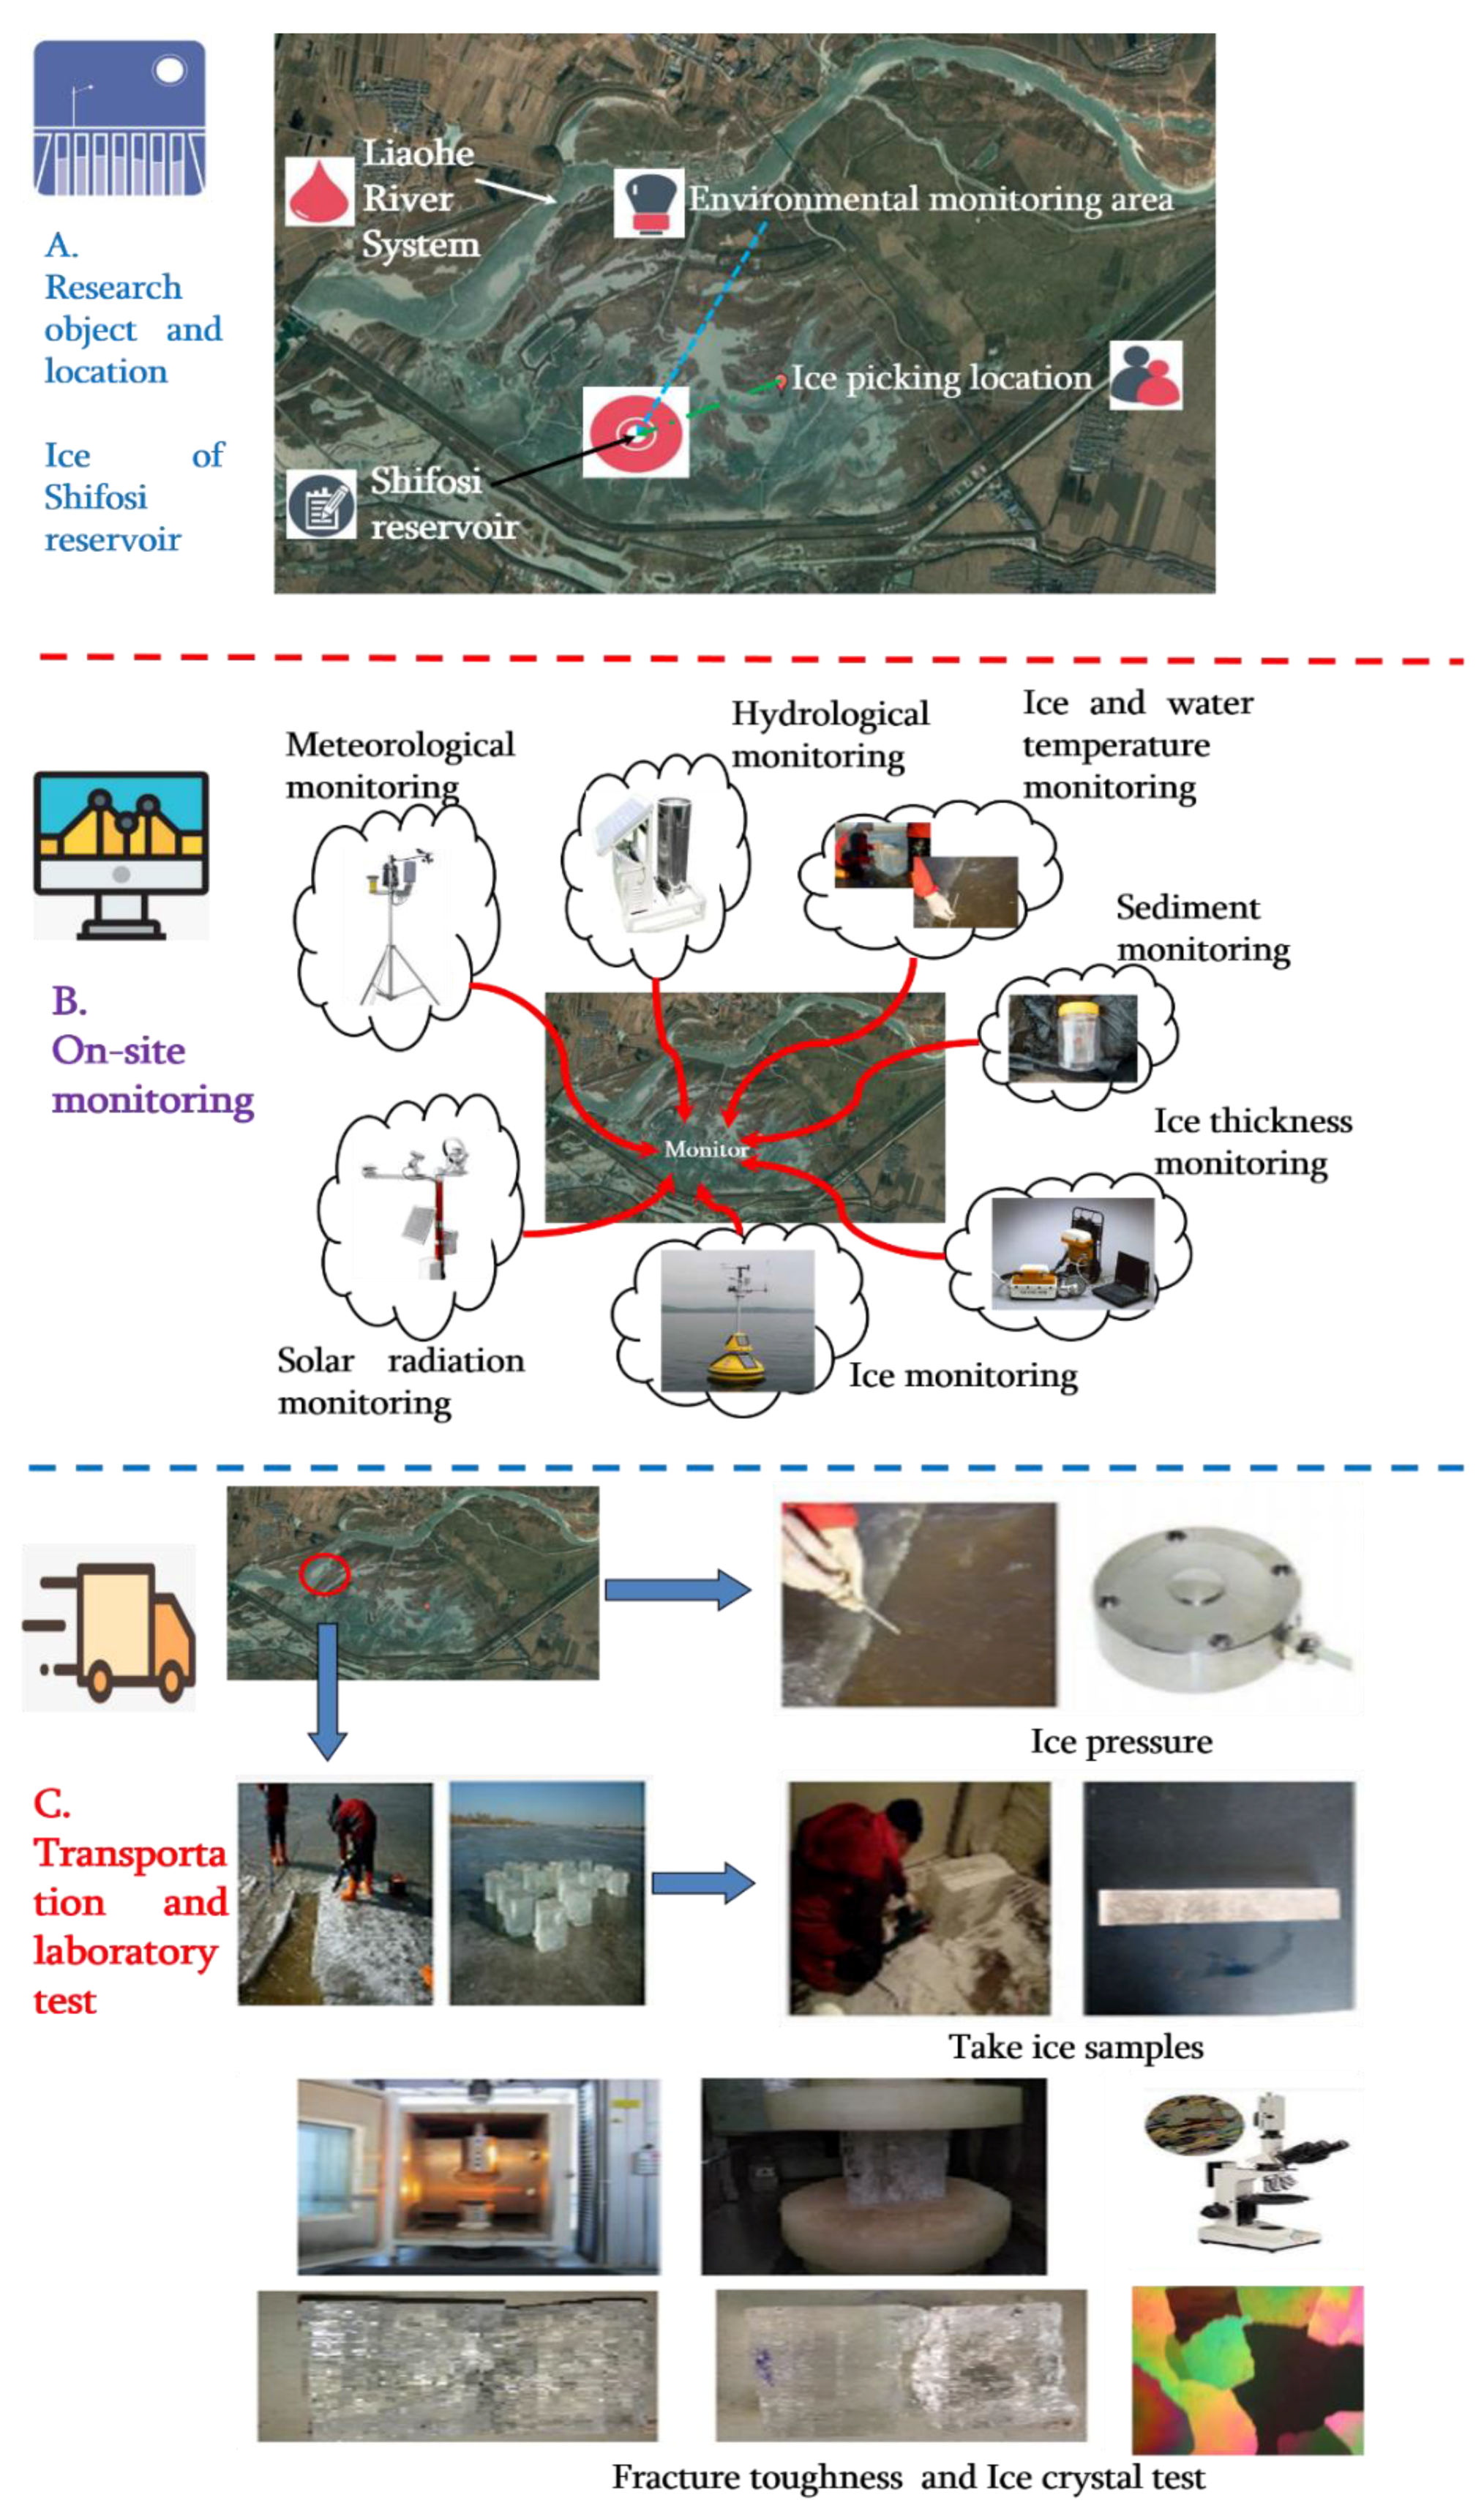
2. Experimental Methods and Details

The experimental flowchart of this paper is shown in Figure 1. The experimental details are as follows:

2.1. Long-Term Monitoring

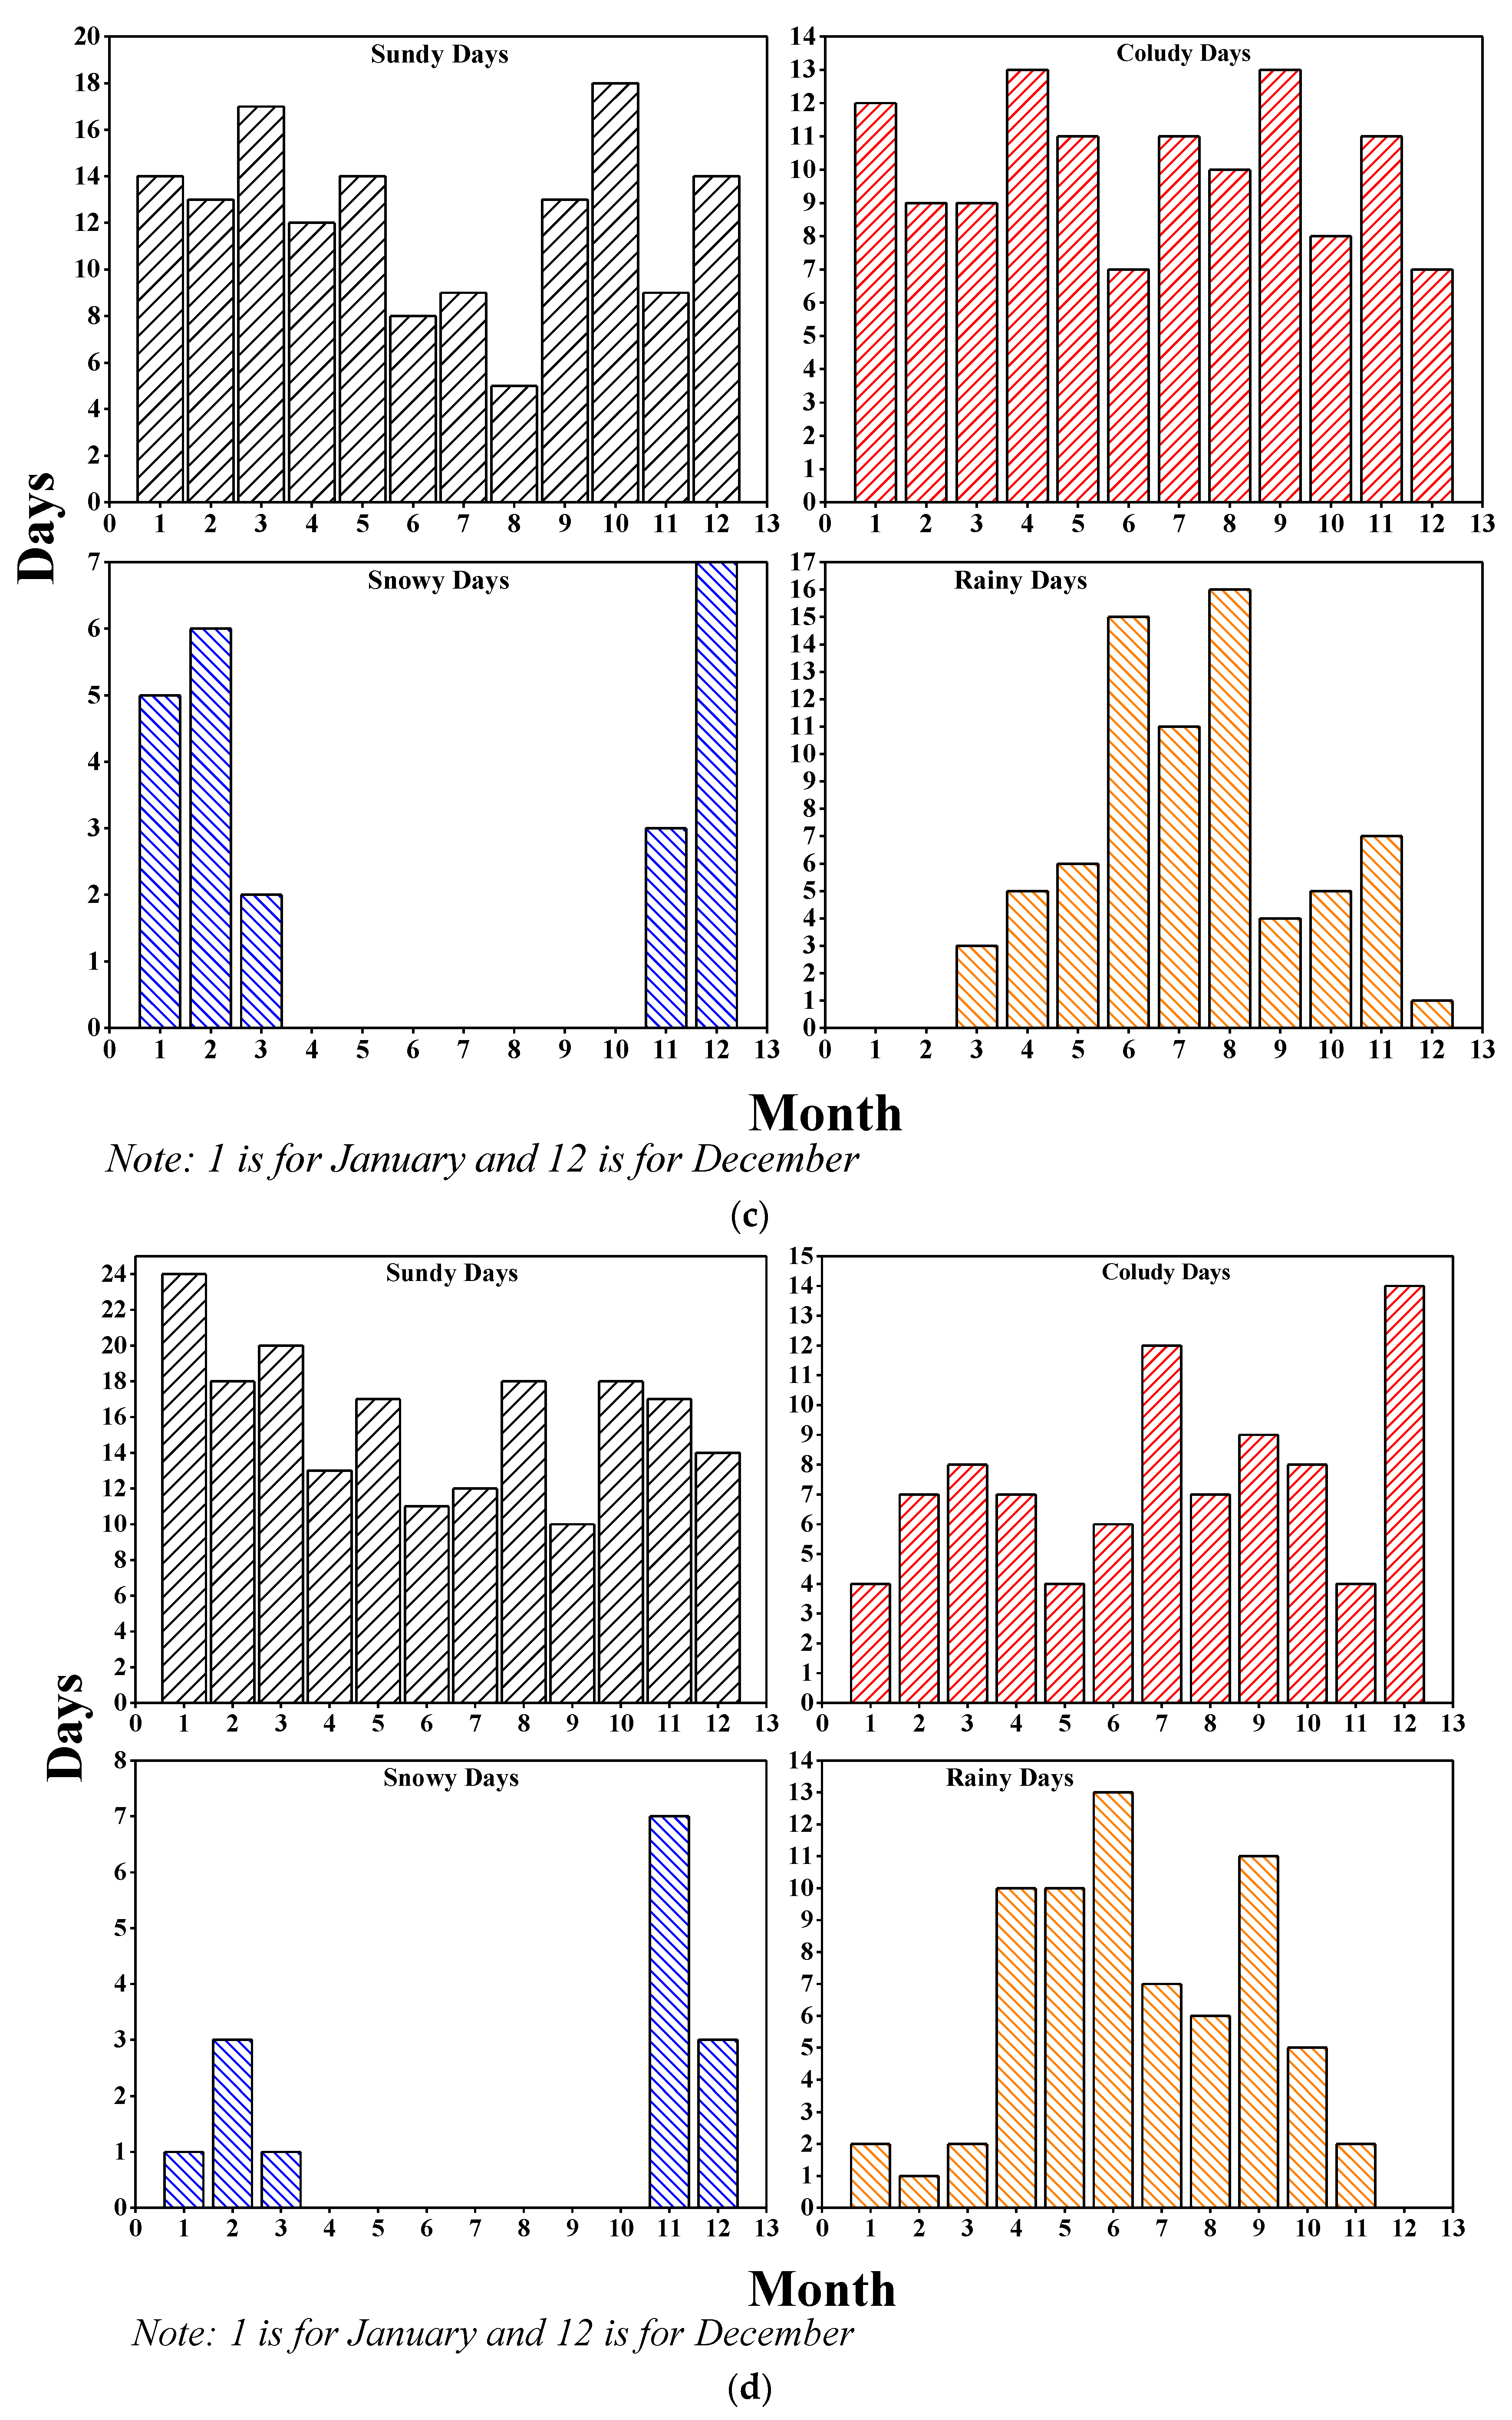
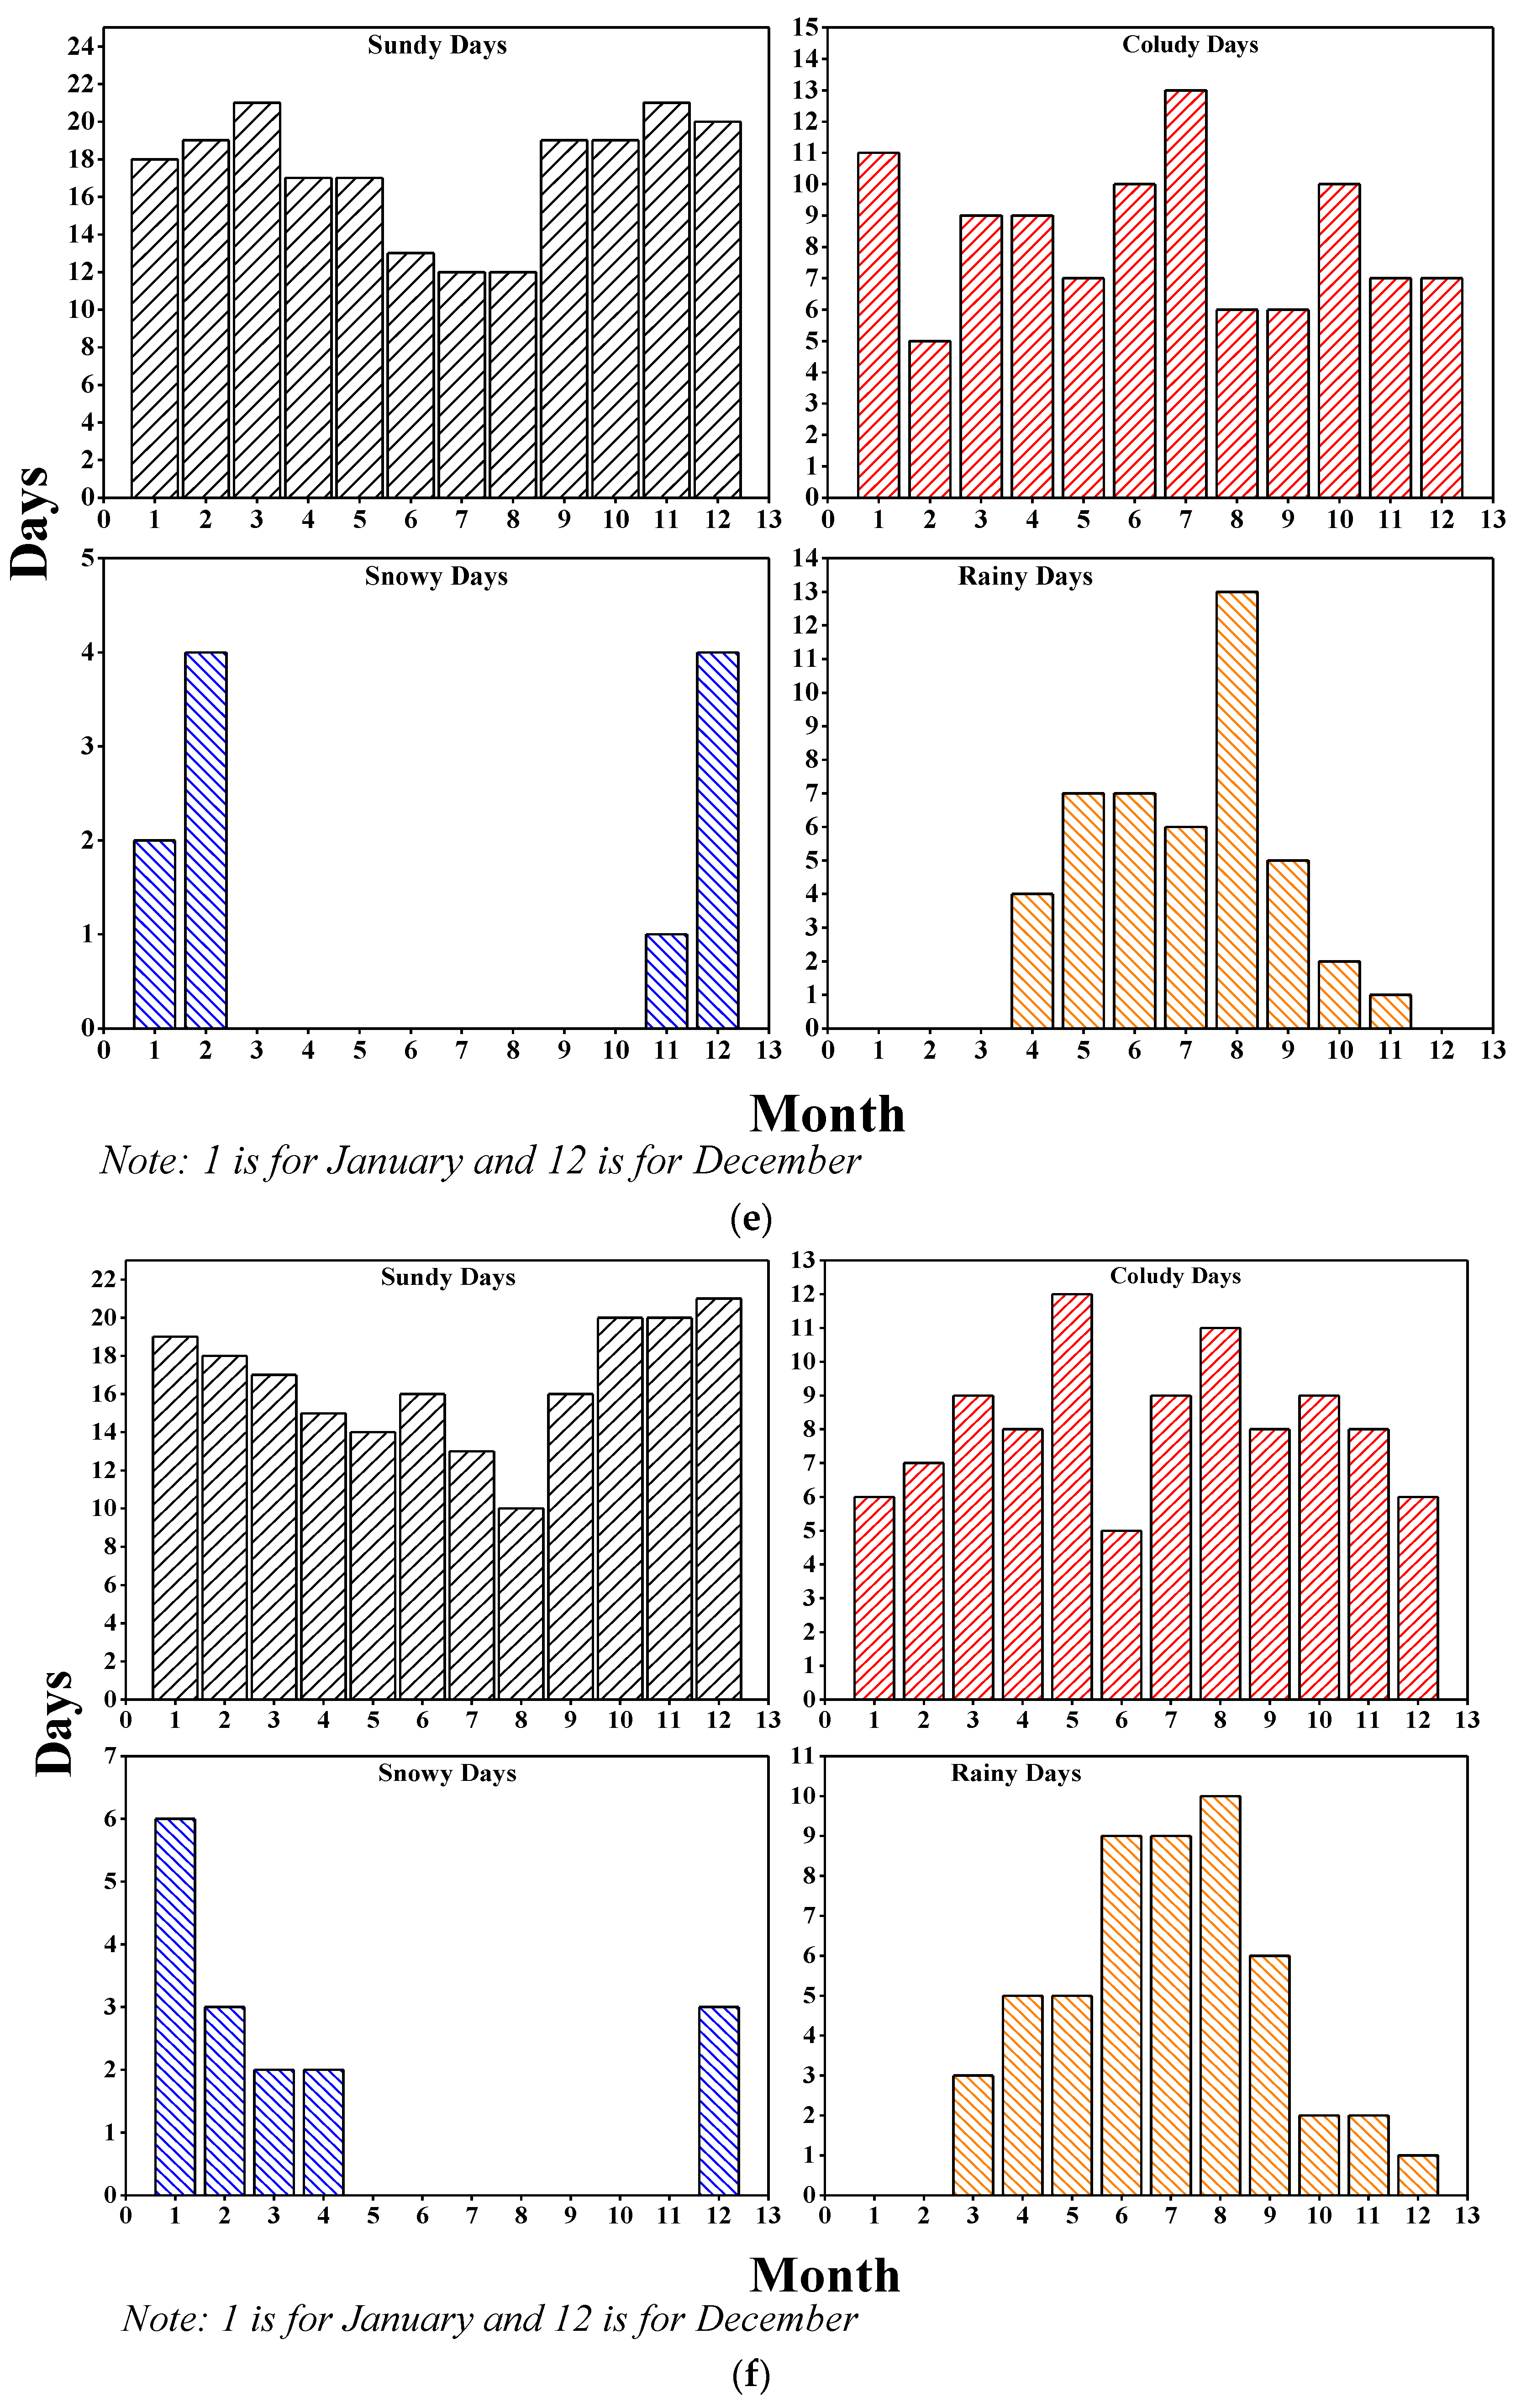
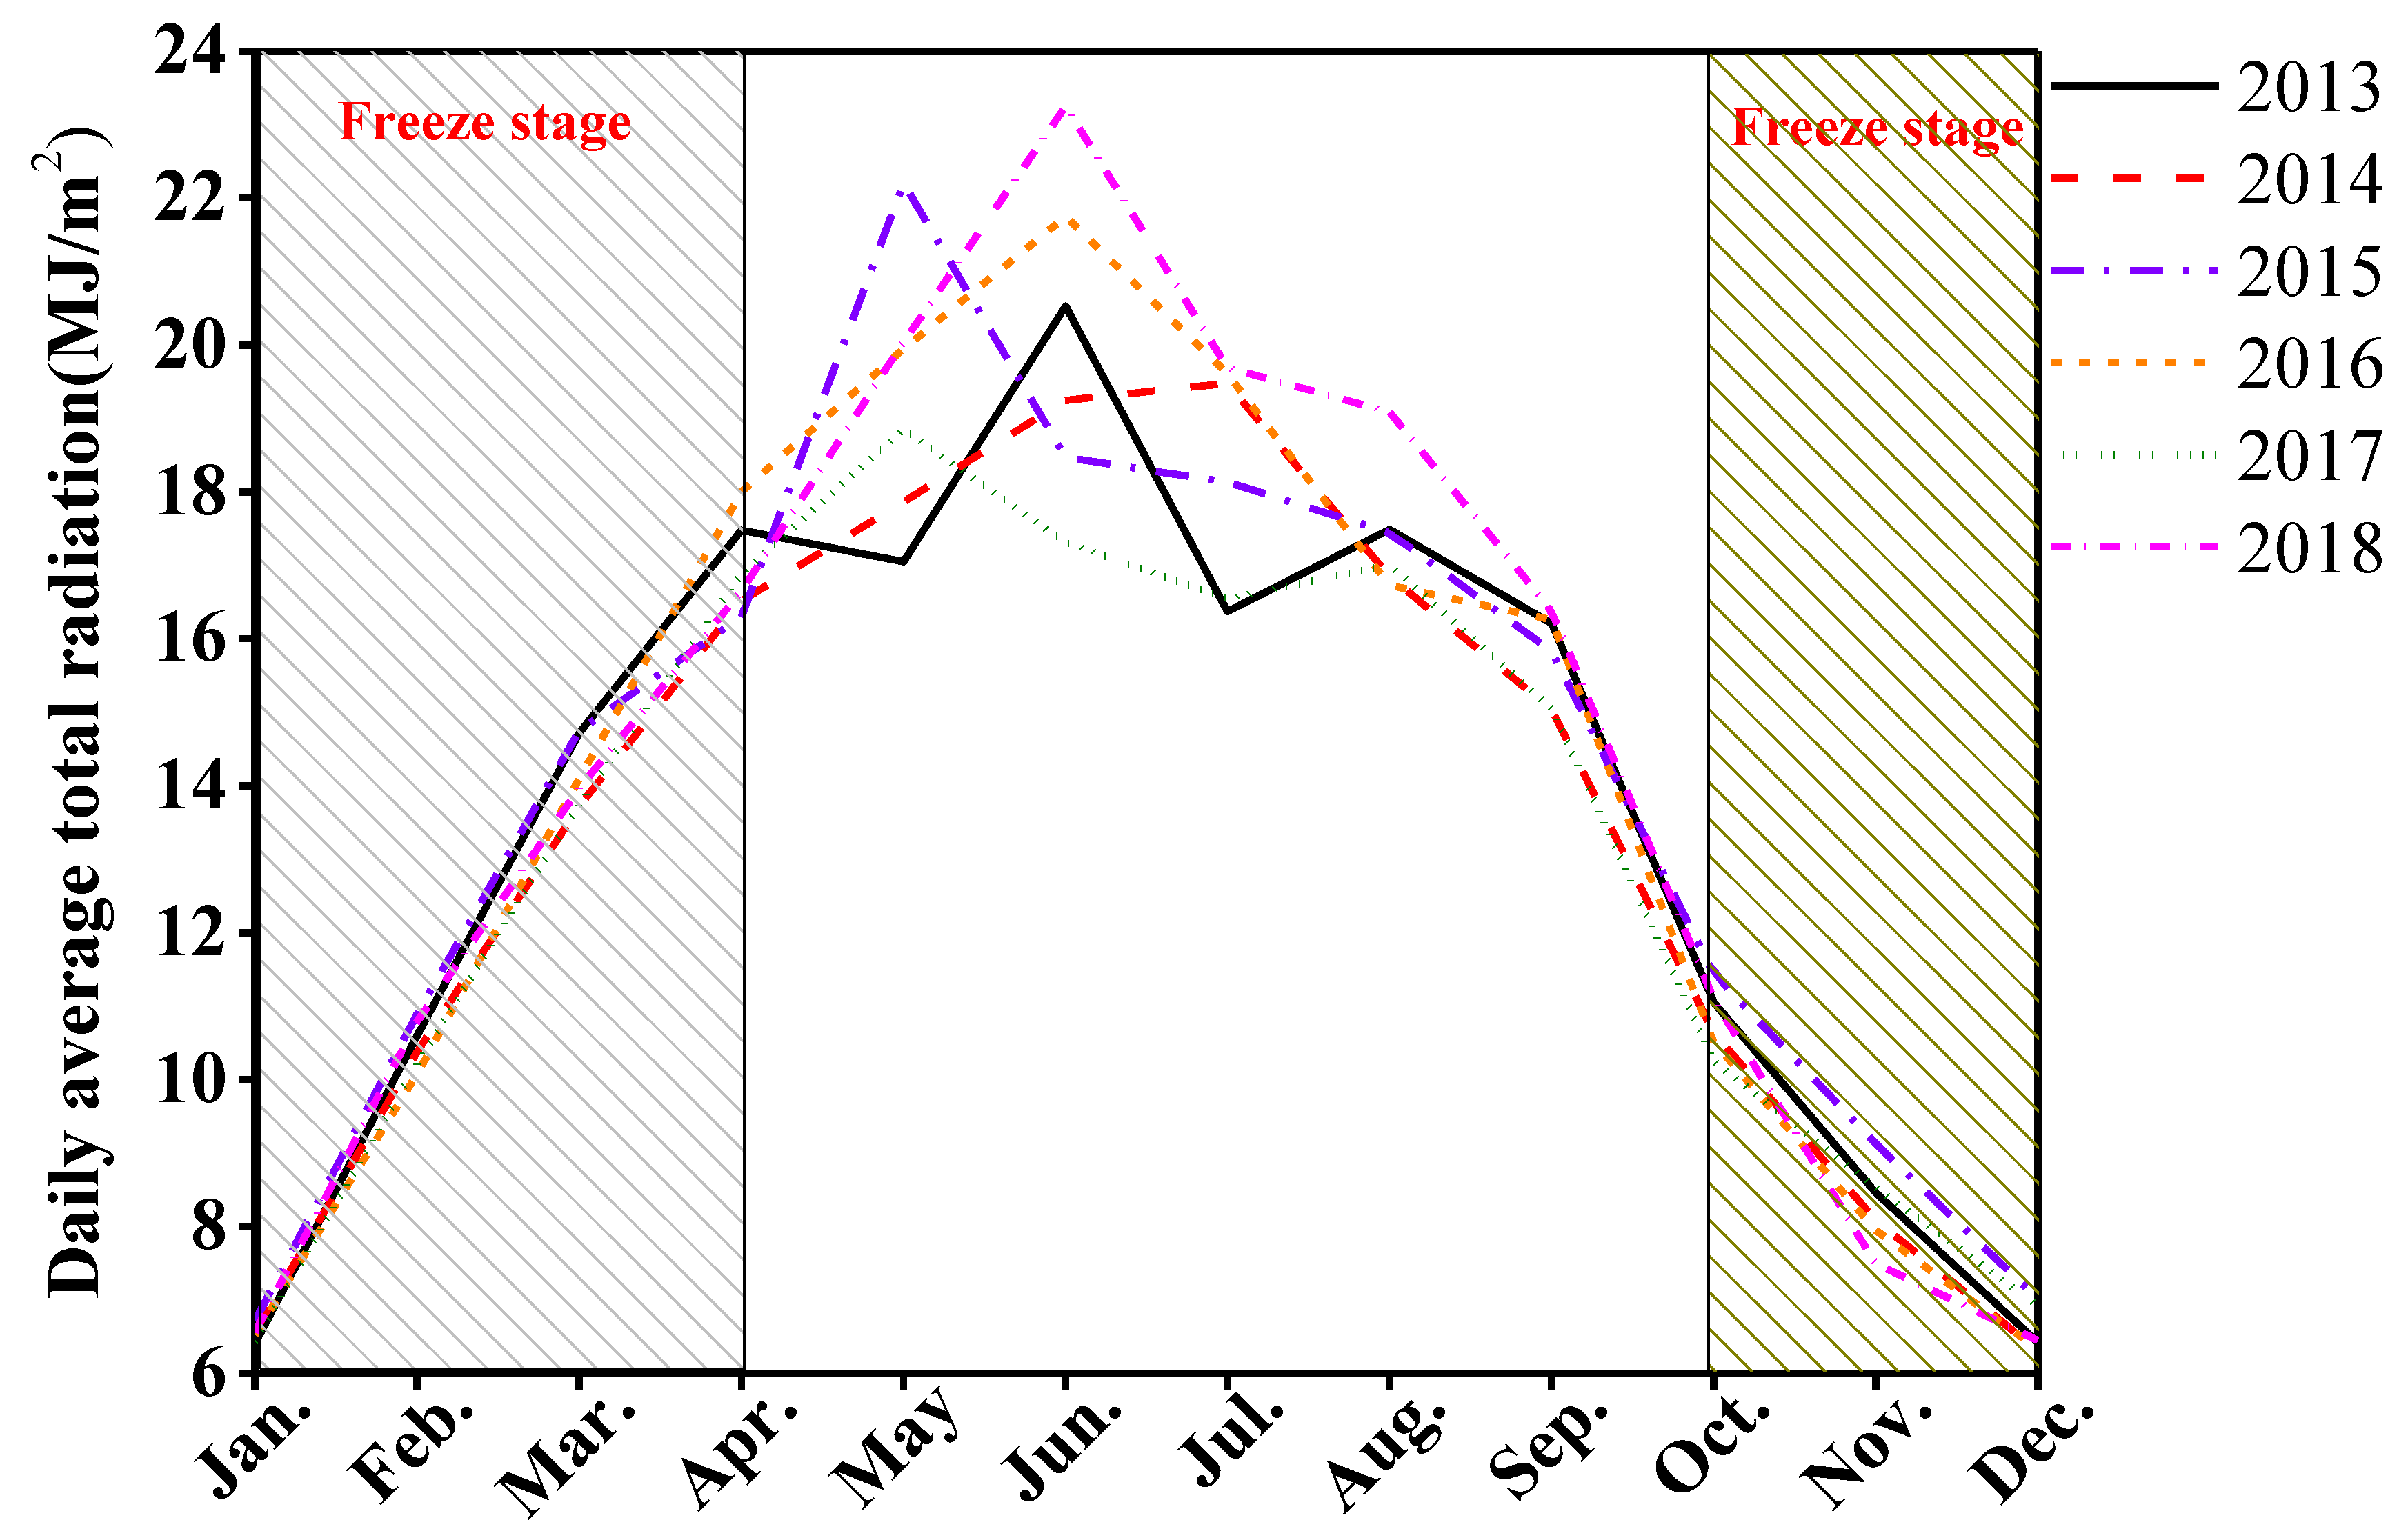
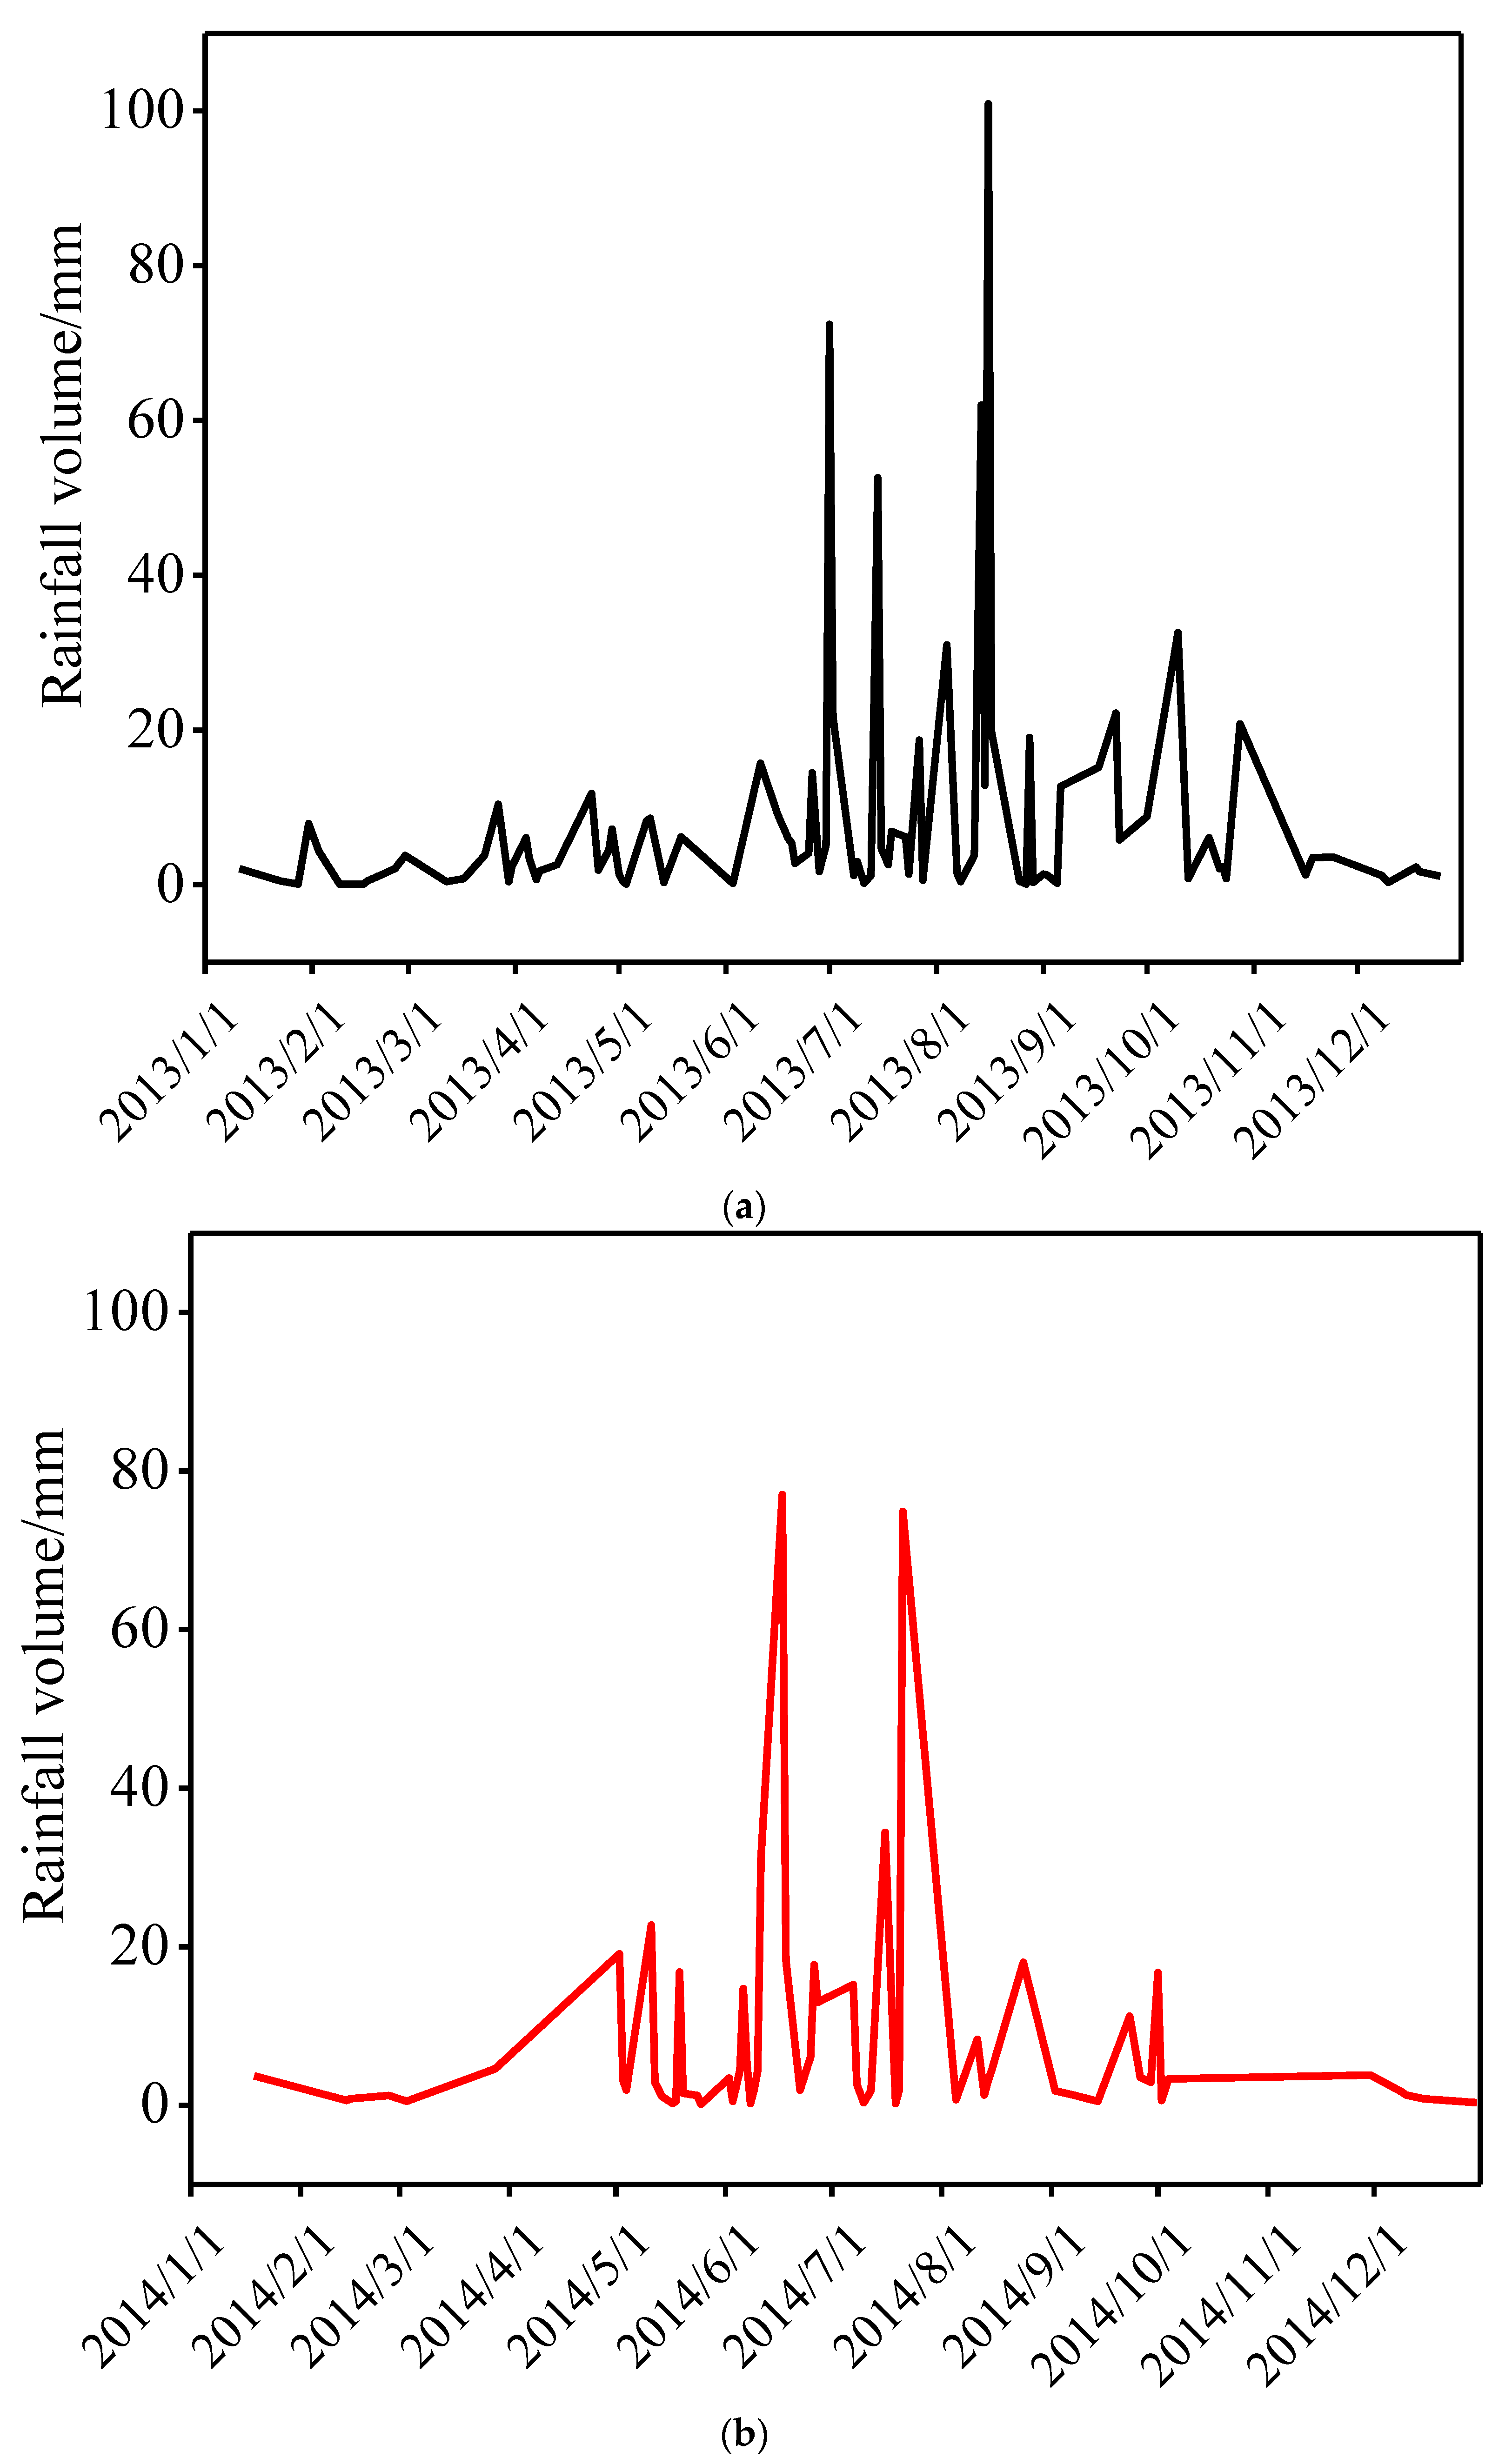
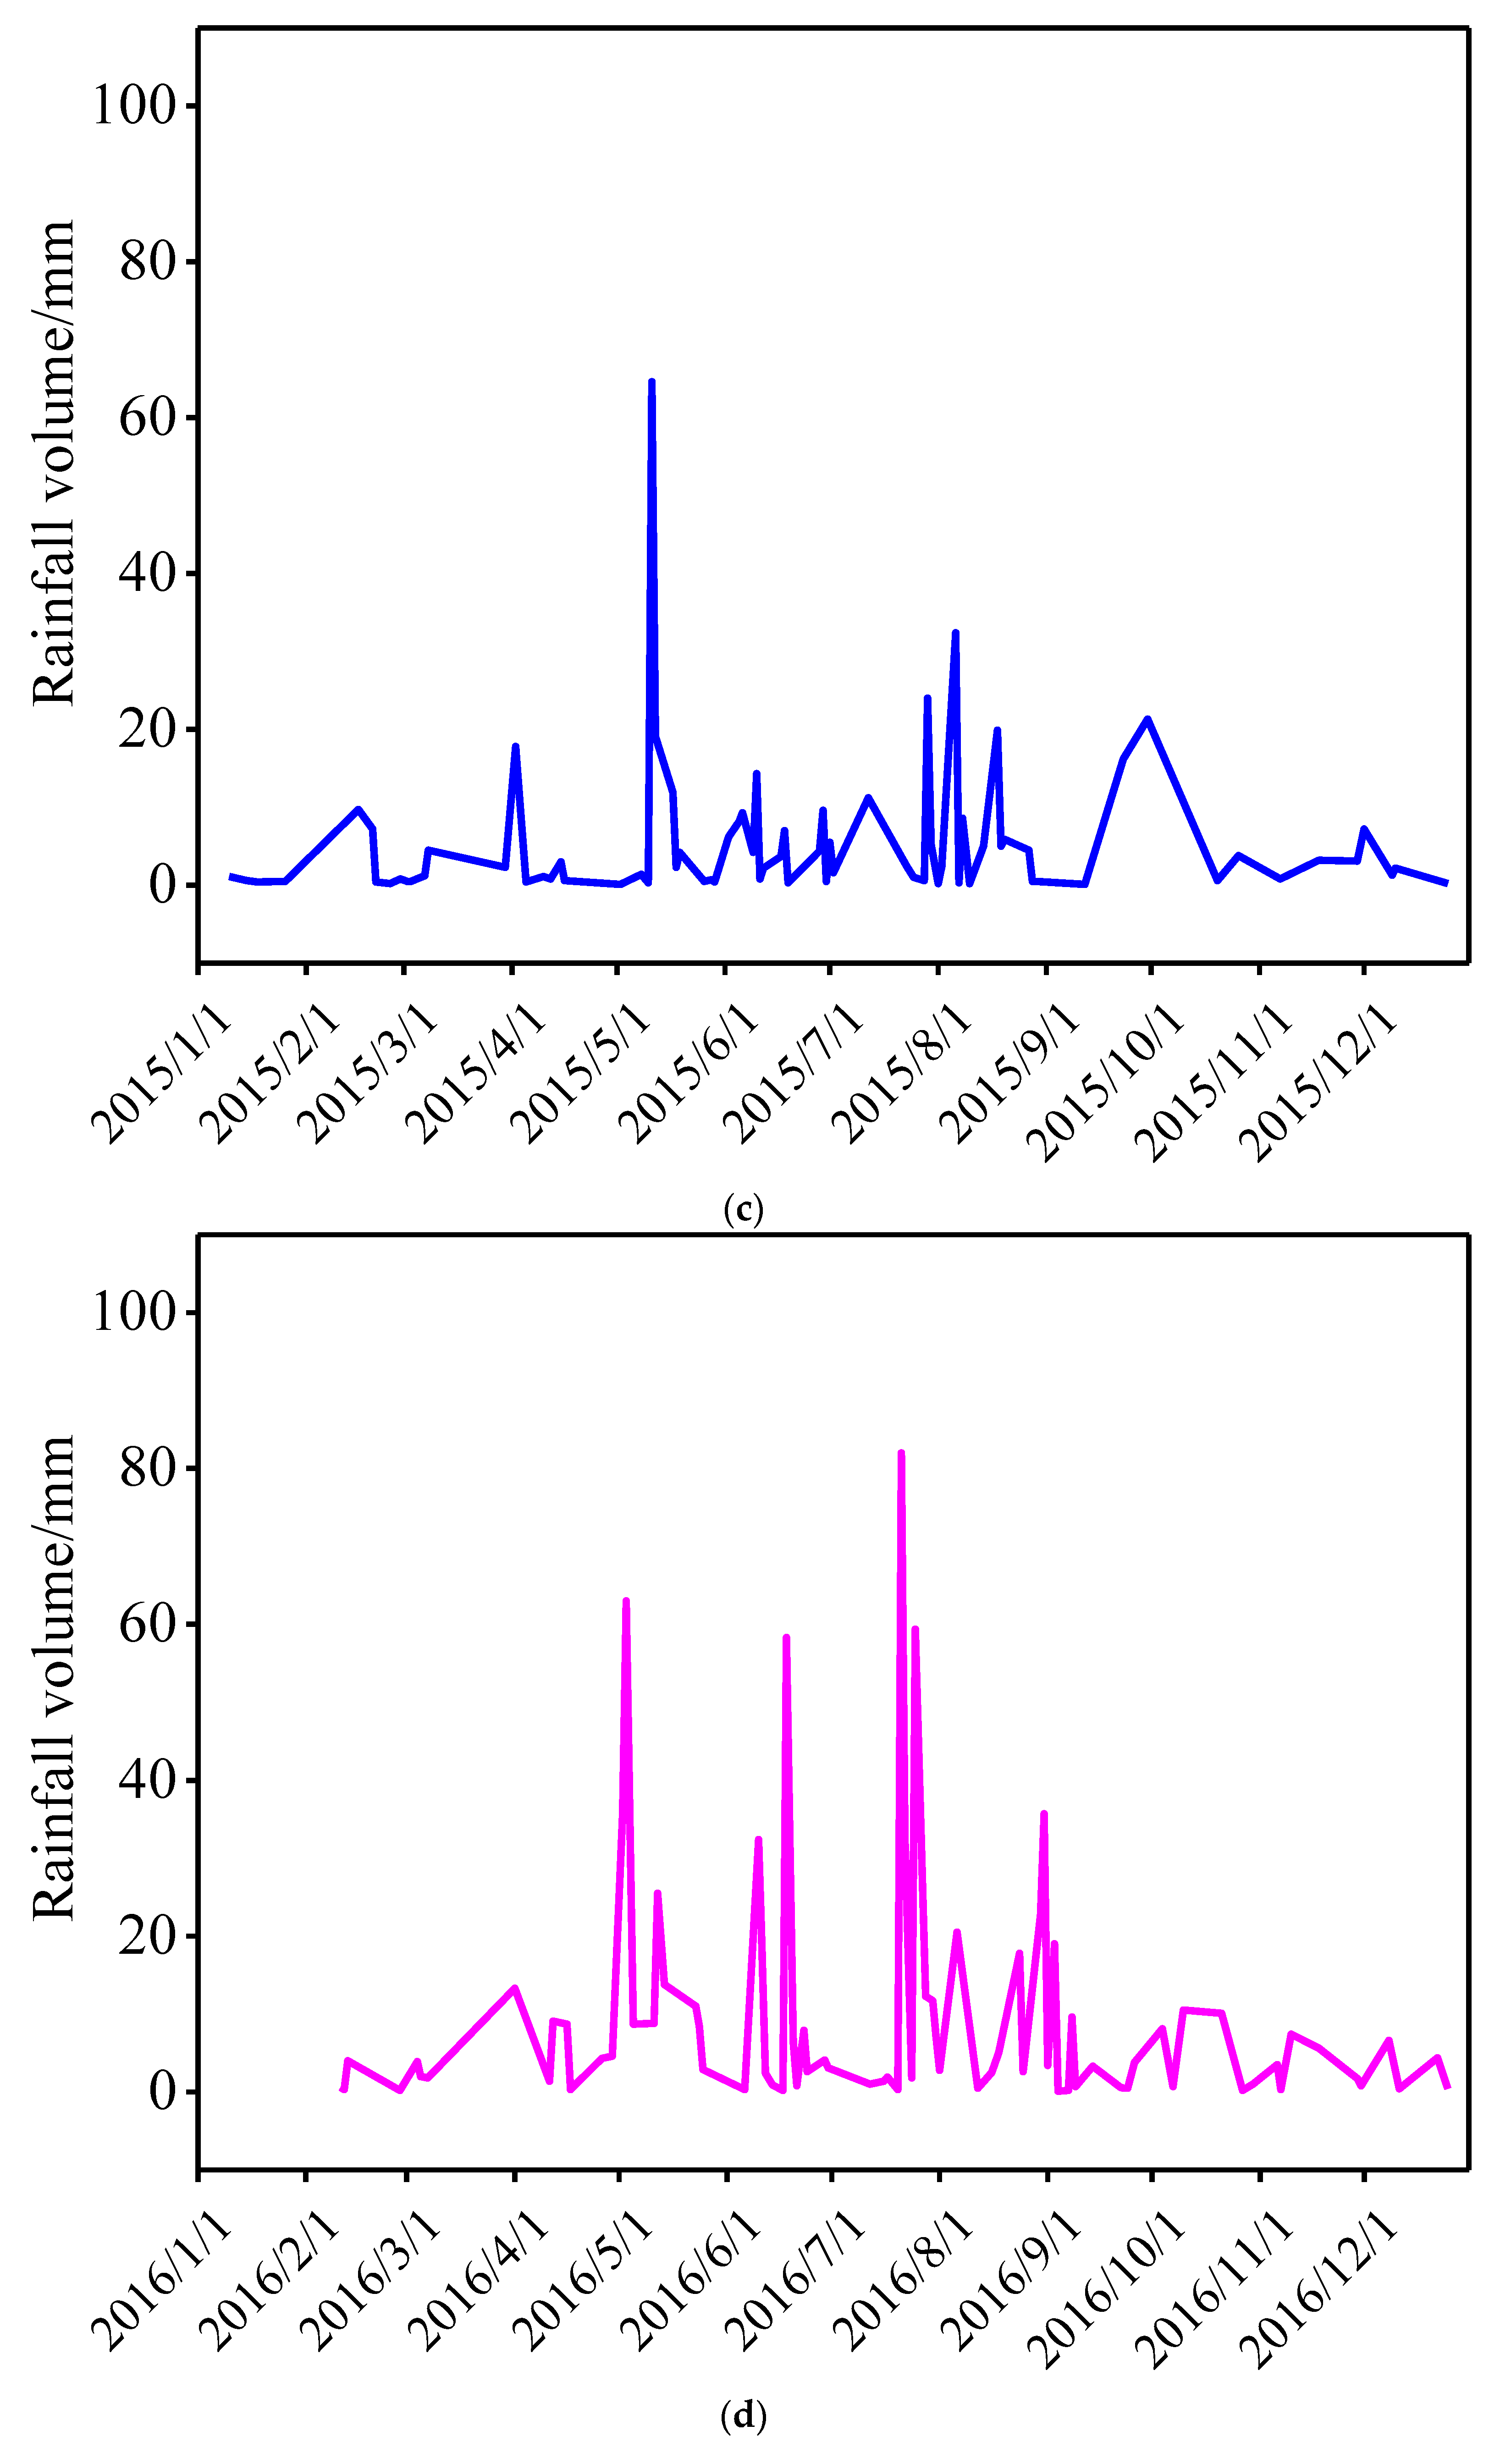
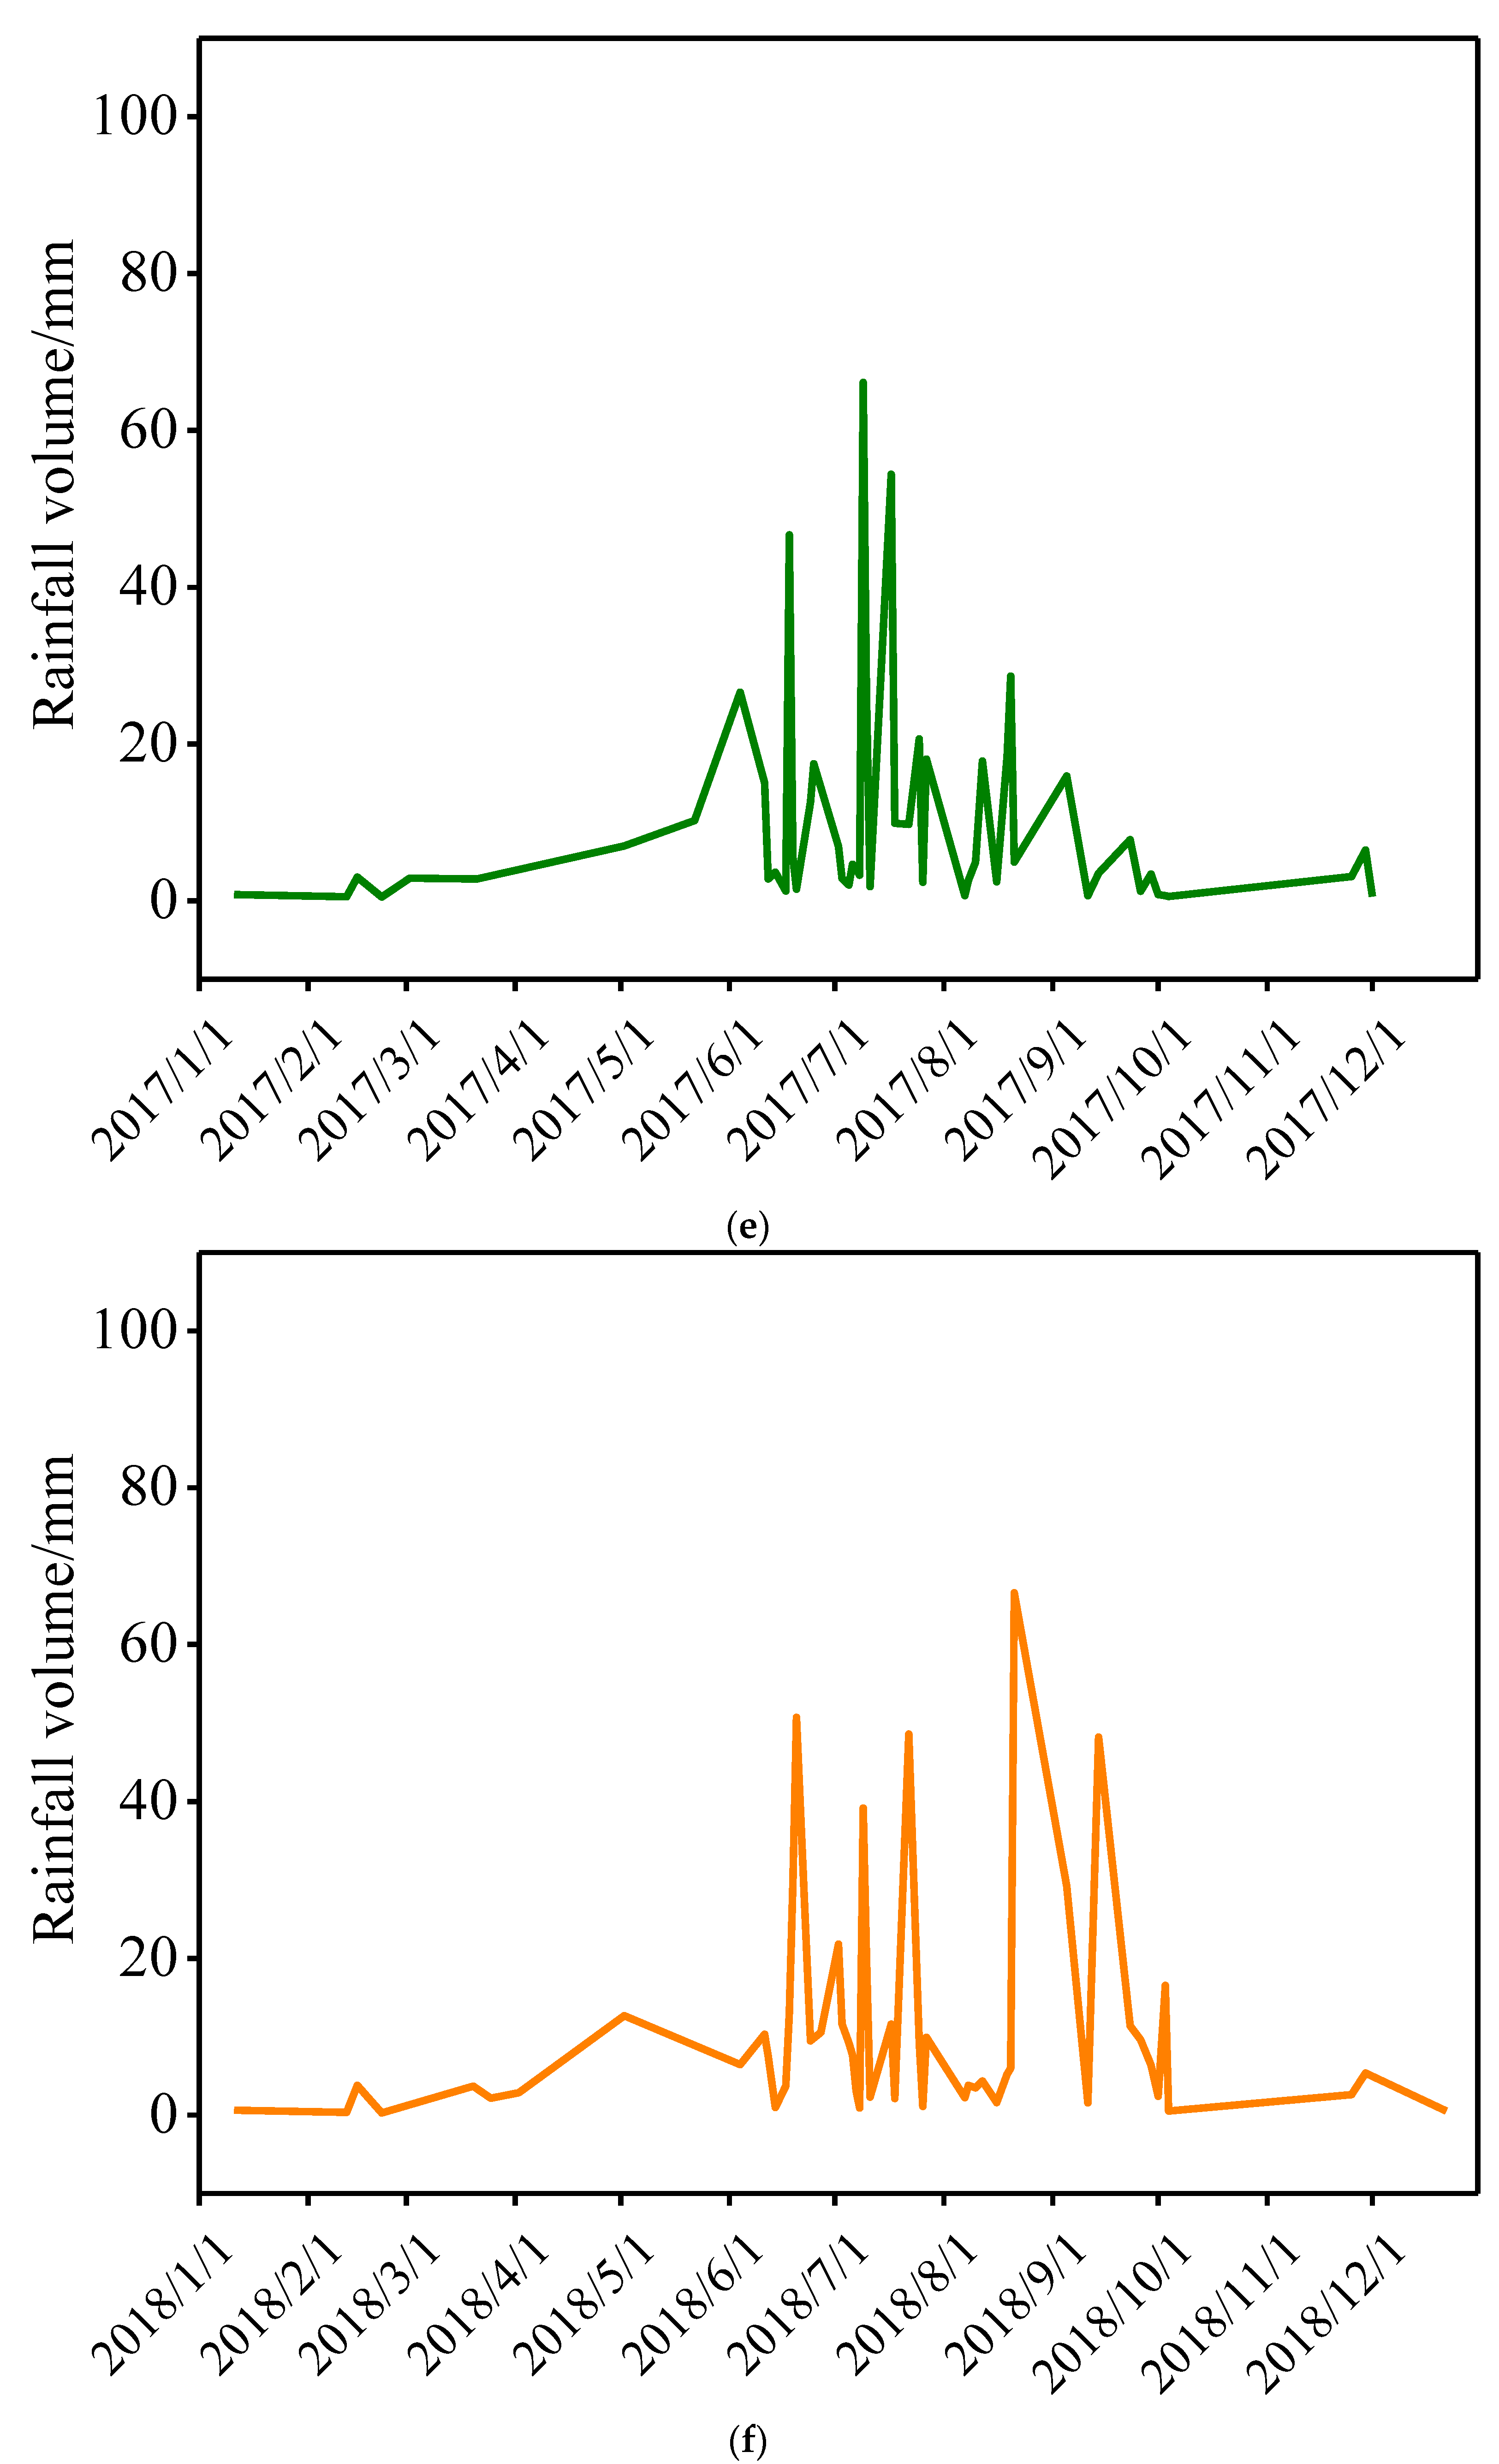
2.1.1. Meteorological Monitoring

Three long-term monitoring areas were established at the Shifosi Reservoir, and a meteorological monitoring station/instrument (HM-SQ10) was installed. Long-term monitoring of various meteorological data in the region, such as wind speed, wind direction, temperature, humidity, air pressure, total radiation, rainfall, evaporation, soil temperature, and soil moisture, was carried out using embedded technology.

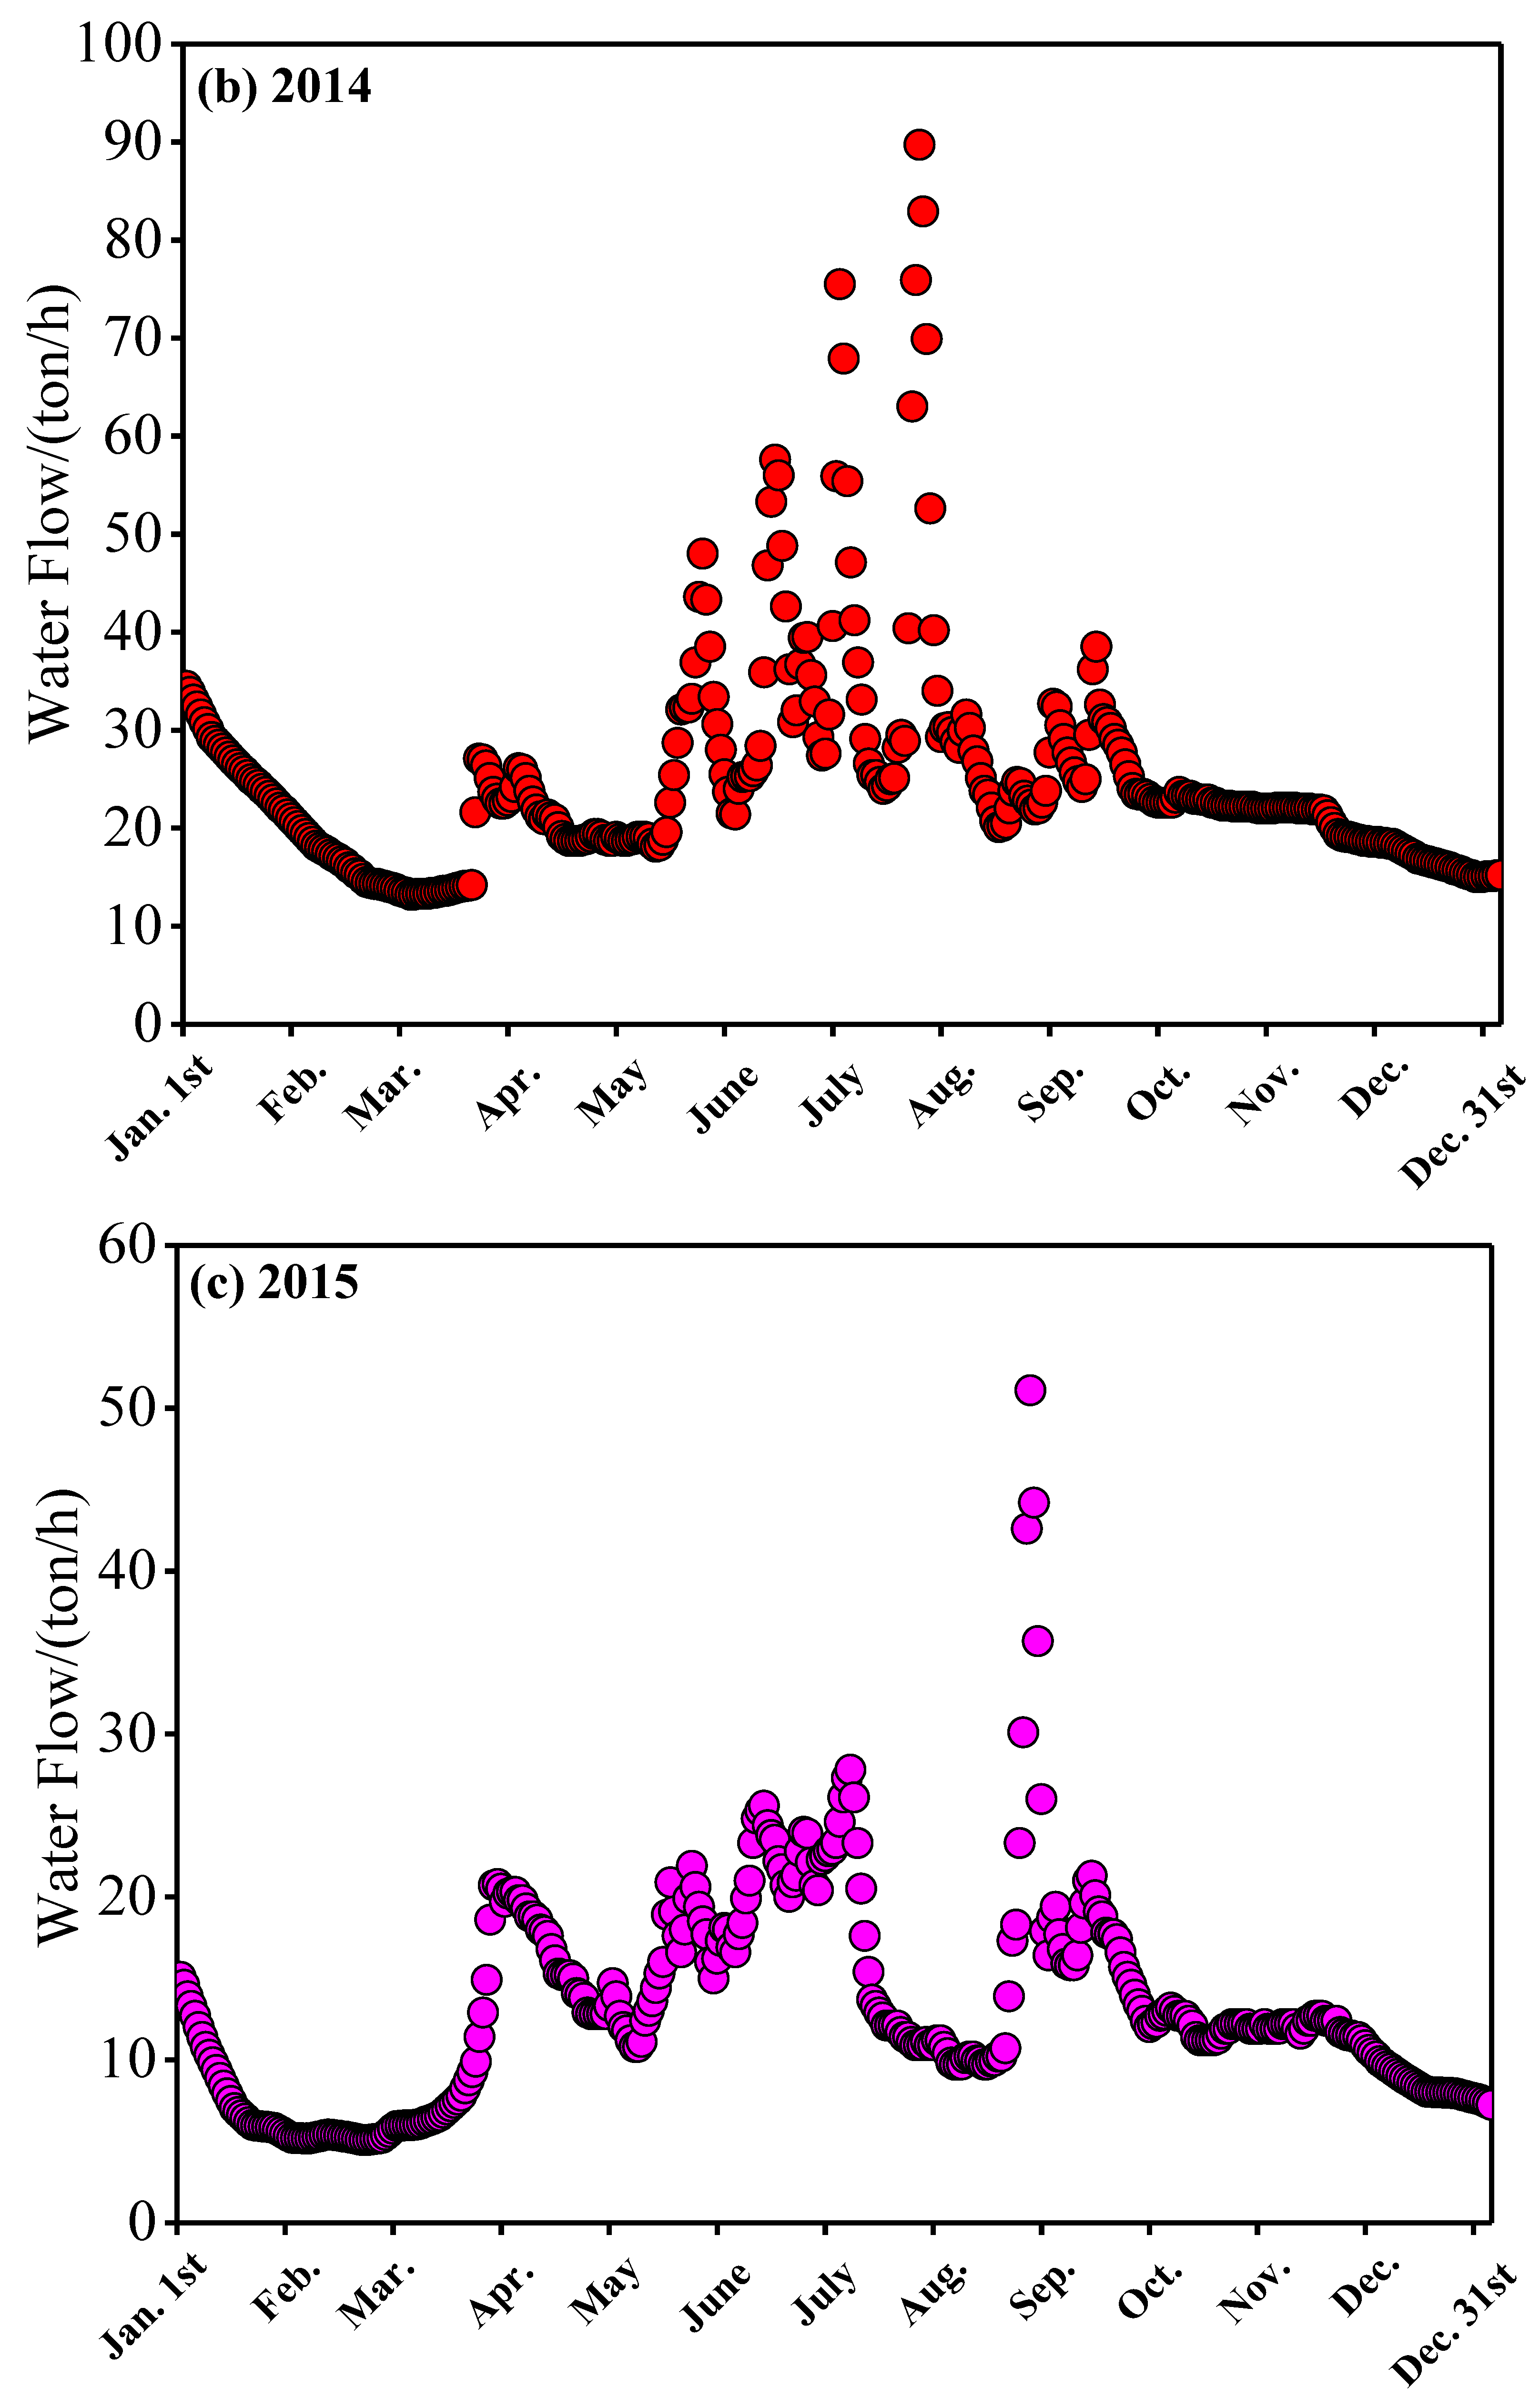
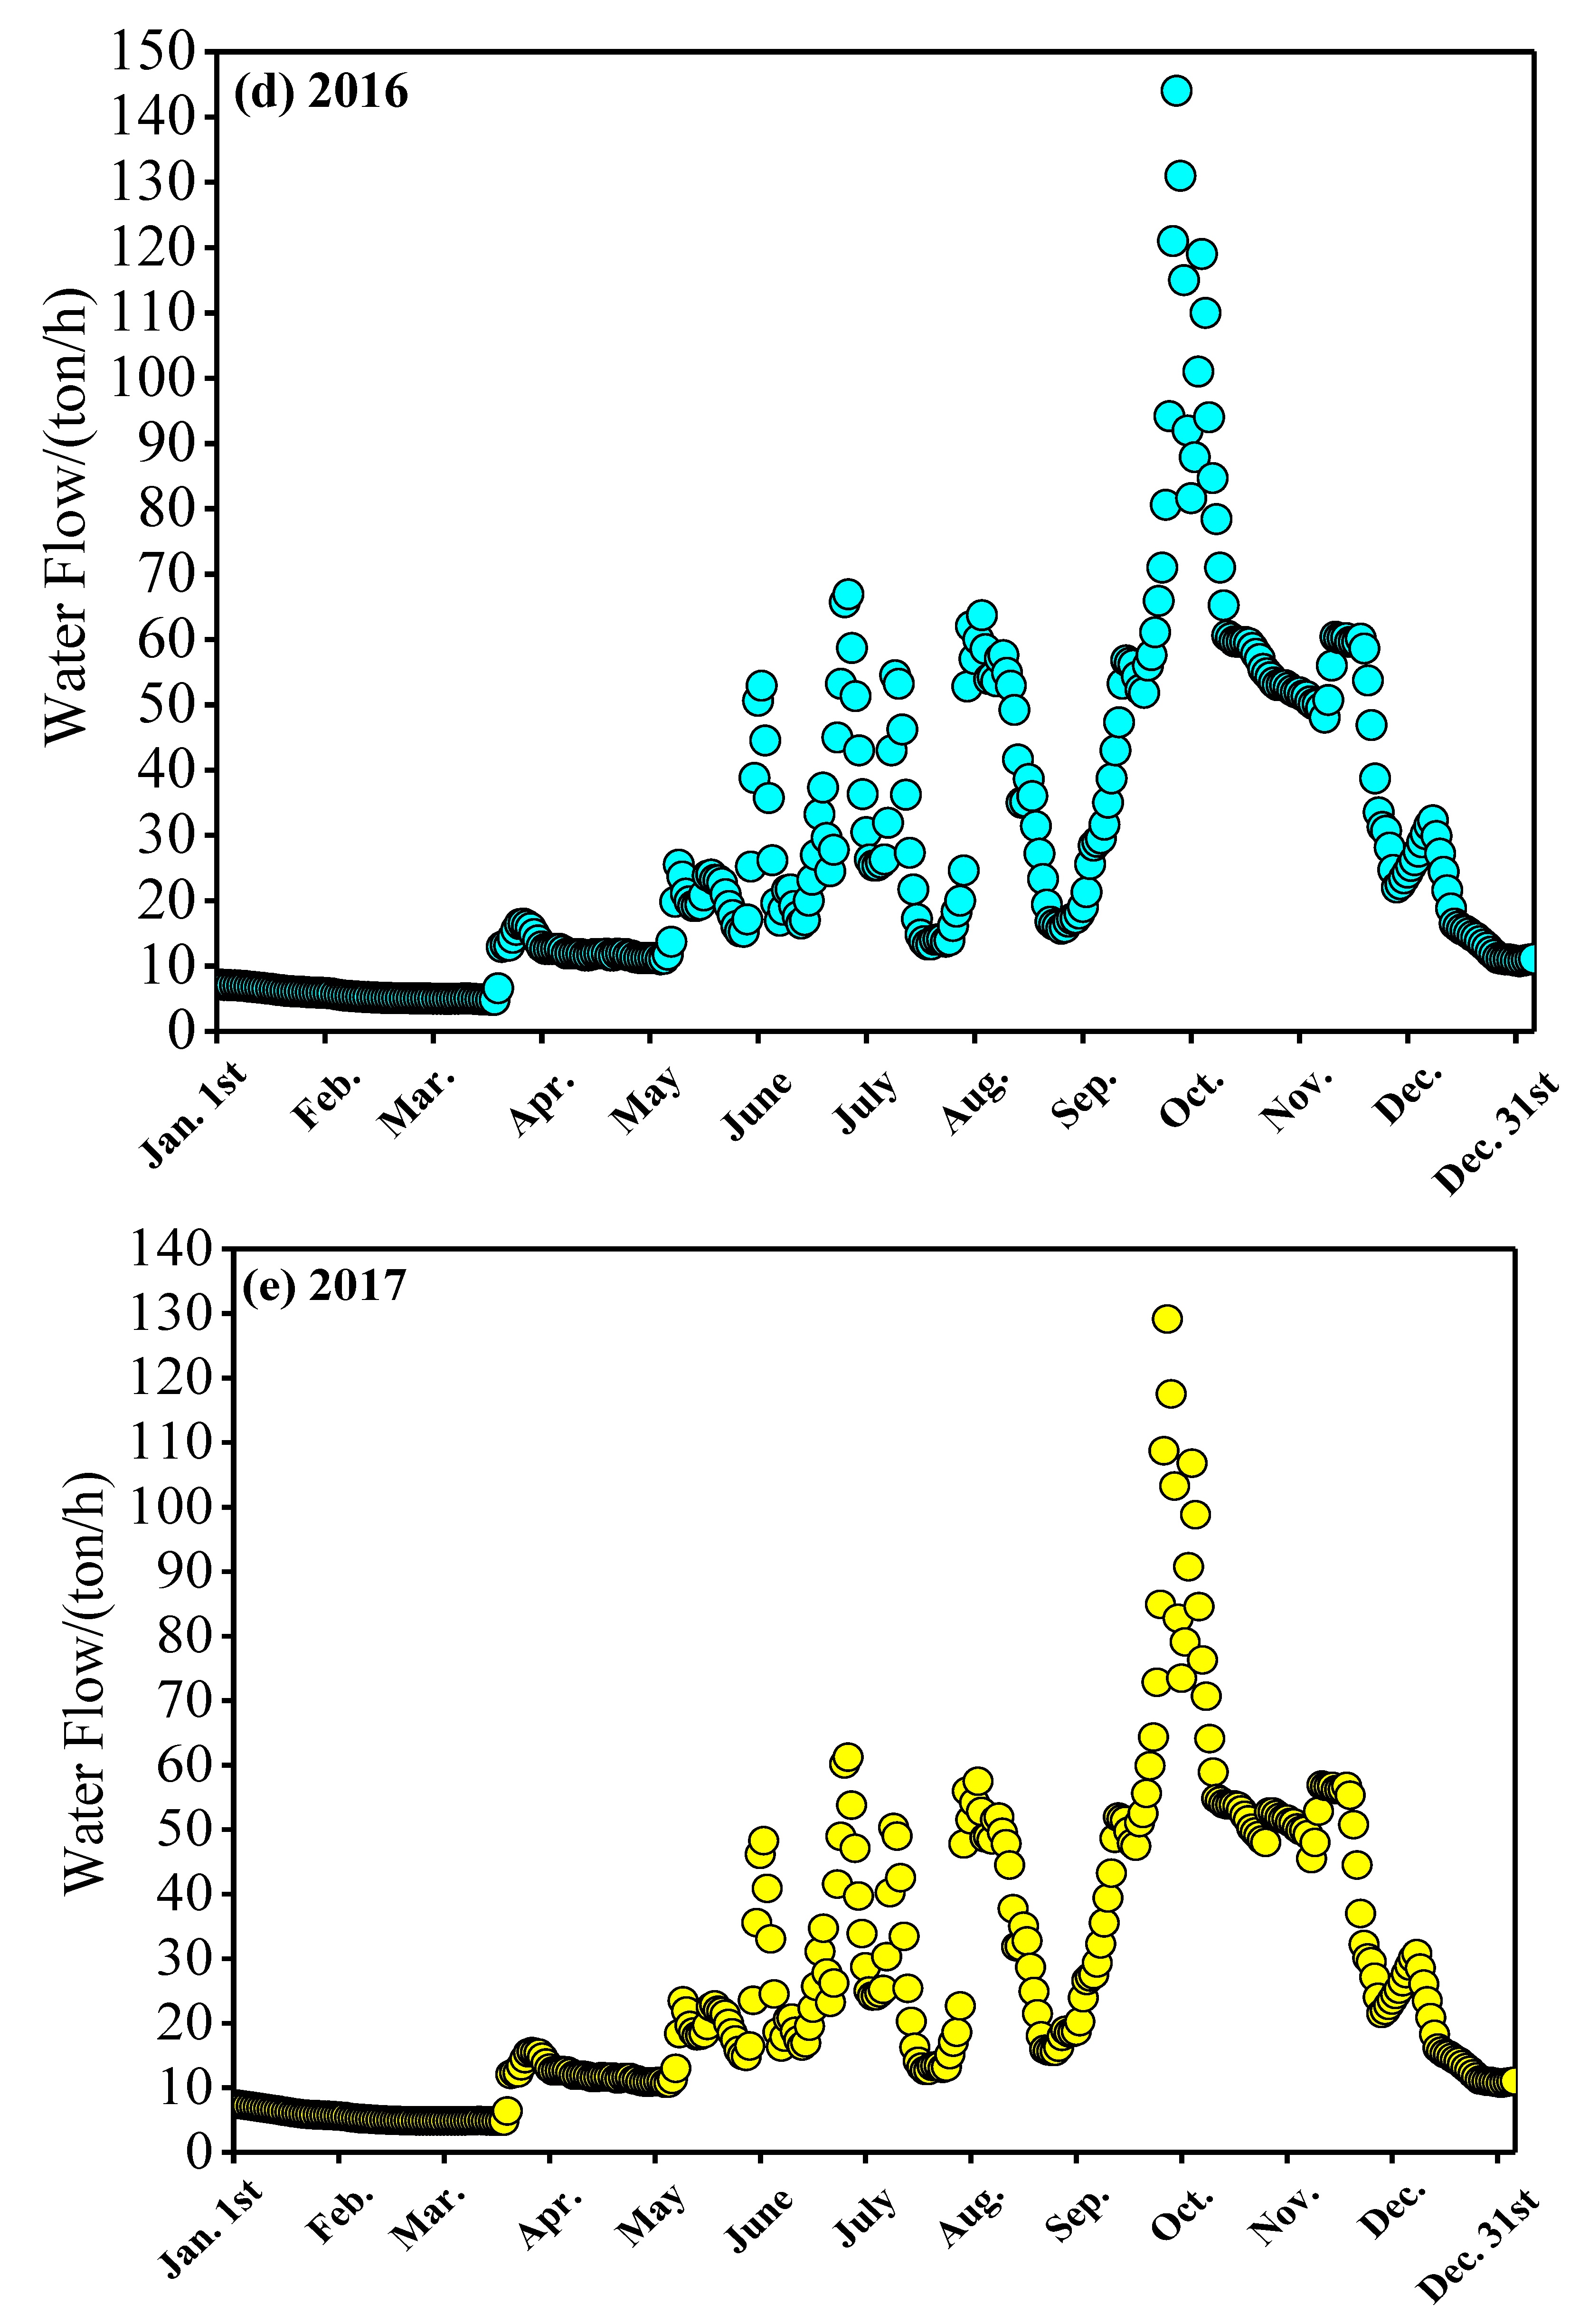
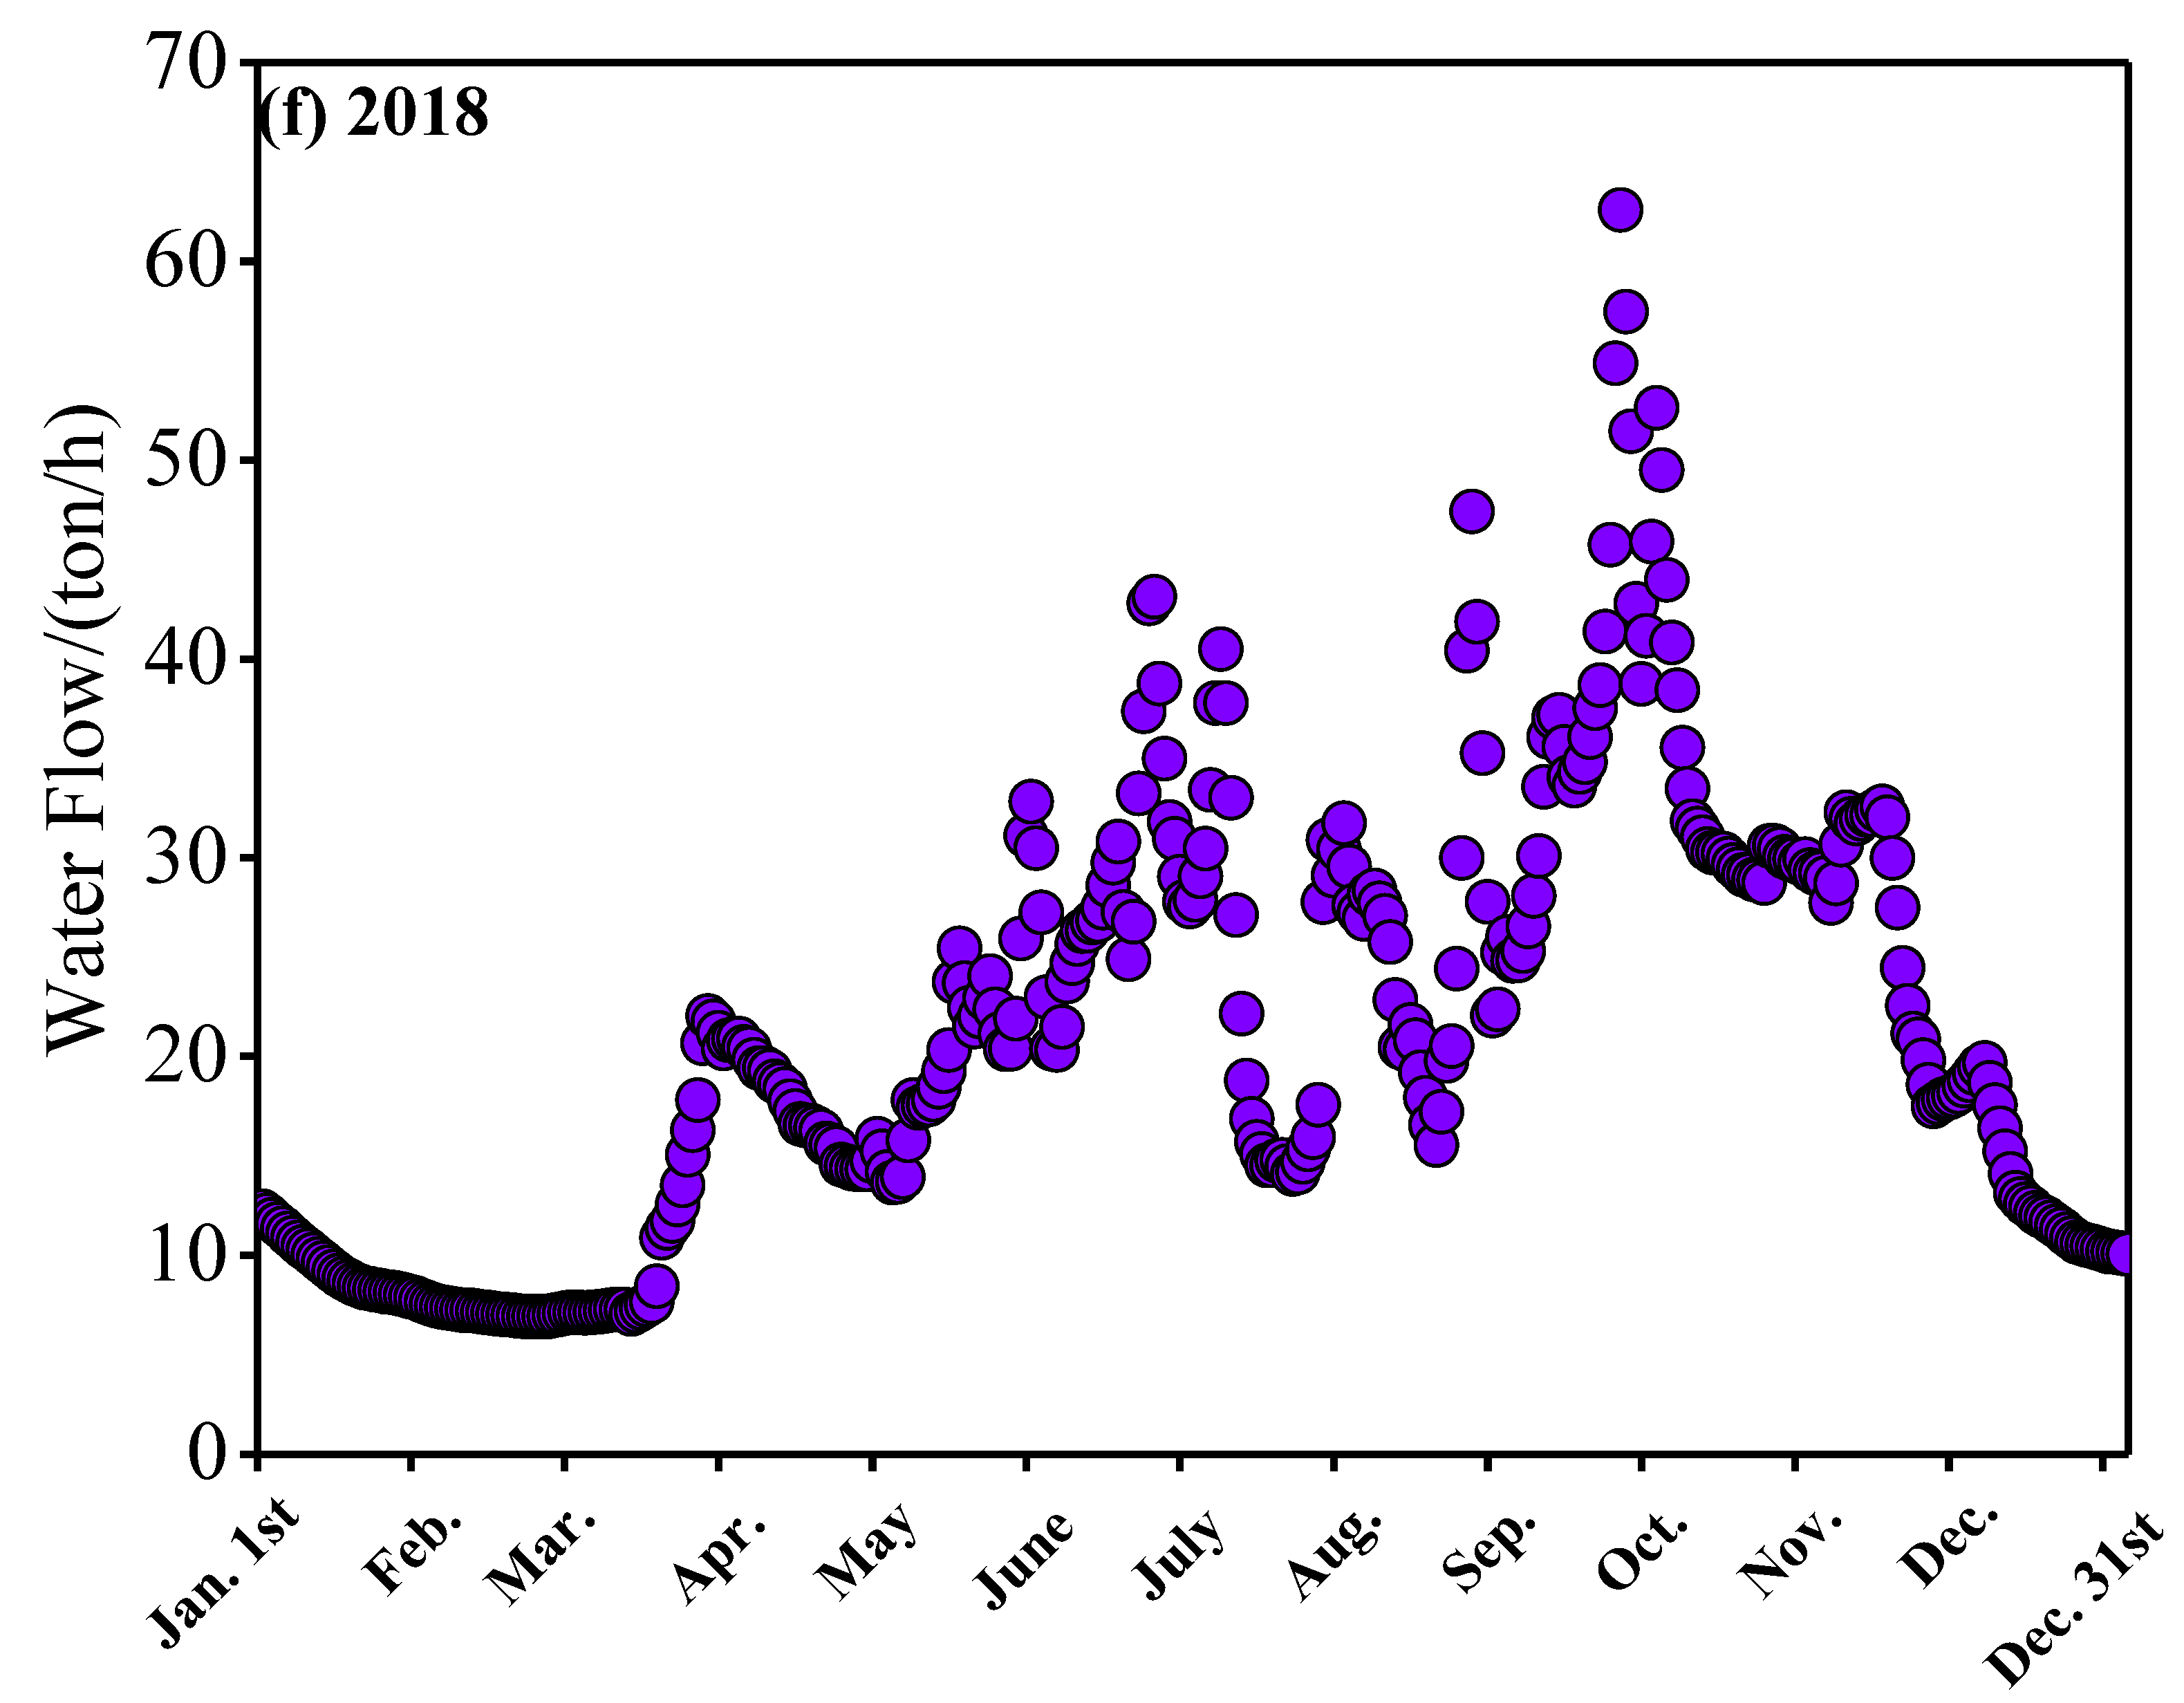
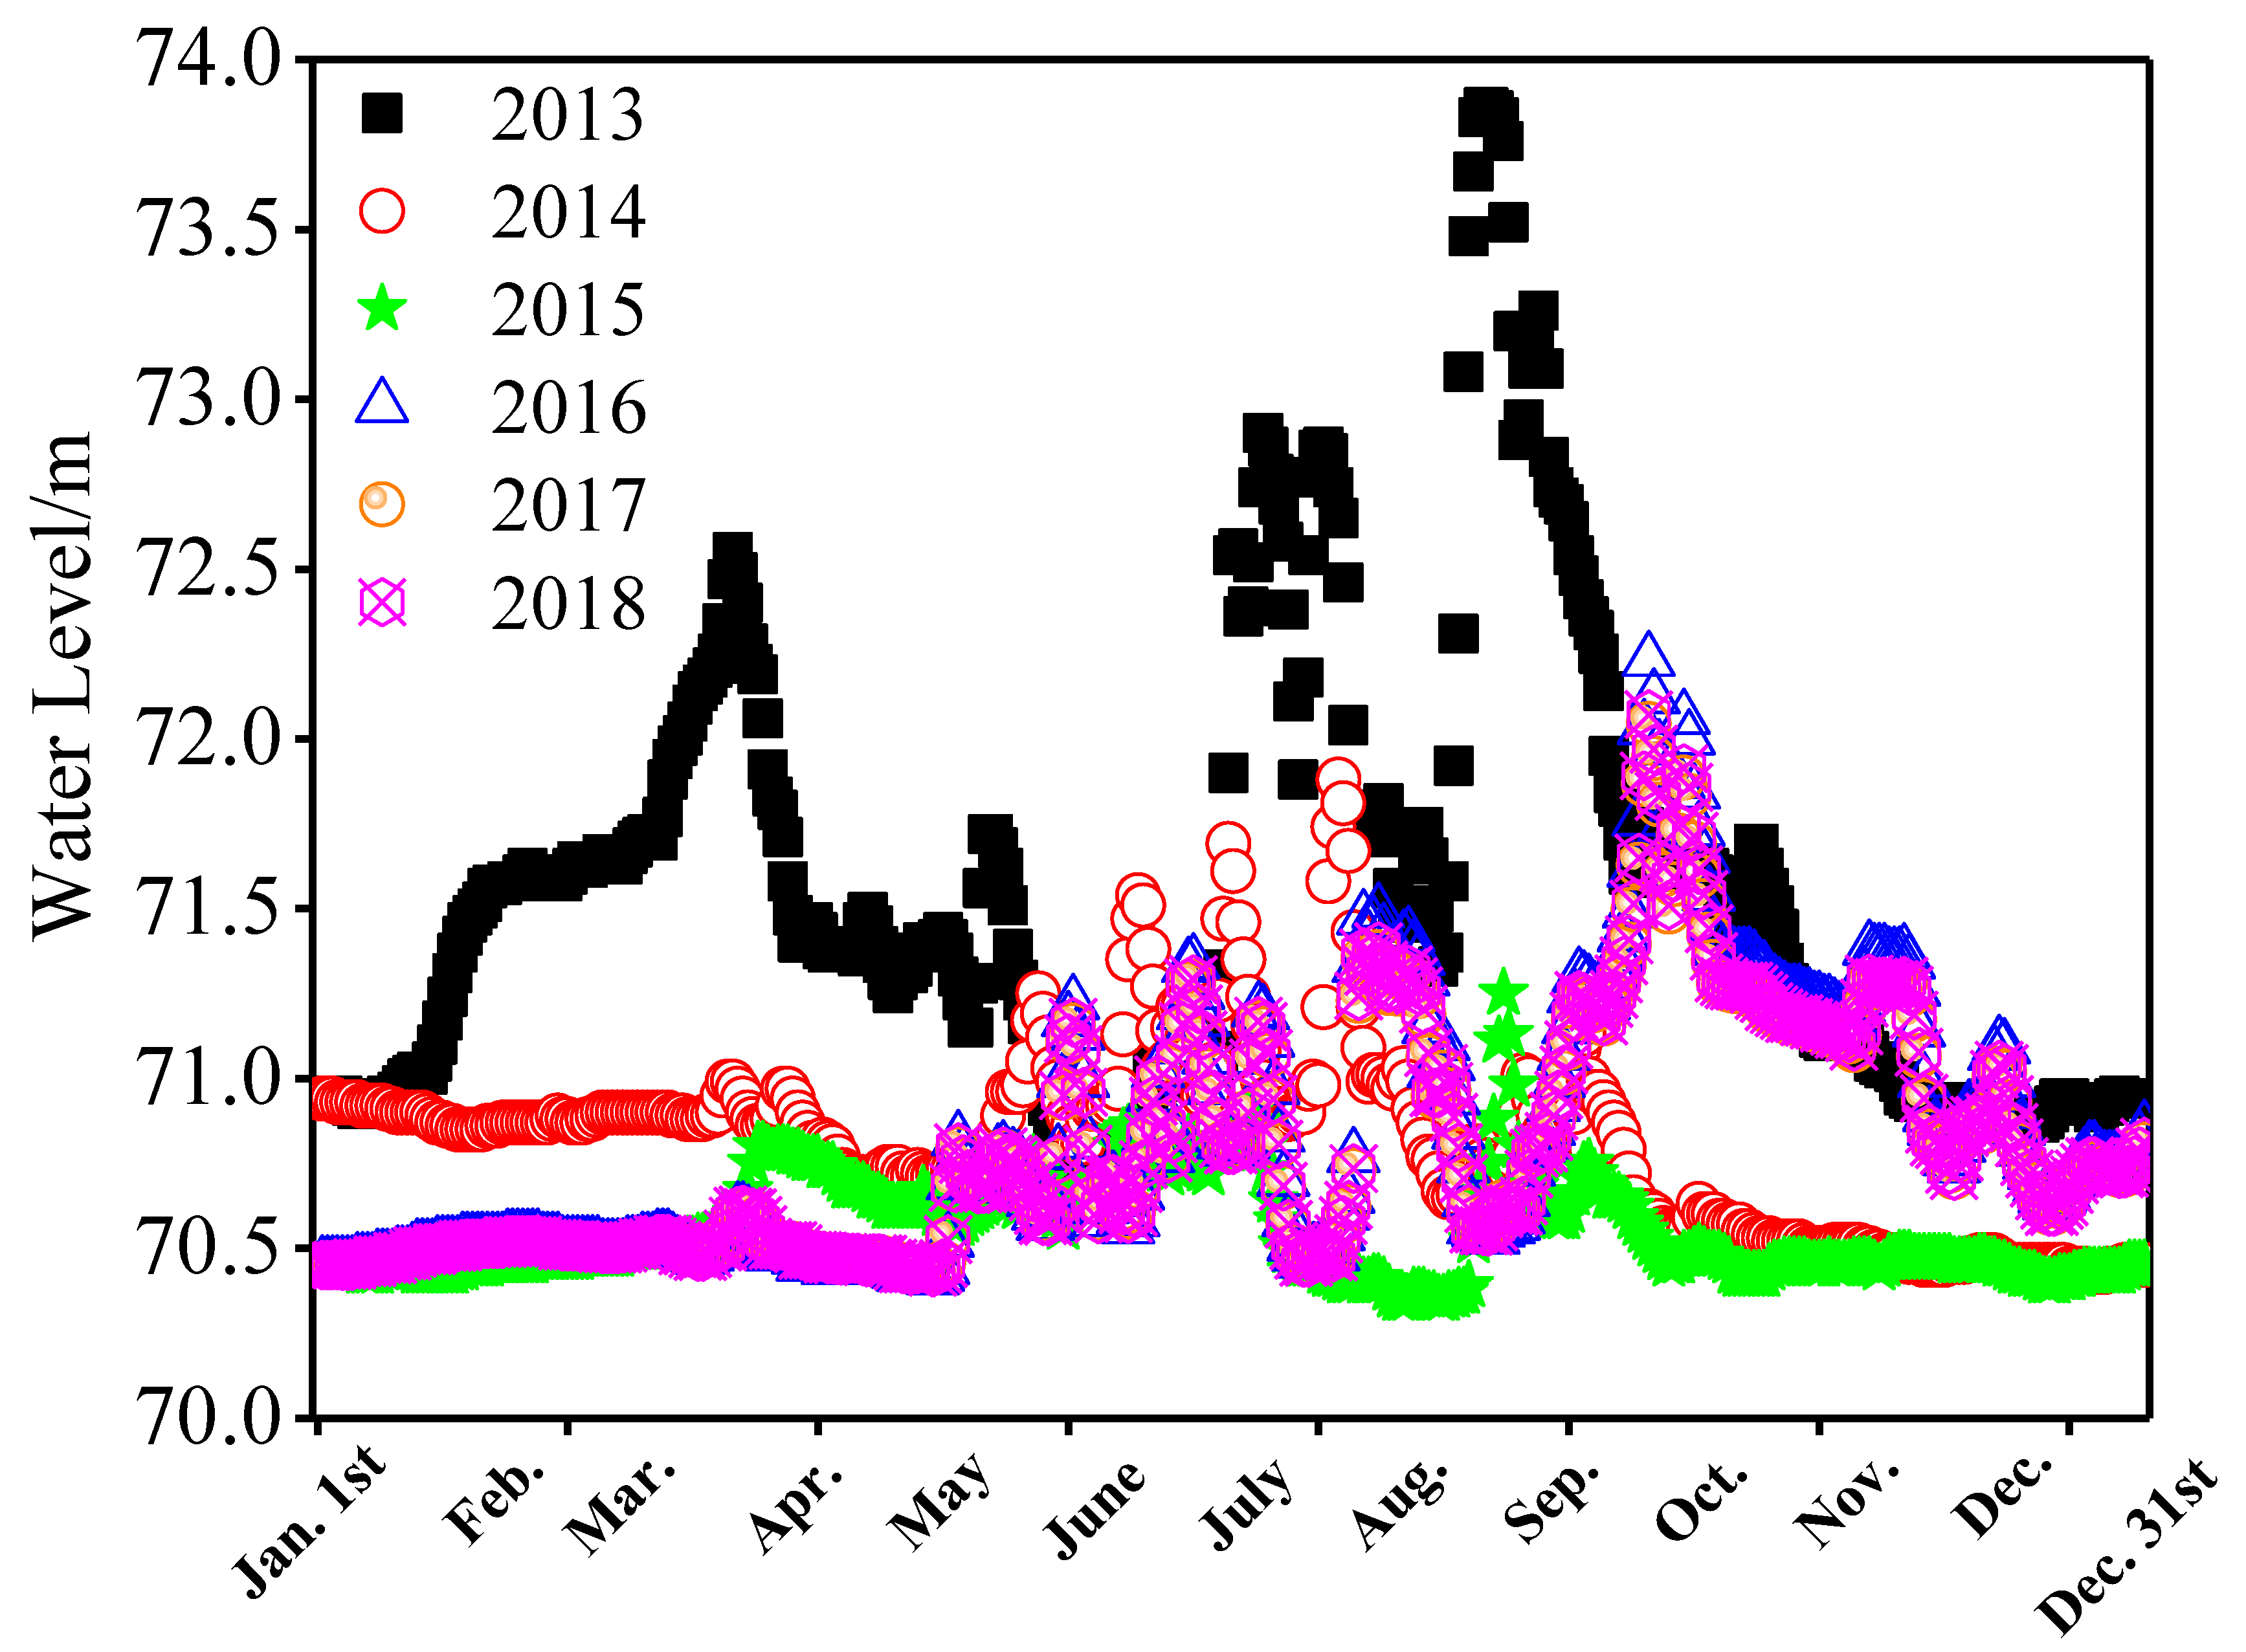
2.1.2. Hydrological Monitoring

A hydrological monitoring station (hydraulic instrument is SL4152007) was set up in the estuary of the Shifosi Reservoir, and the water level, flow rate, rainfall (snow), evaporation, and sediment volume of the reservoir were all monitored on a long-term basis.

2.1.3. Ice Monitoring

Data such as the ice thickness and ice temperature were detected by a resistive ice thickness sensor, which was set up on the centre of the ice surface of the Shifosi Reservoir.

2.2. Experimental Materials

2.2.1. Selection of Ice Material

The Shifosi reservoir was selected in Liaoning Province in northeastern China, and ice testing was conducted at specific times and months from 2013 to 2018 (shown in Table 1). The annual period when the Shifosi Reservoir is iced over lasts 5 months, the ice thickness is 0.3–0.6 m, and the average water depth is 1.9 m. The ice sample collection site was located in a wide area of the ice on the reservoir, and an ice sample collection point was set up. The measured ice thickness at the time of ice block collection was 40 cm. The large ice cubes taken out of the reservoirs were initially cut into (L) 500 mm × (B) 400 mm × (W) 300 mm ice blocks and sealed in plastic bags. These plastic bags were wrapped in a foam incubator with tape. The ice cubes were shipped to Dalian after being packed at the site in the evening to ensure that they would not melt during transportation. These ice cubes were placed in cold storage near Dalian University of Technology at −10 °C. It is important to note that after the floating ice is harvested from the cold water and stored at a specific temperature and tested in a laboratory, its mechanical properties become different from those of the in situ floating ice, which is relatively warm and has a naturally occurring temperature gradient [40,41].

2.2.2. Ice Specimen Preparation

The ice sample was cut, and the end face was polished, ensuring that the end face sides were perpendicular. The maximum ice thickness was controlled between 0.8 and 1.2 m. Among the ice thicknesses of 0.3–1.2 m, 8–10 specimens of equal thickness were selected for the mechanical property experiments [42]. A complete ice block was formed into a vertical ice sample with a height of approximately 7–10 cm from the surface layer in the thickness direction. In addition, at a horizontal position for the same ice block at a certain distance from the surface layer to the bottom layer, a thick horizontal piece of ice was cut off the top, and the specific position of the observation surface was recorded accordingly. The selected end face of each ice block was ground, and then, the flat end face was flattened on a thin glass piece at a temperature slightly higher than 0 °C until it froze onto the glass. Then, a small amount of ice water was reused and applied uniformly around the contact surface to better fix the ice to the surface. After the water was completely frozen, the ice cubes were repaired with a planer until the thickness of the ice was less than 1 mm. At the same time, the specific position of the end face of the ice was marked. Ice flakes were used to analyse the ice crystal morphology.

2.2.3. Specimen Preparation for the Cracking Test

This study begins with the traditional preparation characteristics of a rectangular test piece. Because of its simple sample processing method and high controllable precision, the traditional preparation method of a rectangular cross-section test with smooth, tidy and high dimensional control standards for processing large ice blanks was chosen. Then, for each cleft crack test piece with a thickness of 3.5 cm, a rectangular saw blade was used to cut the rectangular test piece into a 7 cm × 7 cm × 3.5 cm square cross-section test piece to replace the traditional circle-shaped section of the Brazilian disc splitting test piece (shown in Table 2). The advantage of this technique is that it not only avoids the difficulty associated with cylindrical processing for the preparation of circular split section specimens but also avoids the disadvantages of traditional circular section specimens, which include difficult control due to processing technology, and inadequate processing precision when processing loading platforms. Meanwhile, according to the requirements of the experimental design, 0.2 mm thick copper sheets coated on both sides with low-temperature-resistant lubricating oil were embedded in the specimens during the formation process. The thin copper sheets were removed gently after the initial setting. Thus, 50–55 mm long and 0.2–0.4 mm wide thin slits were formed in the specimens. The formation of the crack tip was a difficult task. To create a very sharp crack tip in the specimens, they were placed on the test stand, and the maximum load was applied until the specimens were destroyed. This process produces the maximum yield value of the specimens. Compared to previous methods, the crack tips formed by this method accurately reflect the actual crack extension areas in the specimens, and the ice crack defects are more realistic. Thus, the experiment is more realistic and reliable. Then, the ice specimens were numbered, sealed with plastic, and stored in a constant temperature freezer. The temperature was controlled at the average value of the ice layer across the thickness.

2.3. Experimental Methods

2.3.1. Mechanical Tests

The loading test analysis was carried out on the ice material specimens selected from the reservoir at the same time and location every year (2013 to 2018). This paper mainly uses the experimental data of ice material mechanics from 2018 to conduct a comprehensive analysis of related theoretical, experimental, and numerical simulations. The mechanical experiment was carried out on a CSS-2250 electronic universal compression testing machine at 500 kN. The loading rate was automatically set by the testing machine (shown in Table 3). The experimental temperature was precisely controlled using a constant-temperature cold bath with an error of ±0.1 °C. The load sensor was calibrated at the experimental temperature twice, at the beginning and at the end of the experiment, to maintain the consistency of the results. Force and displacement signals were collected by a computer and processed automatically to create the experimental data.

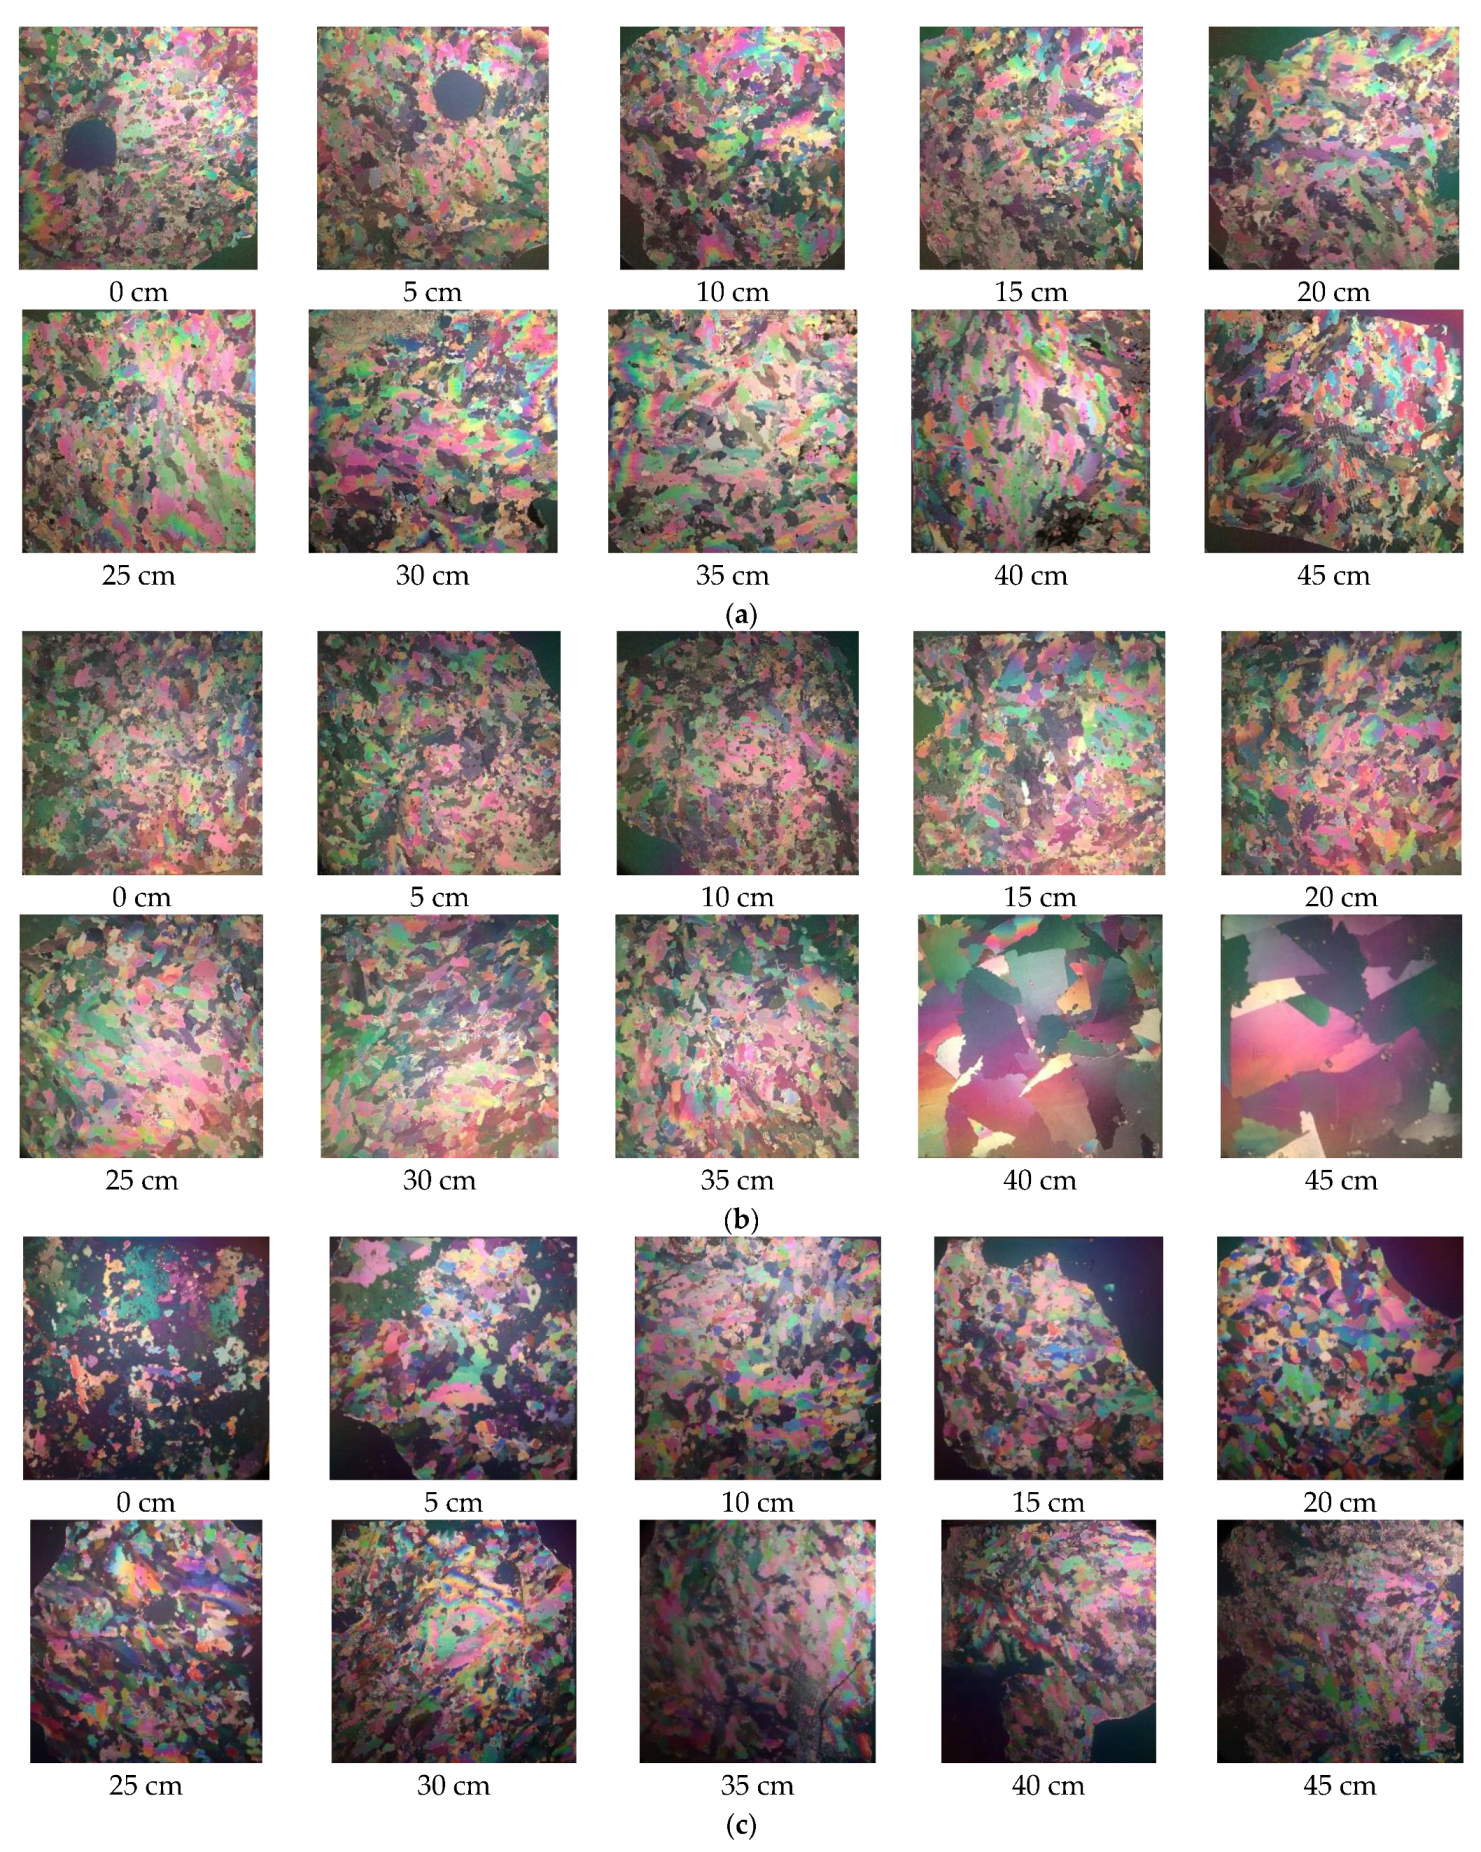
2.3.2. Ice Crystal Tests

After the slices were prepared, the ice sheets were subjected to crystal structure observations according to the commonly used Langway method [43,44]; that is, the thin ice sheets were placed under an orthogonal polarizing microscope, their position was adjusted, and the ice crystal structure became clearly visible. Then, on the sheet, a transparent ruler was placed on one side, and a high-pixel digital camera photo was taken. Finally, the observation of bubbles in the ice was carried out by means of data imaging.

2.3.3. Ice Fracture Simulation

Combined with the derivation of the comprehensive model of ice material fracture (considering the influence of meteorology, hydrology and geography on the material properties of ice), a numerical simulation was used to simulate the mechanical properties of ice materials, and the simulation results were compared with the actual test results. Finally, a fracture model of the new ice material was established.

3. Results and Discussion

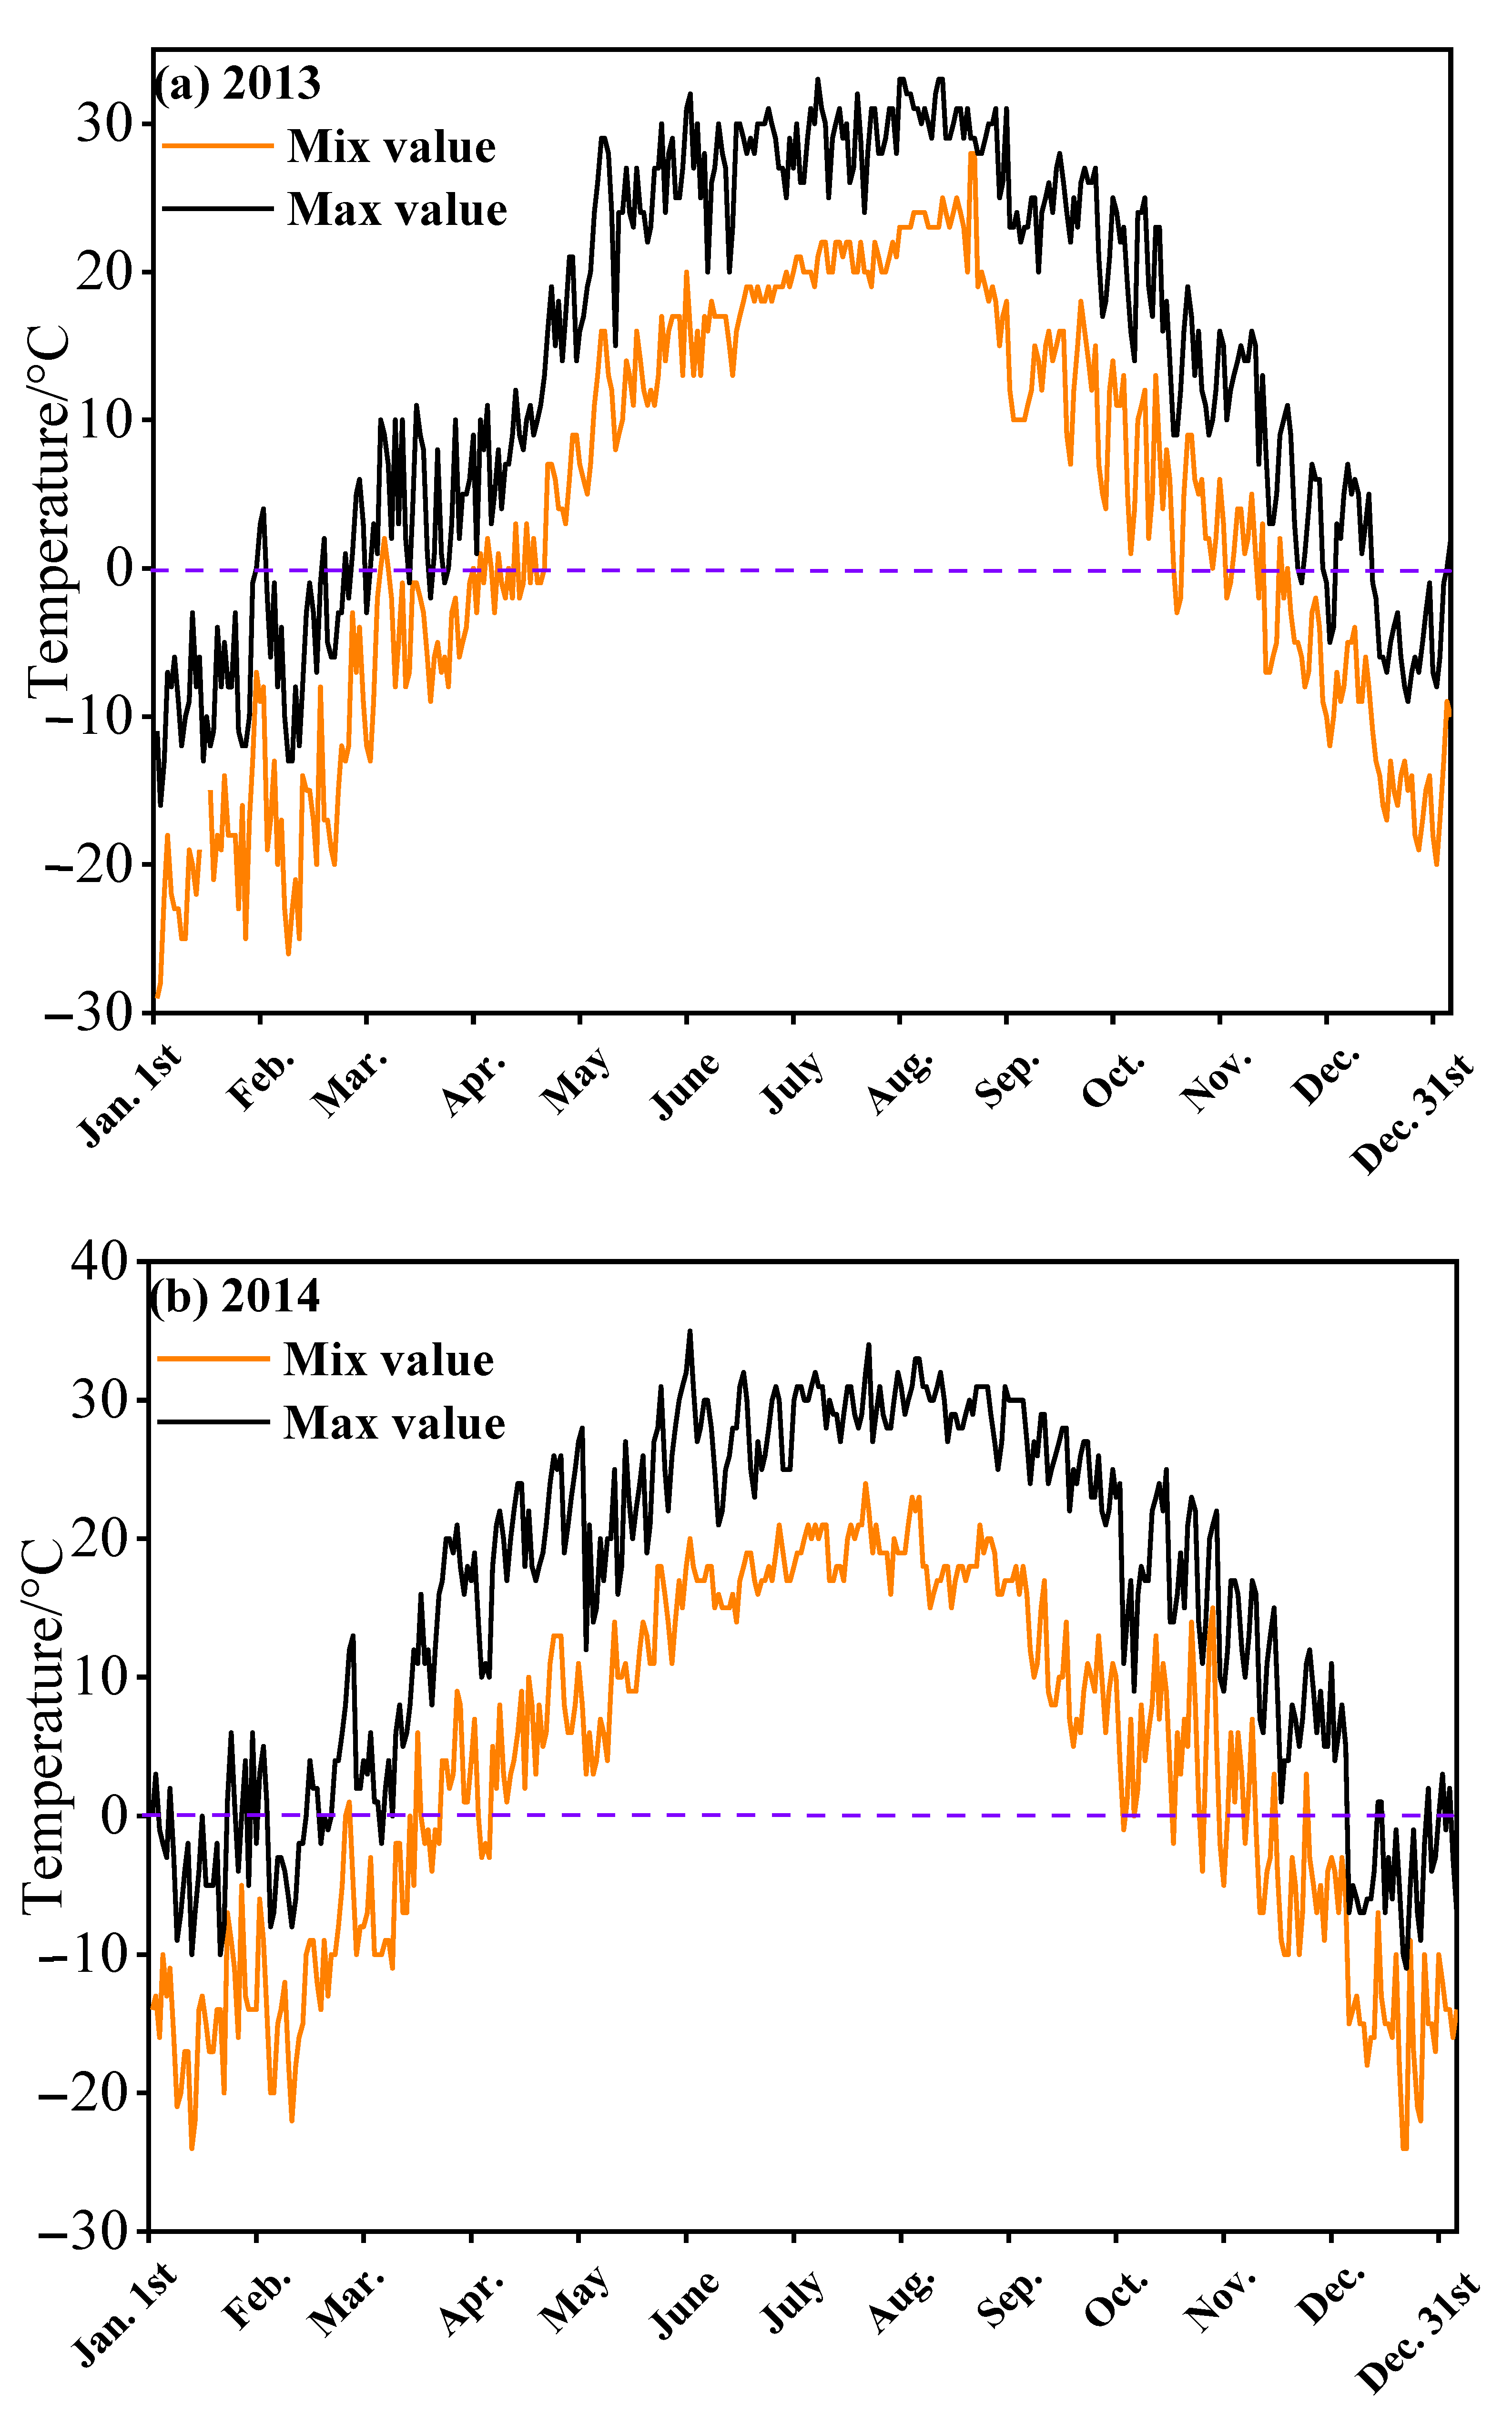
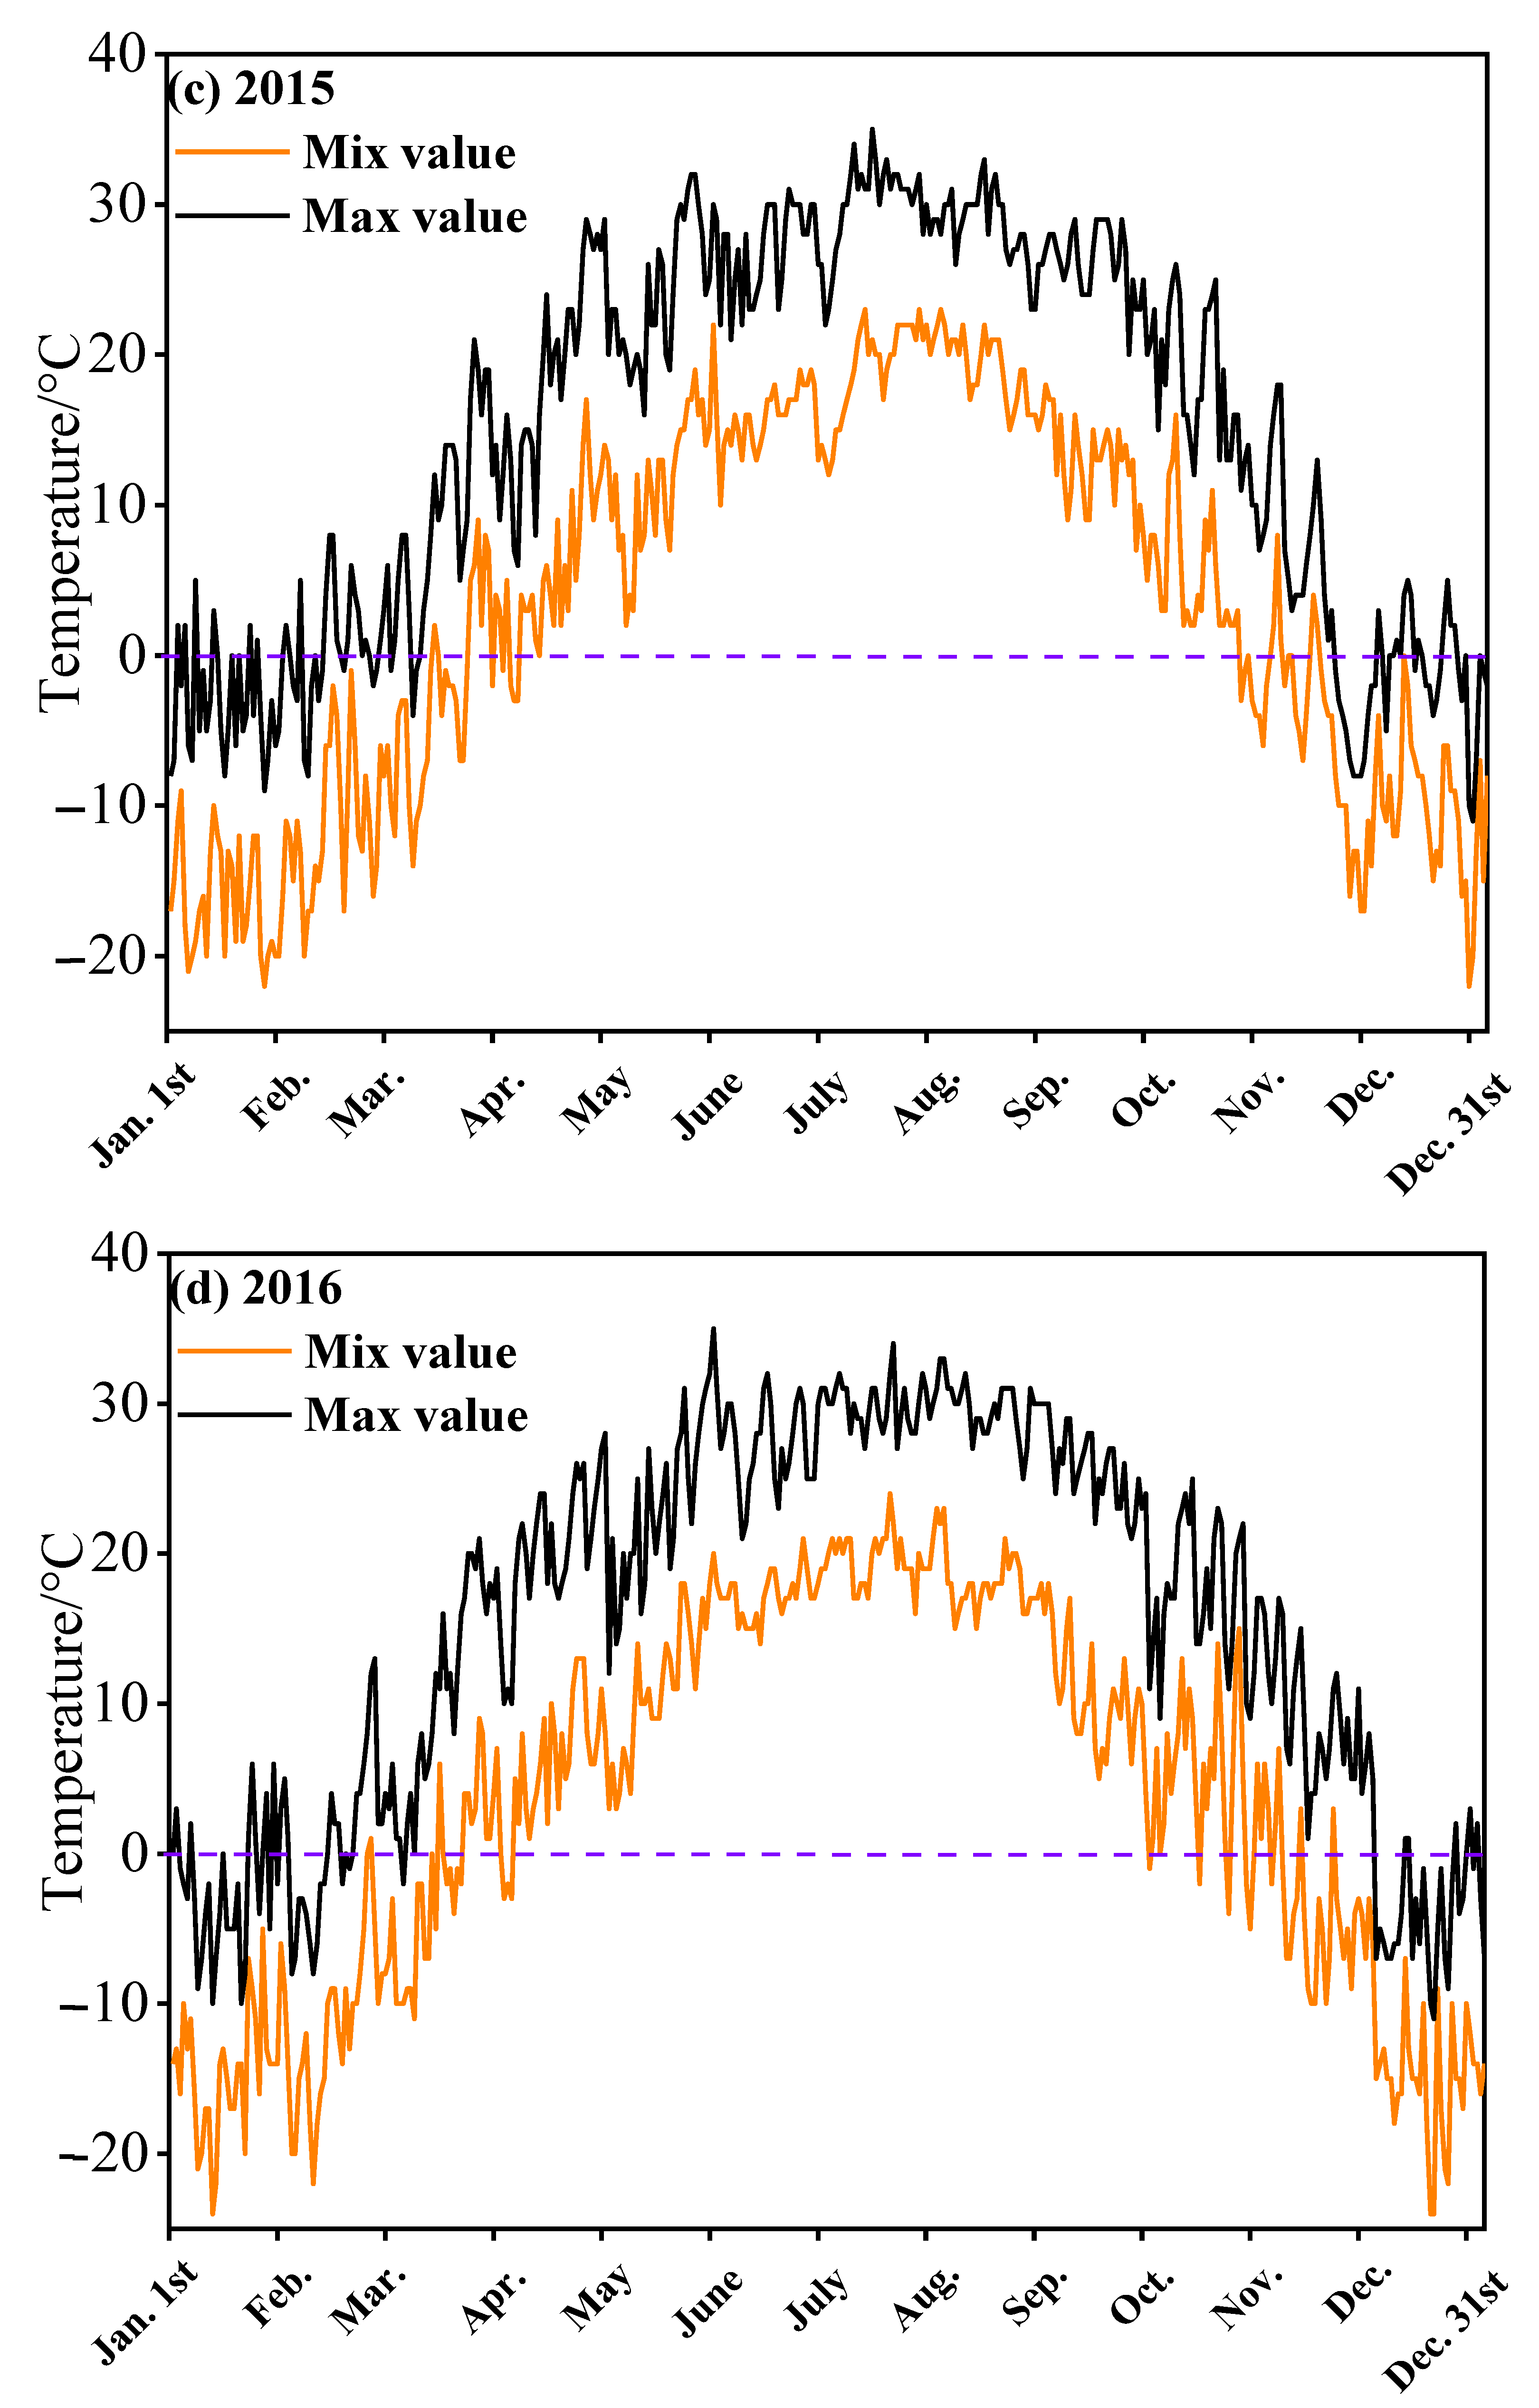
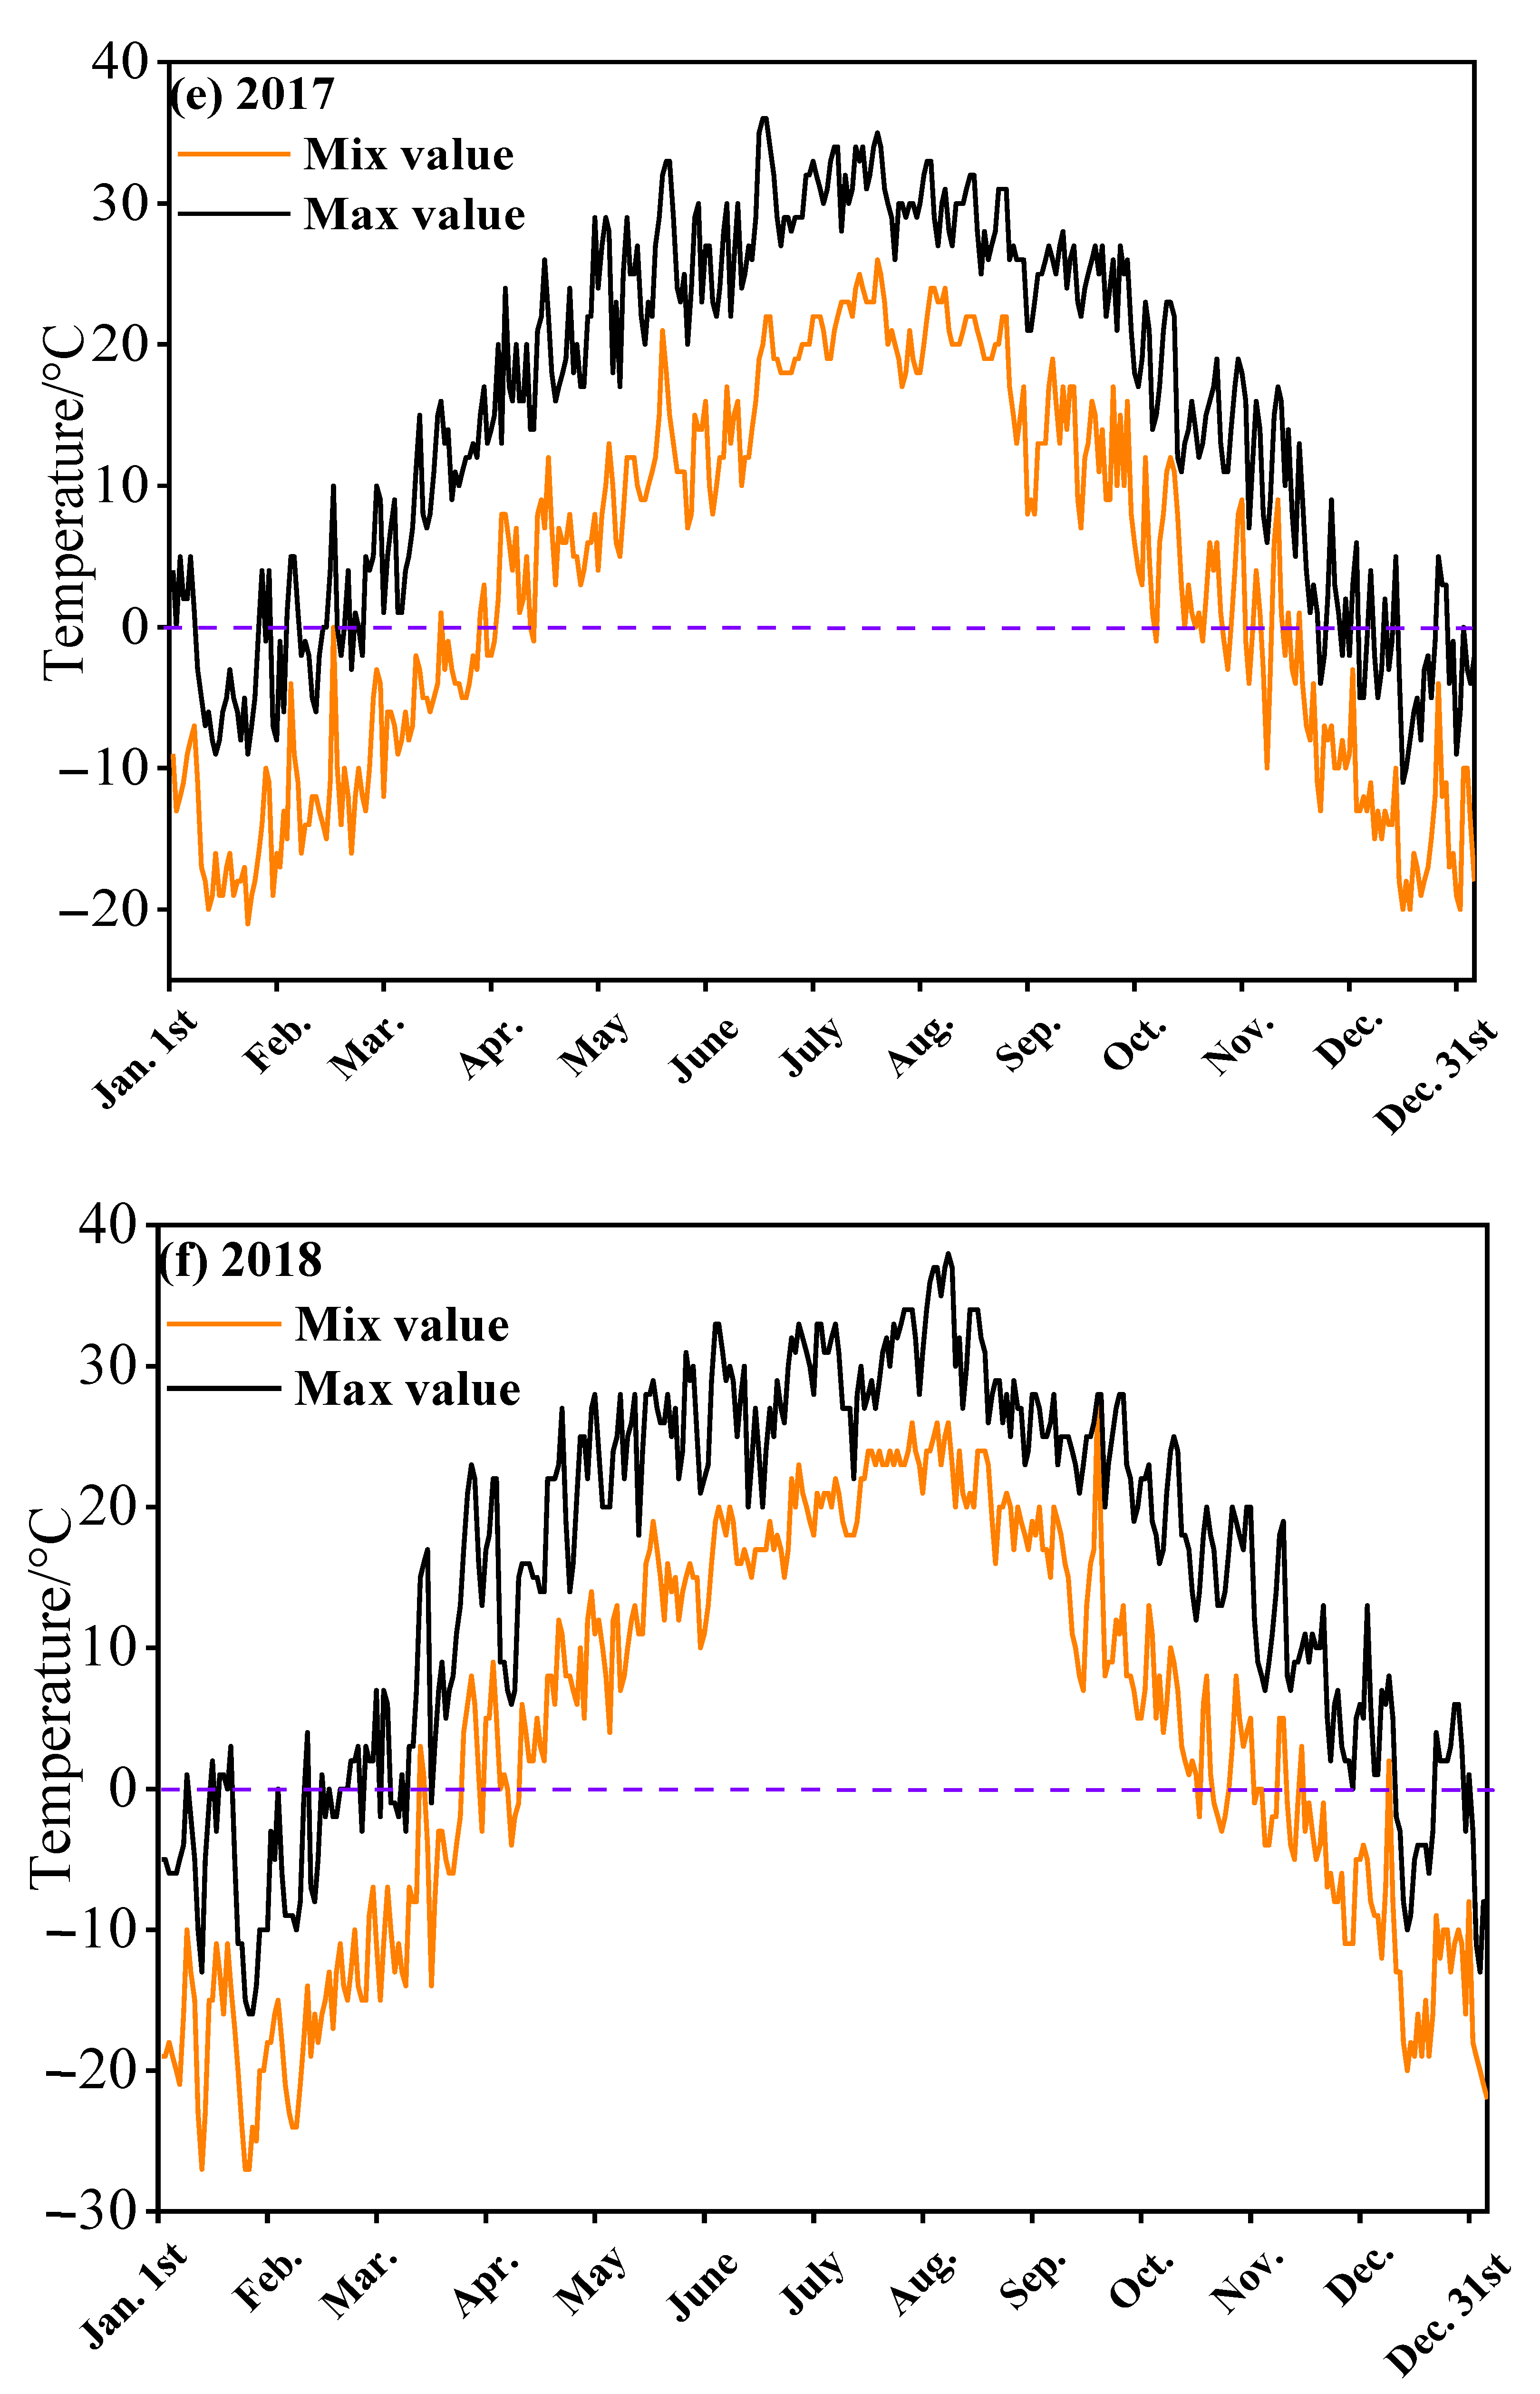
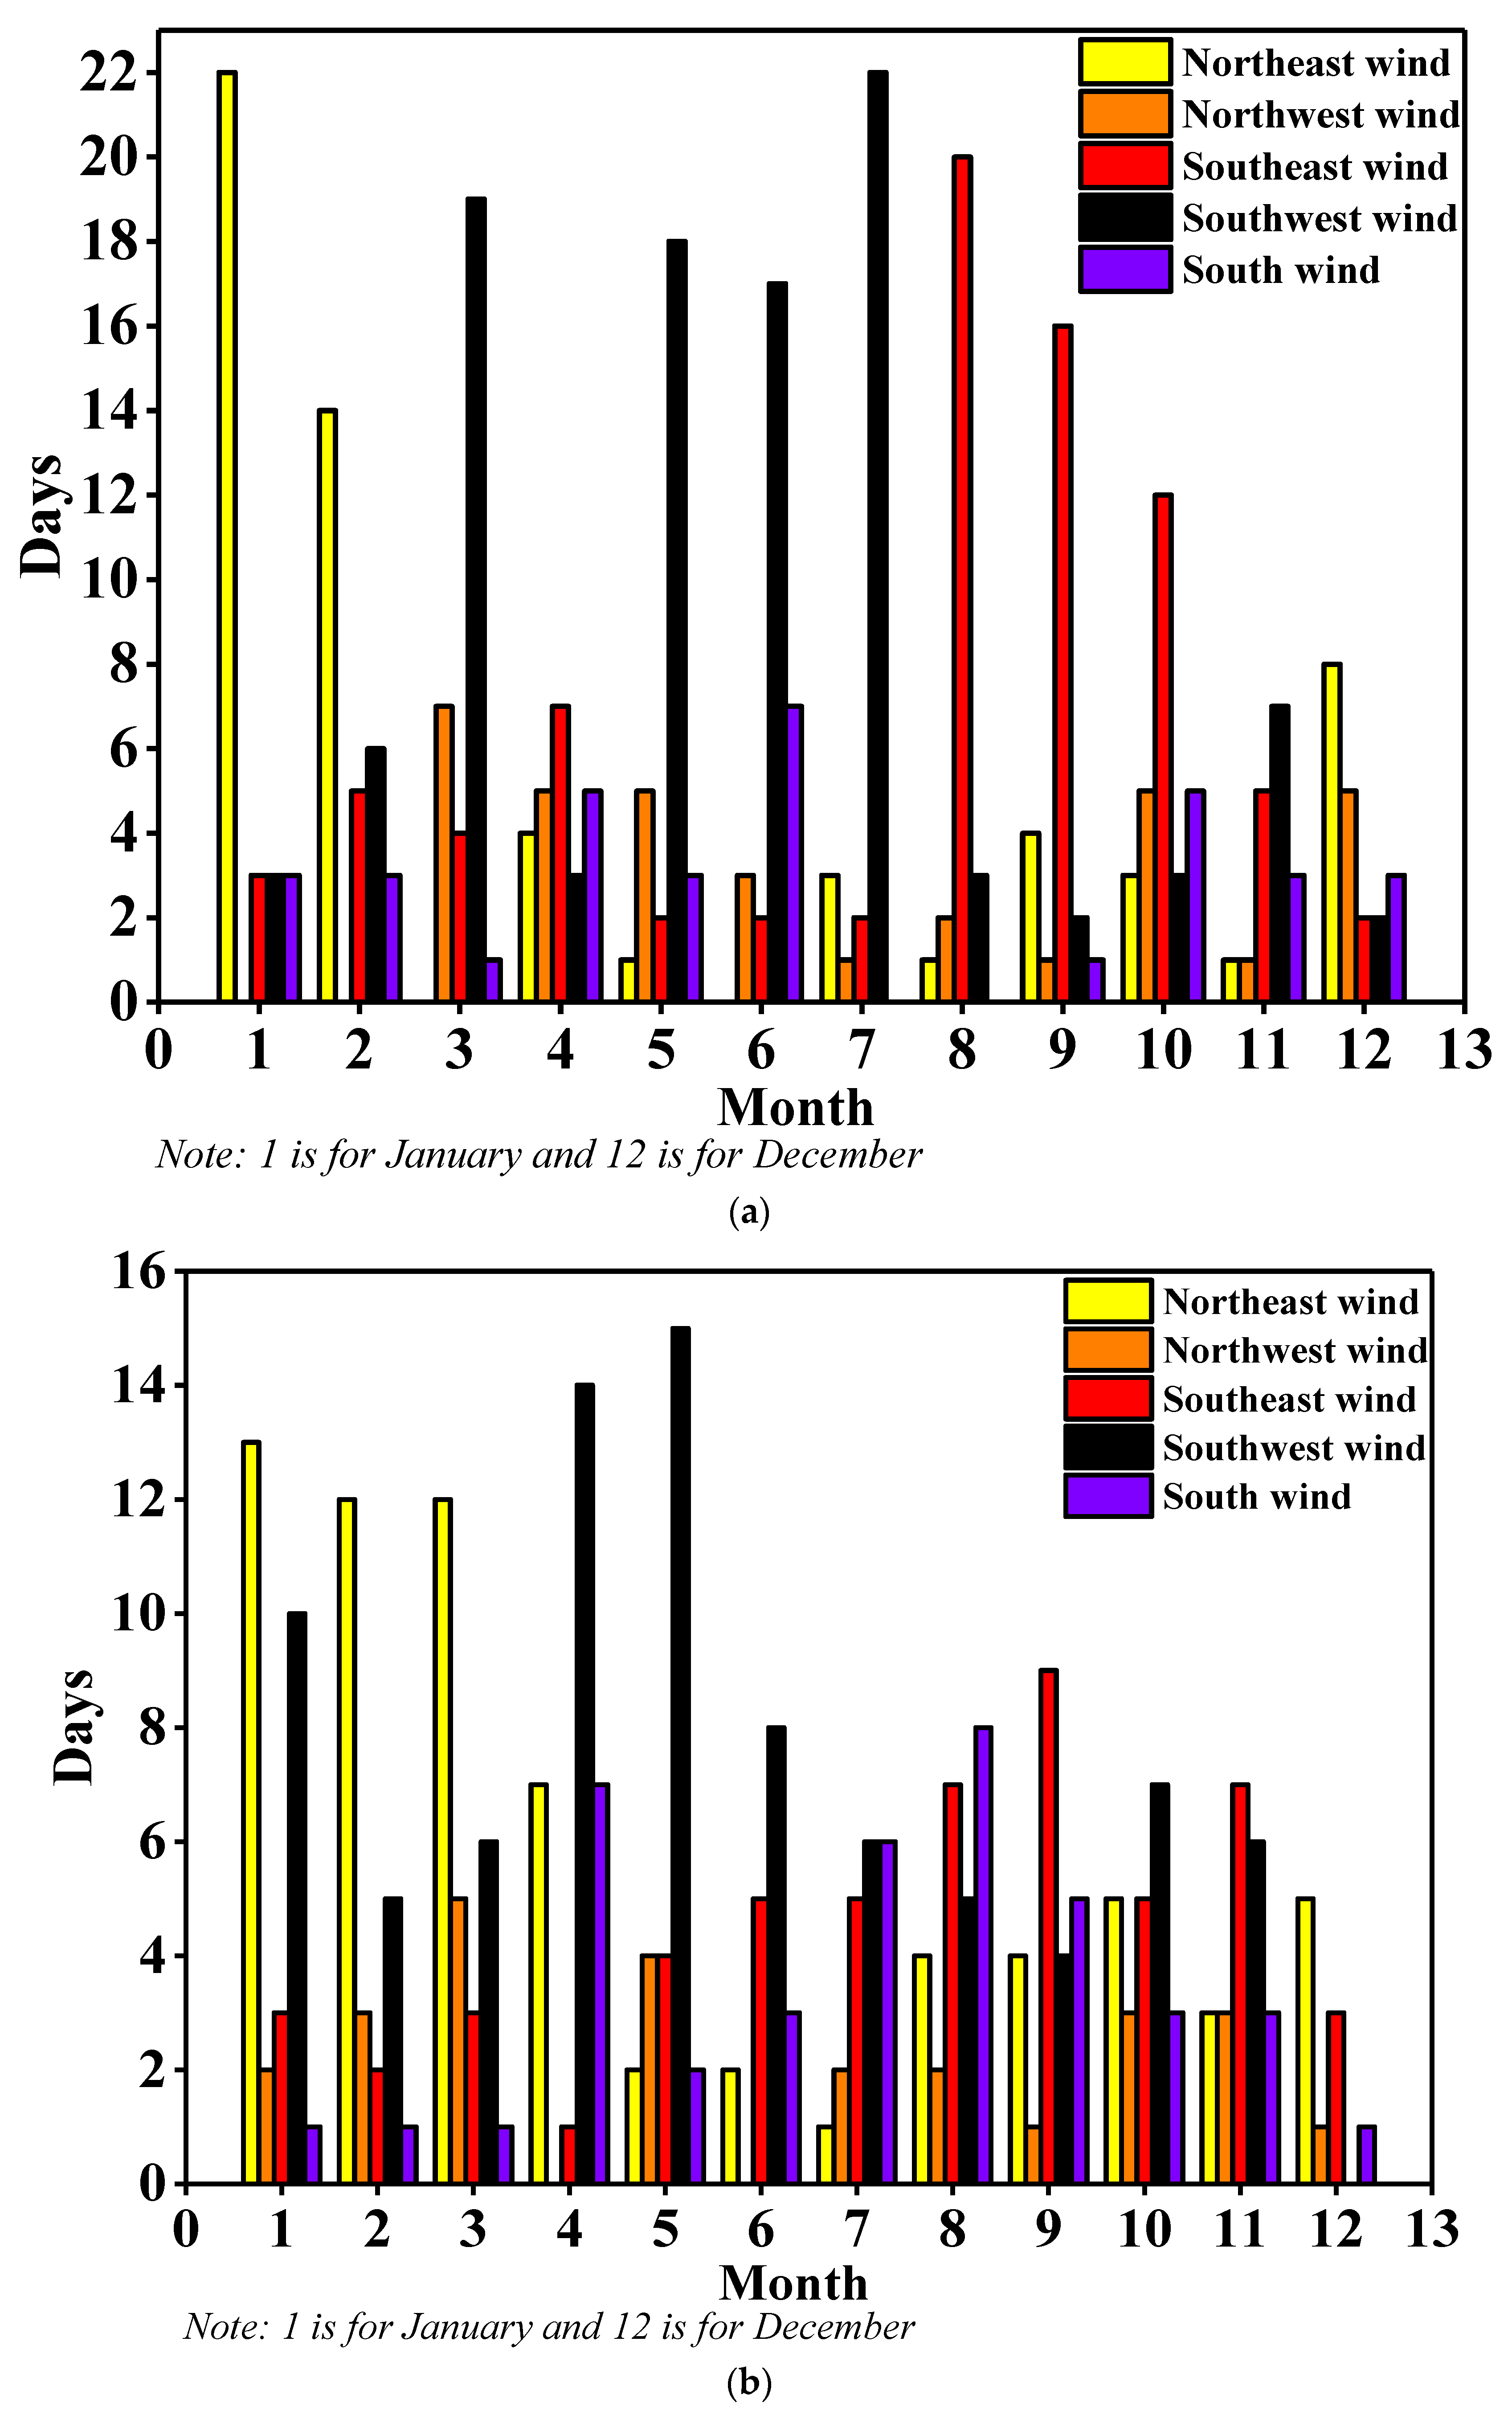
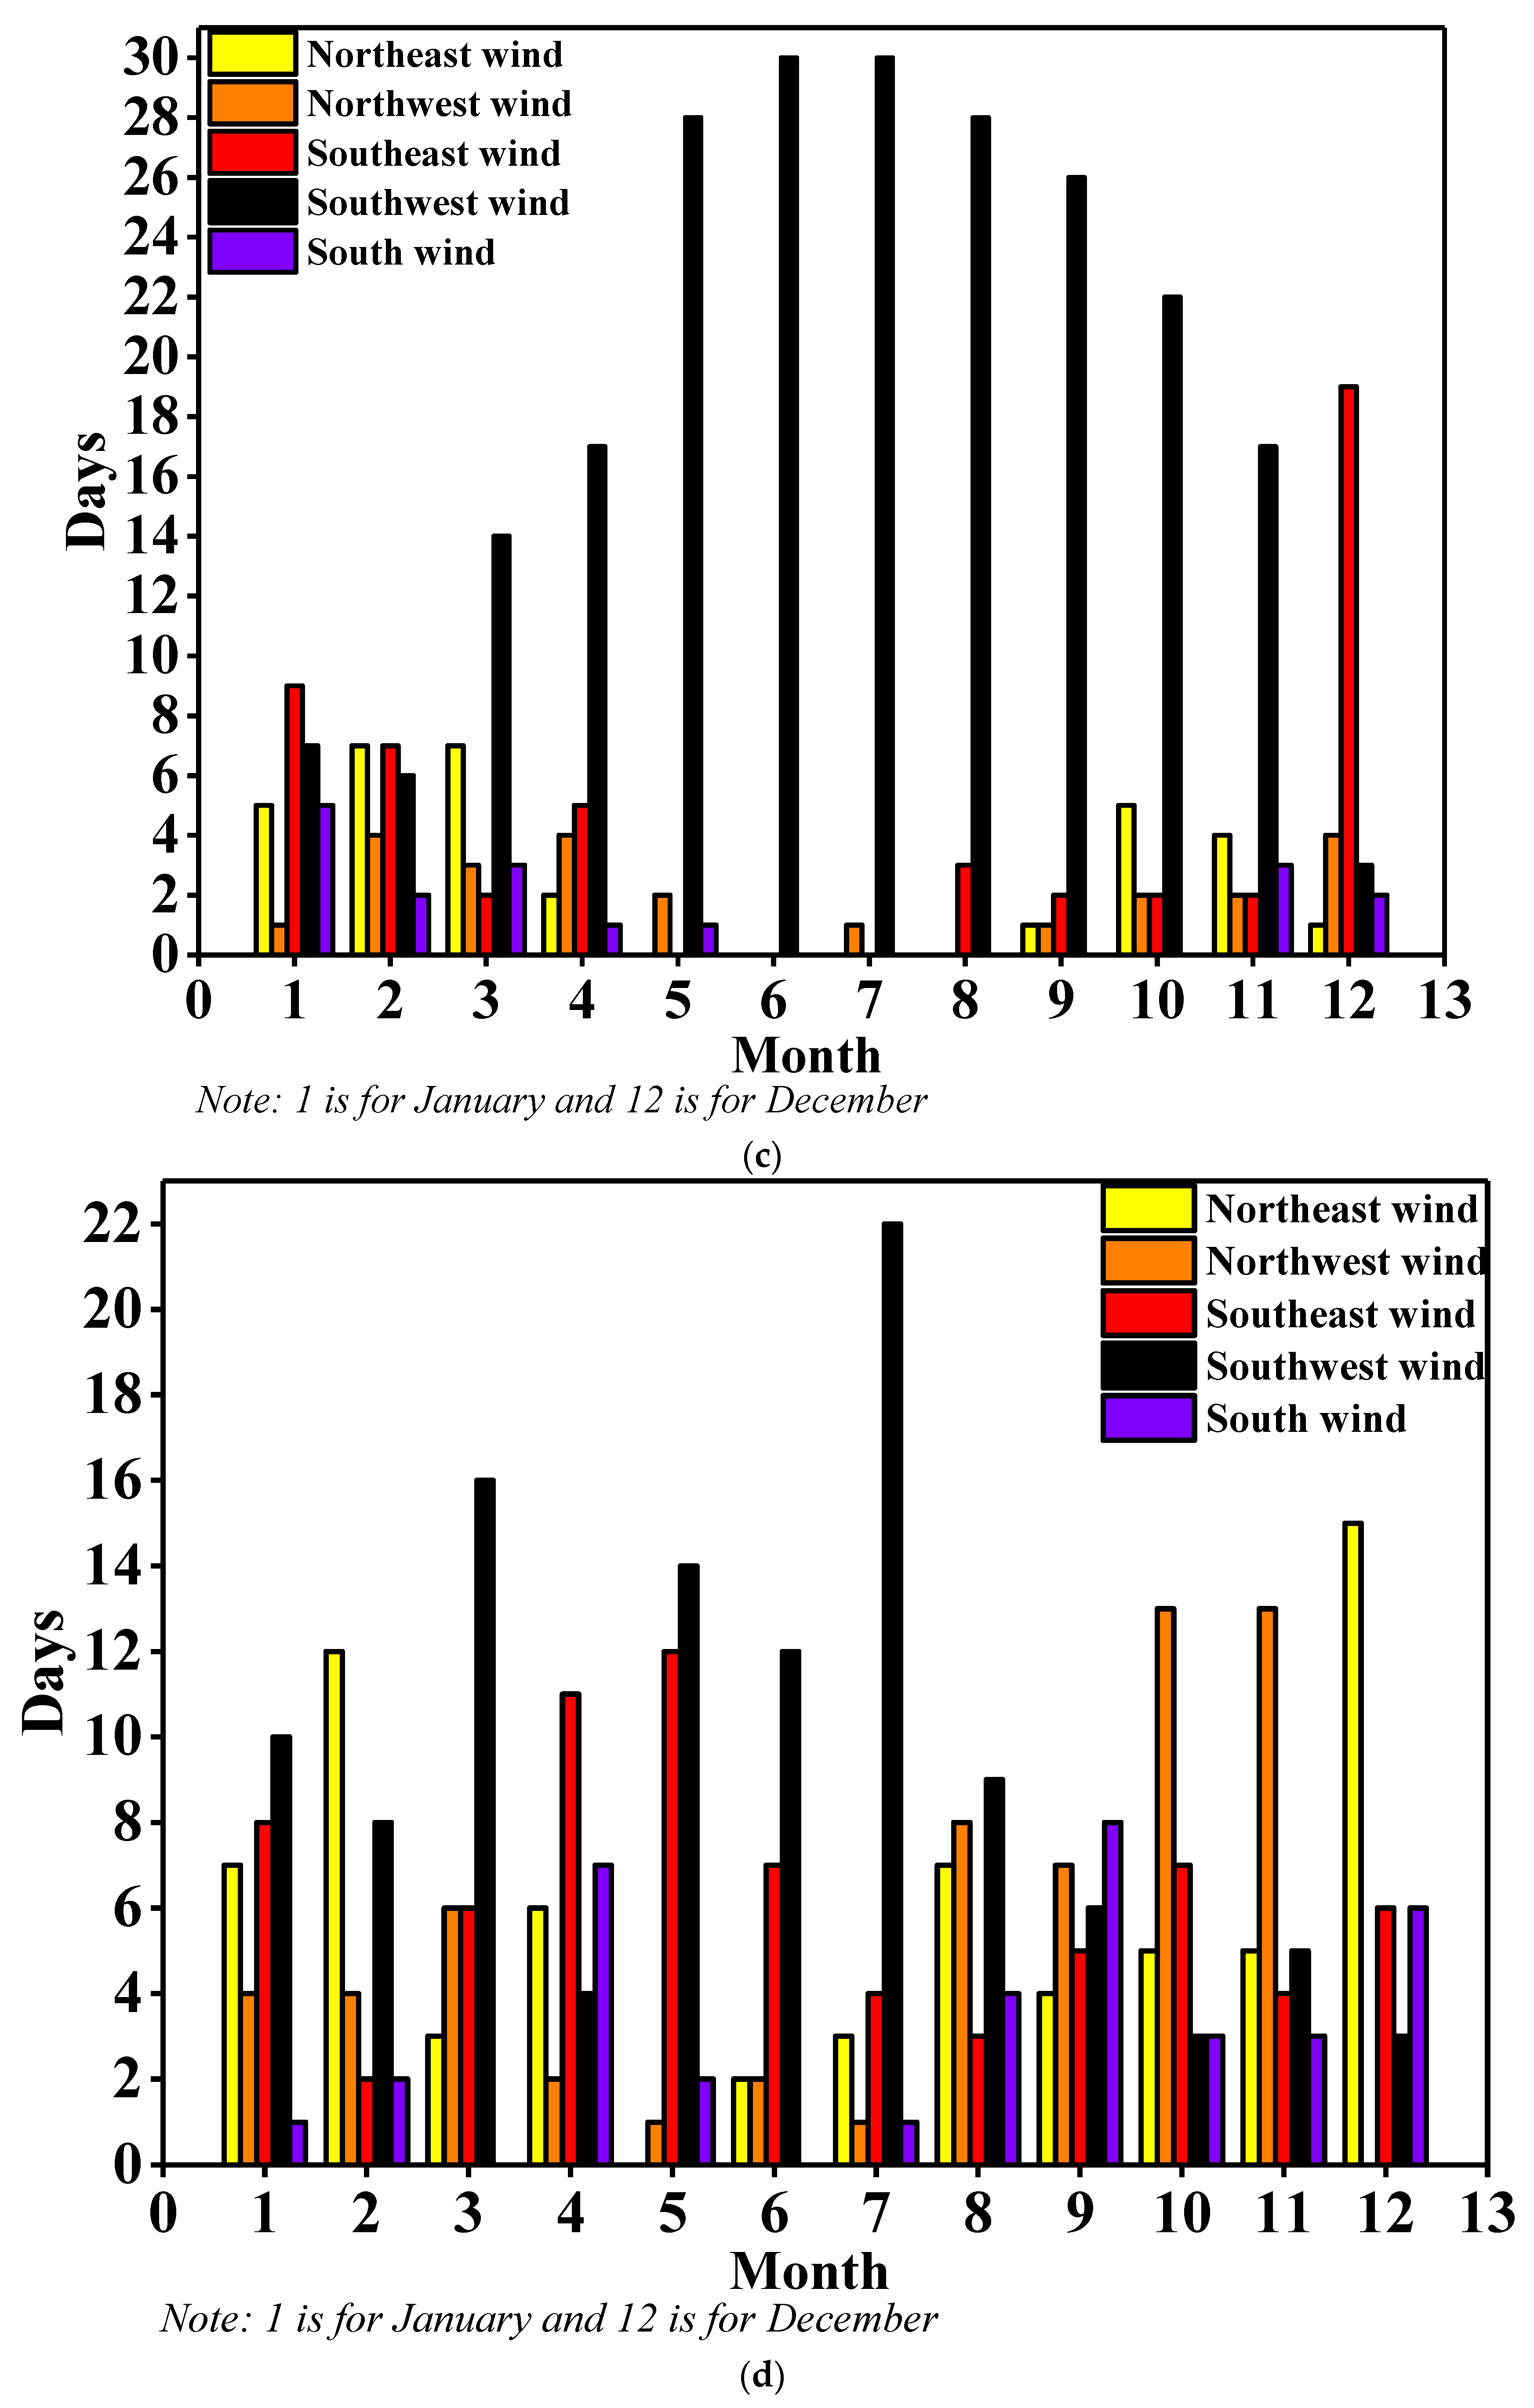
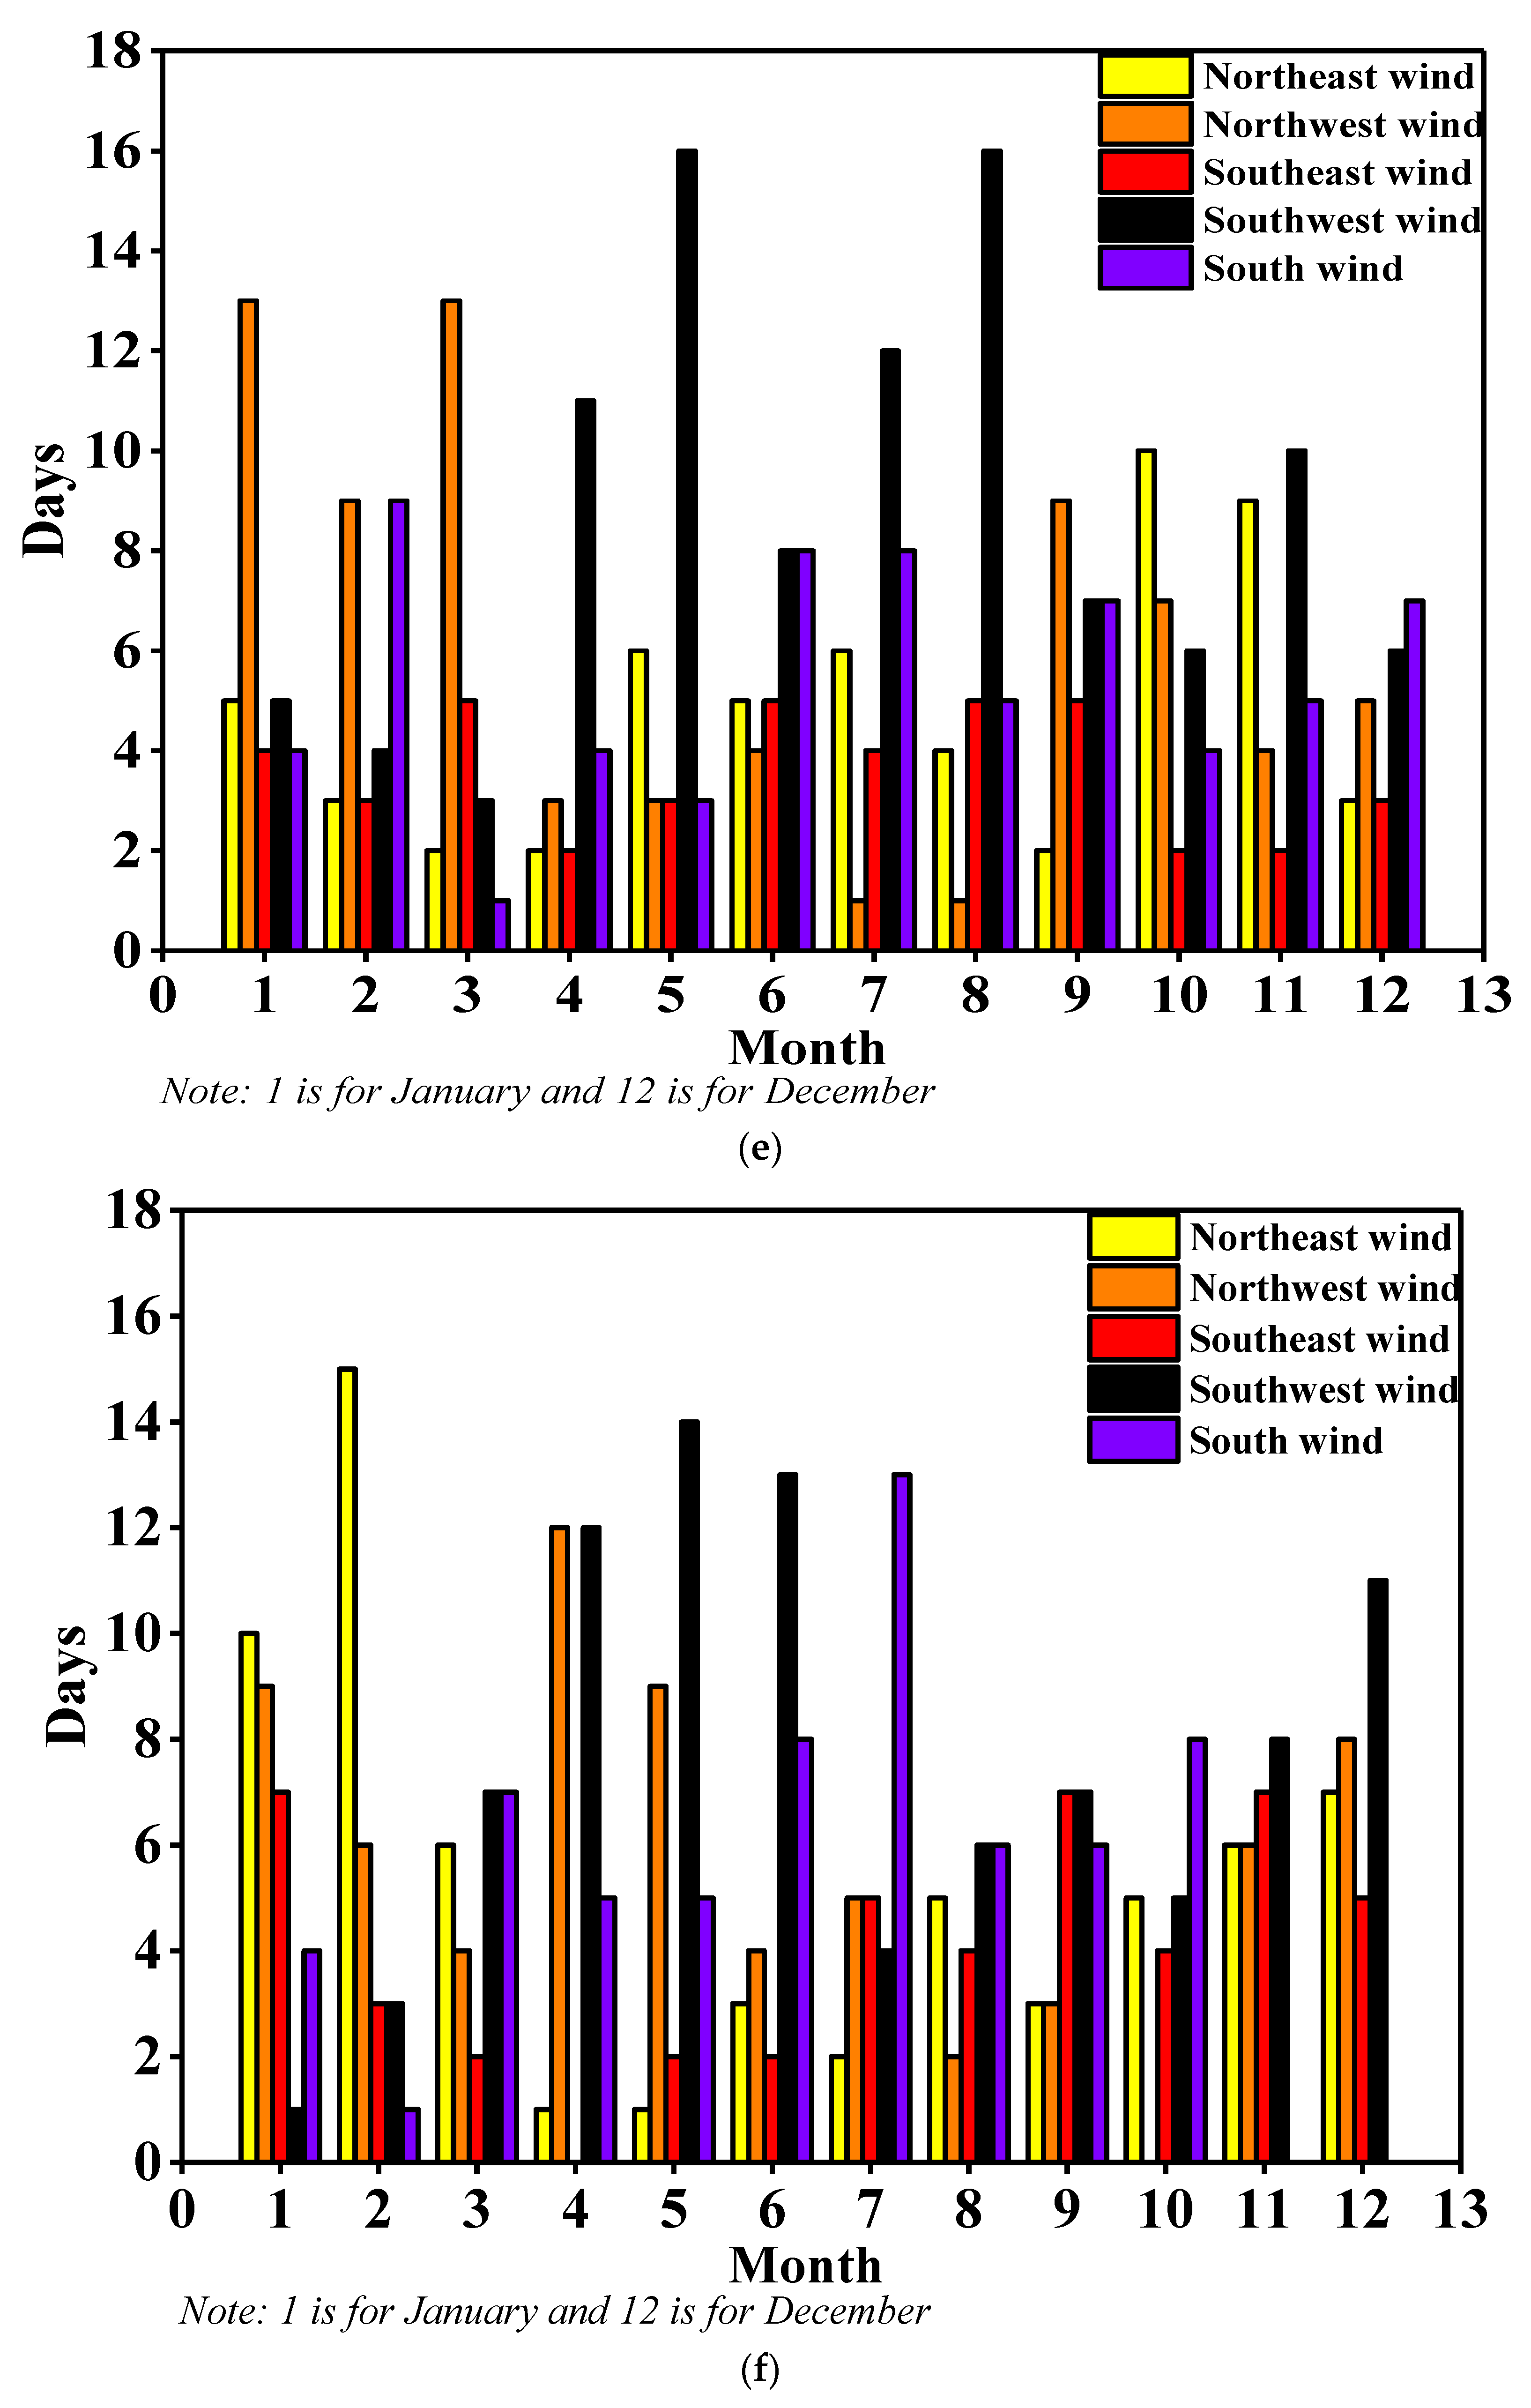
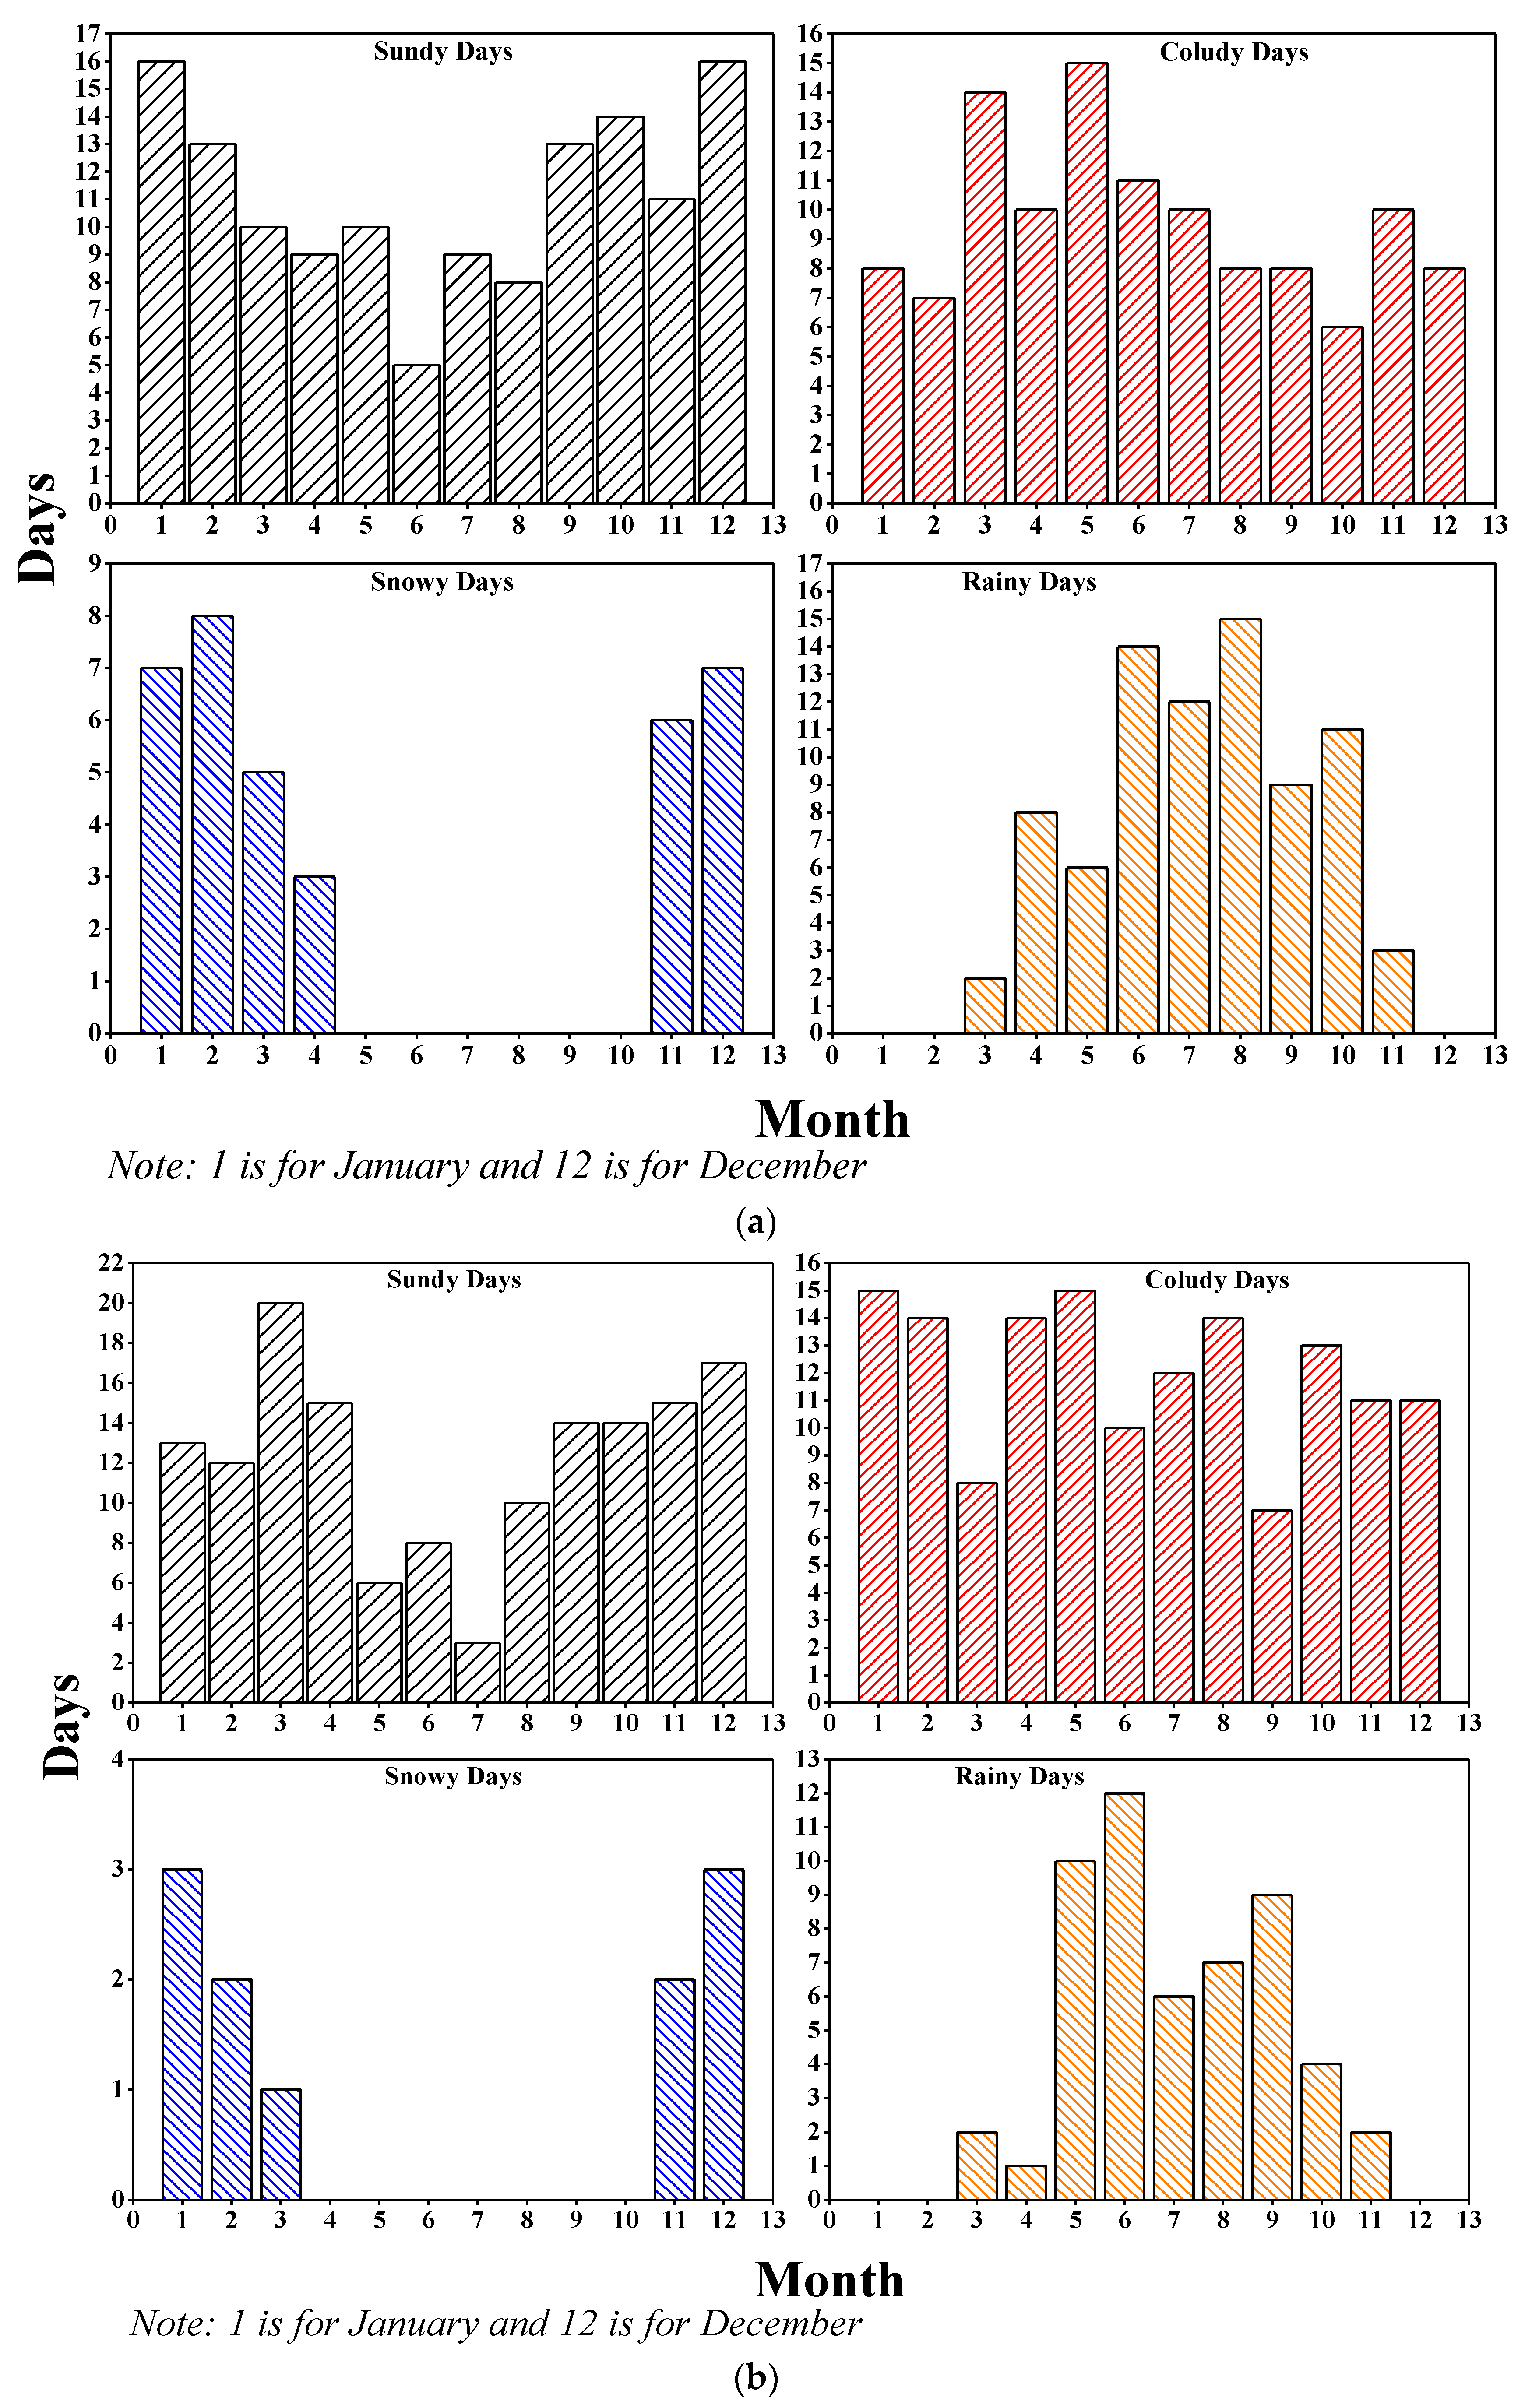
3.1. Analysis of Meteorological Changes

Meteorological changes have a crucial impact on the formation and mechanical properties of ice materials. Through the collection and statistics of long-term monitoring data, the meteorological change pattern of the Shifosi Reservoir for a period of many years can be obtained. The annual temperature changes, wind statistics, weather statistics and solar radiation statistics of the Shifosi Reservoir from 2013 to 2018 are shown in Figure 2, Figure 3, Figure 4 and Figure 5. The annual temperature change is shown in Figure 2. Our conclusions are as follows: (1) The freezing period of the Shifosi Reservoir is mainly concentrated from November to mid-March of the following year. (2) Due to ecological changes, the maximum temperature and the minimum temperature during the main freezing period have both increased significantly. (3) Especially in 2018, global warming caused the difference between the highest temperature and the lowest temperature in the Shifosi Reservoir area to decrease, and the freezing period was shortened by 13 days. Changes in the temperature also affect the change in the wind direction around the Shifosi Reservoir (shown in Figure 3). Before 2014, the main wind direction during the freezing period was northeast wind. However, the main wind directions during the freezing period between 2015 and 2018 were northwest and southwest winds. Changes in the wind direction will affect the pressure conditions around the reservoir during the freezing period, thereby changing the thickness of the ice on the reservoir [45,46].
At the same time, changes in temperature also cause changes in weather conditions (shown in Figure 4). The number of snowfall days gradually decreases, rainfall gradually increases, and rainy weather occurs even during the freezing period. Changes in rainfall and snowfall conditions affect the inflow of rivers upstream and downstream from the reservoir. The flow of water beneath the ice during the freezing period affects the thickness of the ice layer, the bubble content, and the stability of the ice layer [47,48,49]. Another important factor is the amount of ice that evaporates. The intensity of solar radiation is affected by changes in weather conditions within the reservoir. The results of solar radiation monitoring in the Shifosi Reservoir area from 2013 to 2018 (Figure 5) show that (1) due to changing weather conditions, especially changes in the number of cloudy, snowy or rainy days, the average amount of radiation during the freezing period showed a slight increase year to year; (2) during the critical November and December periods that affect freezing, the amount of radiation during the freezing period was high in both 2015 and 2017. This was due to the increase in the number of sunny days during those two years and to the significant change in the maximum temperature difference.
The mechanical properties of ice materials are closely related to their ice and bubble distribution densities. Meteorological changes directly affect ice and bubble densities. Therefore, the weather influence coefficient of the ice and bubble densities were established as in [50,51,52]:
t i = t 0 × ( 1 + K meteorological )
P i = P 0 × ( 1 + K meteorological )
K meteorological = [ i ( M a x M i n ) ] T [ 0 ( M a x M i n ) ] T + [ Snowy   day ] i N [ Snowy   day ] 0 N [ Rain   day ] i N [ Rain   day ] 0 N [ Radiation   of   the   sun ] i [ Radiation   of   the   sun ] 0 + [ Main   wind   direction ] i N × v i m a i n w i n d s p e e d ¯ [ Main   wind   direction ] 0 N × v 0 m a i n w i n d s p e e d ¯
where t i is the ice density, t 0 is the initial ice density, P i is the bubble distribution density, P 0 is the initial bubble distribution density, K meteorological is the meteorological influence coefficient, [ i ( M a x M i n ) ] T is the temperature difference in the freezing period, [ 0 ( M a x M i n ) ] T is the initial temperature difference in the freezing period, [ Snowy   day ] i N , [ Rain   day ] i N are the meteorological days and [ Snowy   day ] 0 N , [ Rain   day ] 0 N are the initial meteorological days in the freezing period.

3.2. Analysis of the Hydrological Environment

The freezing process of ice is inseparable from the influence of water. The action of water flow leads to a stratified distribution of ice density and the uneven distribution of bubbles during the forming process [53,54,55]. The hydrological data of the Shifosi Reservoir are shown in Figure 6, Figure 7 and Figure 8. As the ambient temperature rose, the amount of sunlight radiation and rainfall in the monitored area changed, resulting in a decreasing trend in the upstream and downstream areas of the Shifosi Reservoir. During the initial preparation period of the reservoir freezing (at the end of October each year), the reservoir water flow even reached its highest peak. However, significant changes in water flow did not cause changes in the water levels within the reservoir. This is because the weather changes led to a shortened rainy season in the region, an increase in overall temperature and a decrease in rainfall. An ecological self-balancing in the reservoir was thus effected.
The water flowing in the reservoir affects the forming characteristics of the ice material during the initial stages of freezing, ice formation and ice melting. In summary, the calculation equation for the variation of the ice and bubble densities in ice, which considers environmental and hydrological changes, is determined as:
t M , H i = t M , H 0 × ( 1 + K meteorological + K hydrological )
P M , H i = P M , H 0 × ( 1 + K meteorological + K hydrological )
K hydrological = [ Water   level ] i [ Water   level ] 0 + [ Water   flow ] i I c e [ Water   flow ] 0 I c e + [ Rainfall ] i [ Rainfall ] 0 [ 1 Evaporation ] i [ 1 Evaporation ] 0
where t M , H i is the comprehensive calculation model of the ice density, P M , H i is the comprehensive calculation model of the bubble distribution density and K hydrological is the hydrological change influence coefficient.

3.3. Analysis of the Internal Structure of Ice Materials

Changes in the environment affect the freezing process of the ice material, resulting in changes to the internal structure of the ice. The internal structural changes of ice directly affect the changes in the mechanical properties of ice materials. In this paper, the ice crystal structure type, ice crystal size, ice density, bubble density and clay content of Shifosi Reservoir ice from 2013 to 2018 were analysed. Simultaneously, optimised models of the ice material thickness and bubble distribution were obtained by comparing theoretical calculation models with experimental data.

3.3.1. Analysis of the Ice Crystal Structure

The ice crystal structure at different depth layers at the same sampling point in different years is shown in Figure 9. The results show that (1) the ice crystal structure in the ice layers at different depths in the reservoir is obviously different, which is mainly manifested by the alternating granular ice and columnar ice types. (2) From 2013 to 2014, when the vertical depth is 0–20 cm, the results mainly show that some granular ice is embedded in the columnar ice, a depth of 20–35 cm shows a columnal ice structure, and granular ice structure is observed at 35–45 cm. From 2015 to 2018, when the vertical depth is 0–20 cm, the results show a columnar ice structure, a depth of 20–35 cm shows a granular ice structure, a depth of 35–45 cm shows a columnar ice structure, but fine grains appear at the 34–38 cm horizontal layer belt. (3) The ice crystal structure diagram shows the form of granular ice embedded in columnar ice. This is due to the rapid freezing of the frost flowers and drift ice at the intersection of the broken ice rows, which forms layers of granular ice. The morphology of the horizontal layers with small grains, as shown in the ice crystal structure diagram, can reflect changes in the freezing rate caused by sudden changes in external conditions. (4) The frozen ice environment in this area is unstable due to the interference of the climate and the water flow, resulting in obvious differences in the structure of the ice crystals in the ice layers at different locations. In the early stage of ice growth, the temperature gradient in the ice is large, the growth rate of the ice crystals is fast, the long axes of the ice crystals are randomly distributed in the vertical plane, and the ice crystals are disordered. (5) Environmental disturbances and hydrodynamic conditions are the main factors controlling the freezing process. The ice crystal structure here manifests mainly as a granular ice structure. After the continuous ice layer is formed, the temperature in the ice layer gradually stabilises, and the ice growth rate begins to decrease. The growth direction of the ice crystals grows fastest in the direction parallel to the direction of thermal conduction compared to that of other directions. At this time, environmental interference and heat conduction are the main factors controlling the freezing process. Granular ice crystals gradually transition to columnar ice. If the ice grows under thermodynamic conditions, due to the dynamic action of the river, the ice layers squeeze and overlap each other, and the ice crystals will be inclined, appearing as columnar ice inclined into the granular ice.

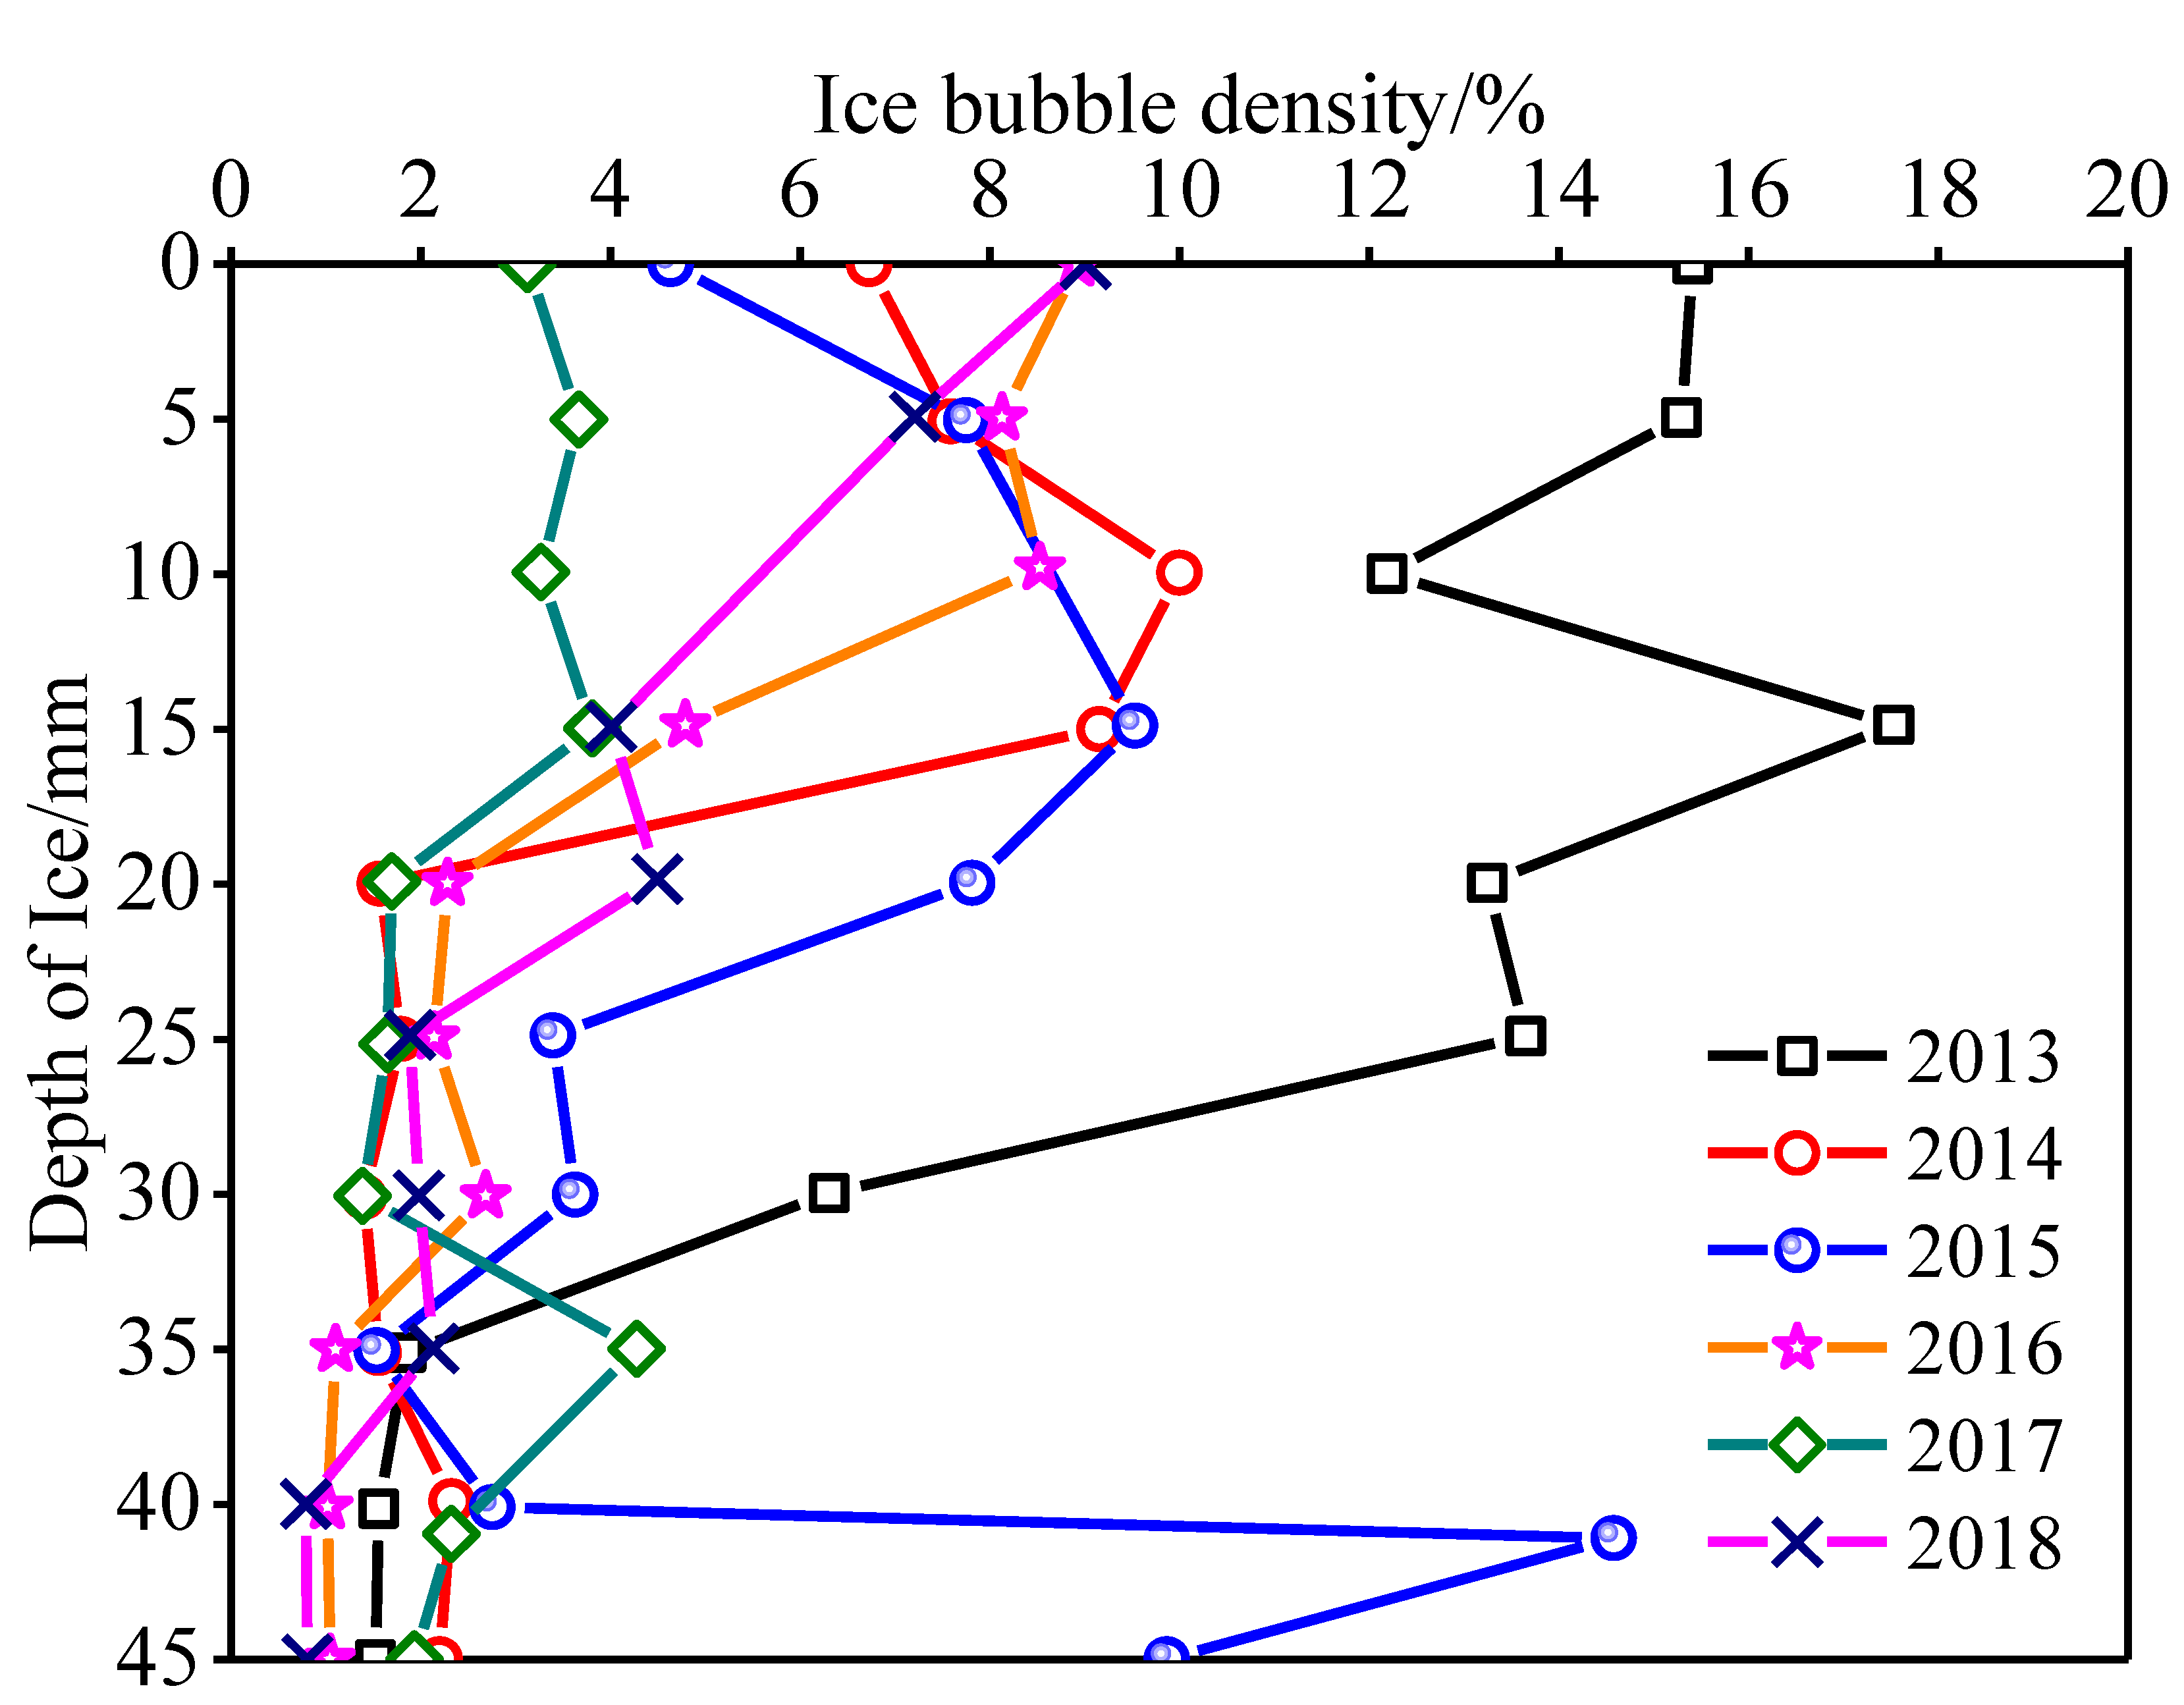
3.3.2. Bubble Density of the Ice Structure

The Shifosi Reservoir is a large-scale wetland reservoir with a complex geological structure, rich with compounds in the inner wall of the formation and with an inevitable release of gas from the formation. The reservoir area also contains a large area of lotuses, reeds, and pampas grass, and plant respiration also releases gas. Therefore, there are two main sources of air bubbles in the ice. The first cause is that during the initial stage of freezing, the water surface envelops the gas in the water due to the severe disturbance of wind and waves. When the temperature gradient greatly changes, the air bubbles cannot be discharged before freezing. Therefore, air bubbles are quickly frozen in the surface ice. The second cause is that during the process of ice growth, plants in the water body release gas due to biological effects, and because the gas cannot be discharged in full before freezing, the gas is in embedded in ice crystals to form bubbles.
Bubble image processing was performed on horizontal ice crystal flakes taken under natural light, and statistical data on the bubble density of the ice crystal flakes were obtained (Figure 10). Shifosi Reservoir’s ice bubble content ranges from 0.4% to 2.0%. The overall trend is that bubble content in ice decreases with increasing depth. The total percentage of bubbles in ice gradually increases, but the bubble content at 0–10 cm varies widely and produces disordered and irregular distributions. This is because the environment has an important influence on the internal structure of ice materials, especially on the distribution of the internal structure of surface ice and the evolution characteristics of ice crystal nucleation. The equivalent diameter of bubbles in ice varies from 0.1 to 0.2 mm. The equivalent diameter of bubbles first increases in the depth direction and then gradually decreases with increasing depth. Meanwhile, the range of the bubble content in ice in the 0–10 cm layer is large, and the equivalent particle size of the ice tends to increase gradually. This is mainly because, at the beginning of freezing, as the temperature gradually decreases, the water surface temperature also gradually decreases below the freezing point. At this time, the water begins to freeze rapidly, and the growth rate of ice is fast. The air bubbles generated by the intense disturbance of the wind and current and the gas generated by plant respiration cannot be discharged in time and are frozen in the ice. Therefore, the ice surface layer contains a large number of bubbles. Once the ice cap is formed, the bubbles are more difficult to discharge. At this time, bubbles with a larger diameter gradually begin to form.

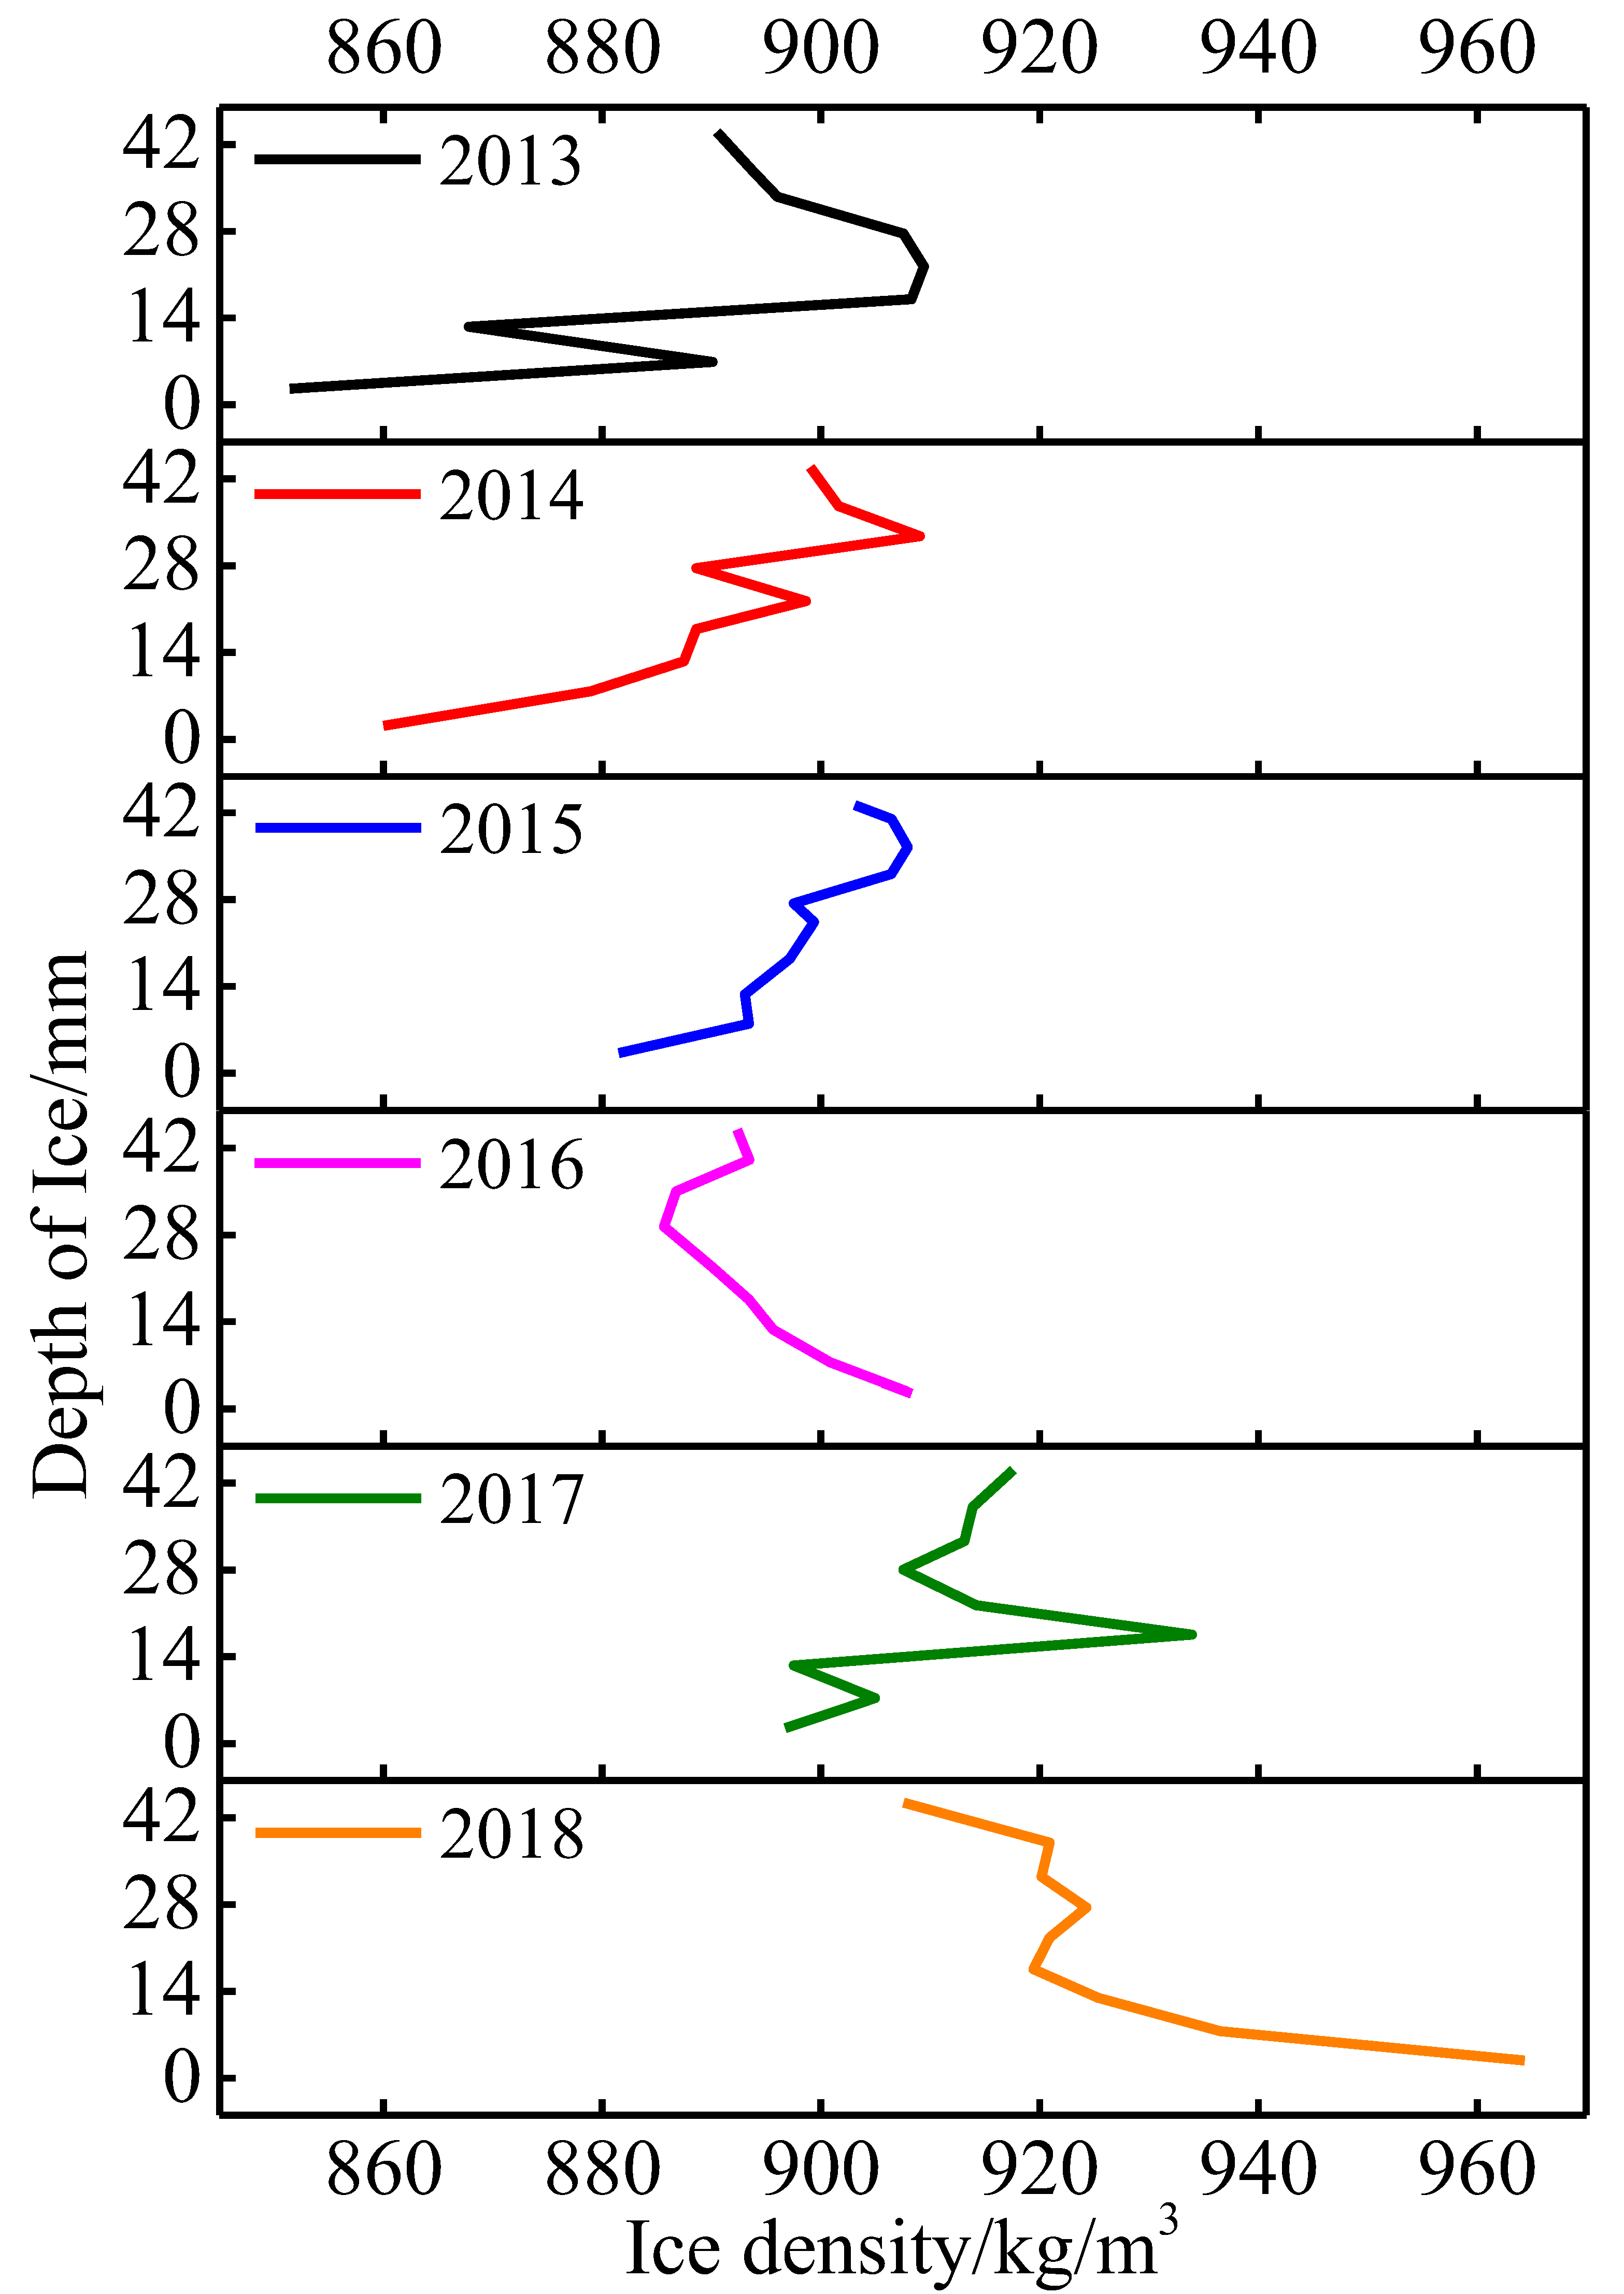
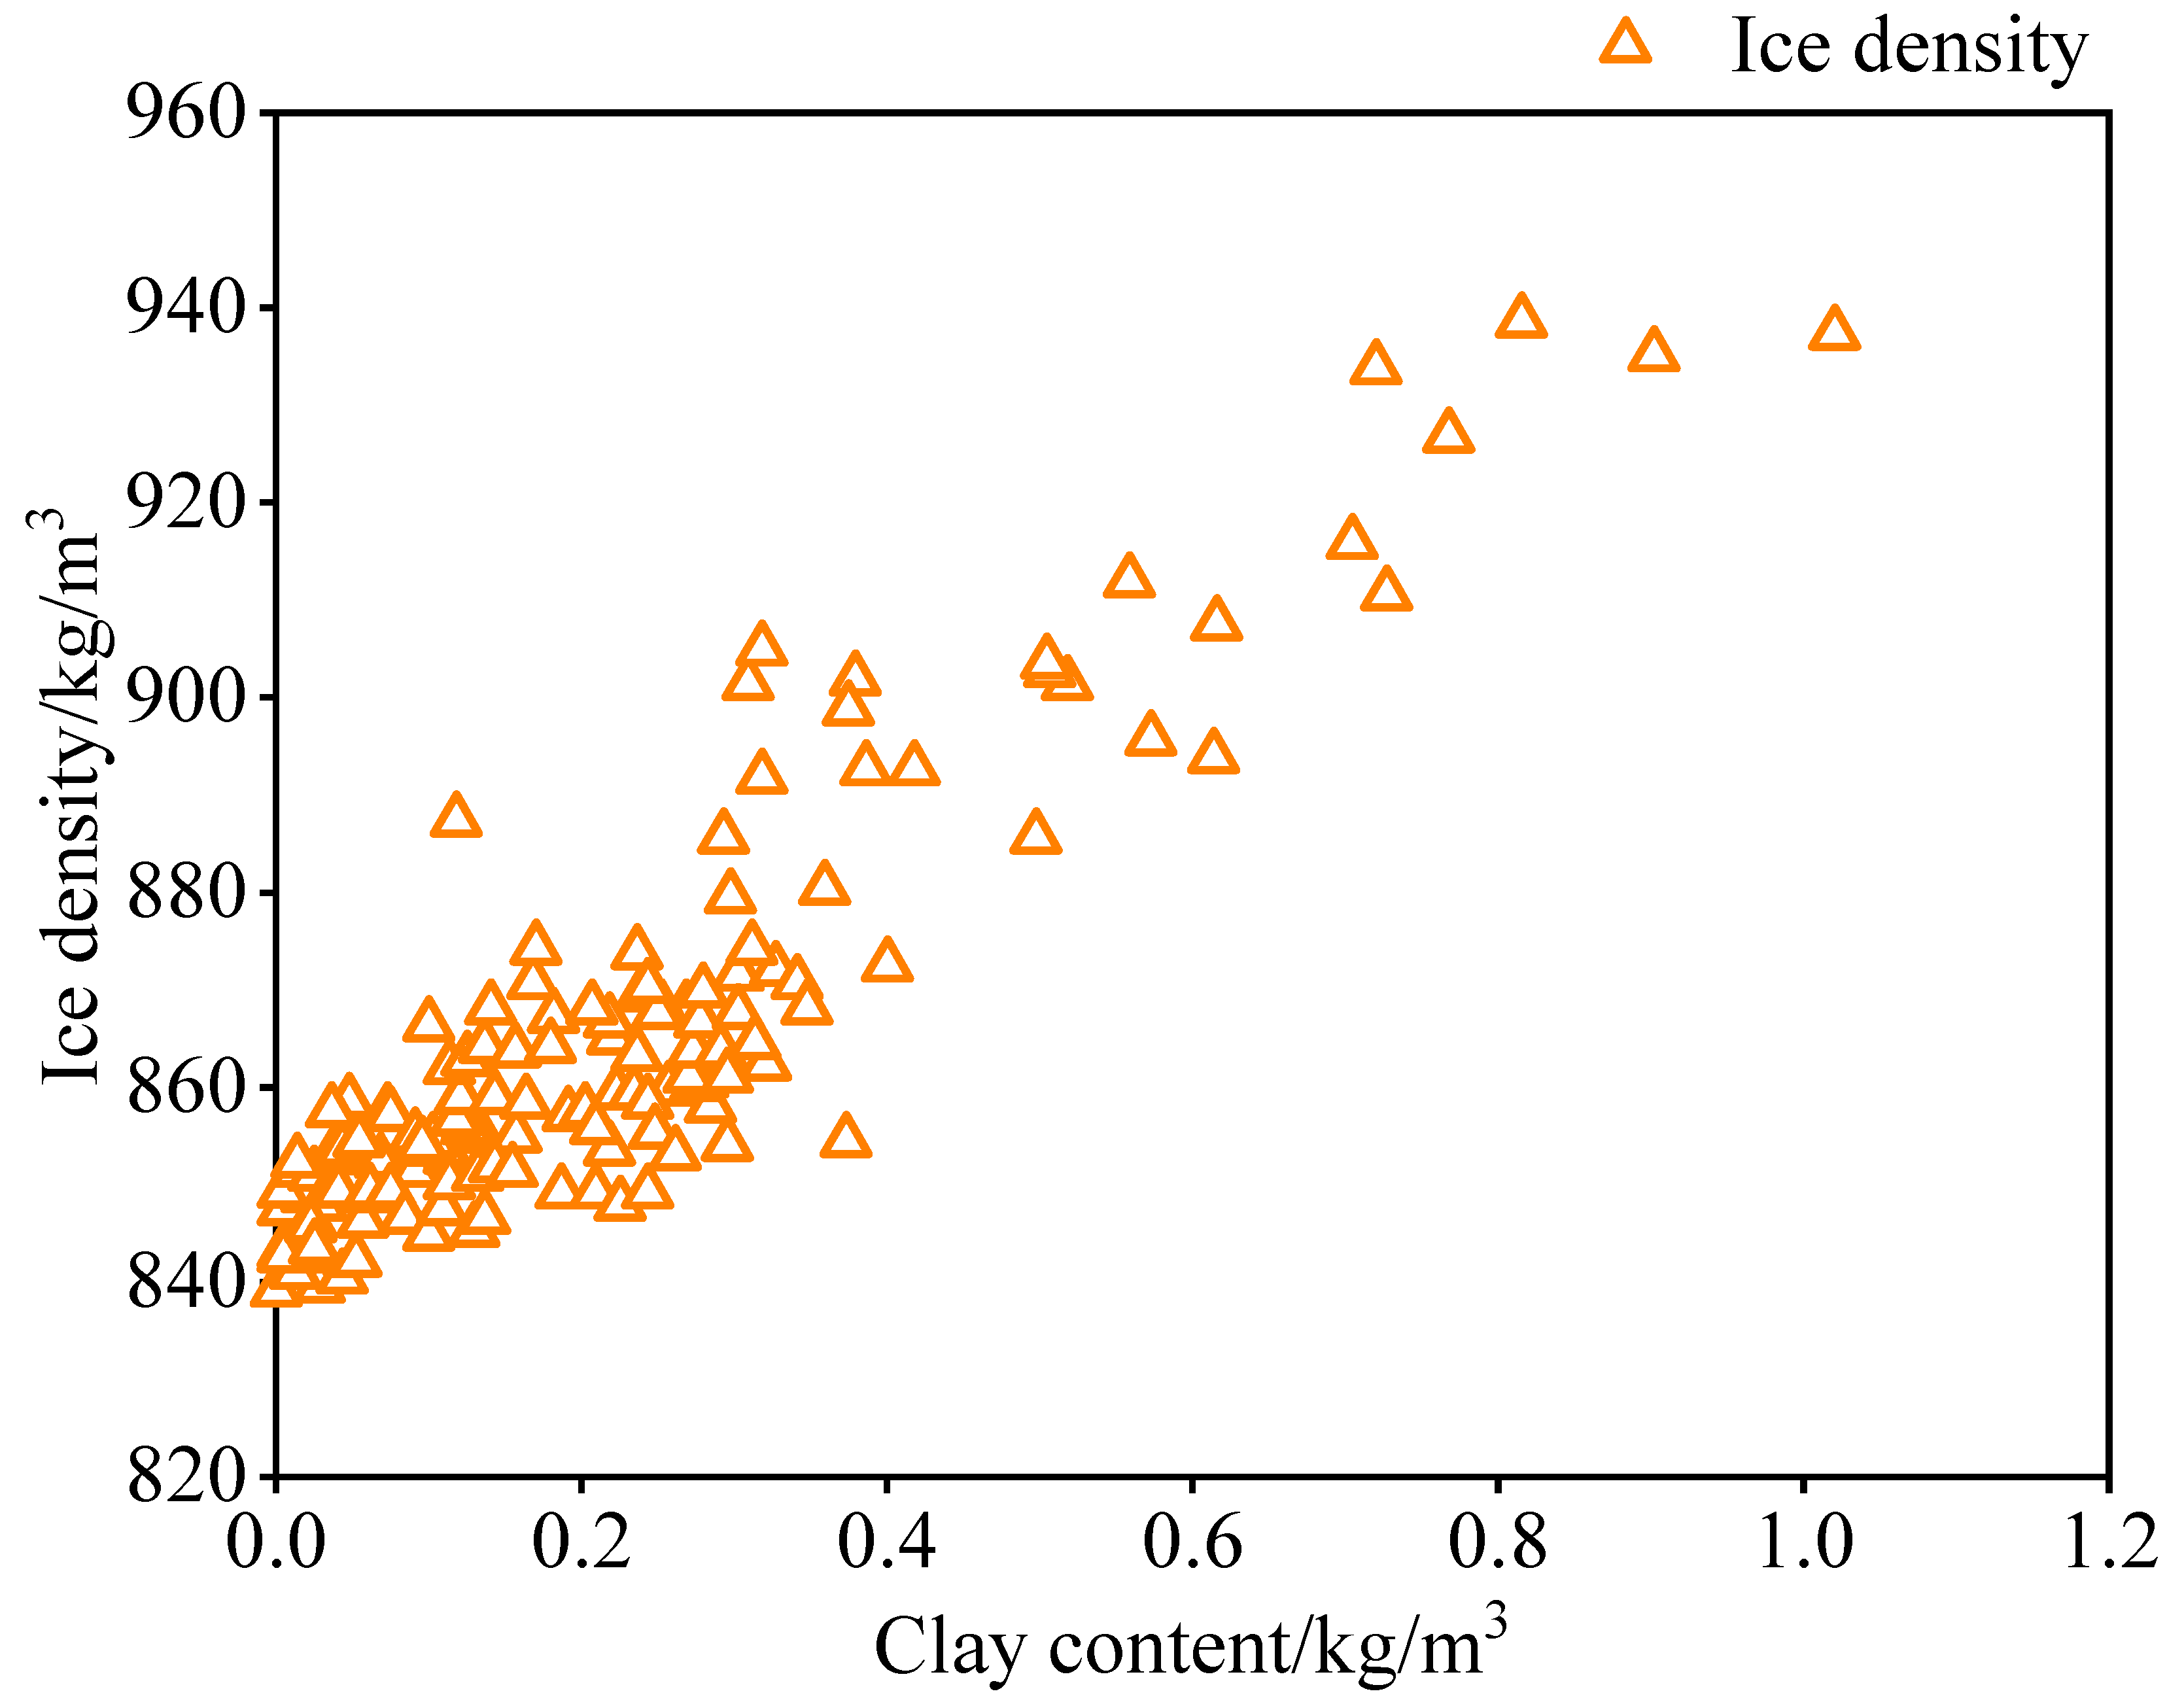
3.3.3. Density and Clay Content of Ice Structure

The ice density of the Shifosi Reservoir ranges from 864.9 to 964.6 kg/m³ (Figure 11). The ice density fluctuates greatly in the depth direction, and its distribution is governed by no certain law. This is mainly because there are bubbles, sand and other impurities in the ice, which cause the ice density to irregularly change. To analyse the relationship between different ice densities and ice contents more clearly, the relationship between different ice densities and clay contents is plotted (Figure 12). It can be seen that the ice density gradually increases with the increase in the mud content in the ice, and it fluctuates along the depth direction and gradually decreases, until it finally stabilises. This is mainly because there is a large amount of cultivated land around the Shifosi Reservoir in the Shenyang/Liaohe river region. The nearby sediments are driven by the wind to fall onto the ice surface, and they penetrate the ice surface through the radiation of the sun and the freeze-thaw action on the ice surface. At the same time, due to the different grain boundaries, bubbles and pores form in the ice crystals, and the sediment storage volume fluctuates with depth.

3.4. Comprehensive Fracture Model of the Ice Material

Liu and Li [33] made a preliminary theoretical derivation of the fracture toughness model of ice materials in 2018. On this basis, the authors of this paper reconstructed the corresponding theoretical calculation model by comprehensively considering the impact of environmental impacts (meteorology and hydrology, etc.) on the ice crystal morphology, ice crystal structure, and characteristic parameters (bubble density, ice density, etc.) during the ice material forming process. According to the functional principle of fracture mechanics and the principle of energy conservation, the stress equation for crack initiation is determined as:
Step I: Supplement the calculation equation for the equivalent modulus as:
E ¯ = { 1 + 16 45 ( 1 μ 2 ) ( 10 3 μ ) 2 μ S c r a c k S u n i t + f ( μ ) ( S c r a c k S u n i t ) 5 / 2 } 1 × i = 0 n t M , H i × i = 0 n P M , H i E
where E is the modulus of the ice material (no cracks), μ is the Poisson’s ratio of the ice material (only depending on ice crystals, ice cores, ice depth and environmental and geological factors), f ( μ ) represents the matrix material parameters (depending on the Poisson’s ratio), S c r a c k S u n i t is the crack density (ratio of the crack area to the unit area), η b u b b l e d e n s i t y 0 is the initial bubble density, η b u b b l e d e n s i t y i is the bubble density at year i, η i c e d e n s i t y 0 is the initial ice density and η i c e d e n s i t y i is the ice density at year i.
Step II: The equation for the stress development during loading is as follows:
Σ e = 3 ( S c r a c k S u n i t ) cosh E E ¯ E E ¯ Σ m ± { 3 ( S c r a c k S u n i t ) cosh E E ¯ E E ¯ Σ m } 2 + 4 { 1 + ( S c r a c k S u n i t ) 2 } ( Σ e q ) 2 2 { 1 + ( S c r a c k S u n i t ) 2 }
Σ e q = { [ 1 + 2 α β α + 1 ( σ P E ¯ ) n 1 ] × 1 2 σ P 2 d dL c r a c k ( 1 E ¯ ) } [ σ P E ¯ + β ( σ P E ¯ ) n ]
Σ m = 2 S c r a c k S u n i t 1 + S c r a c k S u n i t 0.09 ψ i c e ψ i c e K i c e ¯ + ( 1 ψ i c e ) K w a t e r × i = 0 n t M , H i × i = 0 n P M , H i
where Σ e q is the von Mises equivalent stress, Σ m is the hydrostatic pressure (or ice pressure), Σ e is the effective yield stress of the ice material, ψ i c e is the normalized ice content, K i c e ¯ is the equivalent bulk modulus of the ice materials, K w a t e r is the bulk modulus of the water, L c r a c k is the length of the preformed crack, and α and β are the ice material parameters.
In this paper, the mechanical properties of the ice material in 2018 are experimentally analysed. In the centre of the ice test block, a diameter of 1 to 8 mm is preset as the initial crack by core drilling, and the crack development and tip stress are analysed by pressure loading. The loading path and method of this test is performed at −3 °C and is shown in Figure 13. The stress generated by cracking caused by experimental loading is determined as:
t = ( 2 sin 2 A + cos A + sin A A 2 ) 8 ( cos A + sin A A ) 2 P c π L s a m . t s a m .
where Σ e q is the cracking stress (tensile stress), A is the loading centre angle, P c is the critical load, L s a m . is the length of the ice specimen and t s a m . is the thickness of the ice specimen.
Considering the comprehensive environmental impact factors (meteorological and hydrological monitoring), fracture and damage mechanics, and energy conservation laws, the tensile performance of the ice material was numerically simulated through the secondary development of software and the theoretical equations. The setting of the ice material mechanics simulation parameters takes into account the influence of the bubbles inside the actual ice, and the initial setting of the simulation calculation unit is carried out. At the same time, considering the actual loading process, we set the same loading path and mechanical simulation calculation parameters as the experiment (the specific simulation parameters are shown in Table 4). The simulation results of the crack stress diagram of the ice material under different initial crack conditions with different loading rates are shown in Figure 14, and the simulation calculation results obtained by Equation (8) are compared with the experimental results and shown in Figure 15. In this paper, the differences between the experimental results and the theoretical simulation analysis results are expressed in the form of regional error bars. The corresponding conclusions are summarised as follows: (1) The calculated results are generally higher than those obtained by the experiments, especially when calculating the initial crack diameter (<4 mm) and when the loading rate is large (<0.001 mm/min). (2) When the simulated preset crack is the largest (diameter of 8 mm), the calculated result agrees well with the test result, and the calculation error is small. However, when the simulation calculation of the preset crack is the smallest (diameter of 1 mm), the calculation error is large, especially for the low loading rate. (3) The total error rate calculated by the theoretical derivation and numerical simulation method is 7–11%, and the calculation accuracy is ideal. However, because some parameters considered in the theoretical calculations are ideal and depend on changes in the external environment, this also results in some calculation results that are relatively high. Therefore, in future work, the author of this article will further improve this equation to quickly guide actual engineering applications.

4. Conclusions

In this paper, a new comprehensive fracture model for ice material subjected to different environmental factors and loading speeds was presented, and simulation calculations were carried out through secondary development. Based on the mechanical simulation and experimental results, the following conclusions can be drawn:
(1) The formation of reservoir ice is directly related to environmental changes, especially changes in temperature and rainfall. At the same time, changes in the water flow in the reservoir also have a significant effect on the ice content, mud density, and bubble density.
(2) The internal properties of ice, such as bubble density and mud content, have important effects on the mechanical properties of ice materials. According to our analysis of ice crystals, an increase in bubble density changes the density and stability of the ice material.
(3) Based on fracture mechanics, damage mechanics and energy methods, combined with the change in bubble density in the ice material, a new comprehensive fracture model of ice materials was established. By comparing and analysing the simulation calculation results and the test results, it was determined that the model has good calculation accuracy. The new model can be used to further investigate the mechanical mechanism of ice materials.

Author Contributions

X.L.: software, formal analysis, investigation, data curation, conceptualization, methodology; B.L.: methodology, software, formal analysis, investigation, data curation, writing—original draft, visualization. Y.Z.: resources, data curation, writing—review and editing. C.Z.: Data curation, writing—review and editing. All authors have read and agreed to the published version of the manuscript.

Funding

This research was funded by National Natural Science Foundation of China, grant number 51979024 and Science and Technology Innovation Platform of Foshan City, grant No. 2016AG100341.

Conflicts of Interest

The authors declare that they have no known competing financial interest or personal relationship that could have appeared to influence the work reported in this paper.

References

  1. Li, F.; Ma, H.Y. Application of Fracture Mechanics to Ice Engineering. J. Glaciol. Geocryol. 2010, 32, 139–150. [Google Scholar]
  2. Li, H.S.; Zhu, Y.L. Frozen Soil Fracture Mechanics and Application; Ocean Book Publishing: Beijing, China, 2002. [Google Scholar]
  3. Carter, D.; Sodhi, D.; Stander, E. Ice Thrust in Reservoirs. J. Cold Reg. Eng. 1998, 12, 169–183. [Google Scholar] [CrossRef]
  4. Karimidastenaei, Z.; Klöve, B.; Sadegh, M.; Haghighi, A.T. Polar Ice as an Unconventional Water Resource: Opportunities and Challenges. Water 2021, 13, 3220. [Google Scholar] [CrossRef]
  5. Cox, G.F.N.; Abdelnour, R. A Preliminary Investigation of Thermal Ice Pressure. Cold Reg. Sci. Technol. 1984, 9, 221–229. [Google Scholar] [CrossRef]
  6. Li, H.S. Calculation of Static Ice Pressure onto Slope in Plain Reservoir. Mech. Eng. 1991, 14, 29–32. [Google Scholar]
  7. Liu, X.Z.; Liu, P. Testing Research on the Compressive Fracture Toughness of Slab Fracture of Frozen Soil. Cold Reg. Sci. Technol. 2011, 165, 421–428. [Google Scholar] [CrossRef]
  8. Liu, X.Z.; Li, H.S. Experimental Study on The Plane Strain Fracture Toughness for Undisturbed Frozen Soils. Recent Dev. Res. Permafr. Eng. Cold Reg. 2009, 28, 611–625. [Google Scholar]
  9. Barry, N.W.; Raghu, N.S.; Sun, G. Rock Fracture Mechanics Principles Design and Applications; Elsevier: Amsterdam, The Netherlands, 1992. [Google Scholar]
  10. Liu, X.Z.; Wu, Y. Research on Test of Model Nonlinear Fracture Toughness of Undisturbed Frozen Soils Based on Energy Balance Method. Rock Soil Mech. 2009, 30, 83–87. [Google Scholar]
  11. Li, X.L. Damage and Fracture Analysis on Concrete with an Oblique Crack. J. Nanchang Univ. (Eng. Technol.) 2004, 26, 56–58. [Google Scholar]
  12. Guo, S.H.; Sun, Z.Q.; Xie, X.Q. Research on Mode and Criterion of Rock Fracture under Compressive Loading. Chin. J. Geotech. Eng. 2004, 24, 304–308. [Google Scholar]
  13. Cai, Z.; Sun, B.T.; Guo, S.R. Experimental Research on Ice Load qnd Its Calculation Method. Earthq. Eng. Eng. Vib. 1997, 17, 49–56. [Google Scholar]
  14. Wang, J.F.; Yu, T.L.; Huang, M.L. Experimental Research on Uniaxial and Unconfined Compressive Strength of River Ice. Low Temp. Archit. Technol. 2007, 1, 11–13. [Google Scholar]
  15. Lu, Q.; Tang, A.; Zhong, N.P. Calculating Method of River Ice Loads on Piers the Mechanical Behavior Test of River Ice. J. Nat. Disasters 2002, 11, 75–79. [Google Scholar]
  16. Yu, T.; Yuan, Z.G.; Huang, M.L. Experimental Study on Mechanical Behavior of River Ice. J. Liaoning Tech. Univ. (Nat. Sci.) 2009, 28, 937–940. [Google Scholar]
  17. Zhang, L.M.; Li, Z.J.; Jia, Q. Experimental Study on Uniaxial Compressive Strengths of Artificial Freshwater Ice. J. Hydraul. Eng. 2009, 140, 1392–1396. [Google Scholar]
  18. Yue, Q.J.; Ren, X.H.; Chen, J.B. The Test and Mechanism Investigation on Ductile Brittle Transition of Sea Ice. J. Basic Sci. Eng. 2005, 13, 35–42. [Google Scholar]
  19. Liu, X.Z.; Liu, P. The Laboratorial Study of Fracture Energy Release Rate of the Reservoir Ice Layer. Archit. Build. Mater. 2011, 22, 3802–3807. [Google Scholar] [CrossRef]
  20. Ji, S.Y.; Liu, H.L.; Xu, N.; Ma, H.Y. Experiments on sea ice fracture toughness in the Bohai Sea. Adv. Water Sci. 2013, 24, 386–391. [Google Scholar]
  21. Goetze, C.G. A Study of Brittle Fracture as Applied to Ice; Technical Note; U.S. Army Cold Regions Research and Engineering Laboratory: Hanover, NH, USA, 1965; p. 63. [Google Scholar]
  22. Hellgren, R.; Enzell, J.; Ansell, A.; Nordström, E.; Malm, R. Estimating the Ice Loads on Concrete Dams Based on Their Structural Response. Water 2022, 14, 597. [Google Scholar] [CrossRef]
  23. Hamza, H.; Muggeridge, D.B. Plane strain fracture toughness (KIC) of fresh water ice. In Proceedings of the 5th International POAC Conference, Trondheim, Norway, 13–18 August 1979; Volume 1, pp. 697–707. [Google Scholar]
  24. Urabe, N.; Yoshitake, A. Strain rate dependent fracture toughness (KIC) of pure ice and sea ice. In Proceedings of the 6th International IAHR Symposium on Ice, Quebec City, QC, Canada, 11 August 1981; Volume 2, pp. 551–563. [Google Scholar]
  25. Timco, G.W.; Frederking, R.M.W. Comparative strengths of fresh water ice. Gold Reg. Sci. Technol. 1982, 6, 21–27. [Google Scholar] [CrossRef] [Green Version]
  26. Timco, G.W.; Frederking, R.M.W. The effects of anisotropy and microcracks on the fracture toughness KIC of freshwater ice. In Proceedings of the 5th International OMAE Conference, Tokyo, Japan, 13 April 1986; pp. 341–348. [Google Scholar]
  27. Liu, H.W.; Miller, K.J. Fracture toughness of fresh-water ice. J. Glaciol. 1979, 22, 135–143. [Google Scholar] [CrossRef] [Green Version]
  28. Parsons, B.L.; Snellen, J.B. Fracture toughness of freshwater prototype ice and carbamide model ice. In Proceedings of the 8th International POAC Conference, Narssarssuaq, Greenland, 7–14 September 1985; Volume 1, pp. 128–137. [Google Scholar]
  29. Dempsey, J.P. The fracture toughness of ice. In Ice-Structure Interaction; Springer: Berlin/Heidelberg, Germany, 1991; pp. 109–145. [Google Scholar]
  30. Dempsey, J.P.; Jochmann, P.; Fransson, L.; Mu, Z.; Weiss, J.; Palmer, A.C. Cleavage fracture of warm brackish ice. In Proceedings of the 22nd International Conference on Port and Ocean Engineering under Arctic Conditions, Espoo, Finland, 9–13 June 2013; p. 6. [Google Scholar]
  31. Prasanna, M.; Wei, M.; Polojärvi, A.; Cole, D.M. Laboratory experiments on floating saline ice block breakage in ice-to-ice contact. Cold Reg. Sci. Technol. 2021, 189, 103315. [Google Scholar] [CrossRef]
  32. Wells, J.; Jordaan, I.; Derradji-Aouat, A.; Taylor, R. Small-scale laboratory experiments on the indentation failure of polycrystalline ice in compression: Main results and pressure distribution. Cold Reg. Sci. Technol. 2011, 65, 314–325. [Google Scholar] [CrossRef] [Green Version]
  33. Liu, X.Z.; Li, B.; Li, Z.J.; Shen, W.G. A new fracture model for reservoir ice layers in the northeast cold region of China. Constr. Build. Mater. 2018, 191, 795–811. [Google Scholar] [CrossRef]
  34. Kusumoto, S.; Kimura, N.; Uchida, T.; Takase, T. Study of fracture toughness of coarse grained ice and the effect of specimen size (a). J. Soc. Mater. Sci. 1986, 35, 659–663. (In Japanese) [Google Scholar] [CrossRef]
  35. Kusumoto, S.; Kimura, N.; Takase, T.; Kidera, T. Study of fracture toughness of columnar grained ice using large specimens (b). J. Soc. Mater. Sci. 1986, 35, 887–891. (In Japanese) [Google Scholar] [CrossRef] [Green Version]
  36. Wang, T.; Yang, K.; Guo, Y.; Huo, S. Application of artificial neural networks to forecasting of river ice condition. J. Hydraul. Eng. 2005, 36, 1204–1208. (In Chinese) [Google Scholar]
  37. Li, Z.J.; Zhang, L.M.; Lu, P. Experimental study on the effect of porosity on the uniaxial compressive strength of sea ice in Bohai Sea. Sci. China Technol. Sci. 2011, 54, 2429–2436. (In Chinese) [Google Scholar] [CrossRef]
  38. Li, Z.J.; Huang, W.F.; Jia, Q.; Leppäranta, M. Characteristics of crystals, bubbles and density of freshwater ice in reservoirs. J. Hydraul. Eng. 2009, 40, 1333–1338. (In Chinese) [Google Scholar]
  39. Zhang, Y.D.; Li, Z.J.; Guo, W.D.; Yu, H.H.; Liang, W.W. Methods and equipment for three-point bending strength test of ice. Water Resour. Sci. Cold Reg. Eng. 2008, 1, 63–68. (In Chinese) [Google Scholar]
  40. Wei, M.; Polojärvi, A.; Cole, D.M.; Prasanna, M. Strain response and energy dissipation of floating saline ice under cyclic compressive stress. Cryosphere 2020, 14, 2849–2867. [Google Scholar] [CrossRef]
  41. Wei, M.; Dai, F. Laboratory-scale mixed-mode I/II fracture tests on columnar saline ice. Theor. Appl. Fract. Mech. 2021, 114, 102982. [Google Scholar] [CrossRef]
  42. Water Resources of PRC. Specification for Rock Test of Water Resources and Hydropower Develop; Water Power Press: Beijing, China, 2001; pp. 32–33. [Google Scholar]
  43. Langway, C.C. Ice Fabrics and the Universal Stage; Department of Defense, Department of the Army, Corps of Engineers, Snow Ice and Permafrost Research Establishment: Wilmette, IL, USA, 1959; pp. 468–492. Available online: https://usace.contentdm.oclc.org/digital/collection/p266001coll1/id/2291/ (accessed on 29 April 2022).
  44. Langway, C.C. Ice Fabrics and the Universal Stage; U.S. Army Snow Ice and Permafermafrost Resesrch Establishment, Corps of Engineers: Wilmette, IL, USA, 1958; pp. 551–573. [Google Scholar]
  45. Cho, H.; Shepson, P.B.; Barrie, L.A. NMR investigation of the quasi-brine layer in ice/brine mixtures. J. Phys. Chem. B 2002, 106, 11226–11232. [Google Scholar] [CrossRef]
  46. Coa, G.F.N.; Weeks, W.F. Profile properties of undeformed first-year sea ice. CRREL Rep. 1988, 13, 1–66. [Google Scholar]
  47. Durand, G.; Gagliardini, O.; Thorsteinsson, T. Ice microstructure and fabric: An up-to-date approach for measuring textures. J. Glaciol. 2006, 52, 619–630. [Google Scholar] [CrossRef] [Green Version]
  48. Eicken, H.; Bock, C. Magnetic resonance imaging of sea-ice pore fluids: Methods and thermal evolution of pore microstructure. Cold Reg. Sci. Technol. 2000, 31, 207–225. [Google Scholar] [CrossRef] [Green Version]
  49. Frost, H.J. Mechanims of Crack Nucleation in lce. Eng. Fract. Mech. 2001, 68, 1823–1837. [Google Scholar] [CrossRef]
  50. Zhang, W.; Li, Y.P.; Chai, L. Glacier change and response to climate in the northern slope of the middle Nyainqêntanglha Mountains during 1990–2020. Prog. Geogr. 2021, 40, 2073–2085. [Google Scholar] [CrossRef]
  51. Tian, H.Z.; Yang, T.B.; Liu, Q.P. Relationship between climate change and glacier retreat over the last 40 years in Lenglongling range of eastern Qilian Mountains. Res. Soil Water Conserv. 2012, 19, 34–38. [Google Scholar]
  52. Radić, V.; Hock, R. Regional and global volumes of glaciers derived from statistical upscaling of glacier inventory data. J. Geophys. Res. Earth Surf. 2010, 115, F01010. [Google Scholar] [CrossRef]
  53. Golden, K.M.; Eicken, H.; Heaton, A.L. Thermal evolution of permeability and microstructure in sea ice. Geophys. Res. Lett. 2007, 34, 1–6. [Google Scholar] [CrossRef] [Green Version]
  54. Miyamoto, A.; Weikusat, I.; Hondoh, T. Complete determination of ice crystal orientation using Laue X-ray diffraction method. J. Glaciol. 2011, 57, 103–110. [Google Scholar] [CrossRef] [Green Version]
  55. Timco, G.W.; Weeks, W.F. A review of the engineering properties of sea ice. Cold Reg. Sci. Technol. 2010, 60, 107–129. [Google Scholar] [CrossRef]
Figure 1. Research flow chart.
Sustainability 14 07326 g001
Figure 2. The annual temperature changes of the Shifosi Reservoir from 2013 to 2018.
Sustainability 14 07326 g002aSustainability 14 07326 g002bSustainability 14 07326 g002c
Figure 3. The wind statistics of the Shifosi Reservoir from 2013 to 2018 (af).
Sustainability 14 07326 g003aSustainability 14 07326 g003bSustainability 14 07326 g003c
Figure 4. The weather statistics of the Shifosi Reservoir from 2013 to 2018 (af).
Sustainability 14 07326 g004aSustainability 14 07326 g004bSustainability 14 07326 g004c
Figure 5. The solar radiation statistics of the Shifosi Reservoir from 2013 to 2018.
Sustainability 14 07326 g005
Figure 6. The water flow data of the Shifosi Reservoir from 2013 to 2018.
Sustainability 14 07326 g006aSustainability 14 07326 g006bSustainability 14 07326 g006cSustainability 14 07326 g006d
Figure 7. The water level of the Shifosi Reservoir from 2013 to 2018.
Sustainability 14 07326 g007
Figure 8. The rainfall volume of the Shifosi Reservoir from 2013 to 2018 (af).
Sustainability 14 07326 g008aSustainability 14 07326 g008bSustainability 14 07326 g008c
Figure 9. The ice crystal structure at different depth layers of the Shifosi Reservoir from 2013 to 2018 (af).
Sustainability 14 07326 g009aSustainability 14 07326 g009b
Figure 10. The bubble density of the ice in Shifosi Reservoir from 2013 to 2018.
Sustainability 14 07326 g010
Figure 11. The ice depth from 2013 to 2018.
Sustainability 14 07326 g011
Figure 12. The ice density from 2013 to 2018.
Sustainability 14 07326 g012
Figure 13. Critical load strength and loading rate.
Sustainability 14 07326 g013
Figure 14. Result of theoretical simulation calculation of fracture stress of ice material.
Sustainability 14 07326 g014aSustainability 14 07326 g014bSustainability 14 07326 g014c
Figure 15. Comparison of experimental and theoretical simulation results and errors. (a) Loading rate = 0.1 mm/min; (b) Loading rate = 0.01 mm/min; (c) Loading rate = 0.001 mm/min; (d) Loading rate = 0.0001 mm/min; (e) Loading rate = 0.00001 mm/min; (f) Comparison of experimental and theoretical simulation errors.
Sustainability 14 07326 g015aSustainability 14 07326 g015bSustainability 14 07326 g015cSustainability 14 07326 g015d
Table 1. The information of Shifosi reservoir.
Reservoir NameReservoir LocationAnnual Average TemperatureFreeze Period/YearTest Temperature
ShifoSiShenyang, LiaoNing8.1 °CDecember to March−9.6 °C
Table 2. Experimental design controls aperture value of ice.
Aperture Value1 mm2 mm3 mm4 mm5 mm6 mm7 mm8 mm
Number of pieces1818181818181818
Table 3. The control loading speed.
Loading Speed0.1 mm/s0.01 mm/s0.001 mm/s0.0001 mm/s0.00001 mm/s
Number of pieces150150150150150
Table 4. The simulation parameters for ice material fracture.
Simulation Calculation SettingsSoftwareUnit TypeModelling SizeElastic ModulusPoisson’s StressLoading StressLoading MethodBoundary Conditions
Parameters/DetailsAnsysSolid 4510 mm × 10 mm × 10 mm
(Hexahedral)
56 MPa0.38.16 MPaSymmetrical loading on both sidesFixed constraints on both sides
Publisher’s Note: MDPI stays neutral with regard to jurisdictional claims in published maps and institutional affiliations.

