Article

Comparative Study of Combustion, Performance and Emission Characteristics of Hydrotreated Vegetable Oil–Biobutanol Fuel Blends and Diesel Fuel on a CI Engine

1
Department of Automobile Engineering, Faculty of Transport Engineering, Vilnius Gediminas, Technical University, J. Basanavičiaus Str. 28, LT-03224 Vilnius, Lithuania
2
Faculty of Mechanical Engineering, Lublin University of Technology, Nadbystrzycka 36, 20-618 Lublin, Poland
3
Faculty of Production Engineering, University of Life Sciences in Lublin, Głęboka 28, 20-612 Lublin, Poland
*
Authors to whom correspondence should be addressed.
Sustainability 2022, 14(12), 7324; https://doi.org/10.3390/su14127324
Submission received: 15 May 2022 / Revised: 10 June 2022 / Accepted: 11 June 2022 / Published: 15 June 2022
(This article belongs to the Special Issue Fuels for the Future)

Abstract

:
This article is a study of Hydrotreated Vegetable Oil and Butanol Fuel blends, which are mixed in three different proportions (HVOB5, HVOB10 and HVOB20), and the comparison of their combustion (in-cylinder pressure, pressure rise and ROHR), performance (fuel consumption, BSFC and BTE) and emission (CO2, NOX, HC and Smoke) characteristics with those of fossil diesel fuel. In the wake of finding an alternative fuel that requires little to zero modifications to the existing IC engines, it is necessary to account for the necessity of matching the efficiency of conventional fuels as well as greatly reducing its exhaust emissions. As a result of transesterification, HVO is found to have better stability and higher CN compared to other biofuels. It is termed a “renewable diesel” due to its ability to reduce emissions while maintaining efficiency. HVO as a fuel has higher cost efficiency, and for a more stable oxygen content in the fuel, an alcohol substitute is needed. Butanol, which has a considerable advantage over other alcohols due to its higher density, viscosity and CN, is selected. HVOB5 and HVOB10 are found to match diesel fuel in terms of fuel consumption while having a ~1% lesser efficiency. In terms of emissions, all the fuel mixtures including HVO100 are found to have ~4–5% lesser CO2, ~10–15% lesser NOX and a ~25–45% reduction in smoke levels.

1. Introduction

Mobility is among the top priorities of the modern world, making automobiles an essential part. There has been constant and tremendous growth in the automobile sector since the industrial revolution. While it continues to grow further, problems related to the decrease in fossil fuel availability and increased emissions have also begun to rise. Concerned with the damage caused by emissions such as carbon dioxide (CO2), which has been the major cause of global warming, as well as human health, which is affected by the rising levels of carbon monoxide (CO), nitrogen oxides (NOX) and particulate matter (PM), strict regulations have been put in place to constrain the damage [1,2,3,4].
According to the European Automobile Manufacturers’ Association (ACEA), vehicles powered by conventional fuels accounted for 62.2% of the market share in the second quarter of 2021. Although the demand and production of electric vehicles expanded, they are found to capture only 7.5% of the market share [5]. The transition time and costs associated with a complete transformation to 100% electric vehicles and their infrastructure are essentially out-of-reach. While hybrid electric vehicles are found to contain emission levels, there is still a need for the development of Internal Combustion (IC) engines with higher efficiency and lower emissions. The noise emissions generated by internal combustion engines were discussed by Czech and Madej [6] or Figlus and Liściak [7]. On the other hand, the issues of exhaust emissions have been widely discussed for many years, as evidenced by previous research [3,8,9]. Currently, the development of internal combustion engines is visible primarily in the improvement of their design [10,11], the improvement of the combustion process in spark-ignition engines [12,13,14,15] and the development of fuel-injection systems in diesel engines [16,17,18,19,20] and exhaust gas-cleaning systems [21,22,23]. One of the directions for reducing exhaust emissions is the use of alternative fuels. In this area, research on Liquified Petroleum Gas (LPG) is popular in many countries [15,24,25], as well as biogas [20], natural gas [26,27], Compressed Natural Gas (CNG) [28,29,30] and Liquified Natural Gas (LNG) [31,32]. Interesting studies have been presented on alternative fuels to diesel, as well as mixtures of both, inter alia, [33,34,35,36,37,38,39]. In the wake of this scenario, a more reliable alternative fuel that can be used alone or along with conventional fuels in existing IC engines, with little to no modification, is required [1,40,41].
Complying with the European emission target of reducing CO2 emissions by 37.5% by 2030 and the EURO 7/VII Emission Standards, which require renewable energy to account for at least 32% of the total energy, there is a need for alternative fuels with a higher hydrogen/carbon ratio [42,43,44]. Biodiesel and alcohols are found to be promising sources of alternative fuels, which are already been commercially used on a large scale [45]. They can be either blended with diesel or used in their pure form. Alternative fuels that do not contain aromatic compounds possess great potential for reducing hydro carbon (HC), CO and PM [46].
Hydrotreated Vegetable Oil (HVO), which is termed “renewable diesel”, possesses special properties of decreasing emissions while maintaining efficiency and fuel consumption, which places it above any ether-based alternative fuels. It offers a higher cetane number and stability than biodiesels produced through transesterification [47]. The noted advantage of using HVO as an alternative fuel is that it can be used without any modifications to fuel systems. PM is greatly reduced due to its paraffinic and aromatic-free nature. Its high cetane number (CN) would be well-suited to low-compression-ratio engines, which results in lower NOX and PM. The absence of sulphur greatly reduces the ageing and deterioration of engine components. The primary disadvantage of HVO is the absence of Oxygen (O2) and that it is expensive compared to other biodiesels. From the results of previous studies, it is evident that when HVO is used at high loads, NOX and PM are reduced by up to 50% compared to standard diesel fuel [48,49,50].
Alcohols are mostly used as an alternative fuel and are blended with diesel fuel to increase their O2 content and decrease emissions. The two predominantly used alcohols for diesel engines are ethanol and butanol. They possess greater potential because of their production rate, ease of use and sustainability. Butanol, with its higher density, viscosity, flash point, cetane number and lubricity, is a comparatively better alternative than ethanol [47,51,52].
Mixing a high-reactivity fuel with a low-reactivity-rate fuel is found to have combined advantages such as a lower pressure increase and, in turn, a greater reduction in smoke and NOx emissions [53,54,55]. Alcohols can also be added to increase the efficiency of engines powered by biodiesel [46,56]. Researchers observed that with the increase in engine load, using butanol as a fuel increased the brake thermal efficiency (BTE) and decreased brake-specific fuel consumption (BSFC) [57,58]. It is also found to particularly decrease PM emissions (Vojtisek-Lom). However, due to its lower cetane number, there has been some inconsistency in the results of various research studies concerning NOX emissions [51,59,60,61,62].
Butanol and HVO blends can be a potential solution as they counterbalance their critical parameters [63]. HVO, which has almost all the parameters as that of diesel, is expensive and has a higher cetane number, with the best ignition properties, while butanol is cost-effective and has a lower cetane number while possessing the ability to reduce PM to a great extent [47].
The aim of this research is to perform numerical analysis through combustion parameters such as the in-cylinder pressure and Rate of Heat Release (ROHR) along with recording performance indicators such as fuel consumption (Bf), BSFC and BTE and emission characteristics such as CO2, NOX, HCm and Smoke for pure HVO and HVO–Butanol fuel mixtures prepared in three different volumetric proportions and compare them with those of pure diesel fuel.

2. Materials and Methods
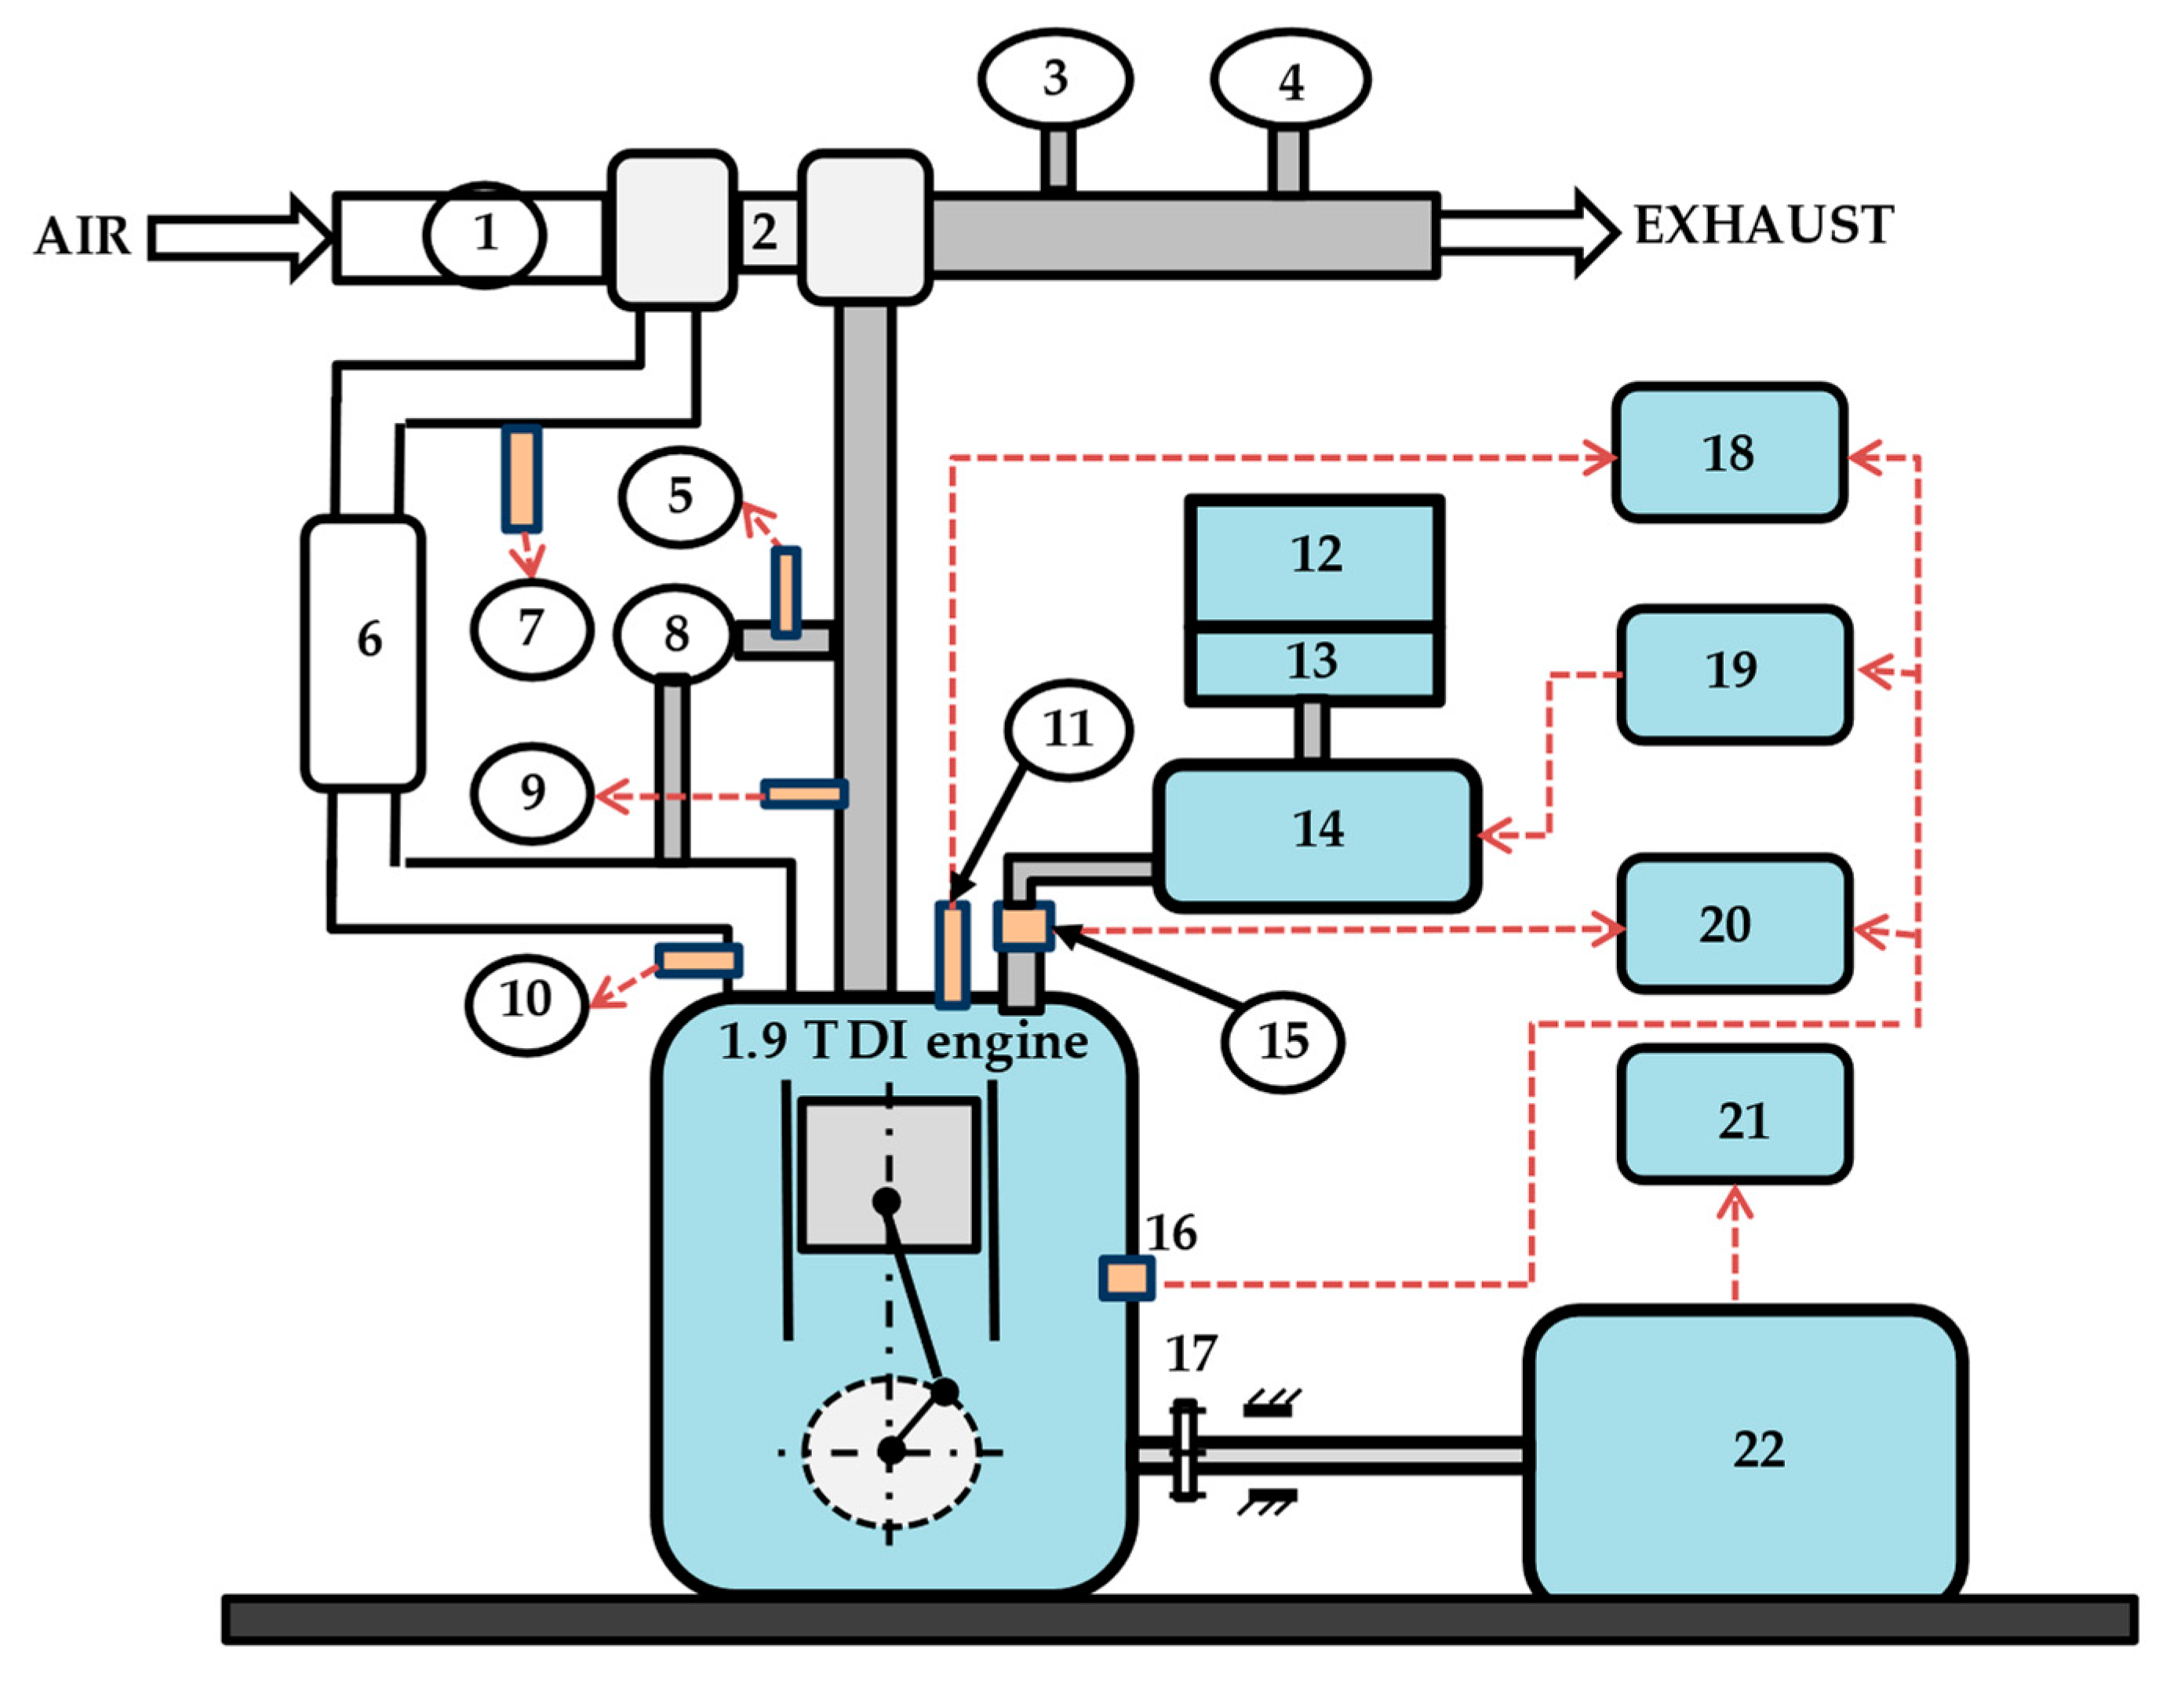
2.1. Testing Engine

The IC engine that was used for testing the fuels was the AUDI 1.9 Turbocharged direct-injection engine with the BOSH VP37 controlled Electronic Control Unit (ECU). It operates on the single injection strategy, and the Start of Injection (SOI) was electronically controlled. The test bench was situated in the Automotive department laboratory of Vilnius Tech. The schematic representation of the engine is presented in Figure 1 along with its engine specifications, which are presented in Table 1.
The KI-5543 load bench was utilized to determine the brake torque (MB), with a measurement error of ±1.23 Nm. The SK-5000 electronic scale, along with a stopwatch, was used to record the hourly fuel consumption (Bf), with a measurement error of 0.5%. The BOSCH HFM 5 m, with an accuracy of 2%, was utilized to determine the intake air mass. The AVL GH13P piezoelectric sensor was used to determine the pressure in the cylinder, with a sensitivity of 15.84 ± 0.09 pC/bar. VAG-Com and OBD II-ECU were utilised as displays for SOI information. The Delta OHM HD 2304.0 m pressure sensor was used to find the pressure in the engine intake manifold, with a measurement error of ±0.0002 MPa. The AVL DiCom 4000 gas analyser was used to determine the concentration of exhaust gases such as CO2, HC and NOX. The measurement error of the instrument was recorded as 0.01% vol (O2) and 1 ppm (HC and NOX). An opacity meter with a measurement error of 0.1% was used to determine the smoke levels.

2.2. Fuels and Testing Methods

The fuels used to prepare the mixture for testing are 100% pure diesel fuel (D100), 100% pure Hydrotreated Vegetable Oil (HVO100) and 100% pure butanol (B100). D100 meets the requirements of standard EN 590. The properties of these fuels are presented in Table 2.
Three fuel mixtures were prepared and compared alongside D100 and HVO100. The first mixture was prepared by blending 95% HVO and 5% butanol (hereafter, HVOB5). The second mixture consisted of 90% HVO and 10% butanol (hereafter, HVOB10). The third mixture was blended with 80% HVO and 20% butanol (hereafter, HVOB20). The fuel mixtures were prepared by blending HVO and Butanol in the prescribed volumetric ratio (V/V). The properties of these fuel mixtures, which are given in Table 3, are the result of mass fraction (m/m) calculations.
Experiments were carried out on an engine with a limited but frequently used operating speed (n) of 2000 rpm. Test results were measured using a Brake torque of (MB) = 30, 60, 90 and 120 Nm, which were ~20%, ~40%, ~60% and ~80% of the total engine load, respectively. The brake mean effective pressure (BMEP) was 0.2, 0.4, 0.6 and 0.8 MPa. The corresponding loads resemble a city car running at a speed range of ~50 to ~120 km/h. The graphs presenting the performance and emission characteristics are the average results of tests performed 5 times. Performance indicators, such as fuel consumption (Bf), brake-specific fuel consumption (BSFC) and brake thermal efficiency (BTE), are presented. Emission characteristics such as carbon dioxide (CO2) emissions, nitrogen oxide (NOX) emissions, hydrocarbon (HC) emissions and smoke (opacity) are recorded. Although the carbon monoxide (CO) emissions were recorded with a measurement error of 0.01%, the difference recorded by our analyser was too low to be evaluated.
In-cylinder pressure data along the crankshaft position were recorded by their respective sensors, which were then processed on LabView Real software. These in-cylinder pressure graph readings were entered into Burn analysis (which is an AVL BOOST’s subprogram) to obtain the combustion parameters, which are the rate of heat release and pressure rise.

3. Results and Discussion

3.1. Combustion Parameters

To obtain a more detailed understanding of the performance and emission indicators, a numerical analysis of the combustion parameters is presented. The combustion parameters are obtained with an engine speed (n) of 2000 rpm, BMEP of 0.8 MPa and SOI at a crank angle degree (CAD) of 7 before the Top Dead Centre (bTDC), which is controlled by the engine ECU. The in-cylinder pressure diagram, with a detailed magnification of the peak pressure, is presented in Figure 2. Even though there is not a considerable difference in the peak in-cylinder pressure, D100 is found to be highest with ~102 MPa.
Ignition delay, which is determined from the start of injection (SOI), the start of combustion (SOC) and the combustion duration (CD), is presented in Table 4. SOI is obtained from the experimental data of the fuel injection timing sensor and SOC is derived from the combustion analysis performed in the AVL Boost. The delay is found to be relatively low in HVO100 when compared with D100, which might be because of the higher cetane number of HVO100, which is presented in Table 3. Although there is a minimal difference in the delay period between HVO100 and HVOB5, with the addition of butanol, the delay is prolonged, which can be explained by the decreasing cetane number. HVO100 has a slightly longer combustion duration (CD) due to the longer fuel injection duration due to lower fuel LHV and higher fuel volume to be injected. The addition of butanol also prolongs the combustion duration, and this affects the energy efficiency of the engine.
The pressure rise graph of the tested fuels is plotted covering the crank angle from −10 CAD to 50 CAD, and a detailed magnification of −6 CAD to 10 CAD is given in Figure 3. The highest peak of the pressure rise is observed in D100 with ~30% more than the other fuels’ combined average. The fuels with a higher increase in pressure tend to increase the mechanical loads, thereby increasing the noise. The temperature rise inside the cylinder is presented in Figure 4. The detailed magnification of the premix combustion phase is shown to indicate the influence of the temperature rise on NOx emissions. The higher temperature rise of D100 during this phase explains the higher NOx emissions.
The rate of heat release of the fuel blends along with D100 and HVO100 is presented in Figure 5. To obtain a clear understanding of the detailed combustion process, three magnifications are presented at different stages of the combustion. HVO is a fuel with relatively high CN compared to diesel fuel, and the higher the CN is, the lower the ignition delay, providing a longer combustion duration. It can also be observed that the start of combustion for HVO100 is earlier compared to other fuels, indicating the shortest ignition delay. With the addition of butanol, the cetane number is reduced following the delay order, with diesel fuel ranking last. The maximum rate of heat release for diesel fuel is ~2 % lower than the average of all the other fuels.

3.2. Performance Indicators

For a better comparative understanding of performance indicators such as fuel mass consumption, efficiency, and BSFC, all the graphs are plotted showing D100 values on the top, comparing them with the percentage change in values with HVO100, HVOB5, HVOB10 and HV0B20, respectively, at four different loads of 0.2, 0.4, 0.6 and 0.8 MPa, respectively.
Change   percentage   of   fuel = ( X F U E L X D 100 X D 100 ) * 100
where X represents the performance indicators and emission characteristics.
For D100, fuel consumption (Bf) is found to rise with an increase in load, as shown in Figure 6. When BMEP is increased from 0.2 to 0.8 MPa, the fuel consumption of D100 is found to increase by ~160%. All other fuel mixtures, along with HVO100, are seen to follow a similar pattern of increase in fuel consumption with the increase in load, and at the highest recorded load of 0.8 MPa, all the fuels are found to decrease. In the comparative analysis, it is found that, at any given load, with the addition of Butanol, the change in fuel consumption of fuel mixtures is found to increase by ~100%, which might be because of the rise in oxygen content in the fuel mixtures, as shown in Table 3. At 0.6 MPa, the fuel consumption of HVOB5 (~4.41 kg/h) is found to be almost similar to that of D100 (~4.42 kg/h).
BSFC is found to decrease with an increasing cetane number as presented in Table 3. This might be because of the increase in the expansion work per cycle afforded by the earlier ignition. The percentage change in the BSFC of HVO100 and the other three fuel mixtures in comparison to D100 is found to follow a similar pattern as in Bf, as shown in Figure 7. With an increase in the BMEP from 0.2 to 0.4 MPa, the BSFC of D100 is found to decrease by 24%; when increased from 0.4 to 0.6 MPa, D100 is found to decrease by 10%; similarly, from 0.6 to 0.8 MPa, the value fell further to 4%. After analysing the results of mass fuel consumption and brake-specific fuel consumption, the properties of D100 are found to fall between those of HVOB5 and HVOB10.
The BTE of all fuel mixtures, along with D100 and HVO100, is found to increase with an increase in load, as shown in Figure 8. BTE is greatly influenced by the combustion duration of the prepared fuel mixtures. With an increase in the duration (Table 4), the efficiency is found to decrease. D100, with a shorter duration is found to have higher efficiency, although the difference varies from ~0.5–1%; with an increase in the alcohol percentage, the duration is prolonged, thereby decreasing the efficiency. At lower loads, the difference in the change percentage is found to be greater, with ~35% at 0.2 MPa and ~18% at 0.4 MPa. The value seems to gradually decrease at higher loads, with an ~8% mean difference in the change percentage at 0.6 and 0.8 MPa. With an increase in the butanol percentage, the BTE is observed to decline. The same tendency is applied to all loads.

3.3. Emission Characteristics

Similar to that of the performance indicators, for a better comparative understanding of exhaust emission characteristics such as CO2, NOX, HC and smoke, all the graphs are plotted with D100 values on top, comparing them with the percentage change in other fuel blends along with HVO100.
Due to the low C/H ratio of HVO100, B100 and its blends, as shown in Table 3, CO2 emissions are reduced to approximately ~4–6% at any given load, as presented in Figure 9. With an increase in load, as BTE increased and BSFC decreased, the CO2 emissions are found to decrease for D100 from ~996 g/kWh at 0.2 MPa to ~695 g/kWh at 0.8 MPa, which is a reduction of ~30%. A similar trend is observed for HVO100 and other fuel mixtures.
A significant, stable ~10–15% reduction in NOX emissions is observed at all loads for all the fuel mixtures and HVO100, as shown in Figure 10. Due to its high cetane number (which is ~50% higher than that of D100), HVO100 is found to have a consistent average decrease in emissions of ~14% at all loads. With an increase in the percentage of butanol, the CN of the fuel blends is reduced, thereby increasing their emissions. However, the mean of the percentage change in NOX emissions in comparison to D100 was reduced over the load.
As the load increases, hydrocarbon emissions of D100 are found to decrease, as shown in Figure 11. All the remaining fuel mixtures, including HVO100, seem to follow the same pattern. An increase in the combustion temperature with load may be the reason behind the decrease in emissions. HVO100 is found to have the lowest emission levels of all the tested fuels, with an average reduction of ~31% at all loads compared to D100. With an increase in butanol, the emissions are found to increase. HVOB20 seems to have an average of ~44% higher emissions than D100.
For any specific fuel that is tested, a steady rise in smoke levels is observed to follow load, as shown in Figure 12. Due to its increasing oxygen content and decreasing C/H ratio, the smoke levels are found to decrease, as given in Table 3. On average, HVO100 has ~35% lesser emissions compared to that of D100, followed by HVOB5 with ~38%, HVOB10 with ~41% and HVOB20, being the lowest, with a ~52% reduction in smoke levels.

4. Conclusions

This paper presents experimental tests on an internal combustion engine with a limited operating speed (n) of 2000 rpm as the most frequently used operating speed. The test results were performed for the braking torque (MB) = 30, 60, 90 and 120 Nm, which are ~20%, ~40%, ~60% and ~80% of the total engine load, respectively. The specified loads resemble the operation of a car in normal traffic conditions, moving at a speed of ~50 to ~120 km / h. In addition, the engine efficiency indicators were presented, and the composition of the emitted exhaust gases was examined. AVL BOOST’s software was used in the analysis of the results.
After conducting the experiment on an IC engine by comparing D100 data with HVO100 and HVO–butanol blends, which were volumetrically prepared at three different proportions (HVOB5, HVOB10 and HVOB20), the performance (Bf, BSFC and BTE) and emission (CO2, NOX, HC and Smoke) characteristics were obtained. The in-cylinder pressure values obtained from the experimental investigation were then used for the numerical analysis of combustion parameters (pressure rise and ROHR). After carefully analysing the obtained results, the following conclusions are drawn:
  • The blending of HVO and Butanol greatly complemented each other’s properties, and they had a great influence on increasing the performance and decreasing the emissions. Upon increasing the butanol concentration by 5% and 20% (from HVOB5 to HVOB10 and HVOB20), there appeared to be a 2- and 4-fold increase in the oxygen content. At the same time, with an increase in butanol content, the CN was found to decrease by ~3.5%, and the value was more than doubled to ~7.4% when the butanol content increased further to 20%.
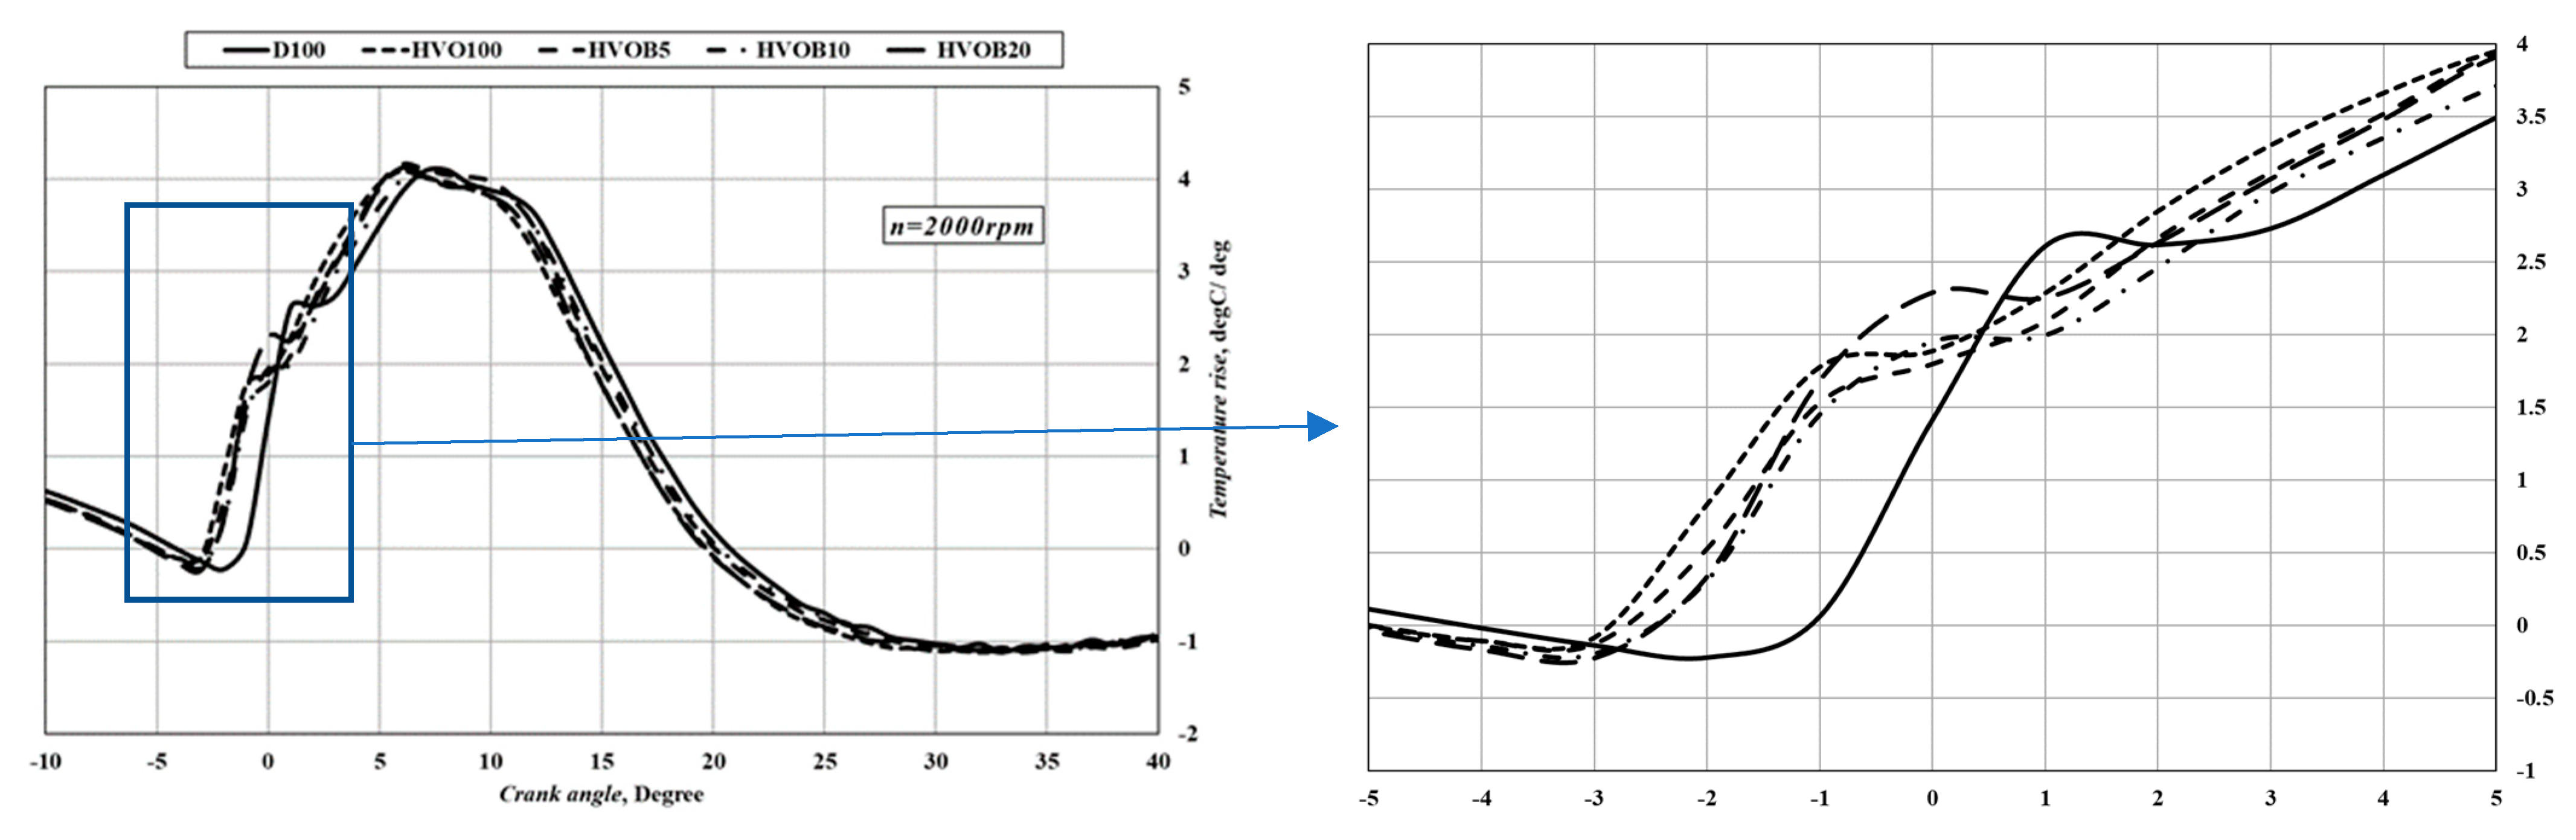
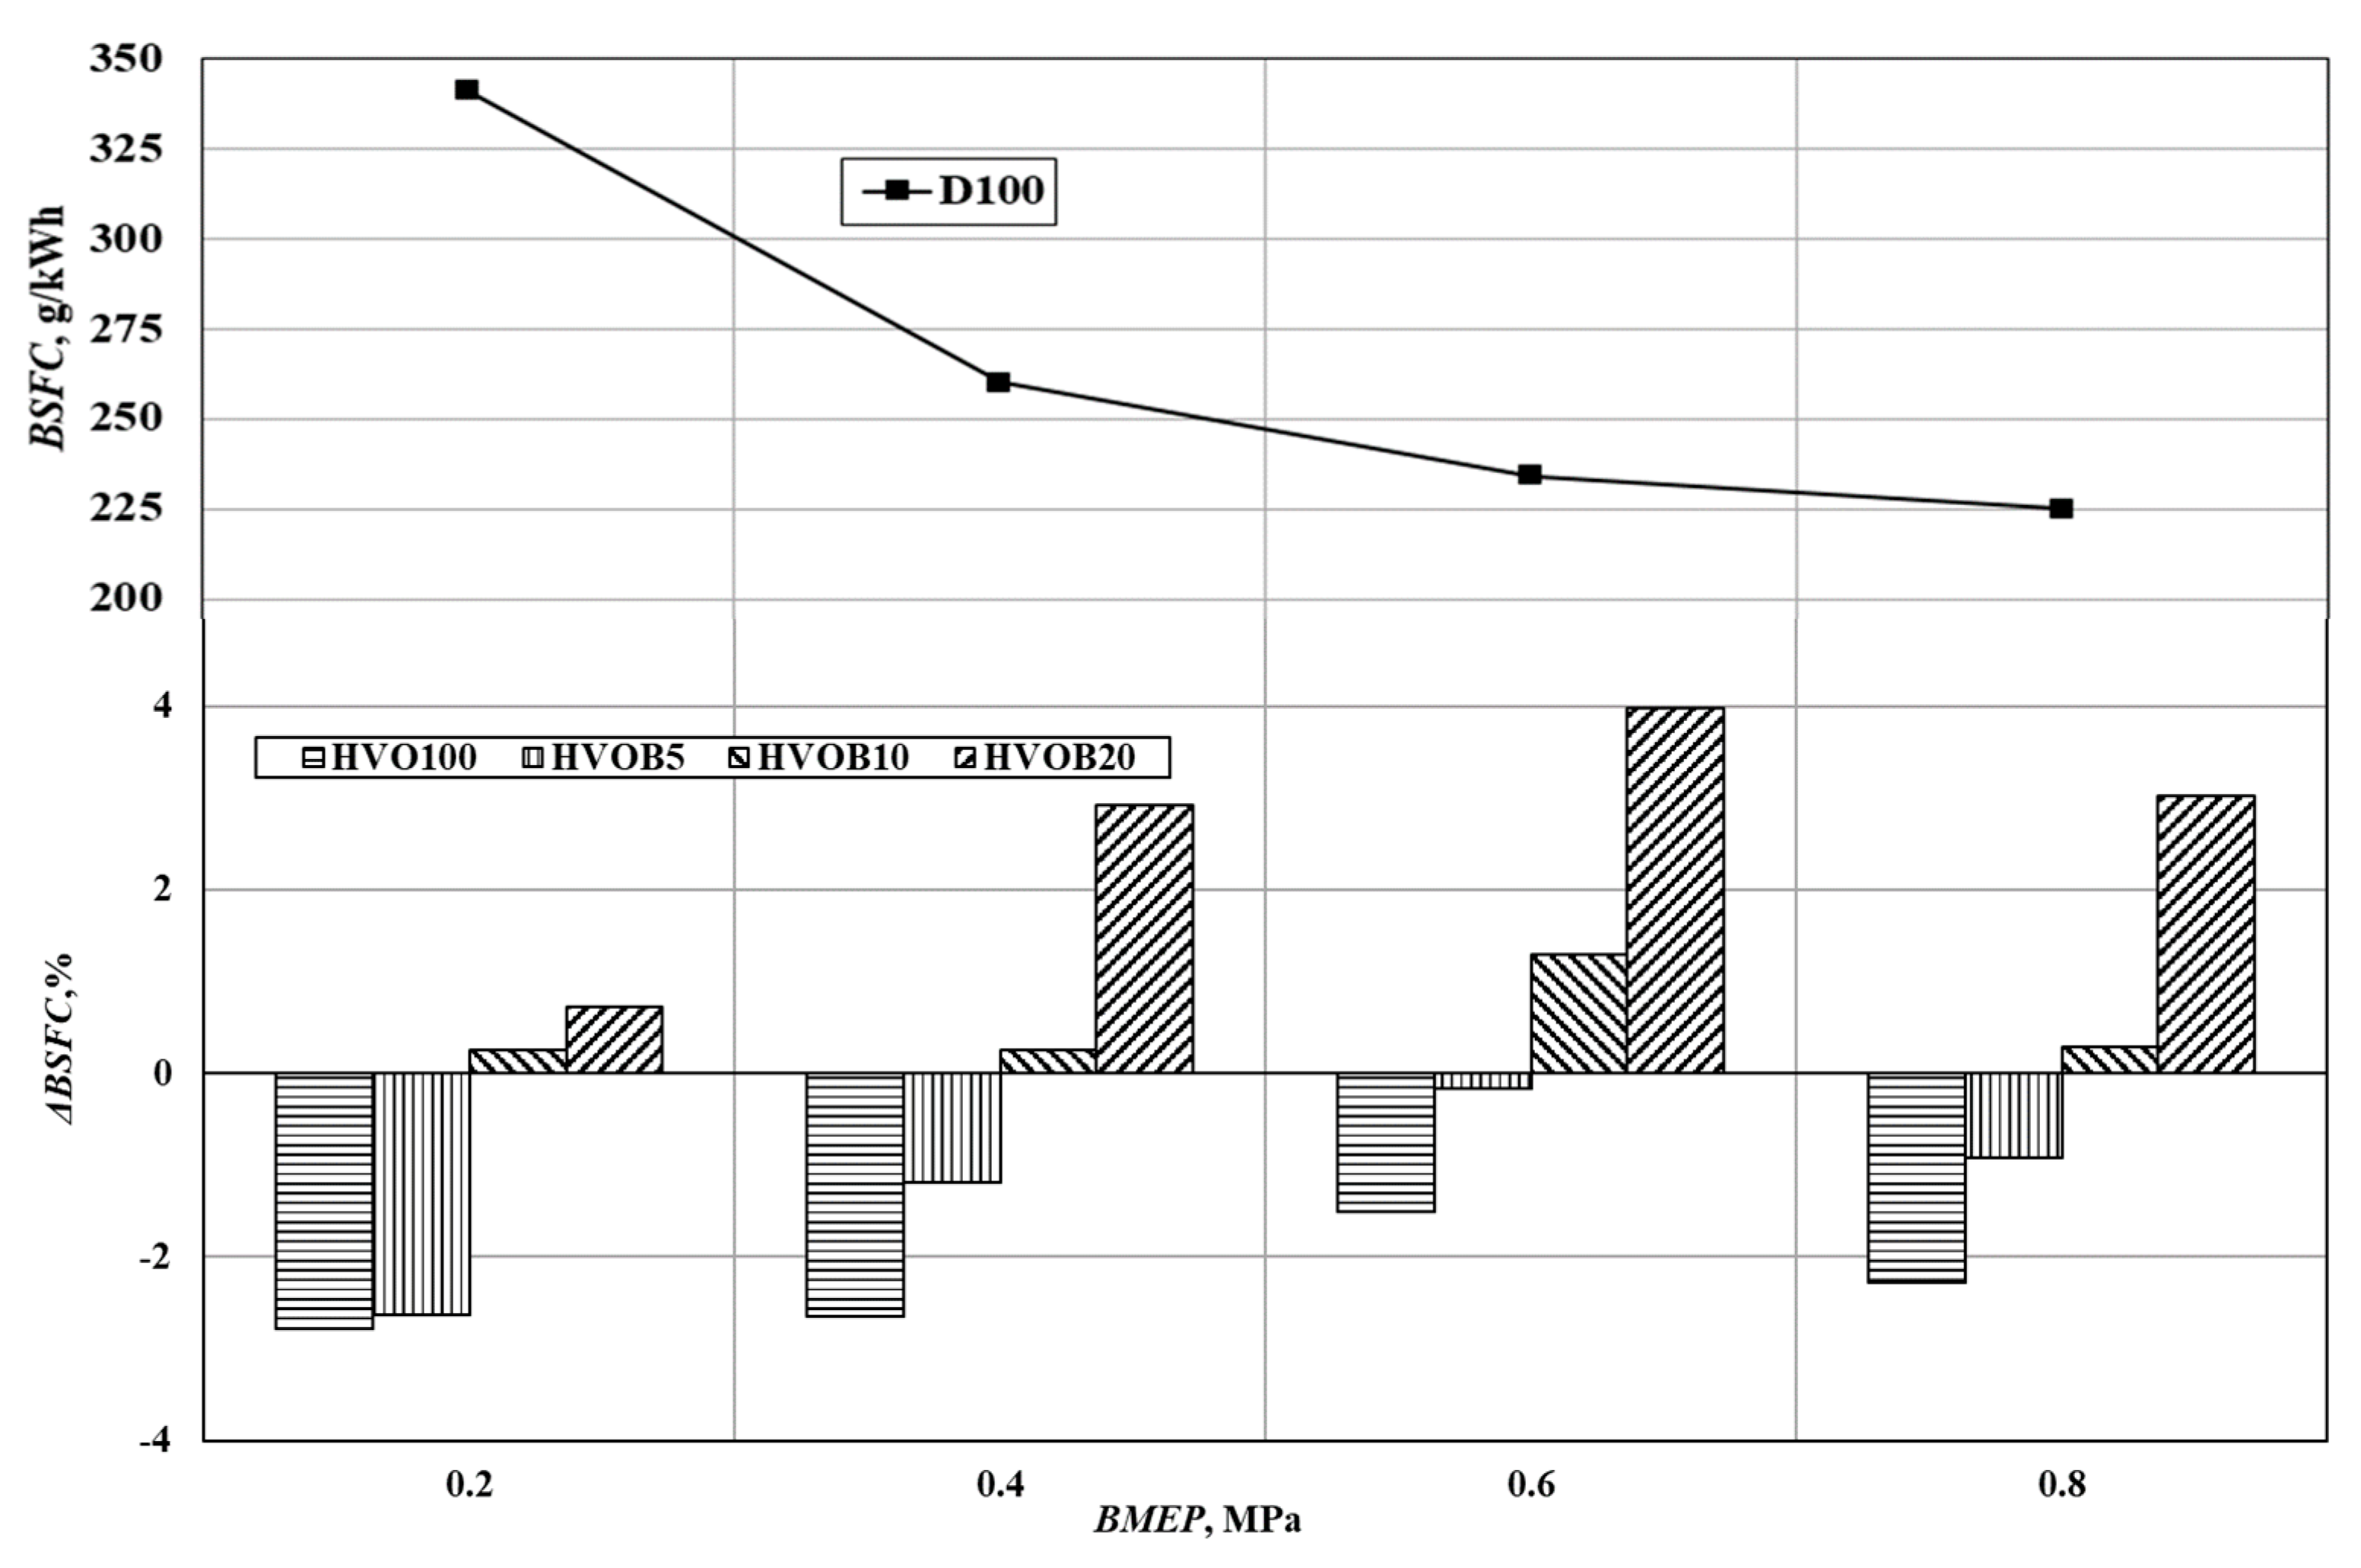
  • HVO, with its high CN, had the shortest ignition delay, but the combustion duration period was longer. With the rise in butanol percentage, the CN was reduced following the delay order, with diesel fuel ranking last, while the combustion duration period was extended due to butanol. BSFC, which is determined by the fuel LHV and the combustion process, is found to decrease with an increasing butanol concentration. The BSFC of D100 can be matched with HVOB5 and HVOB10.
  • There is a comparatively small difference in BTE of all the fuels, with diesel being the highest. At lower loads, the fuel blends with HVO100 are ~0.5–1% lower than that of diesel, and at higher loads, the difference is found to be ~1–1.5%. The decrease in BTE is due to the longer combustion process caused by decreasing the calorific value of the fuel by increasing the concentration of butanol in the mixture with HVO fuel.
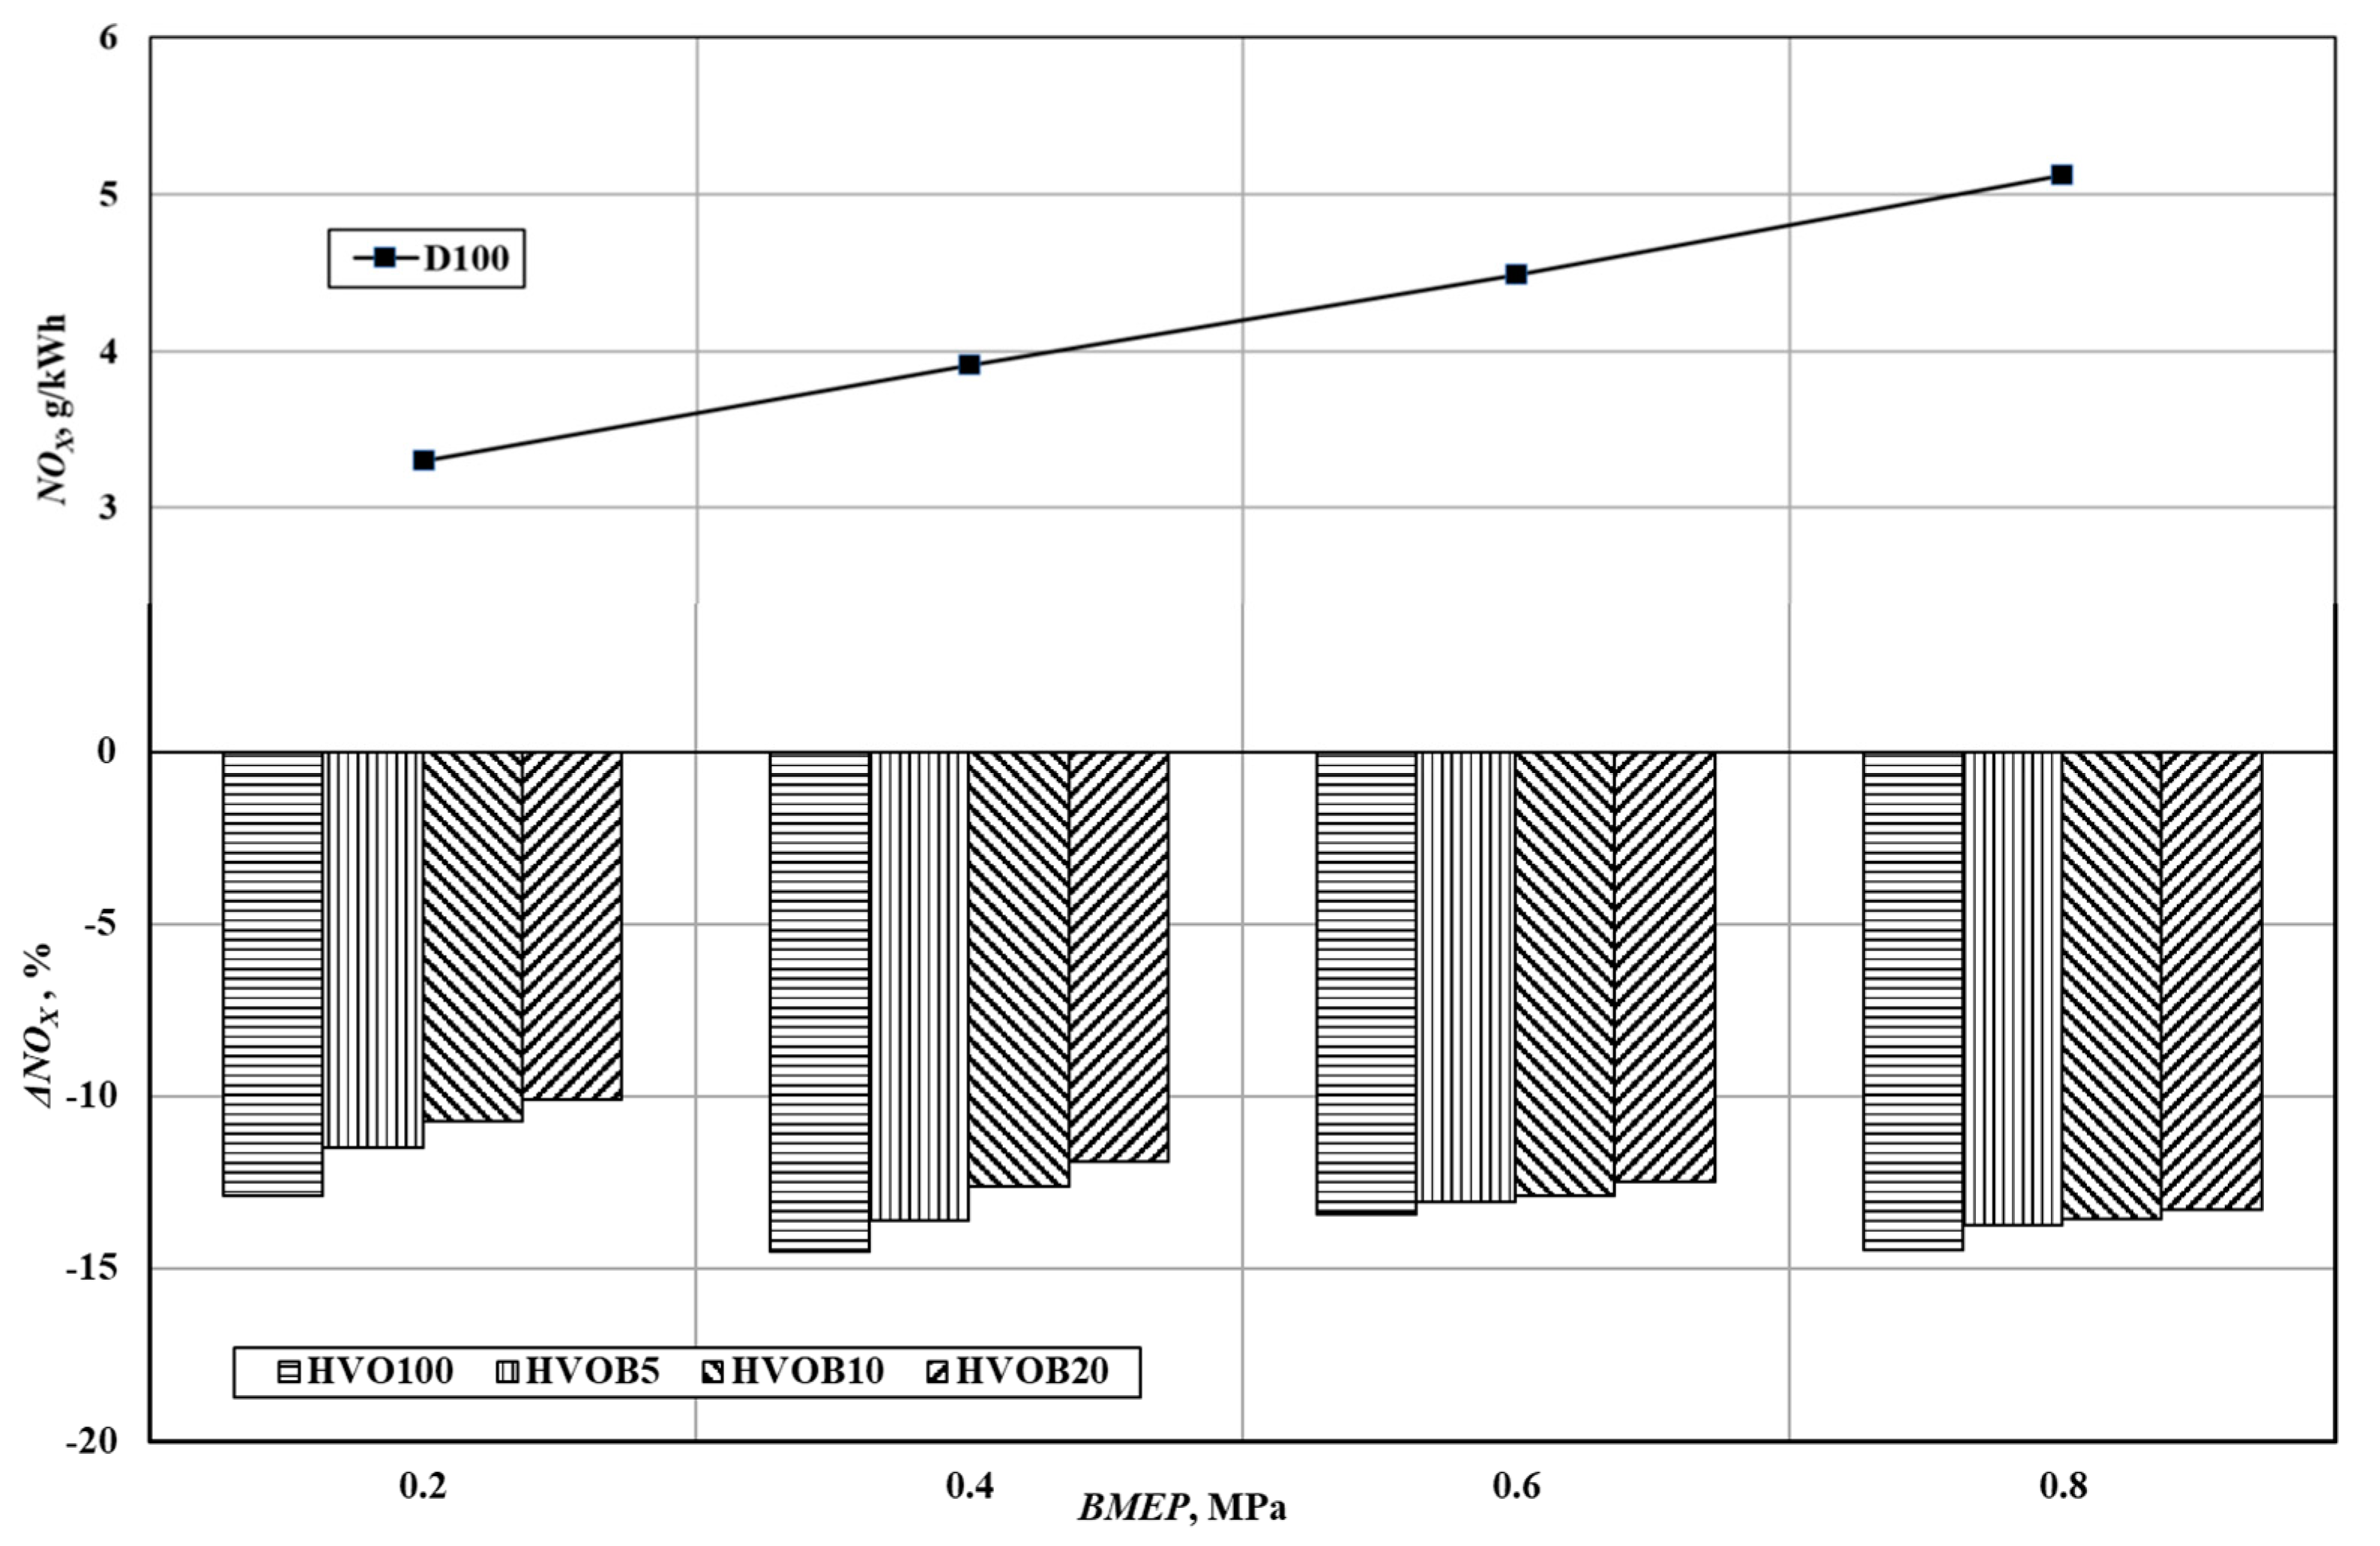
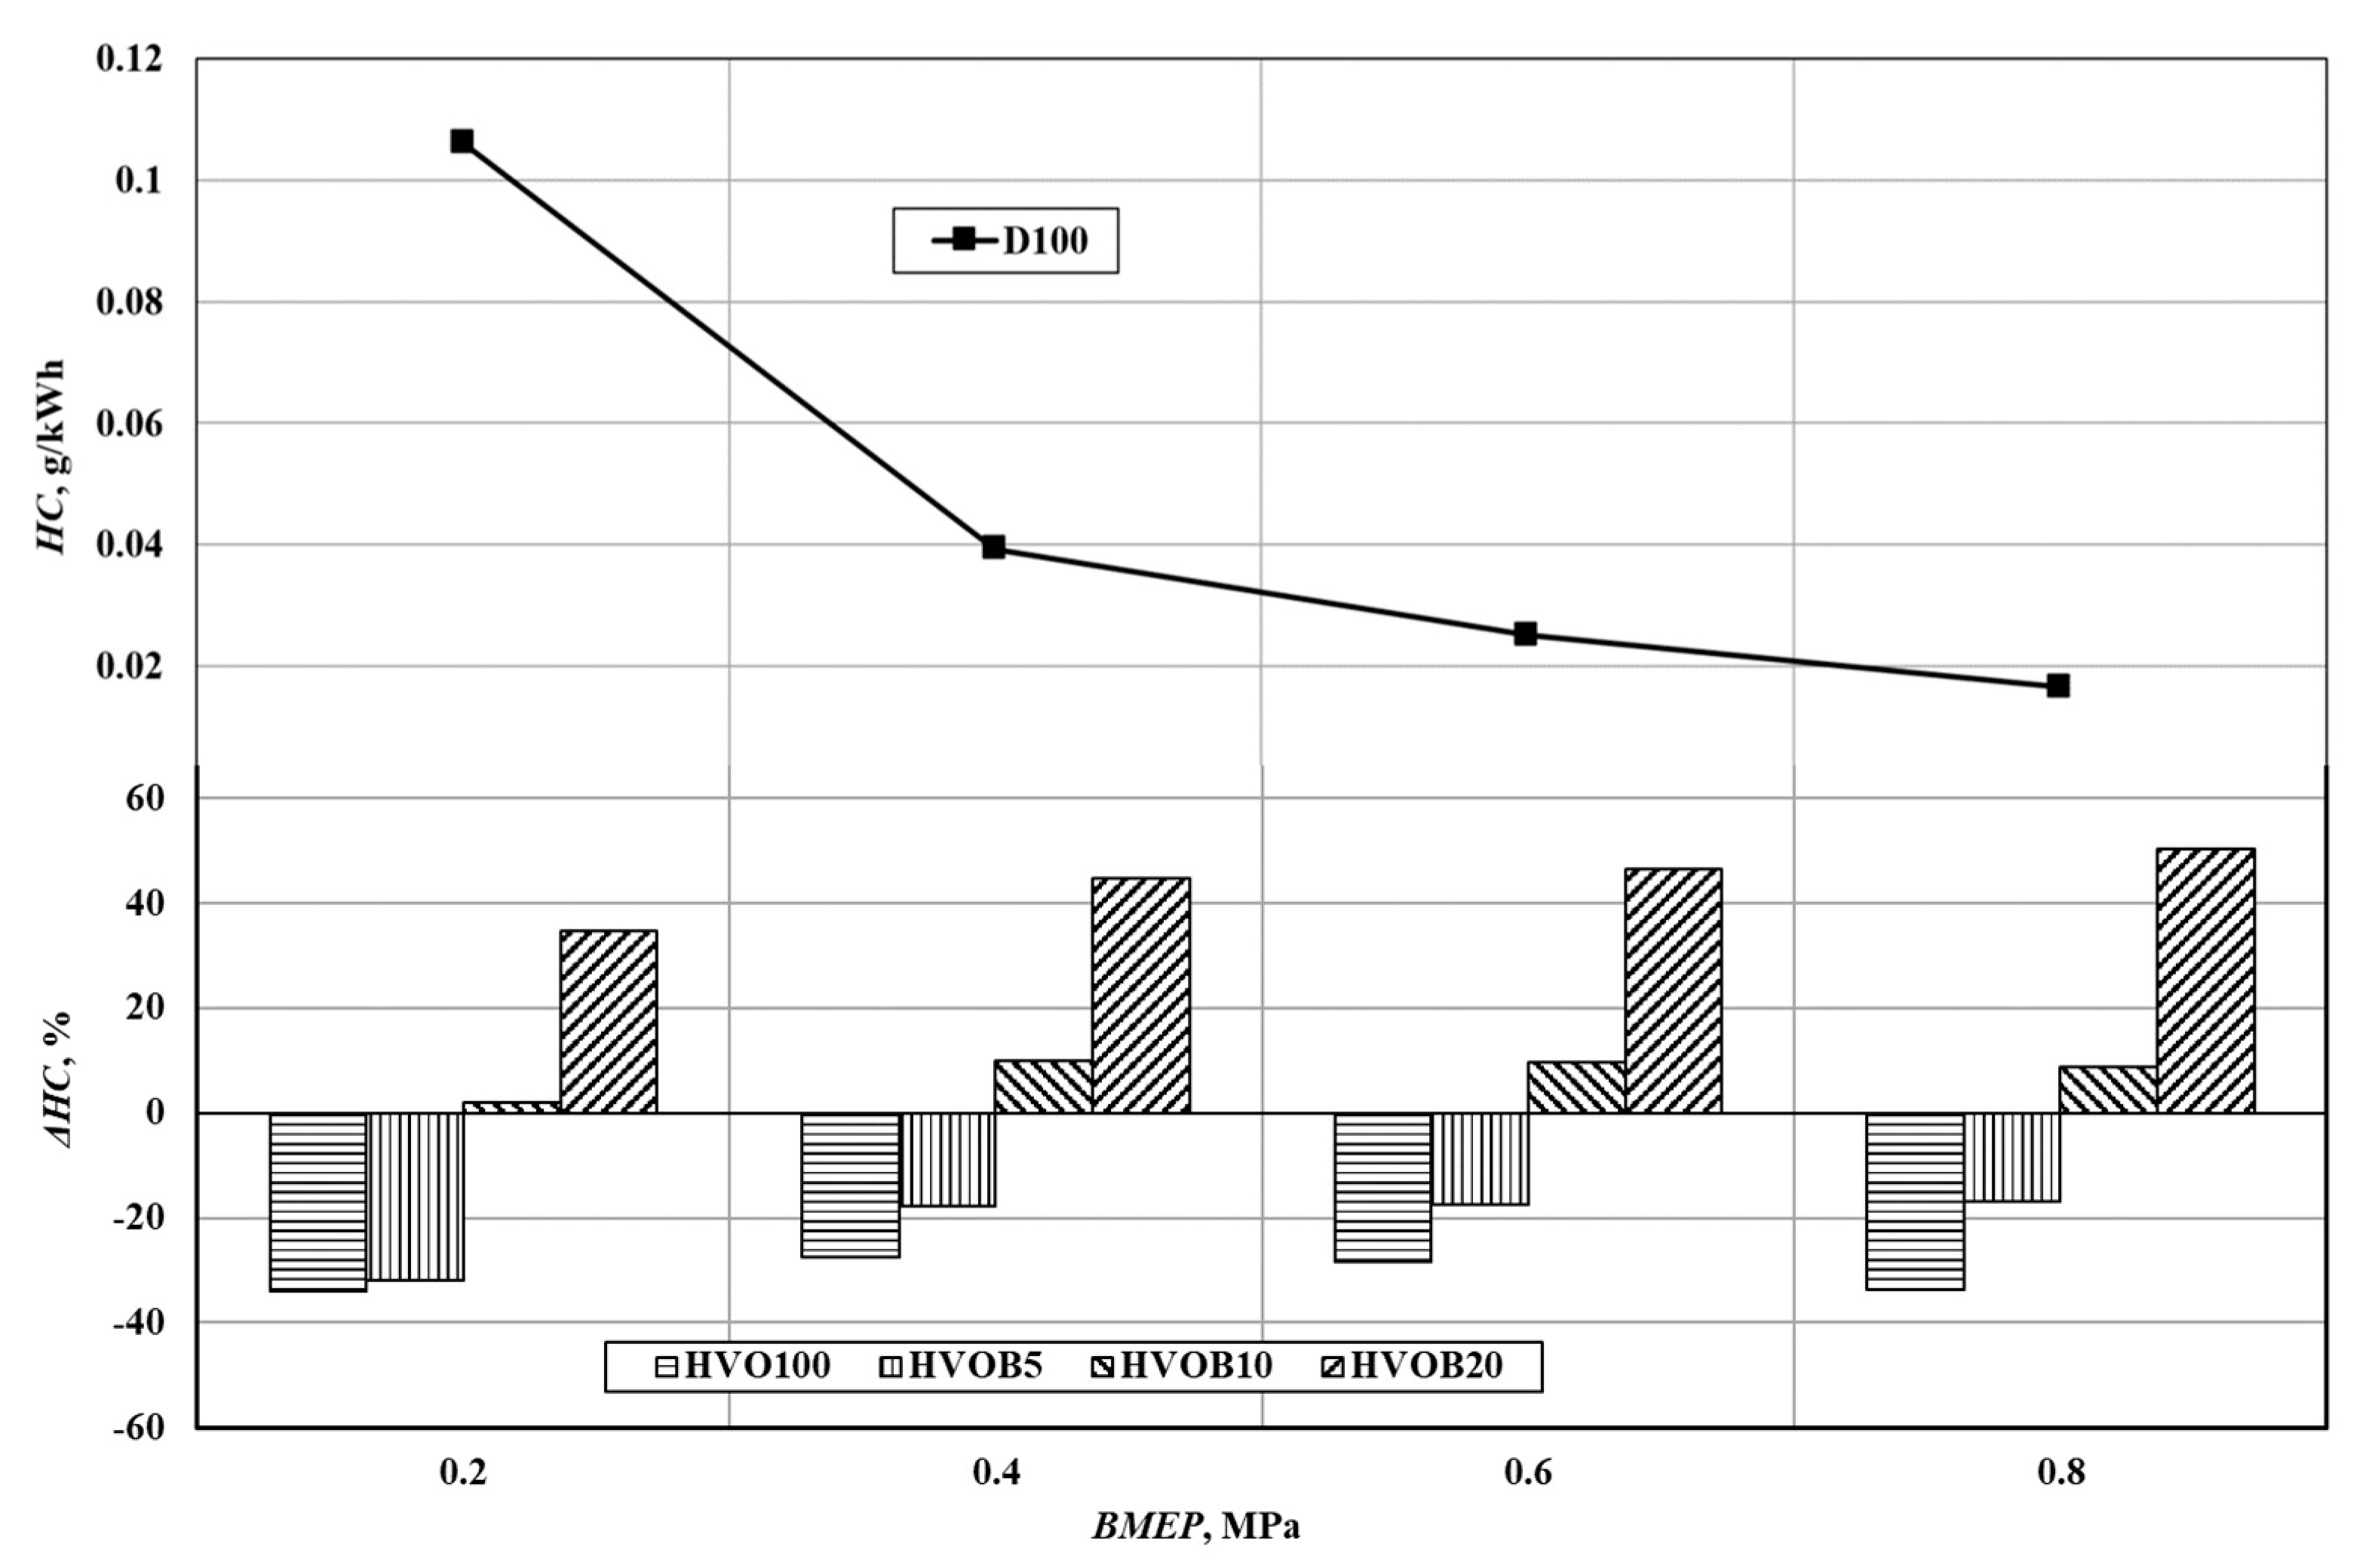
  • Due to the low C/H ratio of HVO100, B100 and its blends, CO2 emissions are reduced by approximately ~4–6% at any given load. A stable reduction of ~10–15% in NOX emissions was observed at all loads for all the fuel mixtures with HVO100. Due to its high CN (which is ~50% higher than that of D100) and a lower combustion intensity during the premixing phase, HVO100 is found to have a consistent decrease in nitrogen emissions at all loads. With an increase in butanol content, the CN of the fuel blends was reduced, thereby increasing their NOX emissions. HVO100 was found to have the lowest emissions of HC, with an average reduction of ~31% at all loads compared to D100. With an increase in butanol, the HC emissions were found to increase due to prolonged combustion. Furthermore, with an increase in O2 content and a decrease in the C/H ratio with an increasing butanol concentration, the smoke levels were found to decrease at a minimum of ~30%.

Author Contributions

Conceptualization, A.R. and S.M.R.; methodology, A.R., S.M.R. and J.M.; software, S.M.R. and A.R.; formal analysis, A.R. and J.M.; validation, A.R., S.M.R. and J.C.; writing—original draft preparation, S.M.R., J.C. and T.S.; writing—review and editing, A.R., J.M. and J.C.; supervision, A.R., J.M. and T.S.; project administration, J.M. All authors have read and agreed to the published version of the manuscript.

Funding

The project/research was financed in the framework of the project of Lublin University of Technology—Regional Excellence Initiative, funded by the Polish Ministry of Science and Higher Education (contract no. 030/RID/2018/19).

Institutional Review Board Statement

Not applicable.

Informed Consent Statement

Not applicable.

Data Availability Statement

Not applicable.

Acknowledgments

The authors thank the AVL company for the opportunity to use the engine simulation tool AVL BOOST, which was used to analyse the combustion process and present the results. A cooperation agreement has been concluded between the Faculty of the Transport Engineering of Vilnius Tech University and AVL Advanced Simulation Technologies. This work was prepared as part of the scientific internship of Eng. Jacek Caban, at the Institute of Mechanical Science of Vilnius Gediminas Technical University, which took place from 26 July to 6 August 2021.

Conflicts of Interest

The authors declare no conflict of interest.

Abbreviations

CNGCompressed Natural Gas
LNGLiquid Natural Gas
HVOHydro-treated Vegetable Oil
BTEBrake Thermal Efficiency
BSFCBrake Specific Fuel Consumption
ROHRRate of Heat Release
ECUElectronic Control Unit
SOIStart of Injection
bTDCbefore Top Dead Centre
CO2Carbon Dioxide
COCarbon Monoxide
HCHydro Carbons
NOxNitrogen Oxides
PMParticulate Matter

References

  1. Di Blasio, G.; Agarwal, A.K.; Belgiorno, G.; Shukla, P.C. Introduction to Clean Fuels for Mobility. In Clean Fuels for Mobility; Energy, Environment, and Sustainability; Di Blasio, G., Agarwal, A.K., Belgiorno, G., Shukla, P.C., Eds.; Springer: Singapore, 2022; pp. 3–7. ISBN 9789811687471. [Google Scholar]
  2. Mizik, T. Sustainable Fuels in Private Transportation–Present and Future Potential. In Clean Fuels for Mobility; Energy, Environment, and Sustainability; Di Blasio, G., Agarwal, A.K., Belgiorno, G., Shukla, P.C., Eds.; Springer: Singapore, 2022; pp. 9–26. ISBN 9789811687471. [Google Scholar]
  3. Marczak, H.; Droździel, P. Analysis of Pollutants Emission into the Air at the Stage of an Electric Vehicle Operation. J. Ecol. Eng. 2021, 22, 182–188. [Google Scholar] [CrossRef]
  4. Wasilewski, J.; Szyszlak-Bargłowicz, J.; Zając, G.; Szczepanik, M. Assessment of Co2 Emission by Tractor Engine at Varied Control Settings of Fuel Unit. Agric. Eng. 2020, 24, 105–115. [Google Scholar] [CrossRef]
  5. ACEA—European Automobile Manufacturers’ Association. Fuel Types of New Cars: Battery Electric 7.5%, Hybrid 19.3%, Petrol 41.8% Market Share in Q2 2021; ACEA—European Automobile Manufacturers’ Association: Brussels, Belgium, 2021. [Google Scholar]
  6. Czech, P.; Madej, H. Application of Cepstrum and Spectrum Histograms of Vibration Engine Body for Setting up the Clearance Model of the Piston-Cylinder Assembly for RBF Neural Classifier. Eksploat. Niezawodn. Maint. Reliab. 2011, 52, 15–20. [Google Scholar]
  7. Figlus, T.; Liściak, S. Assessment of the Vibroactivity Level of SI Engines in Stationary and Non-Stationary Operating Conditions. J. Vibroeng. 2014, 16, 1349–1359. [Google Scholar]
  8. Pielecha, J.; Skobiej, K.; Kurtyka, K. Exhaust Emissions and Energy Consumption Analysis of Conventional, Hybrid, and Electric Vehicles in Real Driving Cycles. Energies 2020, 13, 6423. [Google Scholar] [CrossRef]
  9. Rybicka, I.; Stopka, O.; L’uptak, V.; Chovancova, M.; Droździel, P. Application of the methodology related to the emission standard to specific railway line in comparison with parallel road transport: A case study. In MATEC Web of Conferences; EDP Sciences: Ulis, France, 2018; Volume 244, p. 03002. [Google Scholar] [CrossRef]
  10. Kukuča, P.; Barta, D.; Labuda, R.; Gechev, T. Engine with Unconventional Crank Mechanism FIK 1. In MATEC Web of Conferences; EDP Sciences: Ulis, France, 2018; Volume 244, p. 03004. [Google Scholar] [CrossRef] [Green Version]
  11. Mieczkowski, G.; Szpica, D.; Borawski, A.; Diliunas, S.; Pilkaite, T.; Leisis, V. Application of Smart Materials in the Actuation System of a Gas Injector. Materials 2021, 14, 6984. [Google Scholar] [CrossRef]
  12. Krzysiak, Z.; Bartnik, G.; Samociuk, W.; Zarajczyk, J.; Plizga, K.; Rachwal, B.; Wierzbicki, S.; Krzywonos, L.; Brumercik, F. Analiza zagrożenia bezpieczeństwa przeciwwybuchowego na stacji paliw ciekłych. Przem. Chem. 2017, 96, 279–282. [Google Scholar] [CrossRef]
  13. Longwic, R.; Nieoczym, A.; Kordos, P. Evaluation of the Combustion Process in a Spark-Ignition Engine Based on the Unrepeatability of the Maximum Pressure. In IOP Conference Series: Materials Science and Engineering; IOP Publishing: Bristol, UK, 2018; Volume 421, p. 042048. [Google Scholar] [CrossRef]
  14. Mamala, J.; Brol, S.; Graba, G. Hardware-in-the-Loop Type Simulator of Spark Ignition Engine Control Unit. In Proceedings of the 2013 International Symposium on Electrodynamic and Mechatronic Systems (SELM), Opole-Zawiercie, Poland, 15–18 May 2013; pp. 41–42. [Google Scholar]
  15. Szpica, D. Investigating Fuel Dosage Non-Repeatability of Low-Pressure Gas-Phase Injectors. Flow Meas. Instrum. 2018, 59, 147–156. [Google Scholar] [CrossRef]
  16. Aulin, D.; Klymenko, O.; Falendysh, A.; Kletska, O.; Dizo, J. Improvement of Diesel Injector Nozzle Test Techniques. In IOP Conference Series: Materials Science and Engineering; IOP Publishing: Bristol, UK, 2020; Volume 985, p. 012031. [Google Scholar] [CrossRef]
  17. Eliasz, J.; Osipowicz, T.; Abramek, K.F.; Matuszak, Z.; Mozga, Ł. Fuel Pretreatment Systems in Modern CI Engines. Catalysts 2020, 10, 696. [Google Scholar] [CrossRef]
  18. Osipowicz, T.; Abramek, K.F.; Matuszak, Z.; Jaskiewicz, M.; Ludwinek, K.A.; Lagowski, P. The Concept of Annular Channels Application on the Spraying Nozzle Needle of Modern Fuel Injector in the Aspect of Combustion Process Improvement. In Proceedings of the 2018 XI International Science-Technical Conference Automotive Safety, Častá, Slovakia, 18–20 April 2018; pp. 1–7. [Google Scholar]
  19. Punov, P.; Gechev, T.; Mihalkov, S.; Podevin, P.; Barta, D. Experimental Study of Multiple Pilot Injection Strategy in an Automotive Direct Injection Diesel Engine. In MATEC Web of Conferences; EDP Sciences: Ulis, France, 2018; Volume 234, p. 03007. [Google Scholar] [CrossRef]
  20. Wierzbicki, S.; Śmieja, M. Use of Biogas to Power Diesel Engines with Common Rail Fuel Systems. In MATEC Web of Conferences; EDP Sciences: Ulis, France, 2018; Volume 182, p. 01018. [Google Scholar] [CrossRef] [Green Version]
  21. Hurtová, I.; Sejkorová, M.; Verner, J. A Study of Diesel Particulate Filter Impact on Engine Oil Quality. In Proceedings of the Transport Means—Proceedings of the International Conference, Palanga, Litwa, 2–4 October 2019; Technologija: Kaunas, Lithuania, 2019; pp. 691–695. [Google Scholar]
  22. Gritsuk, I.; Volkov, V.; Gutarevych, Y.; Mateichyk, V.; Verbovskiy, V. Improving Engine Pre-Start and after-Start Heating by Using the Combined Heating System; SAE International: Warrendale, PA, USA, 27 September 2016; No. 2016-01-8071. [Google Scholar]
  23. Sejkorová, M.; Šarkan, B.; Verner, J. Efficiency Assessment of Fuel Borne Catalyst. In MATEC Web of Conferences; EDP Sciences: Ulis, France, 2017; Volume 134, p. 00051. [Google Scholar] [CrossRef]
  24. Fabiś, P.; Flekiewicz, M. Optimalisation of the SI Engine Timing Advance Fueled by LPG. Sci. J. Silesian Univ. Technol. Ser. Transp. 2021, 111, 33–41. [Google Scholar] [CrossRef]
  25. Šarkan, B.; Hudec, J.; Sejkorova, M.; Kuranc, A.; Kiktova, M. Calculation of the Production of Exhaust Emissions in the Laboratory Conditions. In Journal of Physics: Conference Series; IOP Publishing: Bristol, UK, 2021; Volume 1736, p. 012022. [Google Scholar] [CrossRef]
  26. Ding, S.-L.; Song, E.-Z.; Yang, L.-P.; Litak, G.; Wang, Y.-Y.; Yao, C.; Ma, X.-Z. Analysis of Chaos in the Combustion Process of Premixed Natural Gas Engine. Appl. Therm. Eng. 2017, 121, 768–778. [Google Scholar] [CrossRef]
  27. Lebedevas, S.; Čepaitis, T. Parametric Analysis of the Combustion Cycle of a Diesel Engine for Operation on Natural Gas. Sustainability 2021, 13, 2773. [Google Scholar] [CrossRef]
  28. Bialy, M.; Wendeker, M.; Magryta, P.; Czyz, Z.; Sochaczewski, R. CFD Model of the Mixture Formation Process of the CNG Direct Injection Engine; SAE International: Warrendale, PA, USA, 13 October 2014; No. 2014-01–2575. [Google Scholar]
  29. Szpica, D.; Dziewiątkowski, M. Catalyst Conversion Rates Measurement on Engine Fueled with Compressed Natural Gas (CNG) Using Different Operating Temperatures. Mechanika 2021, 27, 492–497. [Google Scholar] [CrossRef]
  30. Khan, M.I.; Yasmin, T.; Shakoor, A. Technical Overview of Compressed Natural Gas (CNG) as a Transportation Fuel. Renew. Sustain. Energy Rev. 2015, 51, 785–797. [Google Scholar] [CrossRef]
  31. Jurkovič, M.; Kalina, T.; Skrúcaný, T.; Gorzelanczyk, P.; Ľupták, V. Environmental Impacts of Introducing LNG as Alternative Fuel for Urban Buses—Case Study in Slovakia. Promet-Traffic Transp. 2020, 32, 837–847. [Google Scholar] [CrossRef]
  32. Langshaw, L.; Ainalis, D.; Acha, S.; Shah, N.; Stettler, M.E.J. Environmental and Economic Analysis of Liquefied Natural Gas (LNG) for Heavy Goods Vehicles in the UK: A Well-to-Wheel and Total Cost of Ownership Evaluation. Energy Policy 2020, 137, 111161. [Google Scholar] [CrossRef]
  33. Jurkovič, M.; Kalina, T. Posúdenie pevnostných charakteristík LNG nádrží na plavidlách. Perner’s Contacts 2019, 14, 74–80. [Google Scholar]
  34. Duda, K.; Wierzbicki, S.; Mikulski, M.; Konieczny, Ł.; Łazarz, B.; Letuń-Łątka, M. Emissions from a medium-duty crdi engine fuelled with diesel-biodiesel blends. Transp. Probl. 2021, 16, 39–49. [Google Scholar] [CrossRef]
  35. Górski, K.; Sander, P.; Longwic, R. The Assessment of Ecological Parameters of Diesel Engine Supplied with Mixtures of Canola Oil with N-Hexane. In IOP Conference Series: Materials Science and Engineering; IOP Publishing: Bristol, UK, 2018; Volume 421, p. 042025. [Google Scholar] [CrossRef]
  36. Hunicz, J.; Mikulski, M.; Shukla, P.C.; Gęca, M.S. Partially Premixed Combustion of Hydrotreated Vegetable Oil in a Diesel Engine: Sensitivity to Boost and Exhaust Gas Recirculation. Fuel 2022, 307, 121910. [Google Scholar] [CrossRef]
  37. Labaj, J.; Barta, D. Unsteady Flow Simulation and Combustion of Ethanol in Diesel Engines. Komunikácie 2006, 8, 27–37. [Google Scholar] [CrossRef]
  38. Tucki, K.; Orynycz, O.; Wasiak, A.; Świć, A.; Mieszkalski, L.; Wichłacz, J. Low Emissions Resulting from Combustion of Forest Biomass in a Small Scale Heating Device. Energies 2020, 13, 5495. [Google Scholar] [CrossRef]
  39. Zdziennicka, A.; Szymczyk, K.; Jańczuk, B.; Longwic, R.; Sander, P. Surface, Volumetric, and Wetting Properties of Oleic, Linoleic, and Linolenic Acids with Regards to Application of Canola Oil in Diesel Engines. Appl. Sci. 2019, 9, 3445. [Google Scholar] [CrossRef] [Green Version]
  40. Holjevac, N.; Cheli, F.; Gobbi, M. Multi-Objective Vehicle Optimization: Comparison of Combustion Engine, Hybrid and Electric Powertrains. Proc. Inst. Mech. Eng. Part D J. Automob. Eng. 2020, 234, 469–487. [Google Scholar] [CrossRef]
  41. Gil, L.; Pieniak, D.; Walczak, M.; Ignaciuk, P.; Sawa, J. Impact of acid number of fuels on the wear process of apparatus for fuel injection in diesel engines. Adv. Sci. Technol. Res. J. 2014, 8, 54–57. [Google Scholar] [CrossRef]
  42. Aatola, H.; Larmi, M.; Sarjovaara, T.; Mikkonen, S. Hydrotreated Vegetable Oil (HVO) as a Renewable Diesel Fuel: Trade-off between NOₓ, Particulate Emission, and Fuel Consumption of a Heavy Duty Engine. SAE Int. J. Engines 2009, 1, 1251–1262. [Google Scholar] [CrossRef] [Green Version]
  43. Gowdagiri, S.; Cesari, X.M.; Huang, M.; Oehlschlaeger, M.A. A Diesel Engine Study of Conventional and Alternative Diesel and Jet Fuels: Ignition and Emissions Characteristics. Fuel 2014, 136, 253–260. [Google Scholar] [CrossRef]
  44. AECC Position on Euro 7/VII. EURO 7/VII Emission Standards. For Cars, Vans, Buses and Trucks. Available online: https://www.aecc.eu/wp-content/uploads/2021/06/210628-AECC-position-on-Euro-7-final.pdf (accessed on 14 May 2022).
  45. Chen, H.; Su, X.; He, J.; Zhang, P.; Xu, H.; Zhou, C. Investigation on Combustion Characteristics of Cyclopentanol/Diesel Fuel Blends in an Optical Engine. Renew. Energy 2021, 167, 811–829. [Google Scholar] [CrossRef]
  46. Tunér, M. Combustion of Alternative Vehicle Fuels in Internal Combustion Engines; The Swedish Knowledge Centre of Renewable Transportation: Lund, Sweden, 2015; p. 40. [Google Scholar]
  47. Vojtisek-Lom, M.; Beránek, V.; Mikuška, P.; Křůmal, K.; Coufalík, P.; Sikorová, J.; Topinka, J. Blends of Butanol and Hydrotreated Vegetable Oils as Drop-in Replacement for Diesel Engines: Effects on Combustion and Emissions. Fuel 2017, 197, 407–421. [Google Scholar] [CrossRef]
  48. Pflaum, H.; Hofmann, P.; Geringer, B.; Weissel, W. Potential of Hydrogenated Vegetable Oil (HVO) in a Modern Diesel Engine; SAE International: Warrendale, PA, USA, 2010. [Google Scholar]
  49. Parravicini, M.; Barro, C.; Boulouchos, K. Experimental Characterization of GTL, HVO, and OME Based Alternative Fuels for Diesel Engines. Fuel 2021, 292, 120177. [Google Scholar] [CrossRef]
  50. Shepel, O.; Matijošius, J.; Rimkus, A.; Duda, K.; Mikulski, M. Research of Parameters of a Compression Ignition Engine Using Various Fuel Mixtures of Hydrotreated Vegetable Oil (HVO) and Fatty Acid Esters (FAE). Energies 2021, 14, 3077. [Google Scholar] [CrossRef]
  51. Giakoumis, E.G.; Rakopoulos, C.D.; Dimaratos, A.M.; Rakopoulos, D.C. Exhaust Emissions with Ethanol or N-Butanol Diesel Fuel Blends during Transient Operation: A Review. Renew. Sustain. Energy Rev. 2013, 17, 170–190. [Google Scholar] [CrossRef]
  52. Zhang, Q.; Yao, M.; Zheng, Z.; Liu, H.; Xu, J. Experimental Study of N-Butanol Addition on Performance and Emissions with Diesel Low Temperature Combustion. Energy 2012, 47, 515–521. [Google Scholar] [CrossRef]
  53. Chen, H.; He, J.; Chen, Z.; Geng, L. A Comparative Study of Combustion and Emission Characteristics of Dual-Fuel Engine Fueled with Diesel/Methanol and Diesel–Polyoxymethylene Dimethyl Ether Blend/Methanol. Process Saf. Environ. Prot. 2021, 147, 714–722. [Google Scholar] [CrossRef]
  54. Han, J.; Bao, H.; Somers, L.M.T. Experimental Investigation of Reactivity Controlled Compression Ignition with N-Butanol/n-Heptane in a Heavy-Duty Diesel Engine. Appl. Energy 2021, 282, 116164. [Google Scholar] [CrossRef]
  55. Žvar Baškovič, U.; Vihar, R.; Rodman Oprešnik, S.; Seljak, T.; Katrašnik, T. RCCI Combustion with Renewable Fuel Mix—Tailoring Operating Parameters to Minimize Exhaust Emissions. Fuel 2022, 311, 122590. [Google Scholar] [CrossRef]
  56. Choudhary, P.; Rao, B.; Sharma, N. Butanol Fuel in Internal Combustion Engines. In Application of Clean Fuels in Combustion Engines; Energy, Environment, and Sustainability; Di Blasio, G., Agarwal, A.K., Belgiorno, G., Shukla, P.C., Eds.; Springer: Singapore, 2022; pp. 103–116. ISBN 9789811687518. [Google Scholar]
  57. Karagöz, M. Investigation of Performance and Emission Characteristics of an CI Engine Fuelled with Diesel—Waste Tire Oil—Butanol Blends. Fuel 2020, 282, 118872. [Google Scholar] [CrossRef]
  58. Kumar Sharma, P.; Sharma, D.; Lal Soni, S.; Jhalani, A.; Singh, D.; Sharma, S. Energy, Exergy, and Emission Analysis of a Hydroxyl Fueled Compression Ignition Engine under Dual Fuel Mode. Fuel 2020, 265, 116923. [Google Scholar] [CrossRef]
  59. Rakopoulos, C.D.; Dimaratos, A.M.; Giakoumis, E.G.; Rakopoulos, D.C. Investigating the Emissions during Acceleration of a Turbocharged Diesel Engine Operating with Bio-Diesel or n-Butanol Diesel Fuel Blends. Energy 2010, 35, 5173–5184. [Google Scholar] [CrossRef]
  60. Rakopoulos, D.C.; Rakopoulos, C.D.; Giakoumis, E.G.; Papagiannakis, R.G.; Kyritsis, D.C. Influence of Properties of Various Common Bio-Fuels on the Combustion and Emission Characteristics of High-Speed DI (Direct Injection) Diesel Engine: Vegetable Oil, Bio-Diesel, Ethanol, n-Butanol, Diethyl Ether. Energy 2014, 73, 354–366. [Google Scholar] [CrossRef]
  61. Miers, S.A.; Carlson, R.W.; McConnell, S.S.; Ng, H.K.; Wallner, T.; LeFeber, J. Video & Multimedia, Esper Images. Drive Cycle Analysis of Butanol/Diesel Blends in a Light-Duty Vehicle; SAE International: Warrendale, PA, USA, 2008. [Google Scholar]
  62. Karthick, C.; Nanthagopal, K. A comprehensive review on ecological approaches of waste to wealth strategies for production of sustainable biobutanol and its suitability in automotive applications. Energy Convers. Manag. 2021, 239, 114219. [Google Scholar] [CrossRef]
  63. Zöldy, M. Fuel Properties of Butanol—Hydrogenated Vegetable Oil Blends as a Diesel Extender Option for Internal Combustion Engines. Period. Polytech. Chem. Eng. 2020, 64, 205–212. [Google Scholar] [CrossRef]
Figure 1. Engine schematic diagram. 1—Air Mass flow meter; 2—turbocharger; 3—exhaust gas analyzer; 4—smoke analyzer; 5—temperature sensor; 6—air cooler; 7—turbocharger pressure meter; 8—EGR valve; 9—exhaust gas temperature meter; 10—intake gas temperature meter; 11—cylinder pressure sensor; 12—fuel tank; 13—fuel consumption calculation equipment; 14—injection pump crankshaft; 15—fuel injection timing sensor; 16—position sensor; 17—connecting shaft; 18—cylinder pressure recording equipment; 19–21—fuel injection moment control equipment fuel consumption calculation equipment; 20—fuel injection moment recording equipment; 21—engine torque and rotational speed recording equipment; 22—engine load plate.
Sustainability 14 07324 g001
Figure 2. In-cylinder pressure with crank angle.
Sustainability 14 07324 g002
Figure 3. Pressure rise with crank angle.
Sustainability 14 07324 g003
Figure 4. Temperature rise with crank angle.
Sustainability 14 07324 g004
Figure 5. Rate of heat release with crank angle.
Sustainability 14 07324 g005
Figure 6. Change in Bf in comparison to D100 with increasing load.
Sustainability 14 07324 g006
Figure 7. Change in BSFC in comparison to D100 with increasing load.
Sustainability 14 07324 g007
Figure 8. Change in BTE in comparison to D100 with increasing load.
Sustainability 14 07324 g008
Figure 9. Change in CO2 in comparison to D100 with increasing load.
Sustainability 14 07324 g009
Figure 10. Change in NOX in comparison to D100 with increasing load.
Sustainability 14 07324 g010
Figure 11. Change in HC in comparison to D100 with increasing load.
Sustainability 14 07324 g011
Figure 12. Change in Smoke in comparison to D100 with increasing load.
Sustainability 14 07324 g012
Table 1. Engine specifications.
ParameterValue
Fuel injectionDirect injection (single)
Fuel injection-pump designAxial-piston distributor injection pump
Displacement (cm3)1896
No. of cylinders4
Compression ratio19.5
Power (kW)66 (4000 rpm)
Torque (Nm)180 (2000–25,000 rpm)
Bore (mm)79.5
Stroke (mm)95.5
Nozzle typeHole-type
Nozzle and holder assemblyTwo-spring
Nozzle opening pressure (bar)200
Table 2. Properties of 100% pure diesel fuel, hydrotreated vegetable oil and butanol.
PROPERTIESD100HVO100B100
Density (kg/m3)835779809.8
Mass Fraction (%): Carbon86.084.664.82
Hydrogen13.915.413.6
Oxygen0.10.0021.59
C/H6.195.494.77
LHV, MJ/kg42.3143.7433.1
Cetane number51.076.325.0
Table 3. Properties of prepared fuel mixtures.
PROPERTIESD100HVO100HVOB5HVOB10HVOB20
Density (kg/m3)835779780.6782.19785.35
Mass Fraction (%): Carbon86.084.683.5782.5580.52
Hydrogen13.915.415.3115.2115.03
Oxygen0.10.001.122.244.45
C/H6.195.495.465.435.36
LHV, MJ/kg42.3143.7443.1942.6441.54
Cetane number51.076.373.6470.9965.72
Table 4. Indicators of combustion process.
FuelsSOI, CAD BTDCSOC, CAD BTDCDelay, CADCD, CAD
D1007.02.05.068.0
HVO1007.03.04.069.0
HVOB57.02.64.469.4
HVOB107.02.54.569.7
HVOB207.02.44.670.0
Publisher’s Note: MDPI stays neutral with regard to jurisdictional claims in published maps and institutional affiliations.

