1. Introduction
The plastic packaging of food products greatly increases the durability of food products and has a significant impact on the sustainability of the food industry and trade in food products. In recent years, plastics have revolutionized the lives of most people in the world and, above all, the food packaging industry. The investigations cover sustainability management and the contested plastic food packaging [
1], food packaging materials [
2], and even the impact of the colour of food packaging on consumer choice [
3].
In 2020, the production of plastics in the world amounted to almost 367 million tonnes [
4]. The data presented in The Plastics Europe Report, Polish Central Statistical Office, Eurostat show that the largest amount of plastics (almost 51%), came from Asia, including as much as 32% from China itself [
5]. Europe is responsible for 15% of all produced plastic (less than 62 million tonnes) [
6].
In Europe, the highest demand for plastics is shown in the packaging industry (about 40%). The second most significant segment is the construction industry, with a share of less than 20%. According to Plastic Europe, the total demand for plastics in Europe amounted to less than 52 million tonnes, which indicates an increase of approximately 0.4% when compared to the previous year [
7]. The largest consumer of European plastics is Germany with a demand of 12.5 million tonnes per year. The value of plastics exports in 2018 from the EU amounted to EUR 221.7 billion [
8]. The share of all EU countries in global exports amounted to less than 40%. The value of imported plastics by EU countries in 2018 amounted to almost EUR 209 billion, and the share of EU countries in global imports amounted to 37%. The main trading partner of Europe in 2018 in the trade of plastics was the United States [
9].
In 2018, companies producing plastic products employed over 1.6 million employees (only in Europe). The ten largest producer countries employed almost 80% of the workforce in that industry. Poland was the second in terms of the number of people employed in the plastics industry and first in terms of the number of companies producing plastic products. The plastic industry saw an increase in labor costs by up to 10%. Raw materials, however, are the key cost for the plastics industry.
Despite the restrictions on the use of plastics resulting from European Union directives, Poland’s demand for them is constantly growing. As a result, in recent years, this industry has been developing much faster compared to the entire economy and other industry sectors. According to the data, the consumption of plastics in Poland fluctuates at the level of approx. 3.6 million tonnes /year, which means that it increased by approx. 7% compared to the previous year. This ranks Poland in 6th place in Europe in terms of plastic consumption. Forecasts for 2023 indicate that growth will remain at a similar level (just over 3%). The constantly growing demand for this raw material means that Poland imports a significant amount of plastic, which creates a negative balance of foreign trade.
The challenge for enterprises is to implement the maintenance function so as to maintain the constant operational efficiency of the devices on the one hand, and on the other hand, to ensure that the costs of maintaining efficiency are at a level acceptable to the enterprise [
10]. For every manufacturing company, the source that generates avoidable costs are failures and downtime of machines, equipment, and installations [
11]. It is their reliability that directly affects the productivity of the company. The more often failures and downtime occur, the smaller the number of finished products, which translates to the financial result of the organization [
12].
The sustainable production and development of products is a continuous process [
13]. Sustainable production technologies that can reduce costs and waste are becoming increasingly accessible and efficient. IT systems to support production management and experienced employees are needed [
14].
Machines working in automated production lines must be properly maintained, because the failure of any of these elements causes downtime of the entire production line. The exploitation strategy should therefore be developed in a manner adequate to the different types of machinery and equipment [
15].
The aim of this work was to analyze the issues of plastic packaging production in the context of the sustainability of production process and to identify the causes of post-production waste formation. Despite the increasing level of public awareness of the dangers of plastic bags and the increasingly restrictive policies of European Union countries, demand for plastic packaging is permanently growing. The present article provides analysis of the course of the production process of foil packaging in the selected company, which is one of the most important producers in Poland. Moreover, it indicates the causes and locations of post-production waste formation and presents the countermeasures that can be applied to eliminate production losses.
It seems also clear that, especially in the plastic industry, there exist so many materials and technologies that practically each producer and each product requires independent, separate analysis, and a dedicated path to reach sustainability. It is therefore worth analyzing the individual cases that after some time might lead to more general conclusions.
The knowledge of a material’s behavior in production processes is a necessary step to correct management of material flow and reduce waste.
The list below contains a set of the most important quantities used in the calculations with the appropriate symbols and units (
Table 1). The table below also lists the most important abbreviations used in the article.
Background
Thanks to their comfortable, reliable, and, above all, functional form, plastics are used in almost every area of everyday life, e.g., in construction products and motorization [
16,
17]. Producers of plastics are under continuous pressure from legislative institutions and society [
18]. It results from the enormous environmental pollution with plastic waste [
19]. Unfortunately, products made of plastics, especially used food packages, are often treated as single-use products, which are thrown away after their use and begin to affect the environment [
20,
21]. During the decomposition processes they can release harmful substances into the ecosystem. Thus, the use of synthetic materials is not the problem; rather, the problem is the lack of recycling and lack of closure of the loop involving the resource–product–resource cycle [
22]. It is estimated that 20% of plastics produced all over the world end up in the environment in an uncontrolled manner. This creates tens of millions of tonnes of plastic waste per year, of which about 8 million tonnes goes to the seas and oceans. The rest remains on land: in soil, lakes, and rivers. For this reason, in 2018 the European Commission developed a Plastics Strategy, implementing it by elaborating a package of directives related to the circular economy, which is based on meeting the needs of consumers without overexploitation of the environment. Introduced in May 2019, Directive 2019/904 of the European Parliament and of the Council takes into account the issues of extended producer responsibility, increasing the use of biodegradable materials and partial elimination of single-use products (no straws, plastic cutlery etc.) [
23]. Moreover, it should be mentioned that biodegradability is not an ideal solution for plastic waste management. The biological, as well as physico-chemical, degradation of plastics in the environment takes place in several stages including micro- and nano-particles, and various chemical species that might have unrecognized harmful effects on living organisms [
24].
The policy of sustainable development is an indispensable element of the strategy of the world’s largest manufacturers (regardless of the type of products supplied) [
25]. The main objective of sustainable development is to minimize the negative impact of our operations on the environment by further reducing greenhouse gas emission rates, increasing energy efficiency in terms of electricity used, reducing waste, and implementing closed-loop economy principles [
26]. Other environmental measures taken by the world’s largest manufacturers include increasing the number of “Go for Nature” eco-friendly product lines [
27] and increasing the proportion of recyclable cardboard packaging [
28]. In addition, further promotion of diversity and equality among employees is strongly encouraged (the objective of equalizing the remuneration of persons of different sexes performing similar work) [
29]. The long-term goal for global manufacturers is to achieve the prestigious MSCI (Morgan Stanley Capital International) ESG (Environmental, Social, and Governance) rating of A+ recognizing global sustainability leaders. In the product area, two processes are extremely important [
30]. Firstly, there is a growing need to be part of a closed loop economy model (involving better use of raw materials and extending the life-cycle value of products) and to ensure that all human rights are respected in the supply chain. Moreover, the necessity to minimize the impact of the business on the environment is stressed, e.g., by reducing greenhouse gas emissions and amount of waste generated, as well as improving energy efficiency [
31]. Therefore, there is a need to systematize and intensify the calculation of GHG (greenhouse gas) emissions and to identify their source throughout the value chain more accurately in line with the European Commission’s guidelines and the recommendations of the Task Force on Climate-Related Financial Disclosures.
The term sustainability is particularly emphasized in the missions and strategies of film packaging companies [
32]. These companies declare that they are reducing to a necessary minimum the consumption of materials and resources required to manufacture products, while working to improve the recyclability of their products. In practice, the sustainability approach often has to give way to deadlines and costs accounting. This approach may also contribute to a decrease of serious environmental burden caused by plastic wastes [
33].
An average European produces around 473 kg of waste a year [
34]. Eurostat data show that over 170 kg is waste from packaging, of which about 33 kg is plastic packaging. In total, this is 15.8 million tonnes of waste in the EU in one year. The amount of plastic waste generated per person ranges from 12 kg in Croatia to 60 kg in Ireland. For all Member States, this amount has risen steadily over the past decade. About 40% of this waste is recycled, with the highest share recorded in Slovenia (63%) and the lowest in Finland (24%).
The problems with recycling and also storage in overloaded landfills, caused by the increase in the use of disposable packaging and their diversity, appeared as early as the 1980s. The range of various plastic waste materials showed the need to implement newer and newer industrial solutions to use residual waste.
2. Materials and Methods
In the first stage, information on the volume of production and the amount of production waste over the last few years was analyzed. Subsequently, the research was limited to 31 days (August), selected due to the introduction of new production machines to the hall. In the selected period, the production process was analyzed and discussions were held with production managers, machine operators, and mechanics. In the next step, documents were analyzed to collect data on the number of failures, downtime, uptime, failure time, shortages, and cycle time. In addition to the weekly OEE cards, documents containing information about failures were analyzed, allowing data to be collected on the number of repair events, failure time, time to start repairs, and time between subsequent failures. After 31 days, the data were systematized and then analyzed.
The research methods include direct observations, analysis of documents, and comparison of the results with the literature, as well as with the expert knowledge of our team.
As part of the research, a short failure analysis was also carried out. Failures are associated not only with production losses, but also with repair costs. Repair costs often greatly exceed the cost of maintenance, which can be performed on a regular basis to eliminate potential failures. Hence, the implementation of autonomous machine maintenance seems to be the right maintenance strategy.
Occurrence of failures obviously can be correlated with the amount of production wastes appearing in the process. It can also be associated with an increase of energy consumption related to the amount of goods or products, and to energy losses connected to waste collection, recycling, or other means of utilization.
2.1. Subject of Analysis
The company is a part of a global corporation and deals only with “food packing”, i.e., technologies for storing and distributing food. Its main goal is to create food packaging that can significantly extend the shelf life without affecting the properties of the food product. The packages must have high tightness and barrier properties in order to protect the food against spoilage and the negative influence of the packaging and the environment on the organoleptic characteristics of a contained food. Vacuum packaging systems in a controlled and/or modified atmosphere require the appropriate barrier properties, and tightness of welded joints. Unfortunately, these barrier requirements can create recycling problems. Some of the materials that are used have a layer containing chlorine, which (unfortunately) excludes the possibility of reuse or recycling. Therefore, significant work is focused on methods to replace these materials with new substitutes without a problematic barrier.
The investigated company produces heat-shrinkable films used in the production of food packaging, called bags. The bags are divided into two types according to the location of the seal. They can have two side seals (product from an SS machine, SS—Shrink Sleeve) or one bottom seal (product from an ES machine, ES—End Seal). The bags can be made of various materials. The company uses 21 different types of raw material, differing mainly in thickness. This diversification allows the material to be matched to customer requirements. Customers can also choose a bag size from 80 mm to 650 mm in width and with no limit in length. In addition to the material types and sizes, the customer can also choose the form of packaging. The bags can be on tapes—when the customer uses a mechanized packaging process, or “collected” bags, intended for manual packaging. On special request, it is possible to produce bags with a logo or an imprint. In addition to the above-mentioned options, the customer may have additional requirements. Such extra wishes are called SPIs (Serial Peripheral Interface). Mainly, SPIs relate to the powder content on the packaging. Powder, i.e., corn meal, is a raw material supporting the process of arranging the bags.
2.2. Maintenance System in the Company
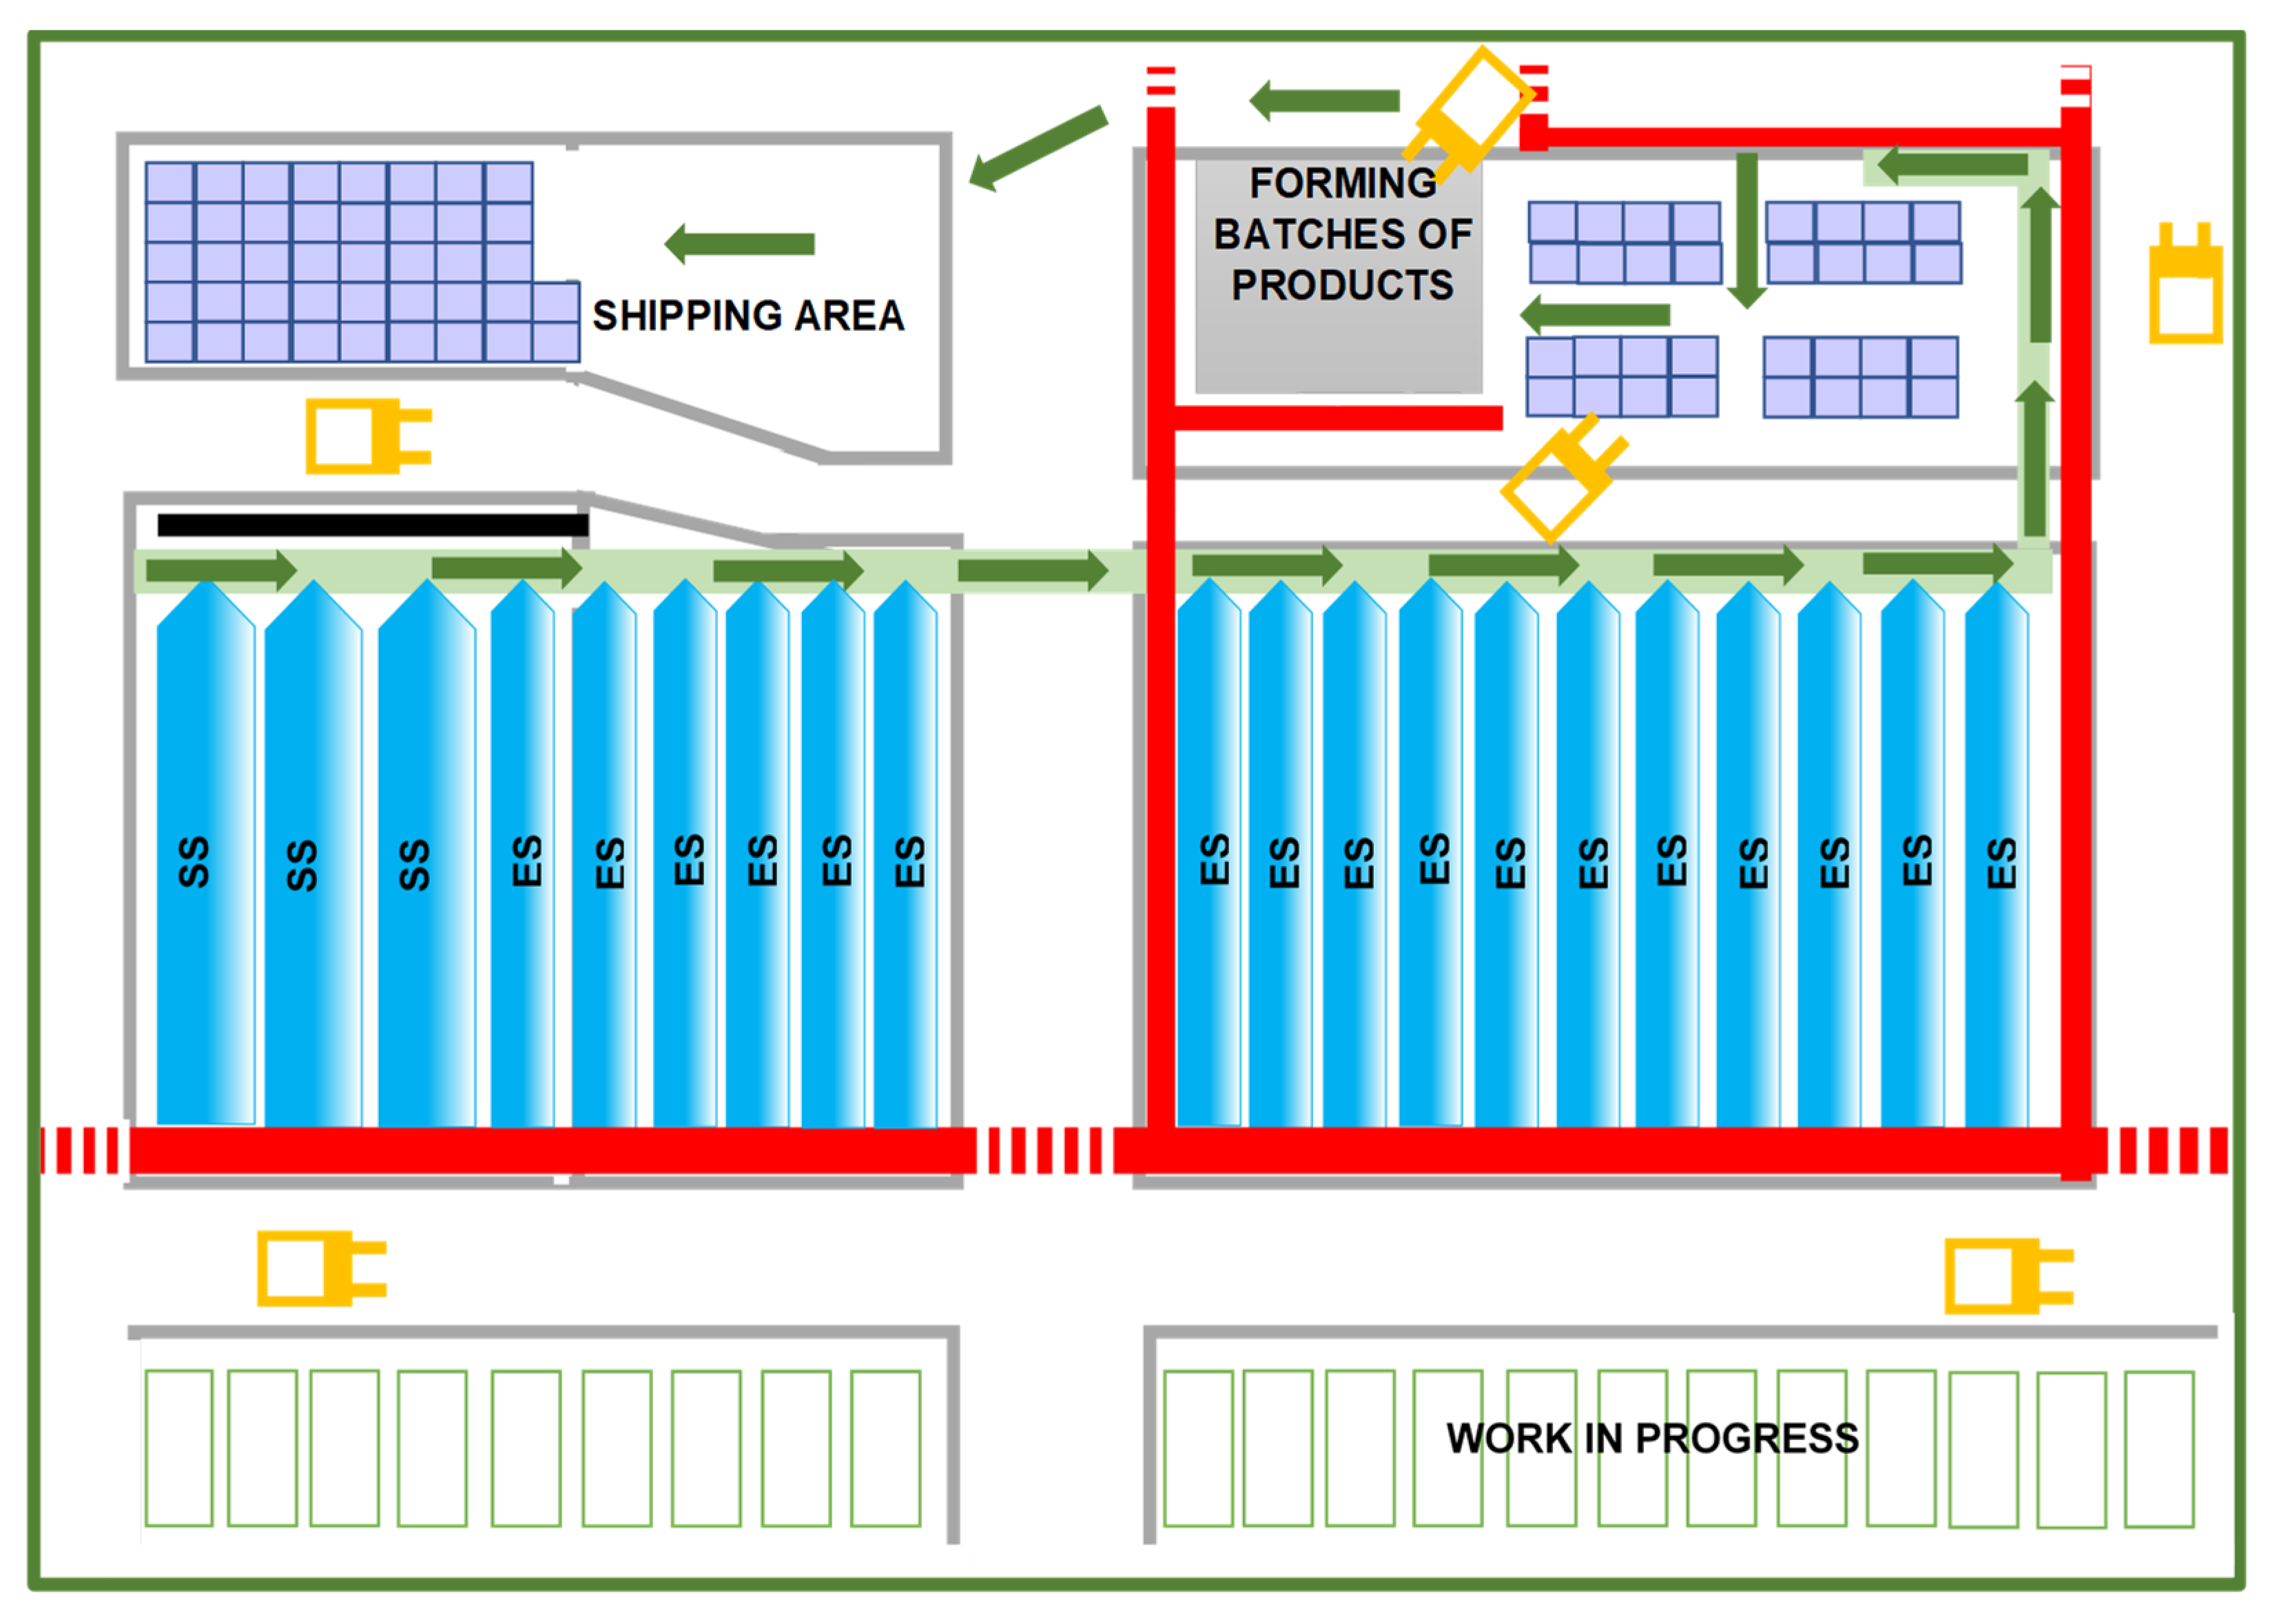
Figure 1 shows a diagram of the production hall of the analyzed company. The production process begins with the acceptance of the customer’s order. Customer service generates an order in the SAP system in accordance with the customer’s requirements. The order specifies such details as quantity, type of material, dimensions of the bags, type of packaging, and date on which the bags should reach the customer. Verification of orders in SAP is carried out by the planning department, the availability of material for the service is checked, and the production date is set. If material is out of stock, the planning department must order this material. The raw material suppliers are sister factories, so if the material is in the warehouse of one of the plants, the waiting period does not exceed 3 days. If material is not available, the waiting time depends on the workload of the extrusion department. The advantage of having sister factories is the possibility of transferring orders to another plant. It happens, for example, during a breakdown of one of the machines, when the timeliness of order fulfillment is threatened.
There are strict rules on safety and work organization in the production hall. The border of the hygienic zone is marked in blue. This means that after entering production, a number of regulations resulting from, among others, the BRC (British Retail Consortium) Global Standard for packing are strictly observed. Such regulations define, among others, complete work clothes (cap, glasses, work clothes, appropriate shoes) or no makeup. Red paths are communication routes for people. There are designated routes for operators and other production workers to travel. Yellow color marks the paths for forklifts, occupational health and safety (OHS) barriers, and storage areas for the finished product. The flow of raw materials coincides with the paths of forklifts, which are responsible for the transfer of each raw material. The finished product is handed over through a belt conveyor, common to all types of machines, and a palletizer, behind which cartons with the finished product are stored. From here, finished products on pallets are peeled for shipment. There are 17 ES machines and three SS machines in the hall. All machines are operated by one person who is responsible for the product from beginning to the end. During the entire shift (a shift is 8 h, production takes place in a three-shift system), the operator can fulfill one or several orders. The machines are divided into three groups called “slots”, with one Team Performance Leader (TPL) for each slot.
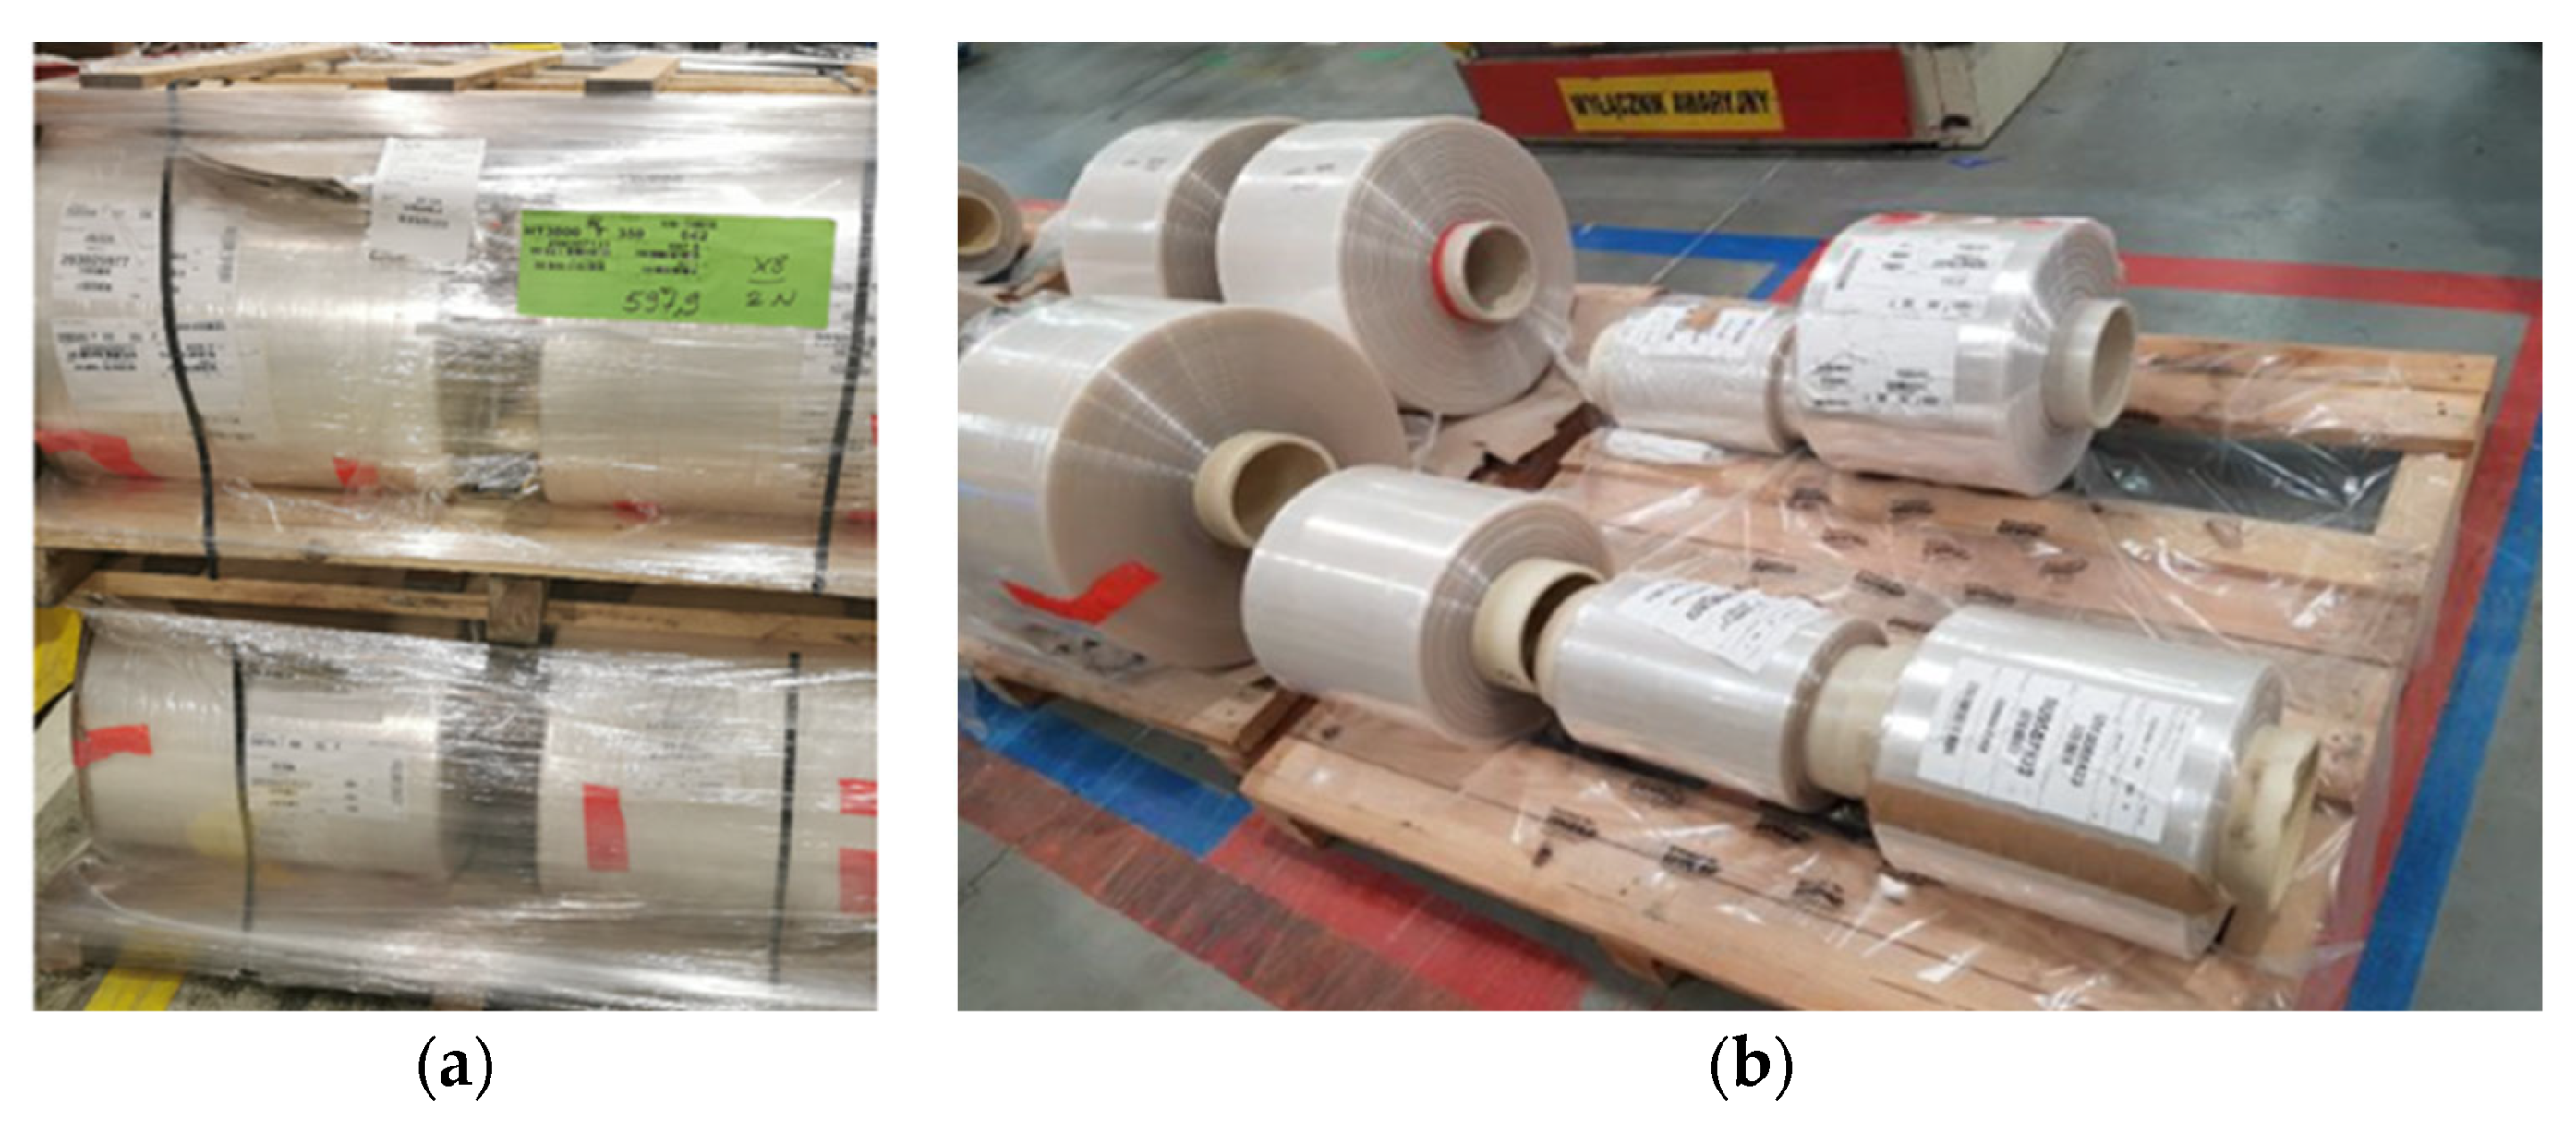
The raw materials used for production, presented in
Figure 2a, are delivered by trucks. The material comes in the form of rolls from 50 to 250 kg, and its width is usually from 80 to 650 mm. The rolls are placed on pallets, usually 4 rolls on 2 levels. Due to the heavy weight of the load, it must be properly secured. The pallets for holding the rolls are made in such a way that the material cannot roll away (
Figure 2b). This would be a threat to forklift operators and other production workers. When the load is unloaded, the material must be registered in the SAP system along with its exact location in the raw material warehouse. The SYM PLE program is also used for material management. The raw materials are transported exclusively with the use of forklifts.
Before the shift begins, the health and hygiene of employees is checked at the so-called briefing and items brought into the production area by operators are checked. This procedure is a part of correct management according to HACCP (Hazard Analysis Critical Control Points) rules, being important in food packaging production. The billing specialist prepares orders in accordance with the production plan developed by the Planning Department for production. Then, the billing specialist prints carton labels and liners (protective carton inserts) for each order. Then, the instruction to deliver the material for production is transferred to the warehouse employees. Prepared documentation for the order along with labels are delivered to the operator on the machine. During the kneading of the last roll, the operator places the next order in the basket. The trolley takes the order and brings the right amount of raw material to the machine.
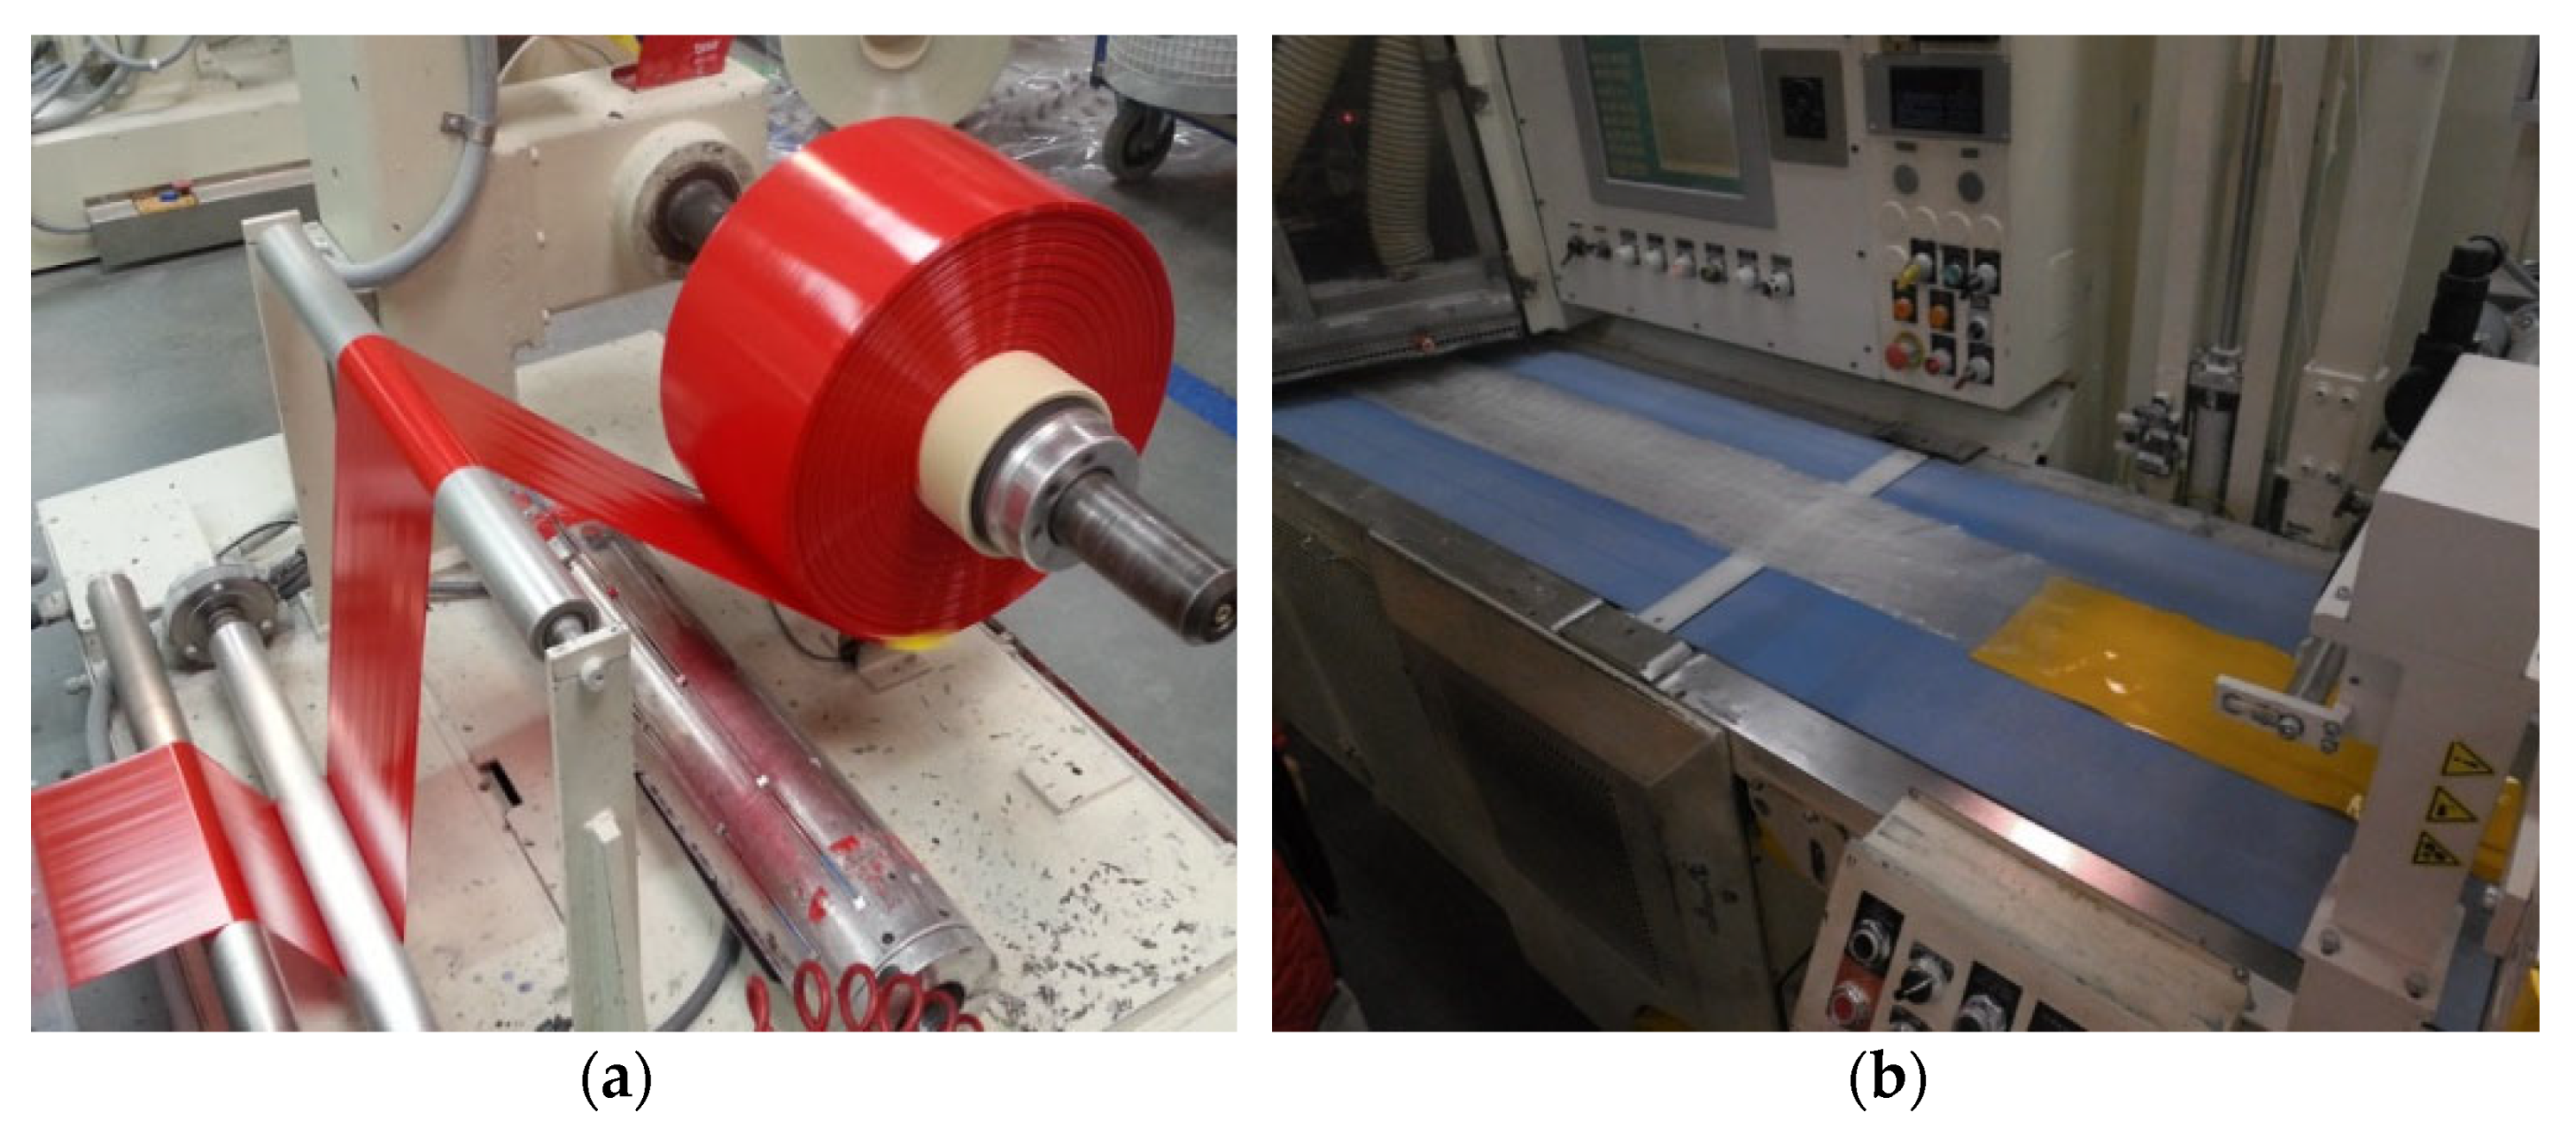
Production is planned in such a way that the material necessary for the given orders should be delivered to the machine when the operator completes the previous order. When the rolls with the material are delivered to the right place next to the machine, the operator prepares the machine for the order. Before commencing production, the operator must check if all raw materials comply with the documentation. Tubing (rolled material) must be clean, without mechanical damage, placed on clean, nail-free pallets. The operator must also check whether the “tubing” has the parameters compliant with the documents (color, name, width, quantity, expiry date). When checking the compliance with the documents is completely finished, the operator only needs to scan the product codes into the system that contains the order data and place the roll of the material on the machine (
Figure 3a). After checking the machine and preparing the cartons, the operator starts loading the recipe on the HMI computer panel, and the parameters of the machine are set in accordance with the production order (
Figure 3b).
To check the settings and efficiency of the machine, a trial batch (about 50 bags) is made. This control is statistical in nature, which means that the bags are randomly selected and then measured using measuring devices—a ruler to measure the length and width and special testers to test the tightness of the seam. Products that have any damage or manufacturing errors are sent to scrap (for destruction); unfortunately, these cannot be recovered in any way, so the bags are thrown away. The tests of quality include PPT (the test of strength to air pressure) and VPHB (test of resistance to heat). The test result depends on the size of the bag and the material it is made of. The products that meet the expectations are delivered in batches (cartons), first to the scissor table, which lifts the carton, then, with the help of the operator, they are moved to an automatic roller conveyor (common to all machines). During this transport, the cardboard passes through the gluing machine which seals the cardboard and then goes to the detector which checks whether there are any metal impurities inside. After passing the last inspection, the carton goes to the palletizer where the label is scanned and on this basis the carton is transferred to the correct pallet. When there are enough cartons on the pallet, the palletizer ejects the full pallet so that it can be transported by a trolley to the edge bander, where it is wrapped with stretch foil. The prepared pallet is transported to the shipping field using a forklift.
The characteristics of the machine maintenance system were prepared on the basis of information obtained from operators and mechanics. This is very important, because poorly selected parameters are the cause of improper operation of the machine, which is associated with a large number of deficiencies in production, as well as improper operation of the device, which results in numerous failures. Depending on the type of failure, the operator or mechanic employed in the enterprise is responsible for the repair. Minor failures, i.e., jamming the film or twisting it, are eliminated on an ongoing basis by the machine operator. Responsible for maintenance is the machine operator, whose task is to select the production parameters, in such a way as not to expose the machine to work in extreme conditions. Elimination of failures in this case must be immediate, since it has a big impact on the correctness of the execution of products. For more serious failures, preventing the operation of the machine, a mechanic is called, who is employed in the enterprise only for the first shift (8 h a day). Failures occurring on another shift are the reason for stopping production until the beginning of the first shift, regardless of the degree of failure.
In the investigated company, all machines operates independently of each other, so that the failure of one machine does not cause the entire production to stop. Machinery which fails and cannot be repaired due to the absence of a mechanic (technical defects) is not put into service. This preserves the continuity of production, and only the size of production is reduced. In the event of a situation in which the setting of the operating parameters of the machines for a new order is changed (e.g., new material for foil bags), which affects the stoppage of the work due to technical reasons (e.g., rolling bearing locking), production is stopped completely. Machine operators are not trained for such repairs (only mechanics can fix such defects).
2.3. Efficiency Indicators of Machine Use
2.3.1. OEE Performance Indicator
In the available literature, a great number of metrics used to assess the supervision of machines have been noted. The most popular indicator used to measure production utilization, especially machine utilization, is the OEE (Overall Equipment Effectiveness) indicator [
35]. This indicator describes three basic areas of the company’s activity: availability (Equation (1)), efficiency of use (Equation (2)) and quality of manufactured products (Equation (3)). The calculation of the indicator allows you to define improvement activities in the scope of implemented production processes, to measure their effect after implementation, and to eliminate existing problems. In addition, this indicator makes it possible to identify bottlenecks. Before starting the calculation of the OEE (Equation (4)), losses and their impact on individual components should be identified, i.e., availability, efficiency, and quality [
36].
The source data made it possible to carry out calculations and assess the components and, finally, the OEE index itself:
- 2.
performance indicator
- 3.
quality indicator
- 4.
OEE indicator
2.3.2. Operational Reliability Indicator
The reduction of failures significantly improves the availability of machines and losses in production efficiency [
37]. The OEE indicator is used, among others, to show what part of all losses are failures, but it does not allow for their detailed analysis [
38,
39]. For this purpose, indicators identified with maintenance activities were used (Equations (5) and (6)):
- 2.
mean time to failure
- 3.
mean time between failures
3. Results and Discussion
Sustainable development can be seen on three pillars: economic development, social development, and environmental protection. The dynamic development of the economy, the growing needs and expectations of consumers, the legal framework, and the environmental awareness of society are forcing companies to manage their production processes in the best possible way. Sustainable production is a term used to describe a business model in the manufacturing sector which, among other things, helps to minimize the impact on the environment. The pace of change in the implementation of the principles of sustainable development and the tendency to minimize environmental impacts have an impact on the business environment. Adapting to the new dynamic is a major challenge for economic operators.
Increasing customer demands and global competition mean that companies must continually search for production reserves, increase production efficiency, and reduce production costs. This requires continuous monitoring of the efficiency of the use of machinery in order to identify waste and existing production reserves in the company’s technological processes. The overall efficiency indicator of the OEE equipment makes it possible to evaluate the efficiency of the machinery fleet. Although the indicator refers to machinery, it also points to problems related to the organization of people’s work and the whole process, as well as to materials management. The recommendations in the article relate to selected aspects of the practical application of the indicator for the overall efficiency of equipment in comprehensive maintenance.
3.1. Analysis of the Volume of Production and Production Losses
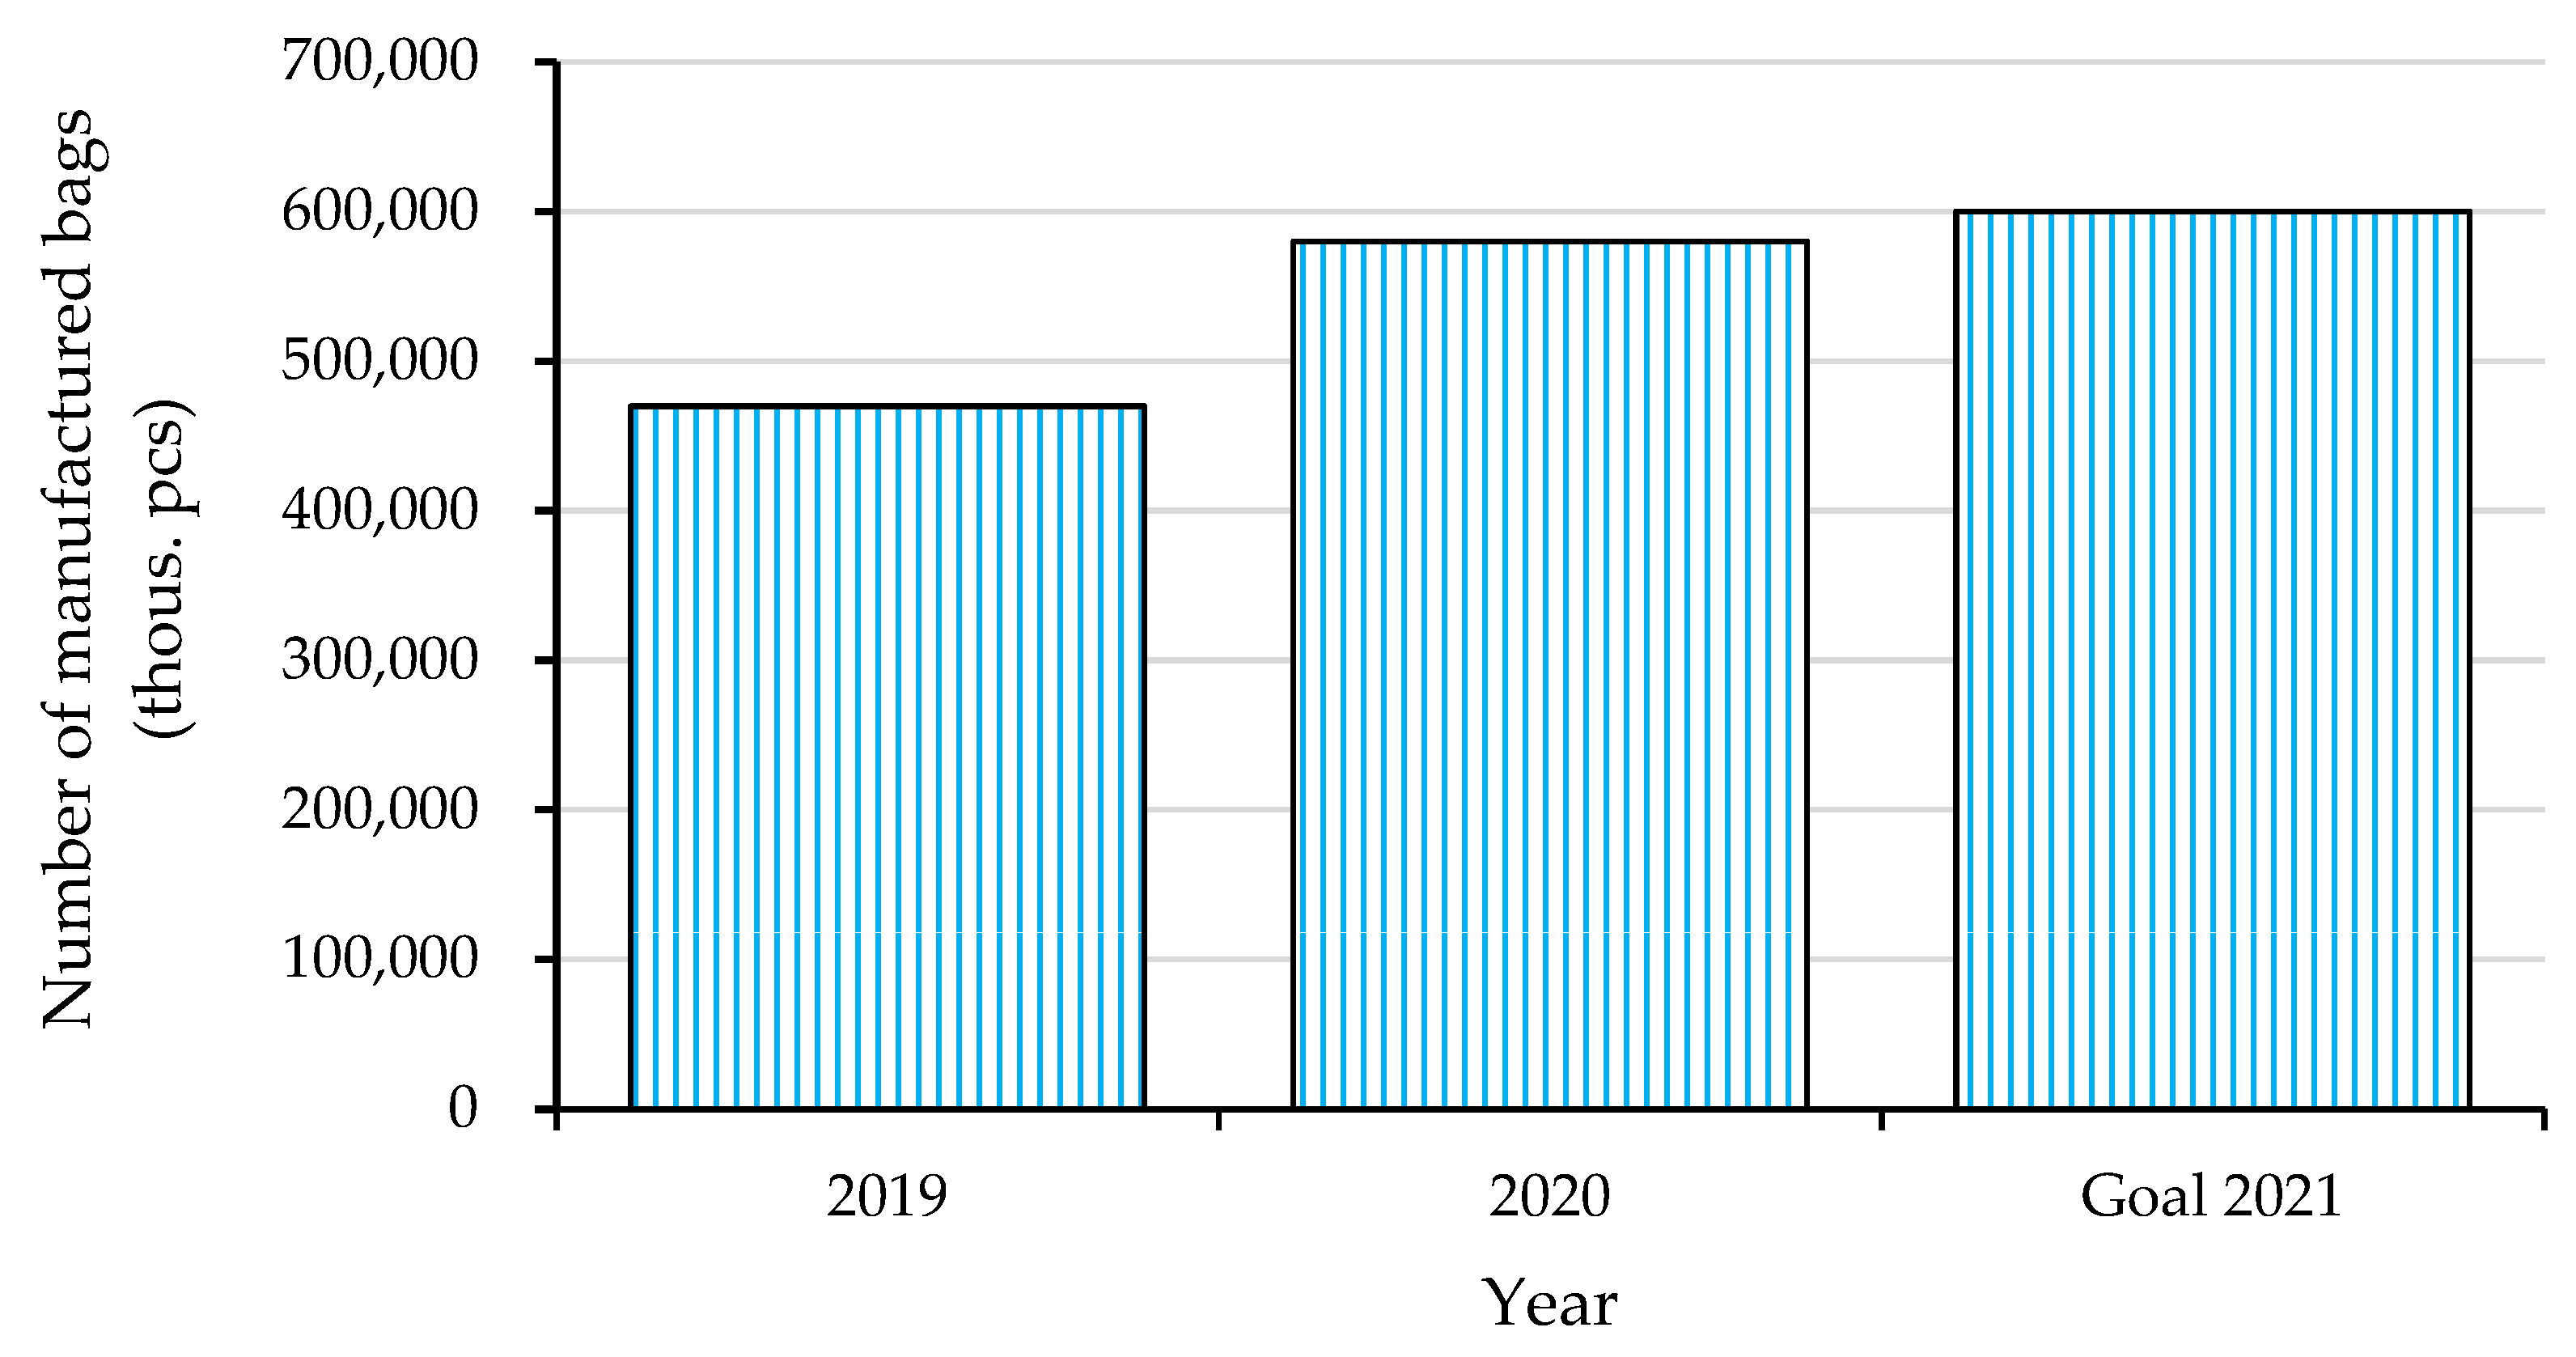
Due to the continuous increase in the demand for packaging on the Polish and German markets, the number of bags produced has been growing in the analyzed company for several years.
Figure 4 shows the changes during years 2019–2021. In reality during the year 2021 the company realized production even higher than expected. In the early stages of the COVID-19 pandemic, the increase in demand for food packaging far exceeded the plant’s production capacity, and despite additional working hours, a large number of orders were delayed.
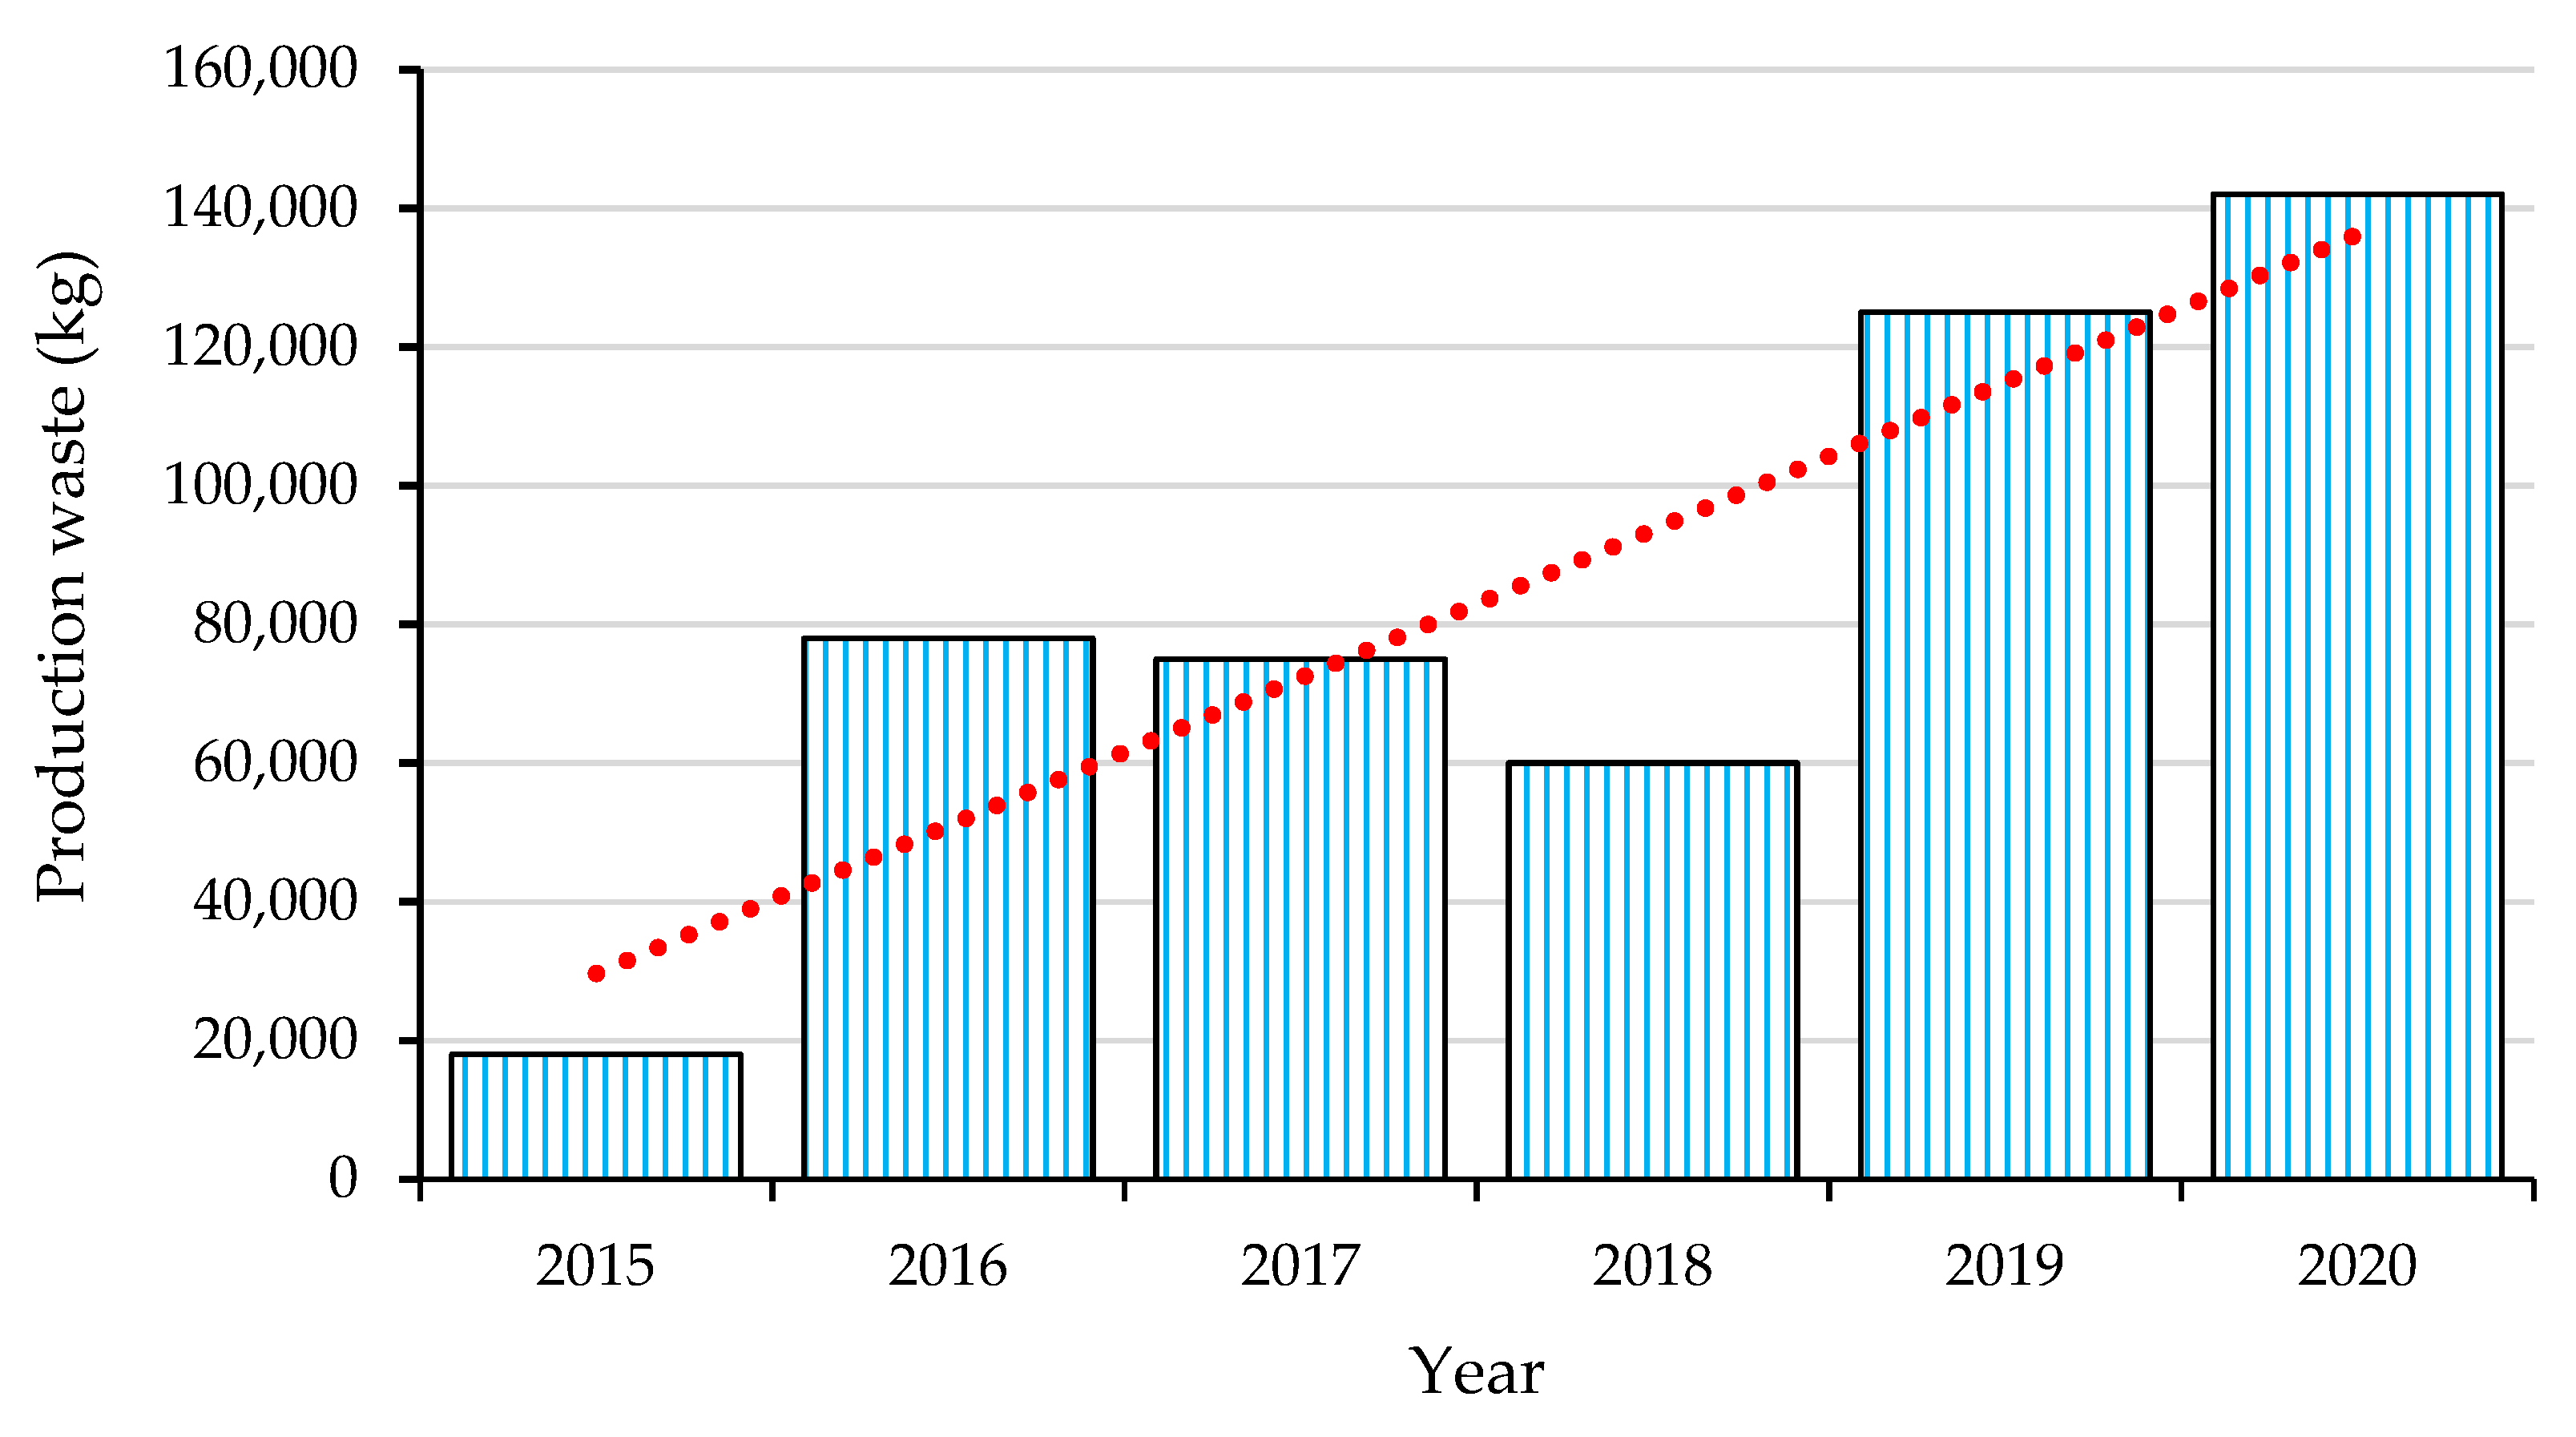
In addition to the huge number of produced bags, the analyzed company is also the source of a large amount of plastic waste. The material for production comes from three different extrusions. Unfortunately, its quality is often not satisfactory. This makes it impossible to execute the order in accordance with the specifications.
Figure 5 shows that in 2019 there was a spike in the amount of material rejected. One of the reasons was the introduction of two new machines (if production capacity increases, the demand for raw material also increases).
Another reason was the growing range of raw materials and their substitutes. With each new type of material comes a new specific production problem. An example of such a problem was the introduction in 2019 of a material that featured a thickness never before seen on the shop floor. The biggest challenge for this material was weldability. In 2020, 30% of weldability issues were related to this material. Another problem of the investigated company was the lack of cooperation between the product manufacturing department and the suppliers of production materials. Employees of individual departments of the company try to use as much material as possible for production purposes. The standard procedure in the company is to reclassify the delivered material for production on machines other than planned. Then a special marking is used, which must be accompanied by a comment which also recommends the use of this material. If, for example, the roll has a defect of the “curling” type (this means that the edges of the bag are curled), the material is intended for tapeless orders on ES type machines. Such use of the curling material will in no way hinder the customer from using it. Moreover, the company practices the reclassification of defective material delivered for production into material for production of ordered products of lower quality.
However, more than 2.5% of the material delivered to the factory did not meet the quality requirements and was thrown away. Whole roll waste is often used for testing refurbished machines or for bagging. Even so, in the past two years, the plant has thrown away over 250,000 kg of plastic.
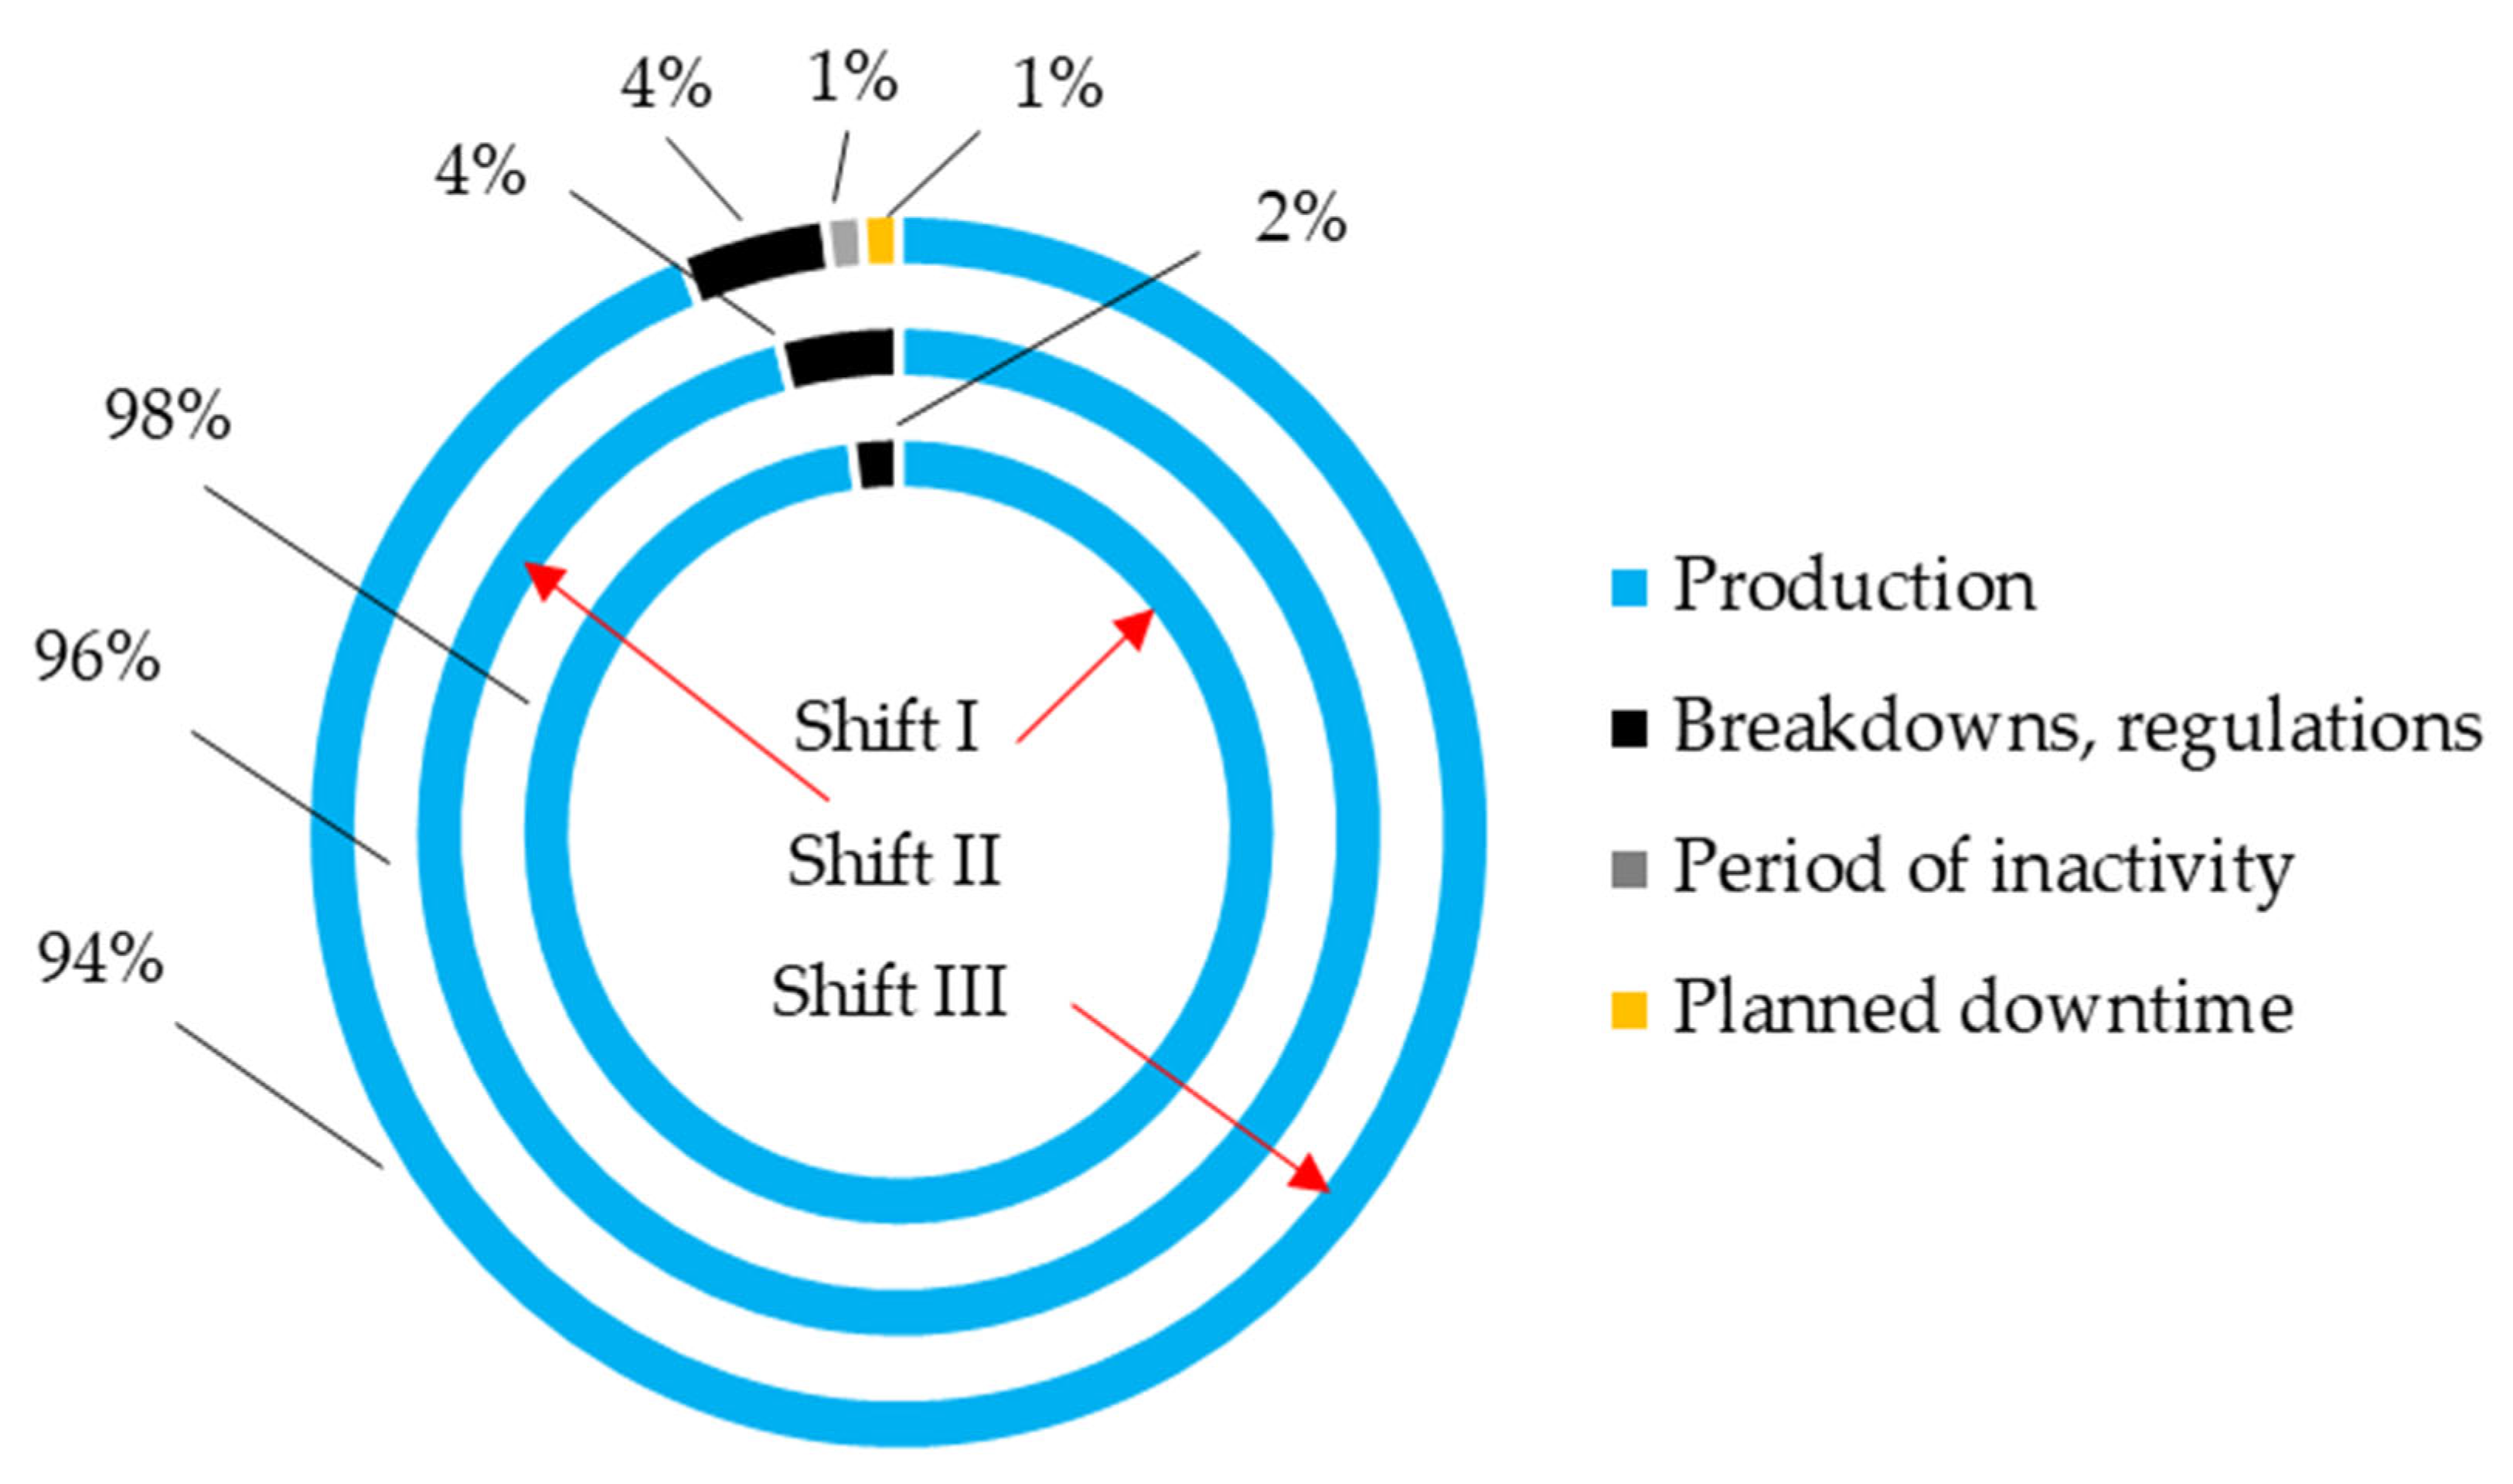
According to the calculation of the production capacity, in August the company should have produced 40 million bags. Unfortunately, this target was missed by 3.2%. Considering that around 0.5 million bags are produced in one shift, it can be observed that the deficit amounted to almost three production shifts (as if production did not start the machines during three shifts). In the analyzed period, there were mainly quality problems and problems with the malfunctioning of machines. Due to quality problems, 5571 min of delays were reported, which equals 92 h, i.e., almost 12 shifts (12.48% of the working time in the analyzed period). Quality problems are mainly material defects and errors that prevent positive results from quality tests. This indicates that quality management should be the main tool for achieving better performance of the production plant. Machine failures and downtime amounted 4017 min (67 h) which is over 8 working shifts (almost 9% of working time in the analyzed period). Such a long downtime was caused by the unexpected refurbishment of two machines. Despite the visible limitation in the functioning of the machines, the execution of orders in August was not delayed.
The implementation of production plans in August 2021 is shown in
Figure 6.
The data presented in
Figure 6 show that the machine’s failure-free operation time in the 3rd shift is 4% shorter than in the 1st shift. In the 3rd shift, there was also machine downtime. The same number of failures occurred on shift 2 and shift 3, resulting in a significant reduction in production time.
Moreover, in the analyzed period, more than 19 thousand goods were classified as waste due to internal breaks, which resulted in defective bags (0.05% of monthly production). Unfortunately, such waste cannot be reused, so it ends up in the garbage. In total, 11 breaks were observed. It also causes delays since defective goods have to be reconstructed. The main reason for such situations was the non-compliance with the standards by machine operators (lack of bag testing according to specific procedures).
As for tubing waste, 20,340 kg of material were thrown away in August 2021. The average monthly material requirement in the company is approximately 677,000 kg. However, it should be emphasized that 1% of conditionally approved tubing is also defective. Thanks to “sister” contacts with suppliers, pipes made of inferior quality materials are used for “less demanding orders”. In this way, in August alone, about 7 tonnes of material were conditionally allowed for production. It is difficult to determine the exact number of such situations, because sometimes the material is not even registered in the system, but is delivered immediately to the target machine.
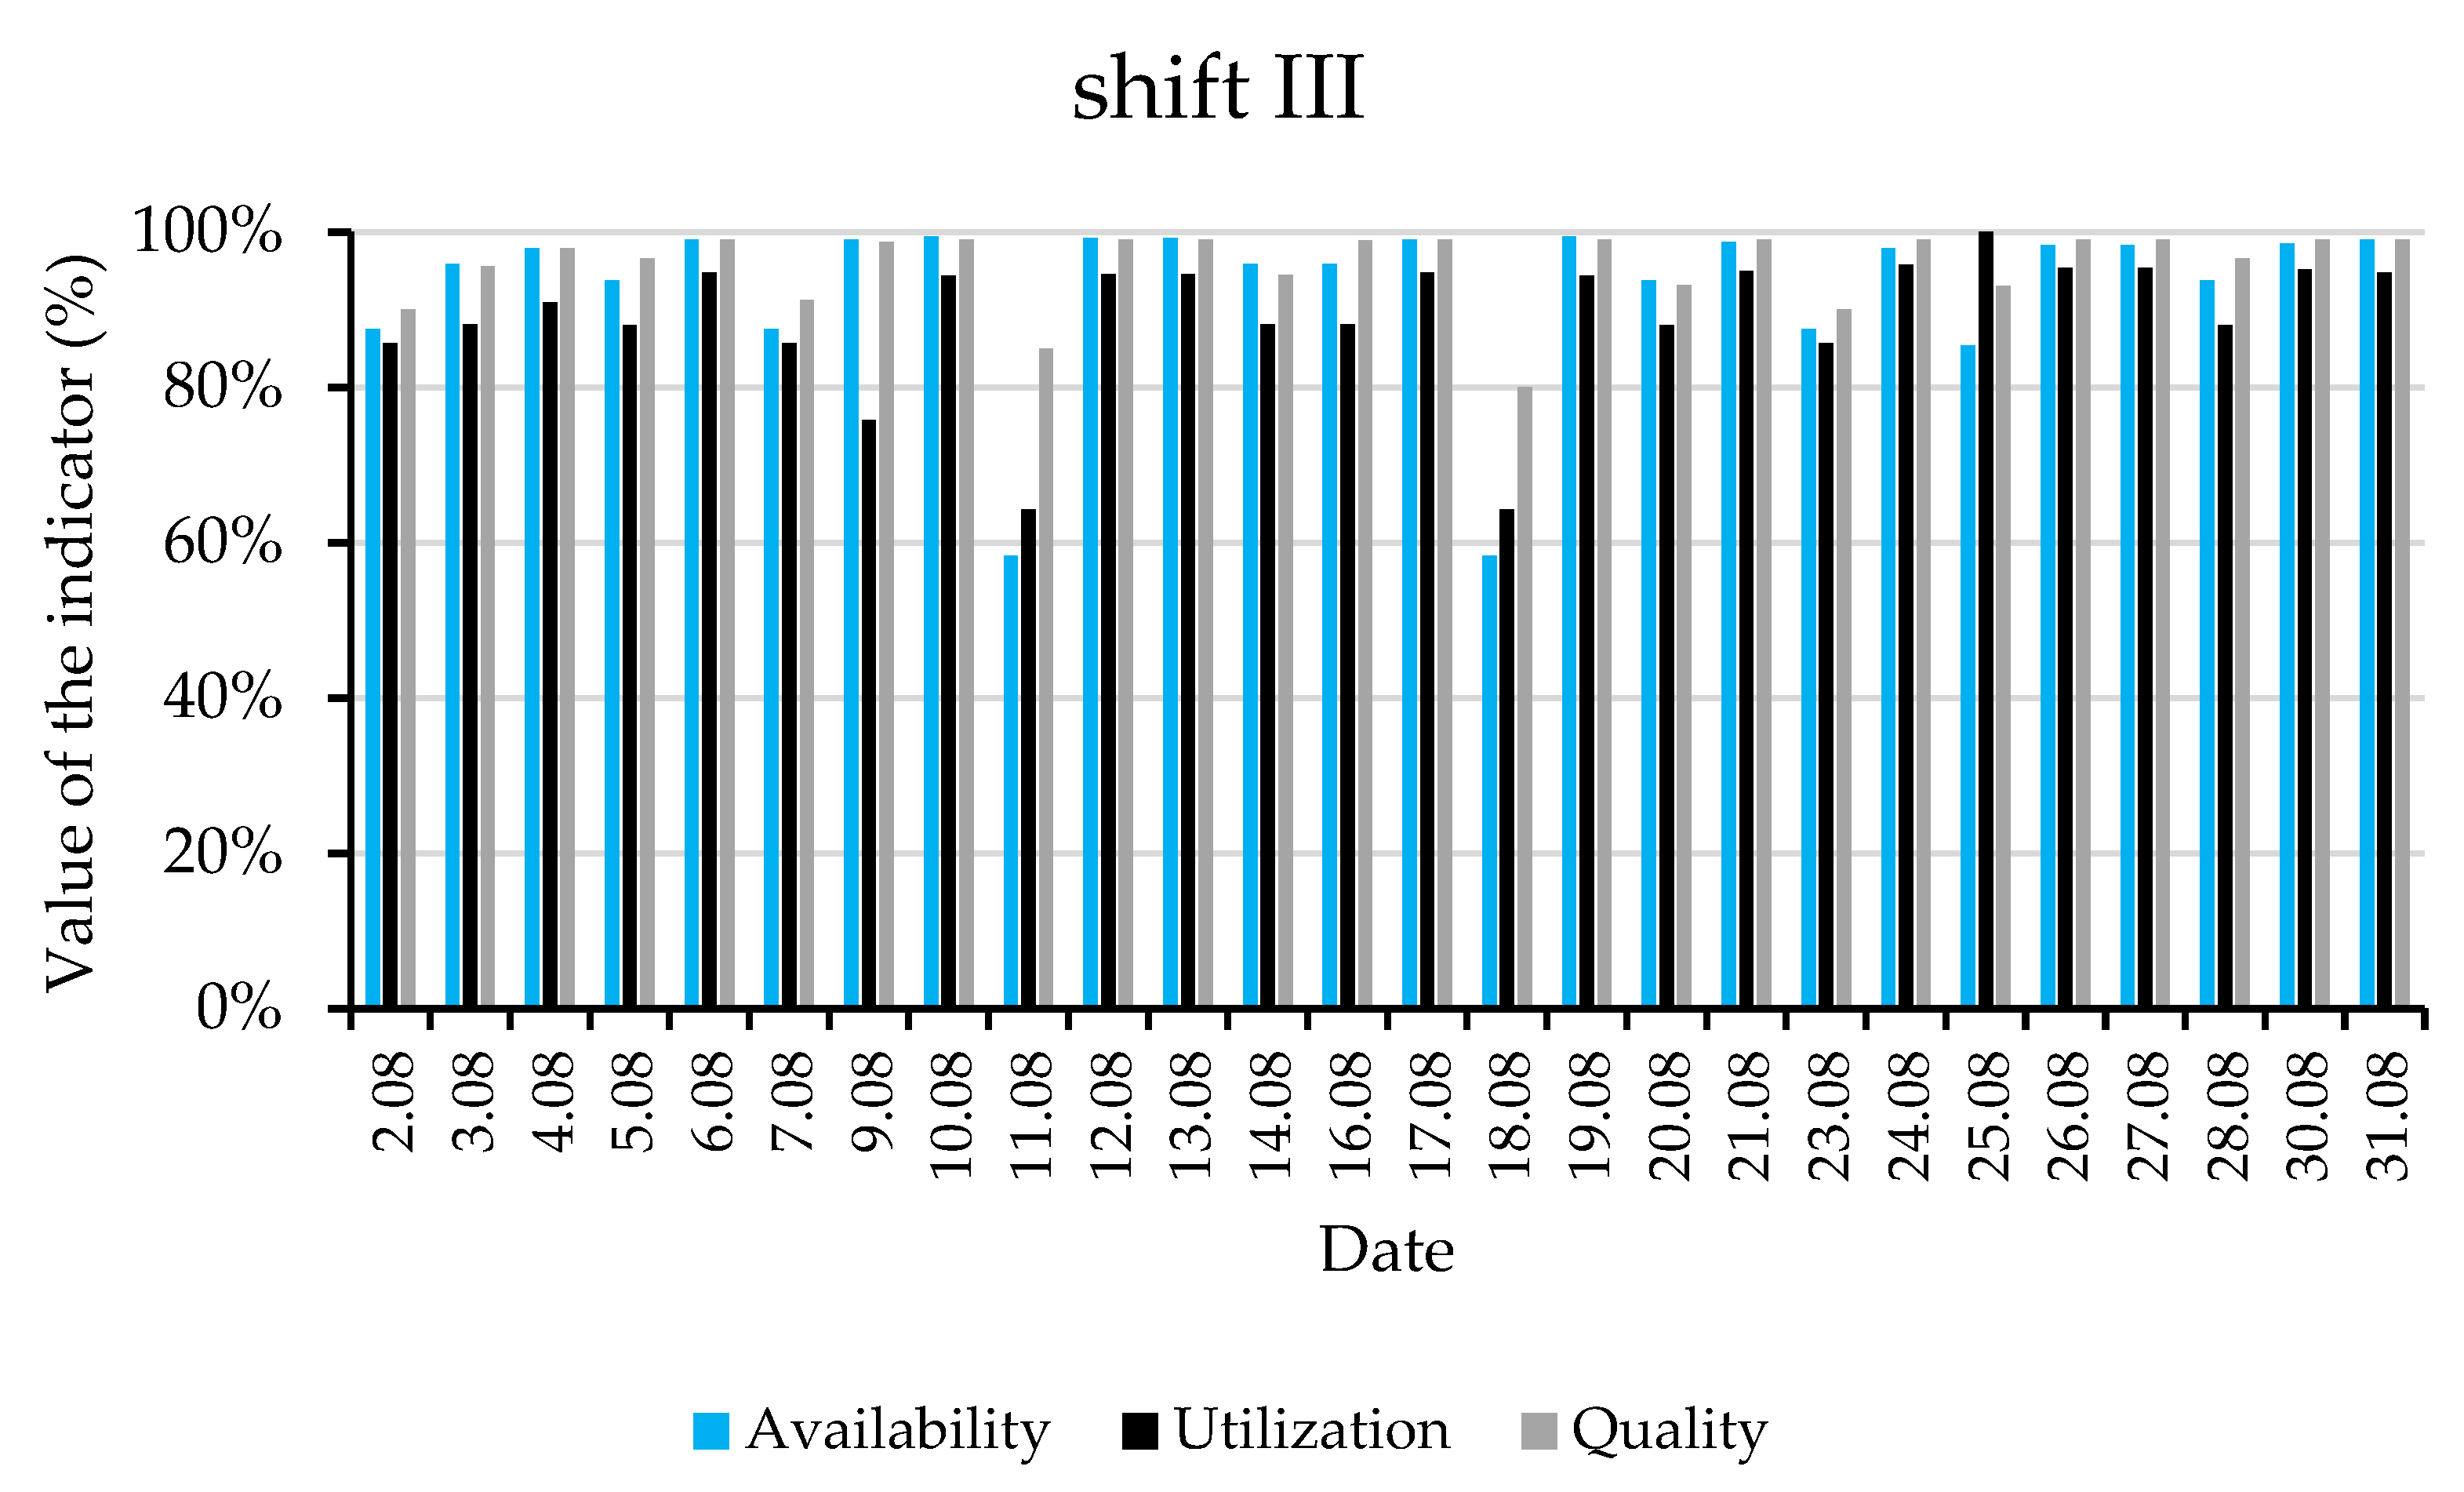
3.2. OEE Machine Utilization Efficiency Index
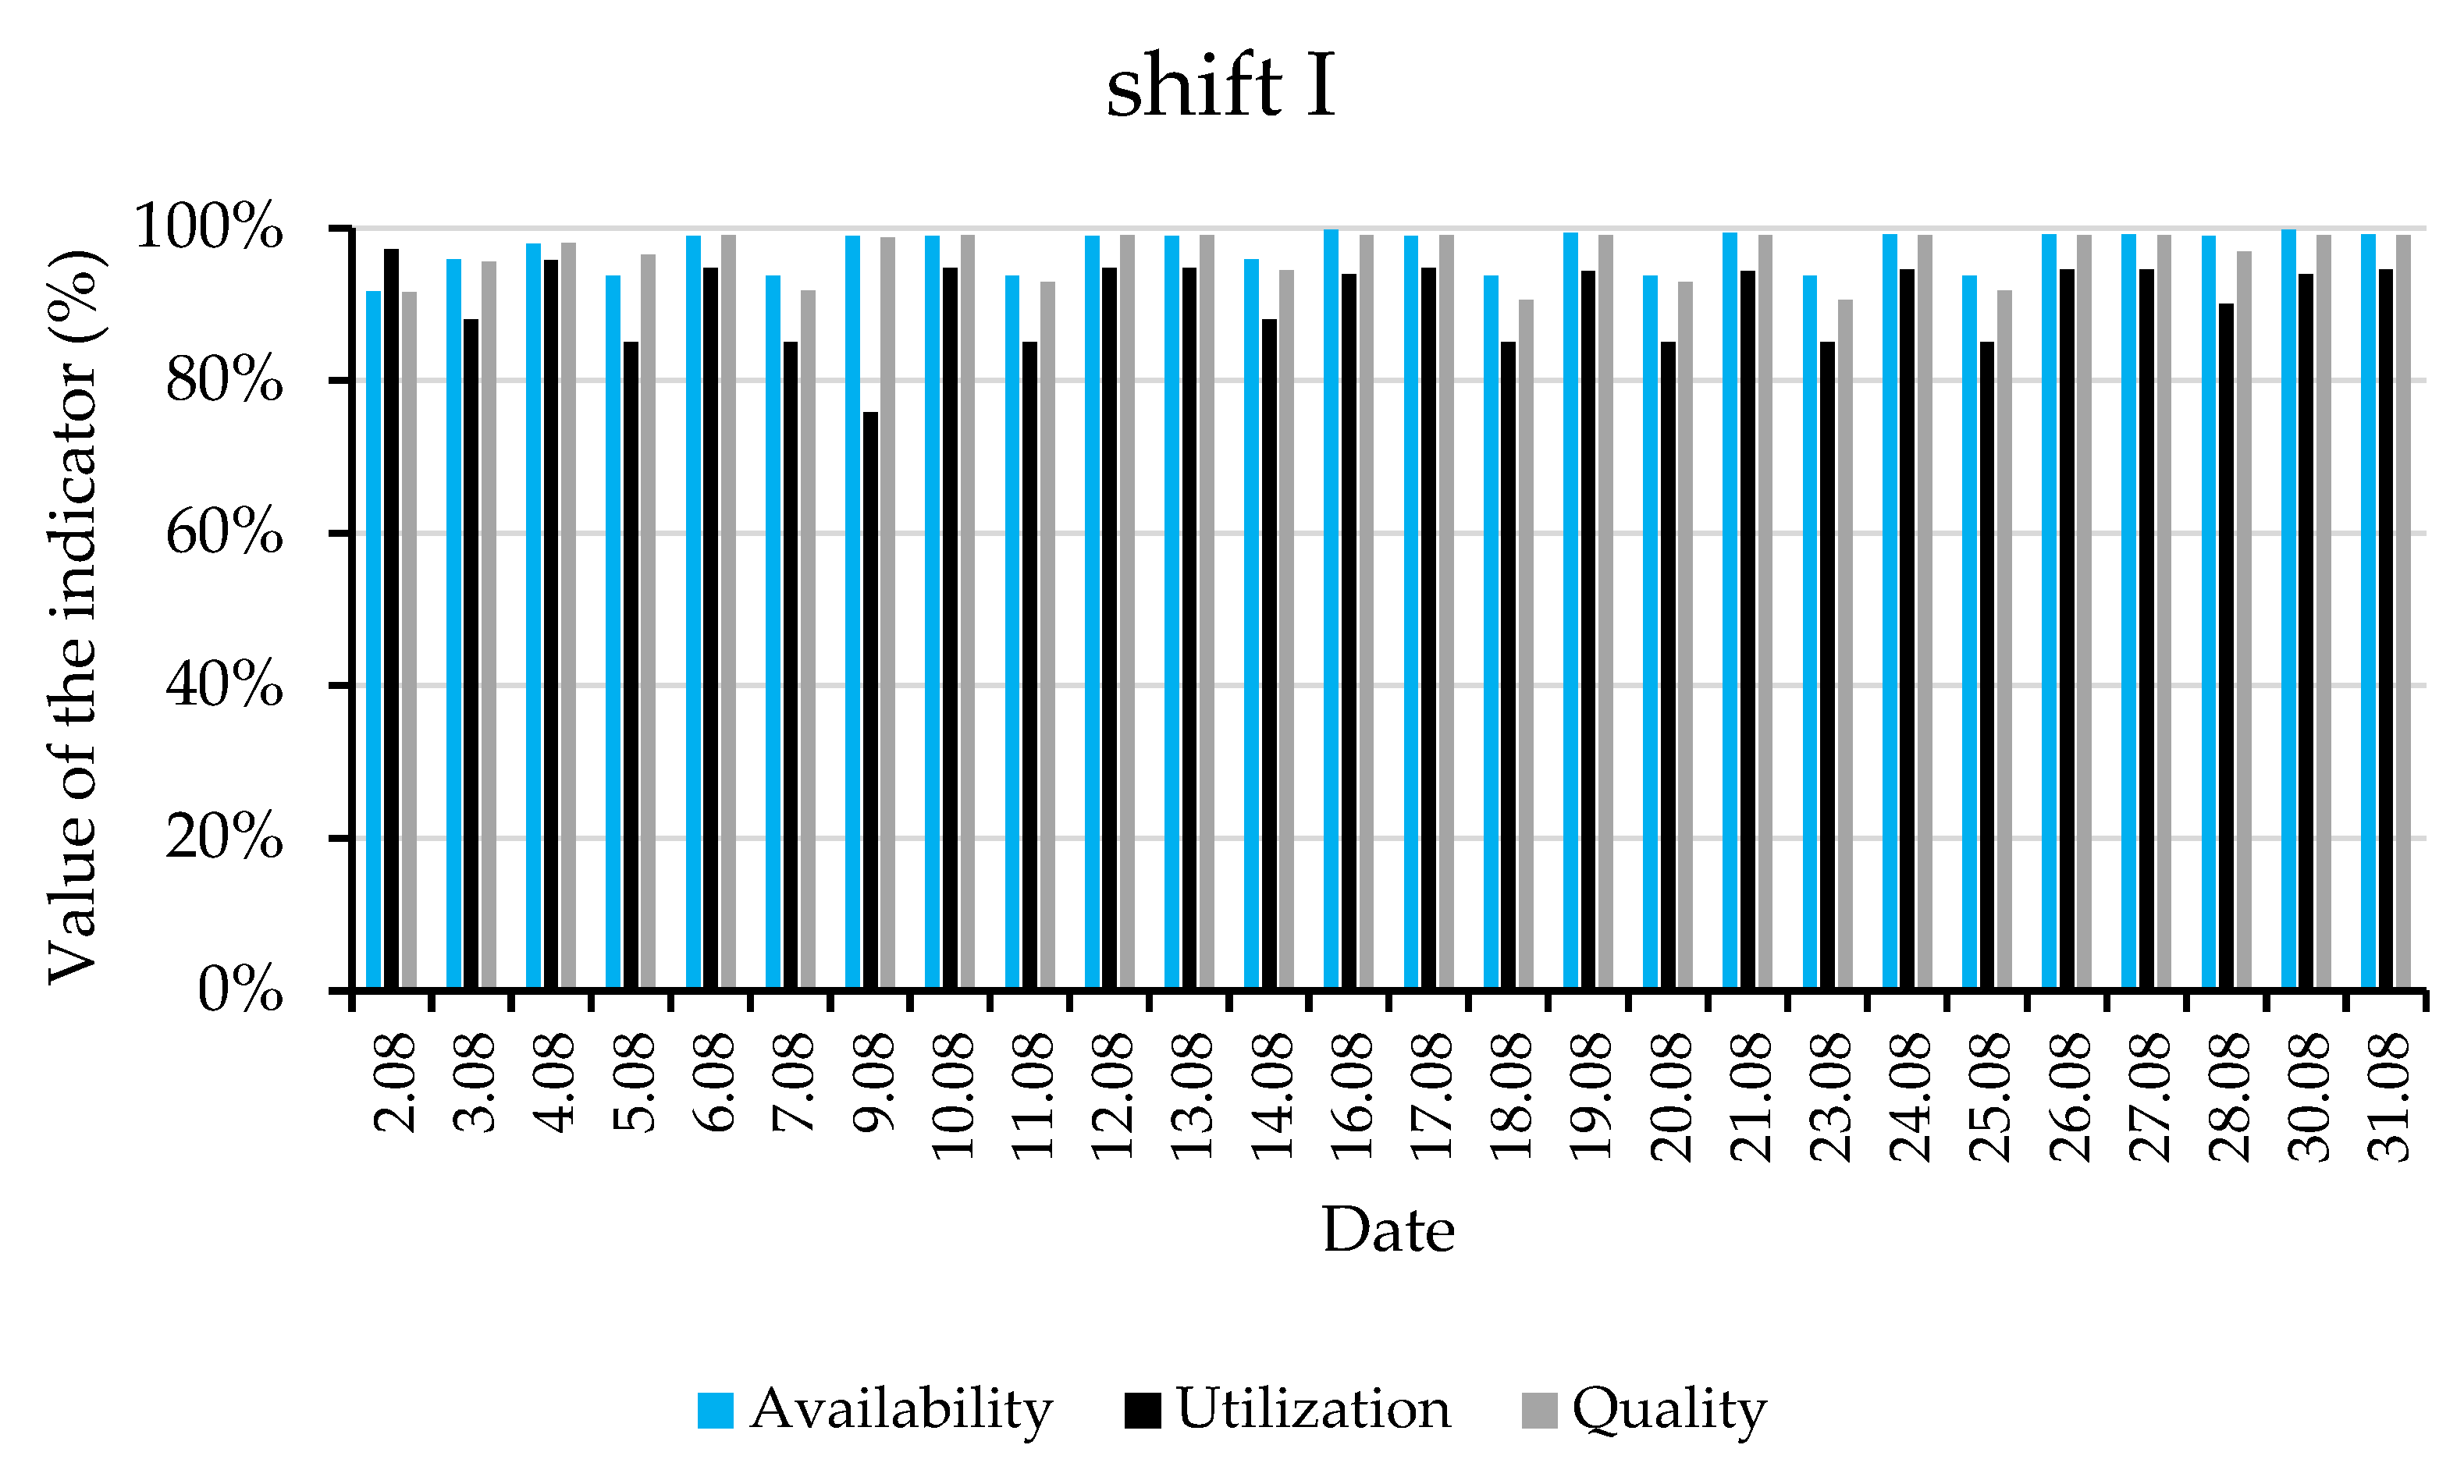
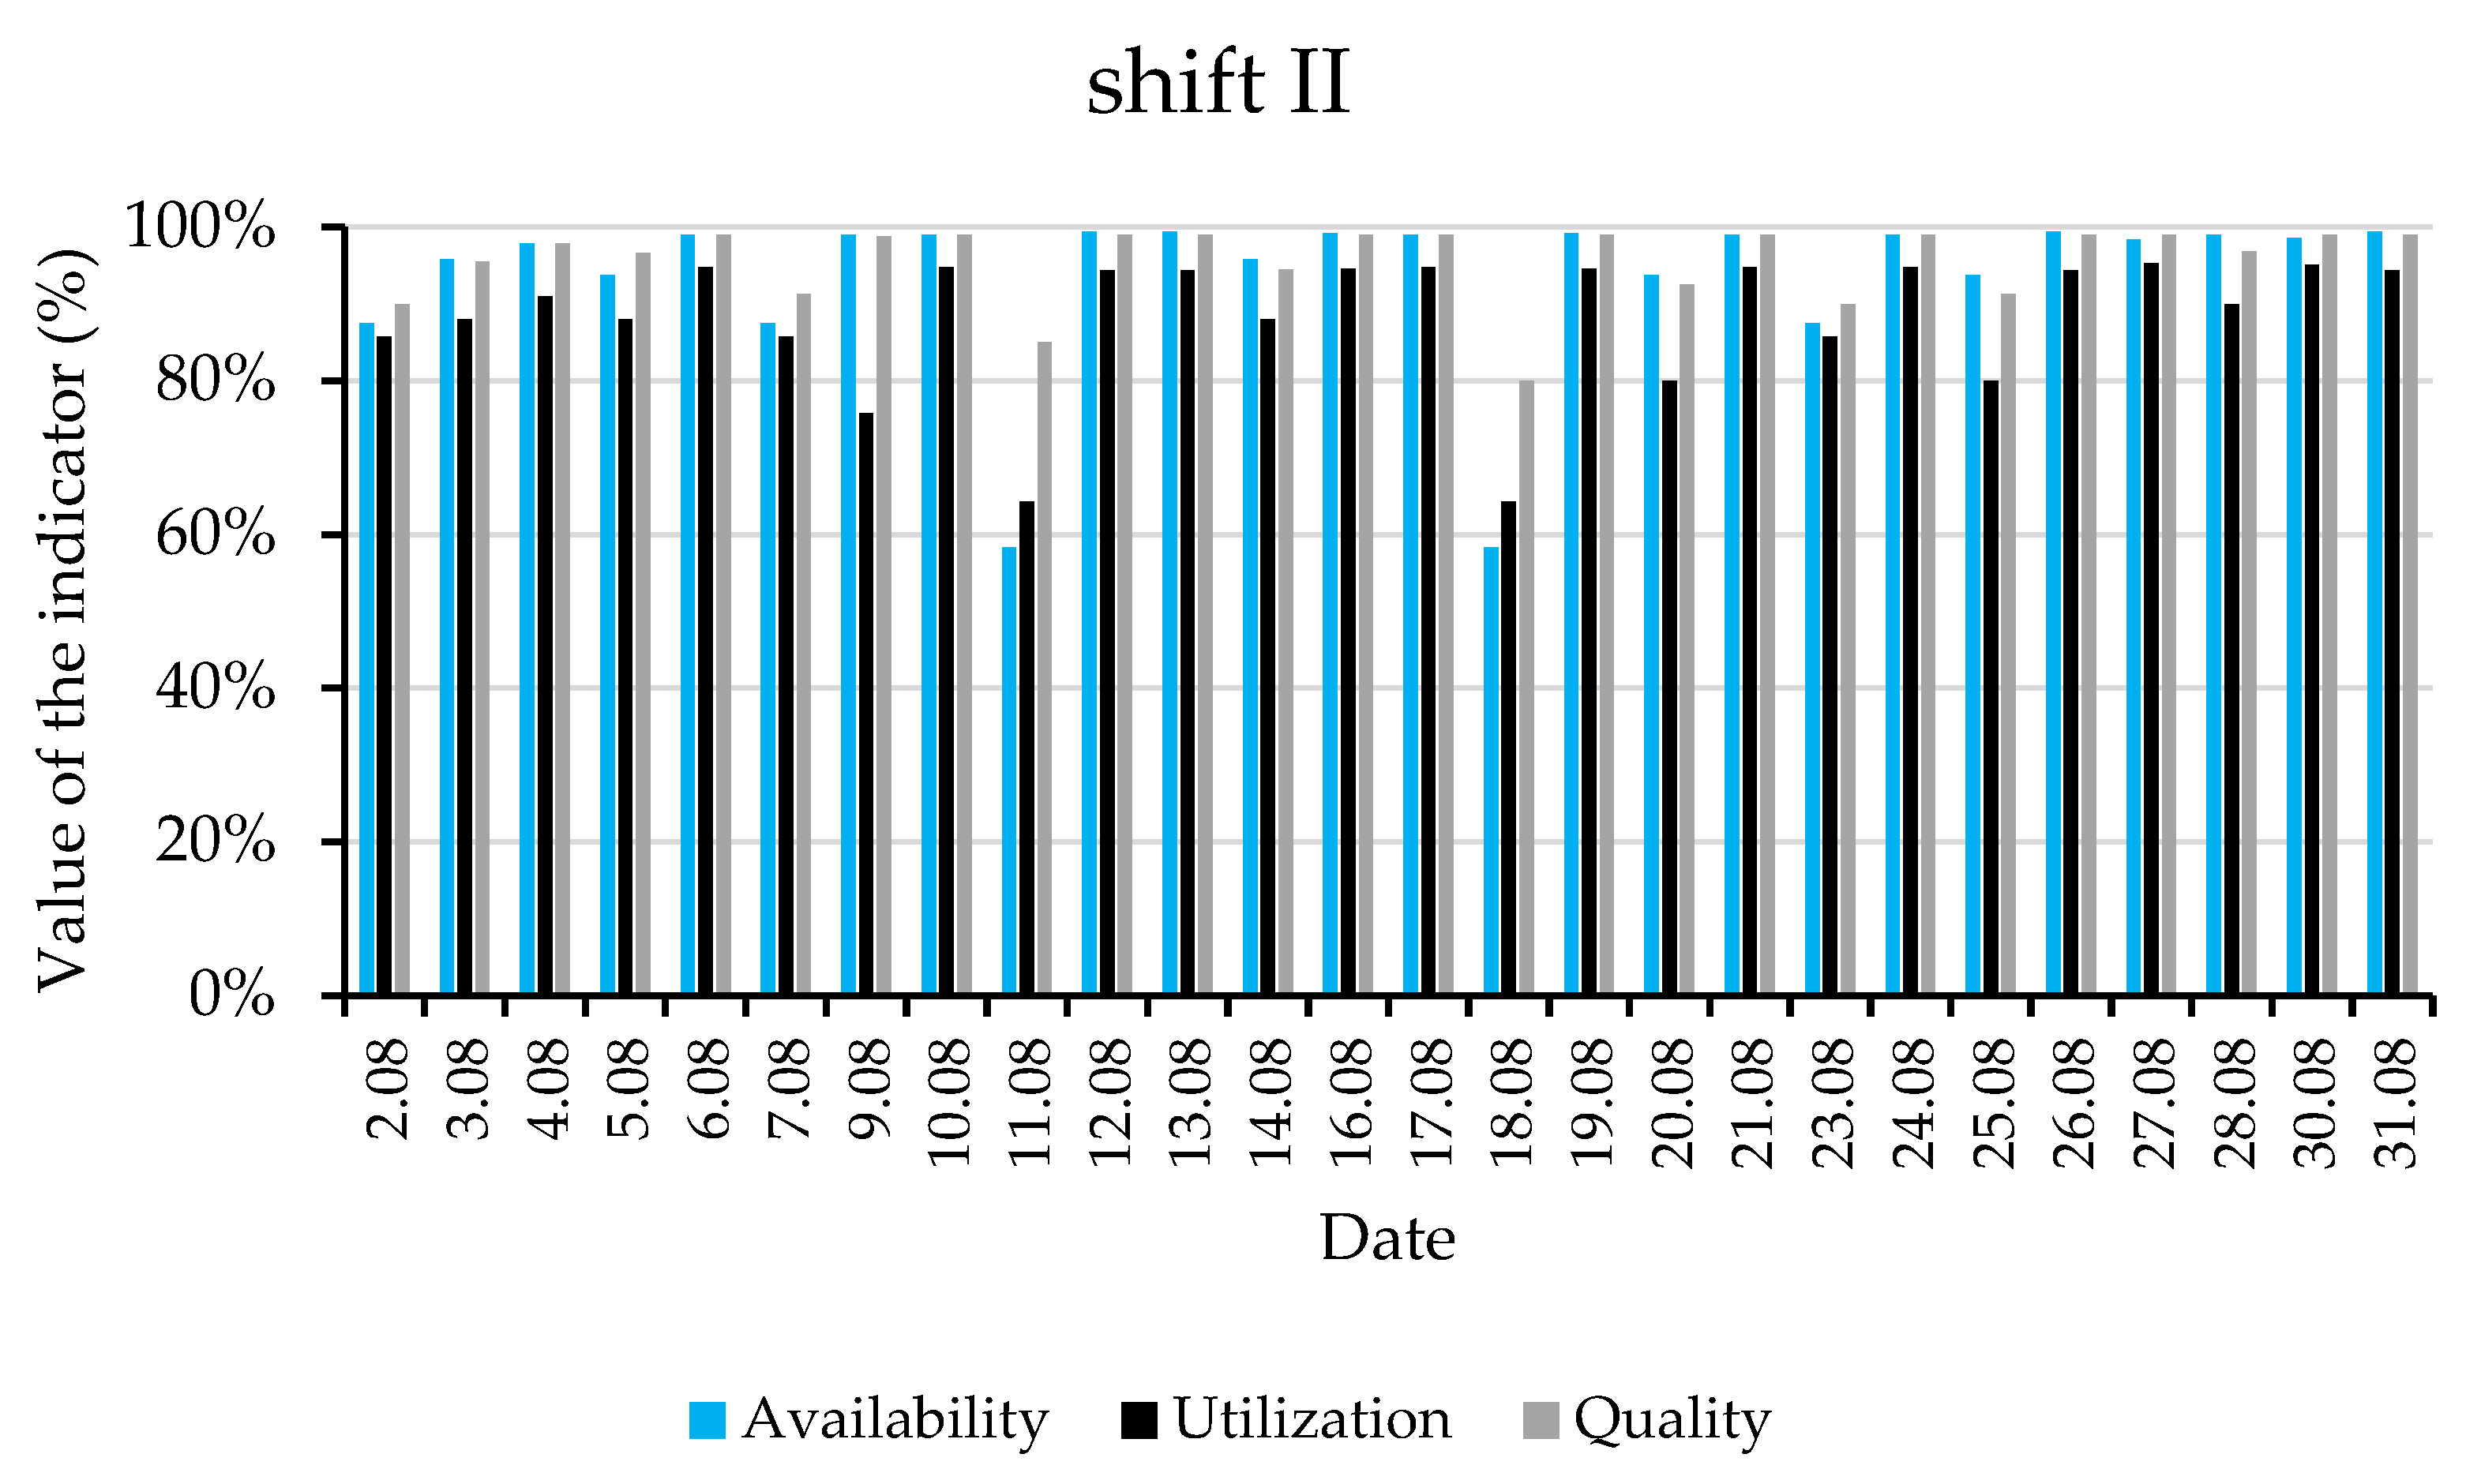
Calculated values of OEE components for shift I, II, and III are shown in
Figure 7,
Figure 8 and
Figure 9. Analysis of the values of OEE components shows that the values lowering the value of the indicator are the utilization coefficients, being the same for shift I, II, and III. The value of the qualitative component remains high, reaching around 90%. Among all the results for the first, second, and third shift, the quality indicator is the best.
It should also be noted that, both on the second and third shift, there are several dozen percent differences in the results for availability, quality, and use. This is due to the fact that at certain times the machine was not working. This was due to the machine failure. This affects the daily values of the OEE coefficient, as well as the average values, which for the entire period under study are as follows: average availability: 94.57%, average utilization: 89.54%, average quality: 95.97%.
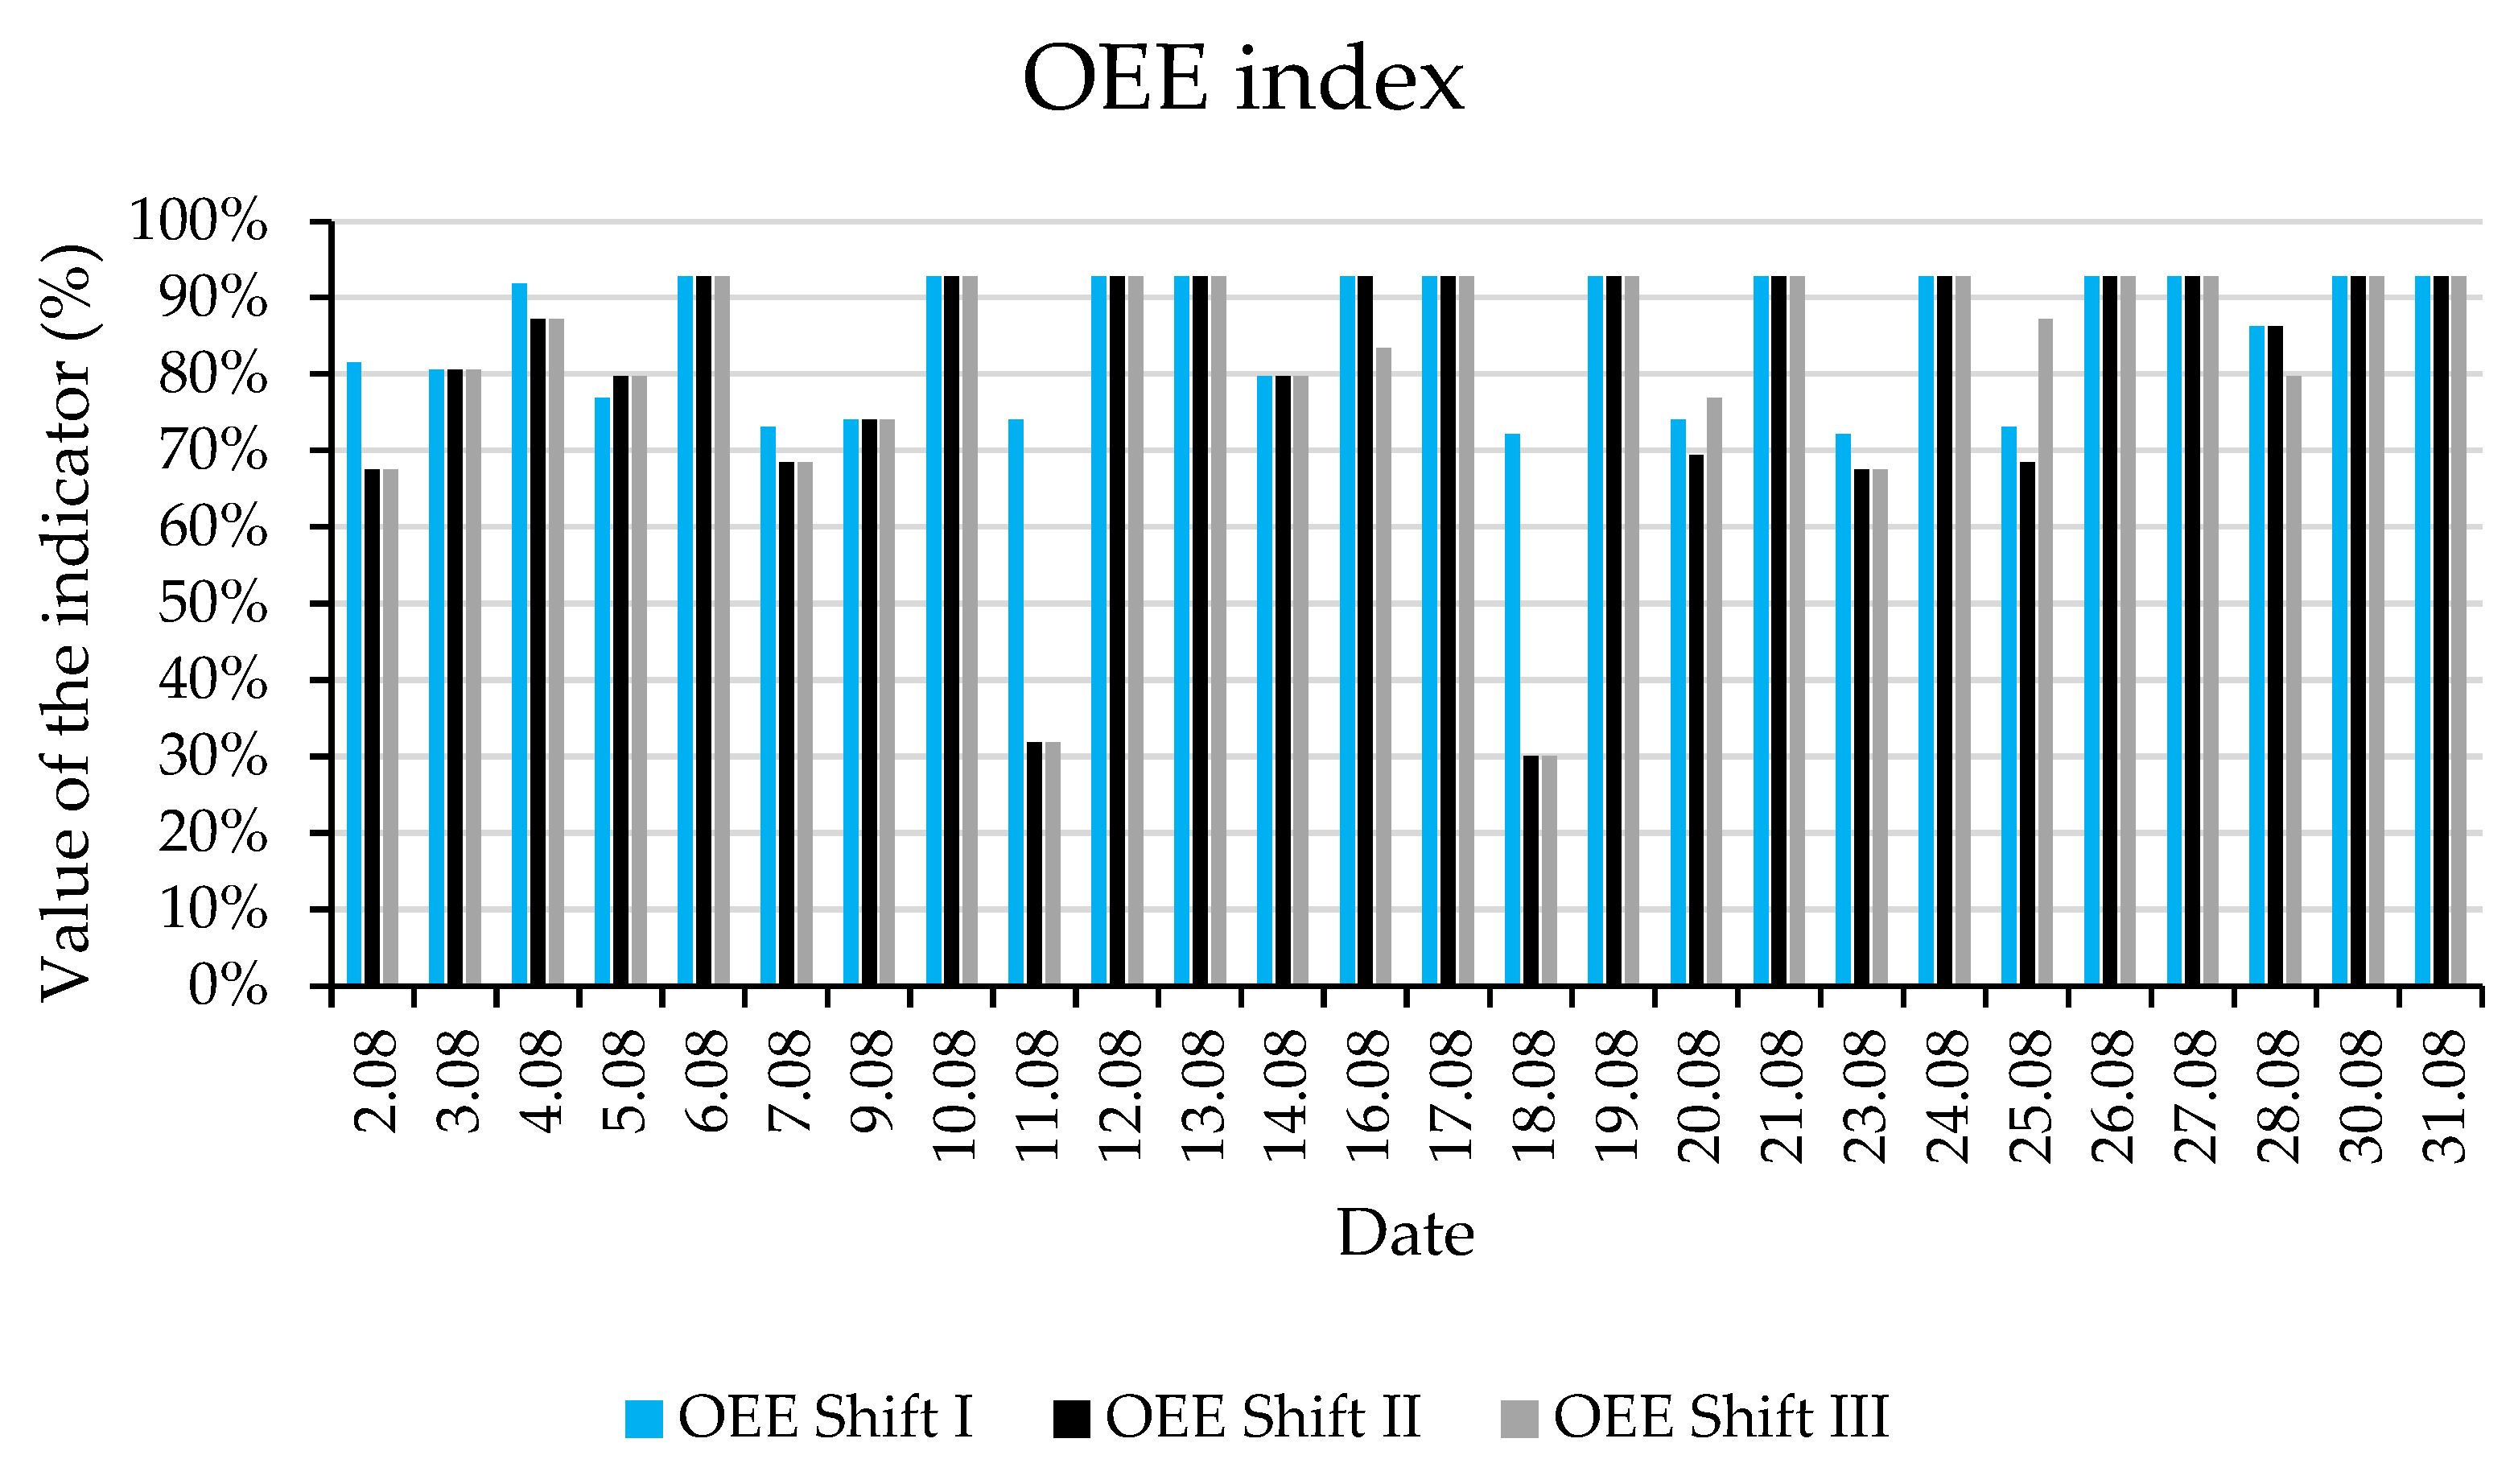
Figure 10 shows the results of OEE calculations for each day for the 1st, 2nd, and 3rd shift. The data presented in the chart show that much more often the value of OEE for the 2nd shift on a given day is higher than the value for the 1st shift on the same day. When analyzing the results achieved in the second shift, one can also notice a large dispersion of the indicator values.
In the next step, the level of the monthly OEE values for each shift separately was calculated: for the 1st shift: 85.24%; for the 2nd shift: 80.66%; for the 3rd shift: 81.06%. The difference in values between shifts 2 and 3 is only 0.4%, which means that despite many differences in daily results, the values within a month are levelling out. Nevertheless, the causes of this condition should be monitored in order to increase production efficiency.
3.3. Operational Reliability Index
During the research, information was collected on the exact dates of the failure, the waiting time for the start of the repair, and the time needed for the repair. Based on this information, the operational reliability indicators were estimated.
In the analyzed month of August, the number of repair events on the tested production line was 12. To determine the indicators, it was necessary to determine the sum of the failure times and the sum of the time available for machines on all three shifts: failure time: 883 min, time available to the machine: 12,480 min.
The determined values of the machine operating reliability indices in the analyzed month were: mean failure repair time (MTTR): 73.58 min, mean time to failure (MTTF): 996.42 min, mean time between failures (MTBF): 1040 min.
The average time between failures is about five shifts, so, on average, every fifth shift during which the machine operates is a failure. The average time needed to repair a breakdown is 8% of the shift duration, which means that when a breakdown occurs, the machine availability index drops by an average of 8%, and consequently the OEE index decreases.
4. Another Route
As can be seen from the previous chapters, all efforts to improve management of the factory’s work do not bring fully satisfactory results in terms of reducing production waste. Therefore, it is important to look for other ways to use this waste in order to improve the efficiency in terms of energy and material consumption and to meet the requirements of environmental and economic sustainability. As mentioned earlier, raw material waste, as a rule, cannot be reused for production. It is often thrown in the garbage. Of course, such a solution cannot be considered as sustainable. Therefore, the search for a technological way of utilizing production waste is rational and useful, and thus brings closer the achievement of a higher degree of sustainability.
The main problems hampering the recycling of plastics are the quality and price of the recycled product compared to its original counterpart. Plastics processors need large quantities of recycled plastics produced to strictly controlled specifications and at competitive prices.
In Europe, energy recovery is the most widespread recycling of plastic waste (42.6%). The next recovery method is recycling (32.5%). Every fourth waste is landfilled. In 2019, more than 850 million tonnes of greenhouse gases were transported into the atmosphere by the production and combustion of plastics. By 2050, these emissions could rise to 2.8 billion tonnes [
40].
Recycling of plastic waste usually involves a significant amount of by-products generated during the separation and processing phase. These residues are usually part of the alternative fuel RDF (refuse derived fuel) and are used for the thermal transformation of waste with energy recovery. However, these processes recover only the energy contained in the RDF, while the energy used to produce the plastics from which RDF itself was made is lost. The so-called thermal conversion of waste, also with energy recovery, also generates significant amounts of CO2.
In the current literature, many works have appeared on the conversion of plastic waste into liquid or gaseous fuels. A comprehensive overview of thermal catalytic pyrolysis of plastic waste was recently published [
41]. The article shows the role of process parameters such as catalyst selection, temperature, catalyst concentration, etc., on the energy demand for conversion and the chemical structure of resulting fuel. The other paper presents, among others, the design of the equipment proposed for the catalytic pyrolysis of HD polyethylene [
42]. Another work, devoted to the degradation of polypropylene during pyrolysis, describes the effects of the reactive carrier gas used in this process [
43]. The idea of stepwise pyrolysis was presented in papers [
44,
45]. The works essential for the case of pyrolysis of at least some food packaging waste, which may contain some chlorine content, are presented in papers [
46,
47].
The current trend is towards biofuels and fuels from renewable sources [
48]. The fuel of the future is hydrogen, which today is mainly produced by steam reforming fossil fuels and water electrolysis [
49]. It is proposed that the pyrolysis of plastic waste could be a non-fossil fuel-based process for producing hydrogen. One example is the DMG (Distributed Modular Generation) system technology of the PowerHouse Energy Group [
50]. In addition to pure hydrogen, it also enables the generation of heat and electricity. In the United Kingdom, a pilot hydrogen plant is being built using this method, which can convert non-recyclable plastics, waste tires, and other waste by gasification into clean synthesis gas from which hydrogen is produced.
Taking into account the existence of many commercial solutions that are advertised in the technical literature, it can be assumed that such a solution could be implemented in a plant, creating the prospect of significant energy savings purchased from external sources. At the same time, the implementation of such an installation would allow the elimination of waste thrown into the garbage, thus contributing to the mitigation of the burden on the natural environment.
It seems obvious that all successful attempts to reduce the amount of waste con-tribute to the improvement of the sustainability of production processes. Additionally, the suggestions concerning the possibility of converting remaining wastes into energy by using depolymerization procedures or chemical, and eventually biochemical, conversion of the material into simpler hydrocarbons that can be used as fuels for energy generation in or outside of the plant also reduce the plant’s energy demand and thus increase the sustainability of the production.
5. Conclusions and Recommendations
The analyzed production plant operates in an industry which, despite the fact that it is dynamically developing, must constantly face the challenges caused by increasingly stringent legal and social requirements. Products of this type are mainly used in packaging for the meat and dairy industries. All processes in the supply chain from placing an order to shipping to the customer are optimized.
The plant has 17 independent machines ES and 3 machines SS, which allows the plant to avoid longer delays. A big problem of the unit is defective material and non-compliance with standards by employees. In the analyzed period, due to failures and quality problems, it was not possible to achieve the assumed production target; however, this did not delay the orders.
The observed problems can be classified into several groups:
Bad quality of the supplied raw material;
Lack of total maintenance procedures to ensure failure-free operation of machines;
Bad training of employees and the lack of implemented standard procedures in production processes. This is particularly important when a machine needs to be retrofitted.
Among the ways to remove (reduce) operating errors, the following can be mentioned:
Definition of critical points in production processes, where the occurrence of an error causes significant negative effects for the entire process, and establishing control of production parameters at these points;
Ensuring and strengthening the quality control of the supplied raw materials, thanks to which the responsibility for the poor quality of raw materials would have to be taken by suppliers;
Gradual introduction of standardization procedures as well as other methods of production management;
Employee training in the field of technological and organizational requirements and procedures ensuring high-quality work and high-quality products;
There are indeed objective technical difficulties in the case of recycling or reuse of a multilayer film having a layer with some halogen content. However, it is worth conducting research on granulation and possible formation of a multi-component blend, which could be used to produce materials that can be used outside the food industry;
The other direction of waste treatment could be energy recycling through, for example, pyrolysis combined with the separation and recovery of halogen in the gas phase;
Depolymerization of wastes to low molecular weight substances could possibly permit their separation and new polymerization to the quality first class material;
Separate studies would be necessary to investigate feasibility of the two routes mentioned in points 6 and 7, in order to decide which route would be better from economic as well energetic reasons;
Both of the mentioned routes of waste treatment could be used for production of fuels dedicated, if not for commercial use, then for local heating or electricity production for powering the own machines;
The planning department with an SAP system must play an important role in optimizing the use of slightly lower quality raw materials. Lower quality batches should be used for the production of less demanding products;
It could be useful to develop the computer based expert system in which experiences and solutions once found could be quickly suggested in other similar cases.
It seems quite important to distinguish between two sources of the defects being observed in products. One of those is associated with internal procedures and malfunctioning or too large variability of equipment work. The second is associated with low quality of supplied raw material. While the first group of mistakes can possibly be removed internally in the production plant, the second require close cooperation with the supplier. The reduction and rational treatment of wastes, however, should be considered as a priority.
To finalize: it seems clear that, especially in the plastic industry, there exist so many materials and technologies that practically each producer, and each product, requires independent separate analysis, and a dedicated path to reach sustainability. It is therefore worthwhile to analyze the individual cases that after some time might lead to more general conclusions.
The conducted analysis allowed us to present the actual state of production efficiency in terms of machine use. The calculated values of the machine availability time show to what extent the machine is used during the day and how much time is lost for both planned and unplanned breaks. Despite the losses generated by machine downtime, the value of the availability factor is high. The weakest element of efficiency is the use of the machine. In turn, the production quality factor can be improved as long as each employee complies with the suggested standards.
A comparison of the test results obtained during the three shifts (of which shift II and III are the changes with the highest number of downtimes) for which the OEE value is the lowest (shift II: 80.66%; shift III: 81.06%), shows that the machine use efficiency is similar on both shifts. The difference is not significant, although it is worth considering which factors affect the deterioration of the effectiveness of the first shift. Moreover, the calculated value of OEE proves a good organizational level of the maintenance services of the analyzed enterprise.


