
A Regional View of Passenger Air Link Evolution in Brazil

 , ,
, ,  and
and
Abstract
:1. Introduction
2. Literature Review
3. Materials and Methods
3.1. Methodology
3.2. Case Study
3.3. Data
4. Results
5. Discussion
6. Conclusions
Author Contributions
Funding
Acknowledgments
Conflicts of Interest
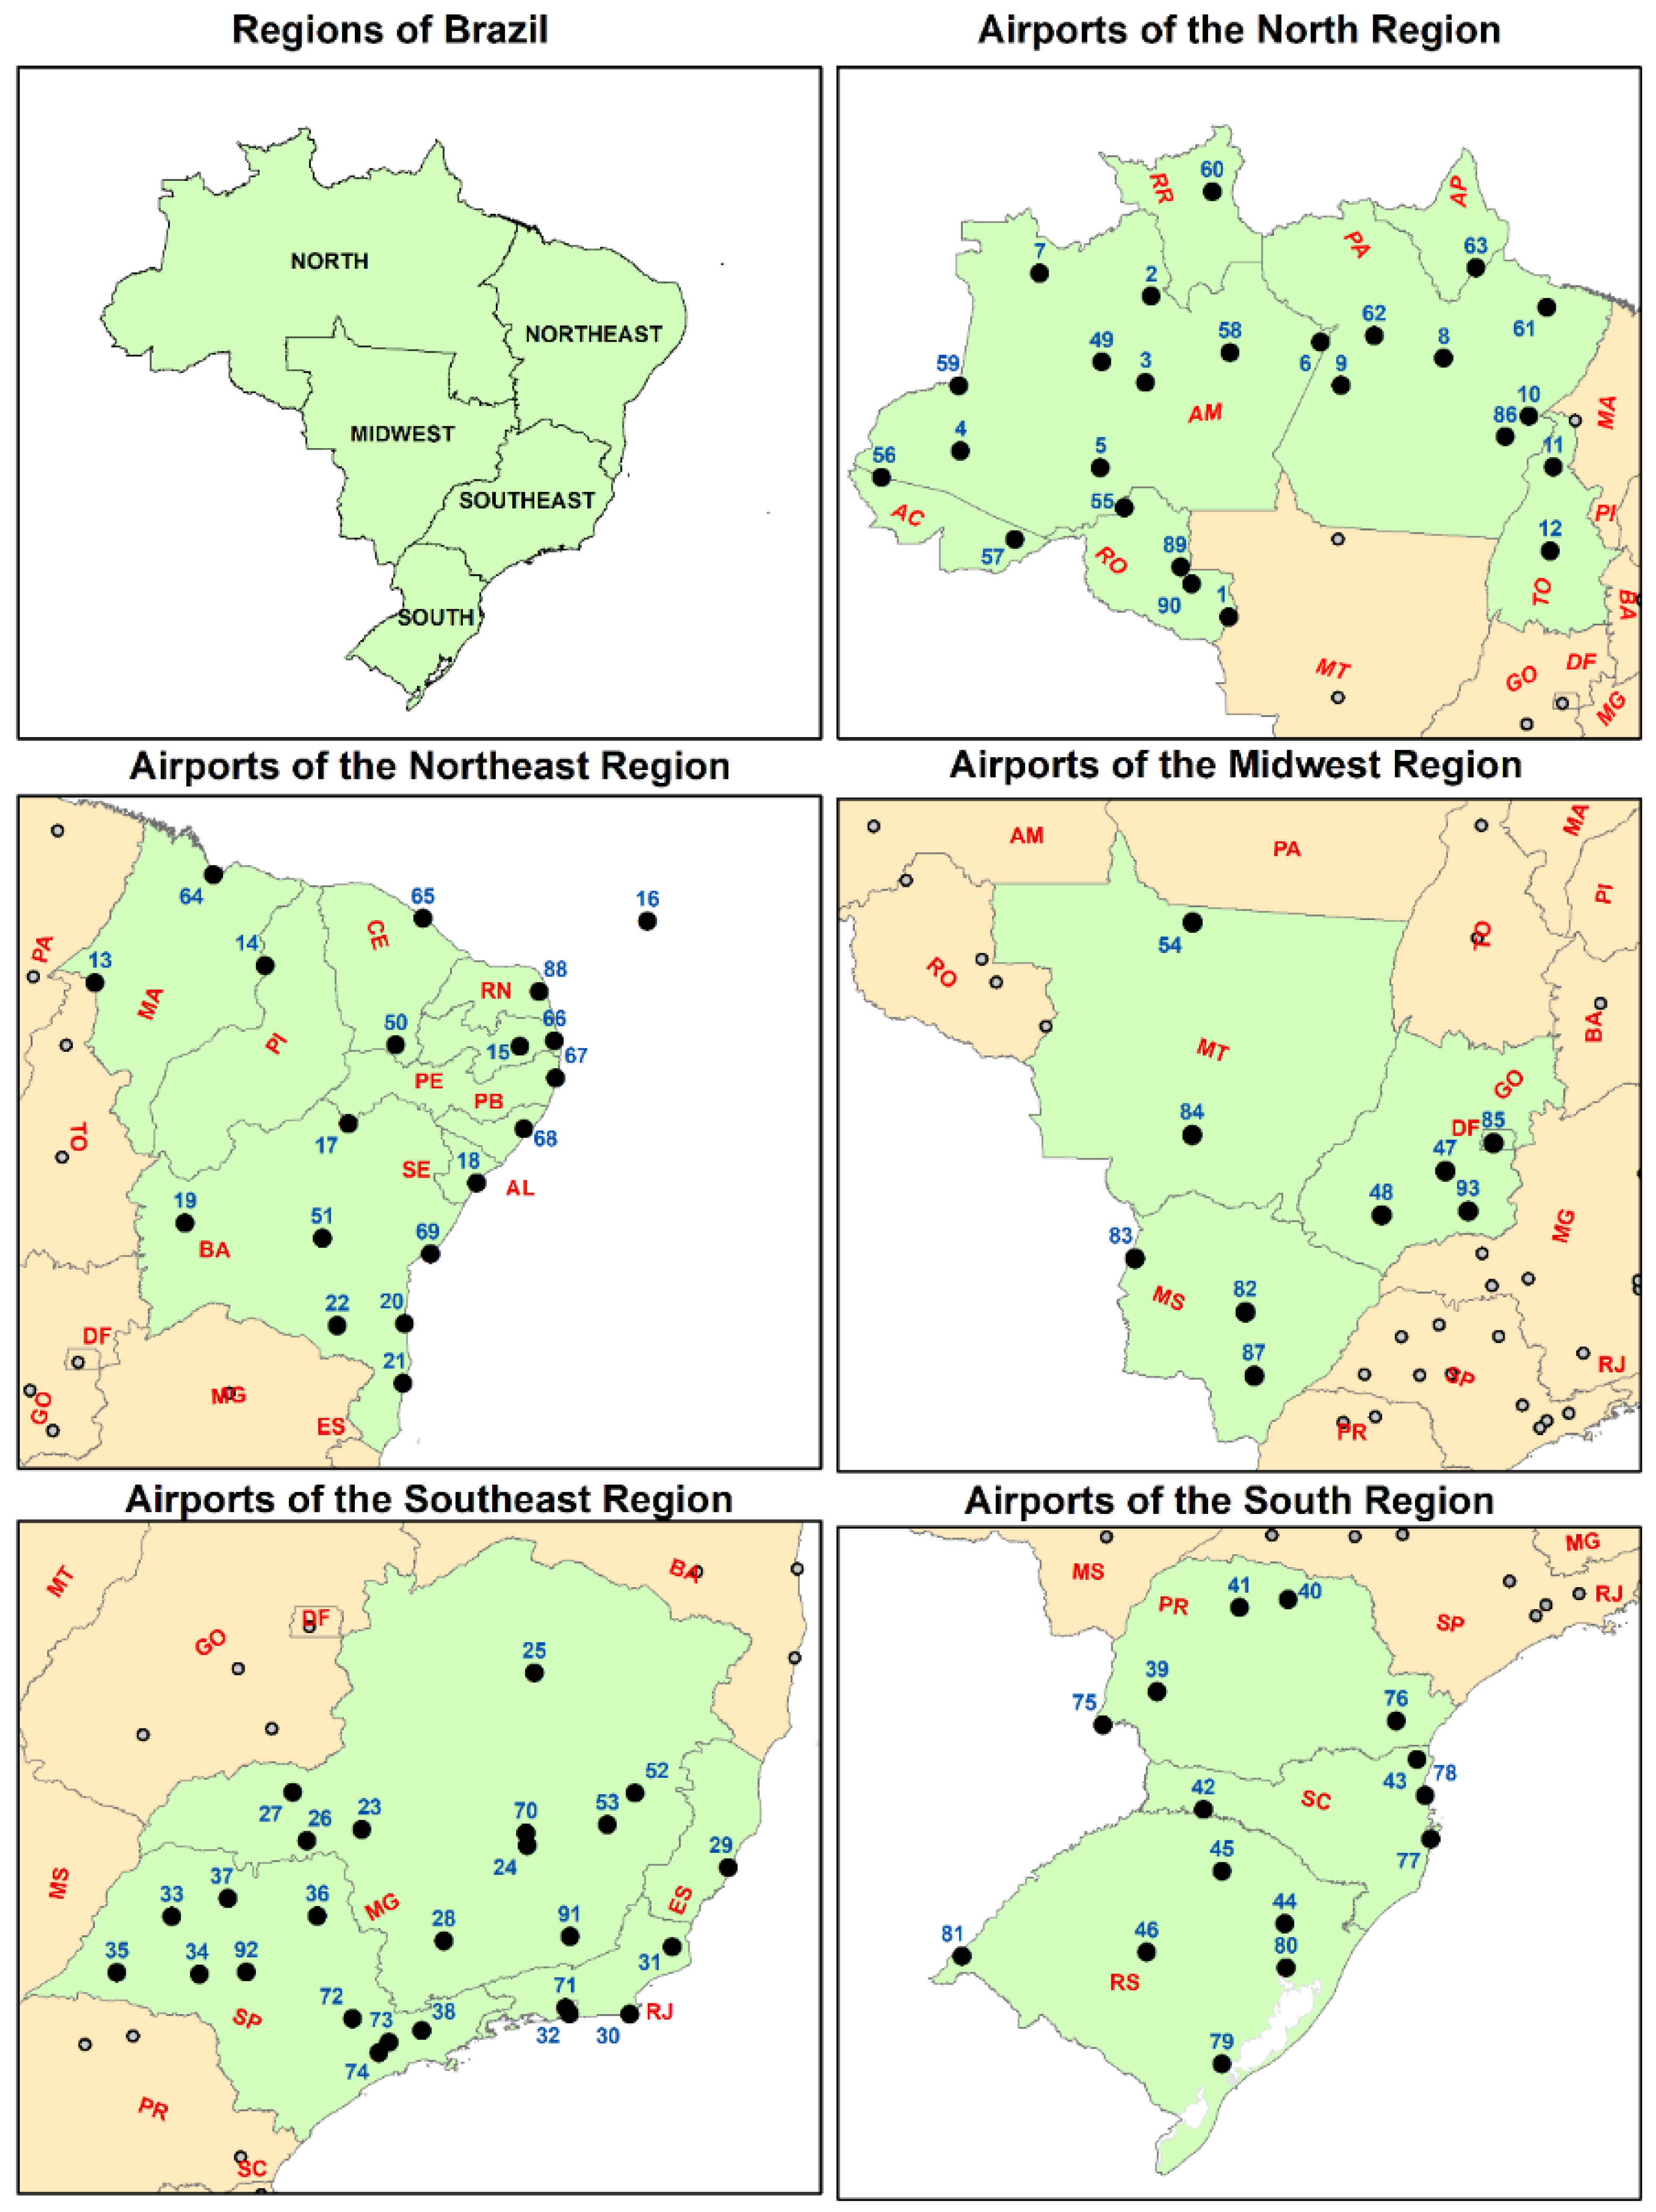
Appendix A


| ID | ICAO | CITY | STATE | REGION |
|---|---|---|---|---|
| 85 | SBBR | Brasília | Distrito Federal (DF) | MIDWEST (MW) |
| 47 | SBGO | Goiânia | Goiás (GO) | |
| 48 | SWLC | Rio Verde | ||
| 93 | SBCN | Caldas Novas | ||
| 82 | SBCG | Campo Grande | Mato Grosso do Sul (MS) | |
| 83 | SBCR | Corumbá | ||
| 87 | SBDO | Dourados | ||
| 54 | SBAT | Alta Floresta | Mato Grosso (MT) | |
| 84 | SBCY | Várzea Grande | ||
| 68 | SBMO | Maceió | Alagoas (AL) | NORTHEAST (NE) |
| 19 | SNBR | Barreiras | Bahia (BA) | |
| 20 | SBIL | Ilhéus | ||
| 21 | SBPS | Porto Seguro | ||
| 22 | SBQV | Vitória da Conquista | ||
| 51 | SBLE | Lencóis | ||
| 69 | SBSV | Salvador | ||
| 50 | SBJU | Juazeiro do Norte | Ceará (CE) | |
| 65 | SBFZ | Fortaleza | ||
| 13 | SBIZ | Imperatriz | Maranhão (MA) | |
| 64 | SBSL | São Luís | ||
| 15 | SBKG | Campina Grande | Paraíba (PB) | |
| 66 | SBJP | Santa Rita | ||
| 16 | SBFN | Fernando de Noronha | Pernambuco (PE) | |
| 17 | SBPL | Petrolina | ||
| 67 | SBRF | Recife | ||
| 14 | SBTE | Teresina | Piauí (PI) | |
| 88 | SBSG | Natal | Rio Grande do Norte (RN) | |
| 18 | SBAR | Aracaju | Sergipe (SE) | |
| 56 | SBCZ | Cruzeiro do Sul | Acre (AC) | NORTH (N) |
| 57 | SBRB | Rio Branco | ||
| 2 | SWBC | Barcelos | Amazonas (AM) | |
| 3 | SWKO | Coari | ||
| 4 | SWEI | Eirunepé | ||
| 5 | SWLB | Lábrea | ||
| 6 | SWPI | Parintins | ||
| 7 | SBUA | São Gabriel da Cachoeira | ||
| 49 | SBTF | Tefé | ||
| 58 | SBEG | Manaus | ||
| 59 | SBTT | Tabatinga | ||
| 63 | SBMQ | Macapá | Amapá (AP) | |
| 8 | SBHT | Altamira | Pará (PA) | |
| 9 | SBIH | Itaituba | ||
| 10 | SBMA | Marabá | ||
| 61 | SBBE | Belém | ||
| 62 | SBSN | Santarém | ||
| 86 | SBCJ | Parauapebas | ||
| 1 | SBVH | Vilhena | Rondônia (RO) | |
| 55 | SBPV | Porto Velho | ||
| 89 | SBJI | Ji-Paraná | ||
| 90 | SSKW | Cacoal | ||
| 60 | SBBV | Boa Vista | Roraima (RR) | |
| 11 | SWGN | Araguaína | Tocantins (TO) | |
| 12 | SBPJ | Palmas | ||
| 29 | SBVT | Vitória | Espírito Santo (ES) | SOUTHEAST (SE) |
| 23 | SBAX | Araxá | Minas Gerais (MG) | |
| 24 | SBBH | Belo Horizonte | ||
| 25 | SBMK | Montes Claros | ||
| 26 | SBUR | Uberaba | ||
| 27 | SBUL | Uberlândia | ||
| 28 | SBVG | Varginha | ||
| 52 | SBGV | Governador Valadares | ||
| 53 | SBIP | Santana do Paraíso | ||
| 70 | SBCF | Confins | ||
| 91 | SBZM | Juiz de Fora | ||
| 30 | SBCB | Cabo Frio | Rio de Janeiro (RJ) | |
| 31 | SBCP | Campos dos Goitacazes | ||
| 32 | SBRJ | Rio de Janeiro | ||
| 71 | SBGL | Rio de Janeiro | ||
| 33 | SBAU | Araçatuba | São Paulo (SP) | |
| 34 | SBML | Marília | ||
| 35 | SBDN | Presidente Prudente | ||
| 36 | SBRP | Ribeirão Preto | ||
| 37 | SBSR | São José do Rio Preto | ||
| 38 | SBSJ | São José dos Campos | ||
| 72 | SBKP | Campinas | ||
| 73 | SBGR | Guarulhos | ||
| 74 | SBSP | São Paulo | ||
| 92 | SBAE | Bauru | ||
| 39 | SBCA | Cascavel | Paraná (PR) | SOUTH (S) |
| 40 | SBLO | Londrina | ||
| 41 | SBMG | Maringá | ||
| 75 | SBFI | Foz do Iguaçu | ||
| 76 | SBCT | São José dos Pinhais | ||
| 44 | SBCX | Caxias do Sul | Rio Grande do Sul (RS) | |
| 45 | SBPF | Passo Fundo | ||
| 46 | SBSM | Santa Maria | ||
| 79 | SBPK | Pelotas | ||
| 80 | SBPA | Porto Alegre | ||
| 81 | SBUG | Uruguaiana | ||
| 42 | SBCH | Chapecó | Santa Catarina (SC) | |
| 43 | SBJV | Joinville | ||
| 77 | SBFL | Florianópolis | ||
| 78 | SBNF | Navegantes |
References
- Zhang, W.; Fang, C.; Zhou, L.; Zhu, J. Measuring megaregional structure in the Pearl River Delta by mobile phone signaling data: A complex network approach. Cities 2020, 104, 102809. [Google Scholar] [CrossRef]
- Zhang, W.; Zhu, J.; Zhao, P. Comparing World City Networks by Language: A Complex-Network Approach. ISPRS Int. J. Geo-Inf. 2021, 10, 219. [Google Scholar] [CrossRef]
- Brons, M.; Pels, E.; Nijkamp, P.; Rietveld, P. Price elasticities of demand for passenger air travel: A meta-analysis. J. Air Transp. Manag. 2002, 8, 165–175. [Google Scholar] [CrossRef] [Green Version]
- Zhang, F.; Graham, D.J. Air transport and economic growth: A review of the impact mechanism and causal relationships. Transp. Rev. 2020, 40, 506–528. [Google Scholar] [CrossRef]
- Tong, T.; Yu, E. Transportation and economic growth in China: A heterogeneous panel cointegration and causality analysis. J. Transp. Geogr. 2018, 73, 120–130. [Google Scholar] [CrossRef]
- Tolcha, T.D.; Bråthen, S.; Holmgren, J. Air transport demand and economic development in sub-Saharan Africa: Direction of causality. J. Transp. Geogr. 2020, 86, 102771. [Google Scholar] [CrossRef]
- Cabo, M.; Fernandes, E.; Pacheco, R.R.; Pires, H. Economic Growth Relations to Domestic and International Air Passenger Transport in Brazil. Int. J. Transp. Veh. Eng. 2018, 12, 1475–1480. [Google Scholar]
- Aprigliano Fernandes, V.; Pacheco, R.R.; Fernandes, E.; Cabo, M.; Ventura, R.V.; Caixeta, R. Air Transportation, Economy and Causality: Remote Towns in Brazil’s Amazon Region. Sustainability 2021, 13, 627. [Google Scholar] [CrossRef]
- Daley, B. Is air transport an effective tool for sustainable development? Sustain. Dev. 2009, 17, 210–219. [Google Scholar] [CrossRef]
- IBGE (Brazilian Institute of Geography and Statistics). Banco de Tabelas Estatísticas. 2019. Available online: https://sidra.ibge.gov.br/home/lspa/brasil (accessed on 5 May 2022).
- OAG. World Crisis Analysis Whitepaper; OAG Marketing Intelligence: Luton, UK, 2011. [Google Scholar]
- Derudder, B.; Witlox, F. Mapping world city networks through airline flows: Context, relevance, and problems. J. Transp. Geogr. 2008, 16, 305–312. [Google Scholar] [CrossRef]
- Grubesic, T.H.; Matisziw, T.C.; Zook, M.A. Global airline networks and nodal regions. GeoJournal 2008, 71, 53–66. [Google Scholar] [CrossRef]
- O’Connor, K.; Fuellhart, K. Cities and air services: The influence of the airline industry. J. Transp. Geogr. 2012, 22, 46–52. [Google Scholar] [CrossRef]
- Bhadra, D.; Kee, J. Structure and dynamics of the core US air travel markets: A basic empirical analysis of domestic passenger demand. J. Air Transp. Manag. 2008, 14, 27–29. [Google Scholar] [CrossRef] [PubMed]
- Pitfield, D.E.; Caves, R.E.; Quddus, M.A. Airline strategies for aircraft size and airline frequency with changing demand and competition: A simultaneous-equations approach for traffic on the north Atlantic. J. Air Transp. Manag. 2010, 16, 151–158. [Google Scholar] [CrossRef] [Green Version]
- Puller, S.L.; Taylor, L.M. Price discrimination by day-of-week of purchase: Evidence from the U.S. airline industry. J. Econ. Behav. Organ. 2012, 84, 801–812. [Google Scholar] [CrossRef]
- Fageda, X.; Flores-Fillol, R. Air services on thin routes: Regional versus low-cost airlines. Reg. Sci. Urban Econ. 2012, 42, 702–714. [Google Scholar] [CrossRef] [Green Version]
- Mumbower, S.; Garrow, L.A.; Higgins, M.J. Estimating flight-level price elasticities using online airline data: A first step toward integrating pricing, demand, and revenue optimization. Transp. Res. Part A 2014, 66, 196–212. [Google Scholar] [CrossRef]
- Luttmann, A. Evidence of directional price discrimination in the U.S. airline industry. Int. J. Ind. Organ. 2019, 62, 291–329. [Google Scholar] [CrossRef]
- Mohammadian, I.; Abareshi, A.; Abbasi, B.; Goh, M. Airline capacity decisions under supply-demand equilibrium of Australia’s domestic aviation market. Transp. Res. Part A 2019, 119, 108–121. [Google Scholar] [CrossRef]
- Oliveira, R.P.; Oliveira, A.V.M.; Lohmann, G.; Bettini, H.F.A.J. The geographic concentrations of air traffic and economic development: A spatiotemporal analysis of their association and decoupling in Brazil. J. Transp. Geogr. 2020, 87, 102792. [Google Scholar] [CrossRef]
- Urban, M.; Hornung, M. Mapping causalities of airline dynamics in long-haul air transport markets. J. Air Transp. Manag. 2021, 91, 101973. [Google Scholar] [CrossRef]
- Oliveira, B.F.; Oliveira, A.V. An empirical analysis of the determinants of network construction for Azul Airlines. J. Air Transp. Manag. 2022, 101, 102207. [Google Scholar] [CrossRef]
- Charnes, A.; Cooper, W.W.; Lewin, A.Y.; Seiford, L.M. Data Envelopment Analysis: Theory, Methodology and Applications; Kluwer Academic Publishers: Boston, MA, USA, 1994. [Google Scholar]
- Malmquist, S. Index numbers and indifference surfaces. Trab. De Estat. 1953, 4, 209–242. [Google Scholar] [CrossRef]
- Coelli, T.; Rao, D.S.P.; O’Donnell, C.J.; Battese, G.E. An Introduction to Efficiency and Productivity Analysis, 2nd ed.; Springer: New York, NY, USA, 2005. [Google Scholar]
- Färe, R.; Grosskopf, S.; Norris, M.; Zhang, Z. Productivity Growth, Technical Progress, and Efficiency Change in Industrialized Countries. Am. Econ. Rev. 1994, 84, 66–83. [Google Scholar]
- Ray, S.C.; Desli, E. Productivity Growth, Technical Progress, and Efficiency Change in Industrialized Countries: Comment. Am. Econ. Rev. 1997, 87, 1033–1039. [Google Scholar]
- IMF (International Monetary Fund). Report for Selected Country Groups and Subjects (Gross Domestic Product, Current Prices/Purchasing Power Parity; International Dollars). 2019. Available online: https://www.imf.org/external/datamapper/PPPSH@WEO/OEMDC/ADVEC/WEOWORL (accessed on 5 May 2022).
- Fernandes, V.A.; Pacheco, R.R.; Fernandes, E.; da Silva, W.R. Regional change in the hierarchy of Brazilian airports 2007–2016. J. Transp. Geogr. 2019, 79, 102467. [Google Scholar] [CrossRef]
- Silva, E.A.M.; Queiroz, M.P.; Fortes, J.A.A.S. Establishing a priority hierarchical for regional airport infrastructure investments according to tourism development criteria: A Brazilian case study. J. Spat. Organ. Dyn. 2017, 5, 351–375. [Google Scholar]
- Fridström, L.; Thune-Larsen, H. An econometric air travel demand model for the entire conventional domestic network: The case of Norway. Transp. Res. Part B 1989, 23, 213–223. [Google Scholar] [CrossRef]
- Kopsch, F. A demand model for domestic air travel in Sweden. J. Air Transp. Manag. 2012, 20, 46–48. [Google Scholar] [CrossRef] [Green Version]
- Mao, L.; Wu, X.; Huang, Z.; Tatem, A.J. Modeling monthly flows of global air travel passengers: An open-access data resource. J. Transp. Geogr. 2015, 48, 52–60. [Google Scholar] [CrossRef] [Green Version]
- Straszheim, M.R. Airline demand functions in the north Atlantic and their pricing implications. J. Transp. Econ. Policy 1978, 12, 179–195. [Google Scholar]
- Bowlin, W.F. Measuring Performance: An Introduction to Data Envelopment Analysis (DEA). J. Cost Anal. 1998, 15, 3–27. [Google Scholar] [CrossRef]
- Ter Wal, A.L.J.; Boschma, R.A. Applying social network analysis in economic geography: Framing some key analytic issues. Ann. Reg. Sci. 2009, 43, 739–756. [Google Scholar] [CrossRef] [Green Version]
- Forster-Carneiro, T.; Berni, M.D.; Lachos-Perez, D.; Prado, J.; Dorileo, I.L.; Rostagno, M.A. Characterization and analysis of specific energy consumption in the Brazilian agricultural sector. Int. J. Environ. Sci. Technol. 2017, 14, 2077–2092. [Google Scholar] [CrossRef]
- Giuliani, E.; Bell, M. The micro-determinants of meso-level learning and innovation: Evidence from a Chilean wine cluster. Res. Policy 2005, 34, 47–68. [Google Scholar] [CrossRef]
- Haddad, E.A.; Porsse, A.A.; Rabahy, W. Domestic tourism and regional inequality in Brazil. Tour. Econ. 2013, 19, 173–186. [Google Scholar] [CrossRef] [Green Version]
| Region | GDP (Billion Reals) | POP (Millions) | Per Capita GDP (Reals) | |||||||
|---|---|---|---|---|---|---|---|---|---|---|
| 2011 | % | 2016 | % | 2011 | % | 2016 | % | 2011 | 2016 | |
| SE | 3452 | 55.41 | 3332 | 53.17 | 80.98 | 42.09 | 86.36 | 41.91 | 41,149 | 38,585 |
| S | 1011 | 16.22 | 1067 | 17.02 | 27.56 | 14.33 | 29.44 | 14.29 | 38,711 | 36,243 |
| NE | 835 | 13.4 | 898 | 14.33 | 53.49 | 27.81 | 56.91 | 27.62 | 16,789 | 15,781 |
| MW | 596 | 9.57 | 633 | 10.1 | 14.24 | 7.4 | 15.66 | 7.6 | 44,431 | 40,412 |
| N | 336 | 5.4 | 337 | 5.38 | 16.1 | 8.37 | 17.71 | 8.59 | 20,951 | 19,043 |
| Brazil | 6230 | 6267 | 192.4 | 206.1 | 32,579 | 30,413 | ||||
| Variables | PAX | |
|---|---|---|
| 2011 | 2016 | |
| GDP ORIG | 0.293 | 0.323 |
| GDP DEST | 0.291 | 0.321 |
| POP ORIG | 0.300 | 0.329 |
| POP DEST | 0.298 | 0.327 |
| TICK | −0.302 | −0.332 |
| Year | PAX | GDP | POP | TICK | |
|---|---|---|---|---|---|
| Average | 2011 | 15,440 | 29,904 | 674 | 378.41 |
| Standard deviation | 52,872 | 84,294 | 1421 | 372.58 | |
| Upper value | 1,108,434 | 705,722 | 11,316 | 2272.62 | |
| Lower value | 52 | 89 | 3 | 95.31 | |
| Average | 2016 | 12,659 | 29,137 | 711 | 339.19 |
| Standard deviation | 40,773 | 83,060 | 1487 | 273.16 | |
| Upper value | 827,281 | 687,036 | 11,896 | 1637.08 | |
| Lower value | 52 | 114 | 3 | 107.25 | |
| Observations | 3133 | 90 | 90 | 3133 |
| Intra-Region | O-Ds | PAX 2011 | PAX 2016 | DEA 2011 | DEA 2016 | CU | FS | SEC | MI | DEA 2011 | DEA 2016 | MI | ||
|---|---|---|---|---|---|---|---|---|---|---|---|---|---|---|
| =100 | =100 | <1 | =1 | >1 | ||||||||||
| SE | 257 | 9991 | 7147 | 0.62 | 0.58 | 0.70 | 1.25 | 1.01 | 0.88 | 7 | 2 | 167 | - | 90 |
| S | 78 | 1751 | 1159 | 0.80 | 0.70 | 0.74 | 0.97 | 0.99 | 0.71 | 7 | 5 | 48 | - | 30 |
| NE | 187 | 2817 | 2246 | 0.55 | 0.60 | 0.70 | 1.07 | 0.99 | 0.74 | 10 | 8 | 112 | 1 | 74 |
| MW | 29 | 545 | 344 | 0.39 | 0.33 | 0.73 | 0.87 | 0.98 | 0.62 | - | - | 24 | - | 5 |
| N | 139 | 1414 | 1021 | 0.63 | 0.60 | 0.71 | 0.96 | 0.97 | 0.66 | 15 | 8 | 93 | - | 46 |
| DEA = 100 | 39 | 23 | ||||||||||||
| DEA < 100 | 651 | 667 | ||||||||||||
| Index < 1 | 673 | 324 | 402 | 444 | ||||||||||
| Index = 1 | 2 | 21 | 13 | 1 | ||||||||||
| Index > 1 | 15 | 345 | 275 | 245 | ||||||||||
| Total | 690 | 16,519 | 11,918 | 690 | 690 | 690 | 690 | 690 | 690 | 39 | 23 | 444 | 1 | 245 |
| Inter-Region | O-Ds | PAX 2011 | PAX 2016 | DEA 2011 | DEA 2016 | CU | FS | SEC | MI | DEA 2011 | DEA 2016 | MI | ||
|---|---|---|---|---|---|---|---|---|---|---|---|---|---|---|
| =100 | =100 | <1 | =1 | >1 | ||||||||||
| MW–NE | 139 | 1927 | 1787 | 0.38 | 0.41 | 0.66 | 1.29 | 0.99 | 0.85 | 1 | 1 | 53 | - | 86 |
| N–MW | 113 | 858 | 635 | 0.27 | 0.21 | 0.70 | 1.11 | 0.98 | 0.76 | - | 2 | 73 | - | 40 |
| N–NE | 248 | 765 | 713 | 0.23 | 0.23 | 0.66 | 1.36 | 1.00 | 0.90 | - | - | 116 | - | 132 |
| SE–MW | 191 | 6015 | 4735 | 0.51 | 0.48 | 0.73 | 1.19 | 0.99 | 0.86 | - | 2 | 103 | 1 | 87 |
| SE–NE | 479 | 9424 | 8261 | 0.60 | 0.62 | 0.68 | 1.30 | 1.00 | 0.88 | 12 | 18 | 206 | - | 273 |
| SE–N | 336 | 1579 | 1589 | 0.20 | 0.23 | 0.68 | 1.41 | 1.15 | 1.10 | 2 | 2 | 160 | - | 176 |
| S–MW | 119 | 1270 | 1186 | 0.33 | 0.34 | 0.72 | 1.28 | 1.03 | 0.95 | 1 | 2 | 55 | - | 64 |
| S–NE | 285 | 976 | 1202 | 0.16 | 0.20 | 0.68 | 1.76 | 1.06 | 1.26 | 4 | 2 | 80 | - | 205 |
| S–N | 197 | 257 | 361 | 0.06 | 0.10 | 0.69 | 1.88 | 1.10 | 1.42 | 2 | - | 75 | - | 122 |
| S–SE | 336 | 8784 | 7272 | 0.63 | 0.60 | 0.77 | 1.15 | 1.00 | 0.88 | 10 | 6 | 160 | - | 176 |
| DEA = 100 | 32 | 35 | ||||||||||||
| DEA < 100 | 2411 | 2408 | ||||||||||||
| Index < 1 | 2399 | 585 | 1245 | 1081 | ||||||||||
| Index = 1 | - | 17 | 16 | 1 | ||||||||||
| Index > 1 | 44 | 1841 | 1182 | 1361 | ||||||||||
| Total | 2443 | 31,856 | 27,742 | 2443 | 2443 | 2443 | 2443 | 2443 | 2443 | 32 | 35 | 1081 | 1 | 1361 |
Publisher’s Note: MDPI stays neutral with regard to jurisdictional claims in published maps and institutional affiliations. |
© 2022 by the authors. Licensee MDPI, Basel, Switzerland. This article is an open access article distributed under the terms and conditions of the Creative Commons Attribution (CC BY) license (https://creativecommons.org/licenses/by/4.0/).
Share and Cite
Aprigliano Fernandes, V.; Pacheco, R.R.; Fernandes, E.; Cabo, M.; Ventura, R.V. A Regional View of Passenger Air Link Evolution in Brazil. Sustainability 2022, 14, 7284. https://doi.org/10.3390/su14127284
Aprigliano Fernandes V, Pacheco RR, Fernandes E, Cabo M, Ventura RV. A Regional View of Passenger Air Link Evolution in Brazil. Sustainability. 2022; 14(12):7284. https://doi.org/10.3390/su14127284
Chicago/Turabian StyleAprigliano Fernandes, Vicente, Ricardo Rodrigues Pacheco, Elton Fernandes, Manoela Cabo, and Rodrigo V. Ventura. 2022. "A Regional View of Passenger Air Link Evolution in Brazil" Sustainability 14, no. 12: 7284. https://doi.org/10.3390/su14127284
APA StyleAprigliano Fernandes, V., Pacheco, R. R., Fernandes, E., Cabo, M., & Ventura, R. V. (2022). A Regional View of Passenger Air Link Evolution in Brazil. Sustainability, 14(12), 7284. https://doi.org/10.3390/su14127284