Article

Shaping the Optimal Technology for Servicing the Long-Distance Deliveries of Packaged Cargo by Road Transport

1
Department of Transportation Systems, Faculty of Civil Engineering, Cracow University of Technology, Str. Warszawska 24, 31-155 Kraków, Poland
2
Faculty of Mathematics and Information Technologies, Jagiellonian University, Str. Stanisława Łojasiewicza 6, 30-348 Kraków, Poland
3
Transport Technologies Department, Kharkiv National Automobile and Highway University, Str. Yaroslava Mudroho 25, 61-002 Kharkiv, Ukraine
4
Department of Operation and Technical Service of Machines, L’viv National Agrarian University, Str. Volodymyra Velykoho 1, 30-831 Dublyany, Ukraine
*
Author to whom correspondence should be addressed.
Sustainability 2022, 14(12), 7283; https://doi.org/10.3390/su14127283
Submission received: 17 April 2022 / Revised: 11 June 2022 / Accepted: 13 June 2022 / Published: 14 June 2022

Abstract

:
The concept of sustainable transportation of goods as the primary paradigm for designing contemporary logistics systems assumes the use of energy-efficient and affordable modes of transport in a way that guarantees the most cost-efficient variant of the delivery scheme. That especially applies to road transport deliveries, where the number of alternatives for organizing the transportation process is numerous and the choice of the optimal solution is complicated by the multiple stochastic influences of the environment on the technological processes. In this paper, we contribute to solving the problem of shaping the sustainable delivery schemes by proposing an approach to shape the complete set of alternative transport and technological schemes for packaged cargo delivery by road transport. The developed mathematical model allows estimating the efficiency of each alternative delivery scheme for the given request and chooses the best variant that minimizes the total costs of all participants in the delivery process. The proposed algorithms are implemented in the C# programming language within the frame of a class library for modeling transport delivery processes. A case of transport processes for Delivery Ltd. (Kharkiv, Ukraine) is applied to illustrate the procedure of using the developed approach to choose the optimal transport and technological schemes for long-distance deliveries. As the result of simulating the goods transportation processes, we show the regression models that represent dependencies of the total costs for the implementation of a delivery scheme from the parameters of demand for the transportation of goods. These regression models allow estimating the most efficient delivery schemes based on the functional analysis of the obtained dependencies for the given demand parameters.

1. Introduction

The contemporary paradigm of transportation systems development is based on sustainability principles. The servicing technological operations performed by the participants of a delivery process should be planned and implemented in a way that guarantees the minimum of harmful impact on the environment (ecological dimension), while the resources used for performing the servicing operations should be saved (economic dimension), and the quality of the service should stay at the satisfying level (social dimension) [1]. According to the concept of sustainable transportation, in that case, the ability of transport companies to maintain the servicing process continuously over time will not be jeopardized.
Although sustainable transportation usually refers to city logistics and last-mile deliveries [2,3,4], the optimization of logistics chains at the macro level allows for improving the servicing processes considering the main aspects of sustainable development of technological systems.
The technology of the cargo delivery process we define as a technique for the implementation of the transportation process by representing it as a system of consecutive and interlinked operations. These operations should be implemented to guarantee the highest efficiency of the delivery process for the given demand parameters and delivery conditions. Planning and implementation of the process of the packaged cargo (PC) delivery are based on transport and technological schemes of delivery (TTSD) that are quite complex due to the specific features of the transportation process.
The transportation process consists of numerous technological operations performed in most cases by different contractors (forwarding companies, freight terminals, transport companies, customs brokers, and others). The way these operations are implemented depends on the set of numeric parameters that characterize the client’s requirements and the decisions made by the delivery operator (usually a dispatcher of a forwarding company that coordinates the delivery process). In practice, as a rule, no complete set of alternative delivery schemes is being analyzed for defining the optimal variant of servicing a given request for delivery: operators of transport and forwarding companies use traditional structures of logistic chains depending on the delivery region or the type of cargo, whereas the choice of the optimal scheme would provide the maximal cumulative effect for all the entities participating in the delivery of a consignment. That substantiates the relevance of this study: to consider the complexity of the technology of the cargo delivery process while choosing the delivery scheme, the corresponding methodology should be proposed allowing decision-makers to choose the best possible way of delivering the consignment.
The existing practical and theoretical approaches to substantiating the delivery scheme are based on the choice of the best variant out of a restricted set of possible solutions. Such a way of planning does not guarantee the determination of the best possible technology for servicing a request for cargo delivery. The complete set of alternative solutions should be analyzed to determine the optimal delivery scheme, which is not always achievable in real-world conditions due to the complexity of the technological process: the number of basic technological operations and the number of alternative ways of performing each of these operations yield such a number of alternatives that their applicability and efficiency cannot be estimated in real-time. That justifies the necessity of the current study: the use of the method that analyzes the complete set of alternative technological schemes would eliminate the non-optimality of decisions made by transport operators. Its implementation would serve as the key component for decision-support tools used by the dispatchers of freight forwarding companies to determine the optimal technology for the delivery process.
The process of cargo delivery is a complex stochastic process due to the influence of many random factors on technological operations. To consider the random nature of the transportation process, the simulations of the servicing operations are performed while assessing the efficiency indicators for the given parameters of demand for deliveries and the structure of the technological process [5]. As the result of the servicing process in transport being random as well, after completing a series of simulations, the outputs are analyzed as stochastic variables based on the corresponding samples of the performance indicators. For these purposes, specialized software should be developed that implements a used approach to the optimization of a logistics system, because performing the simulation and analyzing the results in a not-automized way is not productive and not applicable for real-world situations.
The goal of this paper is to present the developed approach to choosing the optimal technology of packaged cargo delivery by road transport. We focus on long-distance deliveries of packaged cargo, as that type of TTSD has many more alternatives compared with short-distance deliveries.
While completing the research tasks, the following methods were used within the study presented in this paper:
  • the theory system methods to formulate the problem of choosing the optimal TTSD structure;
  • the queueing theory methods to represent the demand model as a flow of requests for deliveries of packaged cargo;
  • the graph theory to represent the approach to shape the full set of alternative TTSDs for the given structure of a logistics chain and to define the optimal TTSD;
  • the principles of the object-oriented programming to simulate the processes of servicing the flow of requests for deliveries of packaged cargo;
  • the methodology of the regression analysis to define the functional dependencies between the efficiency criterion and the parameters of demand for cargo deliveries;
  • the functional analysis methods to define the areas of the most efficient use of the alternative TTSDs.
The paper has the following structure: the most relevant approaches to shaping the delivery process of packaged cargo by road transport are discussed in the Section 2; in the Section 3, the mathematical model for substantiating the optimal TTSD is briefly described and the problem of shaping a complete set of alternative cargo delivery schemes is formulated; the Section 4 depicts the algorithm proposed for solving the stated problem; the Section 5 introduces an experimental study based on the real-world data provided by Delivery Ltd. (Kharkiv, Ukraine); the Section 7 offers brief conclusions and directions of future research.

2. Literature Review

The main objective of cargo delivery optimization is usually defined as the minimization of the use of resources regarding the delivery in terms of sustainability principles. This goal can be achieved when the cargo delivery system is considered as a logistics system considering the principles of integrated logistics, based on the consolidation of all participants in the delivery process to ensure the continuity of material flows and related information and financial flows. As the experience of developed countries shows, the use of logistics principles in practice reduces the overall delivery cost by up to 35%, accelerates the turnover of material resources to 40%, and reduces stocks of ready products in some cases even up to 100% [6]. Especially that concerns the last-mile deliveries as—traditionally—this the least efficient stage of the supply chain and comprises up to 28% of the total delivery cost [7].
Most of the existing approaches to implement long-distance delivery consider the use of contemporary information and communication technologies (ICT) for logistics [8,9,10,11,12]. Freight transport companies use an increasing number of applications based on ICT to improve the performance of their technological processes: dedicated Internet applications in logistics parks, for cargo owners, for truck management, for drivers, for transportation enterprises, and intercity distribution [10]. Predominantly, these applications provide a mechanism that automatically matches the consignor’s demand and the carrier’s supply based on mobile Internet. It enhances the use of empty trucks’ distances and improves the average vehicle load, which leads to an improvement of efficiency and a decline in carbon emission in the freight industry considered as the major contributor of greenhouse gas emission into the atmosphere [13,14]. These approaches were implemented in several countries, for example, in Great Britain [8], China [10], Colombia [11], and others.
The problem of decreasing empty trucks’ distances is relevant both from the environmental point of view and to improve the efficiency of freight transport. Such tasks relate to vehicle routing problems and are particularly important due to the imbalance in intercity freight demand for different countries [15,16,17,18,19]. The issues of vehicle routing related to equilibrium assignment techniques are considered in [20,21,22]; the problems of transportation network design are discussed in [23,24]. An extension of the classical vehicle routing problem is the pollution-routing problem that accounts not just for the travel distance, but also for greenhouse emissions, fuel, travel times, and their costs based on eco-routing methodology [25,26]. Another example is truck platooning which enables trucks to automatically follow the lead vehicle while maintaining minimal headway to reduce fuel consumption and minimize the burden imposed on drivers [16,27,28,29,30].
In the existing practice of the organization and implementation of long-distance deliveries, the services of freight forwarding companies are usually used [31,32]. As a rule, freight forwarders (FF) perform long-distance deliveries by using their own fleet, a fleet of local transport companies, or vehicles of other contractors—carriers that are located in the area of operations of the particular FF [33]. International forwarders often have their own freight terminals, means of transport for both long-distance and local transportation, loading and unloading equipment. At the same time, while organizing the delivery of packaged cargo, the key issue is to identify the most efficient transport and technological scheme of delivery [34], not necessarily involving their own production resources. Long-distance deliveries are characterized by a high level of customer requirements for the transportation speed, operational costs, the availability of additional services, and the reliability of the transport companies.
The completed analysis of practical and theoretical approaches to increase the efficiency of long-distance cargo deliveries demonstrates the need to develop the appropriate mathematical models and algorithms to enhance the efficiency of the transport process. In the recent literature, authors insufficiently discussed issues of increasing the efficiency of long-distance cargo delivery regarding the direction of shaping the technology of the delivery process, considering the stochastic nature of the transportation processes. Mainly, the recent scientific publications aim to solve the problem of choosing the best option from the set of known alternatives [35,36,37,38,39]; these approaches focus on the methods to perform certain organizational measures, wherein the optimization is based on the enumeration of some basic technological elements—the modules of the delivery process. To date, there are no integrated approaches to shaping the PC delivery technologies that consider the complete set of alternative delivery schemes.

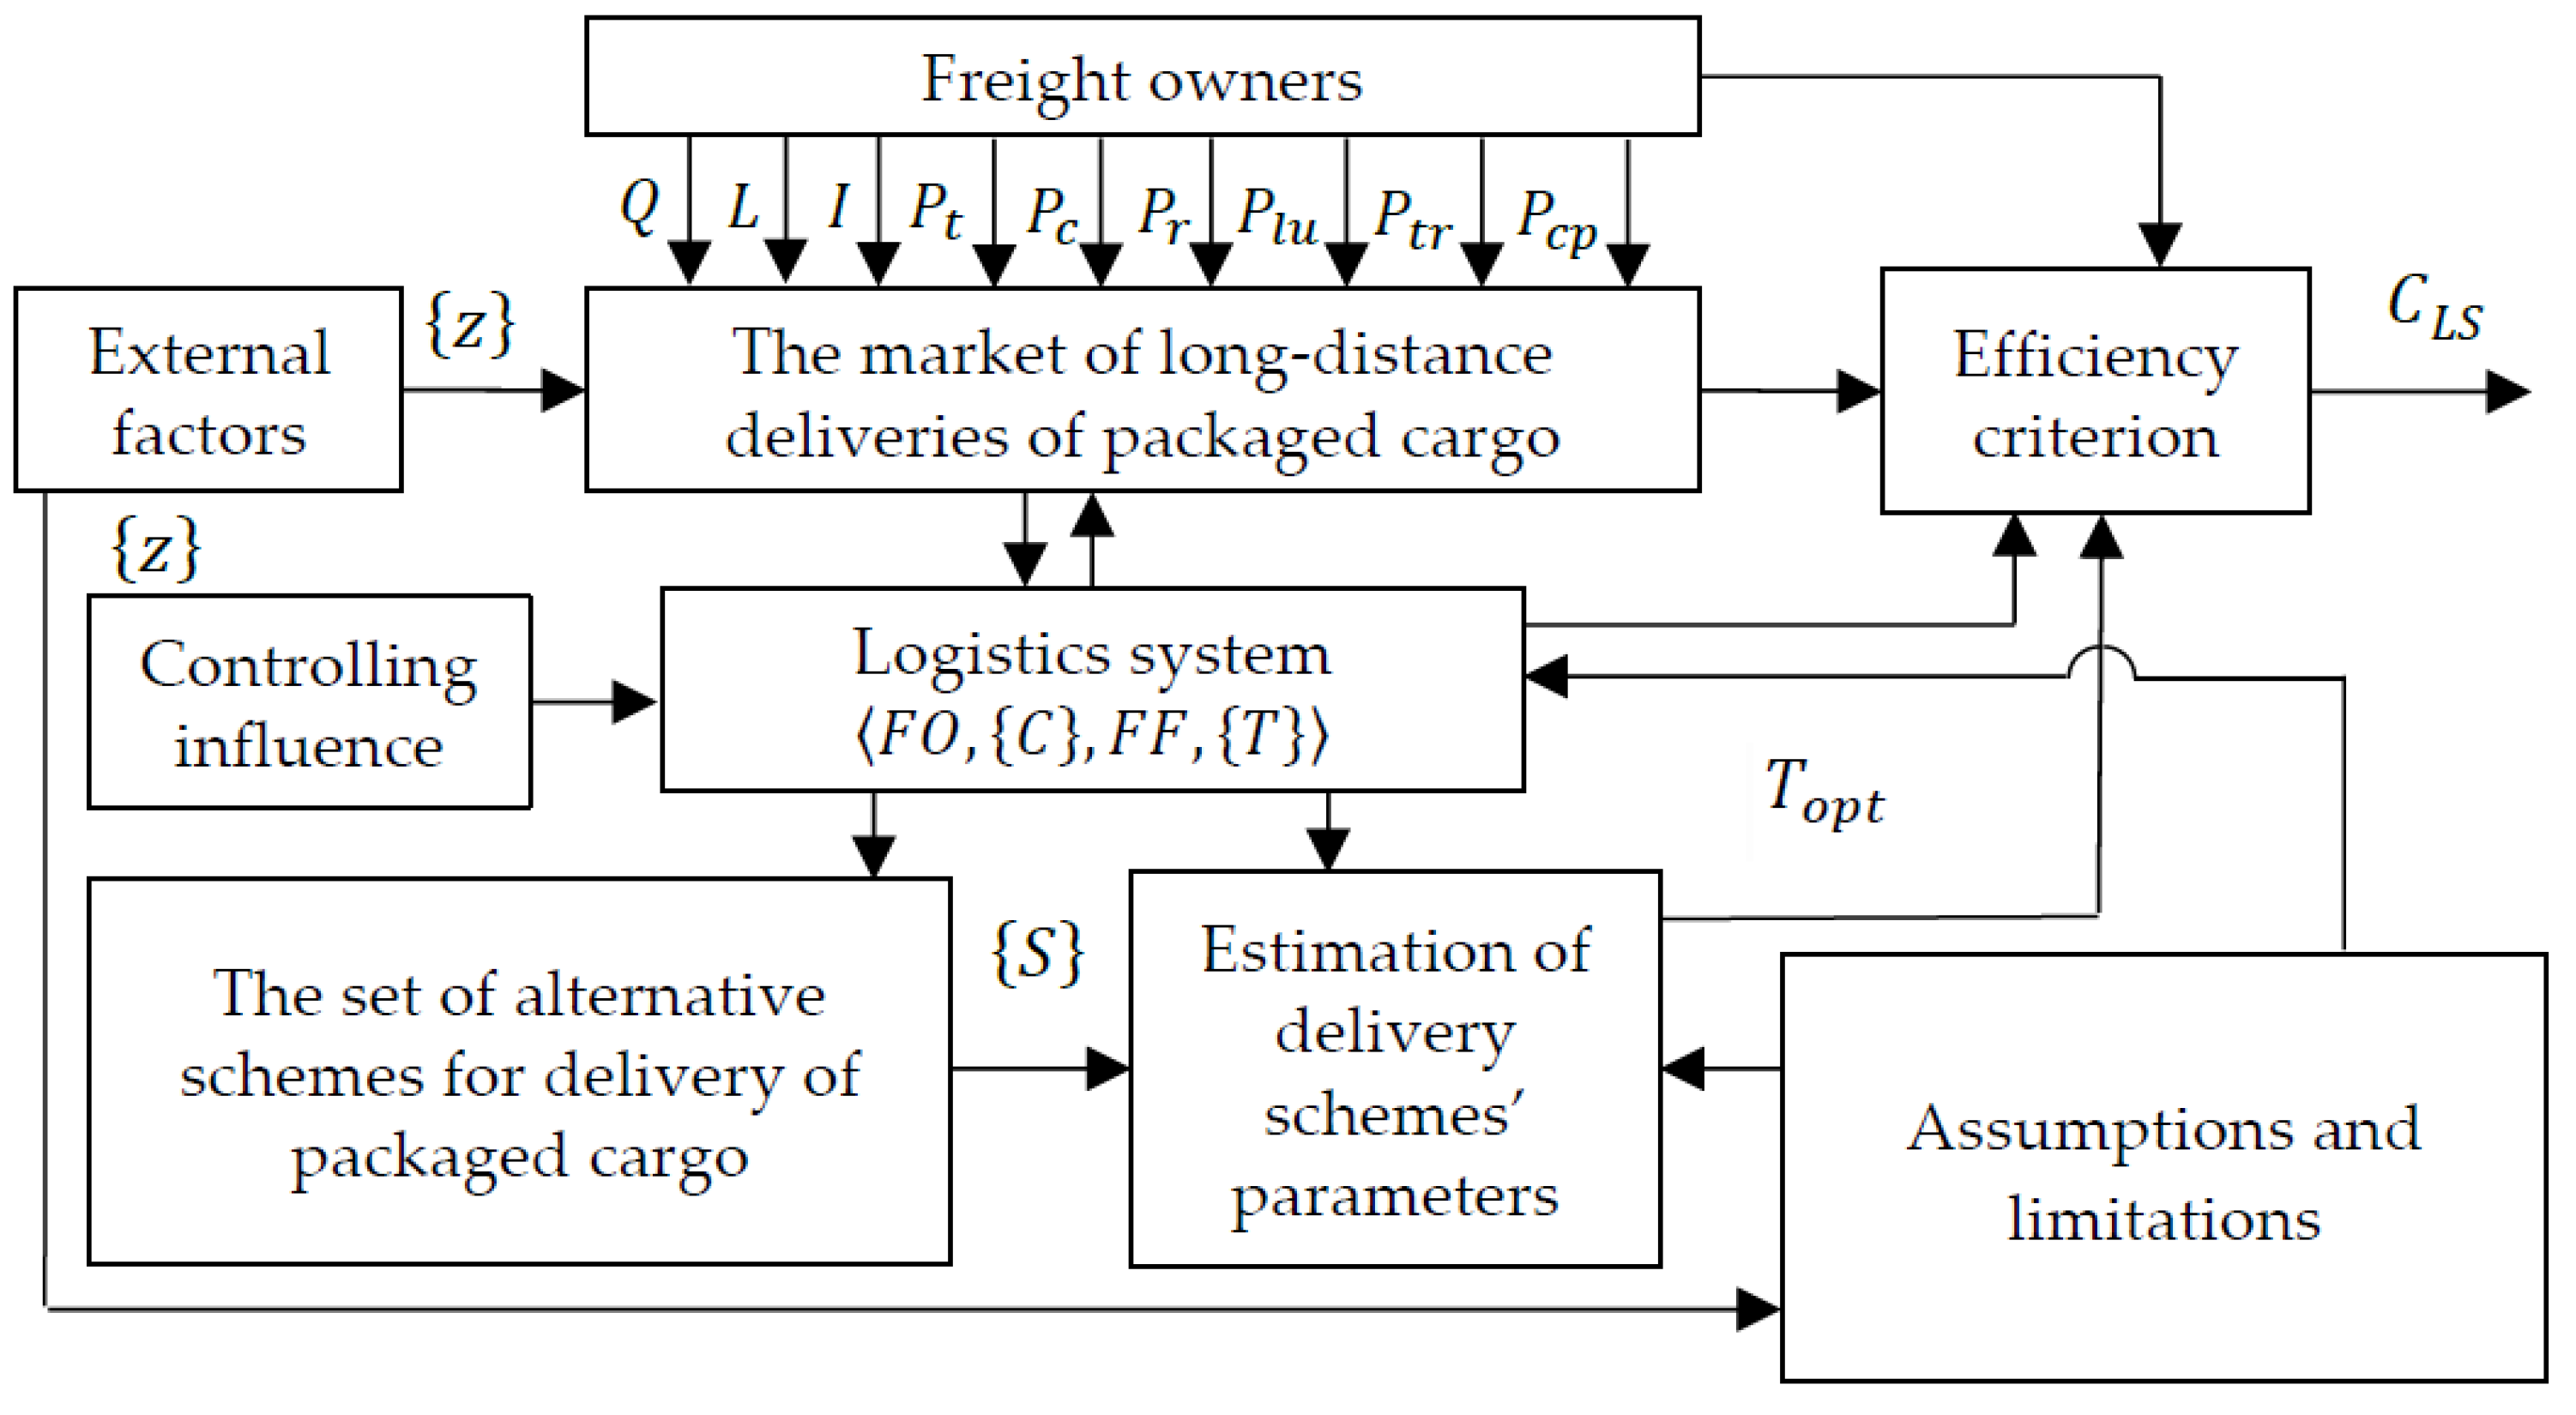
3. Mathematical Model for Shaping the Optimal Schemes of Packaged Cargo Delivery

The chosen delivery scheme has a direct effect on the efficiency of the process of long-distance delivery of packaged cargo by road transport [40,41,42,43]. Only if the TTSD is selected from the complete set of alternatives is the scheme considered as the optimal one. Such approach allows obtaining the maximum cumulative effect for all delivery process participants (usually presented as the minimum total costs of all entities involved in the delivery process).
The structure of a logistics system (LS) for packaged cargo deliveries is usually implemented based on one of four basic structures of the logistic supply chain (LSC). These structures describe the main types of interaction between all participants of the long-distance delivery process following their interests and capabilities [33]. The first LSC type (LSC1) describes a direct delivery without a freight forwarder. The second type (LSC2) is a delivery with a freight forwarding company involved. The third type (LSC3) indicates delivery through a freight terminal with carriers of two types participating (a carrier from the consigner to a terminal and a carrier that delivers a load from a terminal to a consignee). The fourth delivery structure (LSC4) involves two terminals, one of which is located in the consignor operation area and the second one in the consignee operation area, and three types of carriers (a carrier that delivers a consignment from a consignor to the first terminal, from the second terminal to a consignee, and the interterminal carrier). For each of the described basic structures, the set of TTSD alternatives can be proposed.
A logistics system serves a flow of requests for cargo deliveries and can be represented as the set L S containing a cargo owner F O , carriers { C } , a freight forwarder F F , and freight terminals { T } :
L S = F O , { C } , F F , { T }
The loop of functional links that defines the process of shaping the technological schemes for long-distance delivery of packaged cargo by road transport, shown in Figure 1, contains the following input parameters:
  • the consignment weight Q , [tons];
  • the delivery distance L , [km];
  • the time interval between the moments of current request reception and the reception of the next request in a flow I , [hours];
  • Boolean variables that characterize the following conditions to be fulfilled while servicing the request for cargo delivery:
    just-in-time delivery P t ,
    the necessity of cargo consolidation P c ,
    the return of empty transport containers to a freight owner P r ,
    loading and unloading (LU) by freight owner without the use of services provided by contractors P l u ,
    the delivery by using the freight owners’ transport P t r ,
    the availability of a cargo processing area at a freight owner’s premises P c p ,
    the type of package O C R ;
  • the external model factors { z } ;
  • the set of specific characteristics of participants of the delivery process conditioned by assumptions and limitations.
The analysis of the existing criteria of efficiency shows that the most appropriate criterion for the choice of the PC delivery scheme is the total costs of all participants of the delivery process as the elements of the efficiency criterion of the logistic system. It is supposed that the total cost of all serviced requests is the efficiency criterion suggesting that a single LSC structure is used to service a single owner’s request for the cargo delivery. The efficiency criterion C L S can be defined as follows:
C L S = i = 1 N R C L S C i = i = 1 N R ( C F O i + C F F i + p = 1 N C i C C p i + y = 0 N T i C T y i ) min ,
where C L S C i is the cost of servicing of the i-th request for delivery (UAH); C F O i , C C p i , C F F i , and C T y i are expenses of freight owners (consignors and consignees), carriers, freight forwarding companies, and freight terminals, respectively, that are involved in servicing of the i-th request for delivery (UAH/request); N C i is the number of carriers involved in the servicing of the i-th request; N T i is the number of all freight terminals involved in delivery of the i-th request, N R is the number of requests per the considered period of time.
The procedure of choosing the optimal TTSD consists of two interrelated processes: 1—the process of forming sets of alternative transport and technological cargo delivery schemes { S } ; 2—the process of estimating the effectiveness of alternative schemes and choosing the optimal scheme T o p t .
Additional characteristics of freight owners describe the following parameters:
  • the availability of empty shipping containers and their technical characteristics;
  • the availability of the required vehicles and the corresponding technical and economical characteristics of the available fleet;
  • the information on the availability and characteristics of loading and unloading (LU) facilities;
  • the information on the availability and characteristics of equipment for packaging, labeling, and documentation;
  • the information related to the cost of the cargo temporary storage operations performed by a freight owner;
  • data on the costs associated with staff salaries, bank transfers, communication services, and depreciation in the case of the independent servicing of the request for cargo delivery.
  • Characteristics of a freight forwarder include:
  • data on the availability of the required vehicle and its technical and financial characteristics;
  • data on the number of workers of all required work types involved in the implementation of a request for delivery;
  • data on the cost of servicing operations performed by workers involved in the servicing process;
  • data on the costs associated with the request implementation;
  • the profitability level.
  • Characteristics of a freight terminal are the following:
  • the availability of shipping containers and the corresponding technical characteristics of the facilities;
  • the information on the availability of the LU facilities and the corresponding parameters of the facilities;
  • data on the cost of involved workers and other activities related to the handling of cargo at the terminal;
  • the information on the availability and characteristics of equipment for packaging, labeling, and supporting documentation;
  • the cost of temporary cargo storage;
  • the tariff for the processing of a consignment.
The characteristics of a carrier as a contractor include data on the availability and performance of required vehicles and data on the operating costs of vehicles of the required type, and tariffs for the transport operations (for 1 ton-km for cargo transportation and 1 km for empty containers’ transportation).
The characteristics of an LU contractor include data on the availability and parameters of LU facilities, data on the number and the work cost of workers involved in LU operations, and the tariff for loading and unloading operations.

4. Algorithm for Shaping the Optimal TTSD for Long-Distance Deliveries of Packaged Cargo

As the main conceptual idea for justifying the optimal TTSD, we propose to define graph models, where the nodes represent alternatives for the delivery conditions and technological operations and the edges link consecutive nodes with the edge weights representing costs of operations. In that case, the complete set of TTSDs should not be listed to choose the optimal alternative: the shortest path on the graph will define it.

4.1. Models for Shaping the Complete Set of Alternative TTSD

Based on the analysis of modern approaches to the formalization of the cargo delivery process, we have formed the core list of elementary technological operations that could be implemented to deliver a consignment. The options of encoding for events due to the elementary operations of the technological process are introduced in the following format: response (event)—code—a summary of the option (event) characteristics.
The following events should be considered:
  • consultations with freight forwarding companies: a1—completed, a2—did not take place;
  • the evaluation of the possibility to serve the request by the company’s own vehicles: b1—completed, b2—did not take place;
  • a search at the logistics website: c1—took place, c2—did not take place;
  • providing the information at logistics websites: d1—completed, d2—did not take place;
  • the analysis of alternatives: e1—performed, e2—not performed;
  • a coordination of rates with the carrier: f1—took place, f2—did not take place;
  • a coordination of rates with the cargo owner: g1—took place, g2—did not take place;
  • transportation characteristics: aa1—a consignment as a single cargo, aa2—a consignment as a cargo in the consumer packaging, aa3—a consignment as a single cargo loaded on a pallet or in a container, aa4—a consignment as a cargo in the packaging provided by a consumer;
  • the availability of consumer packaging: ab1—available, ab2—not available;
  • the availability of packing means: ac1—available, ac2—not available;
  • a return of shipping tare: ad1—took place, ad2—did not take place;
  • the availability of LU facilities: ae1—available, ae2—not available;
  • the labeling applied: af1—automated, af2—manual;
  • the paperwork operations: ag1—automated, ag2—manual;
  • the labels’ reading: ai1—automated, ai2—manual;
  • required vehicle body type based on the cargo transport characteristics: ak1—van, onboard general-purpose vehicle (tented), ak2—other;
  • the availability of the required vehicle type: al1—available, al2—not available;
  • the loading and unloading scheme of a vehicle: am1—from the rear side of the vehicle, am2—from the sides, am3—combined;
  • the required scheme for the vehicle loading: an1—from the rear side of the vehicle, an2—from the sides, an3—combined;
  • the required scheme for the vehicle unloading: ao1—from the rear side, ao2—from the sides, ao3—combined;
  • the availability of a cargo processing area: ap1—available, ap2—not available;
  • the type of the used packaging method: aq1—mechanized, aq2—manual;
  • the warehouse recycling operations: at1—no need, at2—the consolidation of cargo units is required, at3—the reconfiguration of a cargo unit is required, at4—the disbanding of the cargo unit is required.
We represent the model of the full variant set of technological schemes of PC delivery as graphs for the four basic LSC structures (Figure 2 and Figure 3). The nodes in the shown graphs represent the alternative events and options for technological operations listed above. The attributes of the nodes are the same as the labels of the corresponding events. The graph nodes are connected by the edges in case the corresponding option of the next operation is available. The weights of the edges represent the costs of operating when the option associated with the node is applied.
The complete set of all paths from the top event (“Request is received”) to the end event (“Request is serviced”) can be obtained based on the presented graphs. To define the shortest path from the initial to the final node, Dijkstra’s algorithm may be used [44]. An example of graphical implementation of the optimal TTSD choice for two requests for cargo delivery with different initial characteristics is shown in Figure 3.

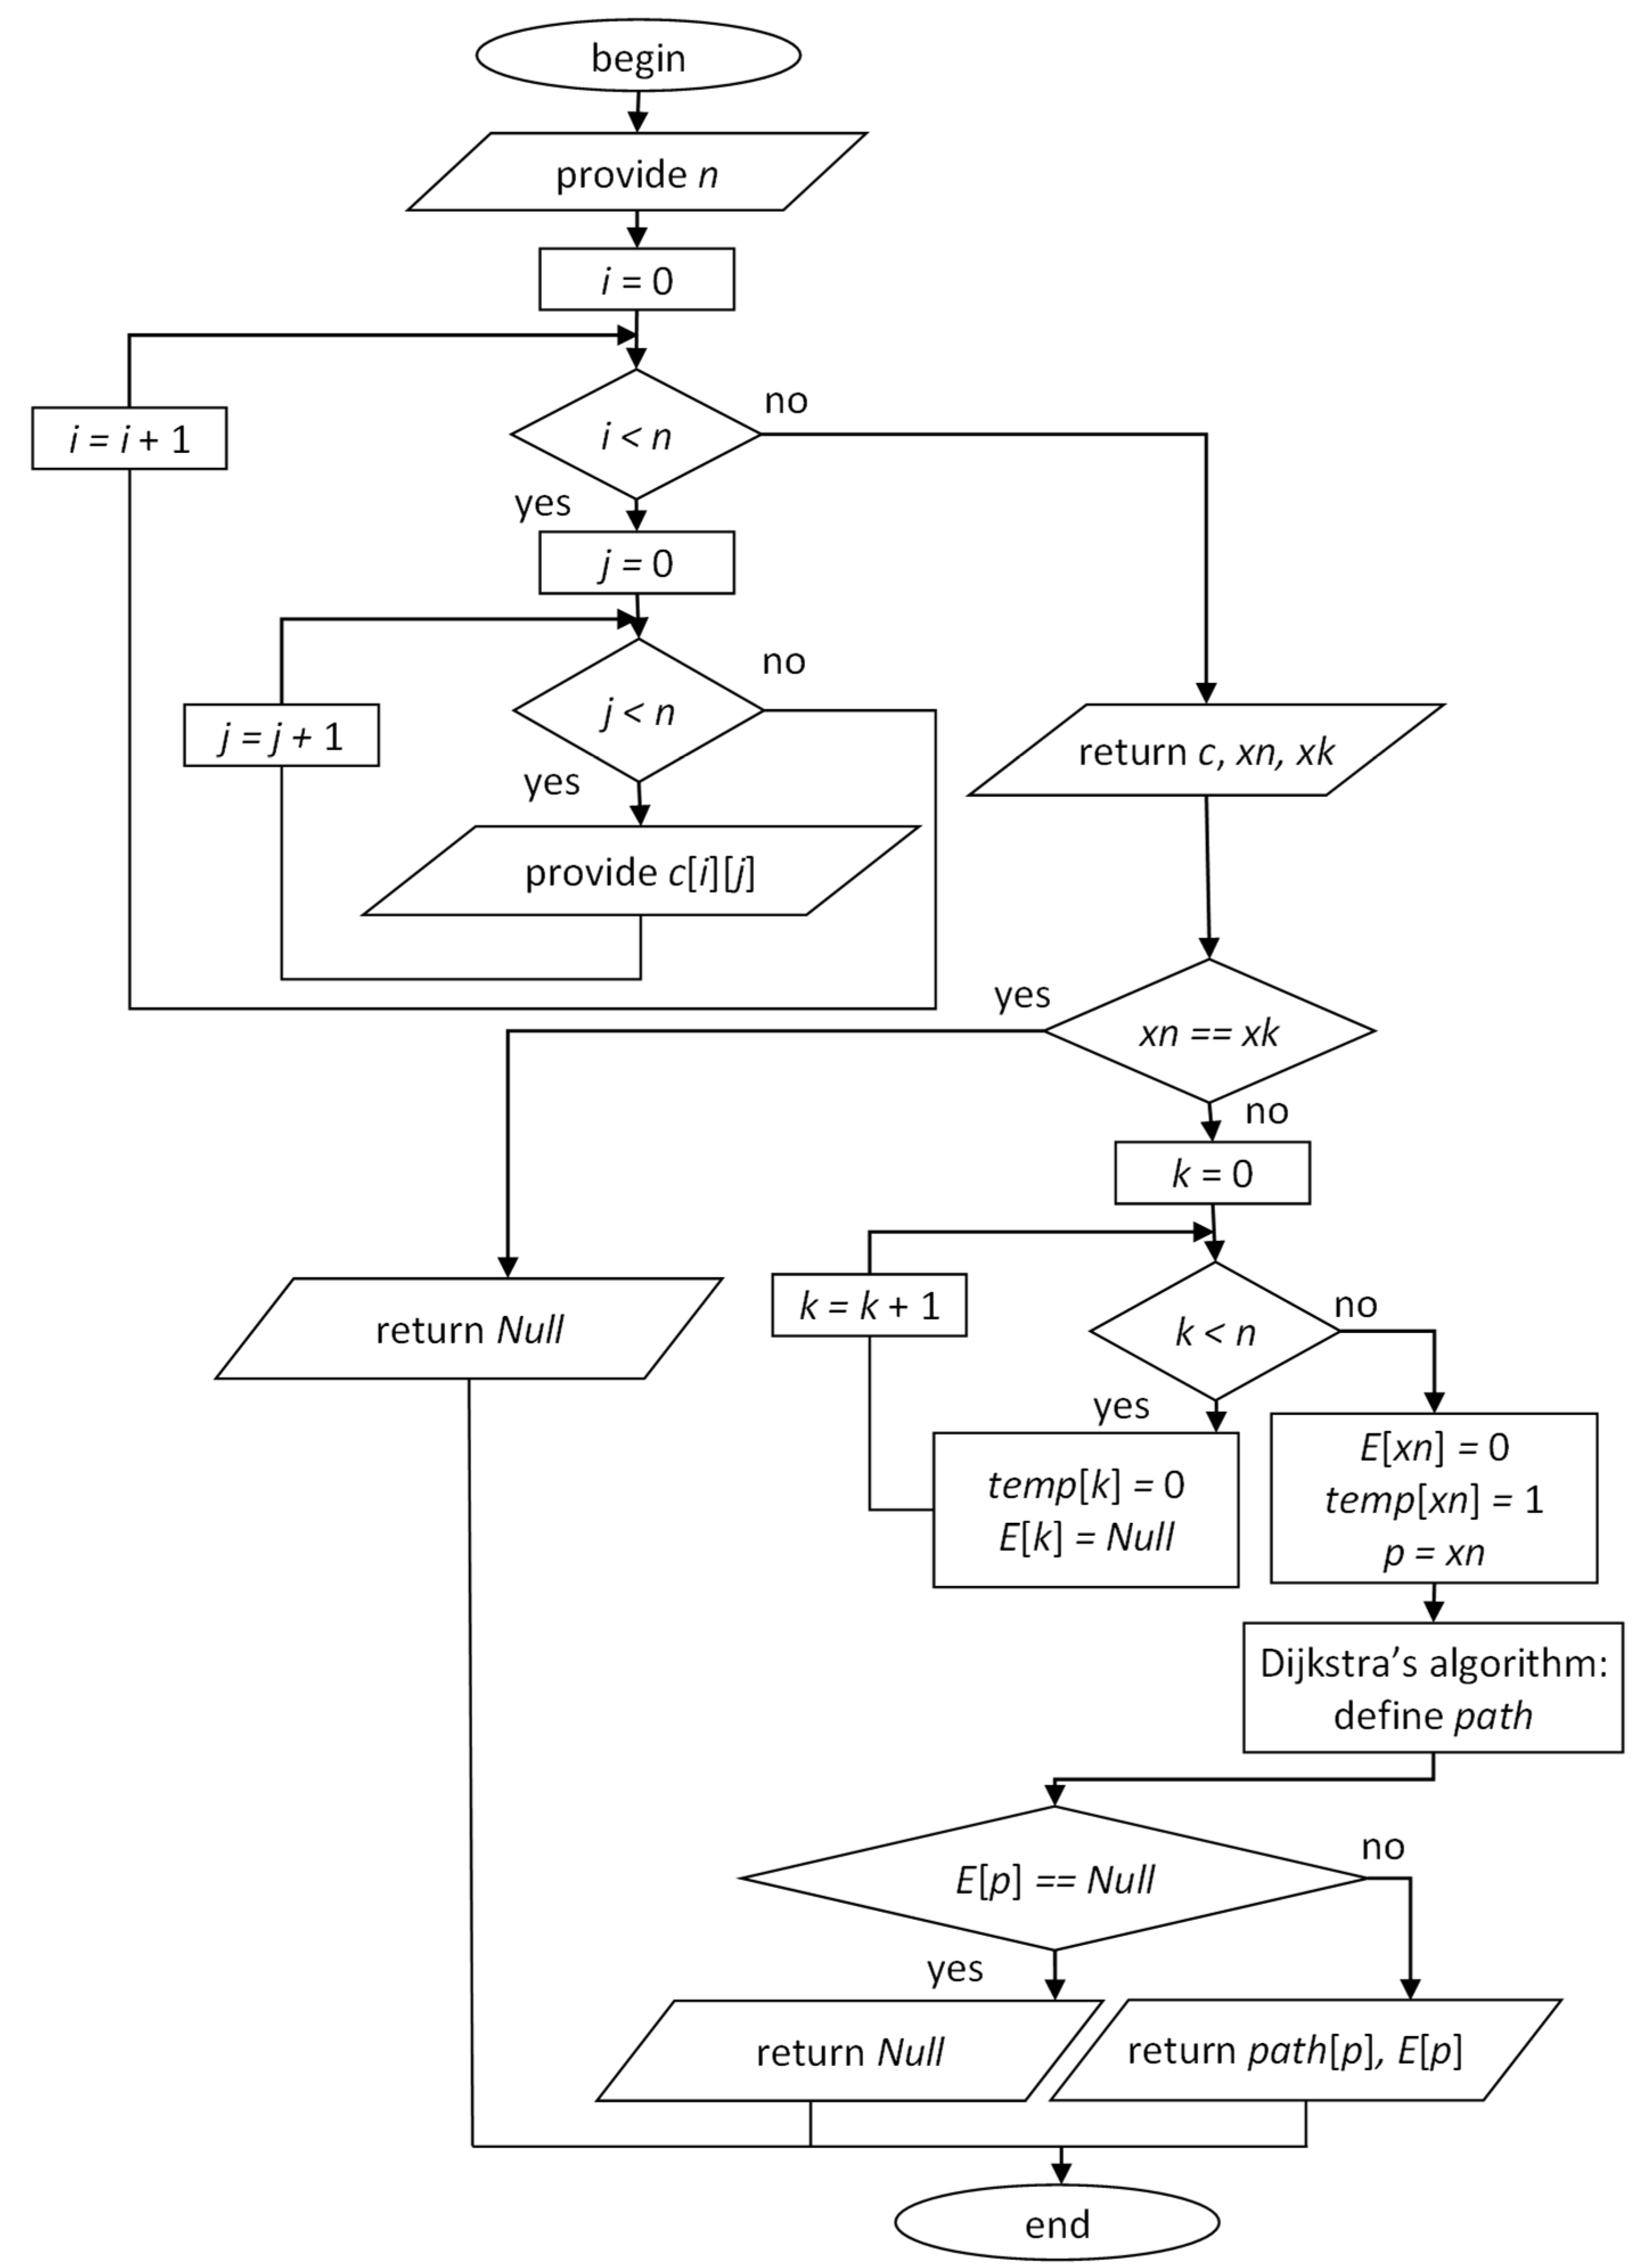
4.2. Algorithm for Defining the Chains of Minimum Length

The algorithm for creating chains of minimum length corresponding to the optimal TTSD for long-distance delivery of packaged cargo is shown in Figure 4. Input parameters of the model are graph nodes characterizing variants of events caused by technological operations ( n is the total number of vertices). The weights of the edges of the graph E represent the operation costs of implementing the associated technological operations. The array c contains the number of graph nodes and the weights of the edges (path) for the p -th element of the array and after applying Dijkstra’s algorithm includes the shortest path. The parameter x n is the code of the initial vertex, and x k is the code of the final vertex. The elements of the array t e m p [ x n ] equal 0 when the corresponding path is temporarily considered and take the value 1 when the path is accepted. The array p a t h contains the collections of nodes representing alternative paths.
The proposed algorithm for creating chains of minimum length allows choosing the optimal TTSD that minimizes the total costs of all participants in the delivery process.

5. Case Study: Shaping the Optimal Schemes for Long-Distance Delivery of Packaged Cargo by Road Transport in Ukraine

The presented approach to the formation of the optimal delivery schemes was used to minimize the total costs of all participants in the delivery process in Ukraine for the requests for deliveries serviced by the Delivery Ltd. company (Kharkiv, Ukraine). This case was chosen to illustrate the calculative abilities of the model and the respective software in the example, which does not require many resources: the territory of Ukraine is divided into 26 zones. The delivery distances for the flow of the requests range from 50 to 1500 km. Only requests for package cargo deliveries were considered.
To consider all possible combinations of input parameters that influence the choice of the optimal TTSD scheme, we developed the full factorial experiment. The plan of the computational experiment can be represented with the matrix that consists of 2048 series (Table 1) and the levels of variation for ten input parameters (Table 2).
The developed approach to justifying the optimal TTSD was implemented in the C# programming language within the frame of a class library TransportationServicesMarket.dll for modeling of cargo transport processes (the source code is available at [45]). The class library is developed in the environment of Microsoft Visual Studio.Net. The library allows us to describe the entities of the freight delivery market and the processes of their interaction within supply chains at different levels. The developed computer program estimates the variants of technological delivery schemes for the request with given characteristics and consistently saves the optimal TTSD and its characteristics in the data file. The optimal TTSD is represented as a sequence of elementary technological operations required for the cargo delivery process that is characterized by the minimum total costs for servicing the request.
As a result of running the developed program, the best TTSD variant is chosen from the full set of alternatives. An example of using the software implementation of a delivery process is shown in Figure 5, demonstrating the results of shaping the optimal TTSD for the LSC1 structure of a supply chain. The costs of performing the technological operations defined as weights of the graph edges are obtained as the output of the simulation model that considers parameters of technological operations as random variables. Based on the evaluated weights of the graph links, the matrix of the shortest distances in a network is evaluated for the graph considered as such the network. The nodes marked with 0 and 1 represent the beginning and finish of the servicing procedure. Hence, the shortest path from 0 to 1 will represent the optimal delivery scheme obtained as the result of simulations for given request parameters. Figure 5 shows the fragment of the shortest distance matrix and the shortest path from the node 0 to the node 1.
As a result of the simulation experiment carried out according to the developed plan, we obtain the data set consisting of 2048 combinations of possible values of technological parameters with the corresponding total delivery cost.

6. Analysis of the Experimental Results and Discussion

Based on the obtained results of simulations, the regression analysis was performed by using the MS Excel tools for data processing. The determination of the functional dependences of total costs from the input parameters has been carried out for each of the transport and technological structures in the following order:
  • shaping the alternative hypotheses about the functional dependencies;
  • estimating the coefficients of regression models to check the hypotheses;
  • evaluating the adequacy of the obtained regression models and choosing the most adequate one (based on the highest value of the determination coefficient).
The results of the regression analysis have shown that the linear model is the most appropriate (has the highest value of the determination coefficient) for the LSC1 structure of a logistic chain predominantly, and for other structures of a logistic chain, the most appropriate hypothesis is the power model with a free regression coefficient equal to 1. However, the set of the statistically significant (for the significance level of 5%) parameters influencing the total costs was different for the considered logistic chain structures. For example, the consignment weight, the delivery distance, the time interval between the requests in a flow, and the type of cargo were the most significant parameters for the LSC1 structure of a logistic chain:
{ C L S 1 065 = 182.6702 Q + 3.3215 L C L S 1 069 = 265.8916 Q + 3.2999 L + 5.1150 I C L S 1 070 = 247.0692 Q + 3.2984 L + 6.2784 I C L S 1 194 = 11.4183 + 203.3974 Q + 3.2583 L + 4.5959 I C L S 1 197 = Q 0.1645 L 0.4309 I 4.1662 C L S 1 198 = Q 0.1608 L 0.4497 I 4.0468
where C L S 1 065 , C L S 1 069 , C L S C 1 070 , C L S 1 194 , C L S 1 197 , and C L S 1 198 are the total delivery costs for using the TTSD with the structures 1-065, 1-069, 1-070, 1-194, 1-197, and 1-198 (UAH/ request).
The used coding of the TTSD structures should be interpreted in the following way:
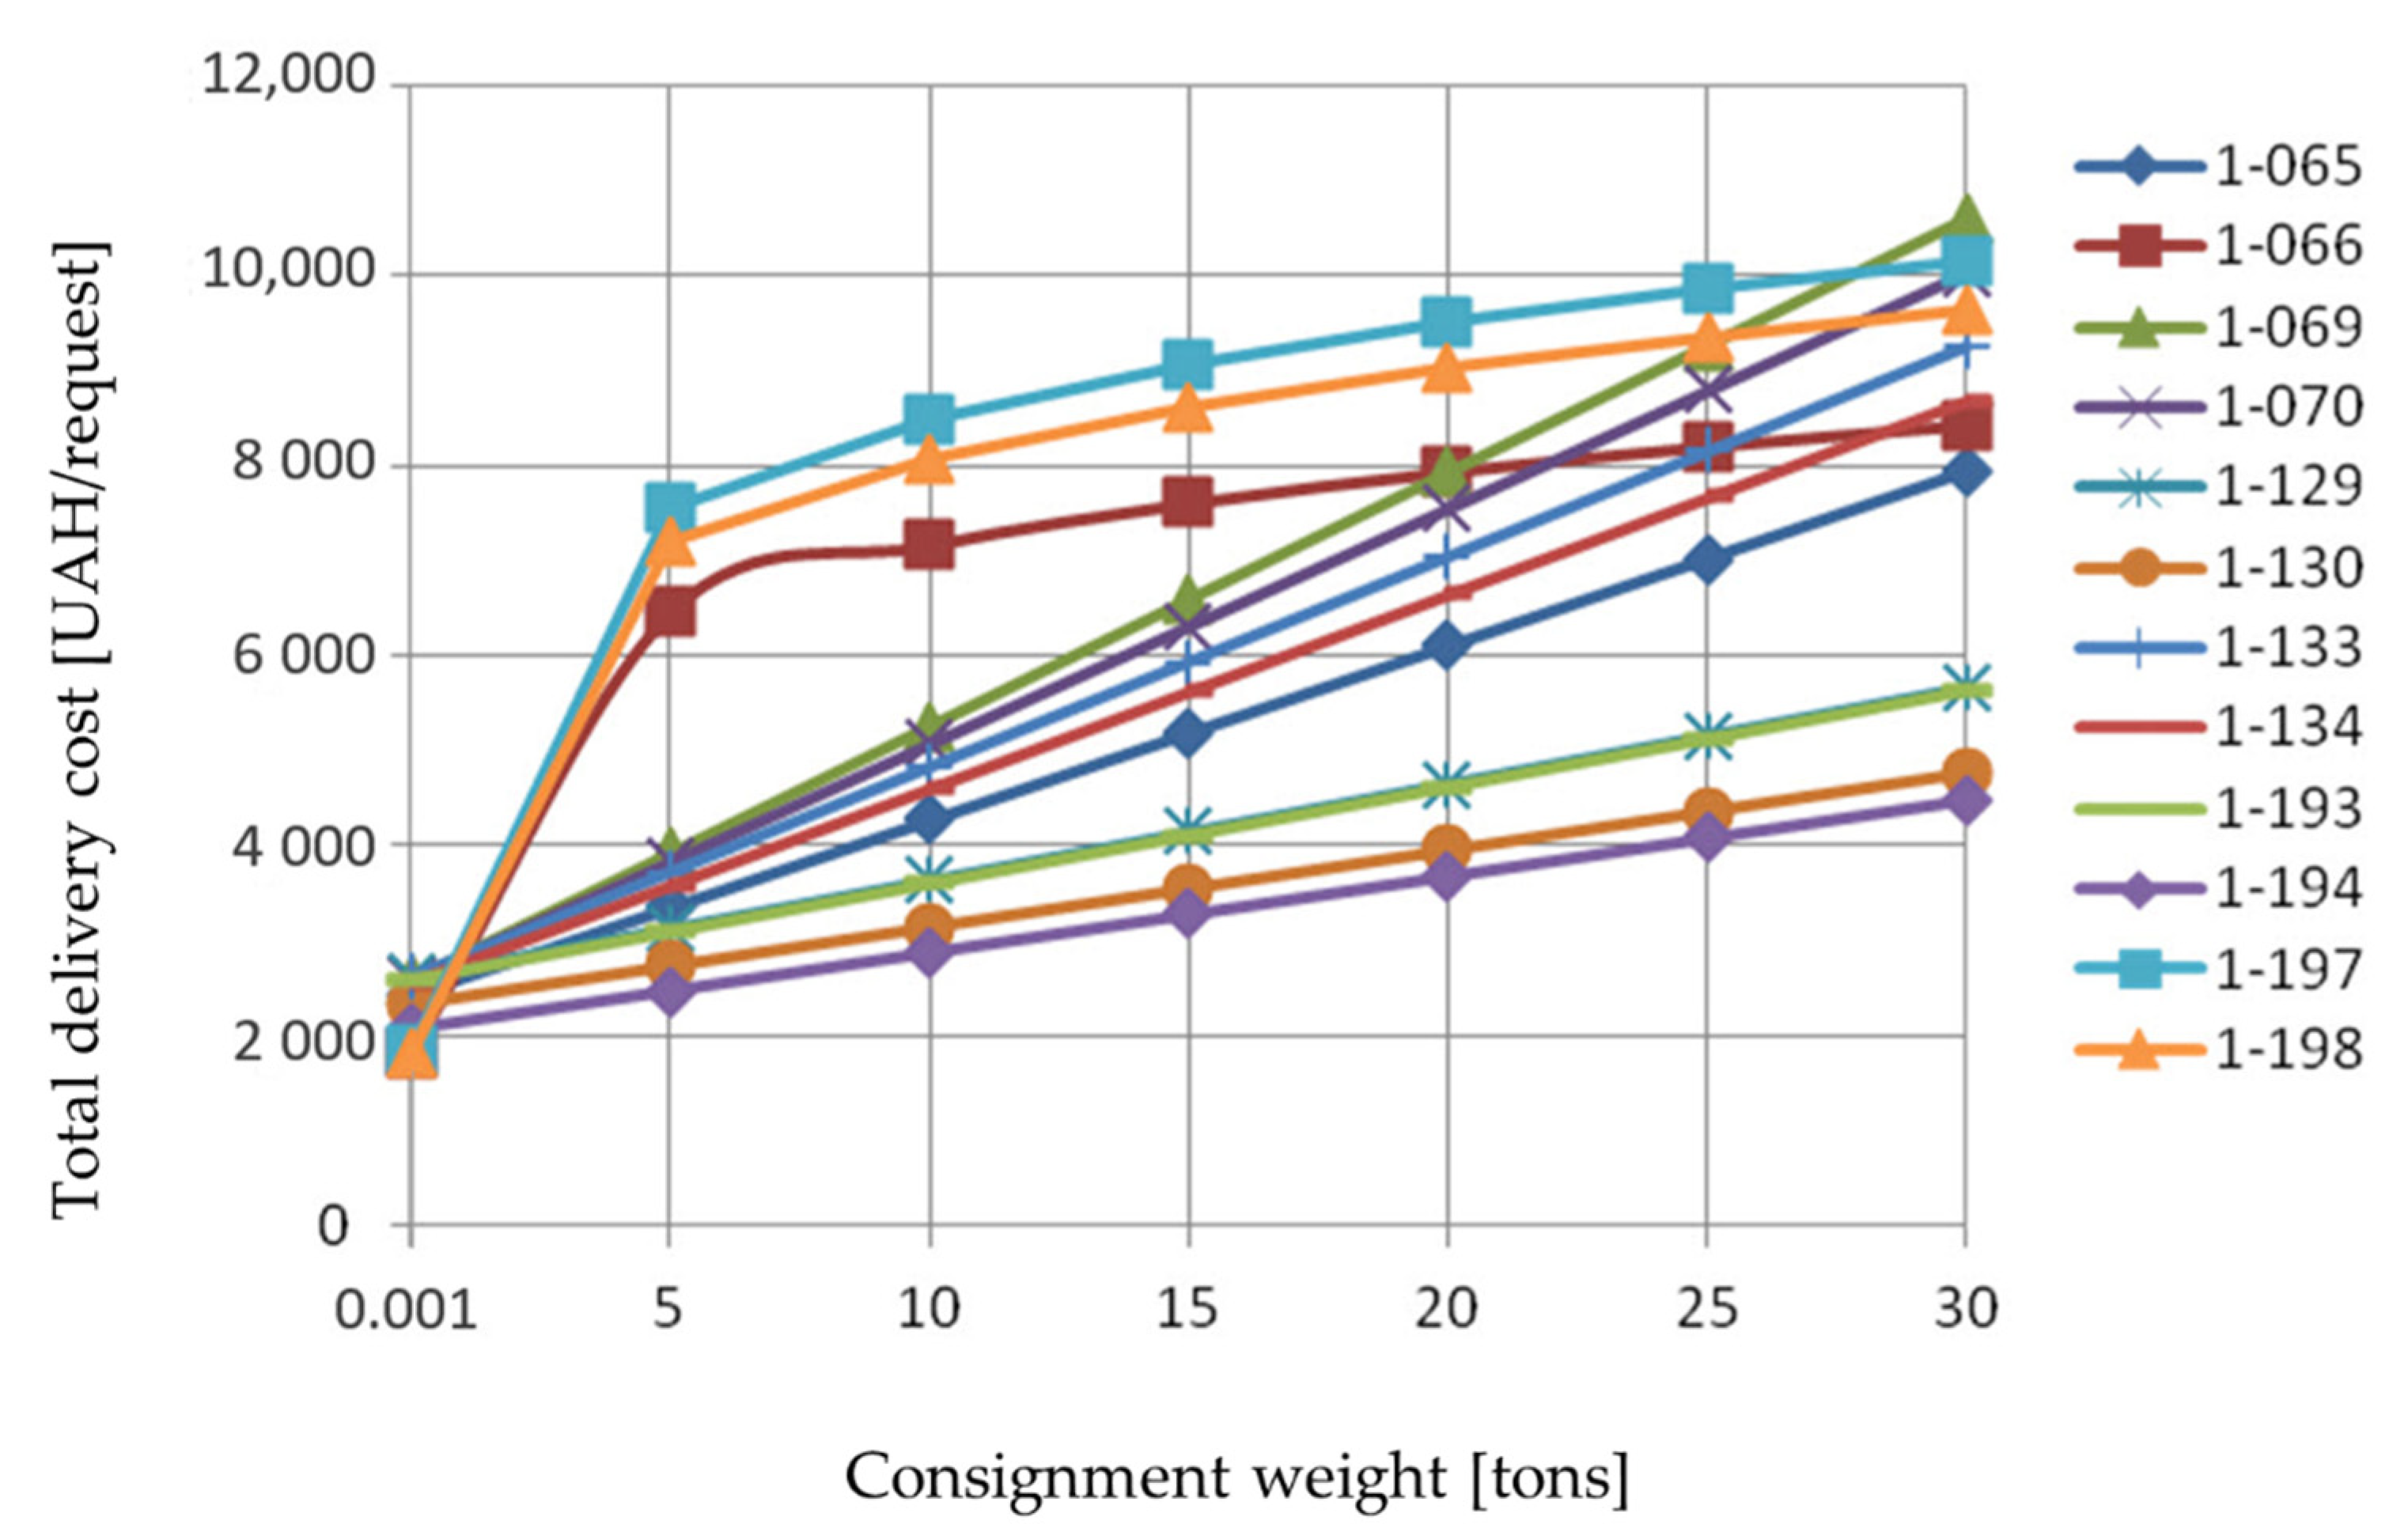
  • 1-065: direct delivery of cargo as a single consignment; load and unload performed by a client without cargo consolidation; a cargo processing area is available at the freight owner’s location; labeling operations and paperwork are automated;
  • 1-069: direct delivery of cargo as a single consignment without cargo consolidation operations; load and unload performed by a contractor; a cargo processing area is available at the freight owner’s location; labeling operations and paperwork are automated;
  • 1-070: direct delivery of cargo as a single consignment; load and unload performed by a freight owner without consolidation; a cargo processing area is not provided by a freight owner; labeling operations and paperwork are manual;
  • 1-194: direct delivery of a consignment as in the consumer’s container; load and unload performed by a freight owner without consolidation; a cargo processing area is available at the freight owner’s location; labeling operations and paperwork are manual;
  • 1-197: direct delivery of a consignment loaded on a pallet by a freight owner; load and unload performed by a contractor; a cargo processing area is not provided by a freight owner; labeling operations and paperwork are manual;
  • 1-198: direct delivery of a consignment loaded on a pallet by a freight owner; load and unload performed by a contractor; a cargo processing area is available at the freight owner’s location; labeling operations and paperwork are automated.
The dependences of the total costs of all delivery participants on the consignment weight structure based on the regression models for the set of the optimal variants of TTSD obtained for the LSC1 are shown in Figure 6. For the graphs presented in Figure 6, the delivery distance is 775 km and the time interval between the requests in a flow equals 6.2 h (average values of these parameters for the flow of requests serviced by the Delivery Ltd. company).
The analysis of the obtained results suggests that for the considered ranges of the input parameters’ values, the areas of the most effective use of the TTSD structures could be distinguished. These areas can be defined for each of the numeric parameters of the requests flow. Table 3 contains an example of the areas of the most effective TTSD use depending on the consignment weight. The presented results consider four structures of LSC described in Section 3 of this paper.
The synergistic effect from the management decision to justify the best cargo delivery scheme was assessed relative to the totality of all alternative TTSD variants as a weighted average, considering the significance (in terms of total costs) of each of the alternative variants. The numeric results are shown in the last column of Table 3.
The share of the synergistic effect for different types of entities participating in the delivery process was defined based on the weighted average costs for participants of the given type. The numeric results obtained based on the optimization results for the Delivery Ltd. company are shown in Table 4.
By analyzing the dependence of total delivery costs on the delivery distance for the set of obtained optimal TTSDs separately for each of the LSC structures, we can emphasize that the choice of the TTSD for each request should be performed by considering the set of the following conditions:
  • the numeric parameters of the requests flow should be evaluated to propose the stable TTSD structures;
  • the possibility of involvement in the delivery process of a partner freight forwarder or a freight terminal should be assessed preliminarily;
  • the availability of production resources for each of the participants (freight owner, partner forwarder, carriers) should be checked.
The developed approach to choosing the optimal TTSD can be used as the module in the frame of the decision-support system for transport operators: as far as the complete set of delivery schemes should not be defined to justify the optimal variant, the response of the proposed method will be fast enough to use it in real-world conditions. For the flows of requests for cargo delivery with stable numeric parameters, the concept of the areas of the most effective use of TTSD structures may be applied: the optimal delivery scheme could be chosen based on the consignment parameters (weight, delivery distance) and the preliminarily assessed ranges of these parameters where the TTSD structure is the best possible option. That determines the practical applicability of the proposed approach: the decision-makers should not estimate the total expenses for each of the alternative structures of a logistics chain to choose the best one. The optimal structure may be determined based on the numeric parameters of a consignment if the request’s characteristics belong in the predefined area of the most effective use of the structure.
We recommend the following methodology of the practical application for the proposed approach to justify the optimal TTSD structure:
  • the parameters of demand for the given delivery cluster (group of clients distinguished by their geographical location, type of cargoes, frequency of orders, etc.) should be studied—the distributions of the demand parameters and the corresponding numeric characteristics should be defined;
  • for the known demand parameters, the computer simulations of the delivery process should be performed and the total costs of using the alternative TTSDs should be determined for the consignments generated for the given demand parameters;
  • the ranges of demand parameters where the alternative TTSD structures are the best possible option should be assessed (these ranges of the demand parameters define the areas of the most efficient use for the alternative TTSD structures);
  • the obtained areas of the most efficient use should be used by transport operators (preferably as the module of the decision-support system) to choose the structure of the delivery scheme while servicing the consignments for deliveries.

7. Conclusions

The developed model for choosing the alternative transport and technological schemes of the packaged cargo delivery process allows evaluating all possible variants of delivery schemes considering parameters of consignment and existing constraints. The developed methodology makes it possible to estimate the efficiency of each alternative delivery scheme for the given request for delivery and choose the best option that minimizes the total costs of all the participants in the delivery process. Our approach assumes the justification of the optimal delivery scheme based on the graph representing all the possible alternatives of the technological process, which allows avoiding the time-consuming operations of defining the complete set of alternative schemes.
In practice, the research results can be implemented by defining the optimal areas of the TTSD use or by using the developed methodology as the module of the decision-support system.
The effect of choosing the optimal TTSD scheme when servicing the request flow for long-distance delivery is synergistic. It can be obtained only through the interaction of the participants in the delivery process within a logistics chain. The synergistic effect is a random variable; therefore, it is required to simulate the process of service of requests for deliveries to evaluate the effect’s expected value. The use of the proposed approach to choose the optimal TTSD structure in real-world conditions could provide an effect from UAH 6000 up to UAH 32,000 per one request for delivery. According to the simulation results, a freight owner benefits the most if the developed methodology is applied (the share of the effect for freight owners is up to 90%).
As the directions of future research, the following tasks should be mentioned:
  • the basic structures of the supply chains may be considered in a more detailed way (current research examines just the simplest structures);
  • studies for the wider range of input parameters should be carried out (the developed model allows considering numeric parameters not included in the plan of the performed simulation experiment);
  • the developed methodology should be applied to other types of cargo and types of transport.

Author Contributions

Conceptualization, V.N. and O.S.; methodology, V.N., O.S. and O.O.; software, V.N., O.S. and H.V.; validation, M.B. and M.O.; formal analysis, O.S. and O.O.; investigation, O.S. and O.O.; data curation, O.S. and M.O.; writing—original draft preparation, O.S.; writing—review and editing, V.N., H.V. and M.B.; visualization, O.S. and O.O. All authors have read and agreed to the published version of the manuscript.

Funding

This research received no external funding.

Institutional Review Board Statement

Not applicable.

Informed Consent Statement

Not applicable.

Acknowledgments

The authors acknowledge the support of the Delivery Ltd. company (Kharkiv, Ukraine) for providing real-world data for experimental studies.

Conflicts of Interest

The authors declare no conflict of interest.

References

  1. Sciller, P.L.; Bruun, E.C.; Kenworthy, J.R. An Introduction to Sustainable Transportation: Policy, Planning and Implementation; Earthscan: London, UK, 2010. [Google Scholar]
  2. Grava, S. Urban Transportation Systems: Choices for Communities; McGrow-Hill: New York, NY, USA, 2002. [Google Scholar]
  3. Ortúzar, J.D. Future transportation: Sustainability, complexity, and individualization of choices. Commun. Transp. Res. 2021, 1, 100010. [Google Scholar] [CrossRef]
  4. Bosona, T. Urban freight last mile logistics—Challenges and opportunities to improve sustainability: A literature review. Sustainability 2020, 12, 8769. [Google Scholar] [CrossRef]
  5. Wang, W.; Wu, Y. Is uncertainty always bad for the performance of transportation systems? Commun. Transp. Res. 2021, 1, 100021. [Google Scholar] [CrossRef]
  6. Bogoviz, A.V.; Ragulina, Y.V.; Lobova, S.V.; Zhukov, B.M.; Stepanova, O.M. Services infrastructure forming in the process of transport logistics stock movement. Int. Rev. Manag. Mark. 2016, 6, 278–283. [Google Scholar]
  7. Ranieri, L.; Digiesi, S.; Silvestri, B.; Roccotelli, M. A review of last mile logistics innovations in externalities cost reduction vision. Sustainability 2018, 10, 782. [Google Scholar] [CrossRef] [Green Version]
  8. Wang, Y.; Rodrigues, V.S.; Evans, L. The use of ICT in road freight transport for CO2 reduction—An exploratory study of UK’s grocery retail industry. Int. J. Logist. Manag. 2015, 26, 2–29. [Google Scholar] [CrossRef] [Green Version]
  9. Perego, A.; Perotti, S.; Mangiaracina, R. ICT for logistics and freight transportation: A literature review and research agenda. Int. J. Phys. Distrib. Logist. Manag. 2011, 41, 457–483. [Google Scholar] [CrossRef]
  10. Li, Y.; Yu, Y. The use of freight apps in road freight transport for CO2 reduction. Eur. Transp. Res. Rev. 2017, 9, 6. [Google Scholar] [CrossRef] [Green Version]
  11. Moros-Daza, A.; Cassandro-De La Hoz, D.; Jaller-Martelo, M.; Paternina-Arboleda, C.D. Using advanced information systems to improve freight efficiency: Results from a pilot program in Colombia. Lect. Notes Comput. Sci. 2019, 11756, 22–38. [Google Scholar]
  12. Paksoy, T.; Bektaş, T.; Özceylan, E. Operational and environmental performance measures in a multi-product closed-loop supply chain. Transp. Res. Part E Logist. Transp. Rev. 2011, 47, 532–546. [Google Scholar] [CrossRef]
  13. Sundo, M.B.; Vergel, K.N.; Sigua, R.G.; Regidor, J.R.F. Methods of estimating energy demand and CO2 emissions for inter-regional road transport. Int. J. GEOMATE 2016, 11, 2182–2187. [Google Scholar] [CrossRef]
  14. Llano, C.; Pérez-Balsalobre, S.; Pérez-García, J. Greenhouse gas emissions from intra-national freight transport: Measurement and scenarios for greater sustainability in Spain. Sustainability 2018, 10, 2467. [Google Scholar] [CrossRef] [Green Version]
  15. Sakai, T.; Kawamura, K.; Hyodo, T. Logistics facilities for intra and inter-regional shipping: Spatial distributions, location choice factors, and externality. J. Transp. Geogr. 2020, 86, 102783. [Google Scholar] [CrossRef]
  16. Hirata, T.; Fukaya, T. Potential of truck platooning for transporting empty trucks considering intercity freight demand imbalances. Logforum 2020, 16, 373–383. [Google Scholar] [CrossRef]
  17. Hirsch, P. Minimizing empty truck loads in round timber transport with tabu search strategies. Int. J. Inf. Syst. Supply Chain Manag. 2011, 4, 15–41. [Google Scholar] [CrossRef] [Green Version]
  18. McKinnon, A.C.; Ge, Y. The potential for reducing empty running by trucks: A retrospective analysis. Int. J. Phys. Distrib. Logist. Manag. 2006, 36, 391–410. [Google Scholar] [CrossRef]
  19. Ivanova, O. Modelling inter-regional freight demand with input-output, gravity and SCGE methodologies. In Modelling Freight Transport; Elsevier: Amsterdam, The Netherlands, 2014; pp. 13–42. [Google Scholar]
  20. Jourquin, B. A multi-flow multi-modal assignment procedure on large freight transportation networks. Stud. Reg. Sci. 2006, 35, 929–945. [Google Scholar] [CrossRef] [Green Version]
  21. Zhalechian, M.; Tavakkoli-Moghaddam, R.; Zahiri, B.; Mohammadi, M. Sustainable design of a closed-loop location-routing-inventory supply chain network under mixed uncertainty. Transp. Res. Part E Logist. Transp. Rev. 2016, 89, 182–214. [Google Scholar] [CrossRef]
  22. Marufuzzaman, M.; Ekşioğlu, S.D. Managing congestion in supply chains via dynamic freight routing: An application in the biomass supply chain. Transp. Res. Part E Logist. Transp. Rev. 2017, 99, 54–76. [Google Scholar] [CrossRef]
  23. Lewe, J.-H.; Hivin, L.F.; Mavris, D.N. A multi-paradigm approach to system dynamics modeling of intercity transportation. Transp. Res. Part E Logist. Transp. Rev. 2014, 71, 188–202. [Google Scholar] [CrossRef]
  24. Apivatanagul, P.; Regan, A.C. Long haul freight network design using shipper-carrier freight flow prediction: A California network improvement case study. Transp. Res. Part E Logist. Transp. Rev. 2010, 46, 507–519. [Google Scholar] [CrossRef]
  25. Minett, C.F.; Salomons, A.M.; Daamen, W.; Van Arem, B.; Kuijpers, S. Eco-routing: Comparing the fuel consumption of different routes between an origin and destination using field test speed profiles and synthetic speed profiles. IEEE Forum Integr. Sustain. Transp. Syst. 2011, 5973621, 32–39. [Google Scholar]
  26. Bektaş, T.; Laporte, G. The pollution-routing problem. Transp. Res. Part B Methodol. 2011, 45, 1232–1250. [Google Scholar] [CrossRef]
  27. Zhang, W.; Jenelius, E.; Ma, X. Freight transport platoon coordination and departure time scheduling under travel time uncertainty. Transp. Res. Part E Logist. Transp. Rev. 2017, 98, 1–23. [Google Scholar] [CrossRef]
  28. Bhoopalam, A.K.; Agatz, N.; Zuidwijk, R. Planning of truck platoons: A literature review and directions for future research. Transp. Res. Part B Methodol. 2018, 107, 212–228. [Google Scholar] [CrossRef] [Green Version]
  29. Boysen, N.; Briskorn, D.; Schwerdfeger, S. The identical-path truck platooning problem. Transp. Res. Part B: Methodol. 2018, 109, 26–39. [Google Scholar] [CrossRef]
  30. Tsugawa, S.; Jeschke, S.; Shladovers, S.E. A review of truck platooning projects for energy savings. IEEE Trans. Intell. Veh. 2016, 1, 68–77. [Google Scholar] [CrossRef]
  31. Khakdaman, M.; Rezaei, J.; Tavasszy, L.A. Shippers’ willingness to delegate modal control in freight transportation. Transp. Res. Part E Logist. Transp. Rev. 2020, 141, 102027. [Google Scholar] [CrossRef]
  32. Mesa-Arango, R.; Ukkusuri, S.V. Attributes driving the selection of trucking services and the quantification of the shipper’s willingness to pay. Transp. Res. Part E Logist. Transp. Rev. 2014, 71, 142–158. [Google Scholar] [CrossRef]
  33. Naumov, V. Substantiating the logistics chain structure while servicing the flow of requests for road transport deliveries. Sustainability 2020, 12, 1635. [Google Scholar] [CrossRef] [Green Version]
  34. Ramazan, B.; Bitileuova, Z.; Musalieva, R.; Naumov, V.; Taran, I. Choosing the logistics chain structure for deliveries of bulk loads: Case study of the Kazakhstan Republic. Nauk. Visnyk Natsionalnoho Hirnychoho Universytetu 2021, 2021, 142–147. [Google Scholar] [CrossRef]
  35. Zhang, M.; Janic, M.; Tavasszy, L.A. A freight transport optimization model for integrated network, service, and policy design. Transp. Res. Part E: Logist. Transp. Rev. 2015, 77, 61–76. [Google Scholar] [CrossRef]
  36. Yamada, T.; Imai, K.; Nakamura, T.; Taniguchi, E. A supply chain-transport supernetwork equilibrium model with the behaviour of freight carriers. Transp. Res. Part E Logist. Transp. Rev. 2011, 47, 887–907. [Google Scholar] [CrossRef]
  37. Shintani, K.; Konings, R.; Imai, A. The impact of foldable containers on container fleet management costs in hinterland transport. Transp. Res. Part E: Logist. Transp. Rev. 2010, 46, 750–763. [Google Scholar] [CrossRef]
  38. Yamada, T.; Febri, Z. Freight transport network design using particle swarm optimisation in supply chain-transport supernetwork equilibrium. Transp. Res. Part E: Logist. Transp. Rev. 2015, 75, 164–187. [Google Scholar] [CrossRef]
  39. Dullaert, W.; Zamparini, L. The impact of lead time reliability in freight transport: A logistics assessment of transport economics findings. Transp. Res. Part E: Logist. Transp. Rev. 2013, 49, 190–200. [Google Scholar] [CrossRef]
  40. Burkovskis, R. Efficiency of freight forwarder’s participation in the process of transportation. Transport 2008, 23, 208–213. [Google Scholar] [CrossRef]
  41. Wisner, J.D.; Tan, K.C. Supply chain management and its impact on purchasing. J. Supply Chain Manag. 2000, 36, 33–42. [Google Scholar] [CrossRef]
  42. Nugymanova, G.; Nurgaliyeva, M.; Zhanbirov, Z.H.; Naumo, V.; Taran, I. Choosing a servicing company’s strategy while interacting with freight owners at the road transport market. Nauk. Visnyk Natsionalnoho Hirnychoho Universytetu 2021, 2021, 204–210. [Google Scholar] [CrossRef]
  43. Naumov, V. Evaluation of freight forwarder risk to transportation market entry. East. -Eur. J. Enterp. Technol. 2015, 4, 28–31. [Google Scholar] [CrossRef] [Green Version]
  44. Knuth, D.E. A generalization of Dijkstra’s algorithm. Inf. Processing Lett. 1977, 6, 1–5. [Google Scholar] [CrossRef]
  45. Core Library for Simulations of Delivery Chains. Available online: https://github.com/naumovvs/delivery-chain-simulation/tree/master (accessed on 1 April 2022).
Figure 1. The loop of the process of shaping the technology of long-distance delivery of packaged cargo by road transport.
Sustainability 14 07283 g001
Figure 2. Graphs for shaping the complete sets of alternative TTSD for LSC1 (a), LSC2 (b), LSC3 (c).
Sustainability 14 07283 g002
Figure 3. A graph for shaping the complete set of alternative TTSDs for LSC4 (with the marked examples of the optimal schemes).
Sustainability 14 07283 g003
Figure 4. The algorithm for creating chains of the minimum length for justifying the optimal TTSD.
Sustainability 14 07283 g004
Figure 5. The example of the optimal TTSD obtained as the result of simulations for provided parameters of a request for delivery.
Sustainability 14 07283 g005
Figure 6. Dependences of the total costs on the consignment weight.
Sustainability 14 07283 g006
Table 1. A fragment of the matrix representing the full factorial experiment.
Series of the ExperimentLevel of Input Factor
Q L I O C R P t P c P r P l u P t r P c p
1+1+1+1+1+1+1+1+1+1+1
2+1+1+1+1+1+1+1+1+1–1
2047–1–1–1–1–1–1–1–1–1+1
2048–1–1–1–1–1–1–1–1–1–1
Table 2. Bounds of input factors considered in the experiment.
Bounds of Input ParametersInput Factors
Q L I O C R P t P c P r P l u P t r P c p
–10.001500.21111111
+130150012.24222222
Table 3. The results of determining the areas of the most effective use of the TTSD structures and the corresponding synergistic effects.
LSC TypeConsignment Weight [tons]Synergistic Effect [UAH/Request]
0.00151015202530
LSC11-1981-1941-1941-1941-1941-1941-19420,097
LSC22-3682-3682-2582-2582-2582-2582-2586005
LSC33-0223-2583-3863-3863-3863-3863-38623,341
LSC44-0144-3864-2584-2584-2584-2584-25832,114
Table 4. The share of synergistic effect for types of entities participating in the delivery process.
Type of ParticipantsLSC Structure
LSC1LSC2LSC3LSC4
Freight owners0.8850.820.7950.778
Freight forwarders0.0040.0060.006
Carriers0.1150.1760.0820.097
Terminals0.1170.119
Publisher’s Note: MDPI stays neutral with regard to jurisdictional claims in published maps and institutional affiliations.

