Article

Interpolated Stand Properties of Urban Forest Parks Account for Posted Facial Expressions of Visitors

1
Guangdong Academy of Forestry, Guangdong Provincial Key Laboratory of Silviculture, Protection and Utilization, Guangzhou 510520, China
2
Guangzhou Tanhui Forestry Co., Ltd., Guangzhou 510520, China
*
Author to whom correspondence should be addressed.
Sustainability 2022, 14(7), 3817; https://doi.org/10.3390/su14073817
Submission received: 21 February 2022 / Revised: 20 March 2022 / Accepted: 21 March 2022 / Published: 24 March 2022
(This article belongs to the Special Issue Urban Forests and Sustainable Urban Residents’ Well-Being)

Abstract

:
Posted facial expressions on social networks have been used as a gauge to assess the emotional perceptions of urban forest visitors. This approach may be limited by the randomness of visitor numbers and park locations, which may not be accounted for by the range of data in local tree inventories. Spatial interpolation can be used to predict stand characteristics and detect their relationship with posted facial expressions. Shaoguan was used as the study area where a tree inventory was used to extract data from 74 forest stands (each sized 30 m × 20 m), in which the range was increased by interpolating the stand characteristics of another 12 urban forest parks. Visitors smiled more in parks in regions with a high population or a large built-up area, where trees had strong trunks and dense canopies. People who displayed sad faces were more likely to visit parks located in regions of hilly mountains or farmlands, where soils had a greater total nitrogen concentration and organic matter. Our study illustrates a successful case in using data from a local tree inventory to predict stand characteristics of forest parks that attracted frequent visits.

1. Introduction

Our world is in an era with high-speed urbanization. The urban lifestyle involves experiencing frequent social interactions and city environments. They both contribute to mental stress, which also damages mental health [1]. Nature helps to relieve mental stress according to attention restoration theory (ART) [2]. Stress recovery theory (SRT) asserts that touching nature can accelerate recovery from stressful lives [3]. Therefore, urban forests can provide a nature-based solution (NBS) to improve mental health and well-being for their visitors [4,5]. The COVID-19 pandemic has drawn attention to the use of urban forests as an NBS to cope with the decline in mental well-being [6,7]. It is important to establish the stand characteristics of urban forests that contribute to promoting mental well-being.
The mental well-being of people exposed to urban forests is mainly quantified through surveys [8,9] or questionnaires [10,11]. These types of investigations have been queried due to a lack of validation [12]. Either the sensitivity or specificity of self-reported results can experience a possible bias in practice [13]. Real-time facial expressions were suggested as an alternative strategy for evaluating the emotional statuses of urban forest visitors [14,15,16]. This theory is based on the fact that facial expressions are reliably associated with emotional status [17]. The sources of facial expressions are either spontaneous or posted emotions [18]. Spontaneous facial expressions were usually used to assess the emotional perception of people experiencing urban forests in pilot studies [15,16,19].
Expressional scores describe emotional status in an unbiased manner, because subjects are not conscious that they are being photographed. However, people also post facial photos and upload them to the Internet to share their real-time sentiments during their interaction with nature [14]. Posted facial expressions are obtained from subjects that are conscious that they are being photographed, but have merit in being able to be sourced from online big data [20]. Taking China as an example, posted facial expressions have been collected from social networks to quantify the sentiments of people in urban forests of cities in northern [21,22], northeastern [14,23], and eastern parts [24], as well as at the national scale [25]. Actions of the facial muscles to form posted facial expressions can activate a sense of happiness, with a psychological influence on the recognition of positive emotions [26]. Therefore, posted facial expressions can be taken as a reliable instrument for evaluating the sentiments of urban forest visitors in a broader context.
When people are about to smile in an urban forest, their decisions to present facial expressions are determined by the perceptions of both internal attributes and external settings. The intention to make a facial expression is a result of decisions shaped by joint determinations of human evolution and socio-demography (gender, group membership, age, mood, religion, etc.) [19,27]. An expressed smile may also result from the perceptions of the surrounding settings. For example, minimum daily temperature has a positive relationship with smiling [24]. Average temperature plus wind velocity can also be perceived by forest visitors, and are potentially joint drivers for posting smiles [22]. In addition, forest landscape metrics can also be perceived by people and promote posting positive emotions [8,14,21,23,25]. People also prefer a view with stately and sizable trees [28,29]. These perceived drivers are synthetically associated with forest stand characteristics [27,30,31,32], which may be drivers of the sense of well-being [30,31,33]. Microclimates are determined by the conditions at the understory layer that can also be perceived by visitors [34,35,36,37]. Soil properties have close associations with forest structure metrics [38,39], especially heavy metals that have a strong effect on forest tree growth [40,41]. However, to our knowledge, there is insufficient evidence about the direct association between urban forest stand properties and posted facial expressions.
Results regarding the mental well-being of urban forest visitors rely on observations of recorded facial expressions. However, the frequency with which visitors post their facial photos to social media is random. For example, the Expo Garden is a famous urban forest environment in Shenyang city, which was reported to have attracted 30 visitors during National Day of China in 2017 [14], but it attracted over 700 visitors per day over a random late June weekend in 2020 [27]. This randomness is an obstacle for choosing urban parks as sites for this study. There is also a risk of failure if the chosen park does not attract the expected number of visitors in a given time. In addition, current technology is unable to fully predict the number of visitors in a park, and no one can predict this number with full confidence either. Perhaps this is the reason why few studies have detected the driving forces of forest stand characteristics that impact the emotional perceptions of visitors.
A tree inventory system is a decision-making tool for policy makers and planners of urban forests [42]. Information from a tree inventory can be used to depict a time-dependent state of change for urban forests, and to implement and refine the management methodology [43,44,45]. Both forest structure and soil characteristics are included in urban tree inventory systems [42]. Currently, using the tree inventory as a guide to construct sustainable forests in urban ecosystems, which can supply services to adjust microclimates and promote human well-being, has been suggested [46,47]. However, forest stands where tree inventory data were collected may cover a geographical range with locations that lack urban forest visitors due to high randomness in visitation. To our knowledge, the tree inventory has rarely been used in studies detecting the mental perceptions of visitors, and the issue of a lack of visitors has not really been resolved.
Shaoguan is a typical city experiencing fast urbanization with rich natural forest resources in South China [48,49]. Fast economic development and heavy mining led to deposits of heavy metals in soils, which remain at a high level even after revegetation [49,50,51]. This may heavily impact the development of local forest ecosystem and be perceived by people experiencing the forest structure. There is a large population visiting local urban forest parks in Shaoguan; hence, there is a proposal to plan and design local parks according to environmental psychology [52]. In this study, we employed a novel approach to use local tree inventory data as predictors of objective urban forest stand characteristics. We mapped the spatial distributions of local forest stand characteristics using inventory data in a geographical range with urban forest parks that attracted a large number of visitors. Thereafter, we objectively targeted parks that reported the highest number of visitors and collected facial photos therein from online social networks. Using the geographical information of these parks, we predicted their stand characteristics using spatial interpolations. Therefore, we can obtain predicted information about stand attributes in parks with few visitors, bridge their relationships with posted facial expressions and detect the most important parameters that may contribute to the presentation of positive emotions. We hypothesized that: (i) urban forests with large canopies and strong trunks promote posting smiles. In addition, (ii) this type of forest is established on stands with high nutritional quality but low heavy metal accumulation.

2. Materials and Methods

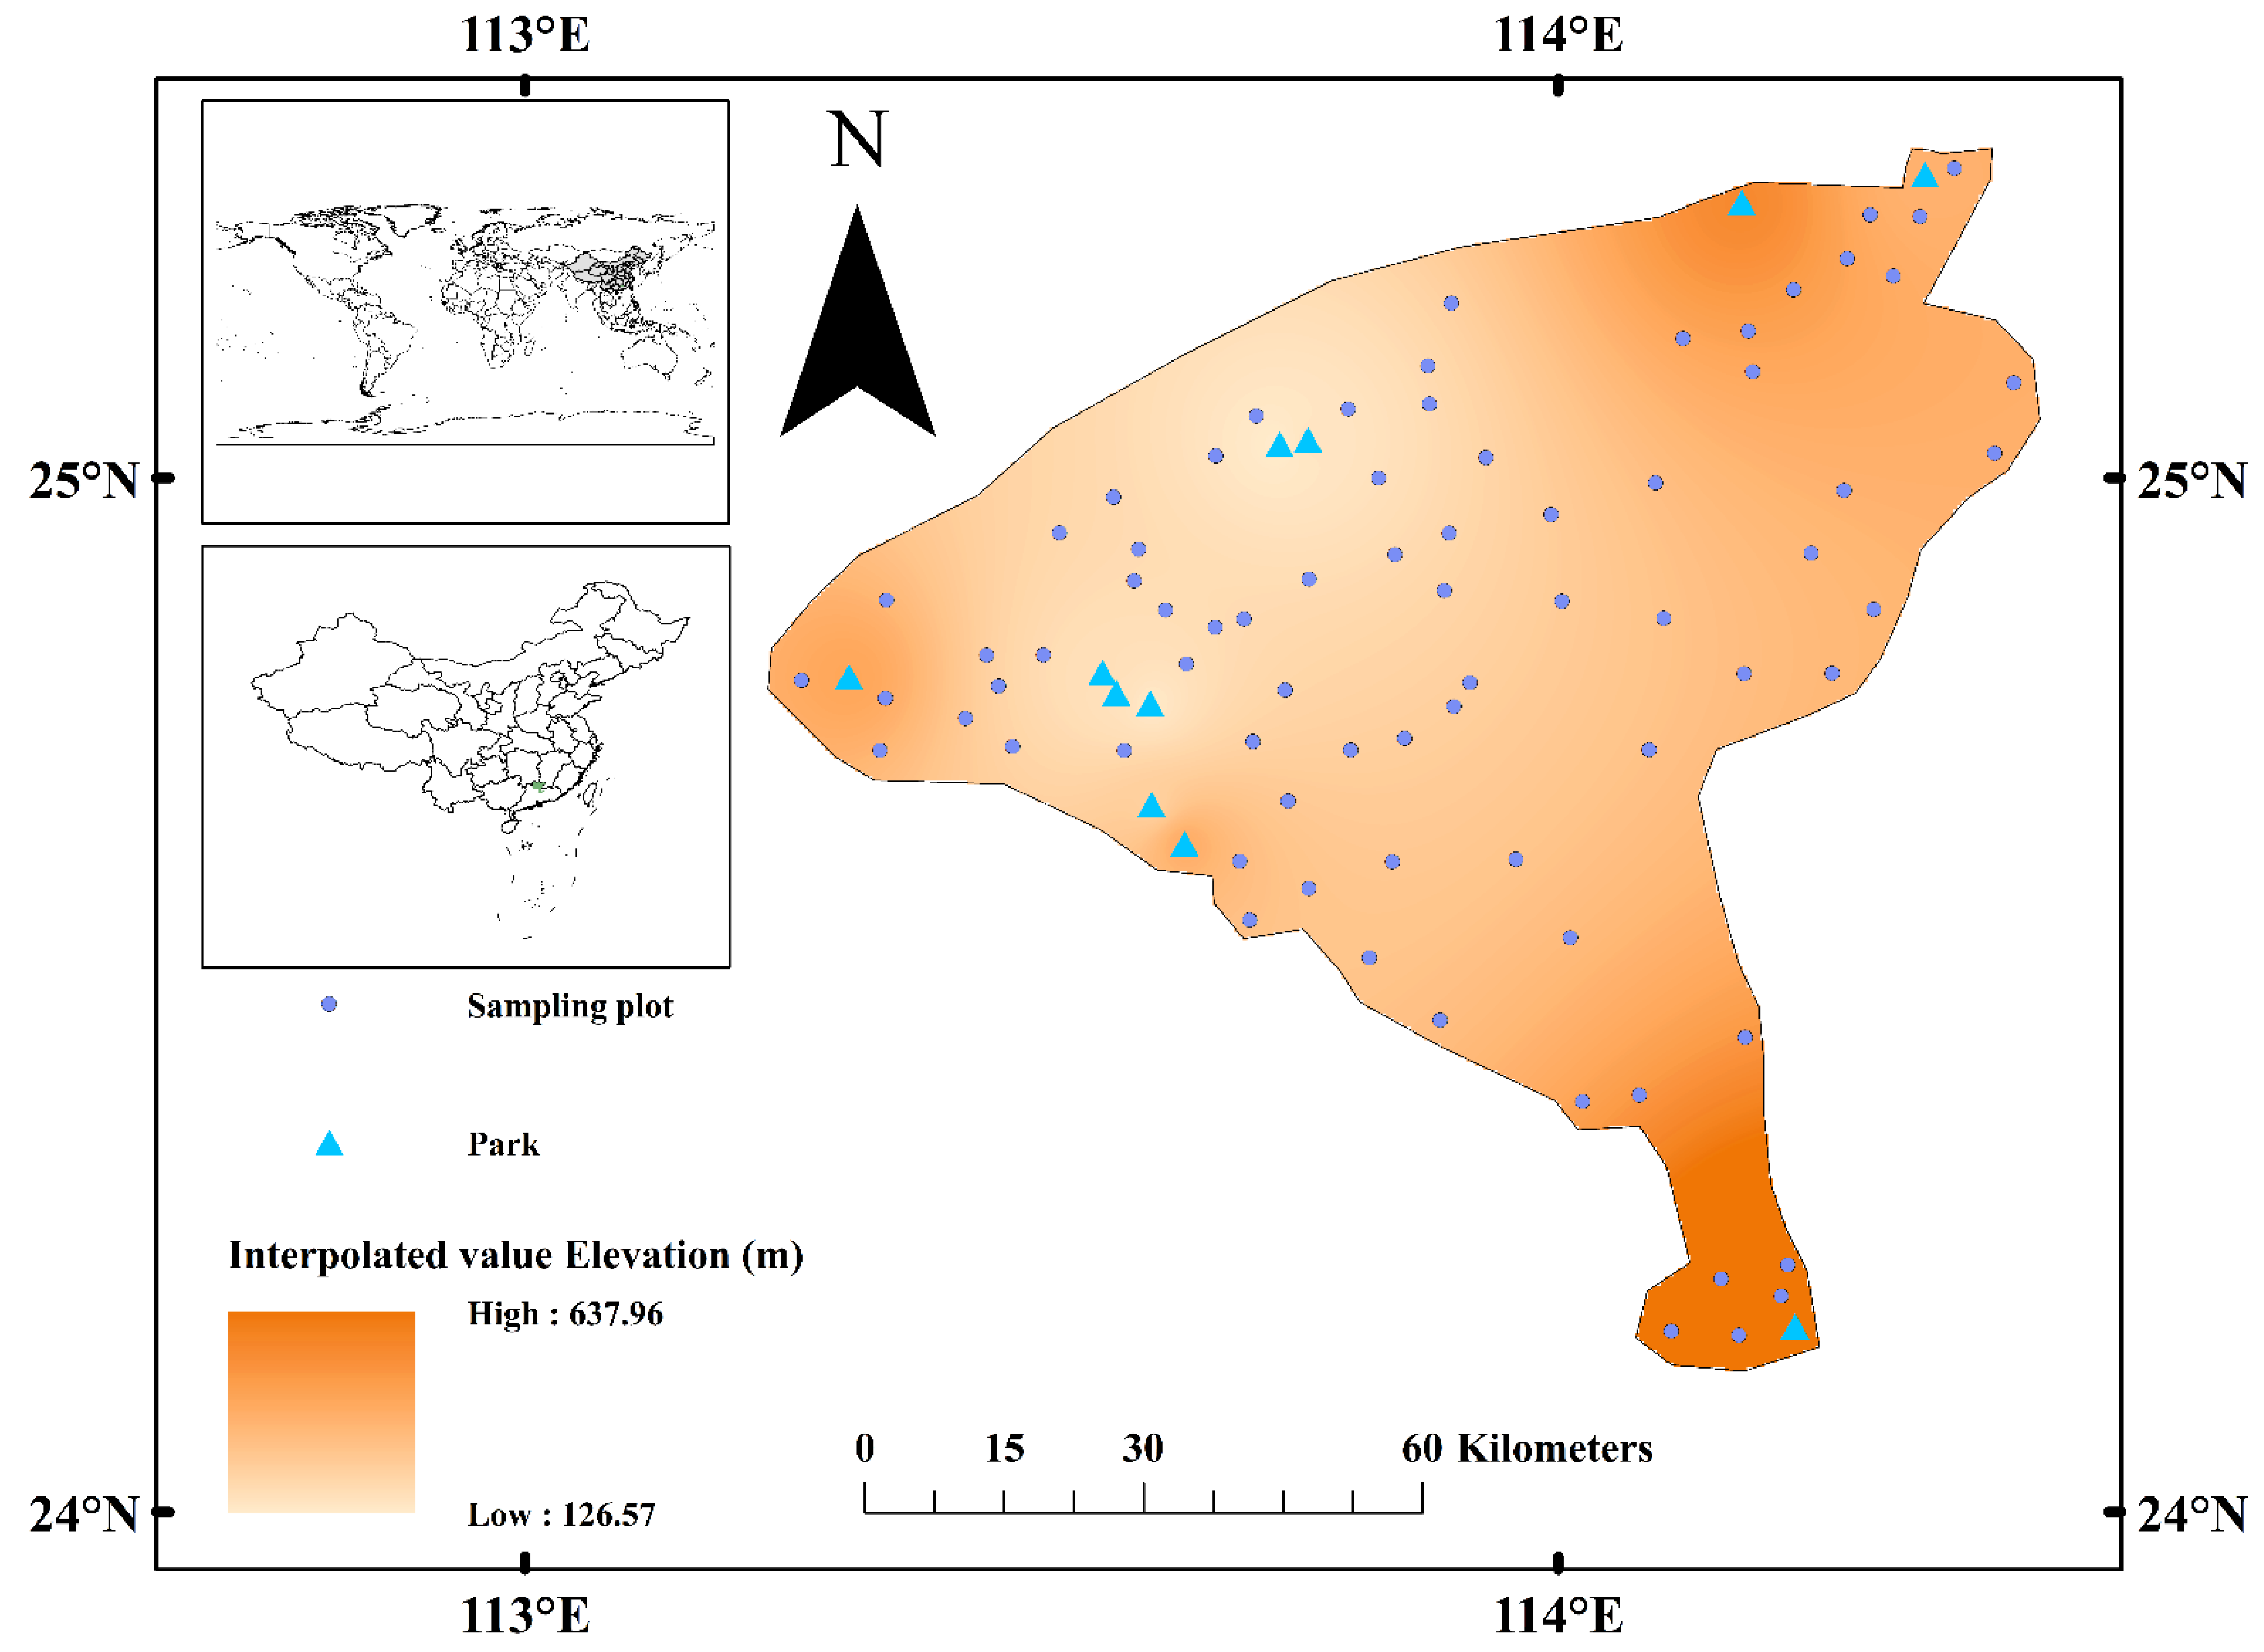
2.1. Study Area and Tree Inventory

Shaoguan is a prefecture-level city in the northern part of Guangdong, China. It is located in the administrative range of 23°53′–25°31′ N and 112°53′–114°45′ E (Figure 1). The total land area is 1.84 × 10⁴ km2, with a fully urbanized land area of 3468 km2 [53]. The local average annual temperature is 21 °C, and the average rainfall is 1700 mm. The annual period of frost-free days is 310 d. The total area of forested land is 1.45 × 10⁶ ha, with an average greening coverage of 74.4%. In 2020, the regional gross domestic product (GDP) was 135.35 billion yuan (exchange rate of 6.9 per US dollar) [54]. The per capita GDP was 5.1 × 10⁴ yuan, and the annual income from public budgets was 10.5 billion yuan. Shaoguan is a typical industrial city with major industries in steelworking, mining, metallurgy, and manufacturing. Therefore, Shaoguan urbanized from agricultural land and forests to a built-up surface with heavy metal contamination [49,50,51,55].
A tree inventory was established in 2021 to build records of the forest structure (average tree height, diameter at breast height (DBH), canopy density (CD)), stand chemical properties (concentrations of total nitrogen (TN), phosphorus (TP), and potassium (TK), soil organic carbon (SOC) content, and pH value), and soil heavy metal concentrations (arsenic [As], chromium [Cr], mercury [Hg], and lead [Pb]). Our inventory data were derived from the bigger, provincial-scale dataset of Guangdong in 2021. Plots at a size of 600 m2 (30 m × 20 m) were investigated for tree shape and soil properties. The altitude ranged from 80 to 1050 m across landforms of low and medium hills. The soil texture of forest stands included light loam, sandy loam, and loam.
A total of 74 forest stands (each at a size of 30 m × 20 m) across 9 regions that were municipally administrated as districts or counties of Shaoguan were investigated. These regions included Nanxiong (n = 11), Qujiang (n = 11), Renhua (n = 12), Ruyuan (n = 4), Shixing (n = 13), Wujiang (n = 5), Wengyuan (n = 5), Xinfeng (n = 5), and Zhenjiang (n = 8). All stands were set in major forest ecosystems of secondary natural forests of mixed hardwood, evergreen conifers, and plantations, such as Masson pine (Pinus massoniana), Slash pine (Pinus elliottii), and eucalyptus (Eucalyptus obliqua), etc [56]. The stand age was 7–15 years for plantations and over 40 years for secondary natural forests. Associated tree species mainly included Phyllostachys heterocycla (Carr.) Mitford cv. Pubescens, Schima superba Gardn. et Champ., Cunninghamia lanceolata Hook, Schefflera octophylla (Lour.) Harms., and Machilus nanmu (Oliver) Hemsley. The spatial distribution of these stands and their elevations can be seen in Figure 1. Socio-economic records of host counties or districts were obtained from the Statistics of Shaoguan City [57] in 2021.

2.2. Sampling and Analyses of Soil Chemical Properties

Soils were sampled from three repeated cores at the top layer of 0–20 cm. Each of the cores were 10 m apart from each other. Sampled soils were screened to remove rocks and organic residuals, placed in sampling bags and sent to the laboratory by the fastest transport method (Figure S1). Soils were air-dried at indoor temperature to a constant weight and used for chemical analysis. Dried soil samples (~100 g per core) were sieved through a 2 mm mesh and divided into three parts at a ratio of about 20% (part I), 10% (part II), and 70% (part III) (v/v/v).
Part I samples were dissolved in 50 mL of 0.01-M calcium chloride (CaCl2) at a ratio of 1.0:2.5 (w/w) [58]. Solutions were shaken for one hour and used for measuring pH values by means of a meter (3020 pH detector, Jenway Inc., Dunmow, UK).
Part II samples were used to determine the percent SOC content using the heating dichromate oxidation method [59].
Part III samples were used to determine soil TN, TP, TK and heavy metals. Soil TN was digested in sulfuric acid (H2SO4) and hydrogen peroxide (H2O2) and determined by means of the Kjeldahl method [60]. Soil TP and TK was determined with soil samples digested in combined perchloric acid and hydrofluoric acid (HF) and analyzed by the ammonium-molybdate colorimetric assay and atomic absorption spectrometry, respectively [58]. Soil heavy metals were determined using digestion with mixed nitric acid (HNO3), hydrochloric acid (HCl), HF, and H2O2. Soil Cr concentration was analyzed by the inductively coupled plasma atomic emission spectrometry (ICP-AES, Agilent-Branch, Beijing, China) [61]. Soil As, Hg, and Pb concentrations were analyzed using inductively coupled plasma mass spectrometry (ICP-MS, Agilent-Branch, Beijing, China) [62] according to the standard operational methodology [63].

2.3. Objective Urban Park Selection

Sina Weibo was employed as the social network service (SNS) platform to collect visit records at urban forest parks in Shaoguan [64]. Sina Weibo is a leading SNS platform for users to create, share, and discover content in China and global Chinese communities [65]. As of December 2020, there were a total of 521 million monthly active users (MAUs) and 225 million daily active users (DAUs). Approximately 94% of MAUs accessed Sina Weibo through mobile terminals (mostly cell phones). DAUs of Sina Weibo frequently reveal their behavior at locations, mostly scenic spots, with check-in records in open micro-twitters [66]. A park that can attract frequent visits was characterized as one that can collect at least 10 unique DAU check-in records [67]. Empirical studies further characterized a park that can attract frequent visits as one that can collect 20 DAUs [14,24]. In this study, we aimed to collect enough ‘useful’ photos with DAUs’ facial portraits to enable a reliable statistical analysis. Therefore, we defined a park with frequent visits as one attracting DAUs with at least 20 photos or selfies with posted facial expressions that fell within a range of limits [21,22,23]:
(i)
All facial organs (eyes, nose, mouth, etc.) were fully shown in the photo.
(ii)
Facial area was accepted as being digitally decorated only when limit (i) was not violated.
(iii)
Subjects had typical facial characteristics of East Asia residents.
The focus on East Asia races was required due to the consideration of higher precision to recognize subtle expressions [27]. Across micro-twitter records in 2021, we screened all of the parks in Shaoguan and selected eleven that met the requirement of 20+ visitors (Table 1; Figure 1). A total of 438 photos of visitors were collected from 11 urban forest parks (Table 1). There were 329 female visitors and 109 males. The ages of visitors were obtained from users’ profiles or estimated from photos. Visitors can be divided into age groups of toddlers (one to five years old) (n = 35), adolescents (six to nineteen years old) (n = 6), young adults (twenty to twenty-five years old) (n = 257), middle-aged adults (thirty-five to fifty years old) (n = 123), and senior adults (over sixty years old) (n = 17). Ranges of ages were adapted from Zhang et al. [23].

2.4. Facial Recognition and Analysis

Obtained photos were cropped to leave one subject per picture, which was further rotated to make the nose axis perpendicular to the horizontal line. We employed FireFACE software (Muzhe Sci. & Tech. Sales Department, Changchun, China) as the instrument for facial recognition and analysis. Happy and sad emotions were focused on as objective expressions, because they reflect extreme effects with the highest validating accuracies [27]. A neutral emotion was also rated in this study, because it was defined as a calm state [68,69] that reflects an indifferent effect [68]. Neutral expression is one of the most frequently found emotions among urban forest visitors [14,19]. Because our faces present universal expressions containing multiple emotions [70], we calculated the net positive emotion using the positive response index (PRI) by subtracting the sad score from the happy score. The theory of using PRI as a meter of net emotion originated from the fact that our facial expressions are a compound of seven emotional expressions [71]. Those revealing positive emotions (e.g., happy) and, in contrast, negative emotions (e.g., sad, angry, scared) may coexist at the same time on a face. Therefore, the net emotional expression reflects the rest of the positive emotions when removing negative emotions from positive emotions. This parameter was frequently used as a sensitive predictor of the positive emotions of people, with subtle changes in emotion, exposed to green space [15,23,24].

2.5. Interpolation Prediction Using Inventory Data

According to Figure 1, none of our selected urban forest parks fell in or around stands that contributed to data collection for the tree inventory. Therefore, we used spatial interpolation to predict urban forest stand characteristics at the location of parks. In ArcGIS (v. 10.2), coordinates of selected park locations were inputted into the system and added to a new shape layer over interpolation. In the function bar of ‘Spatial Analysis Tools’, the instrument of ‘Extract Values to Points’ was used to extract values from the coordinates of parks on the “Input Point Features” layer by inputting pieces of raster. Data of the studied locations were exported from “Opened Attribute Table” to a local place in a ‘.txt’ file. The whole process was repeated for each of the parameters in the tree inventory until all selected parks obtained interpolated predictions.

2.6. Statistical Analysis

Our data were analyzed using SPSS software (v. 20.0, IBM, New York, NY, USA). First, data of all parameters in tree inventory were compared in one-way analysis of variance (ANOVA) to detect their differences among different districts/counties. When the locational effect was indicated to be significant (α = 0.05), results were compared and ranked by Duncan’s new multiple range test (Duncan test for abbreviation) at 0.05 level [72]. Pooled data of stand characteristics and forest structure were analyzed by principal component (PC) functions to detect the relationships of their eigenvalues with socio-economic parameters across districts/counties. Second, facial expression scores (neutral, happy, sad, and PRI) were also analyzed by one-way ANOVA to detect locational effects. Because our expression scores did not follow the normal distribution, raw data were ranked for ANOVA detection and results were calculated using data that were transformed back. This treatment had been used for studies on facial expressions of urban forest visitors [14,16,19]. Finally, Pearson correlation was used to detect relationships between pairs of parameters among groups of variables regarding posted facial expressions (neutral, happy, and sad emotions, and positive response index (PRI) score), forest structure (average tree height (TreeH), diameter at breast height (DBH), canopy density (CD)), soil properties (total N concentration (TN), total P concentration (TP), total K concentration (TK), organic carbon content (SOC), and pH value in soils), and heavy metal concentrations (As, Cr, Hg, Pb concentrations in soils). An arc-link diagram was used to depict all detected relationships.

3. Results

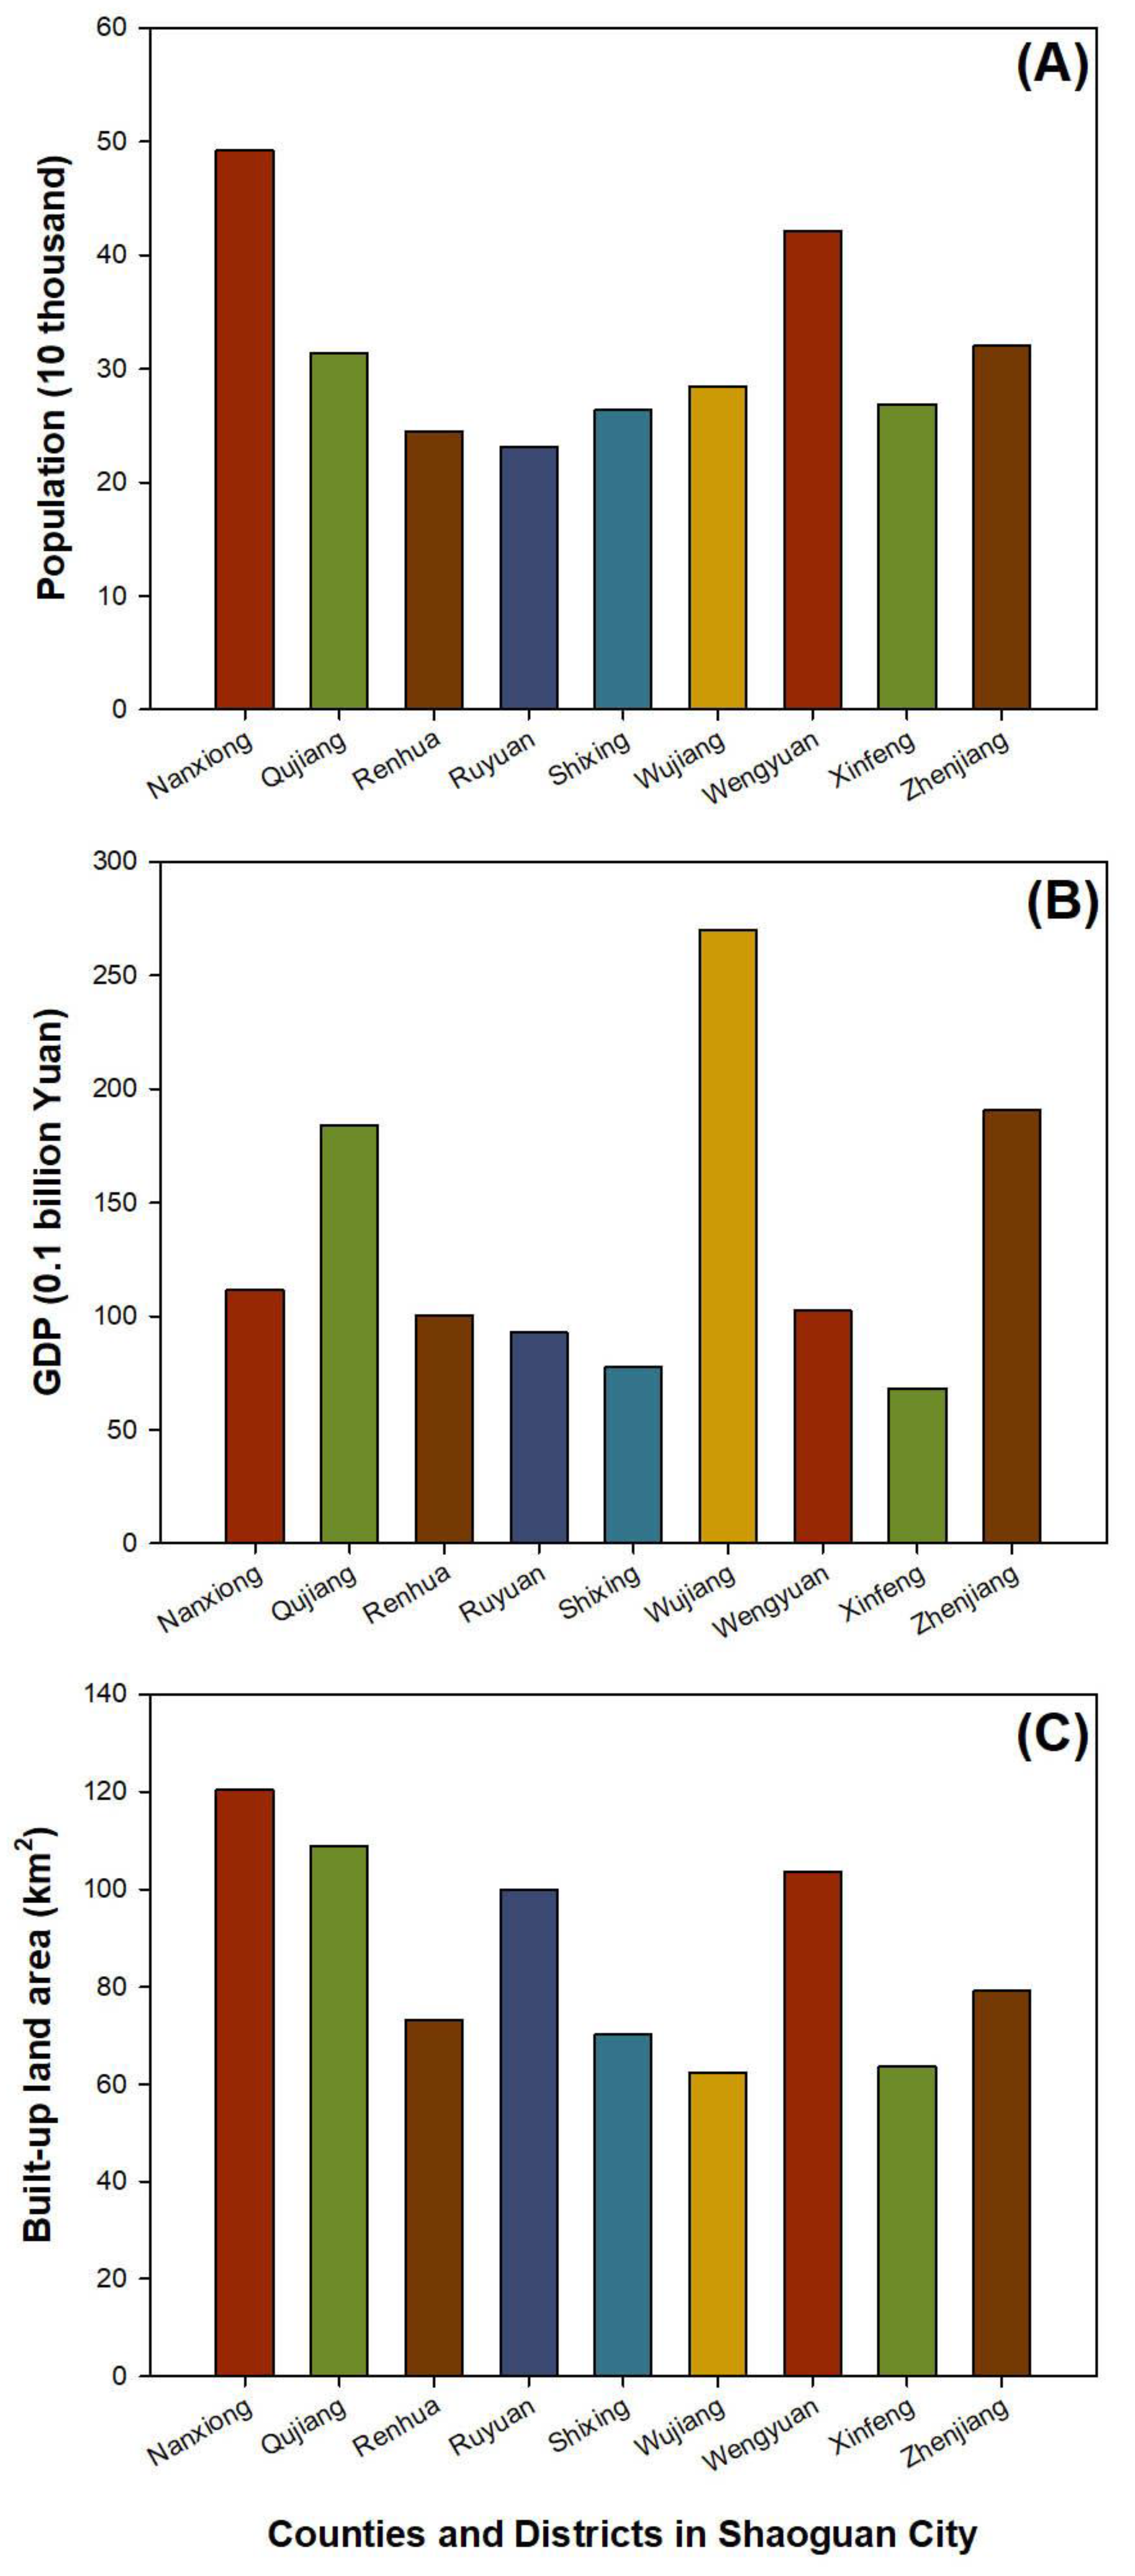
3.1. Socio-Economic States of Regions for Tree Inventory

Among all districts/counties, Nanxiong had the largest population (up to 49.24 × 10⁴), followed by Wengyuan (42.18 ×10⁴) (Figure 2A). Ruyuan had the smallest population of 92.74 × 10⁴.
Wujiang had the highest GDP of 26.98 billion yuan (Figure 2B). Qujiang and Zhenjiang had GDPs at a similar level of 18–20 billion yuan (18.43 and 19.07 billion yuan, respectively). Xinfeng had the lowest GDP, at only 6.83 billion yuan.
Nanxiong had the largest area of built-up land (120.38 km2), followed by Qujiang (108.75 km2) and Wengyuan (103.56 km2) (Figure 2C). Wujiang and Xinfeng had the lowest areas of built-up land, at 62.42 and 63.59 km2, respectively.

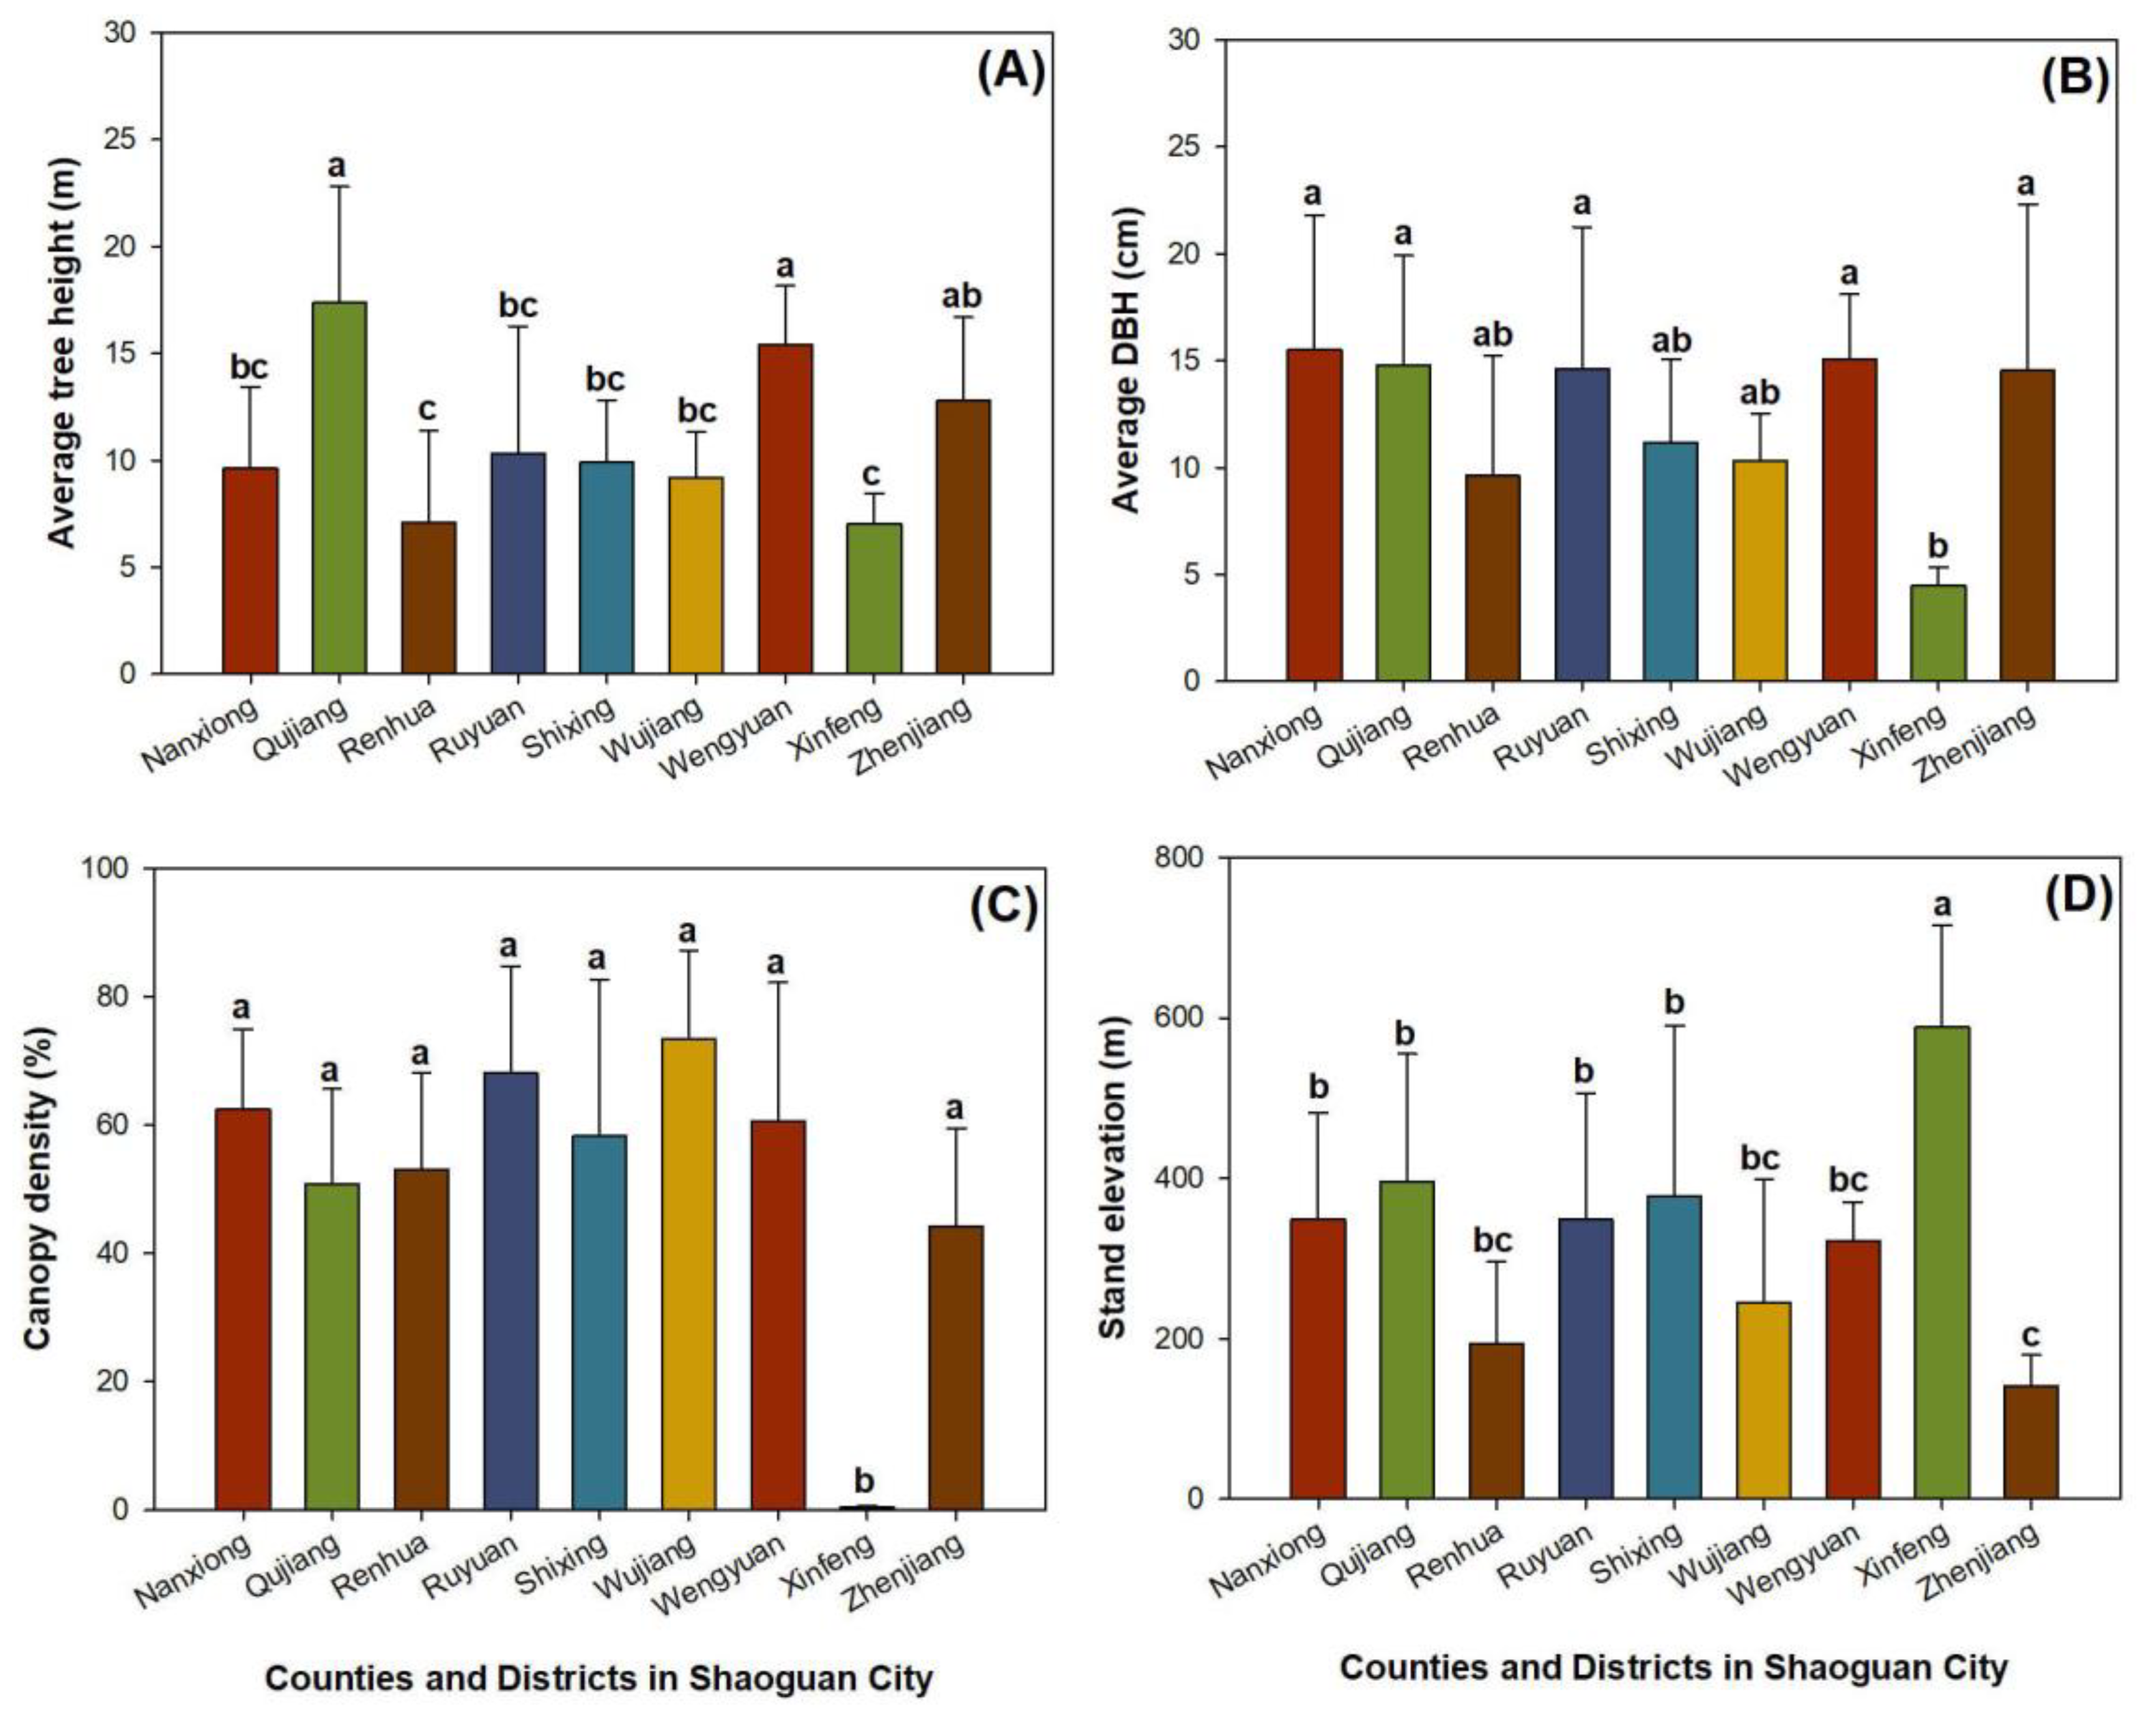
3.2. Forest Structure from Tree Inventory

Average tree height significantly varied among different districts/counties (Table 2). Forest average tree height was higher in Qiujiang and Wengyuan than that in most other regions, but their average tree height was not statistically different from that in Zhenjiang (Figure 3A). Compared to the average tree height in these regions, Renhua and Xinfeng had a lower average tree height.
DBH was significantly different among districts/counties (Table 2). Xinfeng had lower DBH than that in most other regions, except for Renhua, Shixing, and Wujiang (Figure 3B). The DBH of forest trees was not statistically different among Nanxiong, Qujiang, Ruyuan, Wengyuan, and Zhenjiang.
CD showed a significant variation among districts/counties, and was the lowest in Xinfeng (Figure 3C).
In contrast, Xinfeng had the highest elevation among all regions (Figure 3D). The elevation of forests in Nanxiong, Qujiang, Ruyuan, and Shixing was higher than that in Zhenjiang. In the study area, elevation was higher in forests located at the edges of the northern, western, and southern parts (Figure 1).

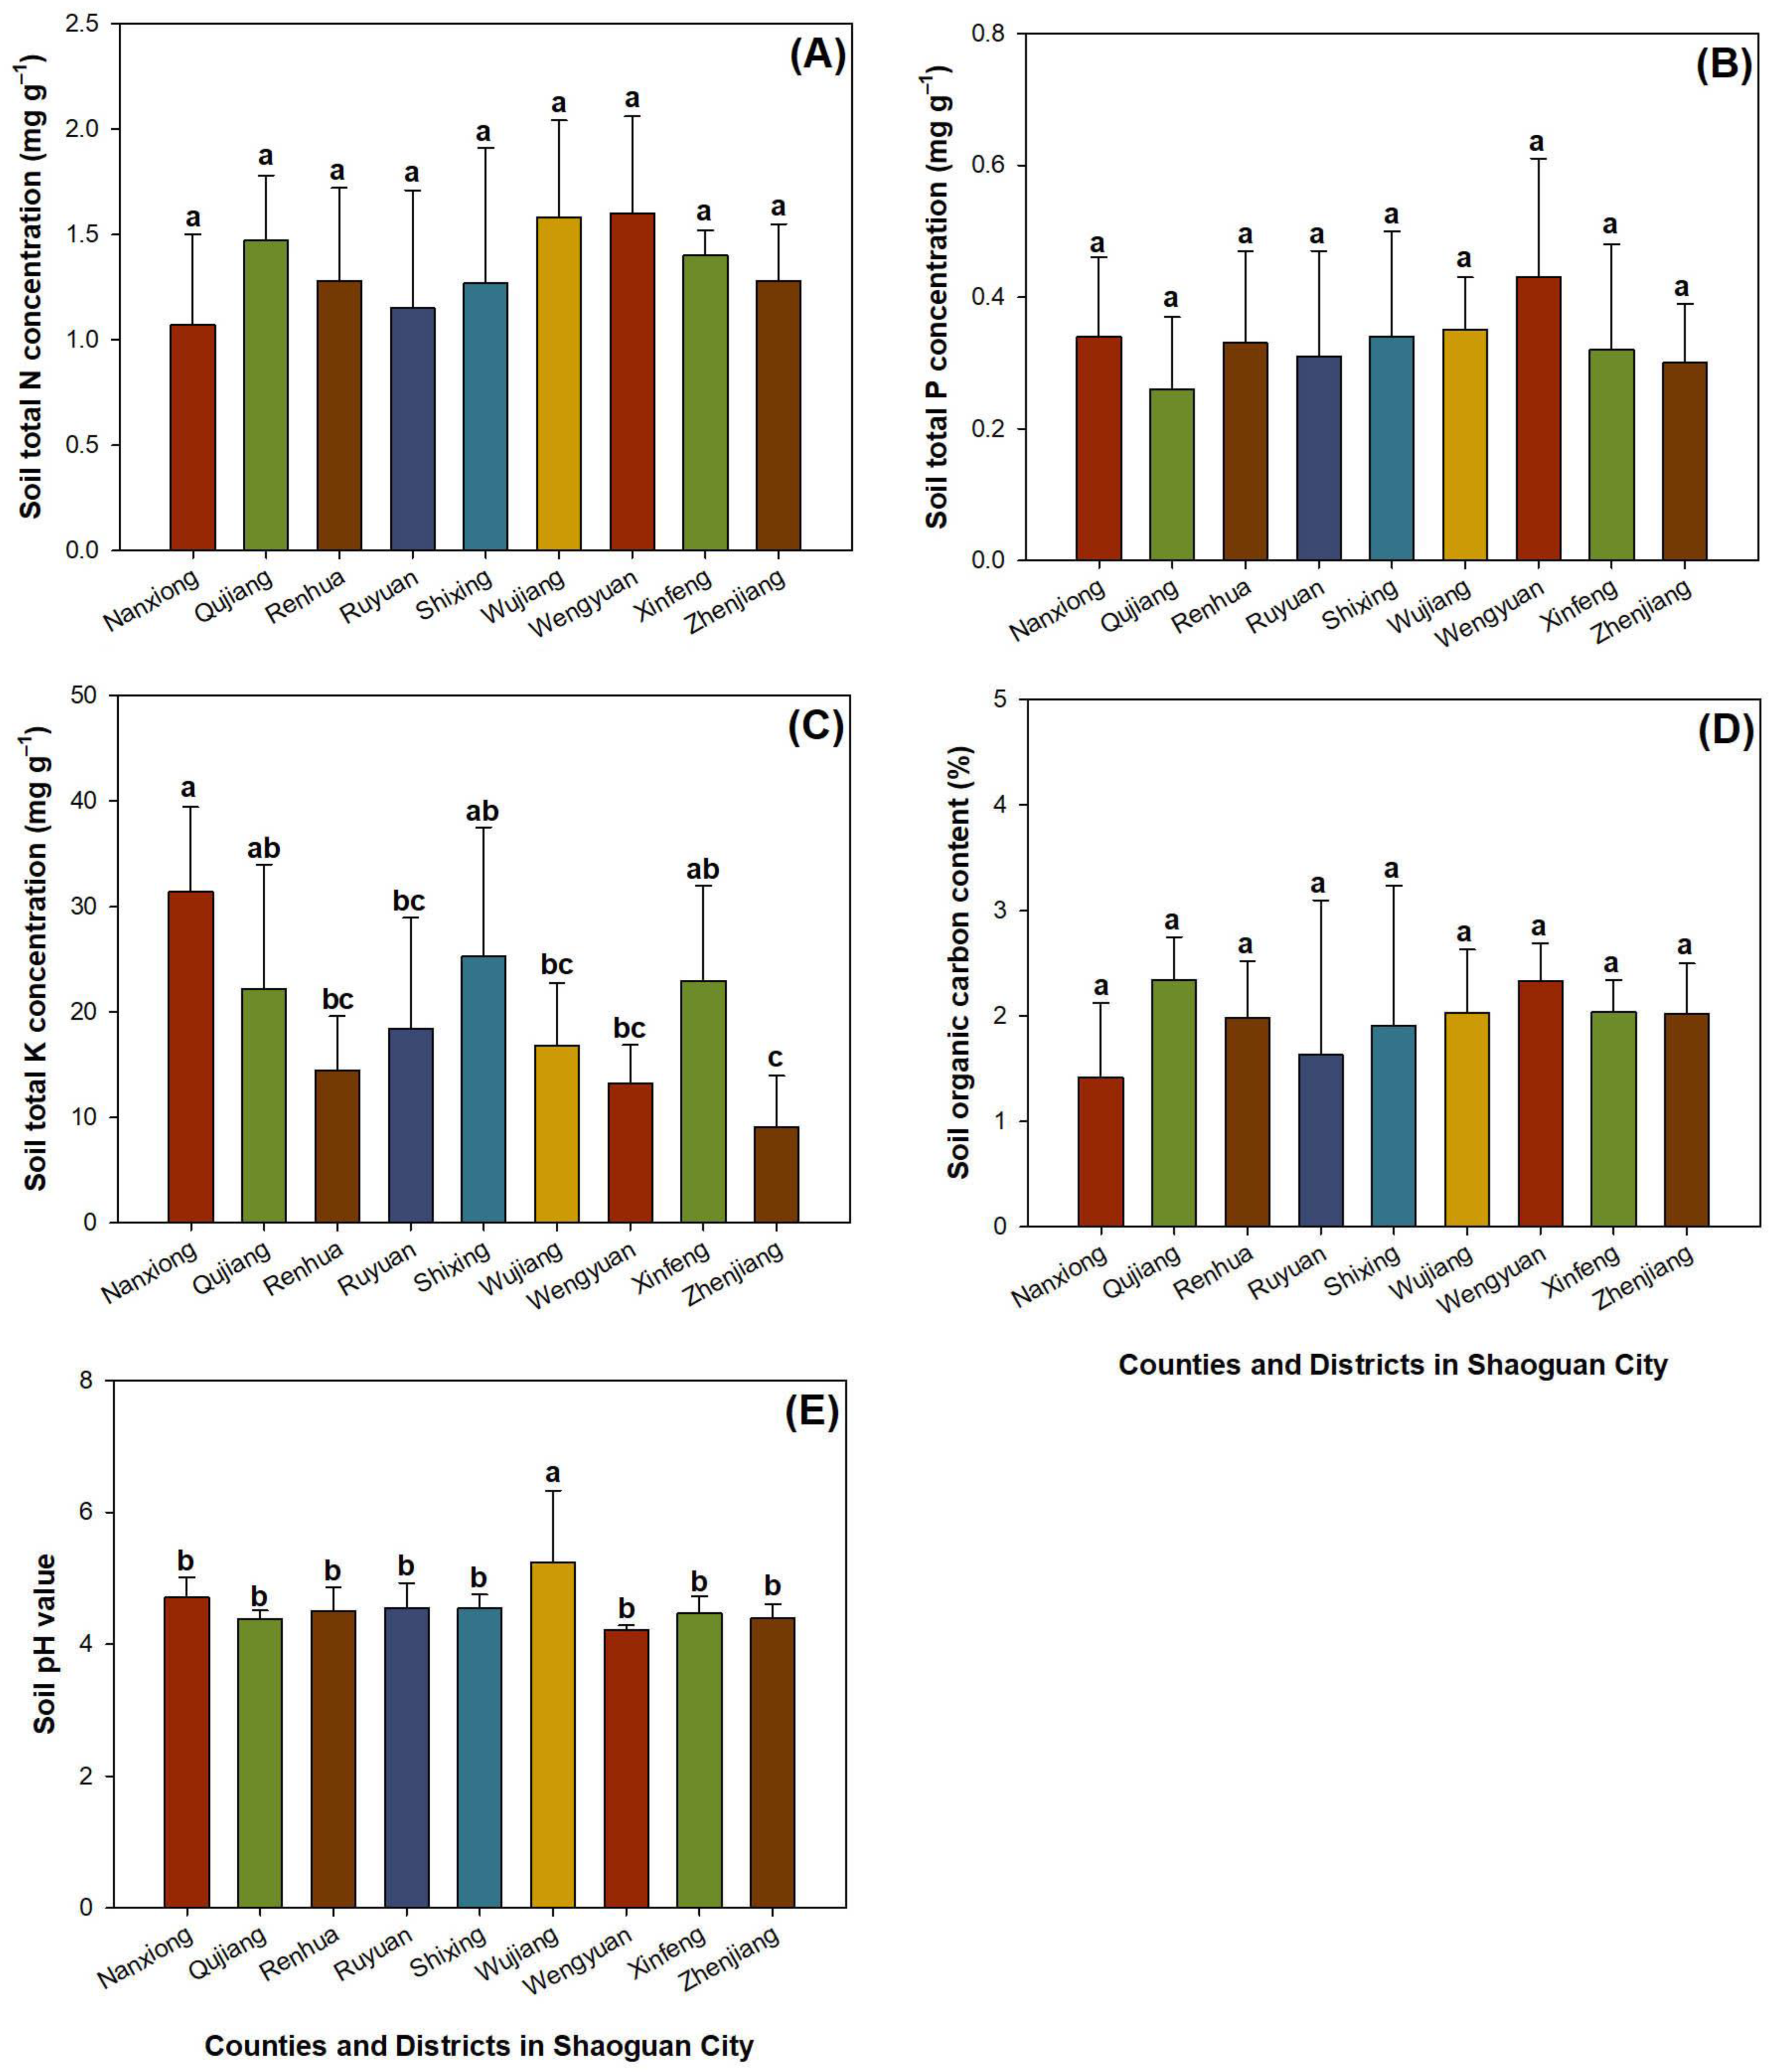
3.3. Chemical Properties of Forest Stand Soils from Tree Inventory

Soil TN concentration did not show any significant variation among districts/counties (Table 2). Field investigation revealed that the highest level of observed TN concentration was 1.60 ± 0.46 (mean ± standard error; the same below) mg g−1 in Wengyuan, while the lowest TN concentration was 1.07 ± 0.43 mg g−1 in Nanxiong (Figure 4A). The average soil TN concentration across all regions was 1.34 ± 0.17 mg g−1.
Soil TP concentration was not significantly different across districts/counties (Table 2). The observed TP concentration ranged from 0.26 ± 0.11 to 0.43 ± 0.18 mg g−1 in Qujiang and Wengyuan, respectively (Figure 4B). The average soil TP concentration across all regions was 0.33 ± 0.04 mg g−1.
Soil TK concentration varied among different locations (Table 2). TK concentration was higher in Nanxiong than in most regions, except for Qujiang, Shixing, and Xinfeng (Figure 4C). The soil TK concentration in all of these regions was much higher than that in Zhenjiang.
Again, SOC did not show significant difference among districts/counties (Table 2). The observed SOC ranged from 1.42 ± 0.70% to 2.34 ± 0.41% in Qujiang and Nanxiong, respectively (Figure 4D). The average SOC across all regions was 1.96 ± 0.28%.
Soil pH value was significantly different between all regions (Table 2). Soil pH was higher in Wujiang than that in other regions (Figure 4E).

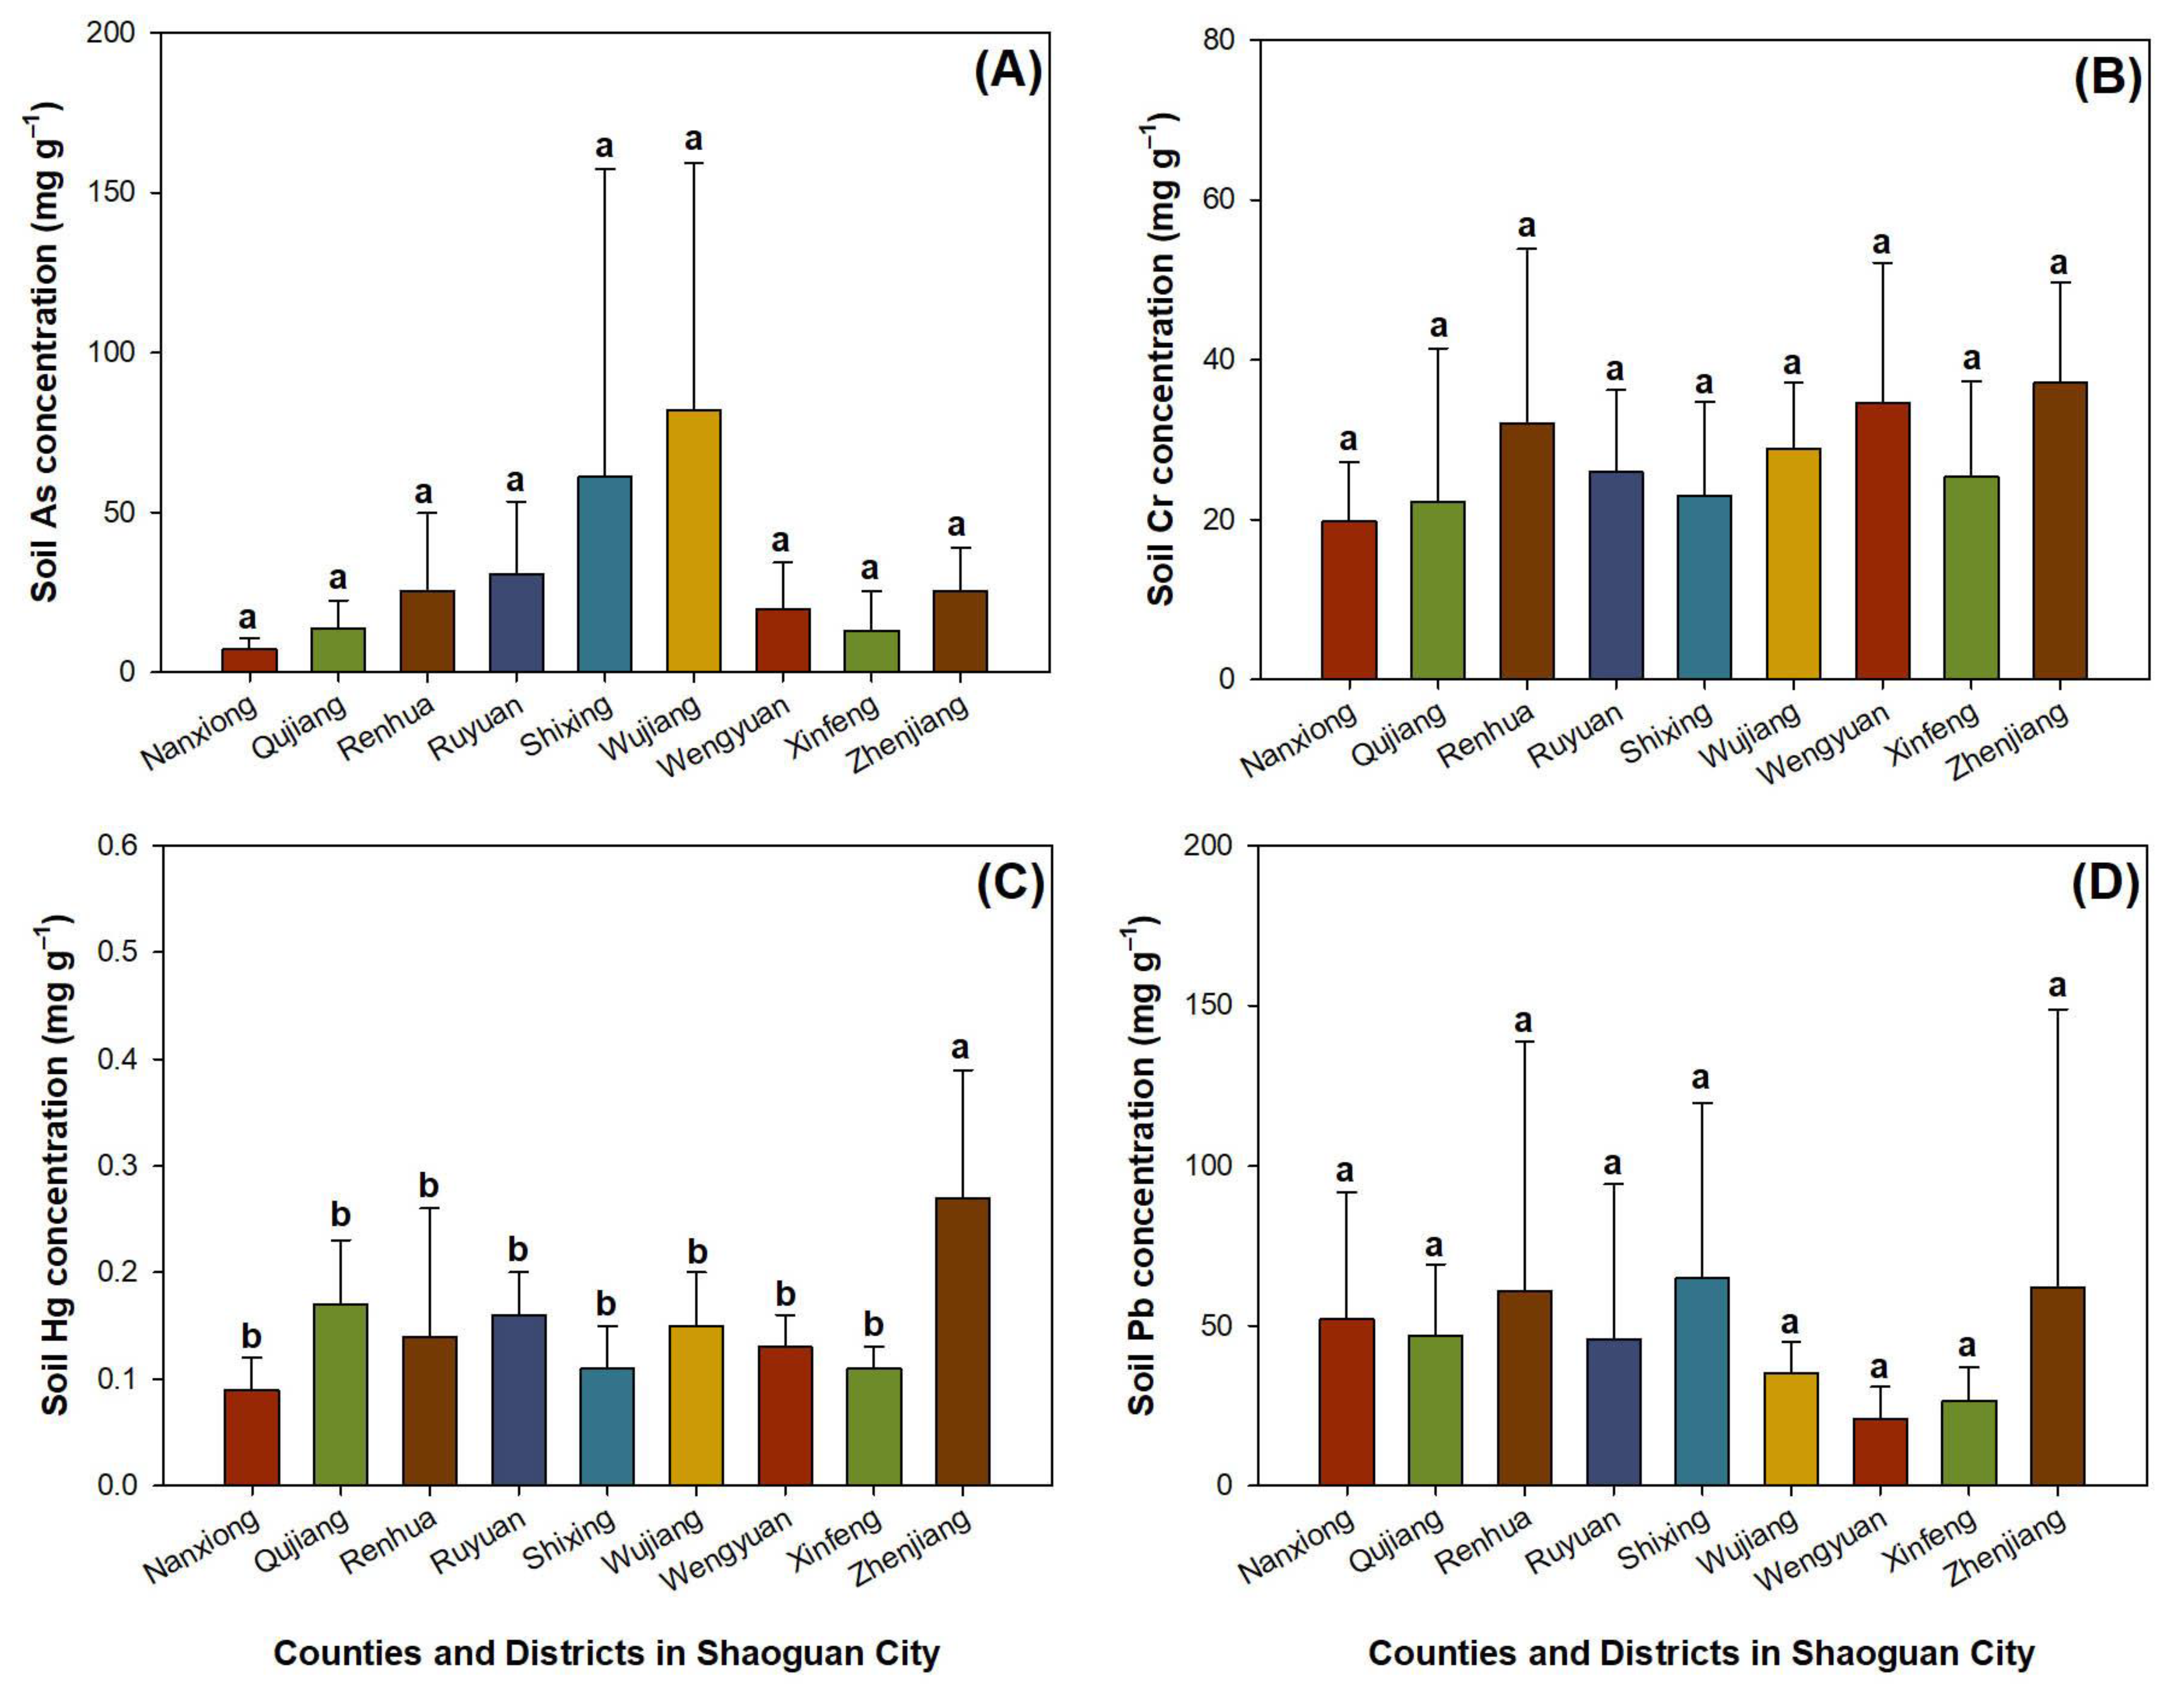
3.4. Heavy Metal Concentration in Forest Stand Soils from Tree Inventory

Soil As concentration did not vary among different regions (Table 2). The observed soil As concentration was 82.04 ± 77.29 and 7.26 ± 3.30 mg kg−1 in Wujiang and Nanxiong, respectively (Figure 5A). Generally, the average soil As concentration was 30.92 ± 23.30 mg kg−1 across all regions.
Again, soil Cr concentration did not vary between districts/counties (Table 2). According to recorded observations, the highest soil Cr concentration was 37.14 ± 12.56 mg kg−1 in Zhenjiang, while the lowest was 19.78 ± 7.41 mg kg−1 in Nanxiong (Figure 5B). The average level of soil Cr concentration across regions was 27.65 ± 5.58 mg kg−1.
Soil Hg concentration was significantly higher in Zhenjiang than in other counties/districts (Table 2; Figure 5C). The general level of soil Hg concentration across all regions, excluding Zhenjiang, was 0.13 ± 0.03 mg kg−1, which was 50.21% lower than that in Zhenjiang.
Soil Pb concentration did not vary among different regions (Table 2). The highest level of observed soil Pb concentration was 64.08 ± 54.93 mg kg−1 (in Shixing), and the lowest was 20.81 ± 10.03 mg kg−1 (in Wengyuan). The average soil Pb concentration was 46.12 ± 14.89 mg kg−1 across all regions.

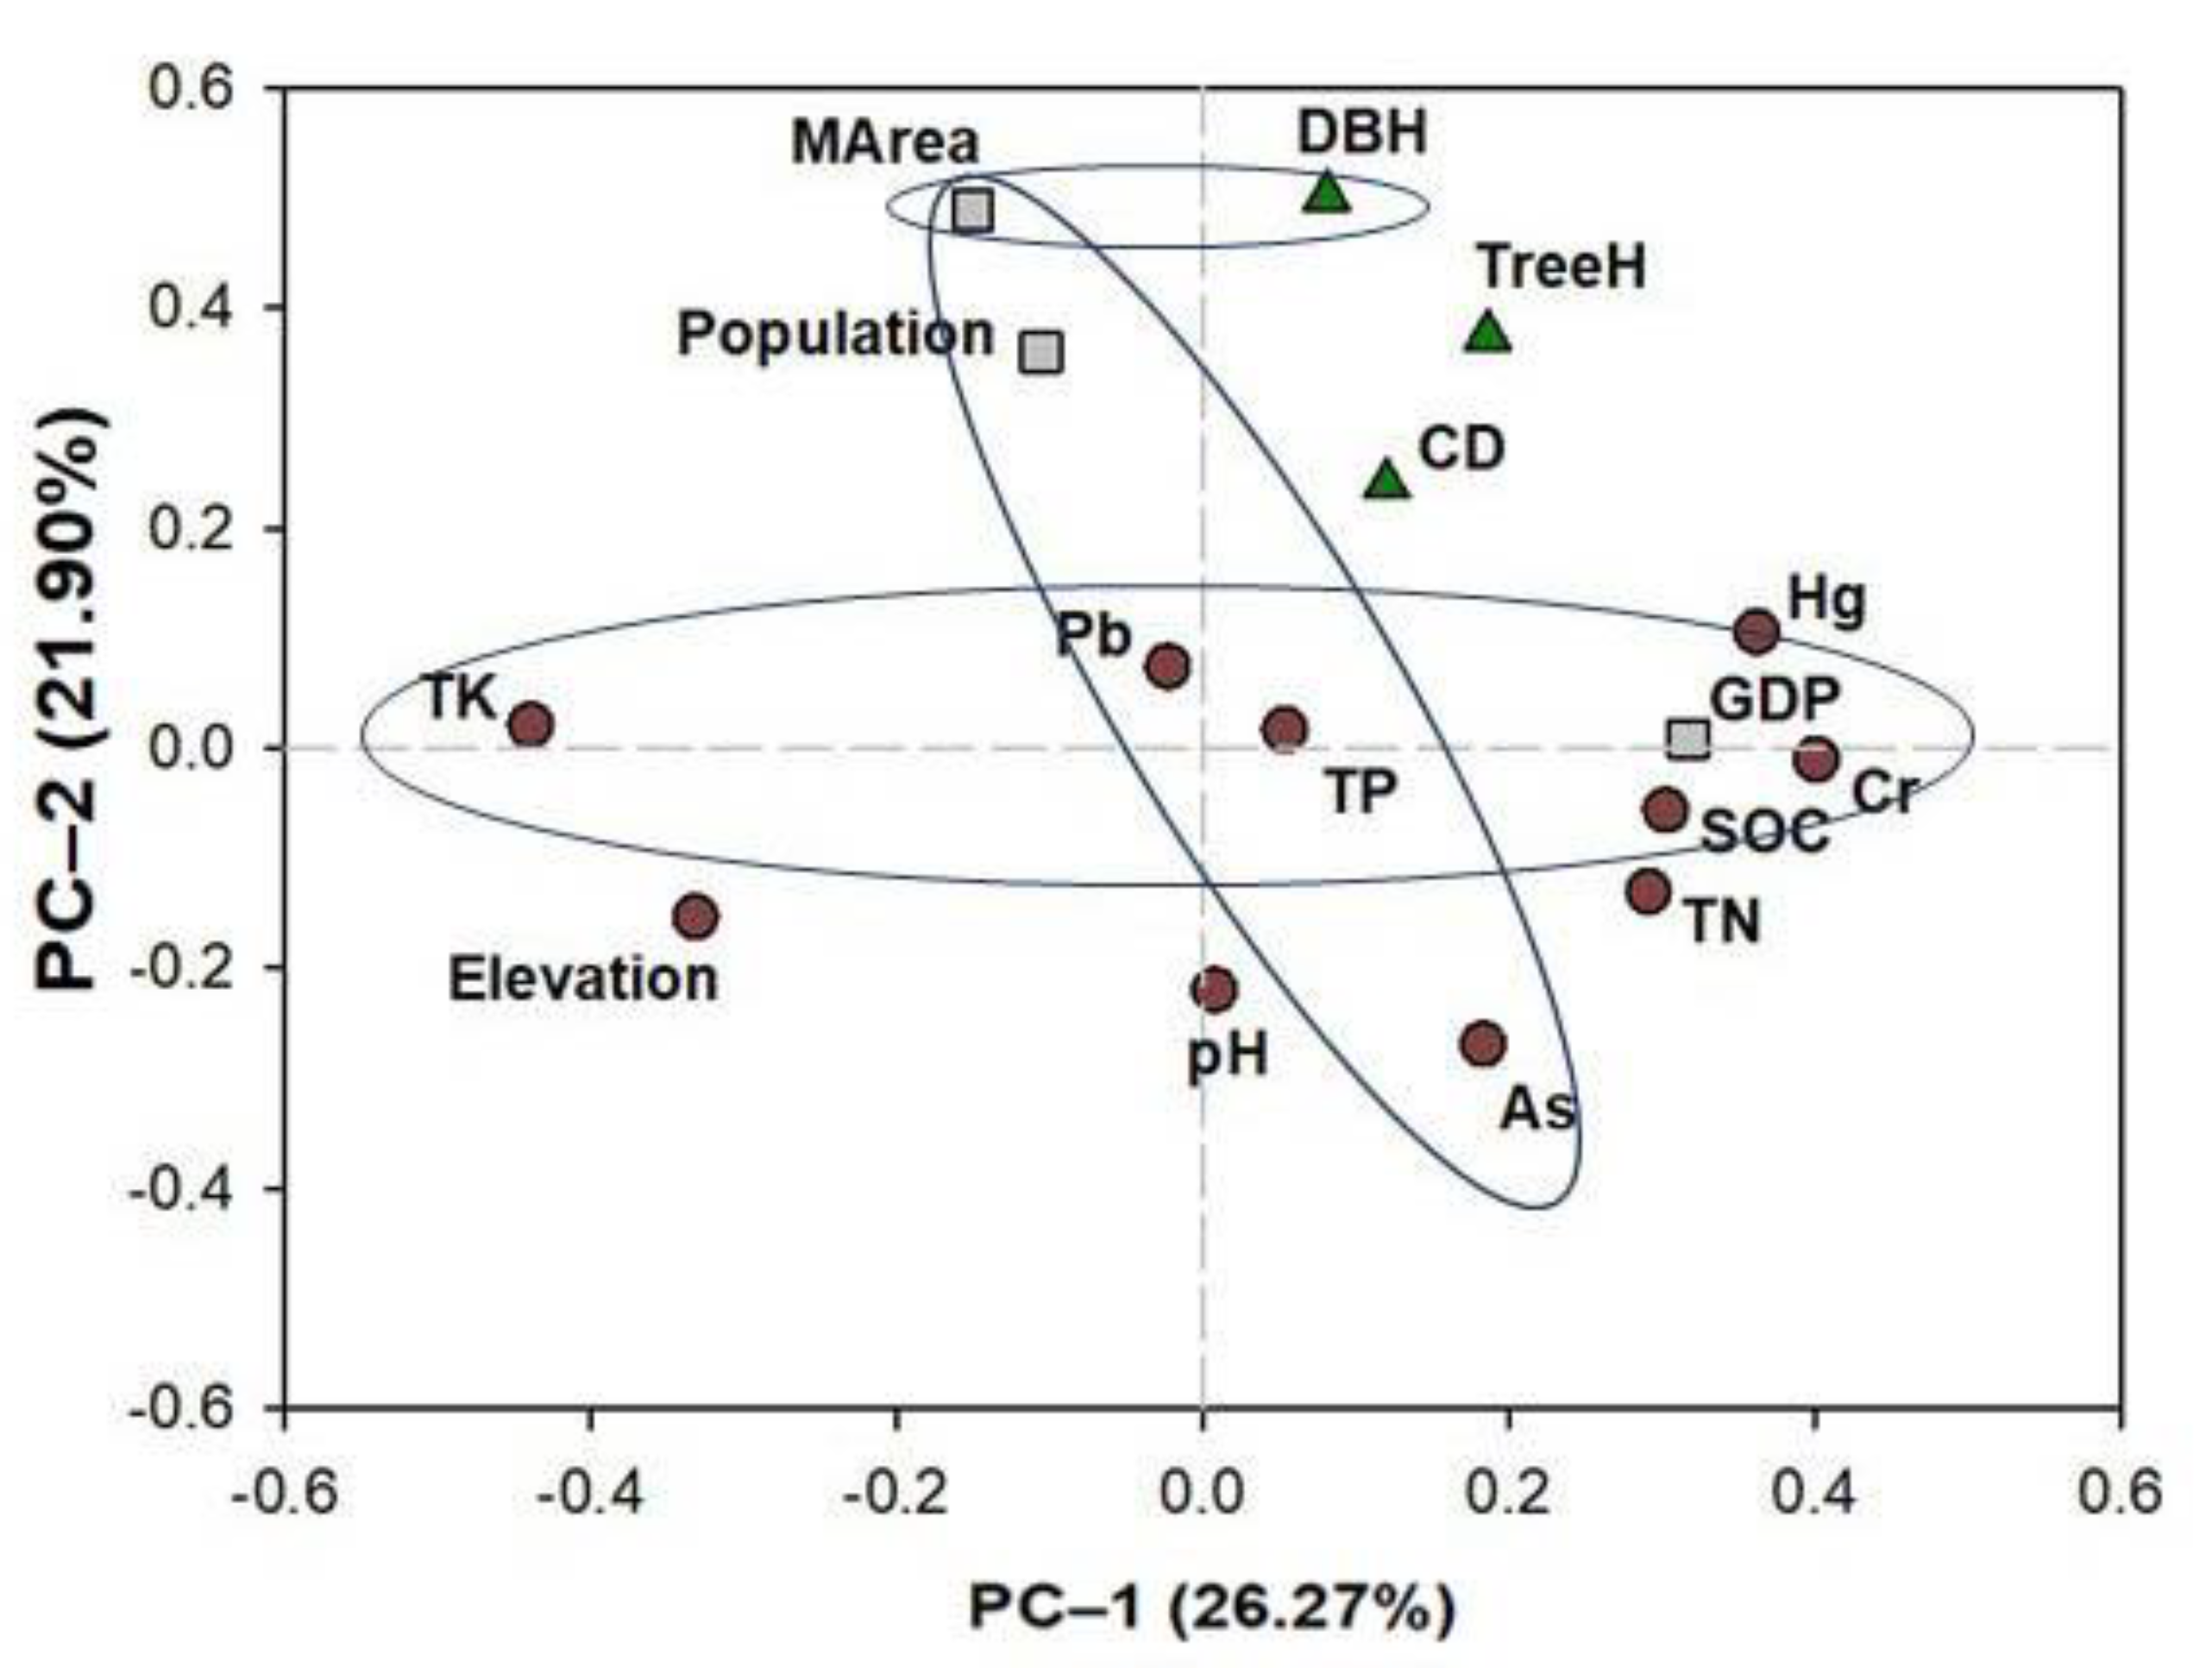
3.5. Principal Component Analysis on Parameters from Tree Inventory

Up to 48.17% of the data variations for all parameters described above can be accounted for, wherein the first PC accounted for 26.27% and the second accounted for 21.90% (Figure 6). Along the first axis of PC-1, GDP showed a high positive eigenvalue (~0.33) with soil properties of TN concentration, SOC content, and Cr and Hg concentrations. Therefore, these soil parameters showed a positive relationship with GDP. In contrast, soil TK concentration had a low negative eigenvalue (−0.45), which showed a negative relationship with GDP. Along the second axis of PC-2, the municipal area of built-up land had a high positive eigenvalue (~0.47), which was close to that for forest tree DBH (~0.48). Therefore, built-up land area showed a positive relationship with forest tree DBH. In addition, municipal area and population had extremely contrasting eigenvalues with soil As concentration, which indicated a negative relationship between municipal area/population and soil As.

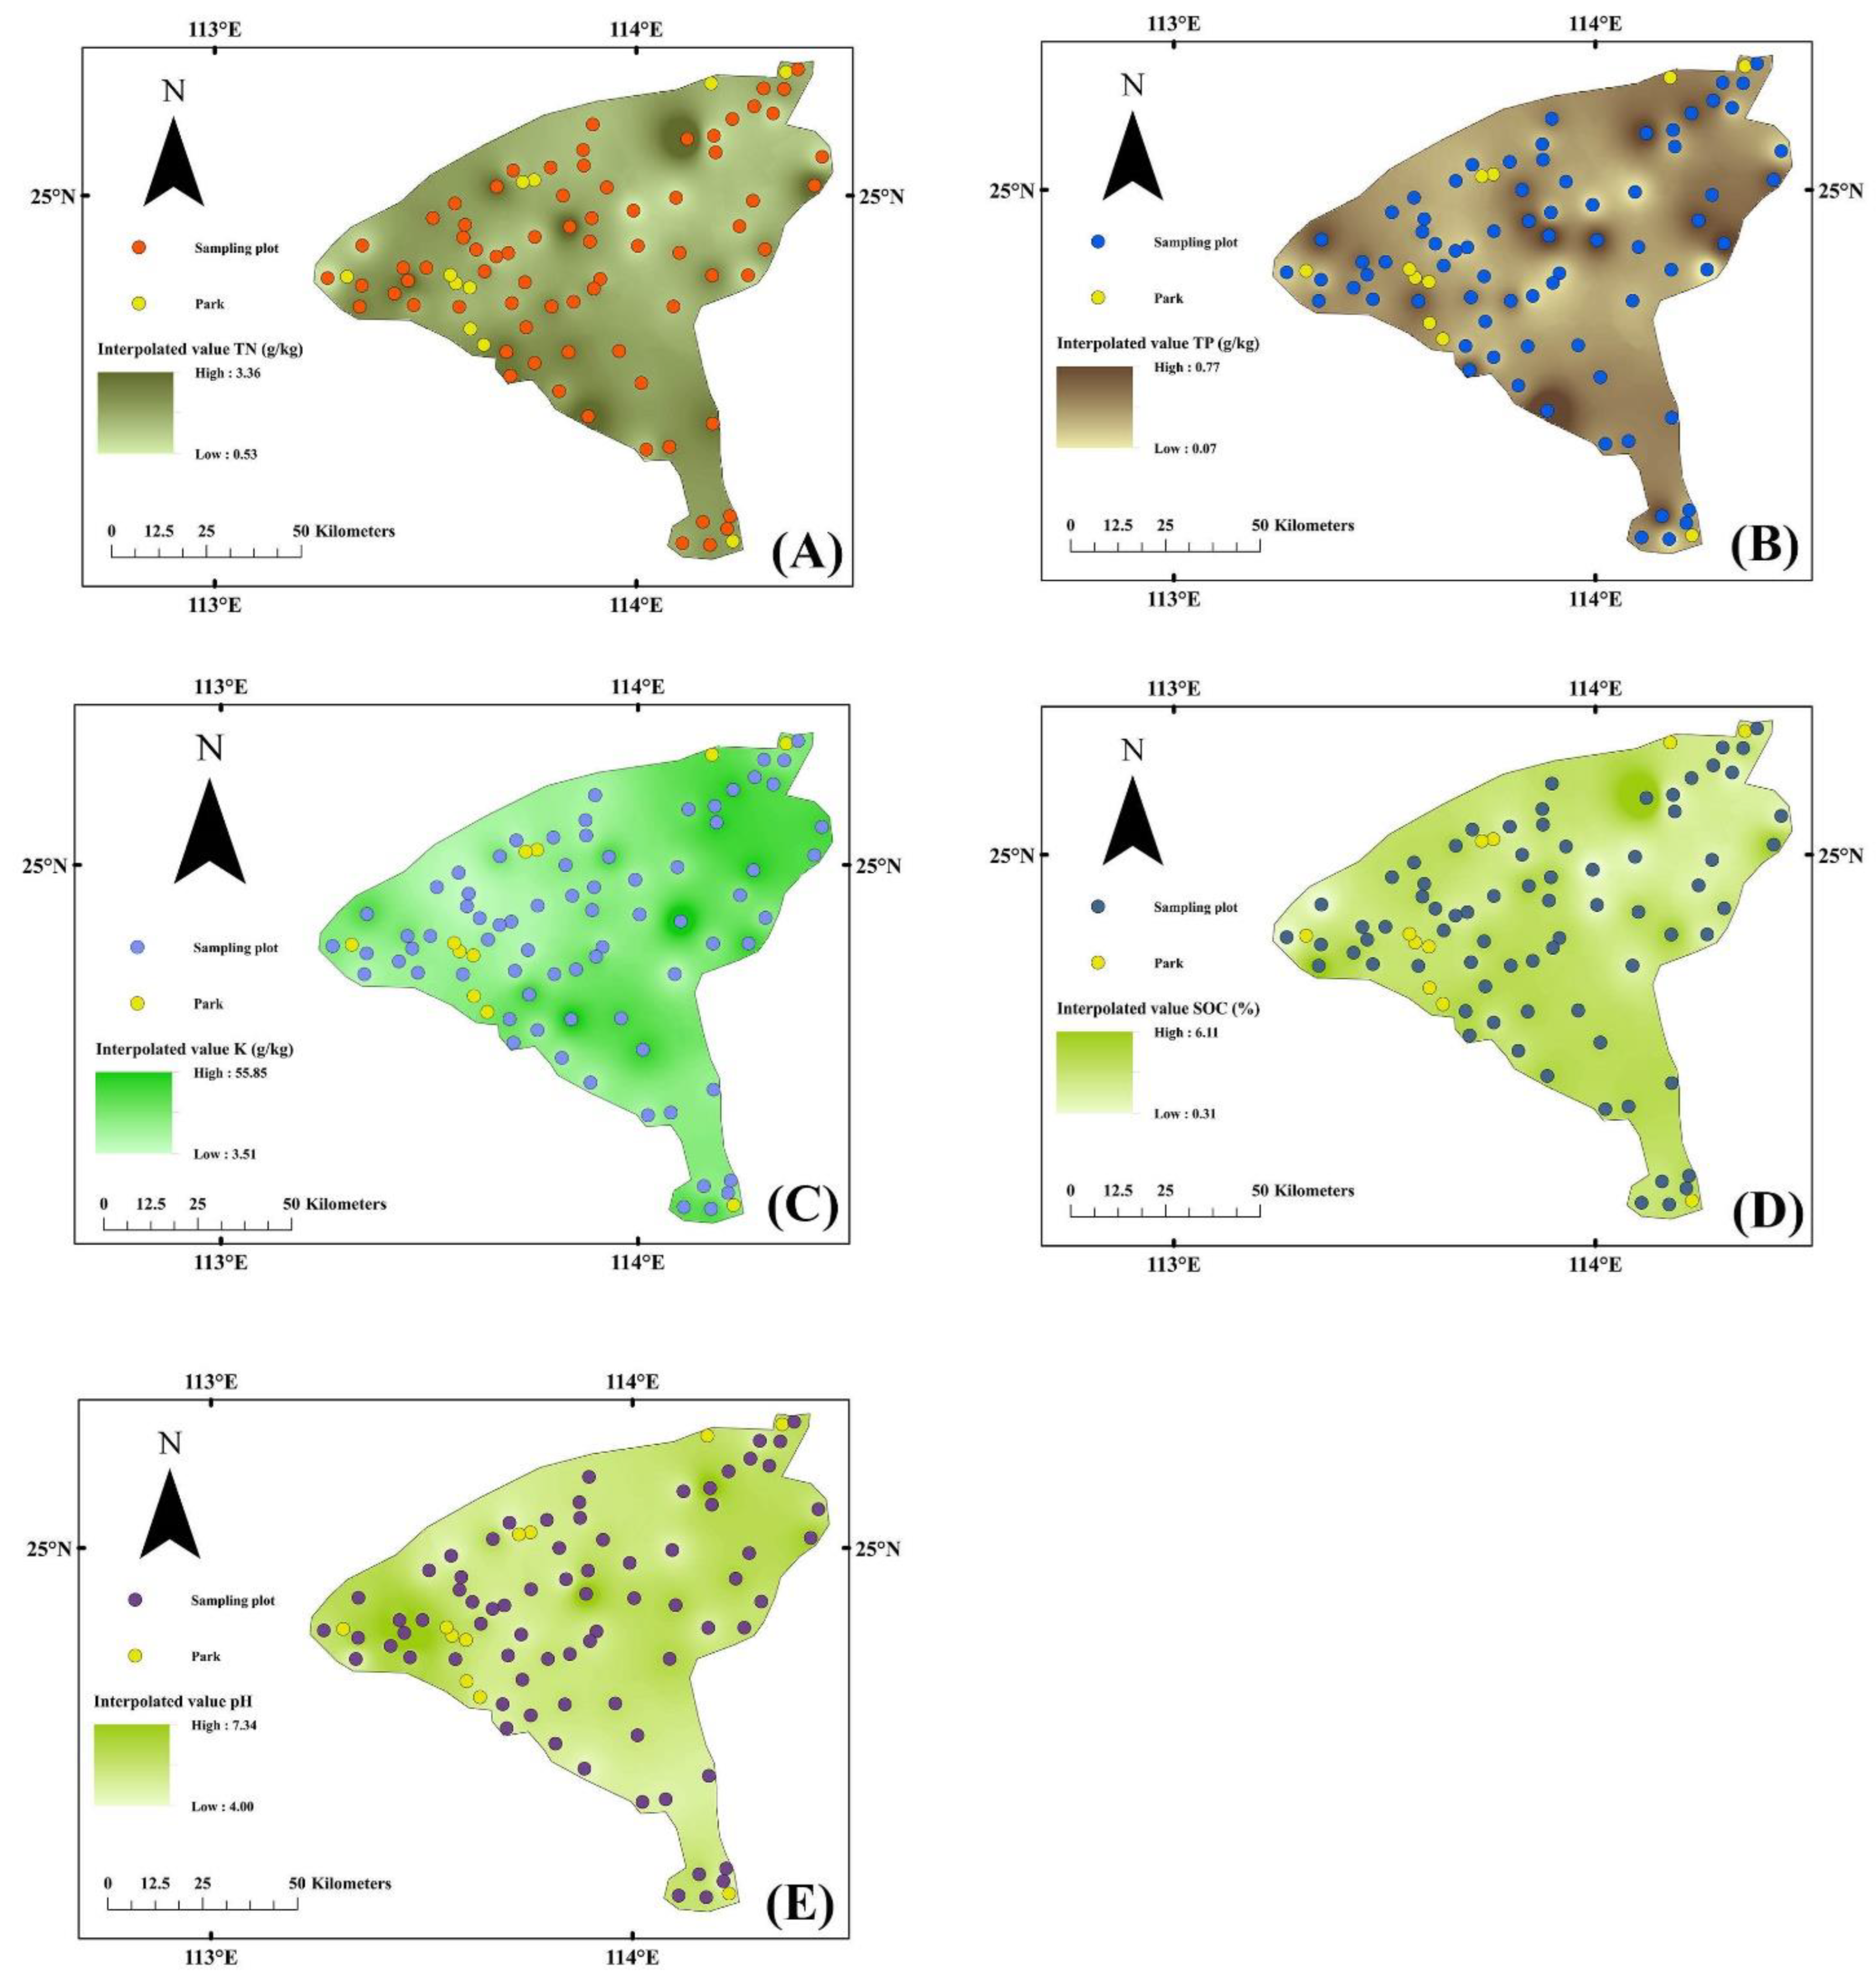
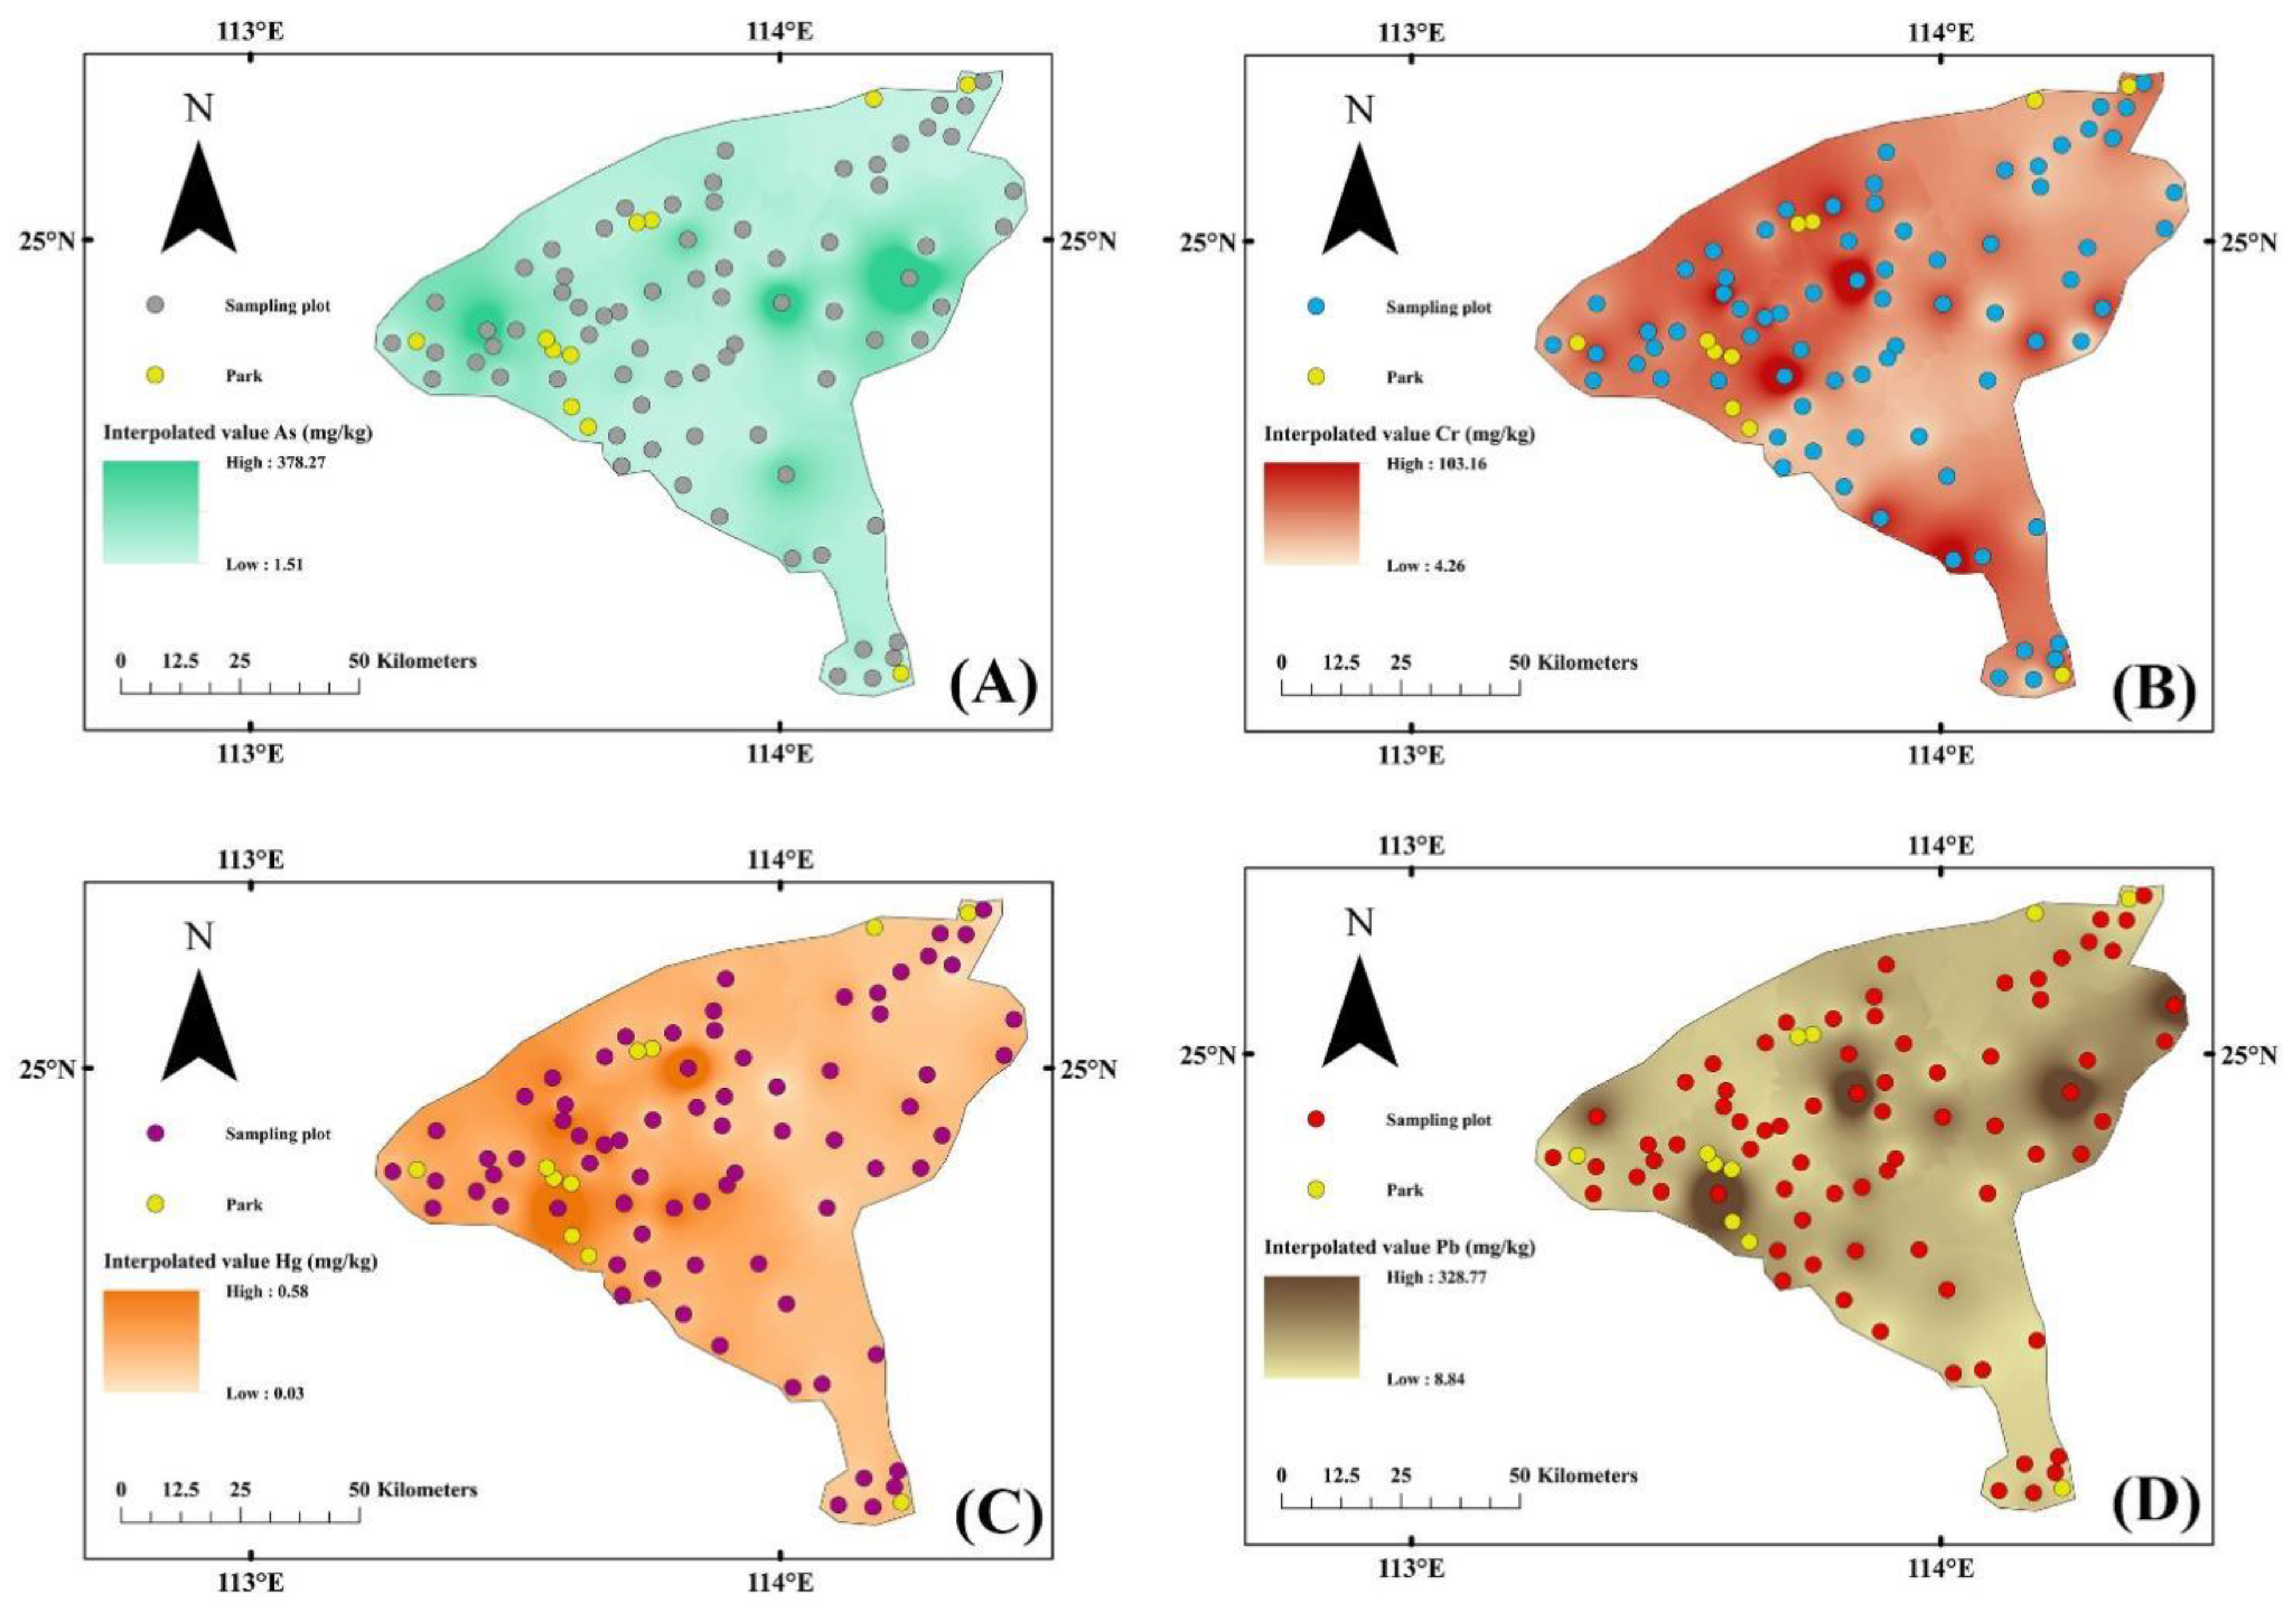
3.6. Interpolation Using Tree Inventory Data

Depending on observed field data from stands regarding forest structure, spatial interpolation indicated a range that extended to the full study area (Figure 7). The average tree height was indicated to be higher in the center part of the study area than other parts (Figure 7A). Parks around 113.5° E were indicated to have a high level of average tree height, at about 26.0 m, while parks in extremely northern and southern parts were indicated to have an average tree height of only about 1.0 m.
DBH was also indicated to be high in the central and northern parts of the study (Figure 7B). Most parks in the western part were indicated to have a DBH of about 7.0–13.0 cm, while parks in the northern part were indicated to have a DBH of about 27.0 cm, and those in the southern part had a DBH of about 0.7 cm.
CD was indicated to show a heterogeneous distribution pattern with alternative high and low levels in regions around different parks (Figure 7C). Generally, parks in the northern part were indicated to have a CD in a range of 50.0–80.0%, while parks in the western part and southern part had a CD of around 47.0–55.0% and 2.2%, respectively.
Soil TN concentration was indicated to be high and low in northern and western regions, respectively, but parks fell in regions that were indicated to have low levels of soil TN concentration (Figure 8A). Parks near the northern edge over 114° E were predicted to have a soil TN concentration of 1.2–1.4 g kg−1, while those in the west were indicated to have a soil TN concentration of 1.2–1.6 g kg−1. The park in the south was indicated to have soil TN concentration of 1.4 g kg−1.
Again, parks were indicated to be located in soils with moderate to low levels of TP concentration (Figure 8B). Parks were predicted to be located in soils with a TP concentration of 0.3–0.4 g kg−1, with higher levels of soil TP concentration distributed in the geographical range of 113.6°–114.0° E and 24.6°–25.2° N.
Soil TK concentration was indicated to be high in the northeastern and southwestern regions of the study area (Figure 8C). Most parks fell in central regions with soil TK concentrations around 12.0–17.0 g kg−1. Northern parks in regions over 25.0° N were predicted to have soil TK concentrations of 21.3–30.4 g kg−1.
SOC was indicated to range between 2.6% and 5.4% in southern regions and between 1.5% and 6.1% in northern regions (Figure 8D). Parks along the northern edge were indicated to have low SOC which ranged from 1.5% to 1.8%, while the SOC in the central part ranged from 1.7% to 2.4%. The park in the south was indicated to have an SOC of 2.2%.
Soil pH was indicated to be higher in regions near the western and eastern edges of study area (Figure 8E). Parks in the eastern part were indicated to have a soil pH of 4.3–4.8, while those in the central part had a pH around 4.4 and those in the western part had a pH around 4.2.
Soil As concentration was indicated to be high in some regions around the central area, but did not cover the locations where parks were distributed (Figure 9A). Parks in the northern and southern regions were indicated to have soil As concentrations of 7.0–8.1 mg kg−1 and 12.5–15.4 mg kg−1, respectively. Parks in the central region were indicated to have high levels of As concentration ranging from 18.8 to 43.5 mg kg−1.
Parks around the northwestern part were indicated to have high levels of soil Cr concentration which ranged from 20.3 to 35.0 mg kg−1 (Figure 9B). Parks in the north and south were indicated to have a soil Cr concentration of about 29.1 and 30.1 mg kg−1, respectively (Figure 9B).
Again, parks in the western part were indicated to be close to regions with high soil Hg concentrations (Figure 9C). Western parks had a soil Hg concentration ranging from 0.15 to 0.28 mg kg−1. The rest of the parks located in the eastern part were indicated to have a soil Hg concentration between 0.07 and 0.12 mg kg−1.
Soil Pb concentration was indicated to be higher in five uncontinuous regions along the central line in the study area (Figure 9D). Only some of the parks in the western part fell in regions that were close to high-Pb soils, which were predicted to have Pb concentrations from 64.3 to 135.0 mg kg−1. Parks near the western and eastern edges were predicted to have soil Pb concentrations between 23.3 and 34.0 mg kg−1.

3.7. Posted Facial Expressions of People in Objective Parks

A neutral score was higher in Cherry Valley than in most other parks, except for Qujiang People Park (Table 3). Happy scores were higher in Meiguangudao Scenic Area, Hat Peak, and Yangyuan Mt. compared to those in Cherry Valley, Nanhua Temple, and Qujiang People Park. Sad scores were higher in Nanhua Temple than in most other parks, except for Meiguangudao Scenic Area. PRI was higher in Yangyuan Mt., Shahu Park, and Yunmen Temple Scenic Area compared to that in Danxia Mt., Nanhua Temple, and Shaoguanfurong Mt. National Mining Park.

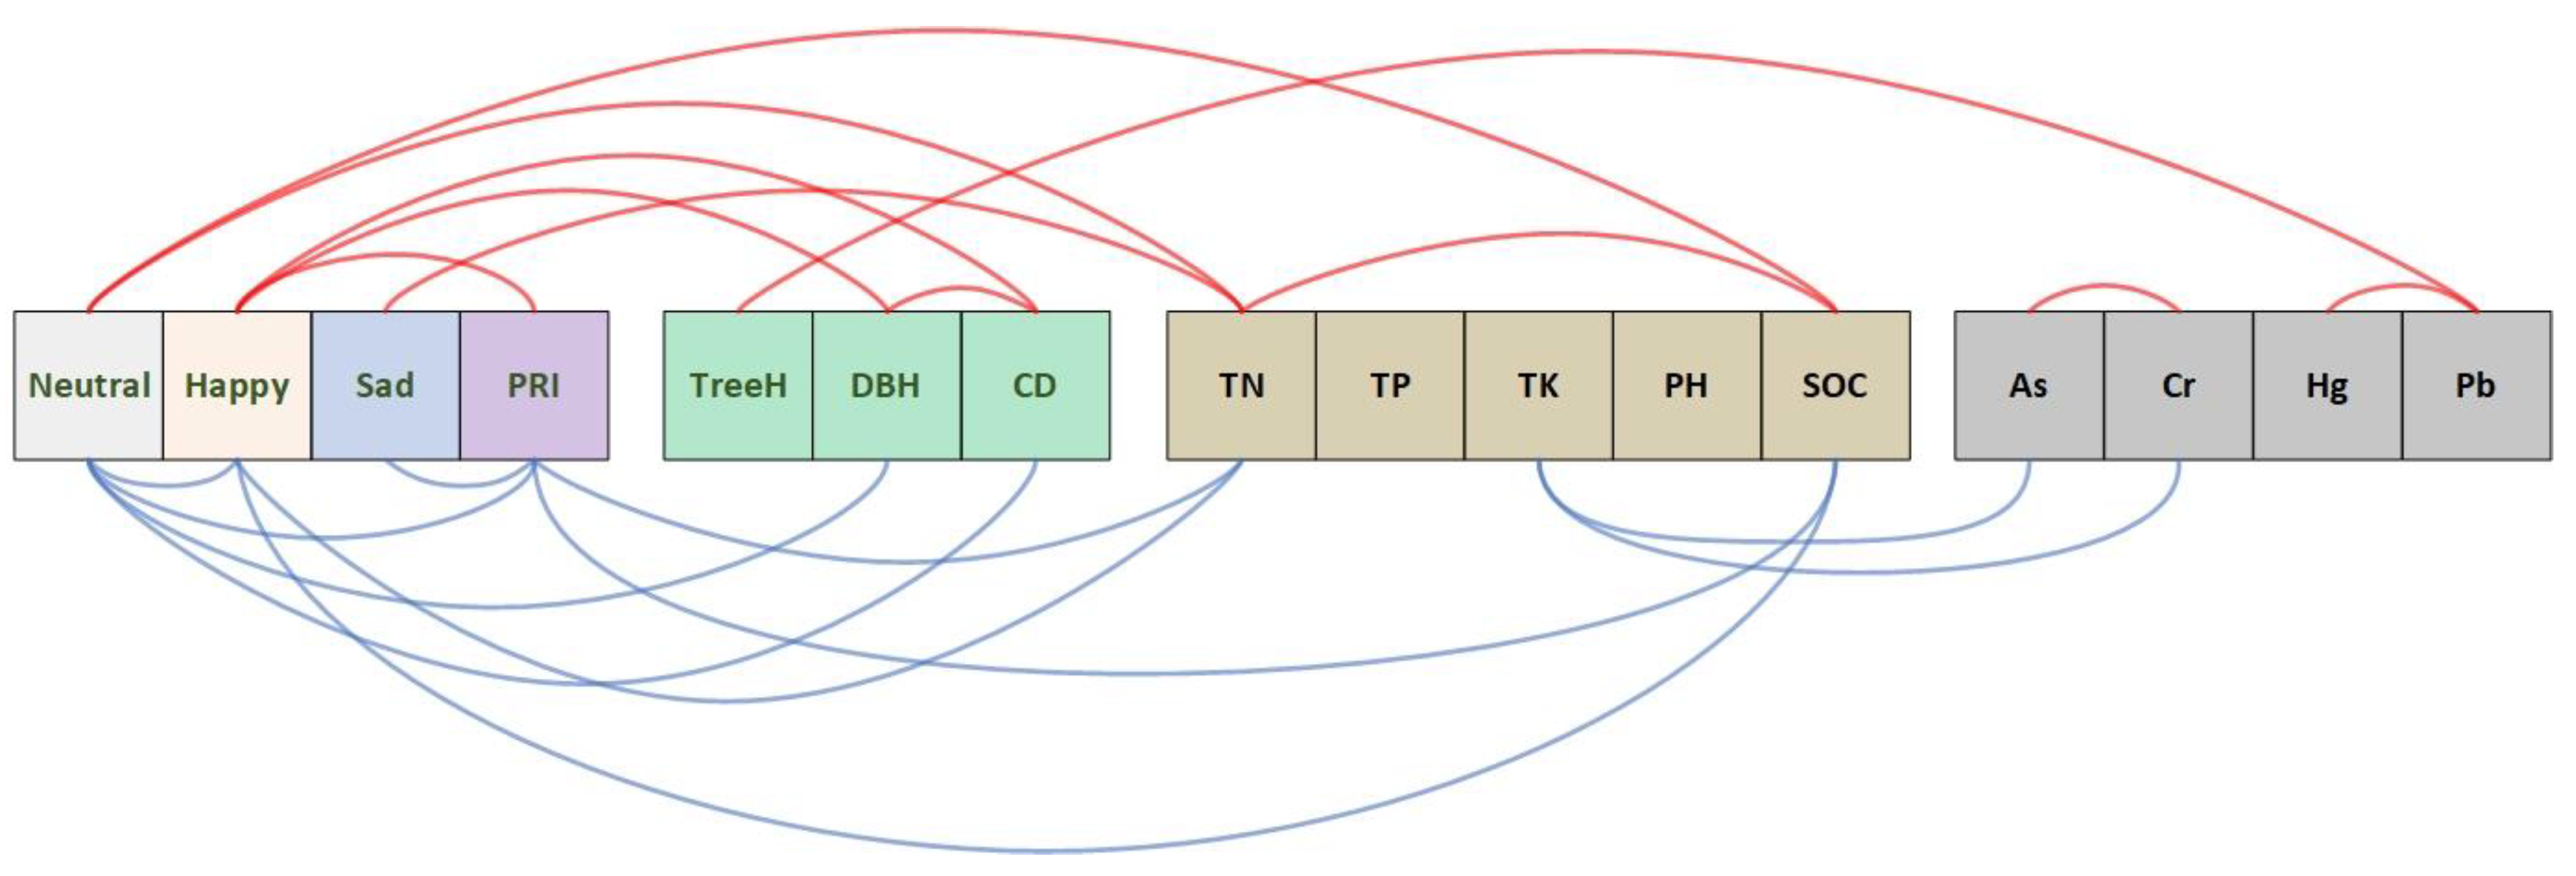
3.8. Relationship Analysis

All Pearson correlations are presented in Figure 10. A neutral score had a positive relationship with soil TN concentration and SOC. Soil TN concentration and SOC have a positive relationship with each other as well. A neutral score also had a negative relationship with happy and PRI scores. In addition, a neutral score had a negative relationship with DBH and CD. A happy score had a positive relationship with PRI score, DBH, and CD. Otherwise, a happy score had a negative relationship with soil TN concentration and SOC. A sad score was positively related with soil TN concentration. It was also negatively related with PRI score. PRI score had negative relationships with TN concentration and SOC in soils.
Average tree height had a positive relationship with soil Pb concentration, and DBH had a positive relationship with CD.
Among soil parameters, TN concentration had a positive relationship with SOC. Soil TK concentration had a negative relationship with As and Cr concentrations, which have a positive relationship with each other. In addition, soil Hg and Pb have a positive relationship with each other as well.

4. Discussion

During the process of urbanization, socio-economic dimensions have close associations with soil heavy metals. Soil Hg was found to be strongly associated with industrial development [73]. Industry is the main source of local economic development in Shaoguan. Hence, Hg was positively correlated with local GDP, which was also found to impact soil Cr concentration in Yixing [74]. We found a negative relationship between population and soil As concentration, which can be explained by the digestion of As by human beings and the large area of built-up regions which diluted As reserves [75].
We found a positive relationship between GDP and SOC, which was also reported in Chifeng City in North China [76]. For cities where the local GDP relies on agricultural industry, tillage was reinforced in accordance with economic development. This was the case for both Chifeng and Shaoguan. Otherwise, economic development can be associated with carbon dioxide (CO2) emissions, which strengthened carbon (C) input into soils to form SOC [77]. Thus, fast industrial developments in steelwork, mining, metallurgy, and manufacture in Shaoguan emission [54] have tendencies to stimulate local CO2 [78,79,80]. The negative relationship between GDP and soil TK may result from soil K deficits in regions with highly developed economies. This is an universal phenomenon in China [81].
Forest tree size can be perceived by people [82], which may further account for the positive effects of a preferred forest view [83]. DBH accounts for the basal area of urban forest trees, which increases with urbanization that supports large forest canopies on larger areas of urbanized land [84]. In our study, DBH had a relationship with municipal area due to the synchronization between forest canopy growth and urbanized land increment. Furthermore, DBH had a positive relationship with CD, both of which have a positive relationship with happy scores. Experiments have demonstrated a close relationship between the experience of touching trees with high CD and positive emotions from relaxation [85]. A large tree with strong branches usually has a large DBH to support the dense canopy. These characteristics of a tree shape account for the visitor’s desire to present a smile. Happy scores in our study were generally lower than 57% and averaged ~31%, which was lower than other findings in northern regions (~43%) [22,23]. In contrast, neutral expressions had a negative relationship with DBH and CD, which suggests presenting an uncalm sentiment when experiencing big trees. Thus, in our study, the presentation of neutral emotions contrasts with the presentation of positive emotions, indicating that uncalm people mostly presented positive emotions.
In our study, soil properties can also be perceived by people who exhibited emotional expressions. On stands with a high TN concentration, people tended to show neutral or sad emotions instead of positive emotions. Our soil TN is closely related with SOC, which is another parameter evoking unhappy emotions. High soil TN and SOC are signs of fertile soils, which have no relationship with forest tree shape. Therefore, it was the lack of green nature on these fertile soils that induced unhappy emotions. Given that Shaoguan is a city whose development relies on the agricultural industry [54], fertile soils should be distributed in farmlands and hilly mountains, where fewer people show happy faces because they do not see scenic beauty.
None of the heavy metals in soils were perceived by people who exhibited emotional expressions. Although soil Pb was richer in stands with tall trees, the length of a trunk was not perceived through emotional expressions. Soils with high Pb and Hg levels were mainly distributed in regions around counties and districts, where local industry mainly relied on metallurgy and mining. Therein, tall-canopy trees are unlikely to motivate smiling in an environment full of noises and smells. In addition, soil K deficit was associated with high As and Cr, which could be the result of exhaustive cropping with heavy inputs of chemicals into soils [86]. Soils with low TK and high As and Cr were mostly distributed in regions with farmland, where no soil properties can be perceived by people with facial emotional expressions.
Our study is a pilot case that predicted stand characteristics for urban parks through spatial interpolation by using data from a tree inventory. We also successfully detected relationships between facial expressions of visitors and stand characteristics. All of our findings can be explained by the general understanding and previous studies. However, our study still has some limitations. First, prediction using tree inventory data is a solution for collecting data in regions that no field investigations covered. However, we still encourage field sampling in stands where park visitors’ photos were obtained. Second, the parks in our study were mostly distributed in regions where soils were less fertile compared to those in surrounding regions. This was shaped by the characteristics of Shaoguan, where forests are experiencing an intensive transition from a secondary natural type to plantations. Future trials should be in cities where natural forests account for a large proportion of the local green spaces. This type of city will have forests in diverse types that evoke more emotional expressions. Finally, our study lacks reliability for the repetition of human variables, i.e., emotional perceptions assessed by facial expressions. This can be resolved by reliable coefficients, such as Cronbach’s alpha [87,88]. More variables describing tree shapes and soil properties may generate relationships with human emotions.

5. Conclusions

Our study illustrates the use of spatial interpolation as an instrument to extend the range of data extraction from a tree inventory for detecting the driving forces of facial expression presentation. According to findings in this study, we conclude that people tended to present more positive emotions in parks in regions with a high population (e.g., Nanxiong) and a large built-up land area (e.g., Nanxiong and Ruyuan). These regions were usually accompanied by forested trees with strong branches and dense canopies. In contrast, the regions with high GDP tended to evoke more sad emotions on faces of park visitors. These regions were characterized by topographies of hilly mountains or farmlands with high soil TN and SOC. We suggest forest policies to establish urban forests in regions around downtown areas and avoid further investment into newly built forests in remote rural regions.

Supplementary Materials

The following supporting information can be downloaded at: https://www.mdpi.com/article/10.3390/su14073817/s1, Figure S1: Real-time work in field investigation of forest stands in tree inventory of Shaoguan, Guangdong, South China.

Author Contributions

Conceptualization, F.Y.; methodology, X.D.; software, F.Y.; validation, H.M.; formal analysis, F.Y.; investigation, F.Y. and H.M.; resources, H.M.; data curation, F.Y.; writing—original draft preparation, F.Y.; writing—review and editing, X.D.; visualization, F.Y.; supervision, X.D. and J.D.; project administration, X.D.; funding acquisition, J.D. All authors have read and agreed to the published version of the manuscript.

Funding

This research was funded by the Guangdong Forestry Science and Technology Project (grant no. 2021-KYXM-13).

Institutional Review Board Statement

The study was conducted in accordance with the Declaration of Helsinki, and approved by the Institutional Ethics Committee of Guangdong Academy of Forestry (protocol code GAF-EC-2021-001 and date of approval: 7 February 2021).

Informed Consent Statement

Informed consent was obtained from the open policy of online platform for all subjects involved in the study.

Data Availability Statement

Not applicable.

Acknowledgments

The authors wish to thank Zhongrui Zhang, Hangyong Zhu, and Geng Zhang for the investigation.

Conflicts of Interest

The authors declare no conflict of interest.

References

  1. Gruebner, O.; Rapp, M.A.; Adli, M.; Kluge, U.; Galea, S.; Heinz, A. Cities and Mental Health. Dtsch. Arztebl. Int. 2017, 114, 121. [Google Scholar] [CrossRef] [PubMed] [Green Version]
  2. Kaplan, S. The restorative benefits of nature: Toward an integrative framework. J. Environ. Psychol. 1995, 15, 169–182. [Google Scholar] [CrossRef]
  3. Ulrich, R.S.; Simons, R.F.; Losito, B.D.; Fiorito, E.; Miles, M.A.; Zelson, M. Stress recovery during exposure to natural and urban environments. J. Environ. Psychol. 1991, 11, 201–230. [Google Scholar] [CrossRef]
  4. Vujcic, M.; Tomicevic-Dubljevic, J.; Grbic, M.; Lecic-Tosevski, D.; Vukovic, O.; Toskovic, O. Nature based solution for improving mental health and well-being in urban areas. Environ. Res. 2017, 158, 385–392. [Google Scholar] [CrossRef]
  5. Van den Bosch, M.; Ode Sang, Å. Urban natural environments as nature-based solutions for improved public health—A systematic review of reviews. Environ. Res. 2017, 158, 373–384. [Google Scholar] [CrossRef] [PubMed]
  6. Ugolini, F.; Massetti, L.; Calaza-Martínez, P.; Cariñanos, P.; Dobbs, C.; Ostoić, S.K.; Marin, A.M.; Pearlmutter, D.; Saaroni, H.; Šaulienė, I.; et al. Effects of the COVID-19 pandemic on the use and perceptions of urban green space: An international exploratory study. Urban For. Urban Green. 2020, 56, 126888. [Google Scholar] [CrossRef]
  7. Sundara Rajoo, K.; Singh Karam, D.; Abdu, A.; Rosli, Z.; James Gerusu, G. Addressing psychosocial issues caused by the COVID-19 lockdown: Can urban greeneries help? Urban For. Urban Green. 2021, 65, 127340. [Google Scholar] [CrossRef] [PubMed]
  8. Tsai, W.L.; McHale, M.R.; Jennings, V.; Marquet, O.; Hipp, J.A.; Leung, Y.F.; Floyd, M.F. Relationships between Characteristics of Urban Green Land Cover and Mental Health in US Metropolitan Areas. Int. J. Environ. Res. Public Health 2018, 15, 340. [Google Scholar] [CrossRef] [PubMed] [Green Version]
  9. Vujcic, M.; Tomicevic-Dubljevic, J. Urban forest benefits to the younger population: The case study of the city of Belgrade, Serbia. For. Policy Econ. 2018, 96, 54–62. [Google Scholar] [CrossRef]
  10. Song, M.K.; Bang, K.S.; Kim, S.; Lee, G.; Jeong, Y. Effects of an Urban Forest-Based Health Promotion Program on Children Living in Group Homes. J. Psychosoc. Nurs. Ment. Health Serv. 2020, 58, 18–29. [Google Scholar] [CrossRef]
  11. Subiza-Pérez, M.; Hauru, K.; Korpela, K.; Haapala, A.; Lehvävirta, S. Perceived Environmental Aesthetic Qualities Scale (PEAQS)—A self-report tool for the evaluation of green-blue spaces. Urban For. Urban Green. 2019, 43, 126383. [Google Scholar] [CrossRef]
  12. Aerts, R.; Honnay, O.; Van Nieuwenhuyse, A. Biodiversity and human health: Mechanisms and evidence of the positive health effects of diversity in nature and green spaces. Br. Med. Bull. 2018, 127, 5–22. [Google Scholar] [CrossRef] [PubMed] [Green Version]
  13. WHO. A User’s Guide to the Self Reporting Questionnaire (SRQ); World Health Organization, Division of Mental Health: Geneva, Switzerland, 1994. [Google Scholar]
  14. Wei, H.; Hauer, R.J.; Chen, X.; He, X. Facial expressions of visitors in forests along the urbanization gradient: What can we learn from selfies on social networking services? Forests 2019, 10, 14. [Google Scholar] [CrossRef] [Green Version]
  15. Wei, H.; Hauer, R.J.; Guo, S. Daytime dynamic of spontaneous expressions of pedestrians in an urban forest park. Urban For. Urban Green. 2021, 65, 127326. [Google Scholar] [CrossRef]
  16. Wei, H.; Ma, B.; Hauer, R.J.; Liu, C.; Chen, X.; He, X. Relationship between environmental factors and facial expressions of visitors during the urban forest experience. Urban For. Urban Green. 2020, 53, 126699. [Google Scholar] [CrossRef]
  17. Tomkins, S.S.; McCarter, R. What and where are the primary affects? Some evidence for a theory. Percept. Mot. Ski. 1964, 18, 119–158. [Google Scholar] [CrossRef]
  18. Park, S.; Lee, K.; Lim, J.A.; Ko, H.; Kim, T.; Lee, J.I.; Kim, H.; Han, S.J.; Kim, J.S.; Park, S.; et al. Differences in Facial Expressions between Spontaneous and Posed Smiles: Automated Method by Action Units and Three-Dimensional Facial Landmarks. Sensors 2020, 20, 1199. [Google Scholar] [CrossRef] [PubMed] [Green Version]
  19. Wei, H.; Hauer, R.J.; He, X. A forest experience does not always evoke positive emotion: A pilot study on unconscious facial expressions using the face reading technology. For. Policy Econ. 2021, 123, 102365. [Google Scholar] [CrossRef]
  20. Sasaki, W.; Nishiyama, Y.; Okoshi, T.; Nakazawa, J. Investigating the occurrence of selfie-based emotional contagion over social network. Soc. Netw. Anal. Min. 2021, 11, 8. [Google Scholar] [CrossRef]
  21. Liu, P.; Liu, M.; Xia, T.; Wang, Y.; Guo, P. The Relationship between Landscape Metrics and Facial Expressions in 18 Urban Forest Parks of Northern China. Forests 2021, 12, 1619. [Google Scholar] [CrossRef]
  22. Mao, B.; Liang, F.; Li, Z.; Zheng, W. Microclimates Potentially Shape Spatial Distribution of Facial Expressions for Urban Forest Visitors: A Regional Study of 30 Parks in North China. Sustainability 2022, 14, 1648. [Google Scholar] [CrossRef]
  23. Zhang, J.; Yang, Z.; Chen, Z.; Guo, M.; Guo, P. Optimizing Urban Forest Landscape for Better Perceptions of Positive Emotions. Forests 2021, 12, 1691. [Google Scholar] [CrossRef]
  24. Liu, P.; Liu, M.; Xia, T.; Wang, Y.; Wei, H. Can Urban Forest Settings Evoke Positive Emotion? Evidence on Facial Expressions and Detection of Driving Factors. Sustainability 2021, 13, 8687. [Google Scholar] [CrossRef]
  25. Wei, H.; Hauer, R.J.; Zhai, X. The relationship between the facial expression of people in university campus and host-city variables. Appl. Sci.-Basel 2020, 10, 1474. [Google Scholar] [CrossRef] [Green Version]
  26. Chang, J.; Zhang, M.; Hitchman, G.; Qiu, J.; Liu, Y. When you smile, you become happy: Evidence from resting state task-based fMRI. Biol. Psychol. 2014, 103, 100–106. [Google Scholar] [CrossRef] [PubMed]
  27. Guan, H.; Wei, H.; Hauer, R.J.; Liu, P. Facial expressions of Asian people exposed to constructed urban forests: Accuracy validation and variation assessment. PLoS ONE 2021, 16, e0253141. [Google Scholar] [CrossRef] [PubMed]
  28. Zheng, B.; Zhang, Y.; Chen, J. Preference to home landscape: Wildness or neatness? Landsc. Urban Plan. 2011, 99, 1–8. [Google Scholar] [CrossRef]
  29. Oldfield, S.F. Botanic gardens and the conservation of tree species. Trends Plant Sci. 2009, 14, 581–583. [Google Scholar] [CrossRef] [PubMed]
  30. An, B.; Wang, D.; Liu, X.; Guan, H.; Wei, H.; Ren, Z. The effect of environmental factors in urban forests on blood pressure and heart rate in university students. J. For. Res. 2019, 24, 27–34. [Google Scholar] [CrossRef]
  31. Zhou, C.; Yan, L.; Yu, L.; Wei, H.; Guan, H.; Shang, C.; Chen, F.; Bao, J. Effect of short-term forest bathing in urban parks on perceived anxiety of young-adults: A pilot study in Guiyang, Southwest China. Chin. Geogr. Sci. 2019, 29, 139–150. [Google Scholar]
  32. Ren, Z.; He, X.; Zheng, H.; Zhang, D.; Yu, X.; Shen, G.; Guo, R. Estimation of the Relationship between Urban Park Characteristics and Park Cool Island Intensity by Remote Sensing Data and Field Measurement. Forests 2013, 4, 868–886. [Google Scholar] [CrossRef] [Green Version]
  33. Guan, H.; Wei, H.; He, X.; Ren, Z.; An, B. The tree-species-specific effect of forest bathing on perceived anxiety alleviation of young-adults in urban forests. Ann. For. Res. 2017, 60, 327–341. [Google Scholar] [CrossRef]
  34. Dong, Y.; Ren, Z.; Fu, Y.; Hu, N.; Guo, Y.; Jia, G.; He, X. Decrease in the residents’ accessibility of summer cooling services due to green space loss in Chinese cities. Environ. Int. 2022, 158, 107002. [Google Scholar] [CrossRef] [PubMed]
  35. Ren, Z.; He, X.; Pu, R.; Zheng, H. The impact of urban forest structure and its spatial location on urban cool island intensity. Urban Ecosyst. 2018, 21, 863–874. [Google Scholar] [CrossRef]
  36. Ren, Z.; Zhao, H.; Fu, Y.; Xiao, L.; Dong, Y. Effects of urban street trees on human thermal comfort and physiological indices: A case study in Changchun city, China. J. For. Res. 2021. Online first. [Google Scholar] [CrossRef]
  37. Li, H.; Wang, X.; Wei, H.; Xia, T.; Liu, M. Geographical Distribution and Driving Meteorological Forces of Facial Expressions of Visitors in Urban Wetland Parks in Eastern China. Front. Earth Sci.-Hydrosphere 2022. Provisionally accepted. Available online: https://www.frontiersin.org/articles/10.3389/feart.2022.781204/abstract (accessed on 11 March 2022).
  38. Datta, D.; Deb, S. Forest structure and soil properties of mangrove ecosystems under different management scenarios: Experiences from the intensely humanized landscape of Indian Sunderbans. Ocean. Coast. Manag. 2017, 140, 22–33. [Google Scholar] [CrossRef]
  39. Peña-Claros, M.; Poorter, L.; Alarcón, A.; Blate, G.; Choque, U.; Fredericksen, T.S.; Justiniano, M.J.; Leaño, C.; Licona, J.C.; Pariona, W.; et al. Soil Effects on Forest Structure and Diversity in a Moist and a Dry Tropical Forest. Biotropica 2012, 44, 276–283. [Google Scholar] [CrossRef]
  40. Pulford, I.D.; Watson, C. Phytoremediation of heavy metal-contaminated land by trees—A review. Environ. Int. 2003, 29, 529–540. [Google Scholar] [CrossRef]
  41. Menon, M.; Hermle, S.; Günthardt-Goerg, M.S.; Schulin, R. Effects of heavy metal soil pollution and acid rain on growth and water use efficiency of a young model forest ecosystem. Plant Soil 2007, 297, 171–183. [Google Scholar] [CrossRef]
  42. Ma, B.; Hauer, R.J.; Östberg, J.; Koeser, A.K.; Wei, H.; Xu, C. A global basis of urban tree inventories: What comes first the inventory or the program. Urban For. Urban Green. 2021, 60, 127087. [Google Scholar] [CrossRef]
  43. Kielbaso, J.J. Management of Urban Forests in the United States. In Ecology, Planning, and Management of Urban Forests: International Perspectives; Carreiro, M.M., Song, Y.-C., Wu, J., Eds.; Springer New York: New York, NY, USA, 2008; pp. 240–258. [Google Scholar]
  44. Miller, R.W.; Hauer, R.J.; Werner, L.P. Urban Forestry: Planning and Managing Urban Greenspaces, 3rd ed.; Waveland Press, Inc.: Long Grove, IL, USA, 2015. [Google Scholar]
  45. Morgenroth, J.; Östberg, J.; Konijnendijk van den Bosch, C.; Nielsen, A.B.; Hauer, R.; Sjöman, H.; Chen, W.; Jansson, M. Urban tree diversity—Taking stock and looking ahead. Urban For. Urban Green. 2016, 15, 1–5. [Google Scholar] [CrossRef] [Green Version]
  46. Corona, P.; Agrimi, M.; Baffetta, F.; Barbati, A.; Chiriaco, M.V.; Fattorini, L.; Pompei, E.; Valentini, R.; Mattioli, W. Extending large-scale forest inventories to assess urban forests. Environ. Monit. Assess. 2012, 184, 1409–1422. [Google Scholar] [CrossRef] [Green Version]
  47. Mills, J.R.; Cunningham, P.; Donovan, G.H. Urban forests and social inequality in the Pacific Northwest. Urban For. Urban Green. 2016, 16, 188–196. [Google Scholar] [CrossRef] [Green Version]
  48. Lin, B.; Li, Z. Spatial analysis of mainland cities’ carbon emissions of and around Guangdong-Hong Kong-Macao Greater Bay area. Sustain. Cities Soc. 2020, 61, 102299. [Google Scholar] [CrossRef]
  49. Zhang, C.B.; Huang, L.N.; Wong, M.H.; Zhang, J.T.; Zhai, C.J.; Lan, C.Y. Characterization of soil physico-chemical and microbial parameters after revegetation near Shaoguan Pb/Zn smelter, Guangdong, PR China. Water Air Soil Pollut. 2006, 177, 81–101. [Google Scholar] [CrossRef]
  50. Zheng, S.; Wang, Q.; Yu, H.; Huang, X.; Li, F. Interactive effects of multiple heavy metal(loid)s on their bioavailability in cocontaminated paddy soils in a large region. Sci. Total Environ. 2020, 708, 135126. [Google Scholar] [CrossRef] [PubMed]
  51. Zhou, M.; Liao, B.; Shu, W.; Yang, B.; Lan, C. Pollution Assessment and Potential Sources of Heavy Metals in Agricultural Soils around Four Pb/Zn Mines of Shaoguan City, China. Soil Sediment Contam. Int. J. 2015, 24, 76–89. [Google Scholar] [CrossRef]
  52. Yan, Q.; Li, J. Park Green Space Planning and Design in ShaoGuan Based on Environmental Psychology. In Proceedings of the International Federation of Landscape Architects Asia-Pacific Region Annual Conference, IFLA Asia Pacif Region, Shanghai, China, 22–24 October 2012; London Science Publishing Ltd.: Shanghai, China, 2013; pp. 151–155. [Google Scholar]
  53. People’ Government of Shaoguan City. Nature and Geography of Shaoguan. Available online: https://www.sg.gov.cn/sq/sgjj/lnmj/content/post_1350291.html (accessed on 15 February 2022).
  54. People’ Government of Shaoguan City. Economic State of Shaoguan. Available online: https://www.sg.gov.cn/sq/sgjj/lnmj/content/post_1350290.html (accessed on 6 August 2021).
  55. Leung, H.M.; Duzgoren-Aydin, N.S.; Au, C.K.; Krupanidhi, S.; Fung, K.Y.; Cheung, K.C.; Wong, Y.K.; Peng, X.L.; Ye, Z.H.; Yung, K.K.L.; et al. Monitoring and assessment of heavy metal contamination in a constructed wetland in Shaoguan (Guangdong Province, China): Bioaccumulation of Pb, Zn, Cu and Cd in aquatic and terrestrial components. Environ. Sci. Pollut. Res. 2017, 24, 9079–9088. [Google Scholar] [CrossRef] [PubMed]
  56. Ding, X.G.; Li, X.C.; Qi, Y.; Zhao, Z.Y.; Sun, D.X.; Wei, H.X. Depth-Dependent C-N-P Stocks and Stoichiometry in Ultisols Resulting from Conversion of Secondary Forests to Plantations and Driving Forces. Forests 2021, 12, 1300. [Google Scholar] [CrossRef]
  57. Statistics of Shaoguan City. Statistics of Shaoguan City in 2021. Available online: https://www.sg.gov.cn/bmpdlm/sgstjj/tjsj/ (accessed on 15 February 2022).
  58. Zhen, Z.; Wang, S.B.; Luo, S.W.; Ren, L.; Liang, Y.Q.; Yang, R.C.; Li, Y.T.; Zhang, Y.Q.; Deng, S.Q.; Zou, L.N.; et al. Significant Impacts of Both Total Amount and Availability of Heavy Metals on the Functions and Assembly of Soil Microbial Communities in Different Land Use Patterns. Front. Microbiol. 2019, 10, 2293. [Google Scholar] [CrossRef] [PubMed]
  59. Liu, G. Soil Physical and Chemical Analysis, Description of Soil Profiles; Standard Press of China: Beijing, China, 1996. [Google Scholar]
  60. Bremner, J.M. Determination of nitrogen in soil by the Kjeldahl method. J. Agric. Sci. 1960, 55, 11–33. [Google Scholar] [CrossRef]
  61. Jiang, X.L.; Xiong, Z.Q.; Liu, H.; Liu, G.H.; Liu, W.Z. Distribution, source identification, and ecological risk assessment of heavy metals in wetland soils of a river-reservoir system. Environ. Sci. Pollut. Res. 2017, 24, 436–444. [Google Scholar] [CrossRef]
  62. Sun, L.; Guo, D.K.; Liu, K.; Meng, H.; Zheng, Y.J.; Yuan, F.Q.; Zhu, G.H. Levels, sources, and spatial distribution of heavy metals in soils from a typical coal industrial city of Tangshan, China. Catena 2019, 175, 101–109. [Google Scholar] [CrossRef]
  63. U.S. EPA. Method 3050B: Acid Digestion of Sediments, Sludges and Soils. Revision 2; U.S. Environmental Proection Agency: Wathington, DC, USA, 1996.
  64. Sina Weibo. IR Home of Sina Weibo. Available online: http://ir.weibo.com/ (accessed on 15 February 2022).
  65. Sina Weibo. Annual Report 2020 of Sina Weibo. Available online: http://ir.weibo.com/static-files/9d492ab8-3e17-47e4-bbf4-ad8d01473ca4 (accessed on 15 February 2022).
  66. Rizwan, M.; Wan, W.; Cervantes, O.; Gwiazdzinski, L. Using Location-Based Social Media Data to Observe Check-In Behavior and Gender Difference: Bringing Weibo Data into Play. ISPRS Int. J. Geo-Inf. 2018, 7, 196. [Google Scholar] [CrossRef] [Green Version]
  67. Ye, Z.; Newing, A.; Clarke, G. Understanding Chinese tourist mobility and consumption-related behaviours in London using Sina Weibo check-ins. Environ. Plan. B Urban Anal. City Sci. 2021, 48, 2436–2452. [Google Scholar] [CrossRef]
  68. Gasper, K.; Spencer, L.A.; Hu, D. Does Neutral Affect Exist? How Challenging Three Beliefs About Neutral Affect Can Advance Affective Research. Front. Psychol. 2019, 10, 2476. [Google Scholar] [CrossRef] [PubMed] [Green Version]
  69. Gasper, K. Utilizing Neutral Affective States in Research: Theory, Assessment, and Recommendations. Emotion Rev. 2018, 10, 255–266. [Google Scholar] [CrossRef] [Green Version]
  70. Ekman, P.; Oster, H. Facial Expressions of Emotion. Annu. Rev. Psychol. 1979, 30, 527–554. [Google Scholar] [CrossRef]
  71. Du, S.; Tao, Y.; Martinez, A.M. Compound facial expressions of emotion. Proc. Natl. Acad. Sci. USA 2014, 111, E1454–E1462. [Google Scholar] [CrossRef] [PubMed] [Green Version]
  72. Duncan, D.B. Multiple Range and Multiple F Tests. Biometrics 1955, 11, 42. [Google Scholar] [CrossRef]
  73. Liu, L.L.; Liu, Q.Y.; Ma, J.; Wu, H.W.; Qu, Y.J.; Gong, Y.W.; Yang, S.H.; An, Y.F.; Zhou, Y.Z. Heavy metal(loid)s in the topsoil of urban parks in Beijing, China: Concentrations, potential sources, and risk assessment. Environ. Pollut. 2020, 260, 114083. [Google Scholar] [CrossRef] [PubMed]
  74. Xu, M.X.; Zhou, S.L.; Wang, X.R.; Wu, S.H.; Cao, W. The Influence of Socio-economic Development on Soil Heavy Metals Accumulation in a Typical Region of Yangtze River Delta. In Proceedings of the International Conference on Energy and Environment Technology (ICEET 2009), Guilin, China, 16–18 October 2009; pp. 628–631. [Google Scholar]
  75. Pal, A.; Chowdhury, U.K.; Mondal, D.; Das, B.; Nayak, B.; Ghosh, A.; Maity, S.; Chakraborti, D. Arsenic Burden from Cooked Rice in the Populations of Arsenic Affected and Nonaffected Areas and Kolkata City in West-Bengal, India. Environ. Sci. Technol. 2009, 43, 3349–3355. [Google Scholar] [CrossRef]
  76. Wang, L.P.; Wang, X.; Wang, D.Y.; Qi, B.S.; Zheng, S.F.; Liu, H.J.; Luo, C.; Li, H.X.; Meng, L.H.; Meng, X.T.; et al. Spatiotemporal Changes and Driving Factors of Cultivated Soil Organic Carbon in Northern China’s Typical Agro-Pastoral Ecotone in the Last 30 Years. Remote Sens. 2021, 13, 3607. [Google Scholar] [CrossRef]
  77. Heo, E.J.; Lee, J. Allocating CO2 emissions: A dynamic claims problem. Rev. Econ. Des. 2022. [Google Scholar] [CrossRef]
  78. Huang, Z.J.; Ding, X.A.; Sun, H.; Liu, S.Y. Analysis of Influencing Factors of CO2 Emissions from Integrated Steelworks Based on LCA. In Proceedings of the China-Materials-Research-Society Annual Meeting, Suzhou, China, 15–17 October 2009; pp. 9–16. [Google Scholar]
  79. Wang, M.; Feng, C. Analysis of energy-related CO2 emissions in China’s mining industry: Evidence and policy implications. Resour. Policy 2017, 53, 77–87. [Google Scholar] [CrossRef]
  80. Hu, C.; Han, X.; Li, Z.; Zhang, C. Comparison of CO2 emission between COREX and blast furnace iron-making system. J. Environ. Sci. 2009, 21 (Suppl. S1), S116–S120. [Google Scholar] [CrossRef]
  81. Shen, R.P.; Sun, B.; Zhao, Q.G. Spatial and temporal variability of N, P and K balances for agroecosystems in China. Pedosphere 2005, 15, 347–355. [Google Scholar]
  82. Nelson, T.; Johnson, T.; Strong, M.; Rudakewich, G. Perception of tree canopy. J. Environ. Psychol. 2001, 21, 315–324. [Google Scholar] [CrossRef] [Green Version]
  83. Townsend, J.B.; Barton, S. The impact of ancient tree form on modern landscape preferences. Urban For. Urban Green. 2018, 34, 205–216. [Google Scholar] [CrossRef]
  84. Ren, Z.B.; Fu, Y.; Dong, Y.L.; Zhang, P.; He, X.Y. Rapid urbanization and climate change significantly contribute to worsening urban human thermal comfort: A national 183-city, 26-year study in China. Urban Clim. 2022, 43, 101154. [Google Scholar] [CrossRef]
  85. Wang, Y.; Jiang, M.; Huang, Y.; Sheng, Z.; Huang, X.; Lin, W.; Chen, Q.; Li, X.; Luo, Z.; Lv, B. Physiological and Psychological Effects of Watching Videos of Different Durations Showing Urban Bamboo Forests with Varied Structures. Int. J. Environ. Res. Public Health 2020, 17, 3434. [Google Scholar] [CrossRef]
  86. Sarkar, G.K.; Debnath, A.; Chattopadhyay, A.P.; Sanyal, S.K. Depletion of Soil Potassium under Exhaustive Cropping in Inceptisol and Alfisol. Commun. Soil Sci. Plant Anal. 2014, 45, 61–72. [Google Scholar] [CrossRef]
  87. Bielinis, E.; Janeczko, E.; Takayama, N.; Zawadzka, A.; Słupska, A.; Piętka, S.; Lipponen, M.; Bielinis, L. The effects of viewing a winter forest landscape with the ground and trees covered in snow on the psychological relaxation of young Finnish adults: A pilot study. PLoS ONE 2021, 16, e0244799. [Google Scholar]
  88. Shin, Y.-K.; Kim, D.J.; Jung-Choi, K.; Son, Y.-J.; Koo, J.-W.; Min, J.-A.; Chae, J.-H. Differences of psychological effects between meditative and athletic walking in a forest and gymnasium. Scand. J. For. Res. 2013, 28, 64–72. [Google Scholar] [CrossRef]
Figure 1. Spatial distribution of sampling data for the tree inventory and urban forest parks that attracted over 20 visitors per year. Elevations were investigated in stands and extended to the whole study area by spatial interpolation.
Sustainability 14 03817 g001
Figure 2. Socio-economic ranking among districts or counties of Shaoguan, South China. Differences were derived from the Statistics of Shaoguan City in 2021 for population (A), gross domestic product (GDP) (B), and built-up land area (C).
Sustainability 14 03817 g002
Figure 3. Differences of forest structure metrics among districts or counties of Shaoguan, South China. Data were obtained from an inventory in 2021 for average tree height (A), average diameter at breast height (DBH) (B), canopy density (C), and stand density (D). Error bars present standard errors above which the same lower-case letters stand for two means without a significant difference at the 0.05 level according to Duncan’s test.
Sustainability 14 03817 g003
Figure 4. Differences in forest stand soil properties among districts or counties of Shaoguan, South China. Data were obtained from an inventory in 2021 for soil total nitrogen (N) concentration (A), soil total phosphorus (P) concentration (B), soil total potassium (K) concentration (C), soil organic carbon content (D), and soil pH value (E). Error bars present standard errors above which the same lower-case letters stand for two means without a significant difference at the 0.05 level according to Duncan’s test.
Sustainability 14 03817 g004
Figure 5. Differences in heavy metal concentrations in forest stand soils among districts or counties of Shaoguan, South China. Data were obtained from an inventory in 2021 for soil arsenic (As) concentration (A), soil chromium (Cr) concentration (B), soil mercury (Hg) concentration (C), and soil lead (Pb) concentration (D). Error bars present standard errors above which the same lower-case letters stand for two means without a significant difference at the 0.05 level according to Duncan’s test.
Sustainability 14 03817 g005
Figure 6. Principal component (PC) analyses of urban forest stand characteristics and socio-economic parameters in a tree inventory for districts/counties of Shaoguan, South China. All data were sampled and investigated in 2021 for regional population, gross domestic product (GDP), municipal area (MArea), average tree height (TreeH), diameter at breast height (DBH), canopy density (CD) and total N concentration (TN), total P concentration (TP), total K concentration (TK), organic carbon content (SOC), pH value, As concentration, Cr concentration, Hg concentration, and Pb concentration in soils. Circles frame parameters that have inner relationships (either positive or negative) according to eigenvalues along the first and the second PCs (PC-1 and PC-2, respectively).
Sustainability 14 03817 g006
Figure 7. Spatial distributions of forest structure metrics in a tree inventory for forests in Shaoguan, South China in 2021 for average tree height (A), diameter at breast height (DBH) (B), and canopy density (CD) (C). Field sampling pots are mapped in the study area where the whole-area distributions were predicted by interpolations.
Sustainability 14 03817 g007
Figure 8. Spatial distributions of forest stand soil properties in a tree inventory for forests in Shaoguan, South China in 2021 for total N concentration (TN) (A), total P concentration (TP) (B), total K concentration (TK) (C), organic carbon content (SOC) (D), and pH value in soils (E). Field sampling pots are mapped in the study area where the whole-area distributions were predicted by interpolations.
Sustainability 14 03817 g008
Figure 9. Spatial distribution of heavy metal concentrations in forest stand soils in a tree inventory for forests in Shaoguan, South China in 2021 for As concentration (A), Cr concentration (B), Hg concentration (C), and Pb concentration (D) in soils. Field sampling pots are mapped in the study area where the whole-area distributions were predicted by interpolations.
Sustainability 14 03817 g009
Figure 10. Arc-link diagram of Pearson correlations on pairs of parameters among groups of variables regarding posted facial expressions (neutral, happy, and sad emotions plus positive response index (PRI) score), forest structure (average tree height (TreeH), diameter at breast height (DBH), canopy density (CD)), soil properties (total N concentration (TN), total P concentration (TP), total K concentration (TK), organic carbon content (SOC), pH value in soils), and heavy metal concentrations (As, Cr, Hg, Pb concentrations in soils). Red arcs above boxes link a pair of parameters that have a positive relationship; blue arcs below boxes link a pair of parameters that have a negative relationship.
Sustainability 14 03817 g010
Table 1. Name, location, and number of visitors in urban forest parks attracting frequent visits in Shaoguan.
No.ParkLongitudeLatitudeCounty/DistrictN
1Meiguan Gudao Scenic Area114.34°25.33°Nanxiong44
2Cherry Valley114.23°24.18°Xinfeng38
3Hat Peak114.18°25.27°Nanxiong45
4Danxia Mount113.76°25.04°Renhua75
5Yangyuan Mount113.73°25.03°Renhua43
6Nanhua Temple113.64°24.65°Qujiang33
7Qujiang People Park113.61°24.68°Qujiang23
8Shaoguan National Forest Park113.60°24.78°Zhenjiang39
9Shaoguan Furong Mt. National Mining Park113.57°24.79°Wujiang28
10Shahu Park113.56°24.81°Wujiang49
11Yunmen Temple Scenic Area113.31°24.81°Ruyuan21
Table 2. One-way analysis of variance (ANOVA) of locational variation among districts/counties regarding forest stand characteristics in Shaoguan, South China.
Stand CharacteristicsF Valuep Value
Average tree height5.64<0.0001
Average diameter at breast height2.550.0175
Canopy density3.990.0007
Stand elevation4.460.0002
Soil total nitrogen concentration0.930.5001
Soil total phosphorus concentration0.600.7747
Soil total potassium concentration4.410.0003
Soil organic carbon content0.940.4921
Soil pH value2.870.0084
Soil As concentration1.620.1375
Soil Cr concentration1.090.3789
Soil Hg concentration3.270.0034
Soil Pb concentration0.480.8691
Table 3. Facial expressional scores for neutral, happy, and sad emotions on the faces of visitors in urban forest parks attracting frequent visits in Shaoguan.
County/DistrictParkNeutral (%)Happy (%)Sad (%)PRI 1 (%)
NanxiongMeiguangudao scenic area32.20 ± 22.50 c 252.22 ± 29.62 a15.58 ± 17.56 ab36.64 ± 43.19 ab
XinfengCherry valley66.11 ± 29.66 a21.81 ± 32.23 d12.08 ± 11.80 b9.74 ± 36.83 abc
NanxiongHat peak35.94 ± 29.86 c52.66 ± 35.21 a11.40 ± 15.88 b41.25 ± 45.75 ab
RenhuaDanxia Mt.43.09 ± 27.97 bc45.56 ± 32.65 ab11.35 ± 11.74 b34.21 ± 40.31 c
RenhuaYangyuan Mt.34.07 ± 29.67 c56.19 ± 34.56 a9.74 ± 14.16 b46.45 ± 42.98 a
QujiangNanhua temple48.04 ± 25.78 bc28.91 ± 27.65 bcd23.05 ± 17.83 a5.86 ± 39.52 c
QujiangQujiang people park59.27 ± 30.56 ab23.78 ± 31.32 cd12.60 ± 13.06 b11.18 ± 38.00 abc
ZhenjiangShaoguan national forest park44.58 ± 31.15 bc43.93 ± 34.69 abc11.49 ± 12.08 b32.44 ± 41.58 abc
WujiangShaoguanfurong Mt. national mining park42.99 ± 27.90 bc44.72 ± 33.74 ab12.29 ± 14.19 b32.42 ± 43.60 bc
WujiangShahu park49.15 ± 28.99 bc39.39 ± 34.13 abcd11.46 ± 13.94 b27.93 ± 42.66 a
RuyuanYunmen temple scenic area34.72 ± 29.66 c54.55 ± 37.50 a10.74 ± 13.07 b43.81 ± 49.83 a
Note: 1 PRI, positive response index, happy score minus sad score; 2 different letters in a horizontal row indicate significant difference according to Duncan test at 0.05 level.
Publisher’s Note: MDPI stays neutral with regard to jurisdictional claims in published maps and institutional affiliations.

