Article

The Impact of Industrial Intelligence on Energy Intensity: Evidence from China

1
China-ASEAN Collaborative Innovation Center for Regional Development Co-Constructed by the Province and Ministry, Guangxi University, Nanning 530004, China
2
School of Economics & China-ASEAN Institute of Financial Cooperation, Guangxi University, Nanning 530004, China
3
School of Business Administration, South China University of Technology, Guangzhou 510641, China
4
School of Business, Guangxi University, Nanning 530004, China
*
Author to whom correspondence should be addressed.
Sustainability 2022, 14(12), 7219; https://doi.org/10.3390/su14127219
Submission received: 19 May 2022 / Revised: 8 June 2022 / Accepted: 9 June 2022 / Published: 13 June 2022
(This article belongs to the Special Issue Intelligent Mechatronic and Renewable Energy Systems)

Abstract

:
With the sustainable development of cyber-physical science and information technologies, artificial intelligence technology is becoming more and more mature and has been used widely in various walks of life. As one part of this development, industrial intelligence has been applied diffusely to improve the productivity and energy efficiency of factories and governments. Meanwhile, the social ecological environment change has also caused widespread social concern in recent years, and energy efficiency, which is related to climate change, has forced almost every country to reduce their carbon emissions for bettering environmental quality. However, there is little research that has studied this problem from the perspective of industrial robots, even though they are an indispensable part in modern industrial systems. In order to promote the development of artificial intelligence and its application in industrial fields effectively and raise the energy consumption efficiency of production, this paper investigates the impact of industrial intelligence on energy intensity in China, as it is the largest manufacturing and energy consumption country in the world, and we also hope that the experimental results in this study can guide relevant departments and governments to formulate reasonable policies to enhance the utilization efficiency of energy and improve the environmental quality synchronously. For the sake of the rigor of this research and the accuracy of the experimental results, this study explores the corresponding effect mechanisms of industrial intelligence on China’s energy intensity from 2008 to 2019 by using the classical linear regression model OLS (Ordinary Least Squares) and WLS (Weighted Least Squares) separately, which were applied in the previous studies. The results of this study reveal three major findings. The first is that it further proves that the application of artificial intelligence can indeed reduce energy intensity, and the wide applications of artificial intelligence can reduce energy intensity significantly by reducing energy consumption. Besides, the ownership structure of state-owned enterprises will have a positive impact on energy efficiency. The environmental performance of state-owned enterprises is better than that of foreign-funded and private enterprises. Finally, the models further verify the significant impact of the enterprise scale effect on energy intensity. It will bring about the improvement of economic efficiency, and the larger the enterprise, the more obvious the economies of scale effect and the lower the energy intensity.

1. Introduction

Since the first industrial revolution at the end of the 18th century, the world has experienced four industrial revolutions until now. The main energy sources of the first three industrial revolutions were coal, electricity and nuclear energy. Now, we are in the era of industry 4.0, with the rapid development of artificial intelligence. Energy 4.0 is an inherent component and driving force of industry 4.0. It is characterized by the coexistence of fossil energy power generation and new energy power generation. In this period, we pay more attention to industrial energy management, consumption detection and determining the best energy combination to strengthen the economic structure and realize economic optimization and upgrading [1,2,3]. We present the framework of the development route of the industry and energy in Figure 1.
Industrial intelligence is an application of artificial intelligence technologies in industrial fields, and it is also an advanced production technology, which combines traditional mechanical technology with modern information technology, motion control technology and robot technology, etc. It can improve production efficiency by training machines to perceive, comprehend, learn and simulate human behavior. It has been listed as the national development strategy by a lot of industrial and economic powers for the excellent promotion effects on economic growth. After the industry 4.0 strategy was first presented in Germany in 2013, the relevant policies have been issued in succession by the governments of the USA, China and Japan. The industrial robots which are applied in the automotive and electrical machinery industries have taken over at the highest rates among all industries, especially in China and Japan, where economic growth is dominated by automobile and electronic manufacturing industries [4,5]. The artificial intelligence technologies not only promote the sustainable development of specific business models [6], but they also accelerate the countries to achieve their sustainable development targets sufficiently at the macro levels, including in the industrial production field [6,7].
There is no doubt that modern industrial production has been combined with automation technologies closely, and the industrial robots have made great contributions to promoting production efficiency and national economic development [8]. According to the report of the International Federation of Robots (IFR), the aggregation of robot stocks in the world in 2019 had increased by about 85% compared with that in 2014 and reached the highest level in history, and the great majority of these robots are used in automobile and electronic production due to industry upgrades in those industrial powers within these five years [9]. From the IFR repot of 2020, it can be observed that the USA, China and Japan are the three largest robot stock economies in the world, and China ranks first among them, both in terms of robot stocks and sale volume. According to the IFR statistics, the stocks of industrial robots in China were about 800,000 sets, and the sales volume of them reached to about 6 billion dollars in 2019, both of which account for about one-third of the global market. The expansion of industrial robots in China got into rapid growth from 2012, and it has continued to maintain the first position of robot stocks in the world since 2015. All in all, the analysis above illustrates the fact that the manufacturing industries in China have developed quickly with the huge potential industrial robot market, and the demand for robots will remain strong as the increasing need for industrial transformation and upgrading progresses with the gradual weakening demographic dividend effect in this country.
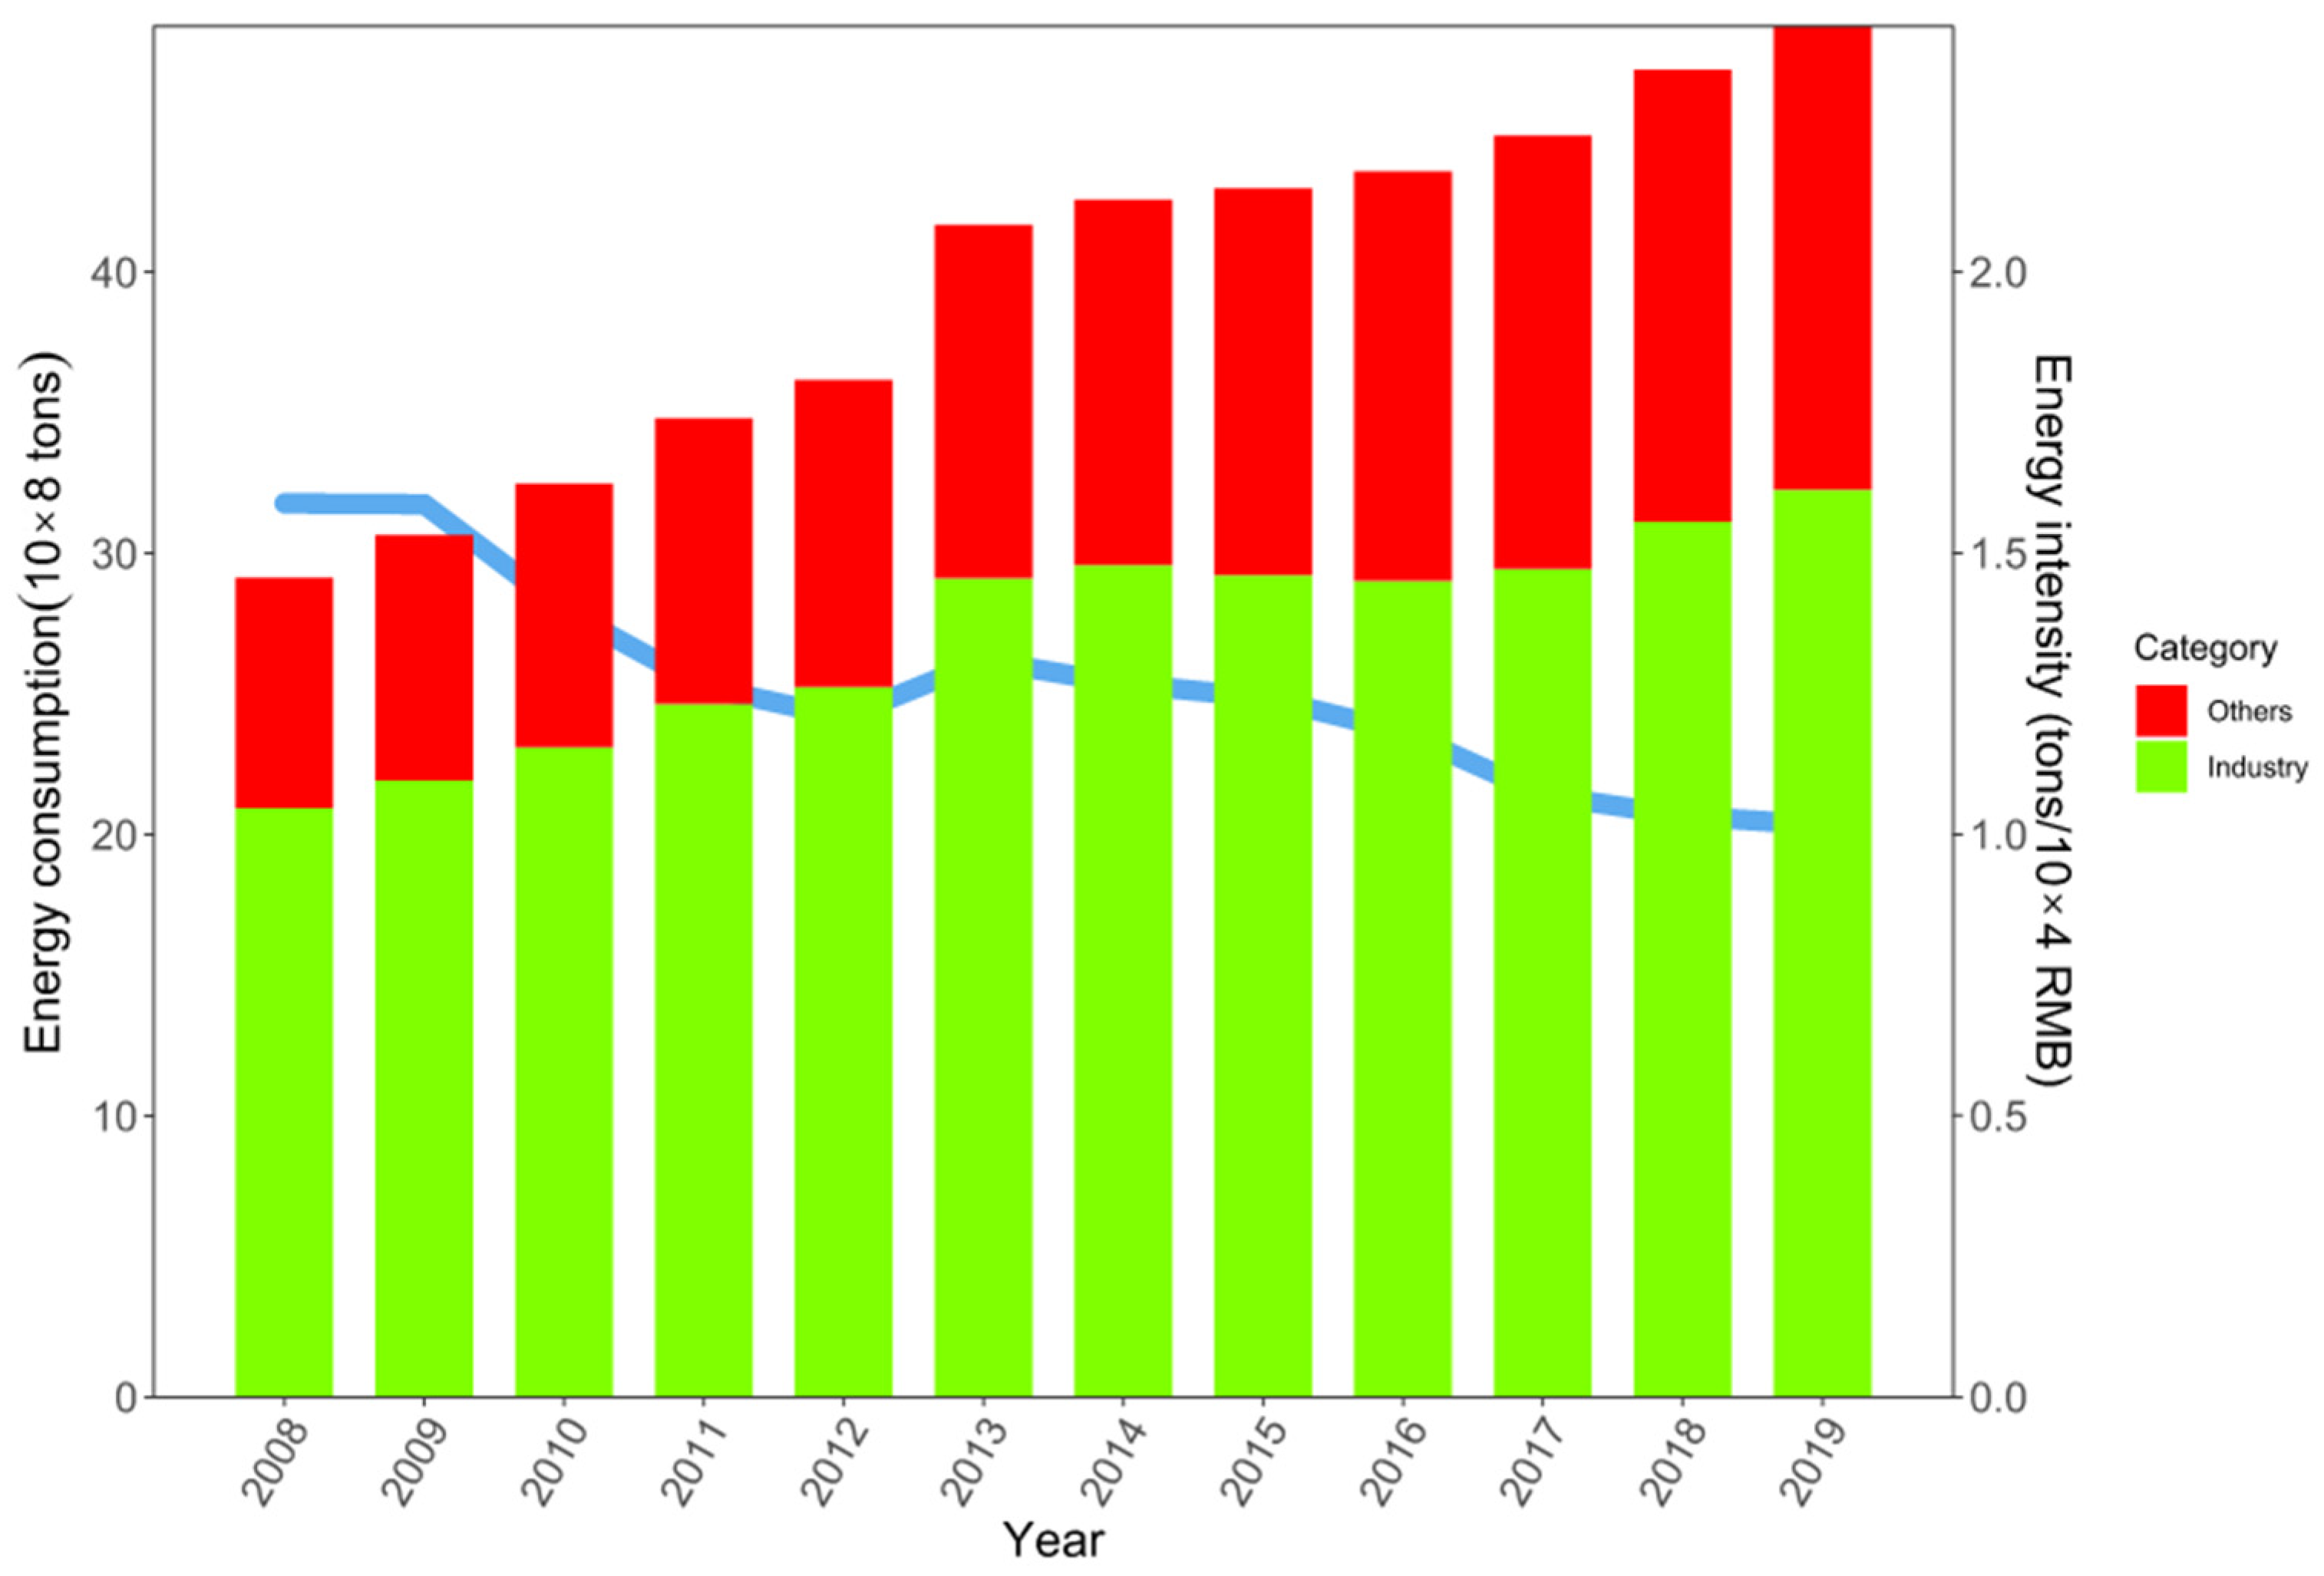
Energy is the material basis and powerful driving force for social processes and economic development, and it makes great contributions to improving the quality of life and pushing forward the process of industrialization [10]. However, many studies have pointed out that excessive energy consumption impact on climate change and environmental quality because the carbon emissions can cause the greenhouse effect and restrict sustainable economic development [11]. Hence, the contradiction between energy consumption and green development has elicited widespread attention in society due to the case of the acceleration of industrialization in developing countries in the past few decades. The investigation of Dong et al. [12] shows that China has surpassed the USA to be the largest region of energy consumption in the world since 2009. At the same time, the report of formerly British Petroleum also shows that China became the largest carbon emission producer among the three largest economic districts; the USA is the second-largest emitter, and Japan ranked fifth in 2019. Figure 2 describes energy consumption in relation to total aggregation and the industrial usage trend in China from 2008 to 2019. The definition of industrial energy intensity (EI) in this paper refers to the energy consumption value per unit of output in a country, region, department or industry in a certain period of time, and we measure it by the ratio of the energy consumption value to the total industrial GDP, which could evaluate the correlations between energy consumption and economic growth. Figure 2 illustrates this trend during that time. We could find that the intensity value in 2019 almost decreased by 40% compared with the figure of about 1.6 tons of standard coal per 10,000 RMB in 2005, but it is still slightly higher than that of the developed countries, such as the United States and Japan. In order to balance the economic growth and environmental protection problems, the Chinese government has put forward the strategy of “intelligent manufacturing and green manufacturing” in the 14th Five-Year plan, clearly to deal with increasingly prominent energy constraints and serious environmental problems by progressing intelligent manufacturing systems and robot technologies.
Compared with previous research, this study makes contributions in three aspects. First, this paper is one of the few studies to investigate the correlations between industrial robots and industrial energy intensity to discuss the relationships from the dimensions of industrial energy consumption and its intensity, which is based on the existing theories. Second, this paper studies the impact of technological innovation efficiency on industrial energy intensity from the perspective of technology output, which is measured by the number of patent applications, rather than from the perspective of input in previous literature. Third, we employ OLS and WLS testing models to verify the correlations between industrial intelligence and energy intensity, respectively, to ensure the accuracy of the results and estimate the effectiveness of the "intelligent manufacturing and green manufacturing" policy, which was proposed in the 14th Five-Year Plan in China.
The remaining structure of this research is divided into four parts. Section 2 describes the theoretical background of our study. Section 3 presents the data sources and the models that are applied in this research. Section 4 analyzes the empirical results. Finally, Section 5 sets out the main conclusions and suggestions.

2. Theoretical Background

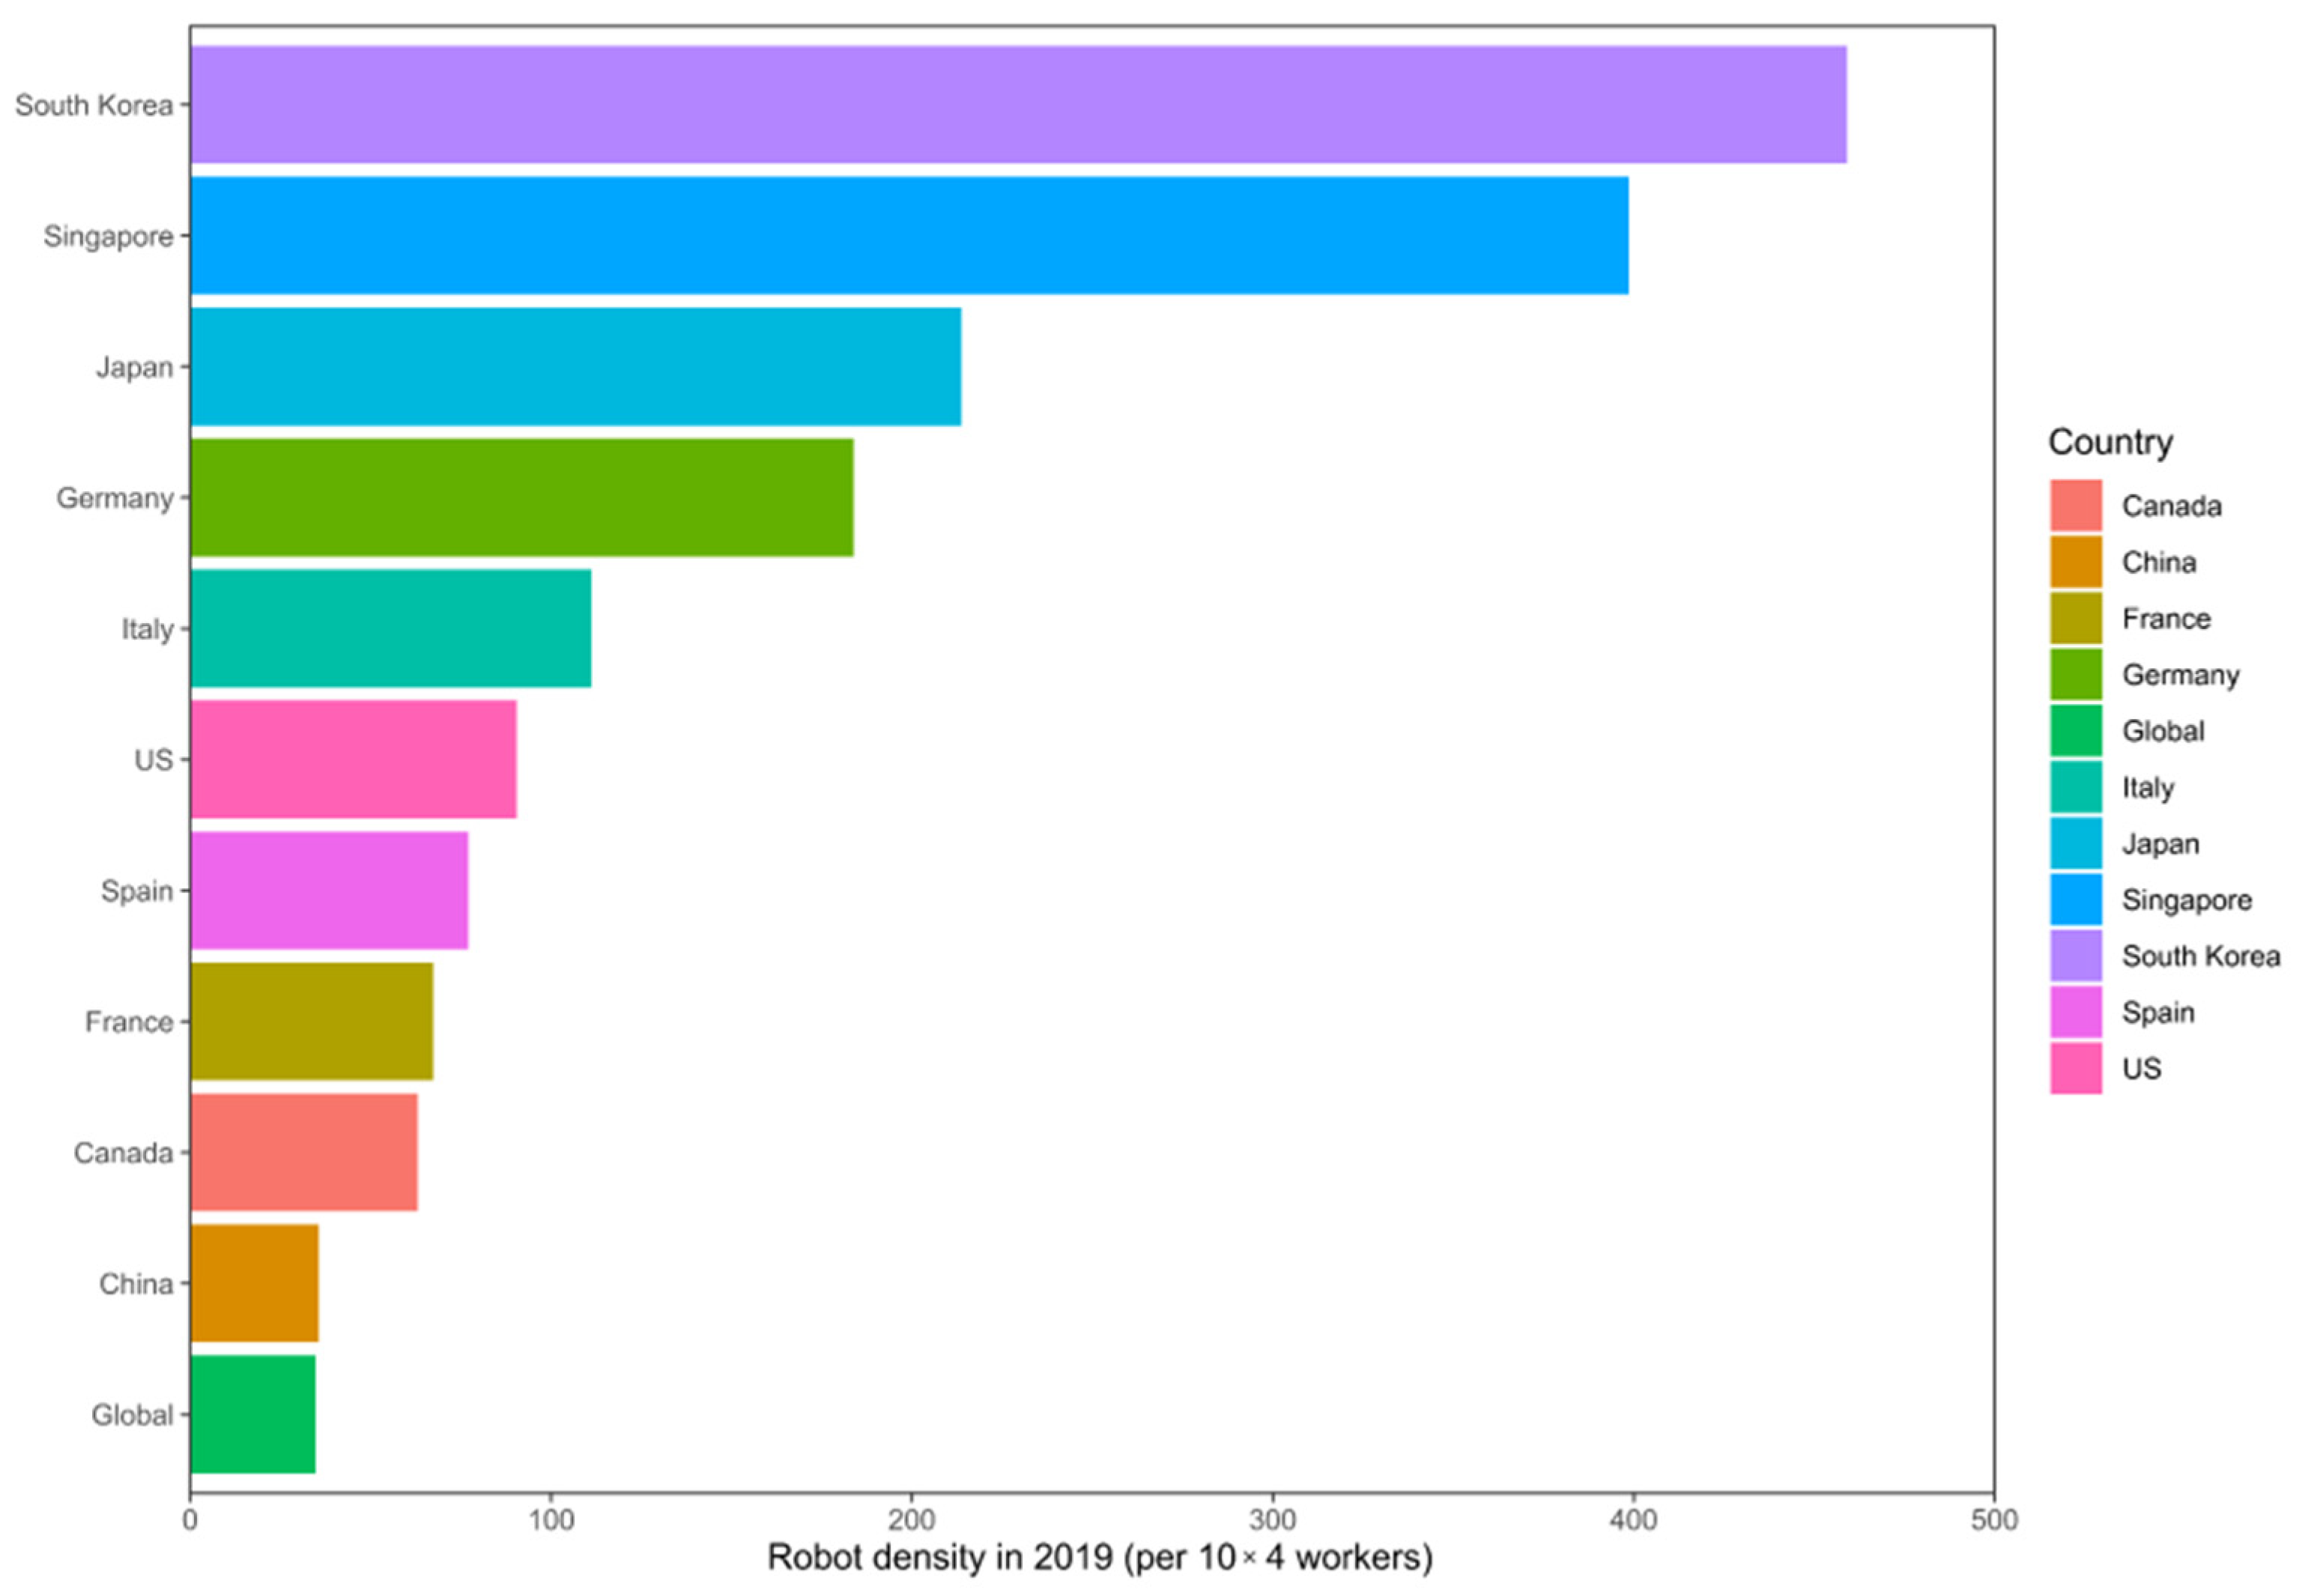
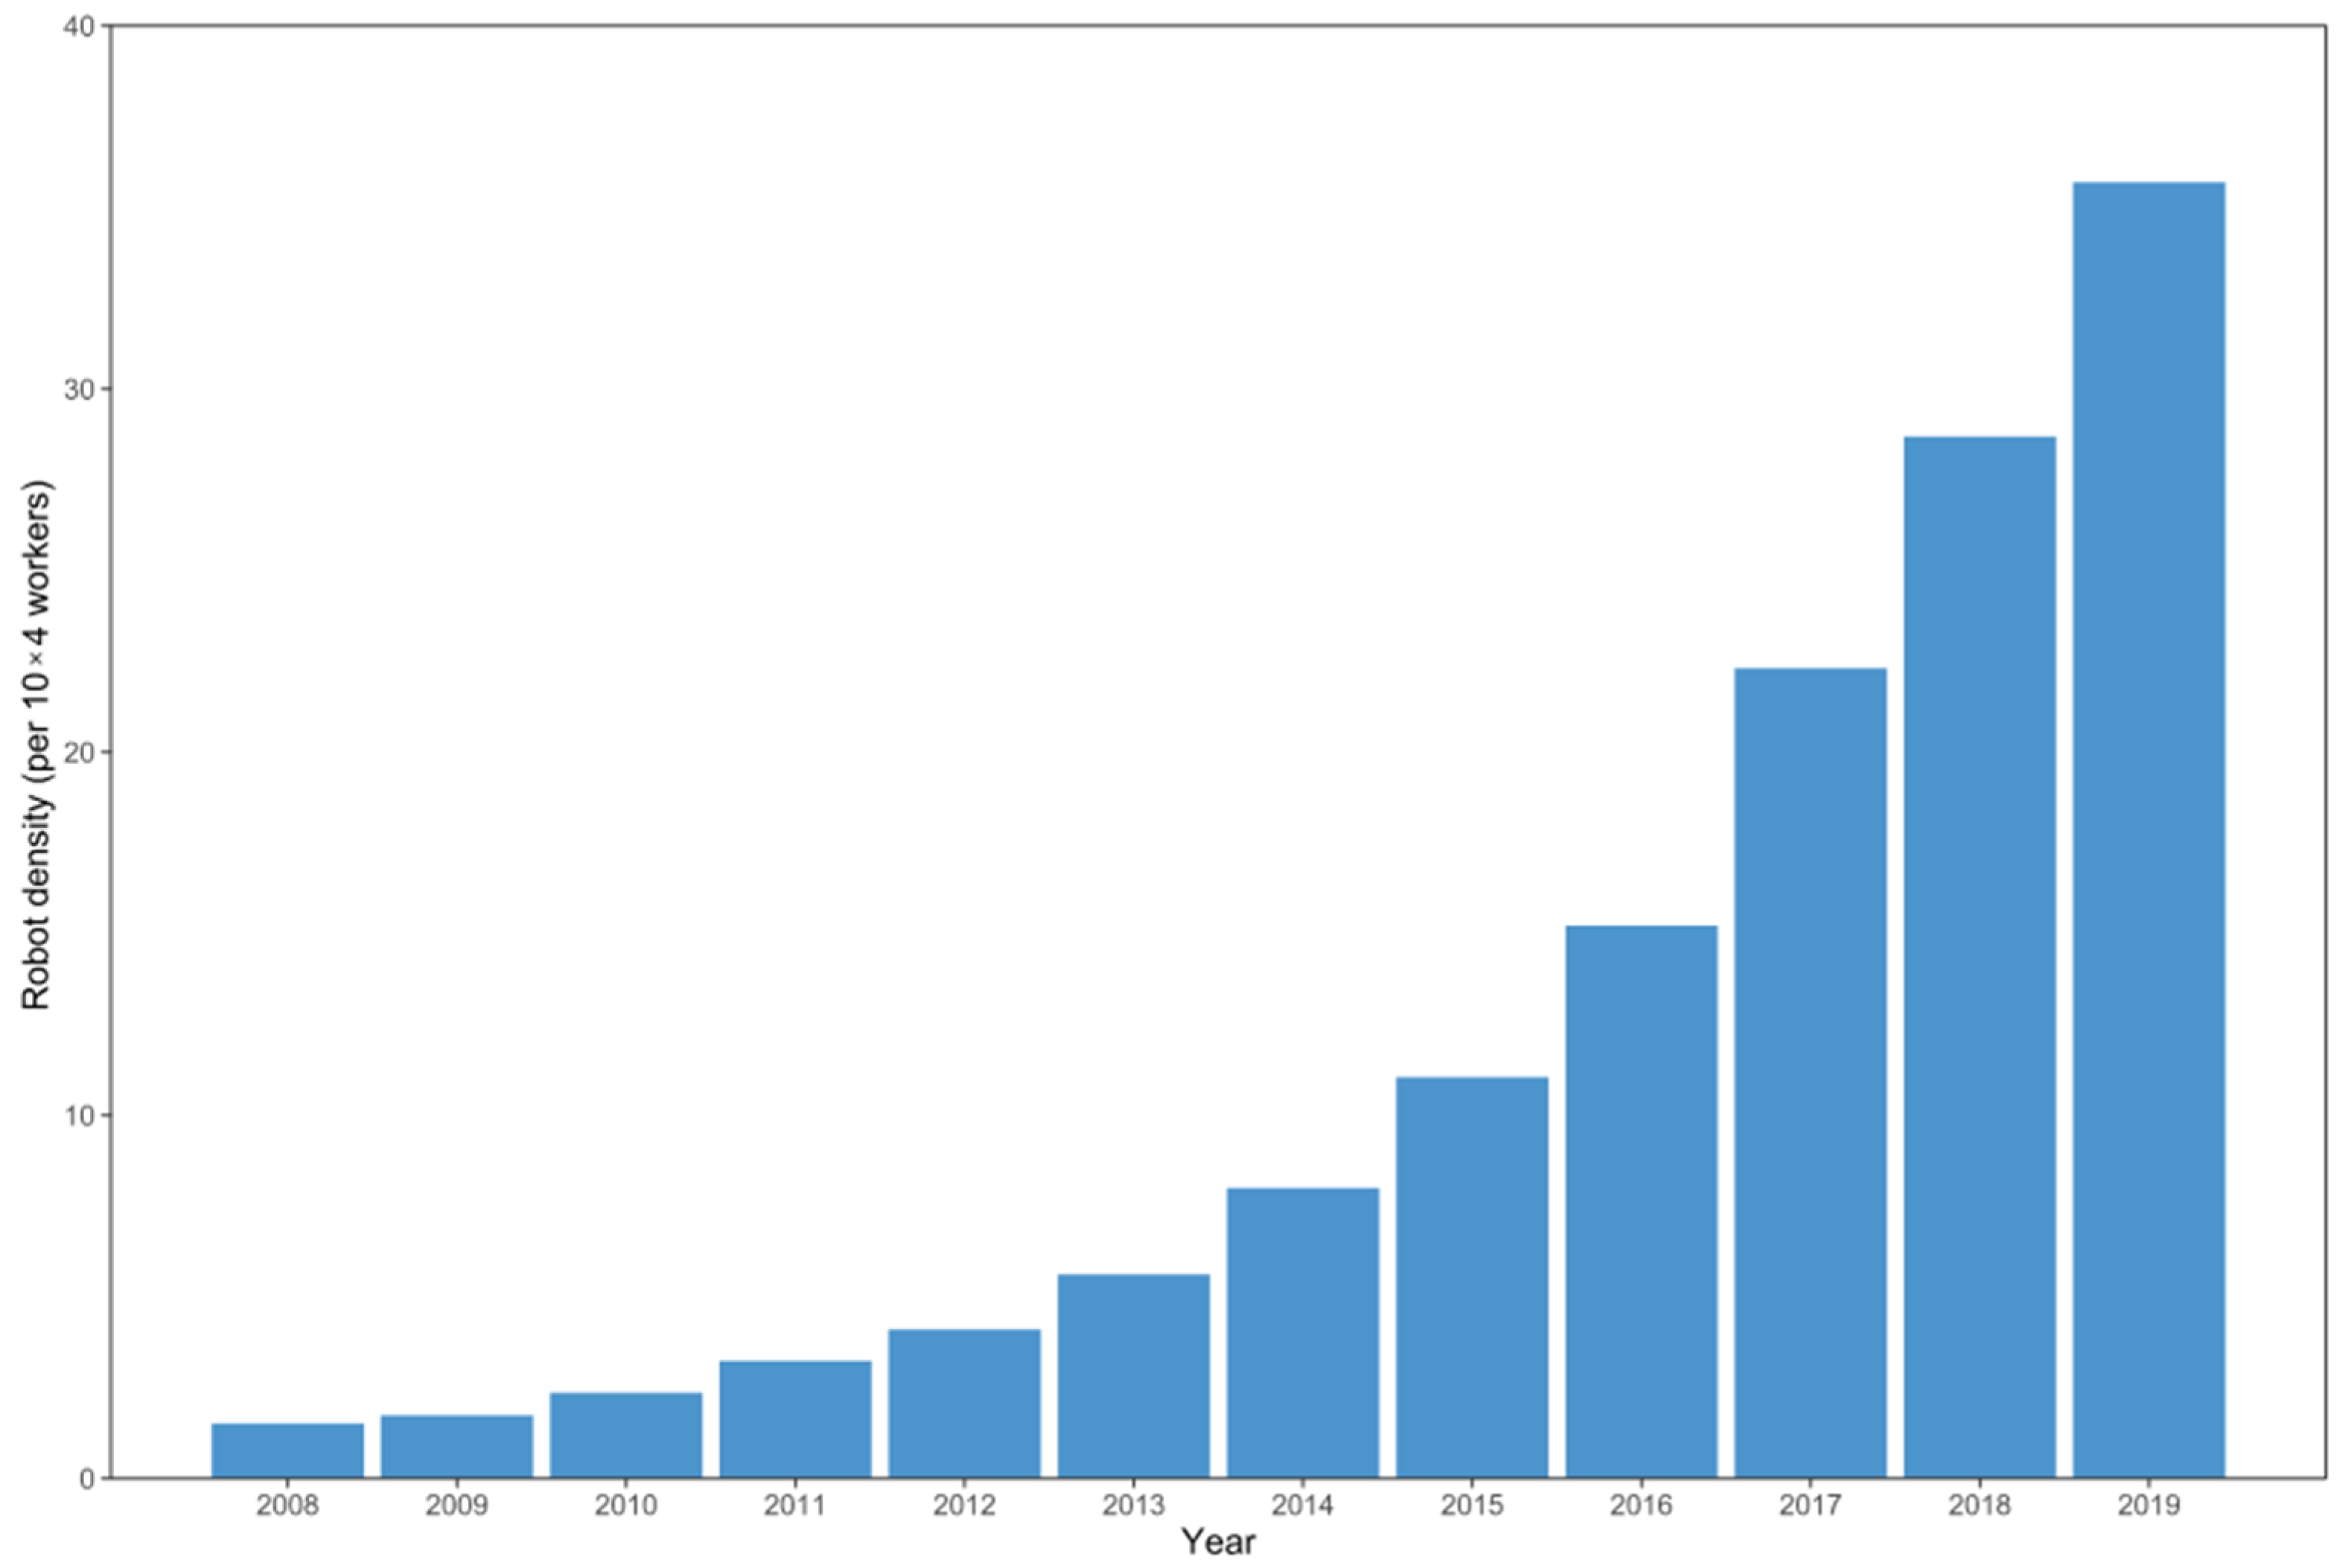
Industrial energy intensity (EI) can reflect the dependence of economic growth on energy, but it can be affected by a series of factors, including economic structure, the economic system, technical level, energy structure, population and so on. Referring to the previous studies which focus on the analysis of energy intensity, we can sort them into two directions. On one hand, some of the literature have studied the effects of technological progress on improving energy efficiency. For instance, Voigt et al. [13], Tan & Lin [14], Zhu et al. [15] and Luan et al. [16] point out that techniques and economic structures can influence the energy intensity deeply, and the energy intensity can be decreased by improving production technologies, upgrading capital equipment and changing economic structures. On the other hand, some investigations have discussed this question from the perspectives of input and output. They think that R&D (research and development) [17,18], ownership type [19], enterprise scale [20], energy price [12,21], foreign direct investment (FDI) [22], export [23], energy and industrial structure [24,25] and some other social factors can change the energy intensity in certain respects. At the same time, a lot of research that is related to industrial intelligence has verified that this advanced technology can produce achievements in economic growth [26,27], sustainable development [6,7] and technological innovation [28]. It can be found from the above investigations that although technologies can make contributions to decrease the energy intensity and although artificial intelligence can promote social sustainable development, few studies have paid attention to the impacts of industrial robotic technology on energy intensity despite the artificial intelligence technology having been applied widely. Figure 3 displays the number of industrial robots per 10,000 employees of the major countries in the world in 2019. Figure 4 illustrates the growing tendency of industrial robotic intensity in China in the past 12 years. Therefore, we take the following factors, which are indeed closely related to industrial energy intensity, into consideration in our research: R&D activity, enterprise scale, capital intensity and enterprises’ ownership structure.

2.1. R&D Activity

R&D activities (R&D) are measured by the number of patent applications in China. Cheng et al. [29] used the number of patents in the technological innovation stage as the output variable to estimate the influence of technological factors on China’s energy intensity. Sharma et al. [18] also took patent applications as the technological innovation component in their study to evaluate the correlation between renewable energy consumption and technological process in BRICS countries. As the representative of industrial intelligent technological innovation, the intelligence level of industrial robots has been improved continuously, and this has stimulated many developed countries to introduce robots into the industrial manufacturing fields widely. Therefore, industrial robots have become a significant symbol for measuring manufacturing and scientific levels of a country. Regarding China’s energy structure, it will benefit from these technologies not only in reducing energy intensity, but also in achieving the goal of carbon neutrality by 2060, indicated through the results of previous studies, which point out that technological innovation is the core driving force of reducing energy consumption and carbon emissions by increasing the output of unit capital, the labor force, energy and other input factors [29,30].

2.2. Enterprise Scale

Enterprise scale (Scale) is measured by the value of the main business income of major industrial firms in relation to the number of them. The magnitude of energy intensity is related to the size of the enterprises closely. The research of Fisher-Vanden et al. [31], which concentrated on the four industries in China from 1999 to 2004, concluded the fact that the policies of encouraging industrial enterprises to merge, reorganize, expand scale and integrate industries to enhance the scale economies can not only bring about the improvement of production efficiency, but they can also help to reduce the energy intensity of the industry. Schleich [32] and Lin et al. [33] presented the same views that the enterprise scale index is an important factor in evaluating energy conservation, and large-scale enterprises usually have a higher energy efficiency than the small-scale ones in production and operation. Generally speaking, enterprises of a larger average size display a lower energy intensity than the small ones because of the greater investment in energy efficiency management and the higher utilization rate of energy and equipment. Figure 5 illustrates that the manufacturing industry consumes the most robots as it has the largest scale among the industries in China.

2.3. Capital Intensity

Capital intensity (Capital) is measured by the value of the total assets of major industrial firms in relation to the annual average number of employees. Capital intensity can affect the energy consumption of the industry from multiple aspects. On the one hand, Capital intensity usually affects the demand for machineries and production equipment. A higher capital intensity usually requires more equipment, and this results in a greater demand for electricity and more pollution emissions [22]. On the other hand, capital-intensive industries may be energy-intensive industries. These enterprises show a high dependence on raw materials and production power, and they need to carry out the production activities by consuming a significant amount of energy [34].

2.4. Enterprise Ownership Structure

Enterprise ownership structure (Ownership) is measured by the proportion of the assets of state-owned-holdings major industrial enterprises to the assets of total firms, which includes state-owned-holdings major industrial enterprises, private enterprises, foreign-invested enterprises and the enterprises invested in by Hong Kong, Macao and Taiwan businessmen. So far, the energy-saving policies are still intervened with by the governments in most developing countries, and many researchers have explained the results by the fact that the characteristics of internal industrial structures, such as ownership structure, can make a significant impact on energy intensity. For example, Fu [35] shared the opinion that the constraint effect of fuel intensity on profitability will be greater with the stricter government interventions and that the fuel consumption companies will strive to save fuel to avoid punishment by the local government. In this case, the government intervention mechanism can reduce the fuel consumption of enterprises (fossil fuels) and improve the enthusiasm of enterprises to save fuel. Earnhart & Lizal [19] analyzed the influence of ownership structure on the environmental performance of enterprises in the Czech Republic from 1993 to 1998 and found that the environmental performance of state-owned enterprises is better than that of others, and they also pointed out that the form of centralized ownership can improve the environmental performance remarkably. As a result, we will introduce the variable of ownership structure into our study to explore whether China’s state-owned enterprises contribute to reducing the energy intensity.

3. Methodology

3.1. Model and Variables

From the above analysis, it can be concluded that industrial energy intensity can be affected by factors such as economic structure, the economic system, technical level and energy structure, and advanced technologies, such as artificial intelligence, can help to reduce energy intensity. For the purpose of verifying the influence of industrial intelligence on China’s industrial energy intensity, we employed the aggregate industrial robot stocks in this country as the independent variable and introduced a few control variables, including R&D, Scale, Capital and Ownership, into our models, which we defined above from previous literature, and the value of energy intensity was defined as the output variable in the regression models. Referring to the studies of Graetz and Michaels [36], they introduced an OLS model to analyze the effects of industrial robots’ density on the labor market in European countries. Meanwhile, some research applied OLS or WLS models to evaluate the factors influencing the energy footprint or industrial energy intensity globally [37]. The relationship between Y and X variables is best described by a multiple regression equation [38], the normal form of which is shown in Equation (1), and many researchers have applied this classical OLS regression method to study the relationship between Y and X variables. For example, it was considered in the study of Carvalho et al. [39] that the estimation results of OLS and GMM were close to each other, and OLS estimates were more accurate. Consequently, we selected OLS and WLS regression models for our investigation, as this paper mainly makes an effort to study the correlation between artificial intelligence and energy intensity. Our regression model form was the following Equation (2):
Yt = β0 + β1 × robotst + β2 × controlst + εt
EIt = α0 + α1 × robotst + α2 × Scalet + α3 × R&Dt + α4 × Capitalt + α5 × Ownershipt + εt
where EIt is the observed variable of industrial energy intensity in China in year t, and the control variables contain R&D activity, enterprise scale, capital intensity and enterprise ownership structure, which were clarified from the previous studies and may affect the verification results, although they were not the main variables for our research purpose, and these values will change over time. We defined the number of patent applications in China as R&D activity (R&D), the average main business income of major industrial firms as enterprise scale (Scale), the value of the total assets of major industrial firms in relation to the annual average number of employees was measured as capital intensity (Capital) and the ratio of the assets of state-owned-holdings major industrial enterprises to the total enterprise assets was used as the enterprise ownership structure (Ownership). These four factors were employed as control variables for us to verify the relationship between robot stock and energy intensity. The formula (1) is the conventional form of the multiple linear regression model, and the formula (2) is the specific model which was applied to our investigation to evaluate the effects of industrial intelligence on energy intensity.
Moreover, the residual tests of the data were introduced into our study to eliminate the interference of heteroscedasticity on the OLS and WLS model results. According to the theoretical hypothesis, the stability of the model should be based on the rules of zero mean error and the same variance. The hypothesis will be held when the observed residual values are an irregular scattered distribution, with the zero axis as the average level. At the same time, the normal distribution tests of the data, which were employed in our model, are needed before the regression verification. The data should follow a normal distribution to ensure the reliability of the experimental results. The Q–Q (Quantile–Quantile) normality tests have been applied widely to present the testing data distribution in previous studies [40], and they were also introduced into our research. The detection results of the variables used in our study are expressed in Figure 6. It can be seen from the trends that the red curves moved around the zero axis, and these proved that the residual hypothesis could be held in the graph. From the Q–Q picture, the traces of the data points almost obeyed the straight line in the plots, and this means that the variables used in robot stocks and robot density were consistent with the normal distributions. All in all, it guaranteed that we could appropriately apply the OLS and WLS regression models in our study after the above data verifications.
In addition, we introduced an appropriate instrumental variable of the robot stocks in Japan (IV) to test the variable endogeneity and examine the experimental robust stability by replacing EI with industrial electric consumption intensity (ELI) and replacing robots’ values with artificial intelligence rates (AI), respectively, to ensure the accuracy of the results. We focused on the variable endogenous test by employing the two-stage least square (2SLS) method, and we applied OLS and WLS to test the robust stability.

3.2. Data Sources

This paper concentrates on the influences of industrial robot stocks on industrial energy intensity in China, and we employed data from 2008 to 2019 to verify the correlations between them. The main data source of industrial robots was employed from the International Federation of Robotics (IFR), which contains robotic information from many relevant robot organizations, such as the Robotic Industries Association (RIA) in the USA, the Chinese Robot Industry Alliance (CRIA) in China, the Japanese Robot Association (JARA) in Japan, etc. It is easy to notice the increasing trend of robot adoptions globally from the data of recent years in the IFR 2020 report, and China ranks first with the largest robot stocks in the world. Furthermore, most of these robots are widely applied in manufacturing industries, such as the automotive, electronics and machinery industries. The IFR reported that the total industrial robots stock was almost about three million units in the world in 2019, and it increased by two-fold within these 10 years compared with that in 2008, and the amount of stock in China maintained a sustained increase with its economic growth, from only a 2% share of the world in 2006 up to a 27% share in 2018. The number of industrial robots used in the manufacturing industry reached 630,000 and accounted for about 80% of the total by 2019, and the automobile manufacturing industry, with the largest number of industrial robots in China, absorbed about 25% of them, while there were only 72 industrial robots in the mining industry. Figure 5 describes the total industrial robot stocks and manufacturing industrial robot stocks in China from 2008 to 2019. Our second main data source was the China Statistical Yearbook. We obtained the data on the number of patent applications (R&D), the average main business income of major industrial firms (Scale), the total assets of major industrial firms in relation to the annual average number of employees (Capital), the assets of state-owned-holdings major industrial enterprises in relation to the total enterprise assets (Ownership), the rate of industrial power consumption in relation to industrial output (ELI) and the ratio of industrial robots to the number of the industrial workers (AI) from it. Table 1 presented the salient parameters and acronyms, and Table 2 presents the data that we collected from the above sources to ensure that the statistical caliber of the research was consistent.

4. Empirical Results

4.1. Industrial Energy Intensity and Industrial Robot Adoption

We focused on the impact of industrial intelligence on energy intensity to verify whether artificial intelligence can contribute to improve output and reduce energy consumption by employing the OLS regression model, and we also introduced the WLS model to conduct further investigation considering the possible existence of heteroscedasticity at the same time. It is confirmed that the verification results are relatively reliable if there is little difference between them by comparing the two verification results. Table 3 presents the empirical results of the influence of robot stocks on industrial energy intensity in China. The regression model results tell us that the significant results appeared in both OLS and WLS models, and industrial intelligence can produce negative effects on energy intensity; this means that robots can contribute to energy consumption reduction in China. The negative coefficients of the variable of robots in the results indicate that increasing the adoption of robots by one unit can lessen energy consumption by about 0.003 units in OLS model and 0.008% in WLS model. We can analyze the reasons which cause the significant and negative impacts on energy intensity from two sides. The first is that the progression of artificial intelligence can promote business model innovation and provide new opportunities to create value to increase productivity and economic growth, which has been confirmed by previous research results [27]. The second is that the applications of artificial intelligence can improve energy efficiency, expand the renewable energy market, enhance the integration of renewable energy and support the use of low-carbon energy systems, which are conducive to curb the consumption of fossil energy and achieve the goal of national sustainable development [7,41]. Although these effects, which we could see from the investigation results, are relatively slight, they really illustrate the negative and restricted effects of robots on energy consumption, and we are also confident that it will perform better. The reason is that from the IFR report, which we mentioned above, China dominated with the largest robot stocks in the past few years, especially in automobile manufacturing and electronic industries, which is the same as the industrial robotic structure in Japan, and the big disparity of robot density between them, which we present in Figure 3, implies a large space for growth in China. These traditional automation manufacturing industries are closely related to energy-intensive consumption, and it requires time for China to update its industrial structure and construct a new intelligent manufacturing system to reduce the consumption of fossil fuels. Jin et al. [42] also offers the same views, that the new manufacturing systems, including new manufacturing processes, materials technologies and product designs, can promote the transformations of traditional industries to realize energy-consumption and carbon-emission reduction. Generally speaking, the results reveal that robot adoption can cut down energy consumption to a certain extent.
Besides, the structure of enterprise ownership is one of the remarkable characteristics in China, and energy intensity is significantly affected by this on the whole. From the empirical results, we could see that an increase of one unit in enterprise size can reduce energy intensity by 0.33 units for China’s state-owned-holdings major industrial enterprises. We should note that the proportions of total assets and sales revenue of China’s state-owned holdings enterprises have shown a downward trend in the total amount in recent years, but this cannot reduce the energy intensity. This can be explicated by the following two reasons. On the one side, the form of ownership of state-owned enterprises can significantly improve environmental performance, and transforming state-owned enterprises into state-controlled ones can also attract a large number of technological investment from private capital [19]. On the other side, the Chinese government supervises the reform of state-owned enterprises to reduce the total amount and intensity of energy consumption. State-controlled industrial enterprises are supervised by the state, and it can respond to the call of national dual control actively, and they prefer to control emissions to obtain better environmental performance by resources and save fuel allocation [35]. Therefore, the government should encourage the development of enterprises and give full play to the role of the scale effect in resource distribution.
To guarantee the accuracy of the experimental results, we further continue the robust stability testing by introducing new substitution variables in the following section.

4.2. Endogenous Test

For the correctness of the experimental results, it is necessary to certify that the explanatory variables are exogenous and that there is no correlation between them and the residual terms. As one of the main tools to test the endogeneity of variables, the instrumental variable method, which is generally realized by 2SLS method, has been wide used in many studies. For example, L. Liu et al. [20] studied the influence of artificial intelligence on energy intensity and the transmission mechanism of this effect in Chinese subsectors using this testing method in this way. Graetz & Michaels [36] proved the effect of instruments which were employed in their investigation by using this method in their OLS model, which aimed to verify whether increasing robots can improve labor productivity. Theoretically, high energy intensity may also affect the decision-making of artificial intelligence development, as the increasing level of industrial intelligence can reduce energy intensity. In other words, there may be a two-way causal relationship between artificial intelligence and energy intensity, and this endogenous problem may result in biased estimation [20]. Therefore, we need to select an instrumental variable (IV) for the endogenous test to ensure the reliability of the results. We employed the robot stocks in Japan, which the IFR calculated from JARA, as the IV, and this was mainly based on the following two considerations. For one thing, Japan is one of the three largest countries, both in terms of economy and robot adoption, in the world. According to IFR statistics, the robot adoption in Japan remained the first in the world before 2015, and the development of industrial intelligence was much earlier, and the industrial robotic density was much higher than that in China. At the same time, it has more motive and power to increase industrial robots to improve the energy efficiency and reduce the energy consumption of it due to the relative lack of energy in this region. As another reason, the large number of robots are applied in manufacturing industry, especially in the automobile and electronic ones, like in China. Therefore, the robot stocks in Japan meet two requirements of the instrumental variable method: they are related to the replaced explanatory variables and not related to other variables and random error terms in the model. The 2SLS regression model is presented in the following equation (3), and the result is presented in Table 3.
EIt =a0 + a1 × IVt + a2 × Scalet + a3 × R&Dt + a4 × Capitalt + a5 × Ownershipt + εt
The result indicates that the IV coefficient in the empirical verification of the first stage was positive and significant, and this means that the development of artificial intelligence in Japan is conducive to improve the popularity of this in China. The coefficient of robots in the second stage was negative and strongly significant, illustrating the fact that the robot stocks have a significant negative impact on energy intensity. From the analysis above, we can come to the conclusion that the outcome of the 2SLS model estimation is consistent with the results of the previous analysis in Table 3.

4.3. Robust Stability Test

We have known that industrial robots are mainly driven by electricity, and most of them are mainly distributed in the manufacturing industry. Taking the automobile industry as an example, the electric consumption by industrial robots in this industry accounts for more than half of the total value, while the electric expansion by an automobile factory with a daily output of 1000 vehicles can reach hundreds of millions of kilowatt-hours a year, which is comparable to a medium-sized city. Thus, we examined the experimental robust stability by replacing energy intensity (EI) with industrial electric consumption intensity (ELI) and by replacing robots’ values with artificial intelligence rates (AI), respectively. Based on the definition of energy intensity, we defined the ratio of the amount of industrial power consumption to the industrial output value as electric intensity, and we explained the impact of robots on energy intensity indirectly by making an effort to test the effect of artificial intelligence on power energy intensity. We used the ratio of the number of robot stocks to the number of industrial employees (AI) to represent the development of artificial intelligence, and we replaced the robots variable with this value to further verify the impact of artificial intelligence on industrial energy intensity. The regression models are provided in the following Equations (4) and (5), and the results are presented in Table 4 and Table 5 separately.
ELIt = b0 + b1 × robotst + b2 × Scalet + b3 × R&Dt + b4 × Capitalt + b5 × Ownershipt + εt
EIt = c0 + c1 × AIt + c2 × Scalet + c3 × R&Dt + c4 × Capitalt + c5 × Ownershipt + εt
The empirical results of model (4) shown in the first stage of Table 4 indicate that the application of artificial intelligence has a significant negative effect on electric intensity. That is to say, artificial intelligence can significantly reduce industrial energy intensity, although production with industrial robots will consume a lot of power, and they can improve labor productivity and energy efficiency to reduce power consumption by optimizing production processes. Meanwhile, the results of (2) in Table 5 were still robust and stable when they were tested by another artificial intelligence index (AI), and this proves that the expansion of artificial intelligence can reduce China’s industrial energy intensity, which can be seen from the positive and strong significant coefficients.

5. Conclusions

Industrial intelligence has been applied diffusely to improve the productivity and energy efficiency of factories and governments with the sustainable development of the cyber-physical science and information technologies. Existing studies have proved that the application of artificial intelligence can help enterprises with energy management, consumption levels detection and determination of the best combination. Meanwhile, climate change, which is related to energy consumption, has attracted social attention towards making efforts to reduce carbon emissions for better environmental quality in recent years. There is no doubt that it is meaningful to study the correlation between robots and industrial intensity, as they are an indispensable part in modern industrial systems. In order to promote the development of artificial intelligence and its application in industry effectively and raise energy consumption efficiency at the same time, this paper employed the data of recent 11 years to investigate the influence of industrial intelligence on energy intensity in China, and the major findings are listed as follows: The first is that it further proved that the application of artificial intelligence can indeed reduce energy intensity; the wide applications of artificial intelligence can reduce energy intensity significantly by reducing energy consumption. Besides, the ownership structure of state-owned enterprises has a positive impact on energy efficiency. The environmental performance of state-owned enterprises is better than that of foreign-funded and private enterprises. This result is contrary to existing research [1], which noted that the energy efficiency of foreign-funded enterprises is higher than that of domestic enterprises when it investigated the relevant data from four developing countries, Mexico, Morocco, Côte d’Ivoire and Venezuela. Finally, the models further verified the significant impact of the enterprise-scale effect on energy intensity. It brings about an improvement of economic efficiency, and the larger the enterprise, the more obvious the economies of scale effect is and the lower the energy intensity. This is consistent with existing studies. R&D activities on energy intensity have a significant negative impact on energy intensity, and capital intensity also has a positive impact on energy intensity; this result is consistent with previous studies. Based on the above research conclusions, we propose the following policy recommendations: Firstly, the government should establish a corresponding incentive mechanism and active fiscal and tax policies to encourage enterprises to participate in basic research in the field of artificial intelligence and promote industrial enterprises to install new technologies and equipment, such as industrial robots. Secondly, we should encourage state-owned enterprises to have a continuing role in energy conservation and emission reduction, and they should further strengthen the role of artificial intelligence in energy management and energy consumption in those high-energy-consuming industries. Thirdly, the Chinese government should give financing policy support for enterprises to reduce energy consumption intensity by expanding the scales appropriately. Finally, the government should encourage enterprises to introduce new production technologies to improve production methods and technologies constantly in order to improve energy efficiency and achieve the green and sustainable economic development target by relying on technological progress to promote industrial transformation and upgrading.
Nevertheless, there are some limitations of our research. This paper employed the relevant data of overall industrial robots to prove the impact of artificial intelligence on industrial energy intensity to some certain extent, but the levels of artificial intelligence are different in different industries, such as high-energy-intensive industries and low-energy-intensive industries or robot installation high-density and low-density industries. Therefore, in the future research, we can further subdivide industries and analyze the heterogeneity of the impact of artificial intelligence on industrial energy intensity in different industries specifically.

Author Contributions

Conceptualization, X.Z.; methodology, P.L.; software, P.L.; data curation, H.Z.; writing—original draft preparation, H.Z.; writing—review and editing, H.Z.; visualization, P.L.; project administration, X.Z.; funding acquisition, X.Z. All authors have read and agreed to the published version of the manuscript.

Funding

This research was funded by the Special Research Fund of China-ASEAN Collaborative Innovation Center for Regional Development Co-constructed by the Province and Ministry and Development Program of the Ministry of Education for Changjiang Scholars and Innovative Teams (Grant No. CWZD201510).

Institutional Review Board Statement

Not applicable.

Informed Consent Statement

Not applicable.

Data Availability Statement

Not applicable.

Conflicts of Interest

The authors declare no conflict of interest.

References

  1. Eskeland, G.S.; Harrison, A.E. Moving to greener pastures? Multinationals and the pollution haven hypothesis. J. Dev. Econ. 2003, 70, 1–23. [Google Scholar] [CrossRef] [Green Version]
  2. Ghobakhloo, M. Industry 4.0, digitization, and opportunities for sustainability. J. Clean. Prod. 2019, 252, 119869. [Google Scholar] [CrossRef]
  3. Szlávik, J.; Szép, T. A Framework of Risks in the Context of Industry 4.0, Related to Sustainability. World Futur. 2022, 1–24. [Google Scholar] [CrossRef]
  4. Dekle, R. Robots and industrial labor: Evidence from Japan. J. Jpn. Int. Econ. 2020, 58, 101108. [Google Scholar] [CrossRef]
  5. Lin, B.; Wu, W.; Song, M. Industry 4.0: Driving factors and impacts on firm’s performance: An empirical study on China’s manufacturing industry. Ann. Oper. Res. 2019, 1–21. [Google Scholar] [CrossRef]
  6. Di Vaio, A.; Palladino, R.; Hassan, R.; Escobar, O. Artificial intelligence and business models in the sustainable development goals perspective: A systematic literature review. J. Bus. Res. 2020, 121, 283–314. [Google Scholar] [CrossRef]
  7. Hannan, M.; Al-Shetwi, A.Q.; Ker, P.J.; Begum, R.; Mansor, M.; Rahman, S.; Dong, Z.; Tiong, S.; Mahlia, T.I.; Muttaqi, K. Impact of renewable energy utilization and artificial intelligence in achieving sustainable development goals. Energy Rep. 2021, 7, 5359–5373. [Google Scholar] [CrossRef]
  8. Cette, G.; Devillard, A.; Spiezia, V. The contribution of robots to productivity growth in 30 OECD countries over 1975–2019. Econ. Lett. 2021, 200, 109762. [Google Scholar] [CrossRef]
  9. Guerry, M.; Bieller, S.; Mueller, C.; Kraus, W. IFR Press Conference 24th September 2020 Frankfurt. International Federation of Robotics, IFR. Available online: https://ifr.org/ifr-press-releases/news/record-2.7-million-robots-work-in-factories-around-the-globe (accessed on 5 October 2021).
  10. Pinzón, K. Dynamics between energy consumption and economic growth in Ecuador: A granger causality analysis. Econ. Anal. Policy 2018, 57, 88–101. [Google Scholar] [CrossRef] [Green Version]
  11. Chen, X.; Gong, X.; Li, D.; Zhang, J. Can information and communication technology reduce CO2 emission? A quantile regression analysis. Environ. Sci. Pollut. Res. 2019, 26, 32977–32992. [Google Scholar] [CrossRef]
  12. Dong, K.; Sun, R.; Hochman, G.; Li, H. Energy intensity and energy conservation potential in China: A regional comparison perspective. Energy 2018, 155, 782–795. [Google Scholar] [CrossRef]
  13. Voigt, S.; DE Cian, E.; Schymura, M.; Verdolini, E. Energy intensity developments in 40 major economies: Structural change or technology improvement? Energy Econ. 2014, 41, 47–62. [Google Scholar] [CrossRef] [Green Version]
  14. Tan, R.; Lin, B. What factors lead to the decline of energy intensity in China’s energy intensive industries? Energy Econ. 2018, 71, 213–221. [Google Scholar] [CrossRef]
  15. Zhu, J.; Niu, L.; Ruth, M.; Shi, L. Technological Change and Energy Efficiency in Large Chinese Firms. Ecol. Econ. 2018, 150, 241–250. [Google Scholar] [CrossRef]
  16. Luan, B.; Huang, J.; Zou, H.; Huang, C. Determining the factors driving China’s industrial energy intensity: Evidence from technological innovation sources and structural change. Sci. Total Environ. 2020, 737, 139767. [Google Scholar] [CrossRef]
  17. Macharia, K.K.; Gathiaka, J.K.; Ngui, D. Energy efficiency in the Kenyan manufacturing sector. Energy Policy 2021, 161, 112715. [Google Scholar] [CrossRef]
  18. Sharma, R.; Shahbaz, M.; Kautish, P.; Vo, X.V. Analyzing the impact of export diversification and technological innovation on renewable energy consumption: Evidences from BRICS nations. Renew. Energy 2021, 178, 1034–1045. [Google Scholar] [CrossRef]
  19. Earnhart, D.; Lizal, L. Effects of ownership and financial performance on corporate environmental performance. J. Comp. Econ. 2006, 34, 111–129. [Google Scholar] [CrossRef]
  20. Liu, L.; Yang, K.; Fujii, H.; Liu, J. Artificial intelligence and energy intensity in China’s industrial sector: Effect and transmission channel. Econ. Anal. Policy 2021, 70, 276–293. [Google Scholar] [CrossRef]
  21. Zhao, X.; Hu, S. Does market-based electricity price affect China’s energy efficiency? Energy Econ. 2020, 91, 104909. [Google Scholar]
  22. Bu, M.; Li, S.; Jiang, L. Foreign direct investment and energy intensity in China: Firm-level evidence. Energy Econ. 2019, 80, 366–376. [Google Scholar] [CrossRef]
  23. Zheng, Y.; Qi, J.; Chen, X. The effect of increasing exports on industrial energy intensity in China. Energy Policy 2011, 39, 2688–2698. [Google Scholar] [CrossRef]
  24. Fisher-Vanden, K.; Jefferson, G.H.; Liu, H.; Tao, Q. What is driving China’s decline in energy intensity? Resour. Energy Econ. 2004, 26, 77–97. [Google Scholar] [CrossRef]
  25. Shen, X.; Lin, B. Does industrial structure distortion impact the energy intensity in China? Sustain. Prod. Consum. 2020, 25, 551–562. [Google Scholar] [CrossRef]
  26. Ballestar, M.T.; Díaz-Chao, Á.; Sainz, J.; Torrent-Sellens, J. Knowledge, robots and productivity in SMEs: Explaining the second digital wave. J. Bus. Res. 2019, 108, 119–131. [Google Scholar] [CrossRef]
  27. Jung, J.H.; Lim, D.-G. Industrial robots, employment growth, and labor cost: A simultaneous equation analysis. Technol. Forecast. Soc. Change 2020, 159, 120202. [Google Scholar] [CrossRef]
  28. Liu, J.; Chang, H.; Forrest, J.Y.-L.; Yang, B. Influence of artificial intelligence on technological innovation: Evidence from the panel data of china’s manufacturing sectors. Technol. Forecast. Soc. Change 2020, 158, 120142. [Google Scholar] [CrossRef]
  29. Cheng, M.; Yang, S.; Wen, Z. The effect of technological factors on industrial energy intensity in China: New evidence from the technological diversification. Sustain. Prod. Consum. 2021, 28, 775–785. [Google Scholar] [CrossRef]
  30. Li, M.; Gao, Y.; Liu, S. China’s energy intensity change in 1997–2015: Non-vertical adjusted structural decomposition analysis based on input-output tables. Struct. Change Econ. Dyn. 2020, 53, 222–236. [Google Scholar] [CrossRef]
  31. Fisher-Vanden, K.; Hu, Y.; Jefferson, G.; Rock, M.; Toman, M. Factors influencing energy intensity in four Chinese industries. Energy J. 2016, 37, 153–178. [Google Scholar] [CrossRef]
  32. Schleich, J. Barriers to energy efficiency: A comparison across the German commercial and services sector. Ecol. Econ. 2009, 68, 2150–2159. [Google Scholar] [CrossRef]
  33. Lin, B.; Chen, Y.; Zhang, G. Impact of technological progress on China’s textile industry and future energy saving potential forecast. Energy 2018, 161, 859–869. [Google Scholar] [CrossRef]
  34. Lan, J.; Kakinaka, M.; Huang, X. Foreign Direct Investment, Human Capital and Environmental Pollution in China. Environ. Resour. Econ. 2011, 51, 255–275. [Google Scholar] [CrossRef]
  35. Fu, T. How does government intervention determine a Firm’s fuel intensity: Evidence from China. J. Clean. Prod. 2018, 196, 1522–1531. [Google Scholar] [CrossRef]
  36. Graetz, G.; Michaels, G. Robots at work. Rev. Econ. Stat. 2018, 100, 753–768. [Google Scholar] [CrossRef] [Green Version]
  37. Lan, J.; Malik, A.; Lenzen, M.; McBain, D.; Kanemoto, K. A structural decomposition analysis of global energy footprints. Appl. Energy 2016, 163, 436–451. [Google Scholar] [CrossRef]
  38. Rahnama, M.R.; Abkooh, S.S. The effect of air pollutant and built environment criteria on unhealthy days in Mashhad, Iran: Using OLS regression. Urban Clim. 2021, 37, 100836. [Google Scholar] [CrossRef]
  39. Carvalho, C.; Nechio, F.; Tristão, T. Taylor rule estimation by OLS. J. Monetary Econ. 2021, 124, 140–154. [Google Scholar] [CrossRef]
  40. Xie, Z.; Wu, R.; Wang, S. How technological progress affects the carbon emission efficiency? Evidence from national panel quantile regression. J. Clean. Prod. 2021, 307, 127133. [Google Scholar] [CrossRef]
  41. Gultekin, H.; Gürel, S.; Taspinar, R. Bicriteria scheduling of a material handling robot in an m-machine cell to minimize the energy consumption of the robot and the cycle time. Robot. Comput. Manuf. 2021, 72, 102207. [Google Scholar] [CrossRef]
  42. Jin, M.; Tang, R.; Ji, Y.; Liu, F.; Gao, L.; Huisingh, D. Impact of advanced manufacturing on sustainability: An overview of the special volume on advanced manufacturing for sustainability and low fossil carbon emissions. J. Clean. Prod. 2017, 161, 69–74. [Google Scholar] [CrossRef]
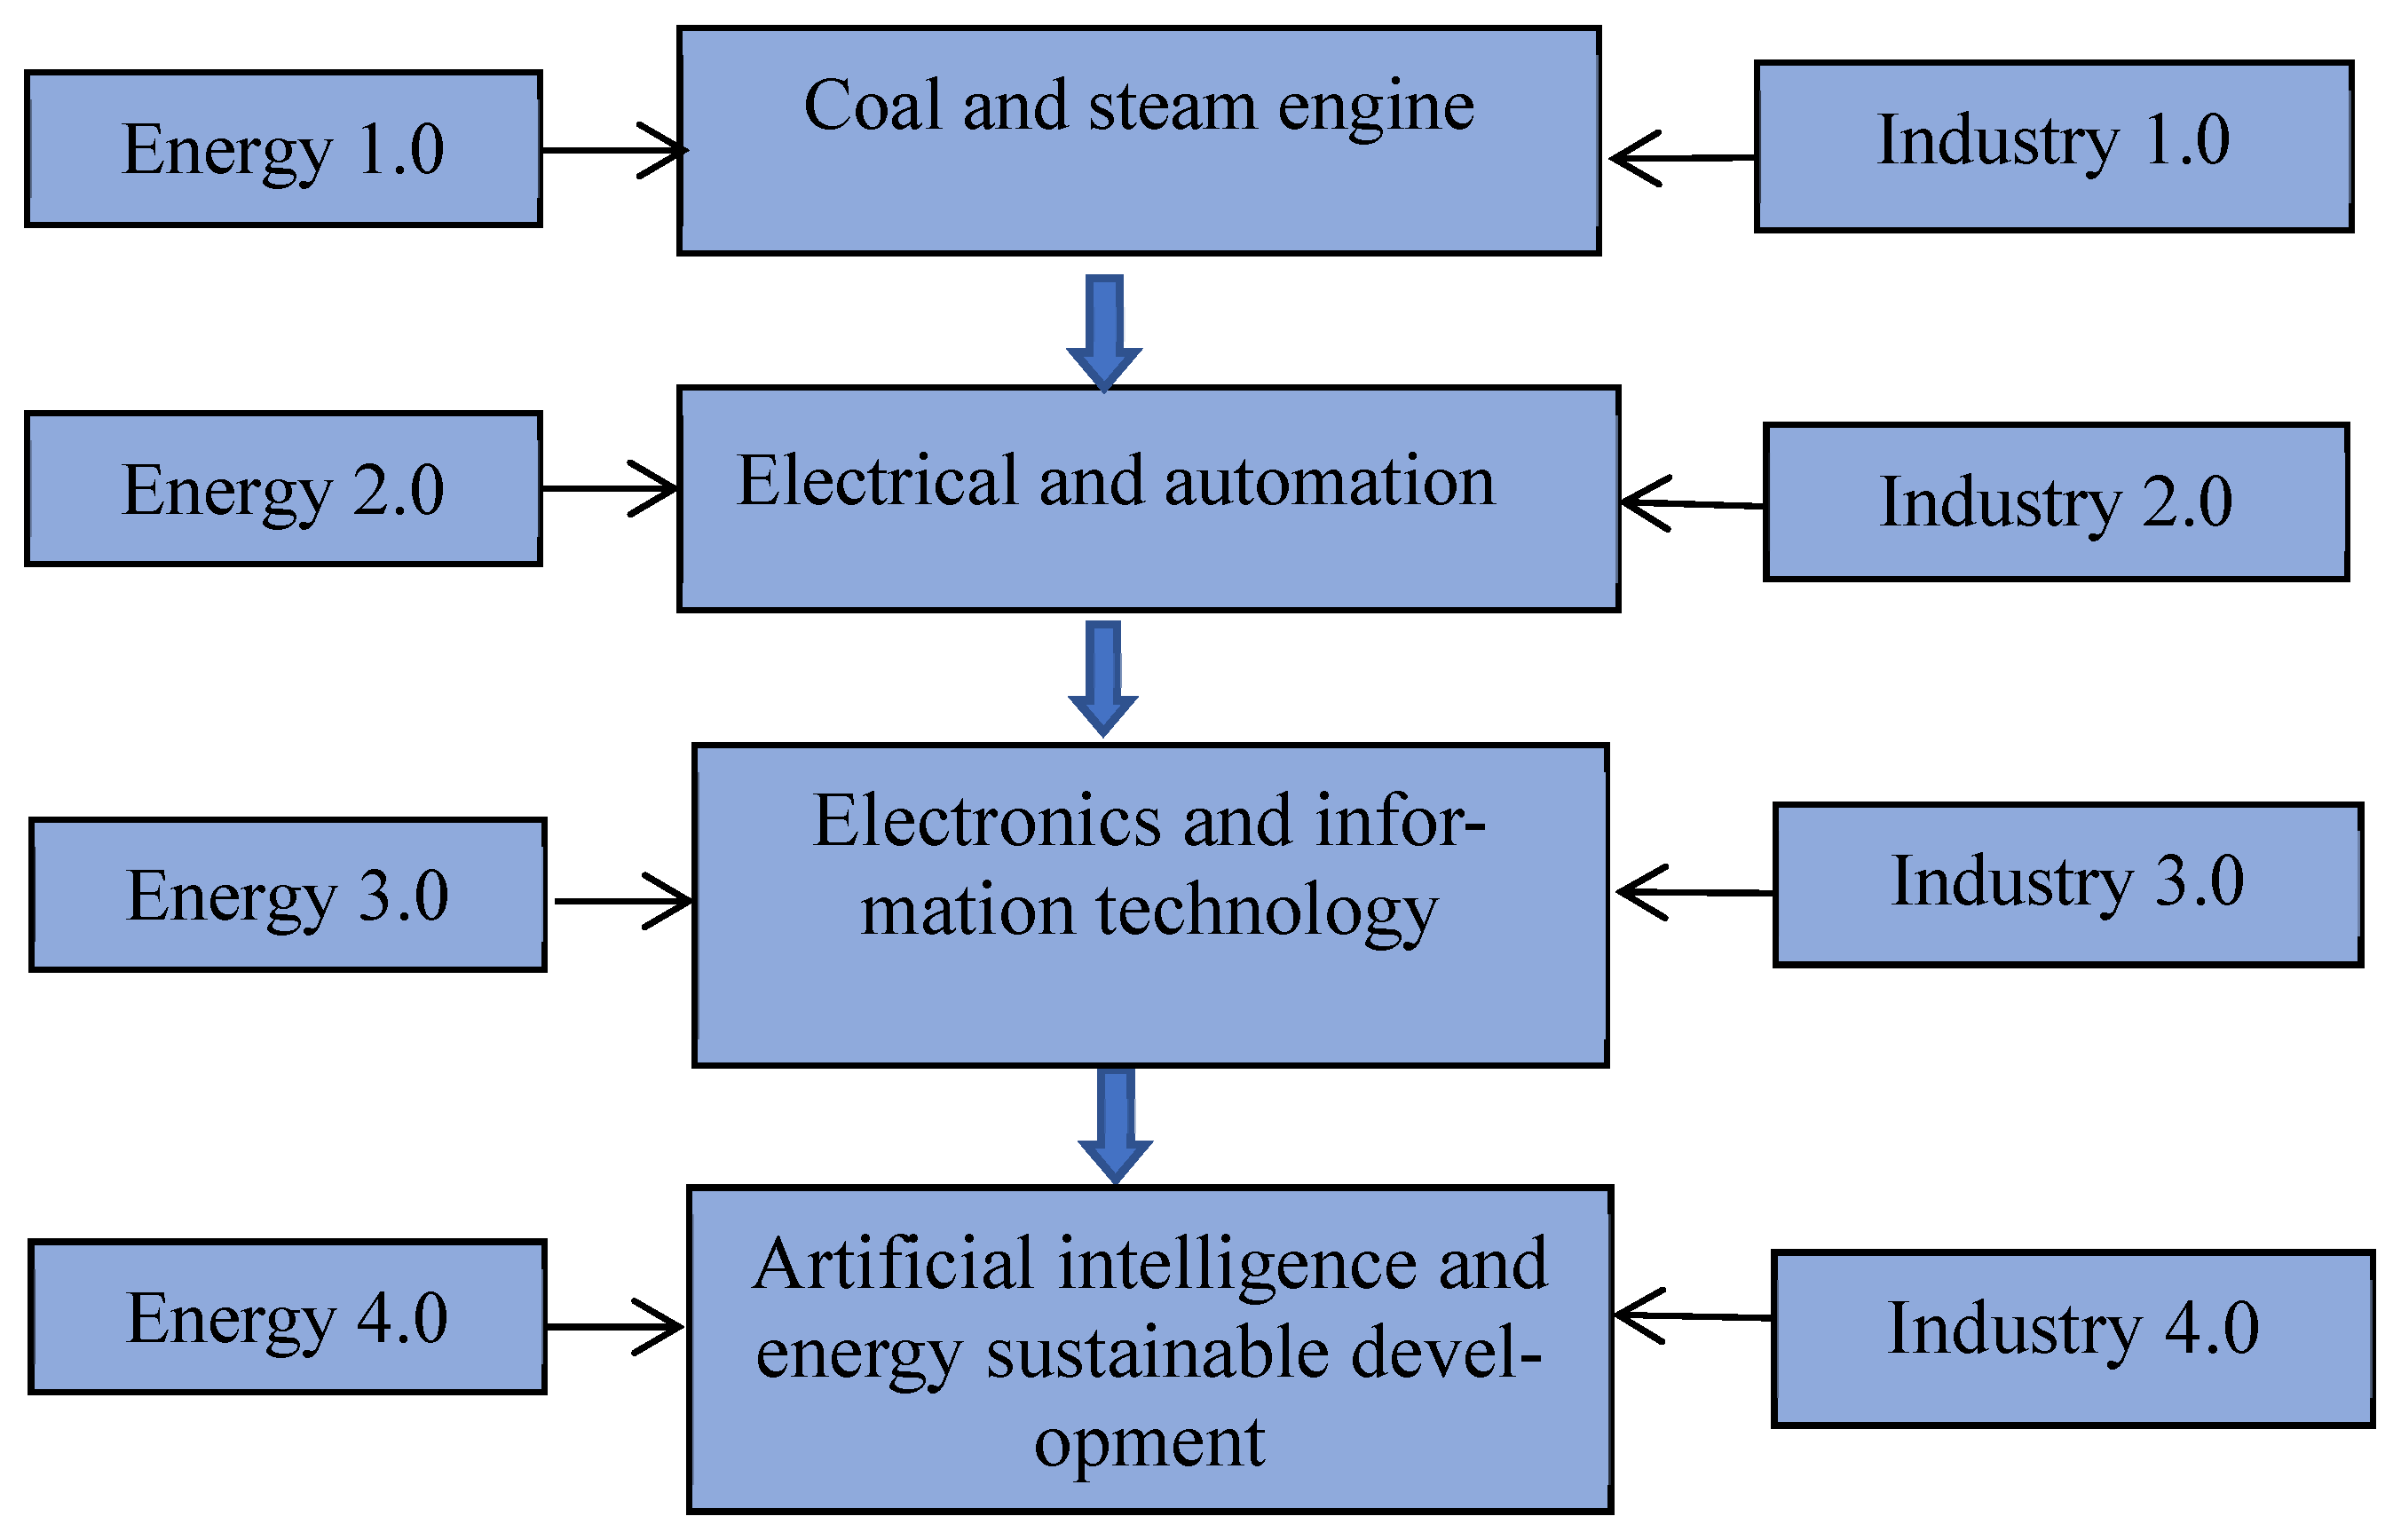
Figure 1. Framework for industrial and energy development.
Sustainability 14 07219 g001
Figure 2. China’s industrial energy consumption and energy intensity from 2008 to 2019. (Data source: China Statistical Yearbook, https://data.cnki.net/yearbook, accessed on 20 October 2021).
Sustainability 14 07219 g002
Figure 3. Industrial robotic density of the world’s major economies in 2019. (Data source: IFR and World Bank, https://www.ifre.com and https://data.worldbank.org, accessed on 20 October 2021).
Sustainability 14 07219 g003
Figure 4. Industrial robotic density in China from 2011 to 2019. (Author’s calculation).
Sustainability 14 07219 g004
Figure 5. Industrial robot stocks in China from 2008 to 2019. (Data source: IFR, https://www.ifre.com, accessed on 5 June 2021).
Sustainability 14 07219 g005
Figure 6. Normality testing graphs of variables.
Sustainability 14 07219 g006
Table 1. Salient parameters and acronyms.
VariableDefinitionVariableDefinition
Std.Dev.Standard DeviationMaxMaximum Value
Obs.ObservesMinMinimum Value
MeanMean Value of Variables_conConstant
OLSOrdinary Least SquaresR2Goodness of Fit, Coefficient of Determination
WLSWeighted Least Square FF-test OR Joint Significant Test
2SLS.Two Stage Least SquareProbProbability Value
Table 2. Descriptive statistics (2008–2019).
VariableDefinitionObs.MeanStd. Dev.MinMax
robotsIndustrial robot stock in China11281,979258,78631,787782,725
EIIndustrial energy intensity111.2520.1931.0171.589
EILIndustrial electric intensity110.1750.0110.1600.194
AIArtificial intelligence rate1132.19132.1063.59798.716
IVRobot stocks in Japan11313,62724,494286,554355,562
ScaleIncome of major industrial firms112.5540.6781.1733.061
R&DNumber of patent applications 11608,630274,597173,5731,059,808
CapitalFirm assets per employees1198.01732.81748.803152.082
OwnershipRate of assets of state-owned firms110.4860.0090.4740.501
Table 3. Industrial energy intensity and industrial robot adoption (2008–2019).
EIOLSWLS
Robots−0.002553 **−0.0082617 **
(0.022)(0.019)
Scale−0.3339558 ***−0. 3405349 ***
(0.000)(0.000)
R&D−0.0062920 *−0.0064196 **
(0.095)(0.049)
Capital0.0122092 **0.0112854 **
(0.038)(0.032)
Ownership−5.90036 *−7.527523 **
(0.076)(0.013)
(0.024)(0.004)
Notes: Estimated coefficients are accompanied by robust standard errors in parentheses. Asterisks denote statistical significance: * p <0.1; ** p <0.05; *** p <0.01, which indicate statistical significance at 10%, 5% and 1% levels, respectively.
Table 4. Endogenous test (2008–2019).
EIFirst StageSecond Stage
Robots −0.0040651 ***
(0.000)
IV1.17338 **
(0.028)
Scale−70,943.67 **−0.4100642 ***
(0.037)(0.000)
R&D−0. 0617938 **−0.0055533 **
(0.805)(0.036)
Capital9,868.284 ***0.0176571 ***
(0.004)(0.001)
Ownership3,360,842 **−3.810791 *
(0.026)(0.052)
Notes: Estimated coefficients are accompanied by robust standard errors in parentheses. Asterisks denote statistical significance: * p < 0.1; ** p < 0.05; *** p < 0.01, which indicate statistical significance at 10%, 5% and 1% levels, respectively.
Table 5. Robust stability test (2008–2019).
(1)(2)
OLSWLSOLSWLS
AI Robots−0.0009575 ***−0.0009575 ***−0.006432 ***−0.0064629 ***
(0.009)(0.009)(0.002)(0.002)
Scale−0.0225685 ***−0.0225684 ***−0.3268144 ***−0.3252669 ***
(0.001)(0.001)(0.000)(0.000)
R&D−0.0024958 **−0.0024958 **−0.00455030.0047235 *
(0.048)(0.048)(0.101)(0.094)
Capital0.0014173 **0.0014176 **0.008501 **0.0086925 **
(0.021)(0.021)(0.032)(0.032)
Ownership−0.1606798 *−0.1604305−6.500448 **−6.378903 **
(0.236)(0.239)(0.012)(0.012)
Notes: Estimated coefficients are accompanied by robust standard errors in parentheses. Asterisks denote statistical significance: * p < 0.1; ** p < 0.05; *** p < 0.01, which indicate statistical significance at 10%, 5% and 1% levels, respectively.
Publisher’s Note: MDPI stays neutral with regard to jurisdictional claims in published maps and institutional affiliations.