Article

Social Housing and Affordable Rent: The Effectiveness of Legal Thresholds of Rents in Two Italian Metropolitan Cities

1
Department of Architecture, University of Palermo, 90128 Palermo, Italy
2
Department of Civil Engineering and Architecture, University of Catania, 95125 Catania, Italy
*
Author to whom correspondence should be addressed.
Sustainability 2022, 14(12), 7172; https://doi.org/10.3390/su14127172
Submission received: 15 April 2022 / Revised: 13 May 2022 / Accepted: 9 June 2022 / Published: 11 June 2022

Abstract

:
Social housing is an instrument of housing policies to support those groups of people who are disadvantaged due to particular economic weaknesses and/or social relational fragility. Consequently, to achieve the objective of social sustainability, the rents of social housing must be below the market rents and low enough to be affordable. Italian law has set several rent thresholds which are based on local territorial agreements between landlords and renters associations. This article aims to examine whether these thresholds generate social fairness and housing affordability within each city and between different cities, or instead inequalities and spatial asymmetries. A cluster analysis is applied to study whether the goal of fairness is achieved, while the effectiveness of providing housing affordability is assessed by comparing the benchmarked rents with those of the national ministerial Real Estate Market Observatory. Two metropolitan cities—one in the north and another in the south of Italy—with different social and economic characteristics were chosen as case studies. The results show that variations in rents, location, and housing quality are fairly consistent within urban areas and cities. However, the benchmarked rents are not consistently related to the market rents and are often higher than the latter, failing to meet the provision of affordable housing that was the primary goal of the law.

1. Introduction

The purpose of social housing (SH) is to provide affordable housing to families who are having difficulty finding adequate housing for their needs at market prices, given that housing is a common good and a fundamental right [1,2,3,4].
SH is a complex multidimensional issue that concerns different fields of study (politics, sociology, ethics, economics, architecture, energy) at different scales (international, national, urban, construction) and involves several actors. Furthermore, SH can have very different characteristics with respect to its coverage in the territory, but also to the target households and the type of economic transaction.
In the literature, there are many studies dealing with housing policy instruments that can influence housing affordability and many topics concerning SH have been addressed at both the social and urban levels. From a social point of view, among the main aspects that have interested recent studies are the measurement of SH renovation programs [5] and the assessment of the social sustainability of urban regenerative actions related to SH projects, with particular attention to social cohesion and community involvement [6]. On the other hand, from an urban perspective, a great deal of research has been conducted on the energy efficiency of SH buildings, as SH providers exert a significant influence on large housing stock and thus offer several opportunities to address energy sustainability and carbon emissions [7,8]. Instead, interesting new urban perspectives have been investigated concerning the ability of public housing estate regeneration initiatives to create an “Outwards Regeneration Effect” [9]. A number of studies have recently emerged highlighting the development of housing policies for low-income citizens in the particular socio-economic systems of African or Middle Eastern countries [10,11,12].
One of the most critical SH issues, however, is the economic one, in which must be found a balance between the economic feasibility of SH projects for investors, even in the presence of public–private partnerships [13], and the housing affordability for people on low incomes or in poor conditions [14,15]. In this regard, an evaluation model has also been developed to support the decision-making process for the realization of integrated urban regeneration programs linked to SH interventions, which is focused on the search for an economic balance between the interests of all the parties involved [16]. On the other hand, some authors have investigated the issue by, for example, identifying the trade-off between urban land rent and housing affordability [17] or, more generally, by exploring SH affordability, including through the residual income approach [18,19].
However, there is a lack of study on the methodologies for appraising SH rents, so that they are fair and affordable; that is, lower than market rents. To achieve these goals, according to Italian law, the maximum SH rents must not exceed certain legal thresholds, i.e., the benchmarked rents obtained by local territorial agreements between landlord and renter associations. Based on these assumptions and in order to fill this gap in the literature, this study aims to verify whether the Italian rule of law generates social equity and housing accessibility for all potential locations of SH, or instead generates inequalities and spatial asymmetries, since in Italy, there are many different SH rents within each city and between cities. The goal of fairness is investigated, as internal consistency of the rents within local territorial agreements is verified by implementing the cluster analysis, while the effectiveness of the benchmarked rents with respect to housing affordability is assessed by comparing these rents with those of the Ministero delle Entrate’s Osservatorio del Mercato Immobiliare (OMI) [20]. The analysis is applied to two case studies, namely the Metropolitan City of Milan, in northern Italy, and the Metropolitan City of Bari, in southern Italy, which are representative of different economic, social, and territorial conditions.
The paper is structured as follows. In the next section, we provide an overview of social housing in the European Union and the United Kingdom. Section 3 explores the housing issue in Italy by describing territorial asymmetries in income, poverty, and housing finance. In Section 4, the two case studies are presented. Section 5 illustrates the methods. In Section 6, the main results of the case study are presented. A discussion of the results is provided in Section 7. Finally, some conclusions and recommendations are suggested.

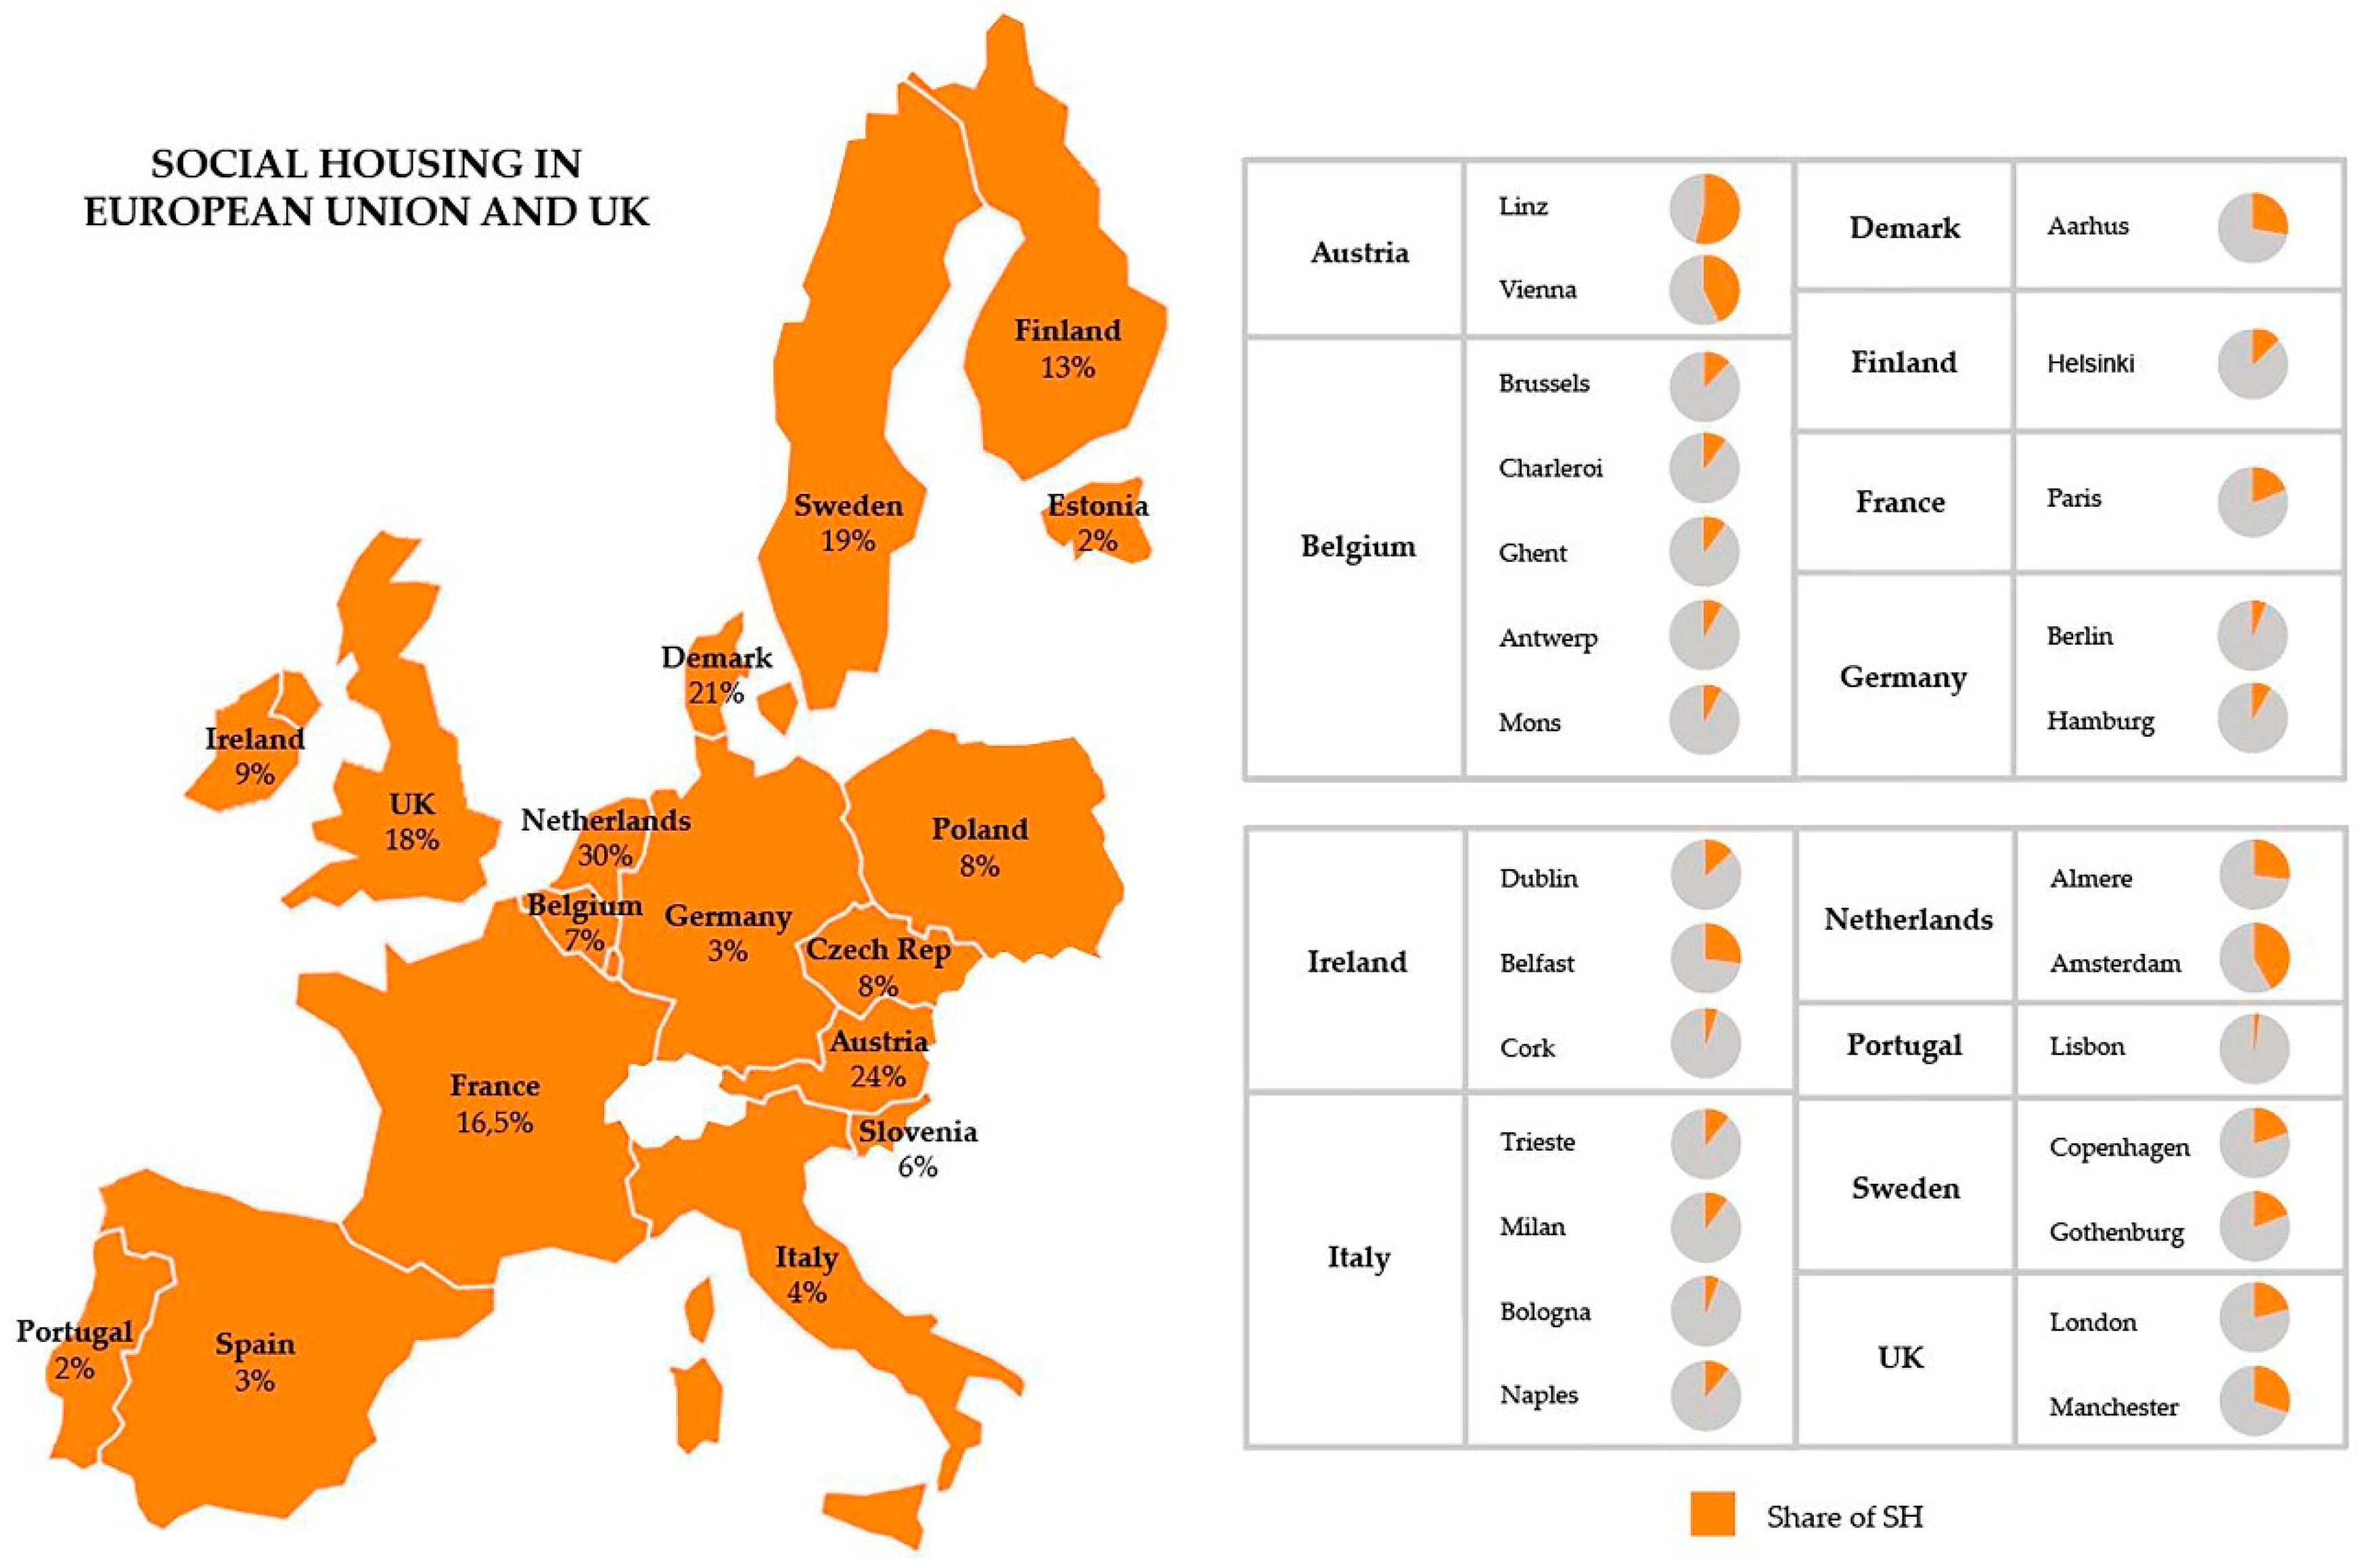
2. Social Housing in the European Union and United Kingdom

Social housing is distributed very differently across the European Union countries and the United Kingdom (Figure 1), depending on citizens’ wealth, local housing tenure, and the social policies of each country [21].
For example, the percentage of SH in the stock of residential properties varies from 30% in the Netherlands to only 2% in Portugal. In Italy, on the other hand, the average percentage is quite low at 4%. Moreover, it is worth mentioning that big cities or metropolitan areas are the places where the scarcity of affordable housing is mostly concentrated and that have to face social problems and spatial inequalities. Again, the incidences vary widely in the European countries, even among cities in the same country, with a high share in Amsterdam (NL), Manchester (UK), and Aarhus (Denmark) and the highest percentage in Linz and Vienna (Austria), at 54% and 43%, respectively [21]. Thus, it shows that there is no direct correlation between the percentage of SH in the stock of residential properties and the percentage of the population at risk of poverty in the total population. This depends on past and current social policies and the choice of tools to provide housing affordability, e.g., rental or purchase subsidies, tax exemptions, etc.
In addition, in some European countries, SH is aimed at specific social groups according to the income level or particular social conditions of fragility—such as young low-income couples or elderly people living alone—or it may be targeted at all citizens who submit an application for a housing assignment.
Because SH must meet the demand for different types of economic transactions, such as the temporary or long-term rental of housing, or the immediate/deferred purchase of the housing unit, it is consequently necessary to establish standards and thresholds to be used in appraising rents and sales prices for all required transactions. Providing public or social housing is an essential welfare action as millions of households in Europe are in need of decent housing at an affordable price and are at risk of poverty (namely, the population whose income is less than 60% of national income median equivalized disposable income).
With specific reference to the SH rental, rent appraisal has a large social and economic impact, as rental housing makes up a significant share of the housing market. In fact, in 2019, around three tenths (30.2%) of the EU-27 population lived in rented dwellings, although this share ranged from 4.2% in Romania up to 58.4% in Switzerland. According to the housing statistics by Eurostat [21], this range depends on the distribution of tenure status between landlords and tenants and is deeply embedded in the social system of every country. For instance, in Romania, there is a high percentage of homeowners (95.8%), even though it is associated with a high rate of overcrowding (46.3%), especially for the population at risk of poverty (56.4%).
In more detail, the EU-27 tenants can be sorted in two groups: those living in rented dwellings with a market-price rent or with a reduced-price rent, 21.1% and 9.1%, respectively. The latter share was very low (less than 5%) in 8 of the EU Member States, e.g., 0.8% in Netherlands and 0.9% in Sweden; by contrast, it was around one fifth in Ireland (22.3%) and Slovenia (19.3%).
In 2018, around a third of the EU-27 population were tenants with market price or in reduced rent (20.8% and 9.3%), while they were respectively 18.8% and 8.8% of the Italian population. Another critical point is the quality of housing, as the proportion of people living in an overcrowded dwelling was 17.1% in the EU-27, while it was 27.8% in Italy. Furthermore, among the people at risk of poverty, the overcrowded rates were even higher, reaching 28.9% in the EU-27 and 38% in Italy (Figure 2a) [22].
With regard to housing affordability and looking at the population whose housing costs exceeded 40 % of their equivalized disposable income, the proportion was 25.1% for tenants with market price rents and 10.2% for tenants with rent at reduced market price. These rates differ in Italy: the former was worse as it reached 29.1%, the latter was better as it was 8.3% (Figure 2b) [22].
The appraisal of SH rent must therefore take into account two conflicting objectives: the financial sustainability of the investors, i.e., the rent must be high enough to make the real estate investment feasible in comparison to the expected private and/or public return objectives; and the social sustainability of households, i.e., the rent must be significantly lower than market rents and, in any case, must be low enough to be affordable for the income level of the households.

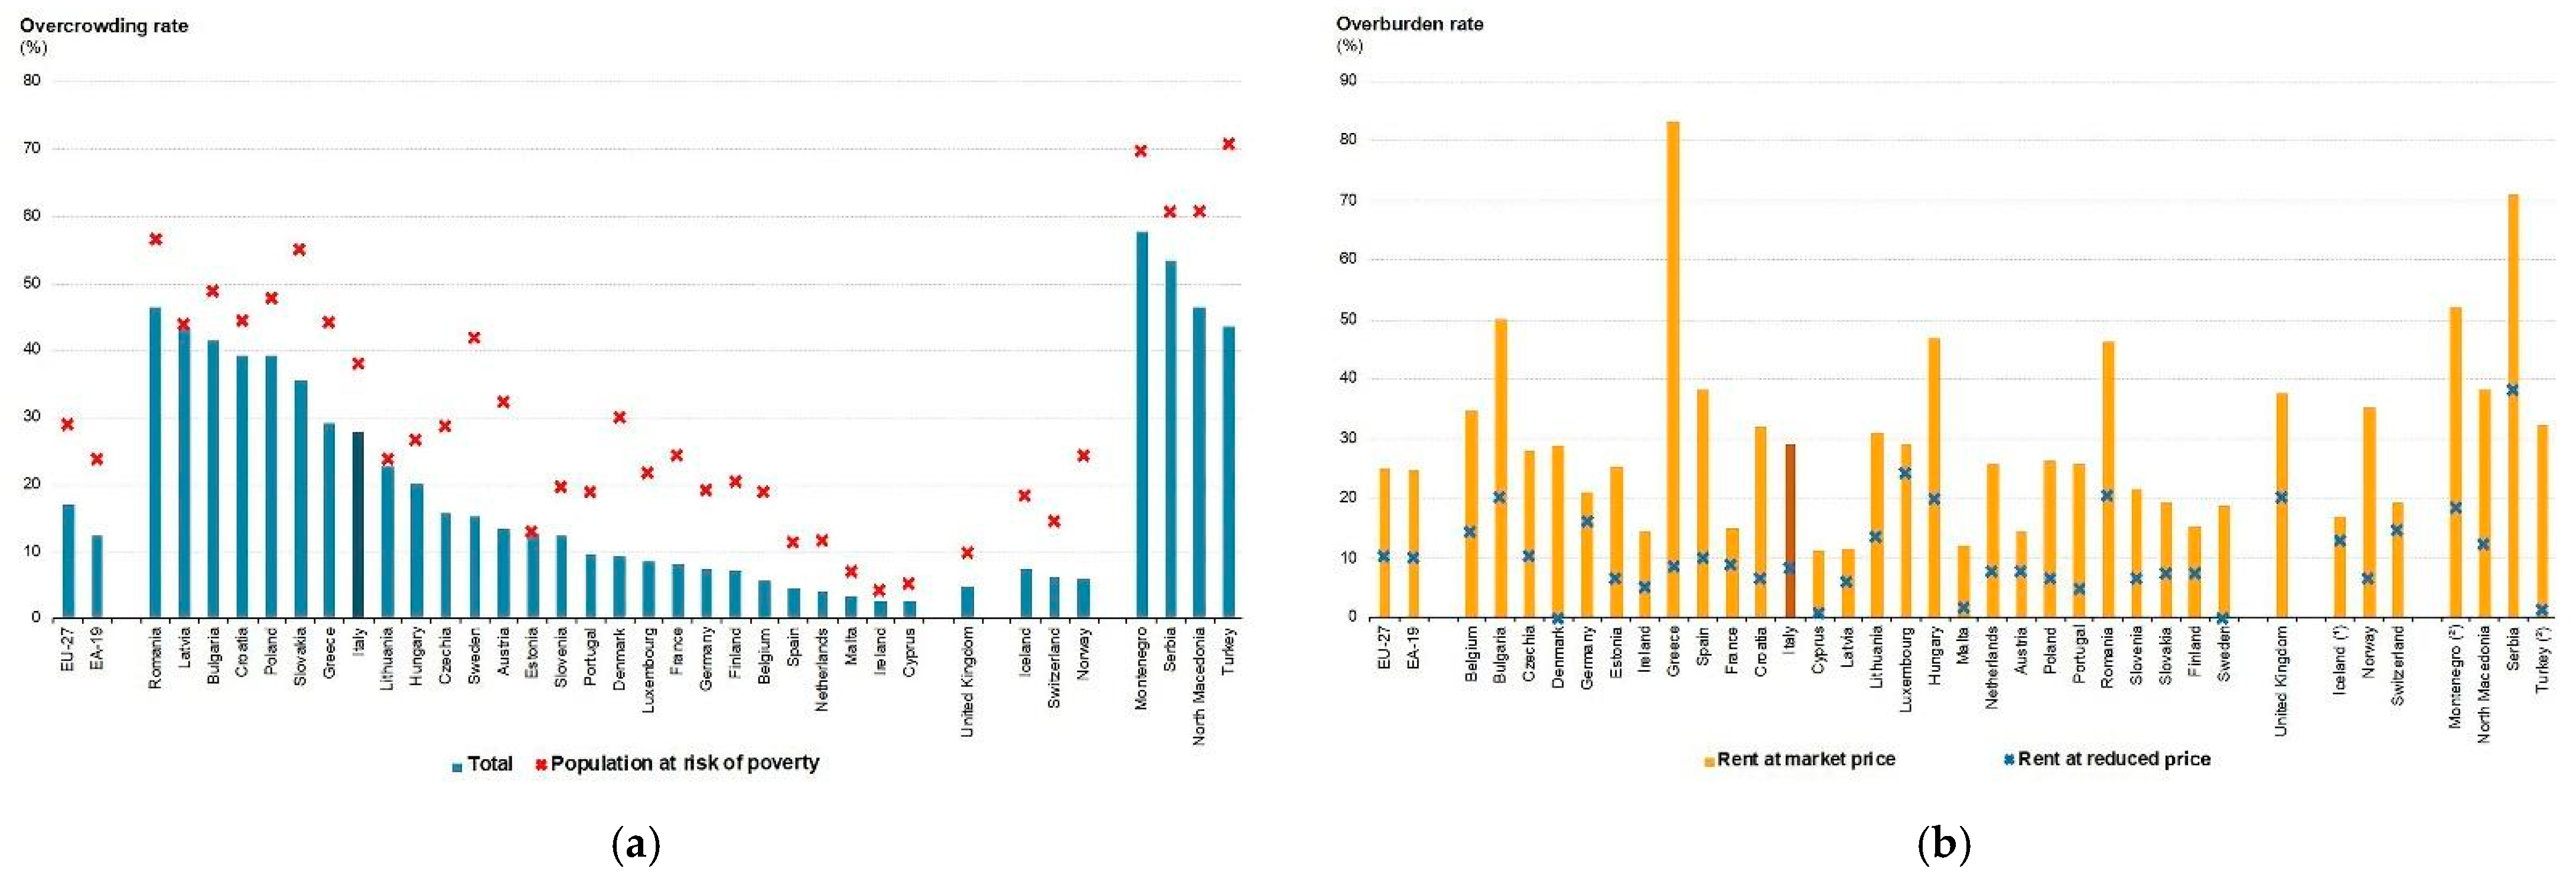
3. Housing Issue in Italy

3.1. Rules of Law and Funding of Social Housing

In Italy, social housing, known as edilizia residenziale sociale (ERS), aims at satisfying the housing demand of certain target social households, identified on the basis of their socio-economic profile or of specific conditions of vulnerability and discomfort. These households, while not being able to access the real estate market, are able to afford moderate rents or reduced purchase prices. SH is a middle ground, then, between market housing and public residential housing (ERP) which is publicly owned and intended for rental to low-income households. SH projects, therefore, provide new or renovated housing with good technological and energy-efficient features, located in redeveloped urban areas at an affordable price [23].
The social groups that can apply for SH units in Italy are:
  • low-income households, including single-parent or single-income households;
  • young low-income couples;
  • elderly people in socially or economically disadvantaged conditions;
  • commuter students;
  • households subjected to eviction;
  • other households (according to articolo 1, legge n. 9, 8 febbraio 2007); and
  • low-income legal immigrants who have resided in the country for at least ten years or at least five years in the same region.
SH projects can be financed by non-reimbursable public contributions, by private investments or by mixed public/private capital also coming from Real Estate Funds. In Italy, an important role is played by the Fondo nazionale di Investimenti per l’Abitare (FIA), managed by Cassa Depositi e Prestiti—Società di gestione del risparmio (CDPI Sgr), which was activated in 2009 by the Sistema Integrato dei Fondi immobiliari per l’housing sociale (SIF) provided in the Piano Nazionale di Edilizia Abitativa (DPCM of 16 July 2009). The function of the FIA is to facilitate, with its capital, the establishment of local real estate funds for SH projects that can be promoted by local actors (Figure 3) [24,25,26].
These real estate funds provide an important economic and social impact because they promote collaboration between public and private stakeholders and, above all, because they constitute “ethical investments” that follow objectives of social solidarity and environmental sustainability. As a result of the social aims of the projects, that is the provision of affordable housing, the expected rate of return on these real estate funds is 3% above the rate of inflation, i.e., it is a positive and low rate but is however in line with the return on long-term, low-risk real estate investments. In addition, FIA selects projects for funding not only on the basis of the quality of the buildings but also of environmental sustainability, both in terms of energy efficiency of the buildings and minimization of land consumption. In fact, priority is given to urban regeneration projects that redevelop brownfields, reuse existing buildings, and create new functional and social connections in the neighborhood.

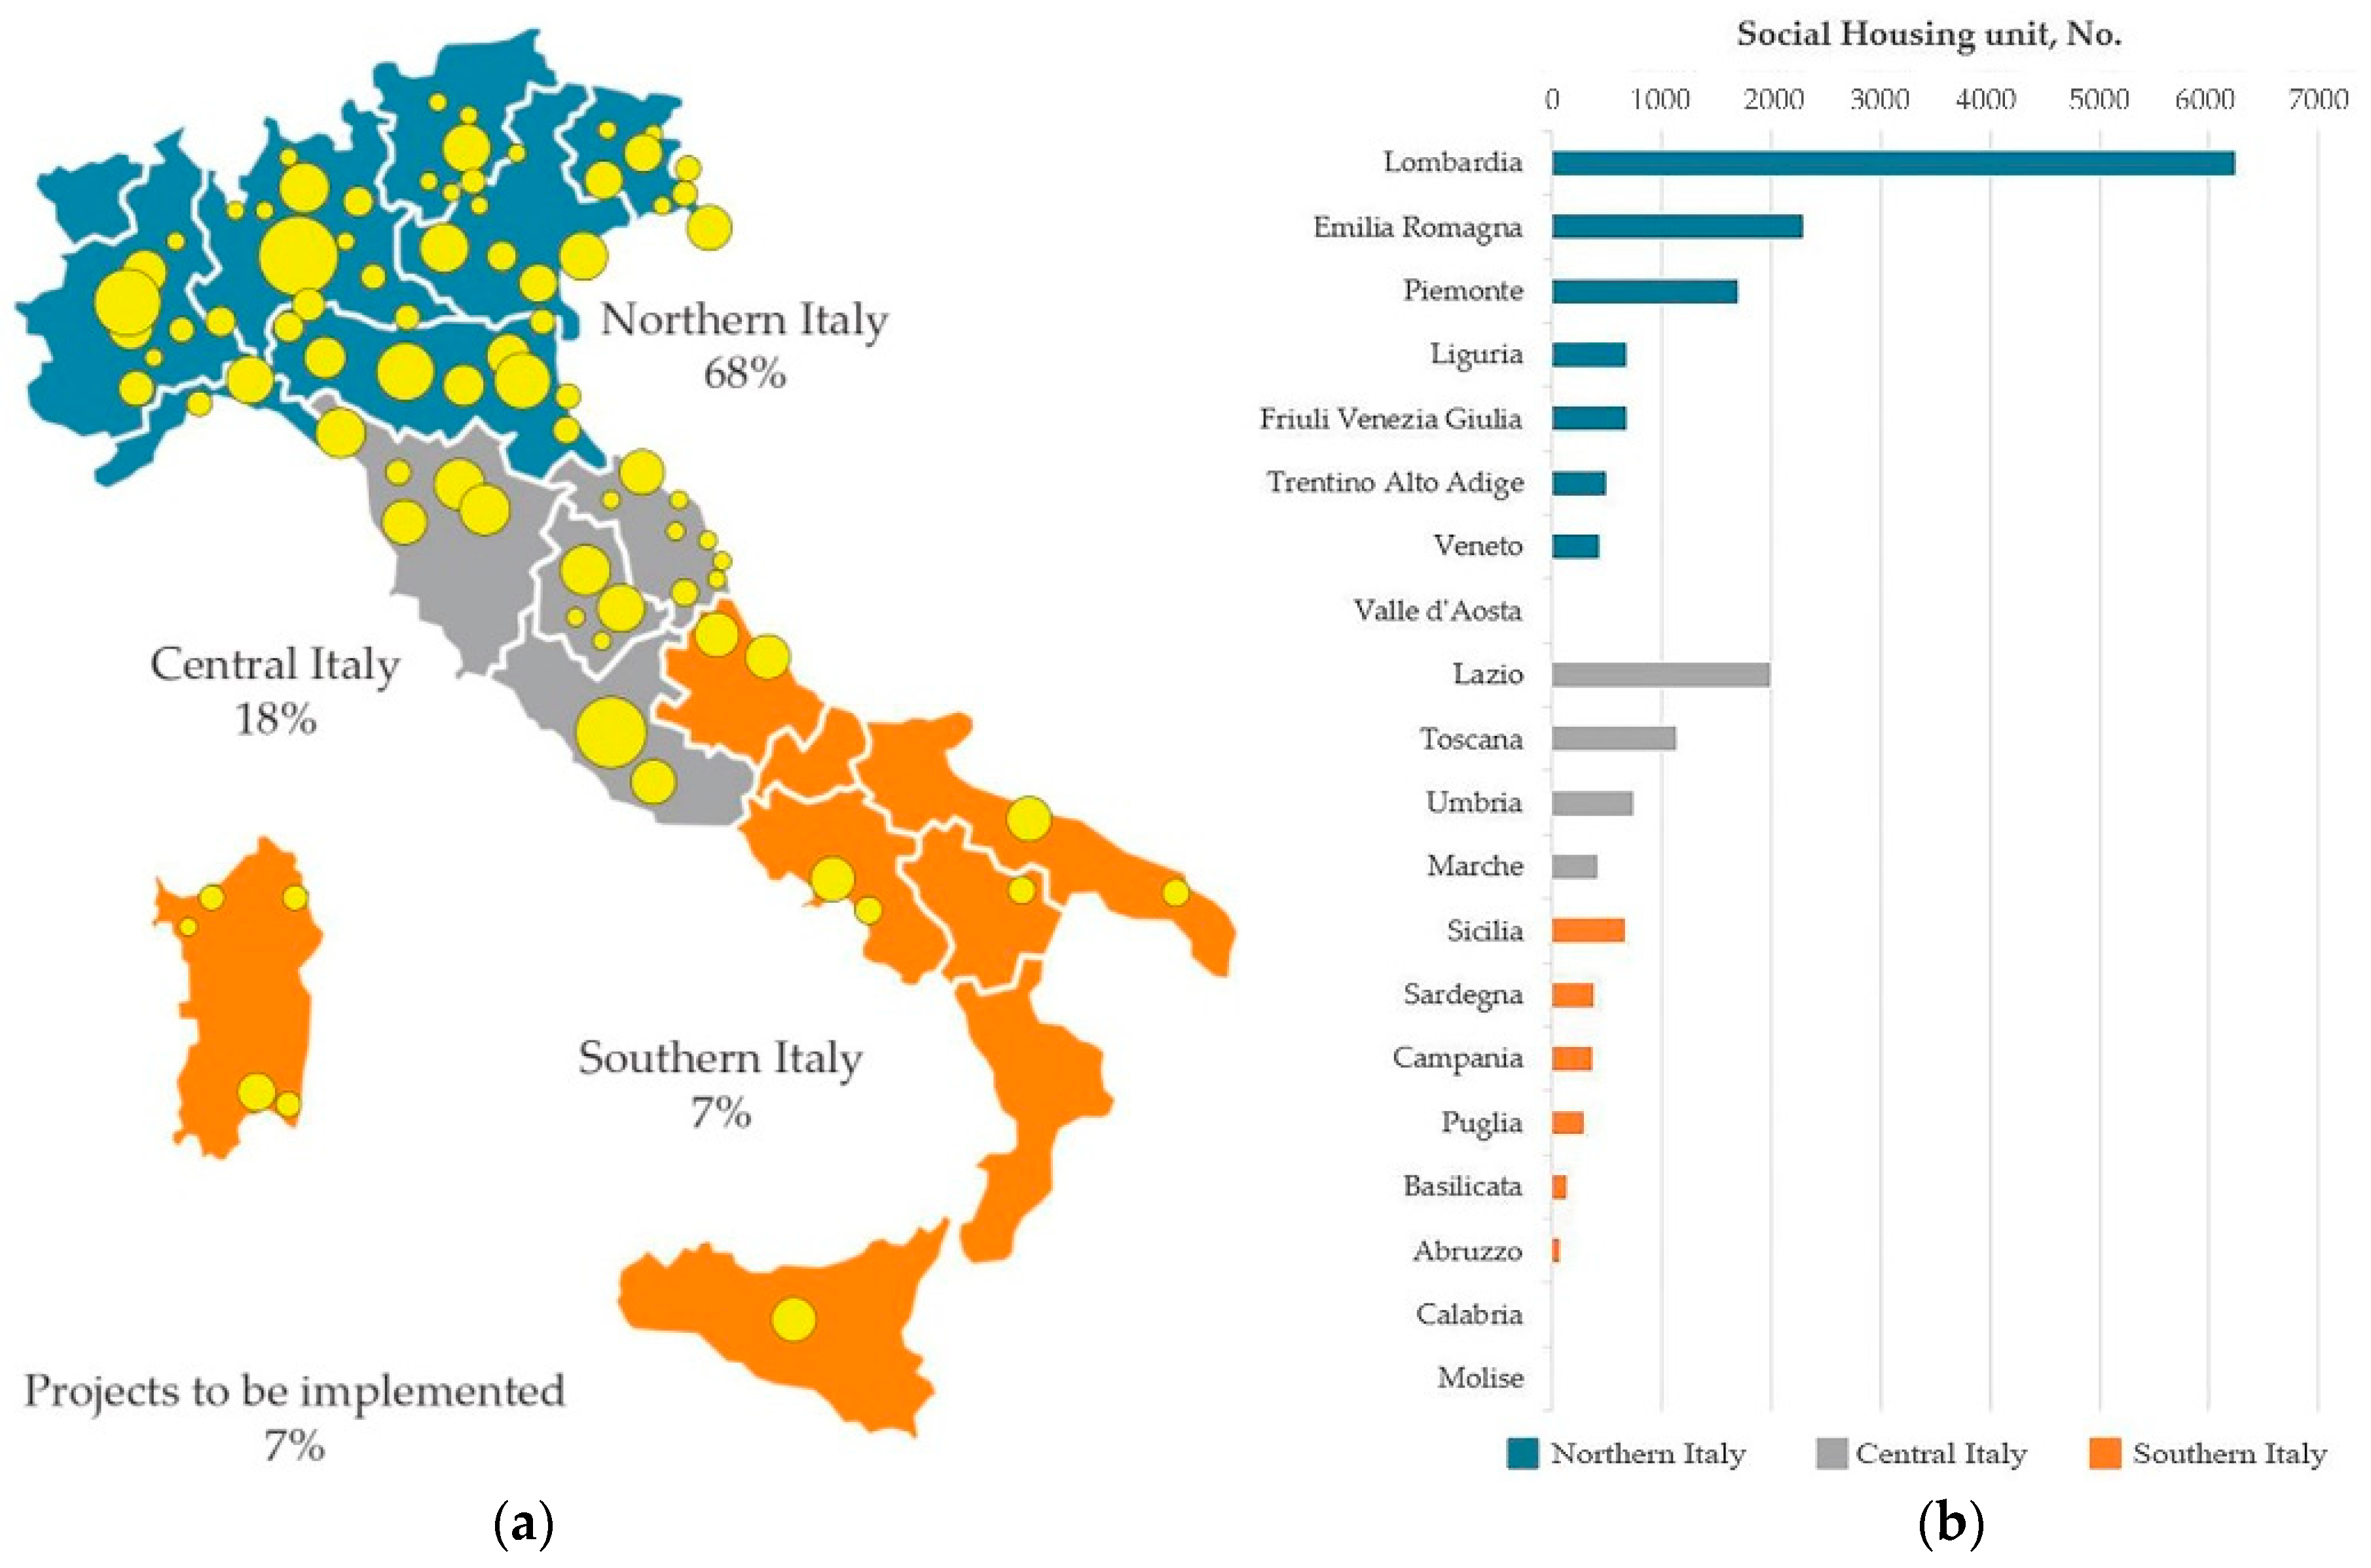
3.2. Territorial Asymmetries of Social Housing

From 2009 to 2017, FIA promoted several local real estate funds (31 deliberated funds and 27 subscribed funds) establishing a constrained investment of €1733 million in 275 initiatives and planning to invest another €619 million. These initiatives created an SH offer of about 2 million sq.m (Figure 3) and a mix of uses such as temporary housing, open market housing, commercial space, and services. In order to meet the demand of many families living in relative poverty due to the cost of market-rate housing corresponding to a high percentage of their income, an SH offer was designated in advance for rent-reduced units (65%). The percentages allocated to lease with the right of redemption and sale at reduced price are lower, at 18% and 17%, respectively, and respond to the demand of those who wanted to buy a house but had difficulty in finding suitable housing on the market at an affordable price concerning their income level (Figure 4) [24].
The construction of social housing, intended as a tool to support equalization policies, is an opportunity to rebalance social inequalities even if the SH supply is far lower than the overall demand and is not equally distributed in the Italian regions. This results in two forms of territorial asymmetries:
  • one at an inter-regional level among people living in cities where there is an existing/absent SH offer; and
  • one at an intra-urban or metropolitan level among the inhabitants of cities where there is an SH offer, as not all eligible persons are able to access SH due to the scarcity of supply.
The analysis of the distribution of SH projects makes clear the degree of territorial asymmetries between three geographical areas, northern, central, and southern Italy (Figure 5a) [27]. In fact, 68% of investments are concentrated in northern Italy, while the regions that have benefited most from the possibilities of FIA co-financing are Lombardy, Emilia-Romagna, and Piedmont [25], but also Tuscany and Lazio. These regions have a dynamic economic system and are more inclined to the adoption of innovative financial instruments and new types of real estate investment. On the other hand, FIA co-financing was used with considerable delay in southern areas, where there were few SH projects (Figure 5b).
Although Italy is a country where the percentage of households living in a house owned is rather high (68.1% in 2016 according to the Bank of Italy), 20.4% of Italian households live in rented accommodation and may have difficulties accessing housing (the remaining share of households have accommodation in different ways such as usufruct, free title, etc.) [28].
There are two areas of problematic access to housing:
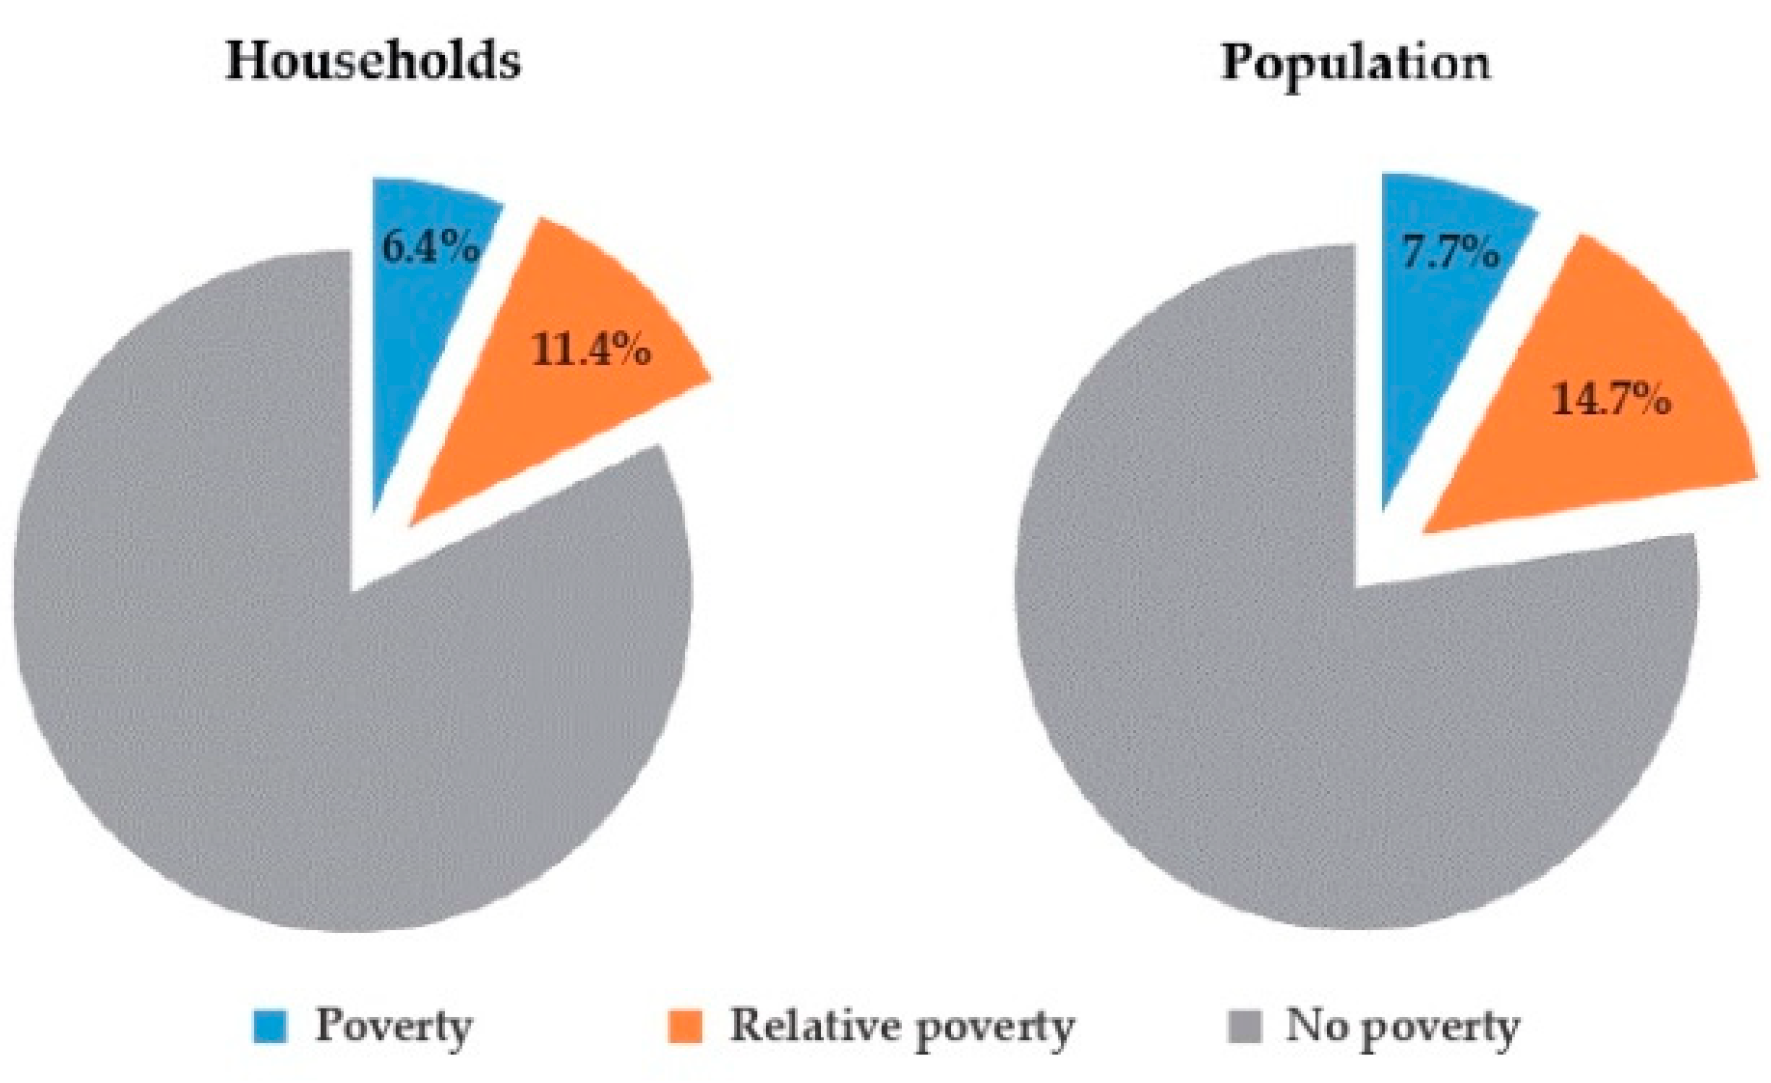
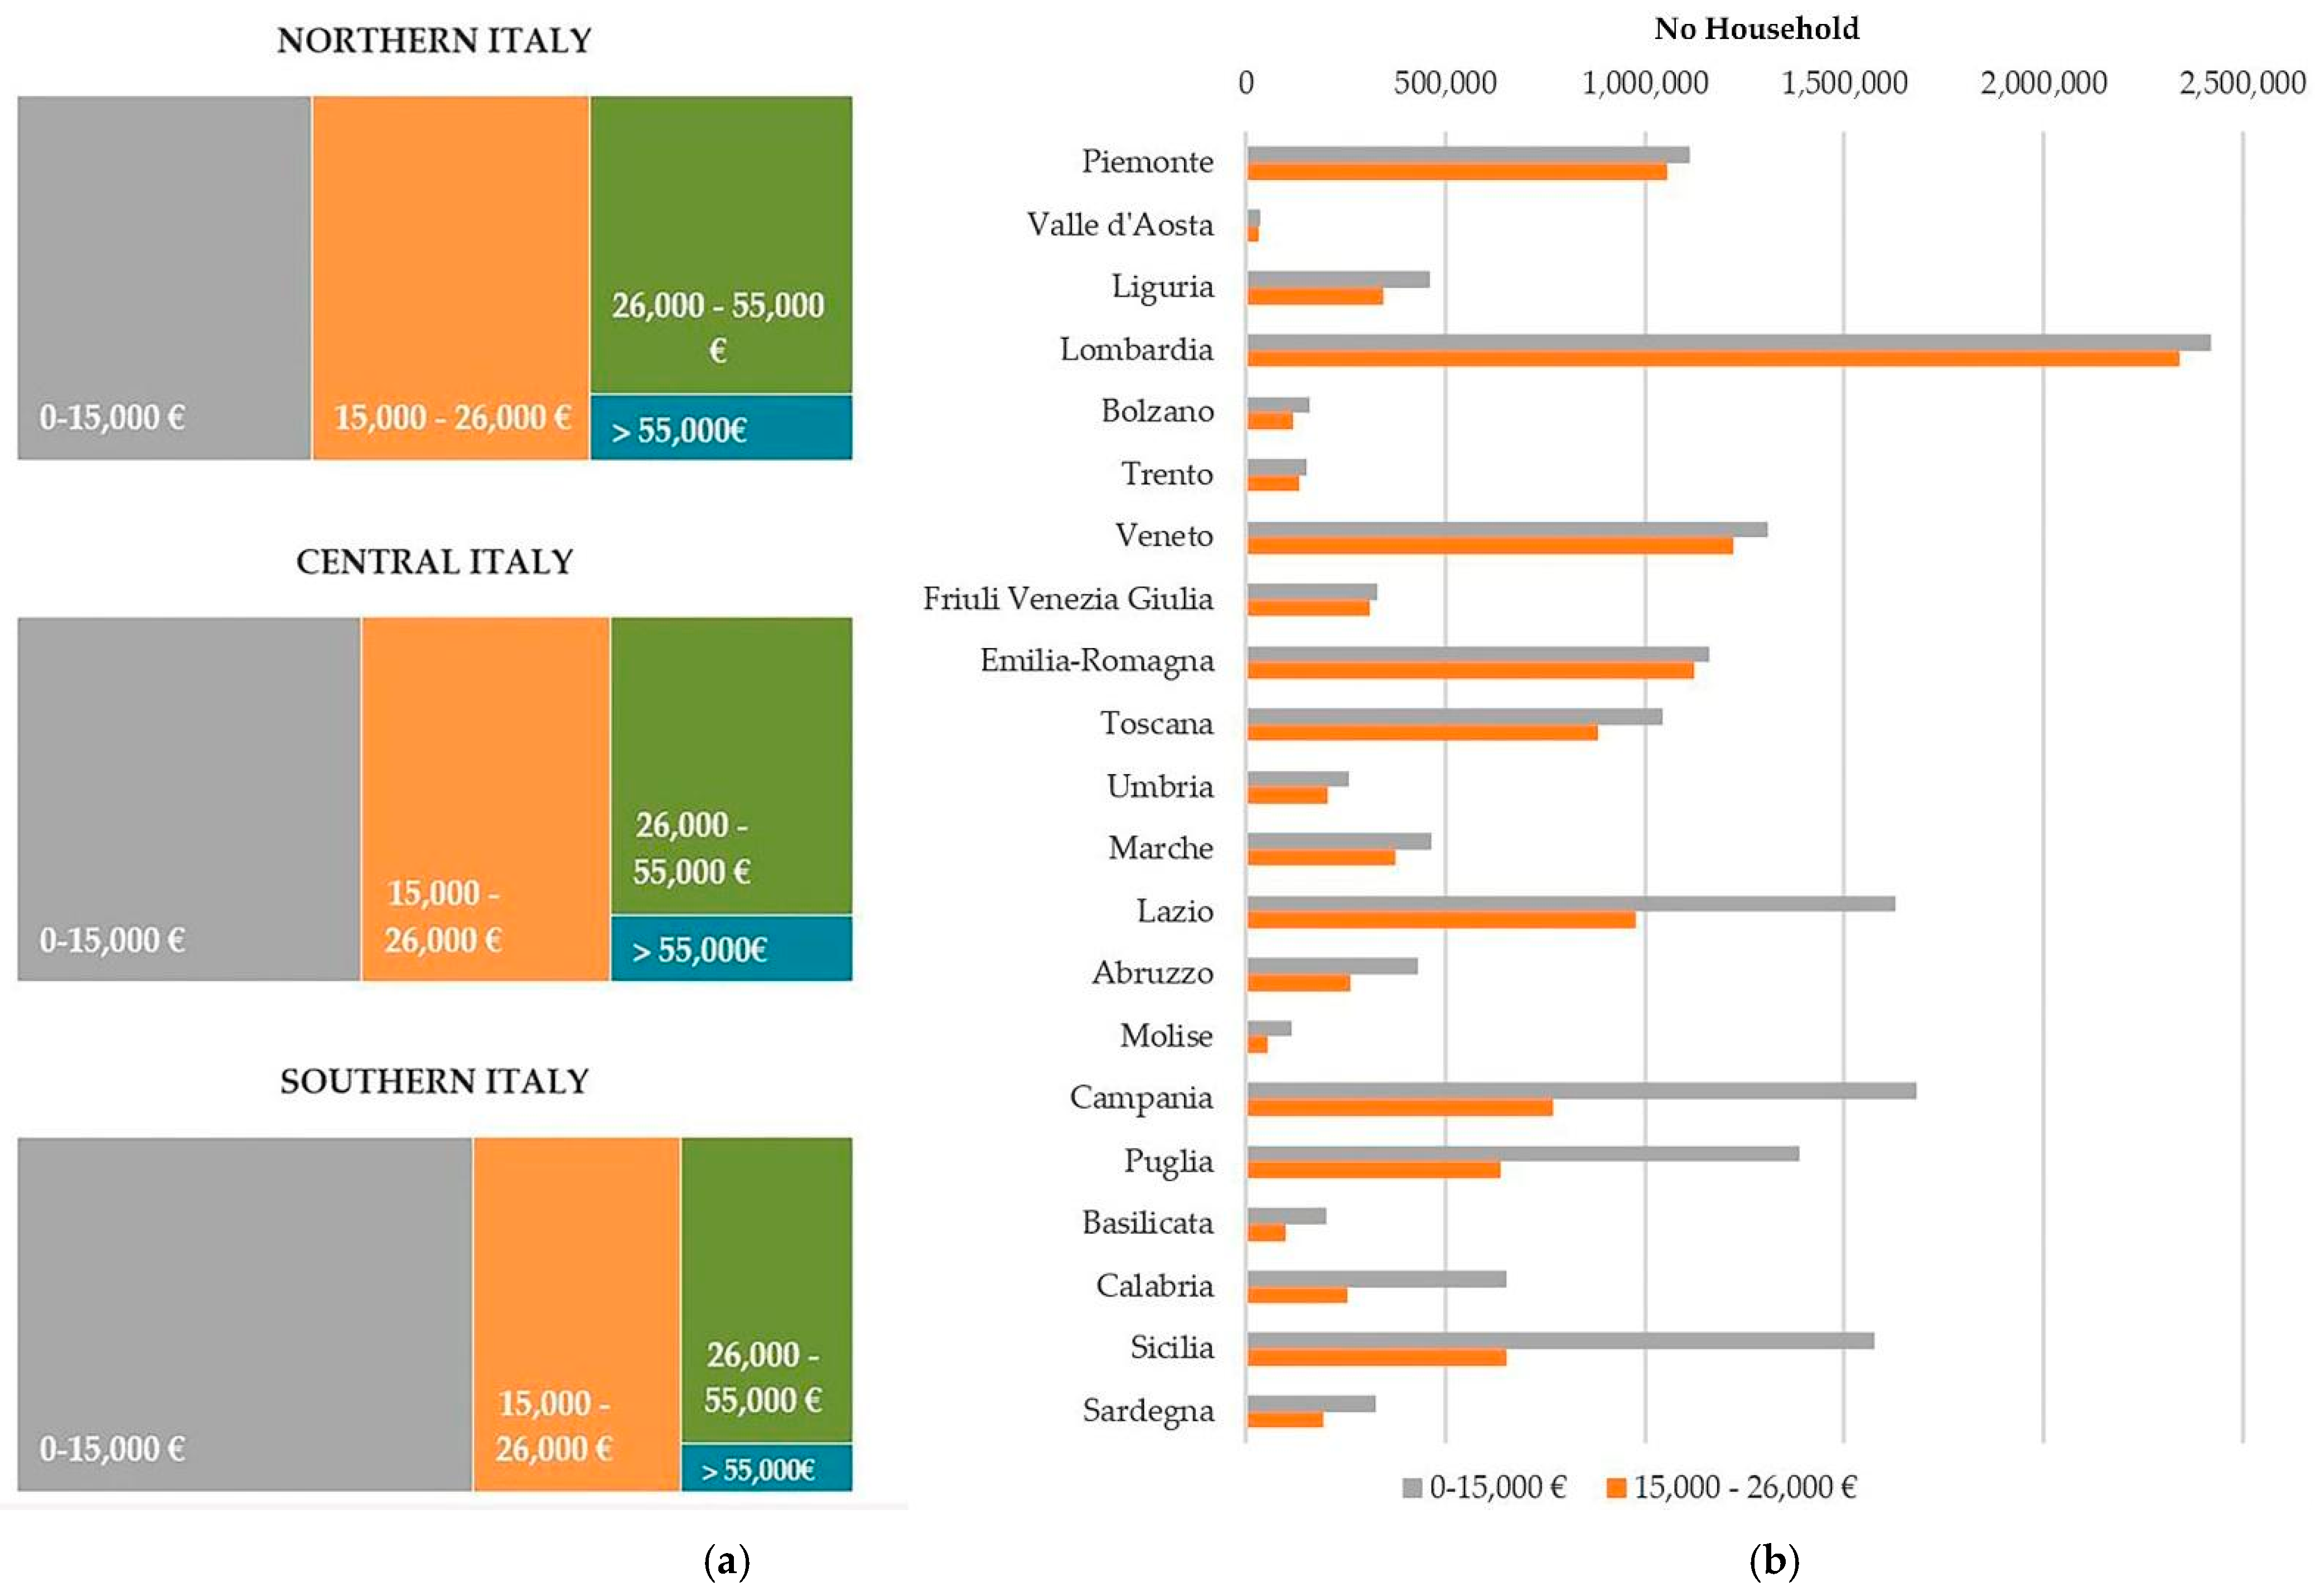
  • the first is the absolute housing emergency which concerns individuals in absolute poverty (4.6 million people and 1.6 million households in 2019) who do not have the resources to live adequately. These people would be entitled to public housing;
  • the second is the housing discomfort of those who are in relational poverty (8.8 million individuals and 2.9 million households in 2016) as, despite having a low to medium income, they cannot find adequate housing for their needs in the housing market. These people may require SH housing (Figure 6) [29].
There are several factors that determine the demand for SH:
  • economic factors concerning income level or the need to relocate for work;
  • social factors concerning the changing composition of families, particularly as the number of single-person and single-parent families has increased in recent years due to an increasing number of separations/divorces and elderly lonely people. In addition, young people find it difficult to move on their own due to the absence of stable and well-paying jobs;
  • demographic factors related to the high percentage of foreigners in precarious employment.
With particular reference to economic factors, it should be highlighted that in Italy, there is a historical gap between the level of wealth of the southern regions and that of the northern regions, as can be seen from an analysis of economic data [30]. For example, if the percentages of GDP and population on a regional basis are compared (Figure 7), it appears that the economic system of southern regions has a structurally low capacity to produce wealth with respect to the resident population, while the contribution of the northern regions to GDP is predominant. In addition, an analysis of the distribution of taxpayer income by geographic area shows the marked prevalence (in percentage terms) of low (€0 to €15,000/year) and medium-low (€15,000 to €26,000/year) income brackets in the southern regions, while the northern regions have the highest percentages of high and medium-high income taxpayers (Figure 8a). The same data in absolute value show that there is a high concentration of low-income taxpayers in Lombardy (northern Italy), even if this depends on the high population of this region on a national basis (16.6% of the Italian population lives in Lombardy) (Figure 8b). The result is that affordable housing is a concern in southern Italy but needs to be addressed in northern Italy as well.

3.3. Eligibility of Householders for Social Housing

Italian housing policy is regulated by national laws that are supplemented by regional laws, as local administrations can independently establish some rules for the SH provision. The categories of people who can apply for SH units are similar in different Italian regions, but other relevant factors to achieving social equalization can vary significantly, for example: maximum income of applicants, agreed rents, agreed sale prices [31].
Local governments establish the economic and social requirements of the categories eligible for social housing and publish public notices that usually contain:
  • list of the eligible categories (elderly, young couples, single-income households, etc.);
  • income limits of the applicant (usually the total income of the members of the household with some detractions);
  • characteristics and dimensions of the housing in relation to the number of the household members and, sometimes, description of spaces serving the housing (common areas, gardens, parking, etc.);
  • conditions of leases, leases with covenants of future sale or sale of SH units (duration of the lease, payment of deposits, etc.);
  • rents, lease with future sale covenants or sale prices of housing, determined in relation to regional as well as national legislation, and thresholds that such rents may not exceed; and
  • criteria for the formation of rankings of beneficiaries.
As an example, Table 1 shows some of the economic data contained in a 2019 call for public housing in the city of Bari (southern Italy) [32], including the household’s income range of 7680 to 45,779 euros/year as a requirement for participating in the call. In contrast, in a similar announcement in the city of Milan (northern Italy), income ranged from 7000 to 16,000 euros. This difference exemplifies the discreteness and variability of the local management of SH offerings.

3.4. The Agreed Rents as Threshold Benchmarked Rents

Social housing rents must meet several requirements: affordability, i.e., be lower than market rents; and fairness, i.e., take into account the different conditions of the housing market in Italian cities; but also ease of updating over time. The Italian legislation established that the reduced rents of SH cannot be higher than certain legal thresholds and chose as thresholds the agreed rents that are set each year by local agreements between landlords and tenants associations.
The local agreements for agreed rents are regulated by the Decree of the Minister of Infrastructure and Transport (Decree 16 January 2017) according to art. 2 paragraph 3 of Law 431 of December 9, 1998 [31]. The local agreements are promoted by the municipalities, which summon the national associations of landlords (e.g., Assoedilizia, Federproprietà, etc.) and tenants (e.g., SUNIA, CONIA, etc.). The associations agree on the subdivision of the areas of the municipal territory into “homogeneous urban zones”, as well as on the building types and the agreed rents. In each zone, the maximum rent for SH (art. 2 paragraph 3, Decree of the Minister of Infrastructure and Transport of 22 April 2008) is included in a minimum–maximum range depending on the characteristics of the property, such as building type, state of maintenance, technical facilities (elevator, energy class, etc.), condominium services (communal garden, parking space, etc.), or private (private garden, terrace, etc.). Since the landlord who rents by agreed rents gets tax breaks, as some taxes are reduced and others are exempted, the range of minimum and maximum rent must be lower than the market range.
Therefore, these local agreements are themselves a housing policy tool because they incentivize the supply of affordable rental housing. In addition, the agreed rents have been used by the law to set the highest benchmarked rents for SH.

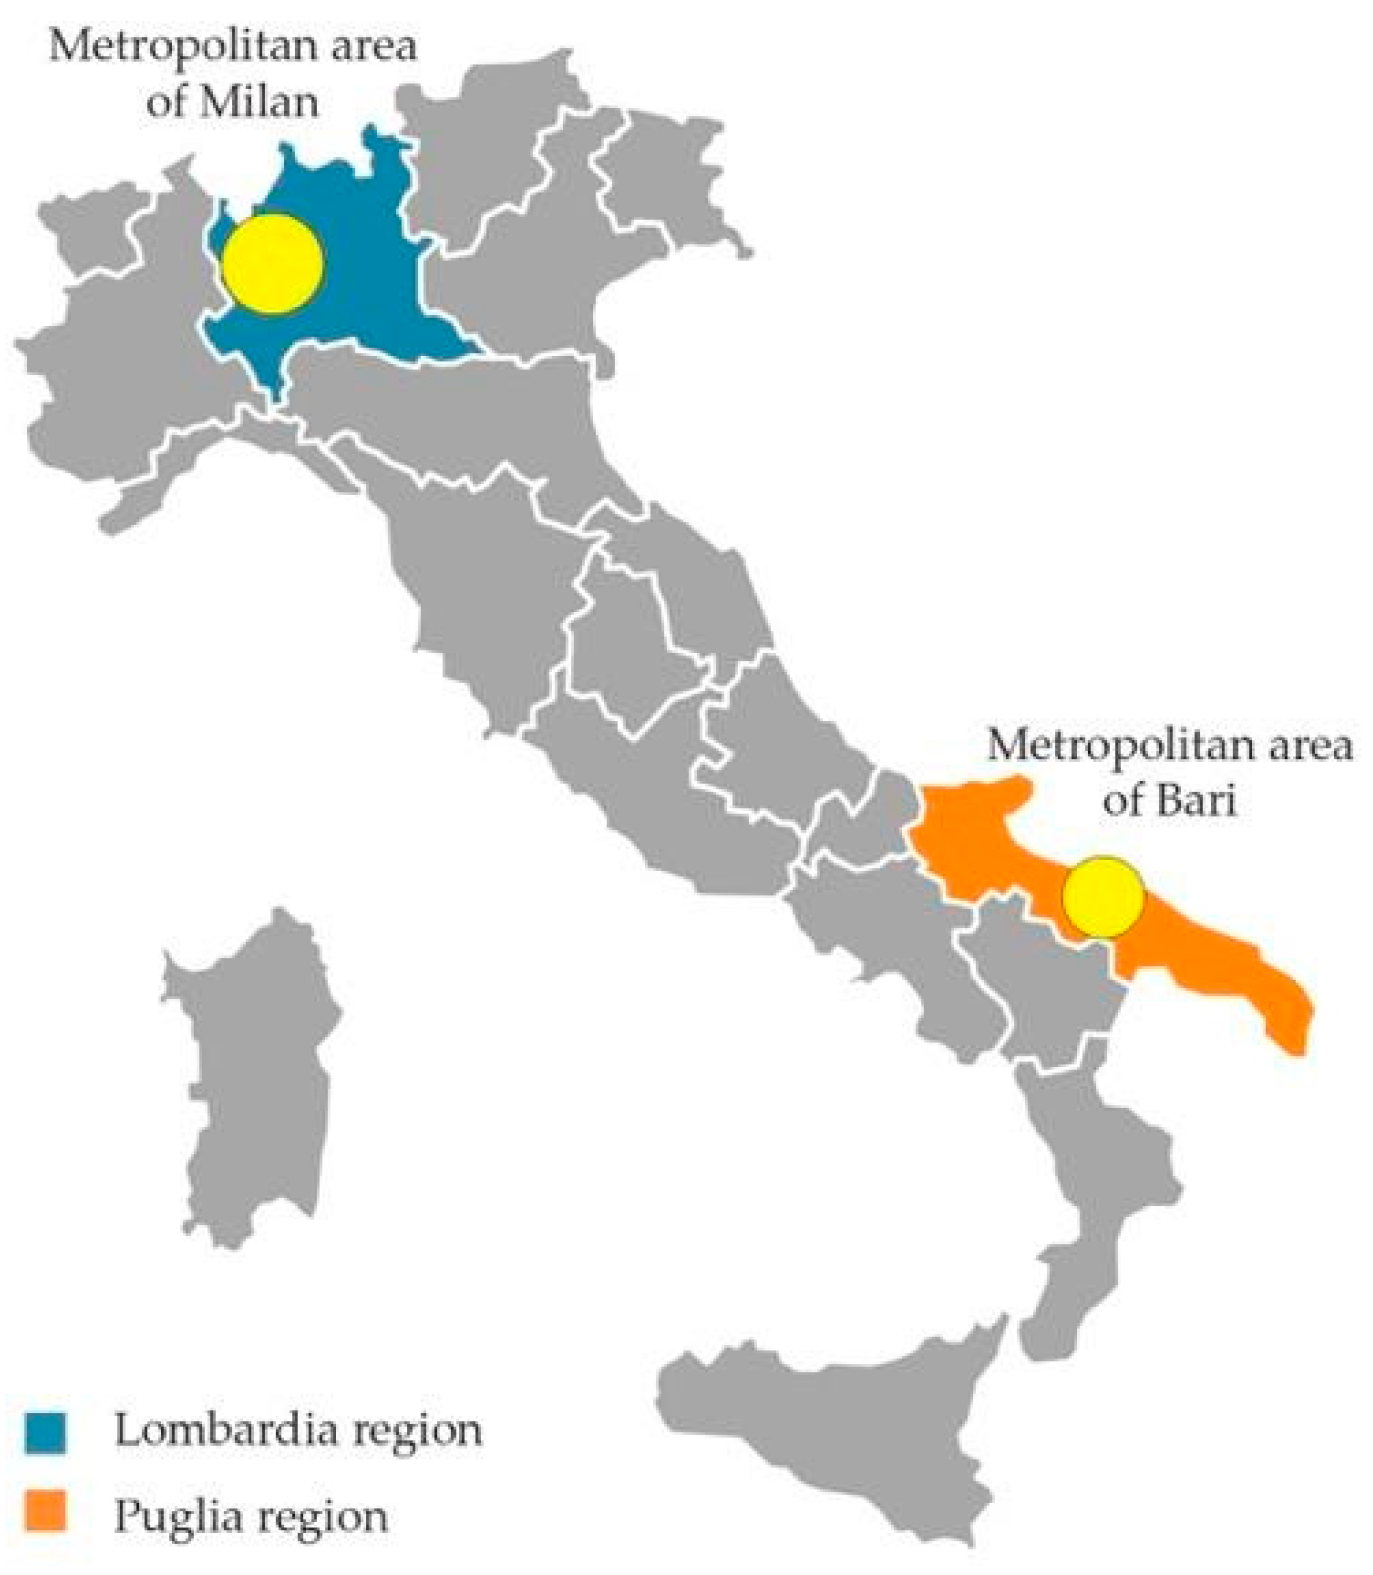
4. Materials: The Metropolitan Cities of Milan and Bari (Italy)

As a case study, the metropolitan cities of Milan and Bari were chosen because they are representative of different social and economic contexts (Figure 9) [33]. Milan is located in northern Italy in the Lombardy region, where the highest percentage of the Italian population lives and where the most important economy in Italy is present, given that it alone produces more than a fifth of the GDP. Bari is in Puglia, in southern Italy, where a small part of the population lives (6.65%) and where only 4% of GDP is produced (see Figure 7). It should be noted that the current “metropolitan cities” were established in 2015 (Law No. 56 of 7 April 2014) and replaced the pre-existing provinces.
The Metropolitan City of Milan has an area of 157,565 km2 (6.60% of the regional area) and is composed of 133 municipalities. In 2019, there were 3,250,077 inhabitants (30.08% of the regional population), of which 1,395,980 lived in Milan, which is the capital city. The Metropolitan City of Milan has an excellent infrastructure system and connection with other European states and, in 2014, the GDP per capita (nominal) was €46,128/year, higher than the national average GDP per capita, which in 2014 was €35,518 (Table 2) [34,35].
The Metropolitan City of Bari has an area of 3825 km2 (19.57% of the regional area) and is composed of 41 municipalities. The population in 2019 was 1,234,997 (32.19% of the regional population), of which 316,491 lived in Bari, which is the capital city. In 2014, the GDP per capita (nominal) of the Metropolitan City of Bari was €22.319/year, less than half that of the Metropolitan City of Milan and lower than the national average GDP per capita, so it is indicative of an underperforming economic system (Table 2) [34,36].
In the Metropolitan City of Milan, 42 municipal administrations, including that of the capital, signed local agreements in the years 2018–2020 according to the current law. Therefore, agreed rents were set and differentiated by municipality, micro-area, and characteristics of the dwelling. This provides insight into the highest rent threshold that can be applied to potential SH interventions in municipalities in the metropolitan area to assess their economic and social sustainability. The case study includes 38/42 towns (Figure 10). On the other hand, in the Metropolitan City of Bari, 41 municipal administrations, including that of the capital city, signed local agreements. Fourteen out of forty-one towns are part of the case study [37].
Each municipal administration has divided its territory into zones called “microzones” with a range from 1 (single zone) to 12 (in Milan). In each zone, rents were divided into 3 levels, i.e., sub 1, sub 2, and sub 3, concerning the characteristics of the dwelling, for an overall total of 314 agreed rents.

5. Methods

5.1. General

The proposed method aims to verify that the agreed rents set in each municipality by local agreements between landlord and tenant associations have both internal and external consistency. This is necessary because, according to the current law, the agreed rents are used as threshold rents for SH units. Internal consistency implies that the rent is fair, and it is achieved if agreed rents correspond to the different characteristics of cities, areas, and housing. External consistency implies that rents are affordable, and it is achieved if agreed rents are significantly lower than market rents.
If, on the one hand, the fragmentation of agreements and the high number of agreed rents are indicative of great flexibility and adaptation to the characteristics of each area and municipality, on the other, they can be an element of weakness and lead to inconsistencies or inefficiencies during the negotiation phase.
Verification of the internal consistency of the agreed rents is obtained by applying cluster analysis, which defines groups of municipalities with similar characteristics, to the data set of local agreements. External consistency is analyzed by comparing the agreed rents with rents collected by the Ministerial Observatory of the Real Estate Market (OMI) to verify their effectiveness as SH rents.
The method consists of the following steps:
  • Construction of a database with data from municipalities and local agreements, such as characteristics of municipalities, agreed rents by municipality, zone, and sub-zone;
  • Segmentation of the housing market through cluster analysis;
  • Analysis of the internal coherence of the agreed rents by the semantic categories of differentiation of the attractiveness of MACBETH (Measuring Attractiveness by a Categorical-Based Evaluation Technique);
  • Comparison of agreed rents with OMI rents.

5.2. Database

The study proposes an analysis of the agreed rents between landlord and tenant associations aimed at verifying the coherence in the implementation of SH policies in this specific area of application. The areas of analysis proposed in this study are those of the metropolitan cities of Milan and Bari.
These areas were selected to respond to the need to highlight the performance of SH policies in territorial contexts characterized by different socio-economic systems (see Figure 7 and Figure 8).
The local agreements of the municipalities of the two metropolitan cities of Bari and Milan subject to analysis involve areas heterogeneous in location compared to the two capital cities of Milan and Bari for socio-economic characteristics such as population density and income, and for real estate characteristics including the rent.
In the construction of the database to support the analysis in order to grasp the peculiarities of the two areas under study and the agreed rents, it was chosen to select the following variables: (1) the minimum annual rent as it is considered more significant with respect to the income threshold for housing affordability; (2) the minimum real estate characteristics because they are consistent with the minimum rent; (3) territorial accessibility; (4) the population density of the municipalities; (5) the population group with income between 15,000 and 26,000, which is considered more significant with reference to the threshold income for housing affordability.

5.3. Segmentation of the Housing Market

Since the 1940s and 1950s, US researchers have developed “filtering models” to explore local housing systems. Filtering models can support a rigorous analysis of the real estate market, allowing the identification of distinct market segments. Sub-markets can be defined on the basis of housing location in the urban context (spatial submarkets), real estate characteristics (structural submarkets), socio-economic characteristics of households, and environmental factors.
William Grigsby [38] first defined the sub-markets in terms of “tight substitutability” of housing. Some researchers, according to this perspective, consider the real estate sub-market as consisting of an n number of properties “close substitutes” belonging to the same group, but “imperfect substitutes” of those belonging to other sub-markets.
Several models have been proposed in the literature to identify and analyze sub-markets such as Hedonic pricing models [39,40], factorial analysis [41], cluster analysis [42,43], geostatistical models [44,45], and Fuzzy clustering [46,47]. Cluster analysis is a widely used approach in the literature as an instrumental filtering model to identify real estate market segments.
We decided to use two filtering models for our analysis in order to delineate the SH sub-markets. The first segmentation model uses cluster analysis, the second further delineates the segments by classifying them based on the semantic categories of differentiation of the attractiveness of MACBETH.
In this study, the cluster analysis supports the verification of the internal coherence of the agreed rents between associations of landlords and tenants. This verification is aimed at highlighting whether the SH policies are implemented consistently in the different cities and their sub-zones.

5.3.1. Cluster Analysis

Cluster analysis is a multivariate statistical technique, through which it is possible to obtain a group structure from a certain population of data, that is, by grouping several similar units together in a certain number of groups.
The identified groups are characterized by being relatively homogeneous within them and heterogeneous among them. Homogeneity and heterogeneity are assessed on the basis of a defined set of variables. Grouping methods include traditional and fuzzy ones. In the first case, the objects belonging to a given group are selected by similarity (hard clustering), i.e., the “similar” objects are found in the same cluster. In the second case, the grouping of objects is carried out on the basis of modulation of the degree of similarity (even partial) (soft clustering).
Among the algorithms cluster proposed in literature of hard clustering type, the one based on the k-medoids was selected because it lends itself better to the purpose of the study that has the objective of verifying how similar the implementation of the SH policy in a city and in sub-areas of cities is.
The k-medoids algorithm allows you to partition the dataset into groups based on the minimum sum of the differences from a point identified as the center of the cluster. This point is characterized based on the selected analysis variables, namely, minimum annual rent, minimum real estate characteristics, territorial accessibility; population density of the municipalities; and population group with income between 15,000 and 26,000, cities and their sub-zones.
In this study, we used the Partitioning Around Medoids (PAM) algorithm proposed by Kaufman and Rousseeuw, a detailed analysis of which can be found in the literature [48,49]. In this study, we used the NCSS statistical software for cluster analysis.

5.3.2. K-Medoid Algorithm Cluster Validation

The term cluster validation is used to design the procedure of evaluating the goodness of clustering algorithm results. It is an important step to avoid falling into the trap of finding patterns in a random data, as well as, in situations where the efficacy of clustering algorithms is compared. This step is arguably the most challenging one in the clustering process. The resulting clusters of any clustering algorithm are almost entirely dependent on the measure and distance criterion decided on and, therefore, are subjective. Hence, an objective validation process is required to prove that the number of clusters is optimal and that the clusters themselves are meaningful.
Two of the most difficult tasks in cluster analysis are deciding on the appropriate number of clusters and deciding how to tell a bad cluster from a good one. Kaufman and Rousseeuw [49] define a set of values called silhouettes that provide key information about both of these tasks.
One useful summary statistic is the average value of s across all objects. This summarizes how well the current configuration fits the data. An easy way to select the appropriate number of clusters is to choose that number of clusters which maximizes the average silhouette. The maximum average silhouette across all values of k is denoted by SC.
Kaufman and Rousseeuw [49] proposed the following SC values to identify the appropriate number of clusters and decide how to distinguish a bad cluster from a good one.
  • 0.71 to 1.00: a strong structure has been found;
  • 0.51 to 0.70: a reasonable structure has been found;
  • 0.26 to 0.50: the structure is weak and could be artificial. Try other methods on this database;
  • −1 to 0.25: no substantial structure has been found.

5.4. Analysis of the Internal Coherence of the Agreed Rents

In order to explore the internal coherence of the agreed rent belonging to a specific cluster, the clusters identified with the k-medoid are subjected to further filtering based on the semantic categories of differentiation of the attractiveness of MACBETH [50]. This analysis aims to identify the internal similarity of a cluster. Based on the distance of each object from the cluster it is possible to assign each of them in the semantic categories of MACBETH: extreme, very strong, strong, moderate, weak, very weak, and no difference.
This analysis allows to classify agreed rents in those characterized by good coherence and those by low coherence, offering a good support to verify the coherence in the implementation of SH policies in two metropolitan cities.

5.5. Analysis of the External Coherence of the Agreed Rents

To explore the external consistency of the agreed rents, they were compared to the OMI database that collects quotations and rents in the OMI zones of all Italian municipalities.
To make the comparison, it is necessary to find the spatial correspondence between the zones of the local agreements and the OMI zones. Then, the differential between the agreed rents and the OMI rents can be calculated.

6. Application and Results

6.1. Rental Local Agreement Survey

Based on the survey of the local agreements of the municipalities in the two metropolitan cities, Milan and Bari, two databases were built with reference to five variables aimed at supporting the verification of coherence of the agreed rents: (1) minimum annual rent, (2) minimum real estate features, (3) accessibility, (4) population density, and (5) percentage population group with income between €15,000 and €26,000.
The agreed rents identify within each “homogeneous urban zone” (Zone 1—Central, Zone 2—Semi-central, and Zone 3—Peripheral) the band of fluctuation with a minimum limit value and a maximum limit value of the rent expressed in €/sqm per year.
Each band of fluctuation by homogeneous urban zone is divided into three sub-zones, in which the minimum and maximum values of the rent are included within the limits of this band.
The sub-bands of oscillation for each homogeneous urban zone are delimited with reference to the objective characteristics of the property and are identified in types A, B, C, and D (Table 3).
For the identification of the sub-bands of oscillation, for each of them, the following composition of the characteristics of the housing must occur:
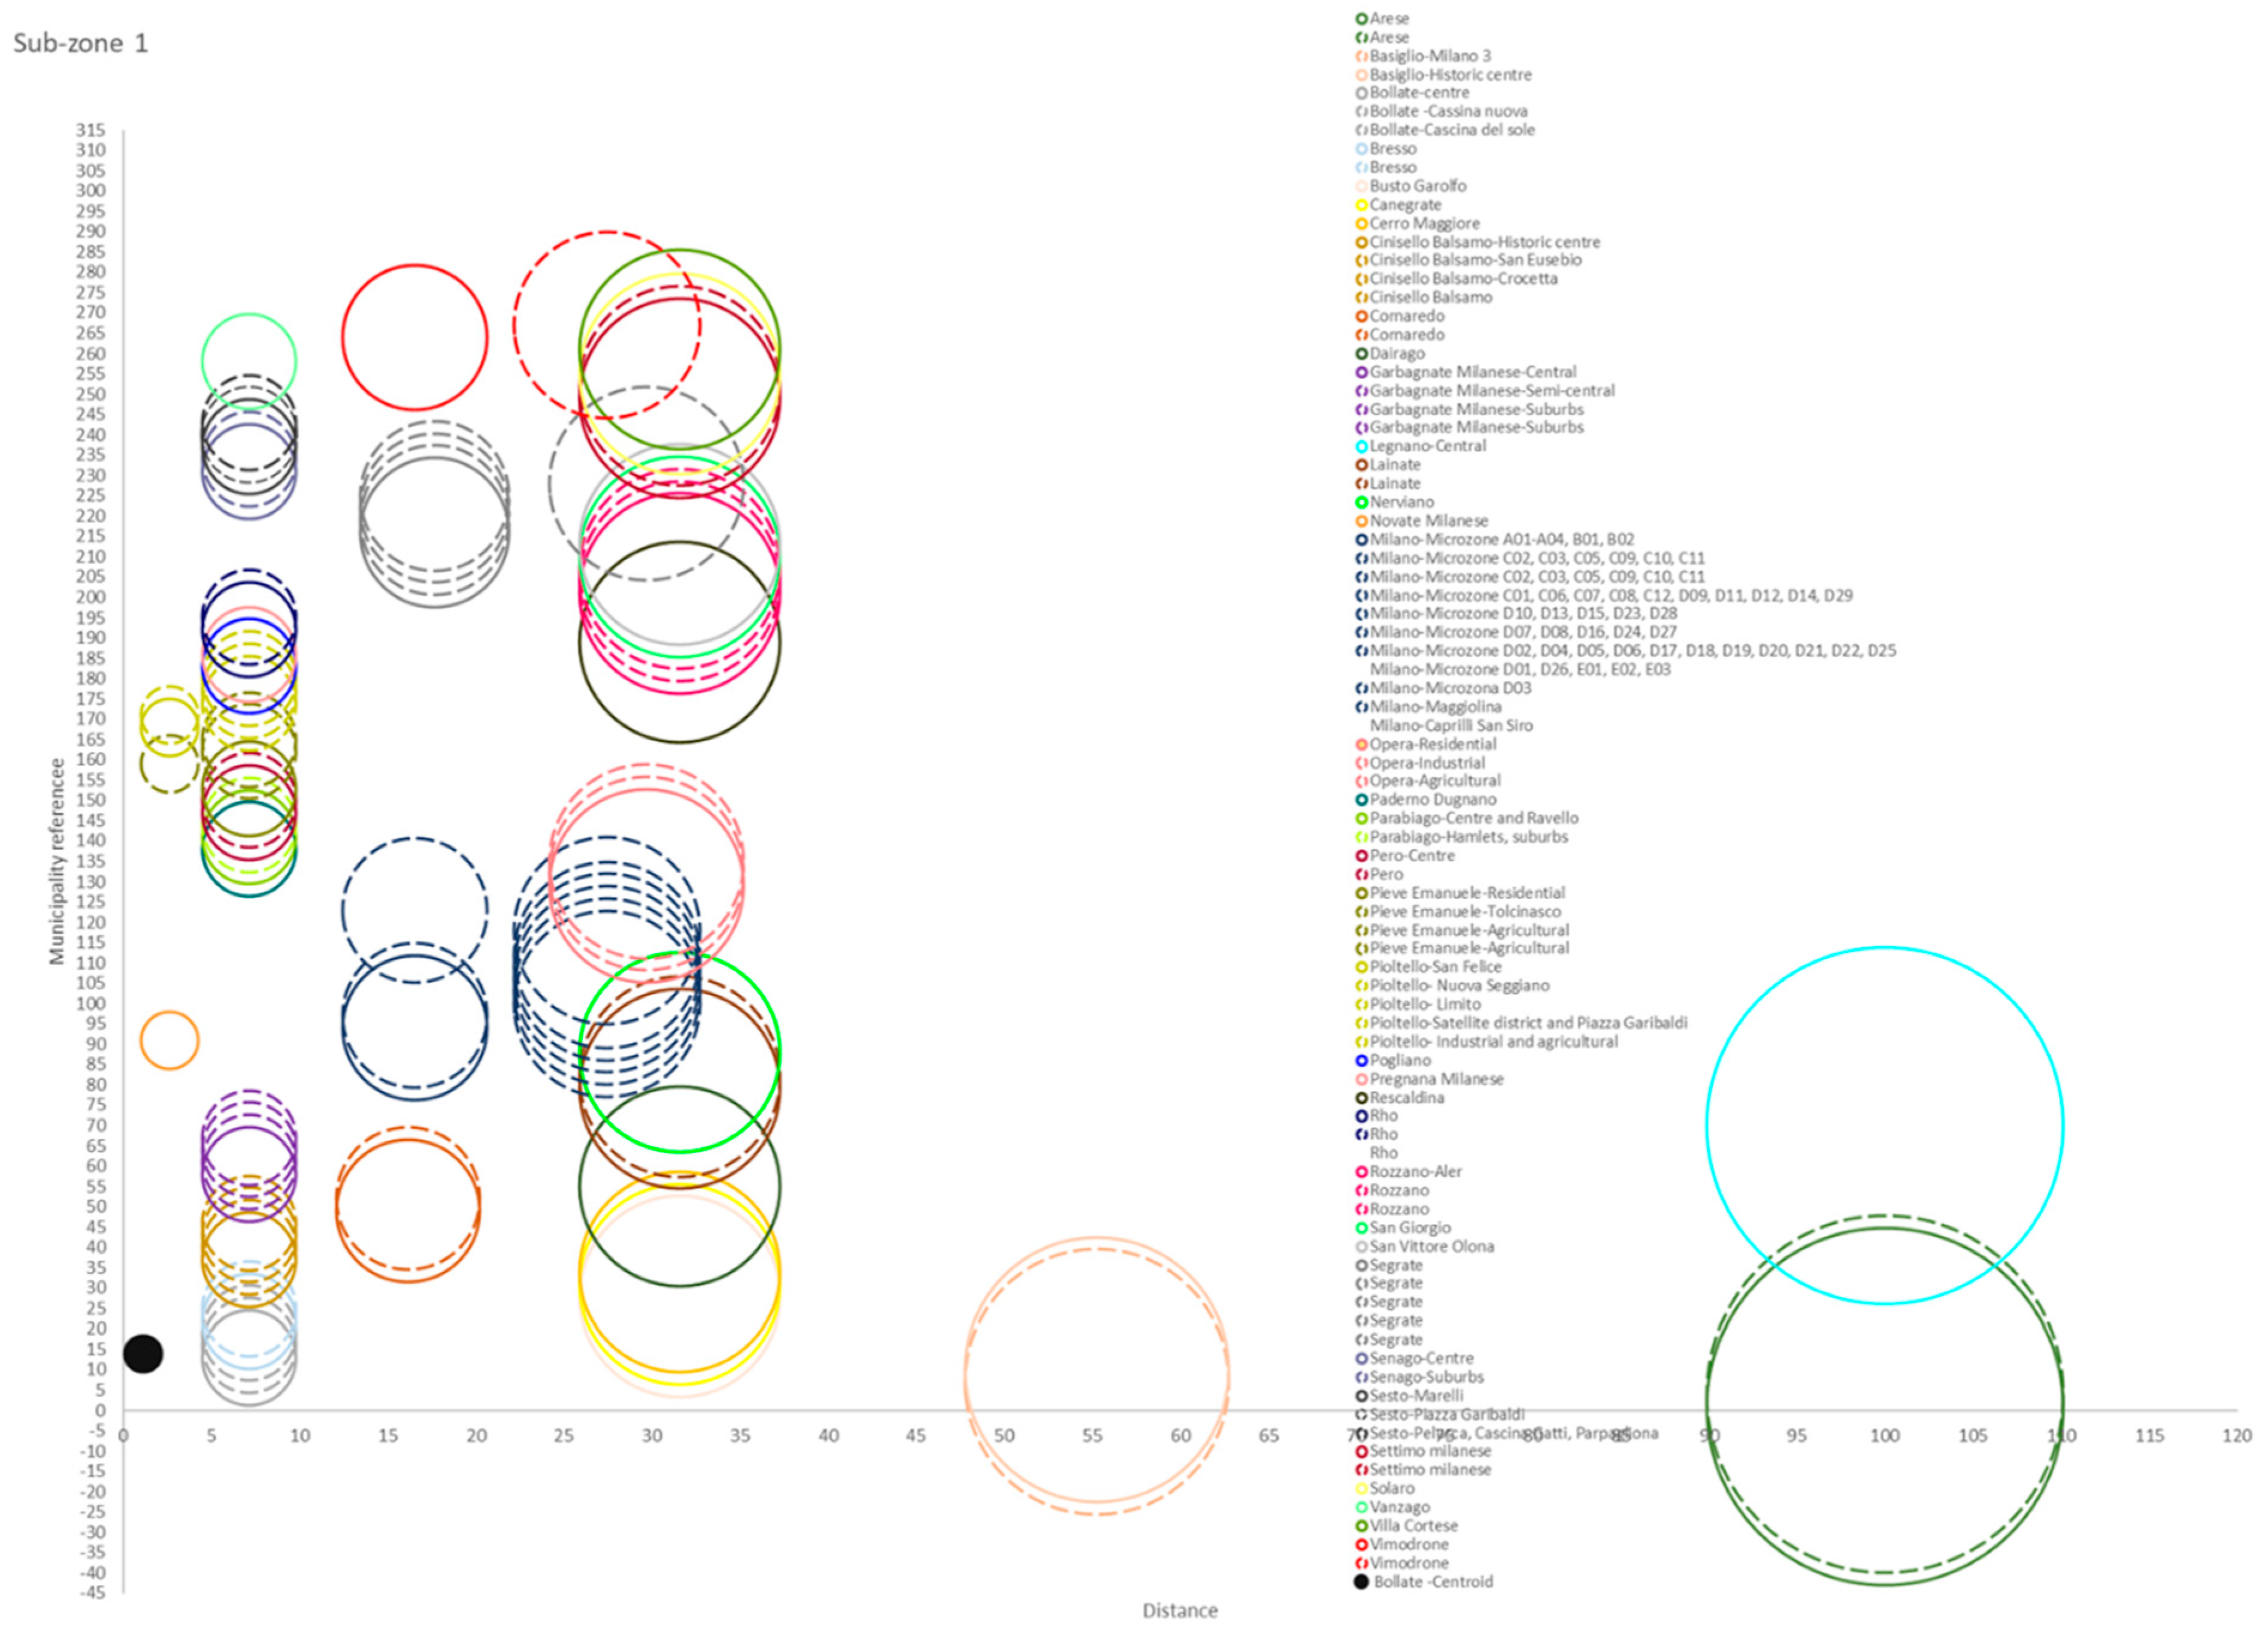
  • sub-zone 1: (a) if only one of type A elements is missing or if cadastral type A/5 is missing; (b) if, equipped with heating system, also by stoves in the individual rooms, except for buildings that have at least four type B elements; (c) if housing units have less than three Type B elements, but all Type A elements.
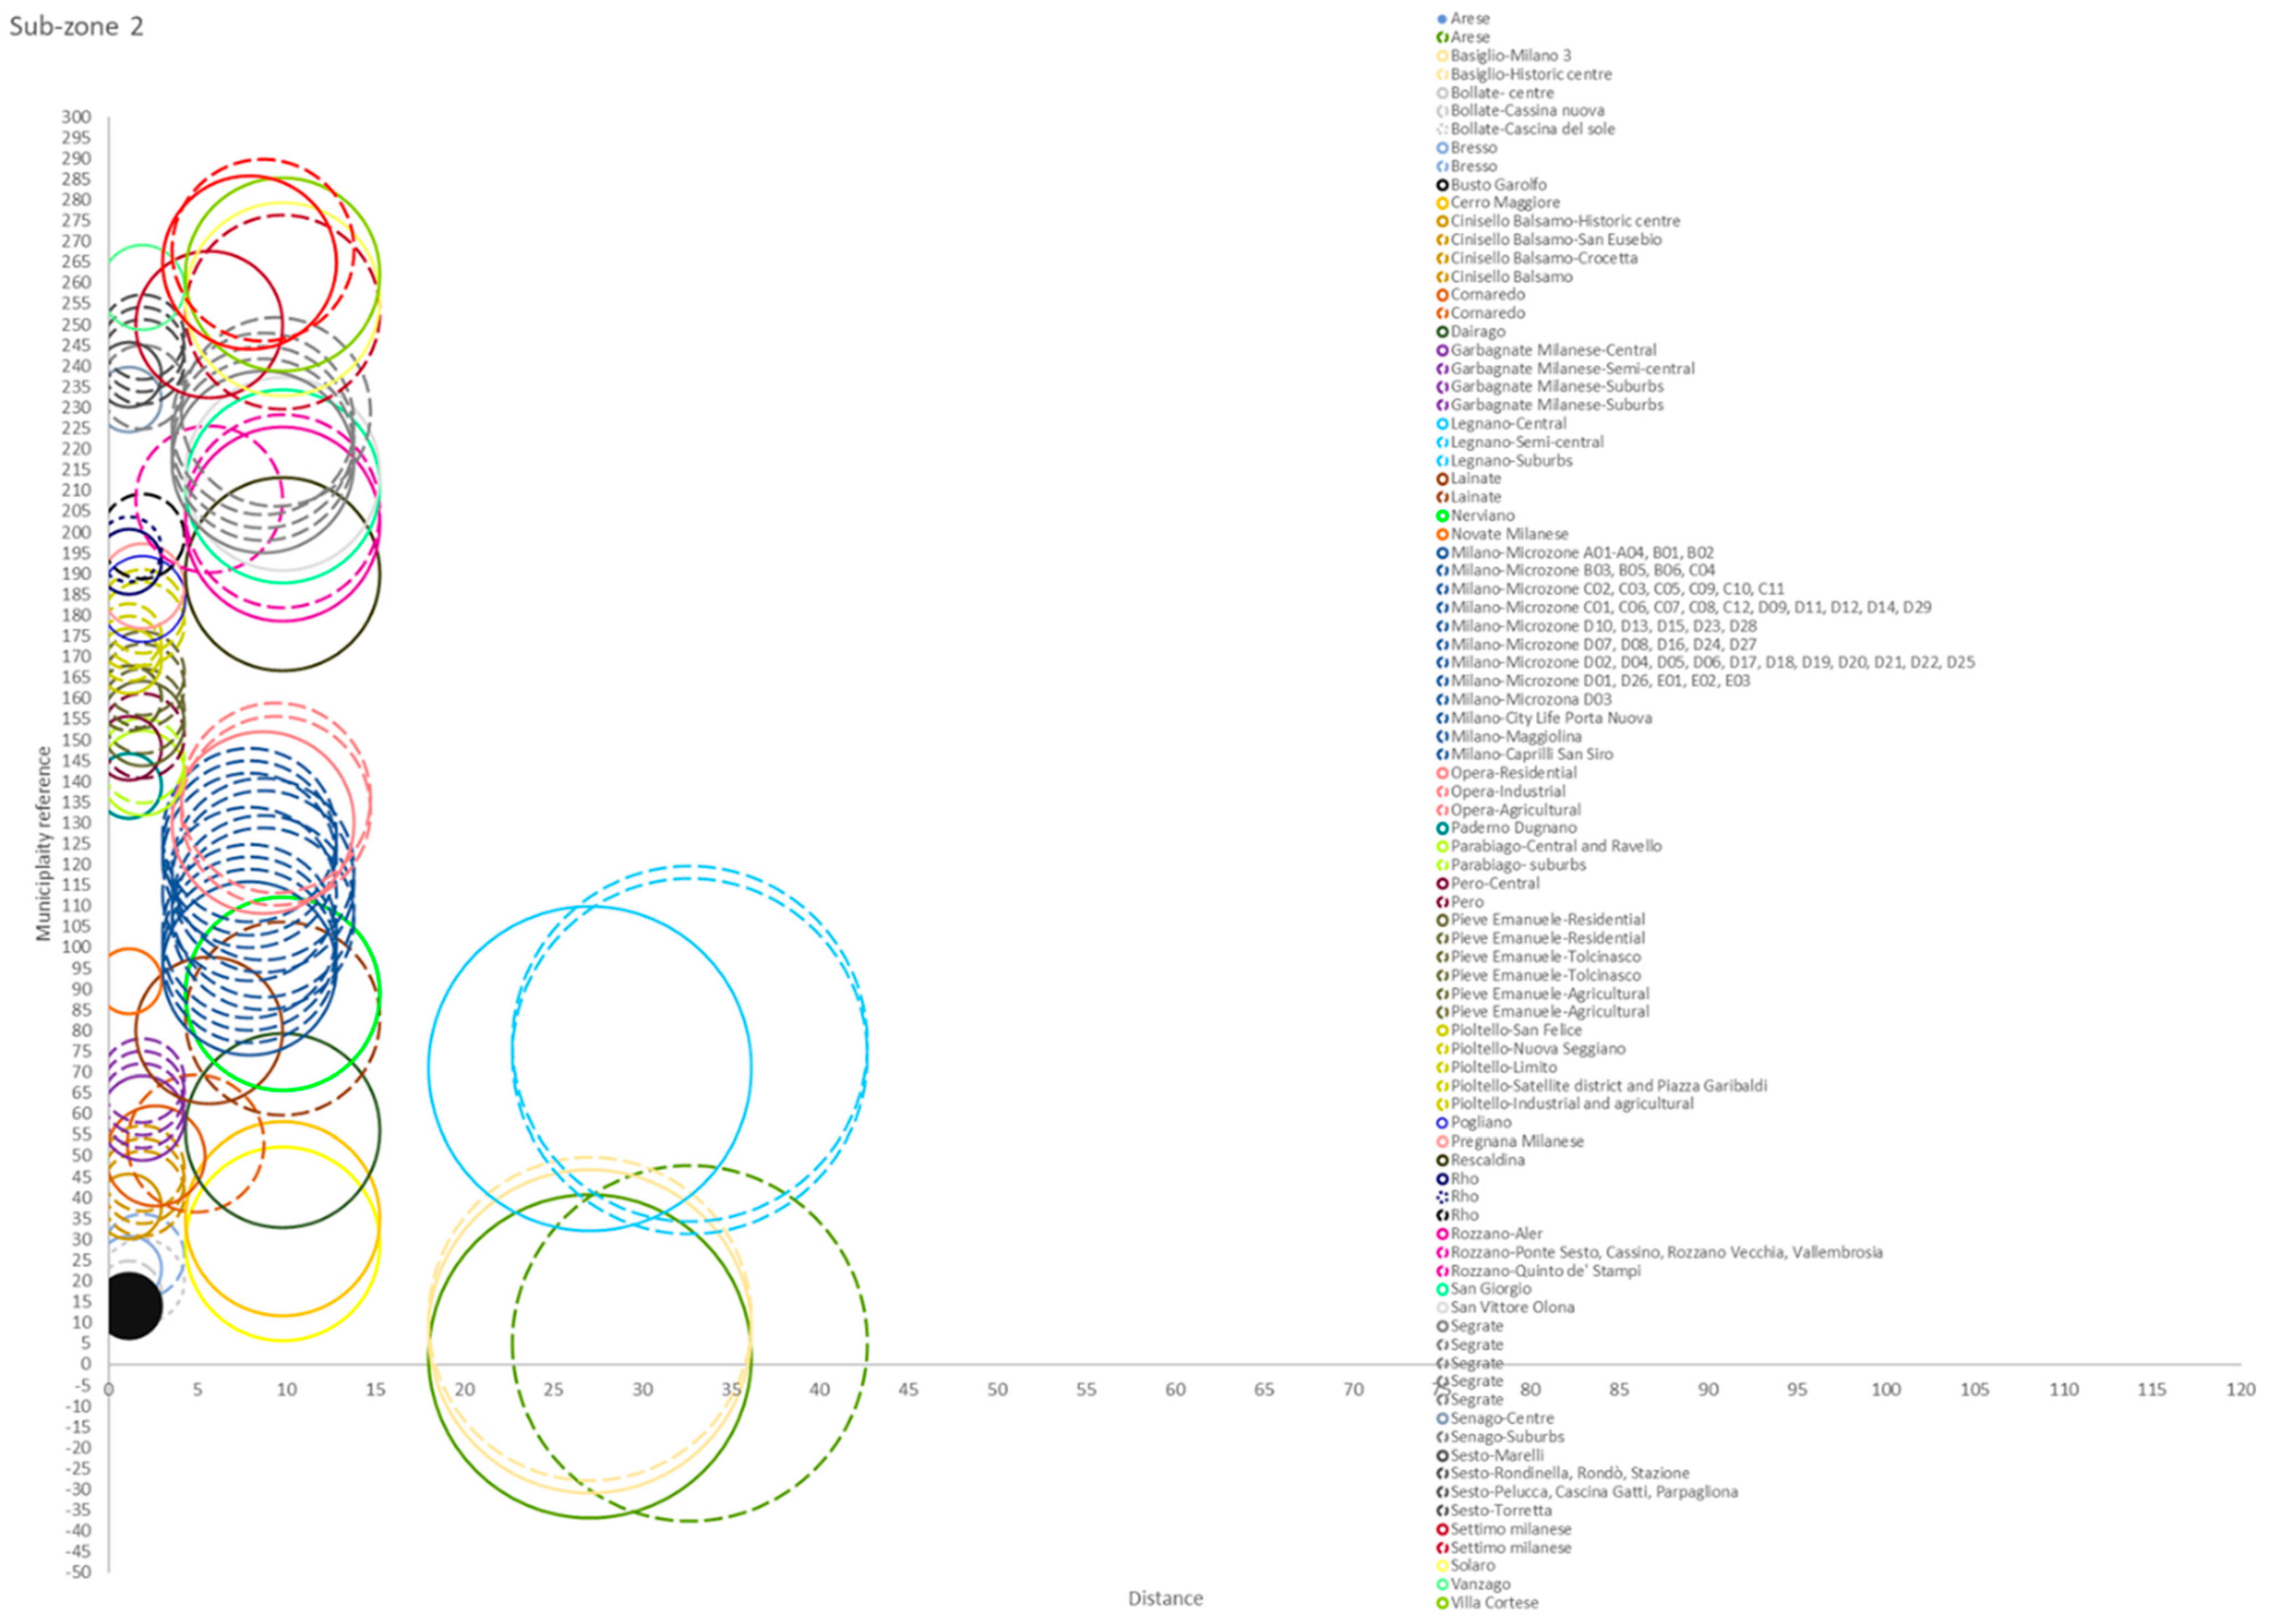
  • sub-zone 2: (a) if housing units have all the elements of type A and at least three elements of type B; (b) if they have all the minimum elements of type A and B, required for sub-zone 2, and less than three elements of type C.
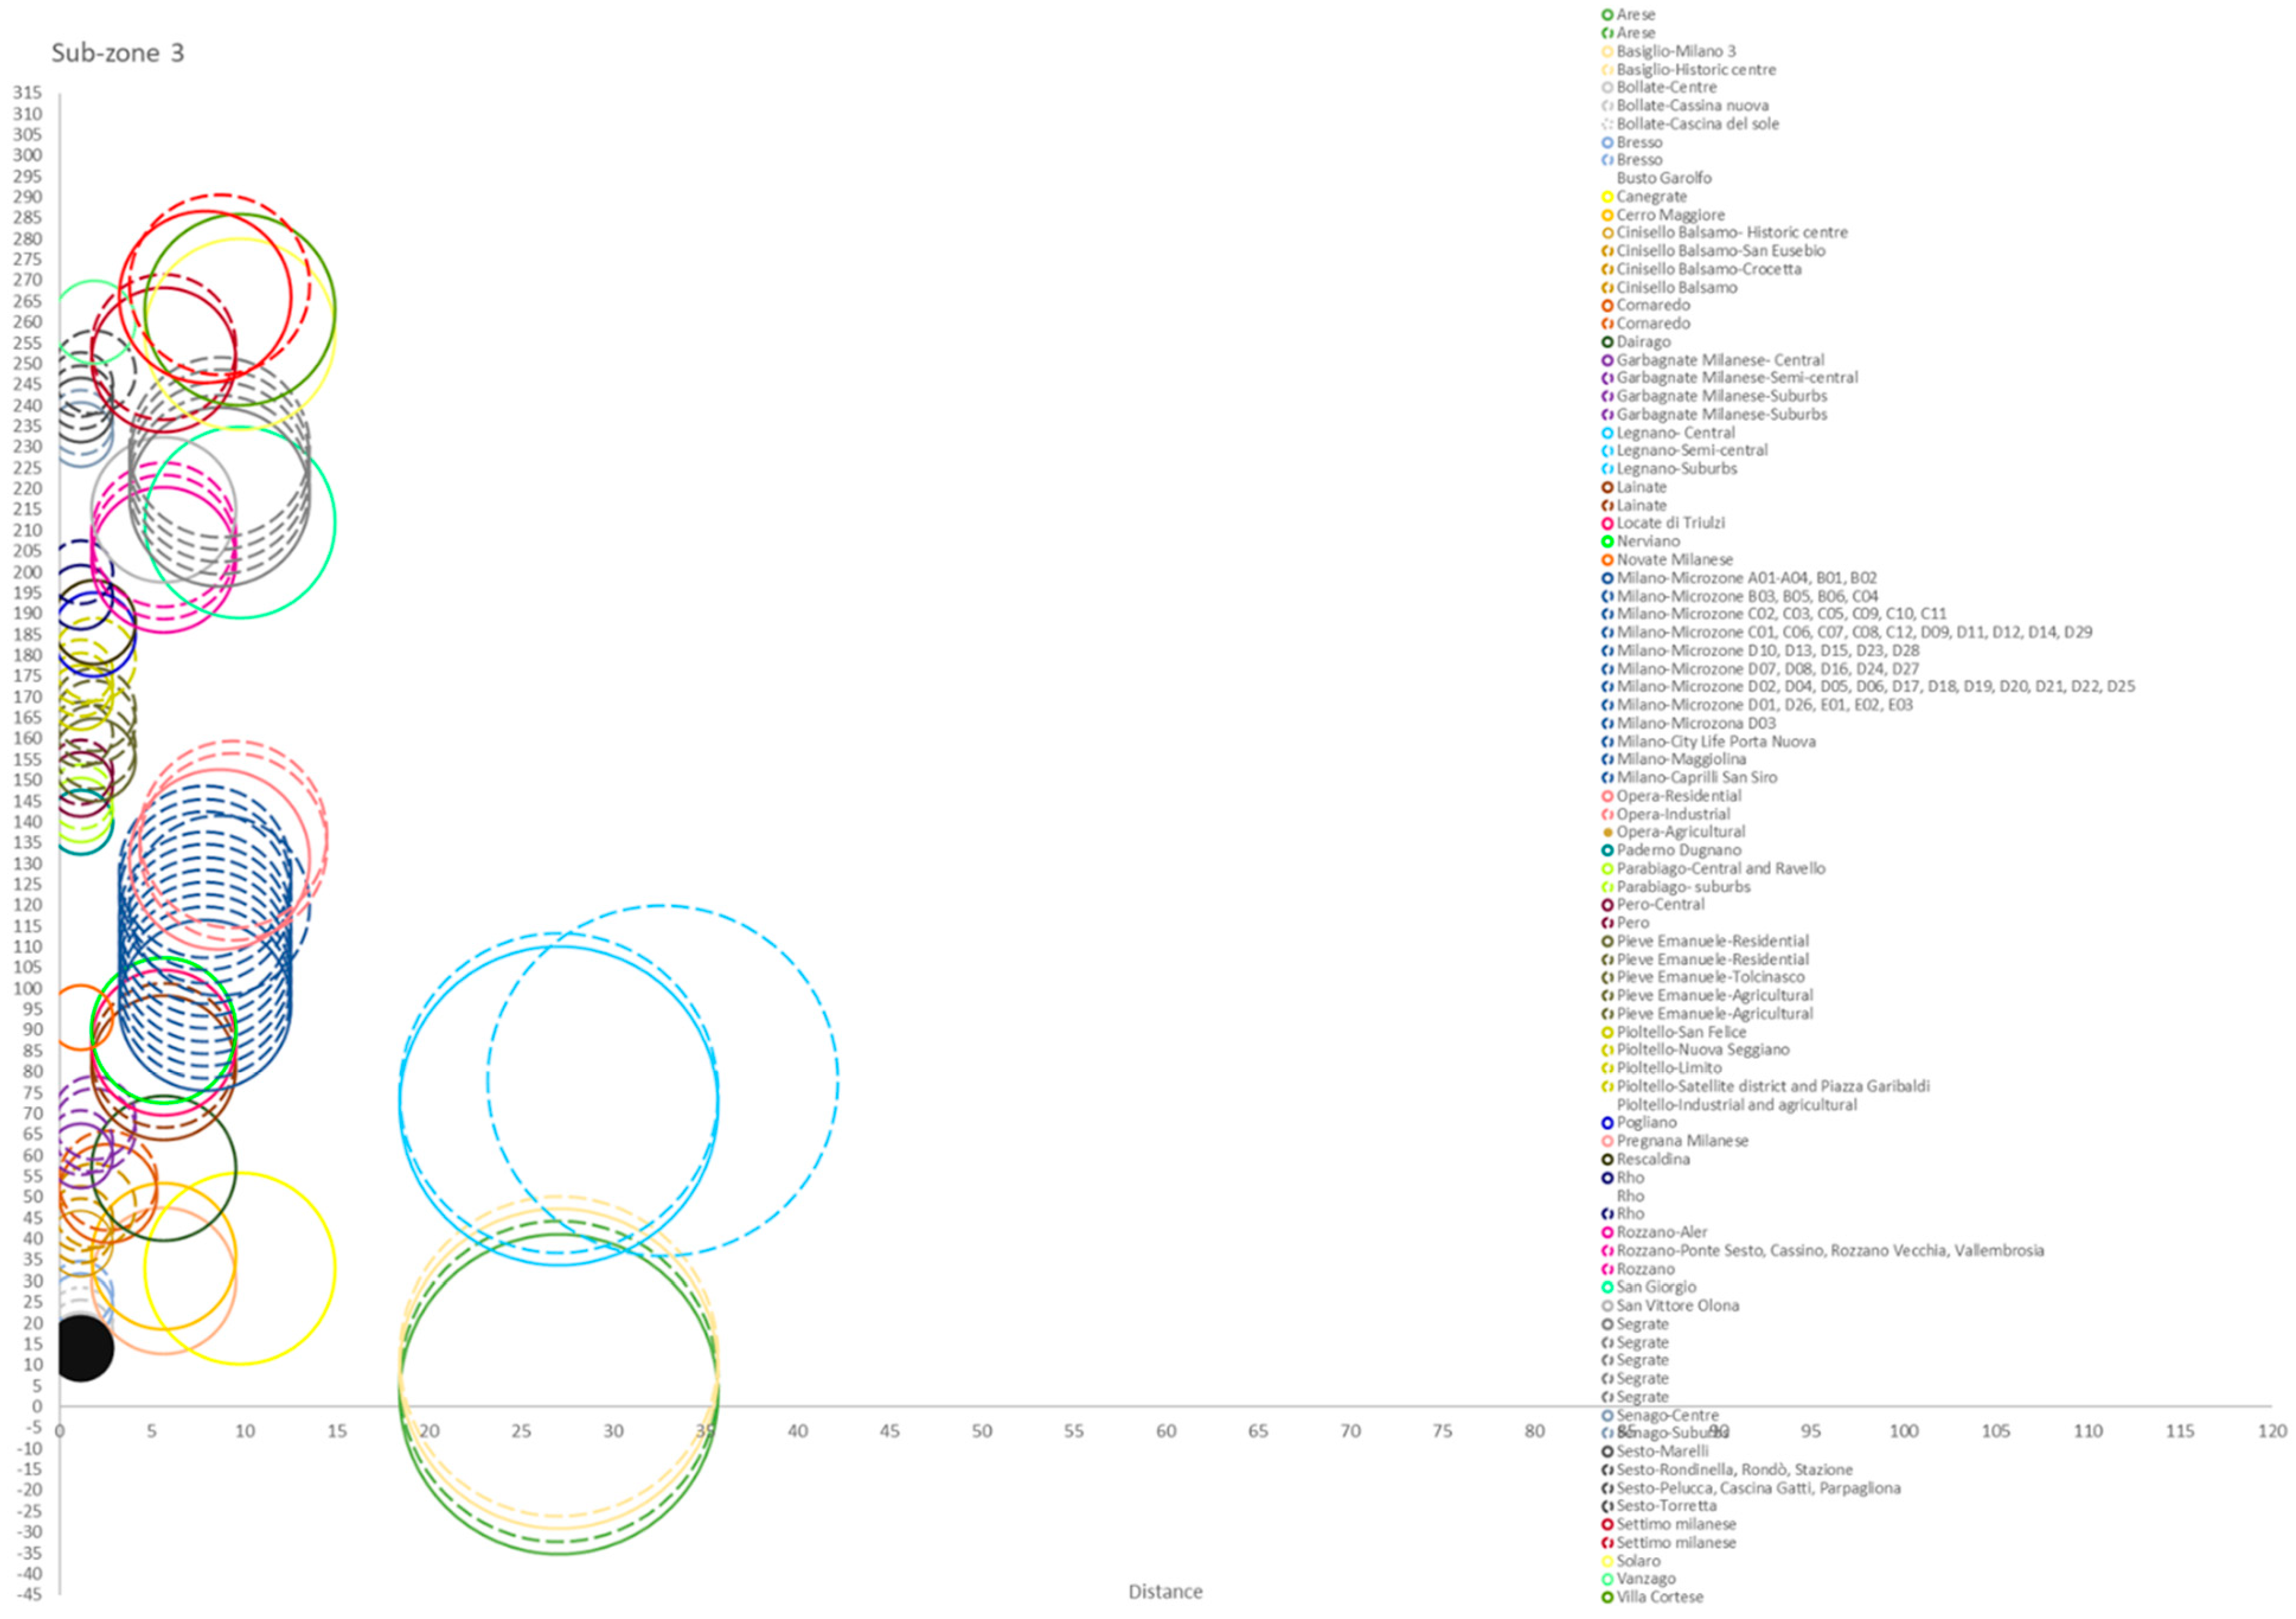
  • sub-zone 3: if housing units have all the elements of type A, at least three elements of type B and three elements of type C and in any case cannot be placed in this sub-zone the buildings if of cadastral type A/3 (of class 1, 2, 3), A/4 and A/6.
The presence of at least five of the elements of type D, implies the possibility of applying to the housing unit the maximum value of the rent in the sub-zone to which it belongs.
In the case of the Metropolitan City of Milan, the characterization by bands allocates the buildings with maximum minimum rents, respectively, in sub-zones 1 to 3, and only in some cases the maximum rent is applied to the buildings in the sub-zone 2.
In Milan, the best housing in relation to its characteristics is that located in sub-zone 3 and then to follow, in sub-zone 2 and sub-zone 1.
In the case of the Metropolitan City of Bari, the characterization by bands allocates the buildings with maximum minimum rents, in order, in sub-zones 3 to 1.
In Bari, the best housing in relation to its characteristics is that located in sub-zone 1 and then to follow, in sub-zone 2 and sub-zone 3.
For the purpose of the analysis, an instrumental score was calculated to measure minimum real estate features of the sub-zones, through the following formula (Equation (1)):
s c o r e m i n s u b z o n e = n C A · % C A + n C B · % C B + n C C · % C C
where n C A , n C B , and n C C represent the number of characteristics defined in points (a), (b), and (c) for the three sub-zones and % C A , % C B , and % C C represent, respectively, the percentages of the housing characteristics in relation to the total of those provided for in type A, B, and C, therefore: 1 < score < 5 in the sub-zona 1, 5 < score < 8 in the sub-zone 2, and score > 8 in the sub-zone 3. Finally, considering the minimum values of the scores, the following score 1 was selected for sub-zone 1, 5 for sub-zone 2, and 8 for sub-zone 3.
In the case of minimum rents, the characteristics of type D are not taken into account because they serve to identify only the maximum rents.
The variable accessibility has been assigned a score ranging from 1 to 5, based on the time to reach the centre of the municipality on foot, i.e., t < 15 min (score 5); 15 < t < 30 min (score 4), 31 < t < 60 min (score 3), 61 < t < 90 min (score 2) e > 90 min (score 1).
The database for the five variables considered and for the two metropolitan cities under study is summarized below (Table 4 and Table 5).
In these tables, for reasons of space, we decided to highlight only the first 13 out of the 269 total elements for the Metropolitan City of Milan and the first 15 out of the 45 total elements for the Metropolitan City of Bari.

6.2. Coherence Analysis of the Agreed Rents Based on the k-Medoids Clustering

Among the literature-based centered algorithms, we chose k-medoids, which is a partitioning clustering algorithm related to the k-means algorithm, which is used differently from the latter, since it centers medoids instead of the average, or a point in the dataset closest to the average [51,52,53,54].
The k-medoids clustering analysis was implemented on the sample of the agreed rents signed in the metropolitan cities of Milan and Bari. The analysis was carried out on the two sets of the agreed rents structured according to the five characteristics previously introduced.
Given the heterogeneity of the units of measurement of the variables considered, they had to be standardized. In particular, they were transformed with the normalization z-score (Equation (2)):
z = x μ σ
where x is the value of the variable to be standardized, μ is the mean of the given sample, and σ is the standard deviation of the given sample.
In particular, the NCSS software that implements a PAM, which uses the medoids as centers of k-means rather than media, was used for the processing of the two sets of the agreed rents, which is a dataset point closer to the average.
The validation of the classification produced was carried out on the basis of the values provided by Kaufman and Rousseeuw for the maximum average gauge in all values of k , namely SC.
Cluster analysis with k-medoids is instrumental in identifying different configurations of lease agreements that refer to different levels of implementation of SH policies.

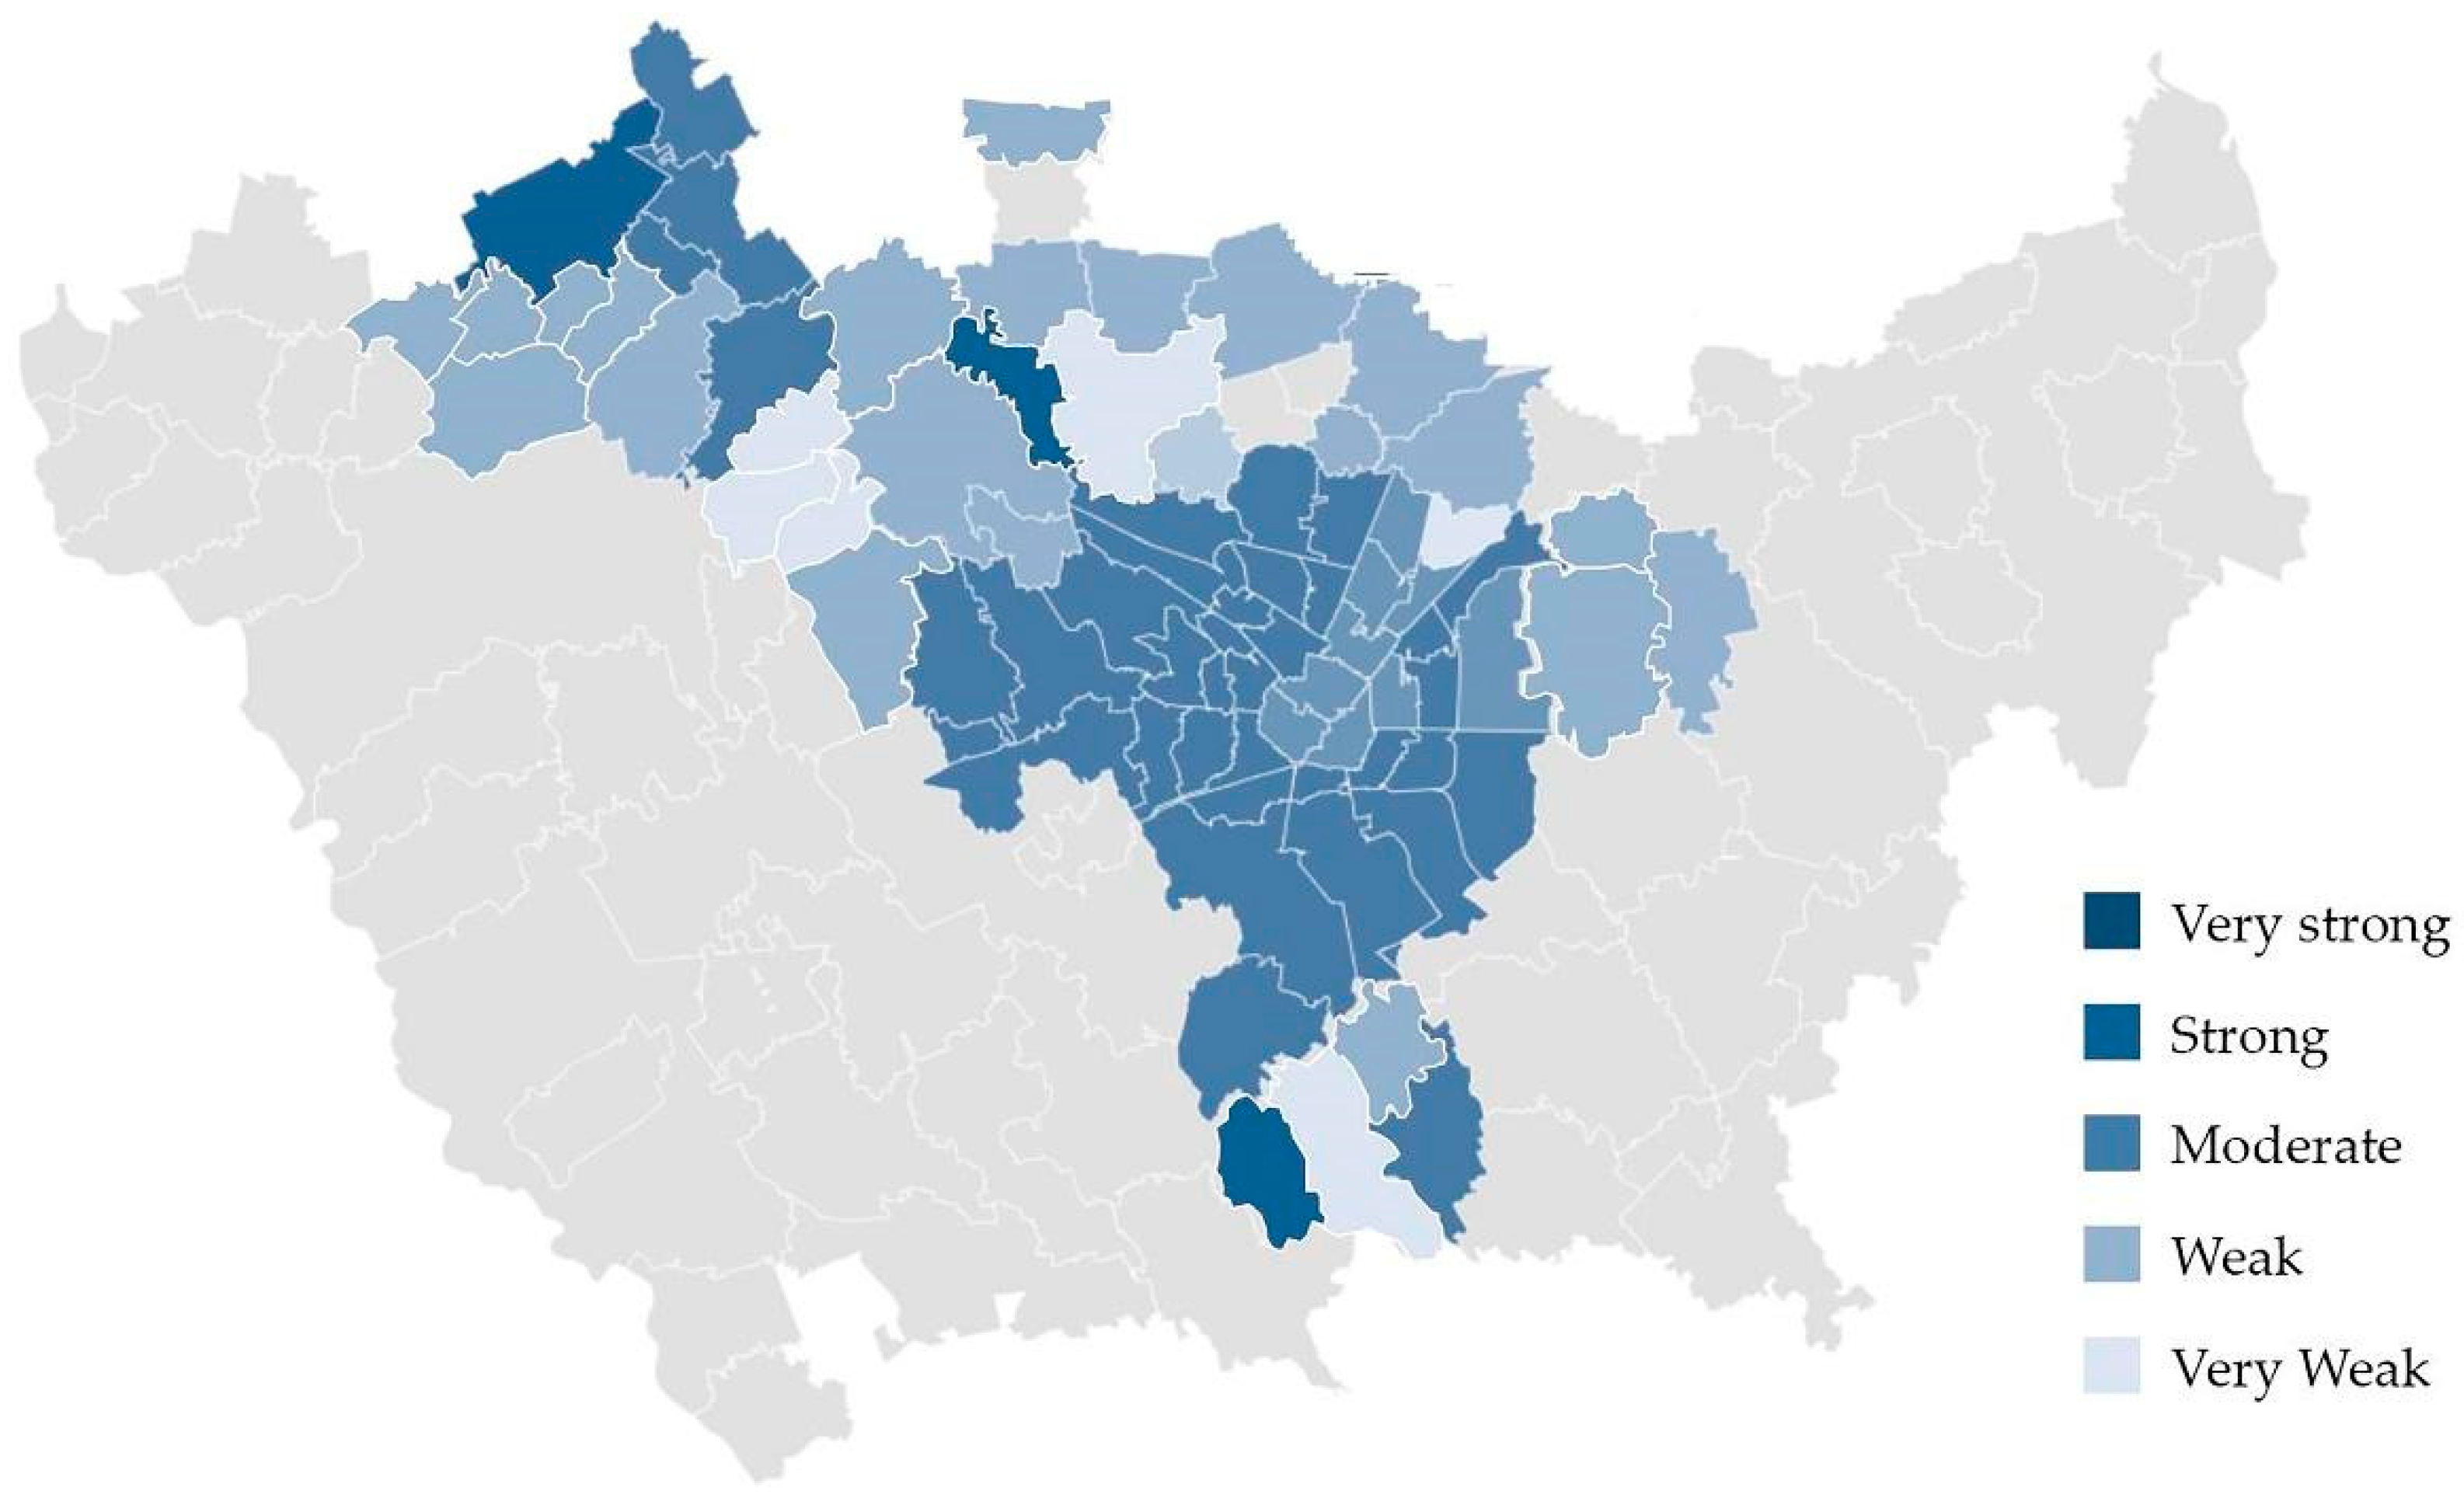
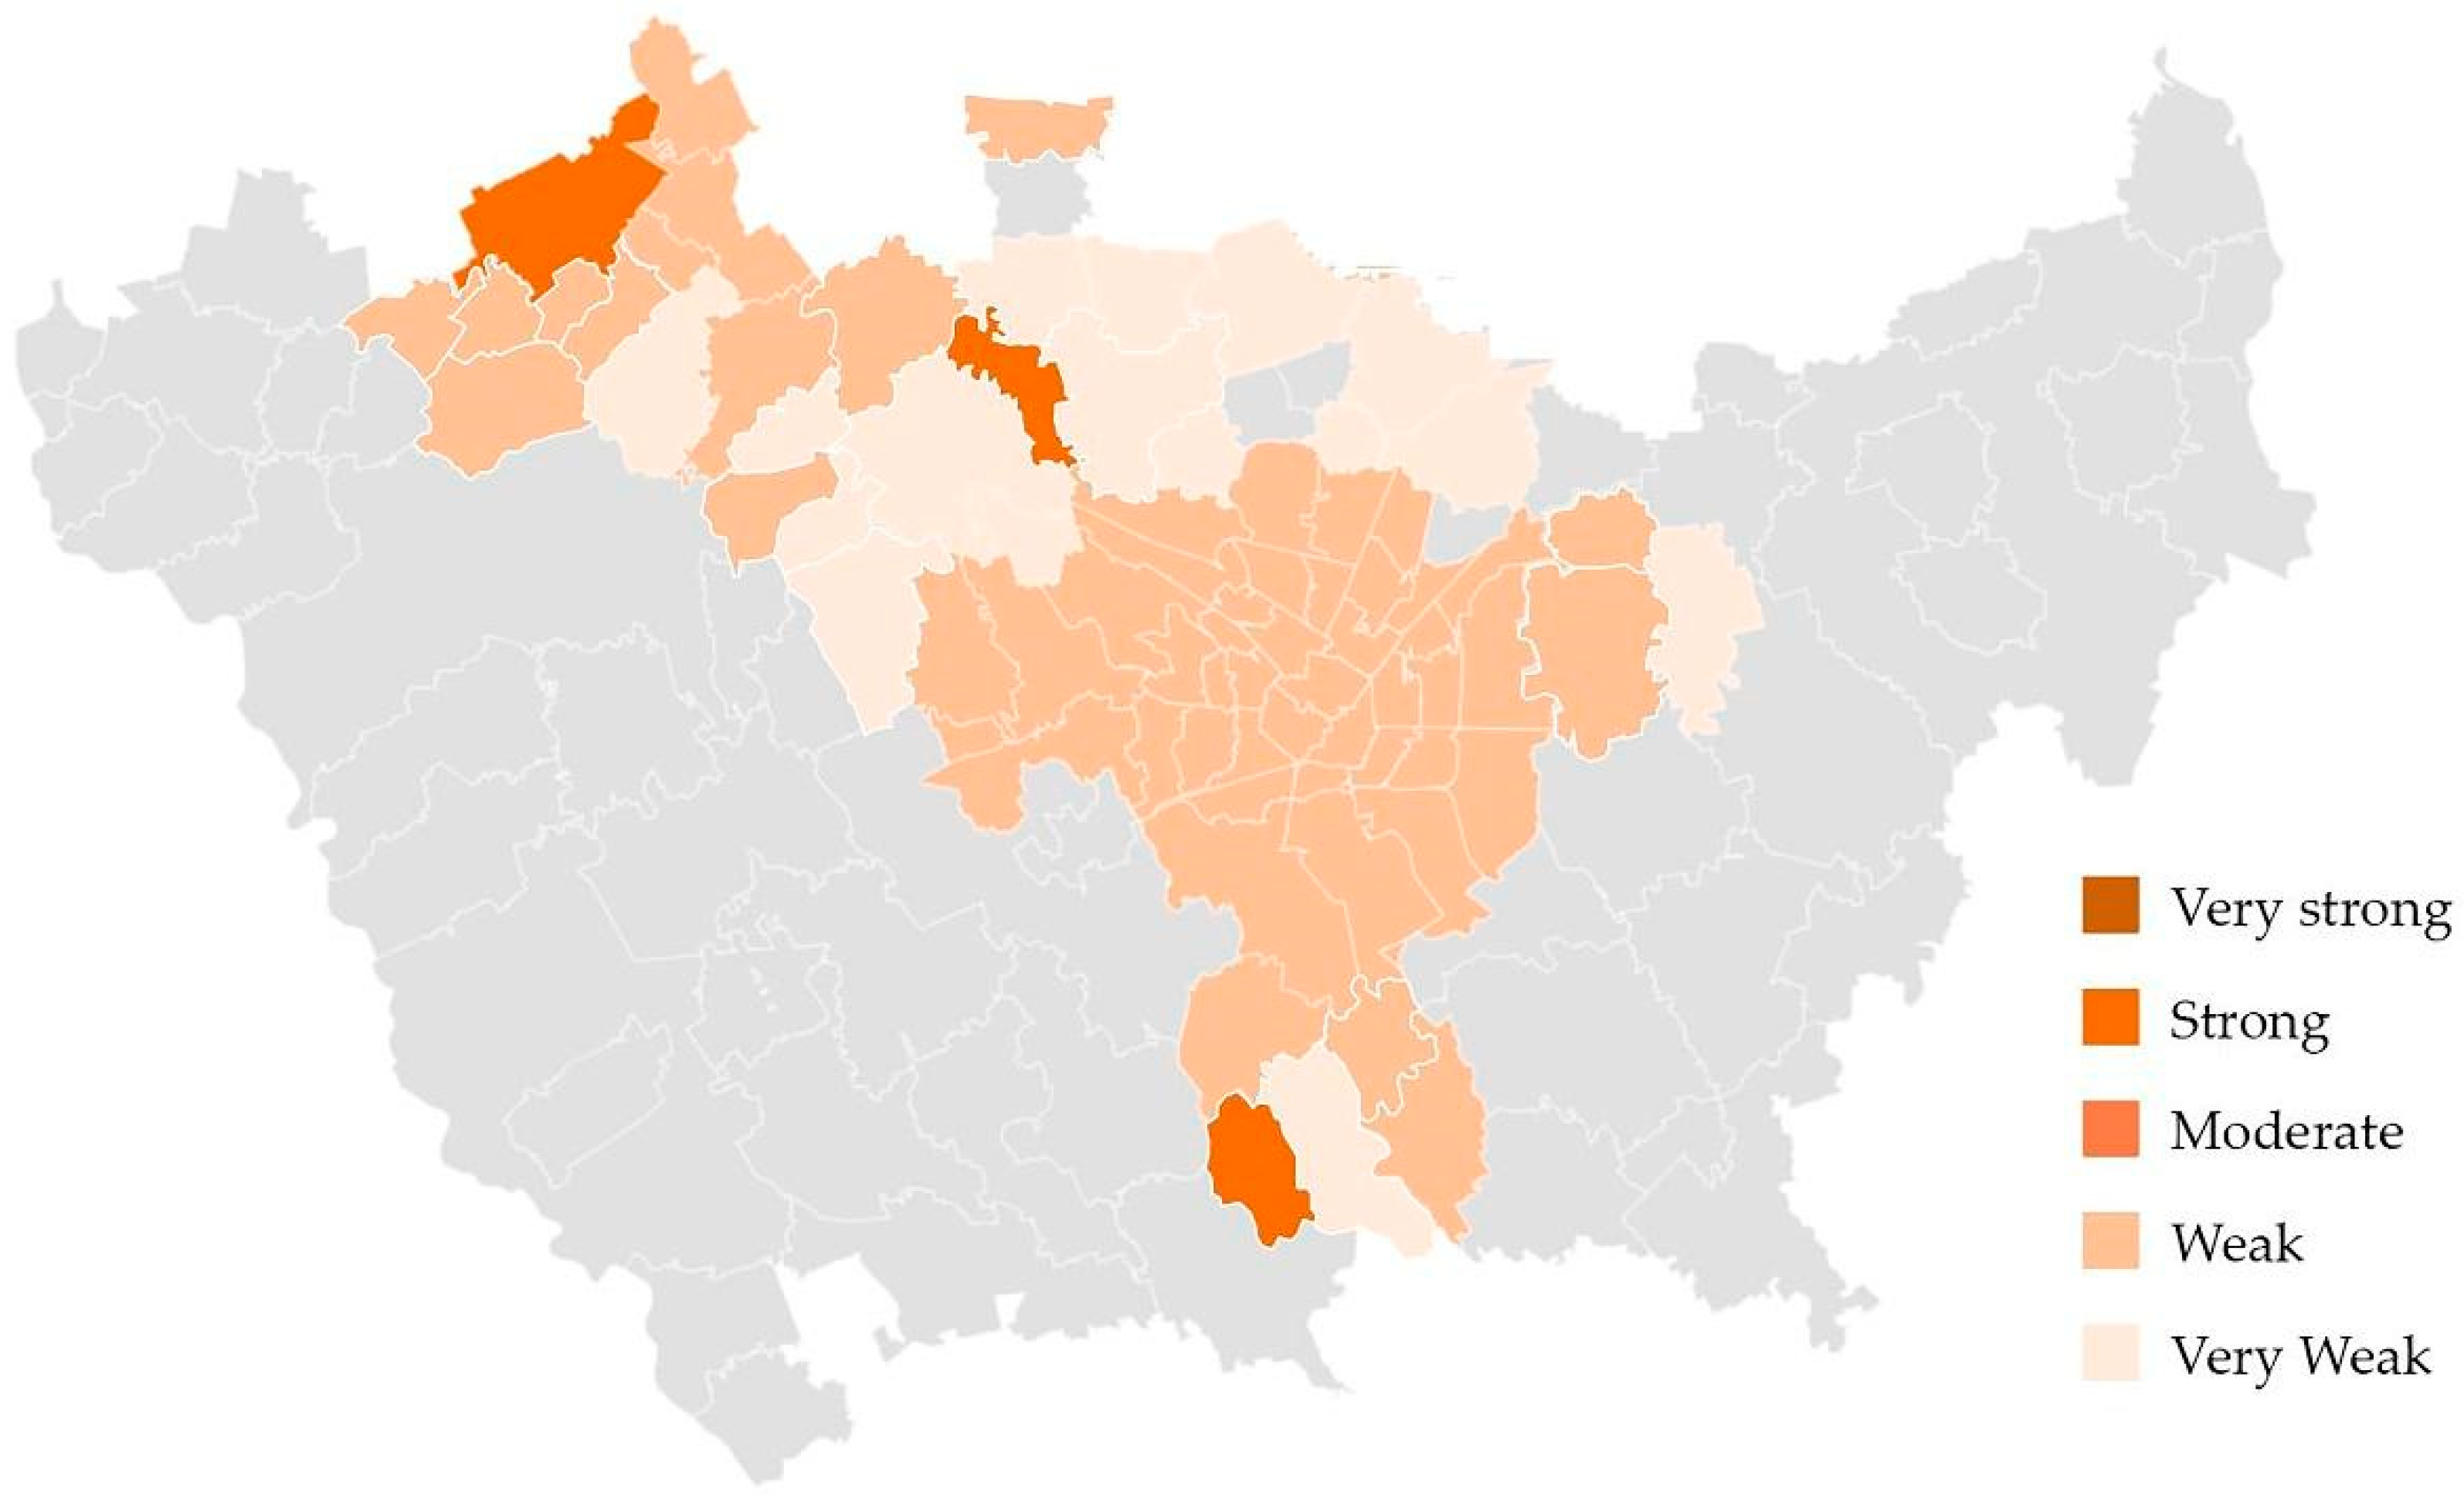
6.2.1. Results for the Metropolitan City of Milan

The analysis based on the k-medoids clustering aims to identify a dissimilarity of the agreed rents in the Metropolitan City of Milan and their distance within the single cluster.
The analysis of the first the dataset of agreed rents for the Metropolitan City of Milan highlighted the following partition into three clusters:
  • (agreed rents 1–72; 74–75; 77–269) Cluster   1 with centroid in agreed rent 14;
  • (agreed rent 73) Cluster   2 with centroid in agreed rent 73;
  • (agreed rent 76) Cluster   3 with centroid in agreed rent 76.
The value of SC for the Cluster 1 is 0.88, which, according to the values proposed for it by Kaufman and Rousseeuw [38], identifies a strong structure.
The other clusters, i.e., Clusters 2 and 3, have a SC of 0 so in both cases no substantial structure was found.
In this case too, the analysis with k-medoids identifies three different configurations of reference agreed rents that refer to different levels of promotion of SH policies.
The three centroids (Figure 11) represent the center to which to report all the agreed rent falling within the specific cluster. These centroids are characterized by the following values of the characteristics, for which, to foster greater understanding, we present their not-normalized values:
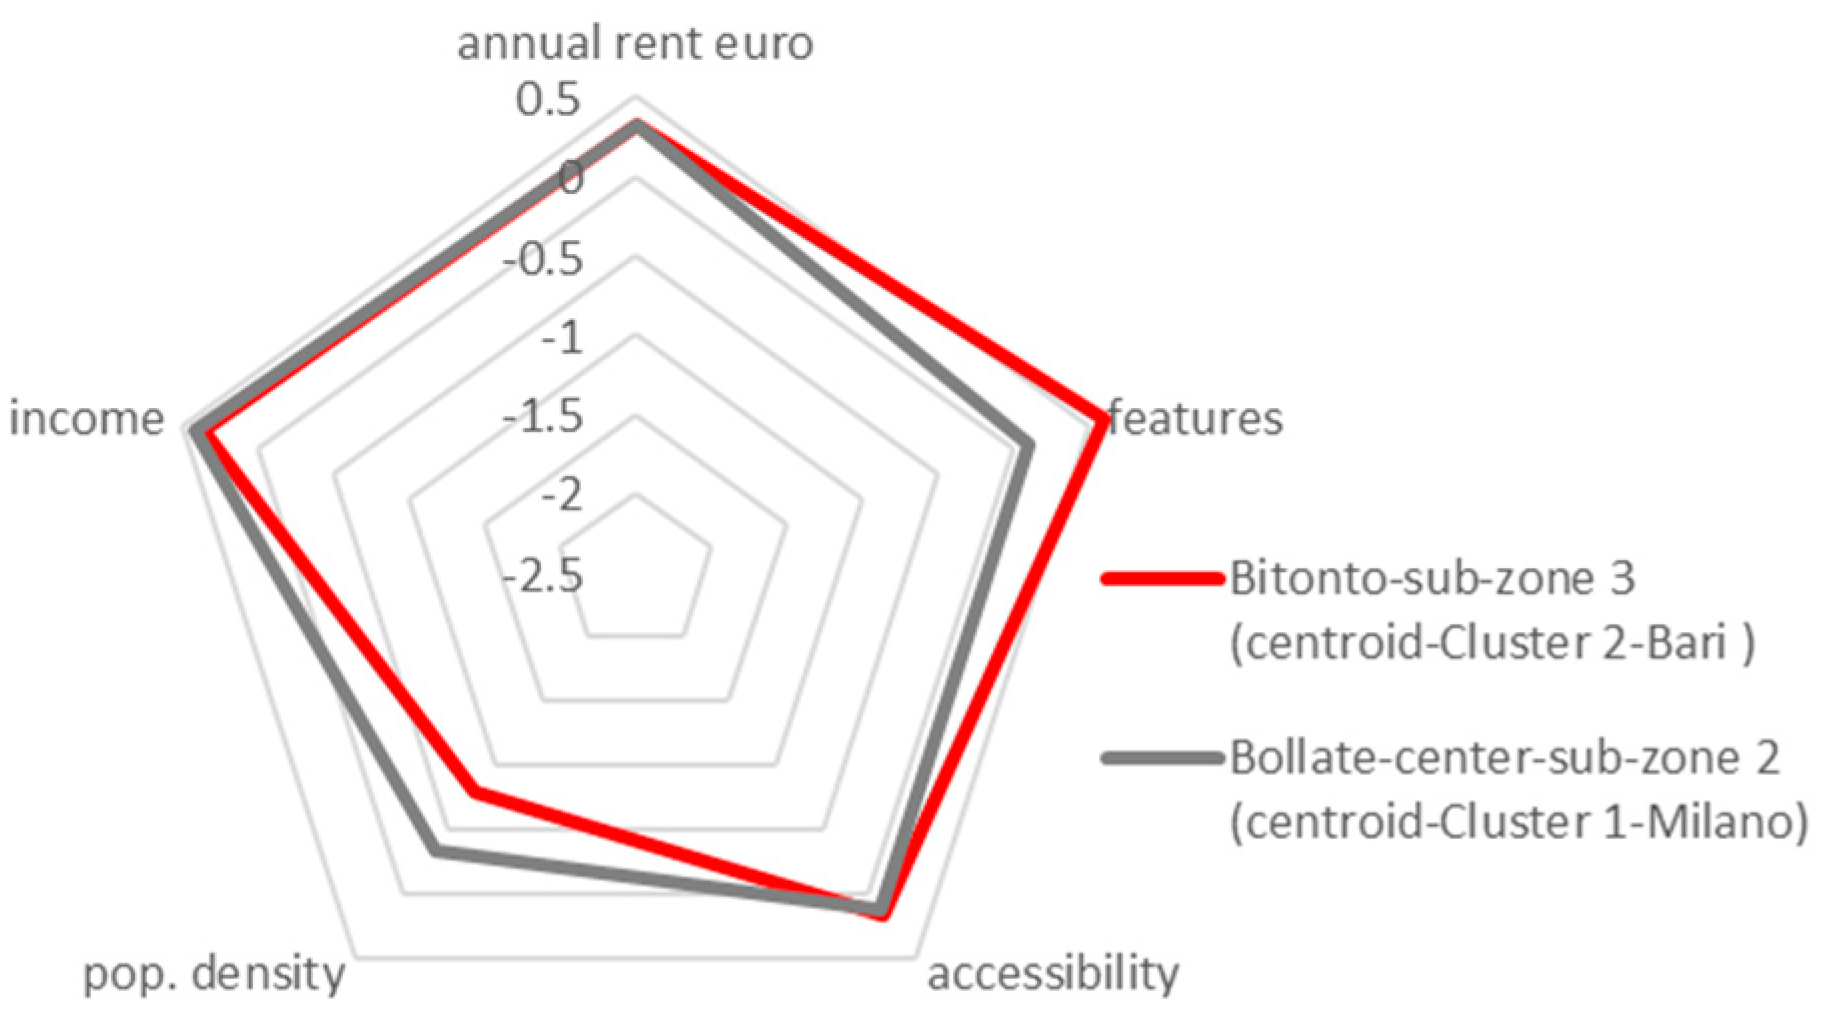
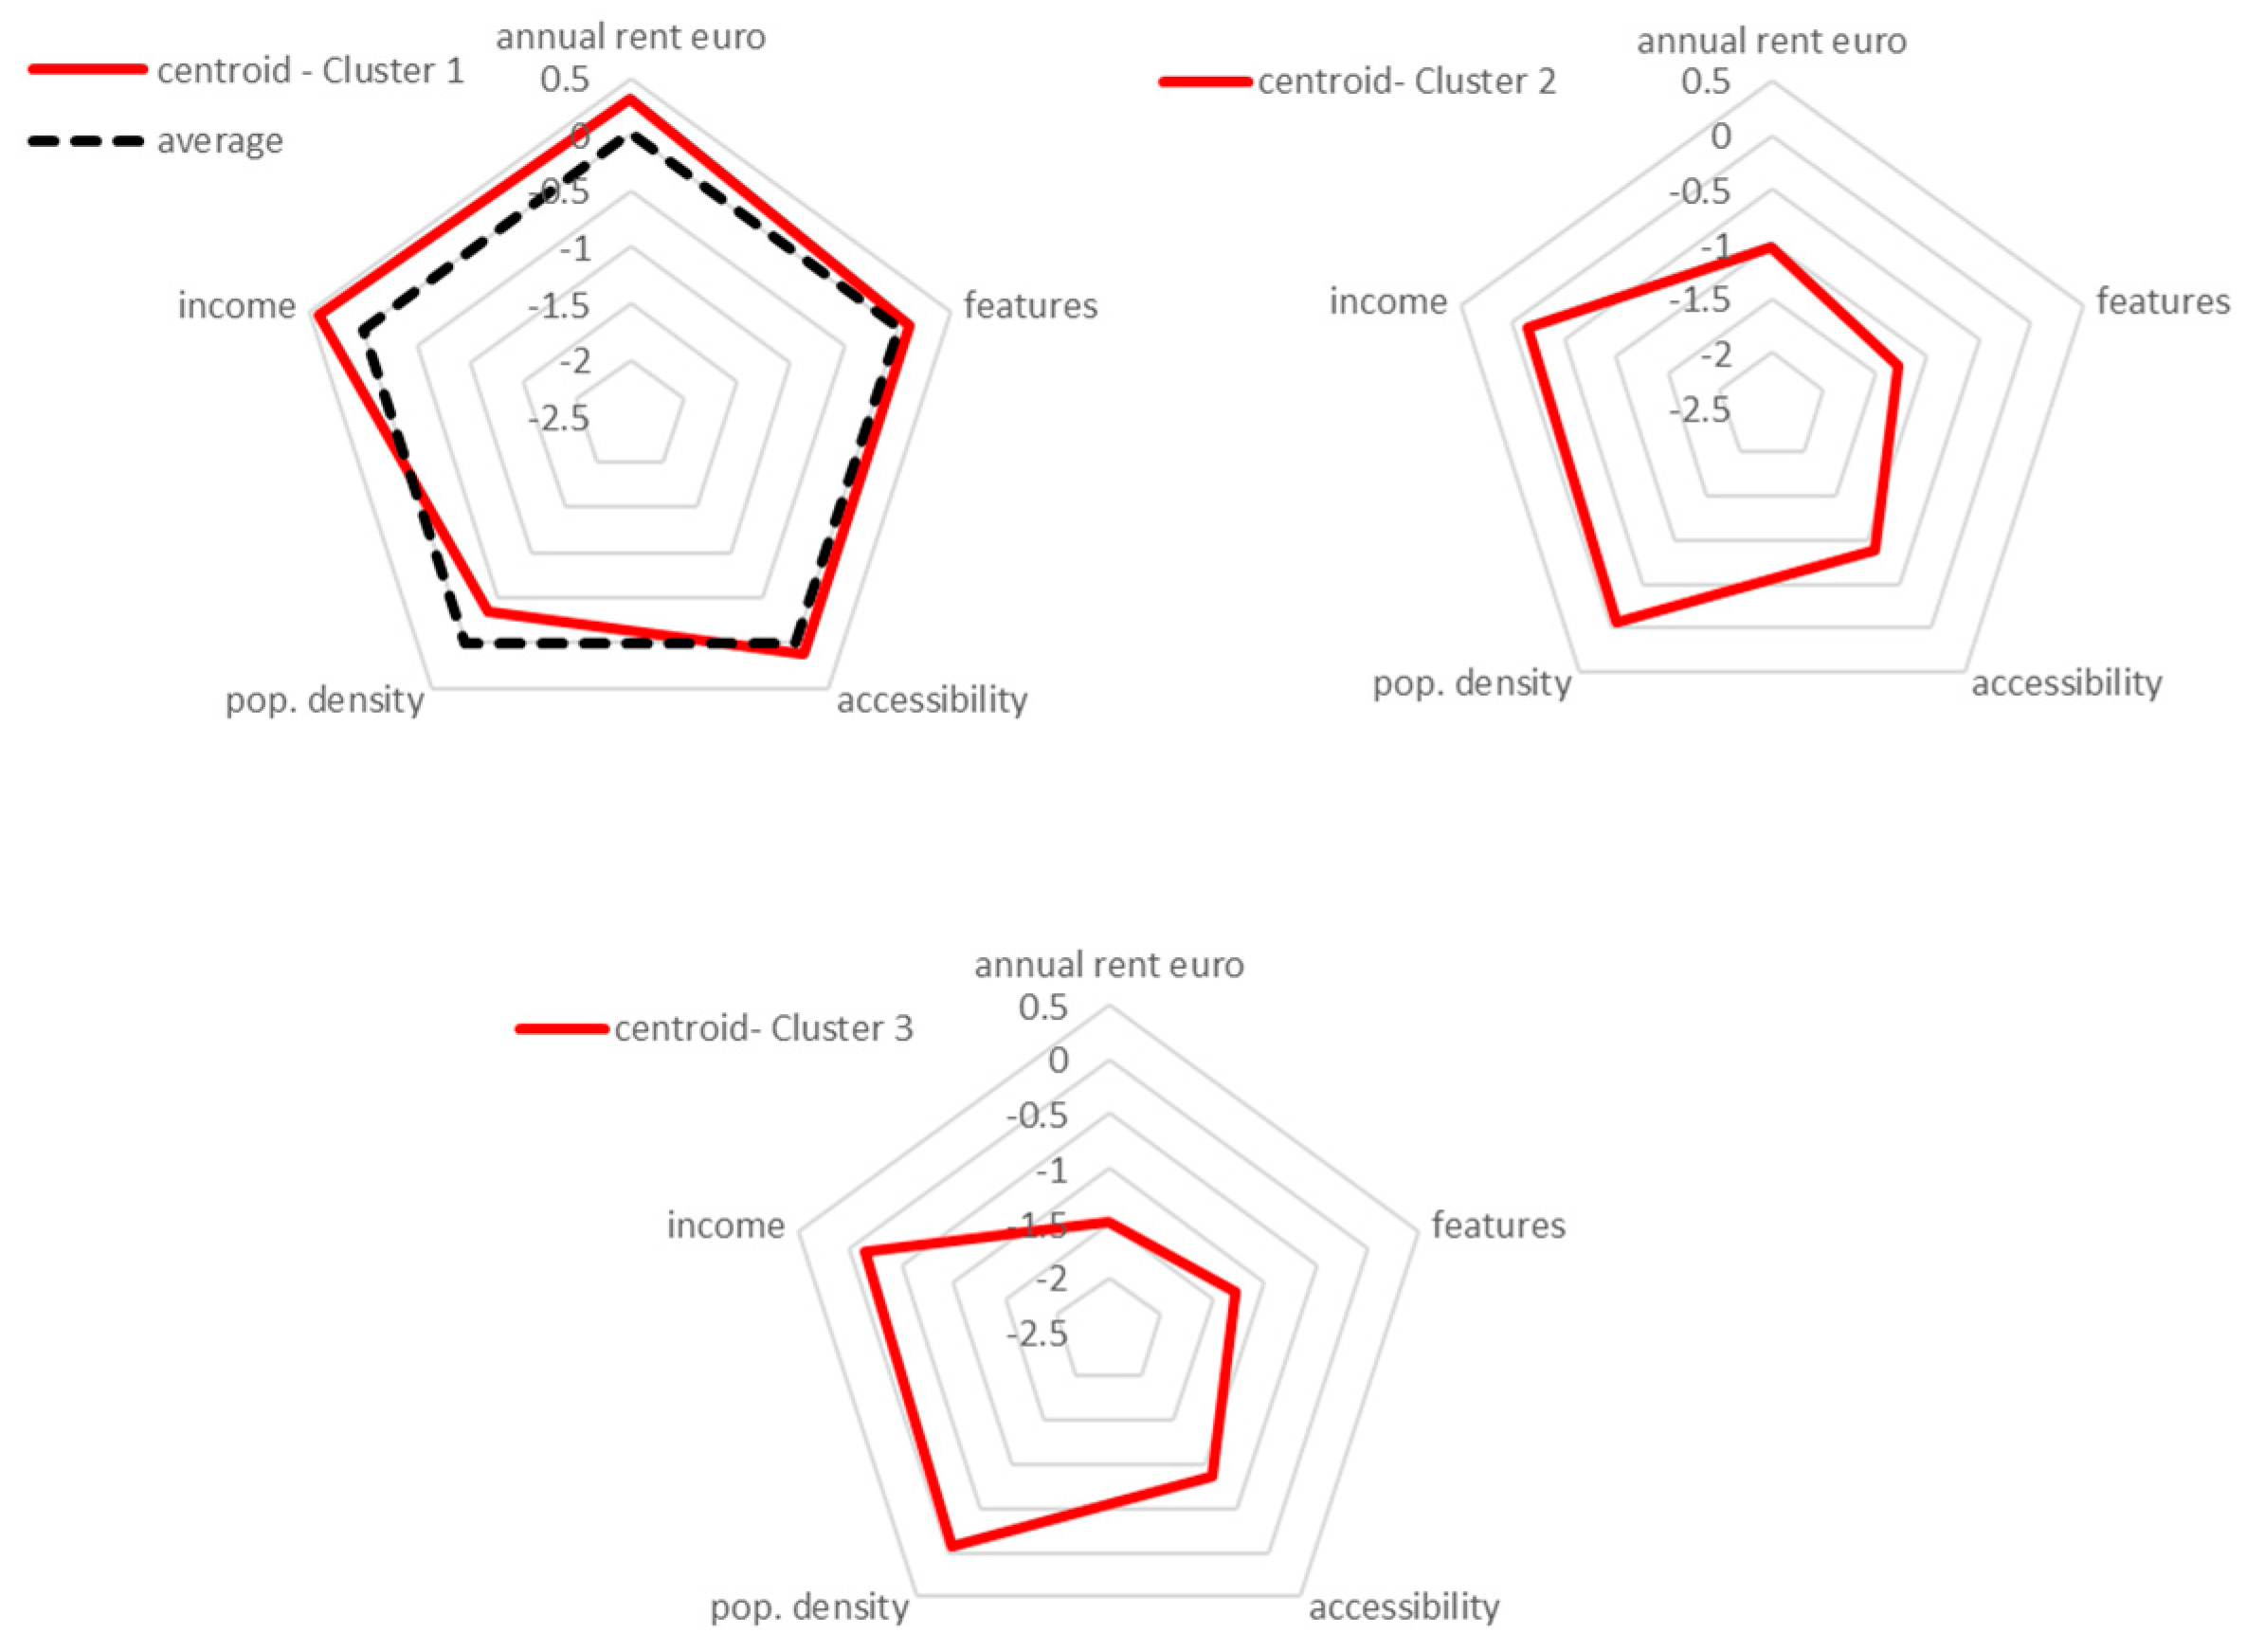
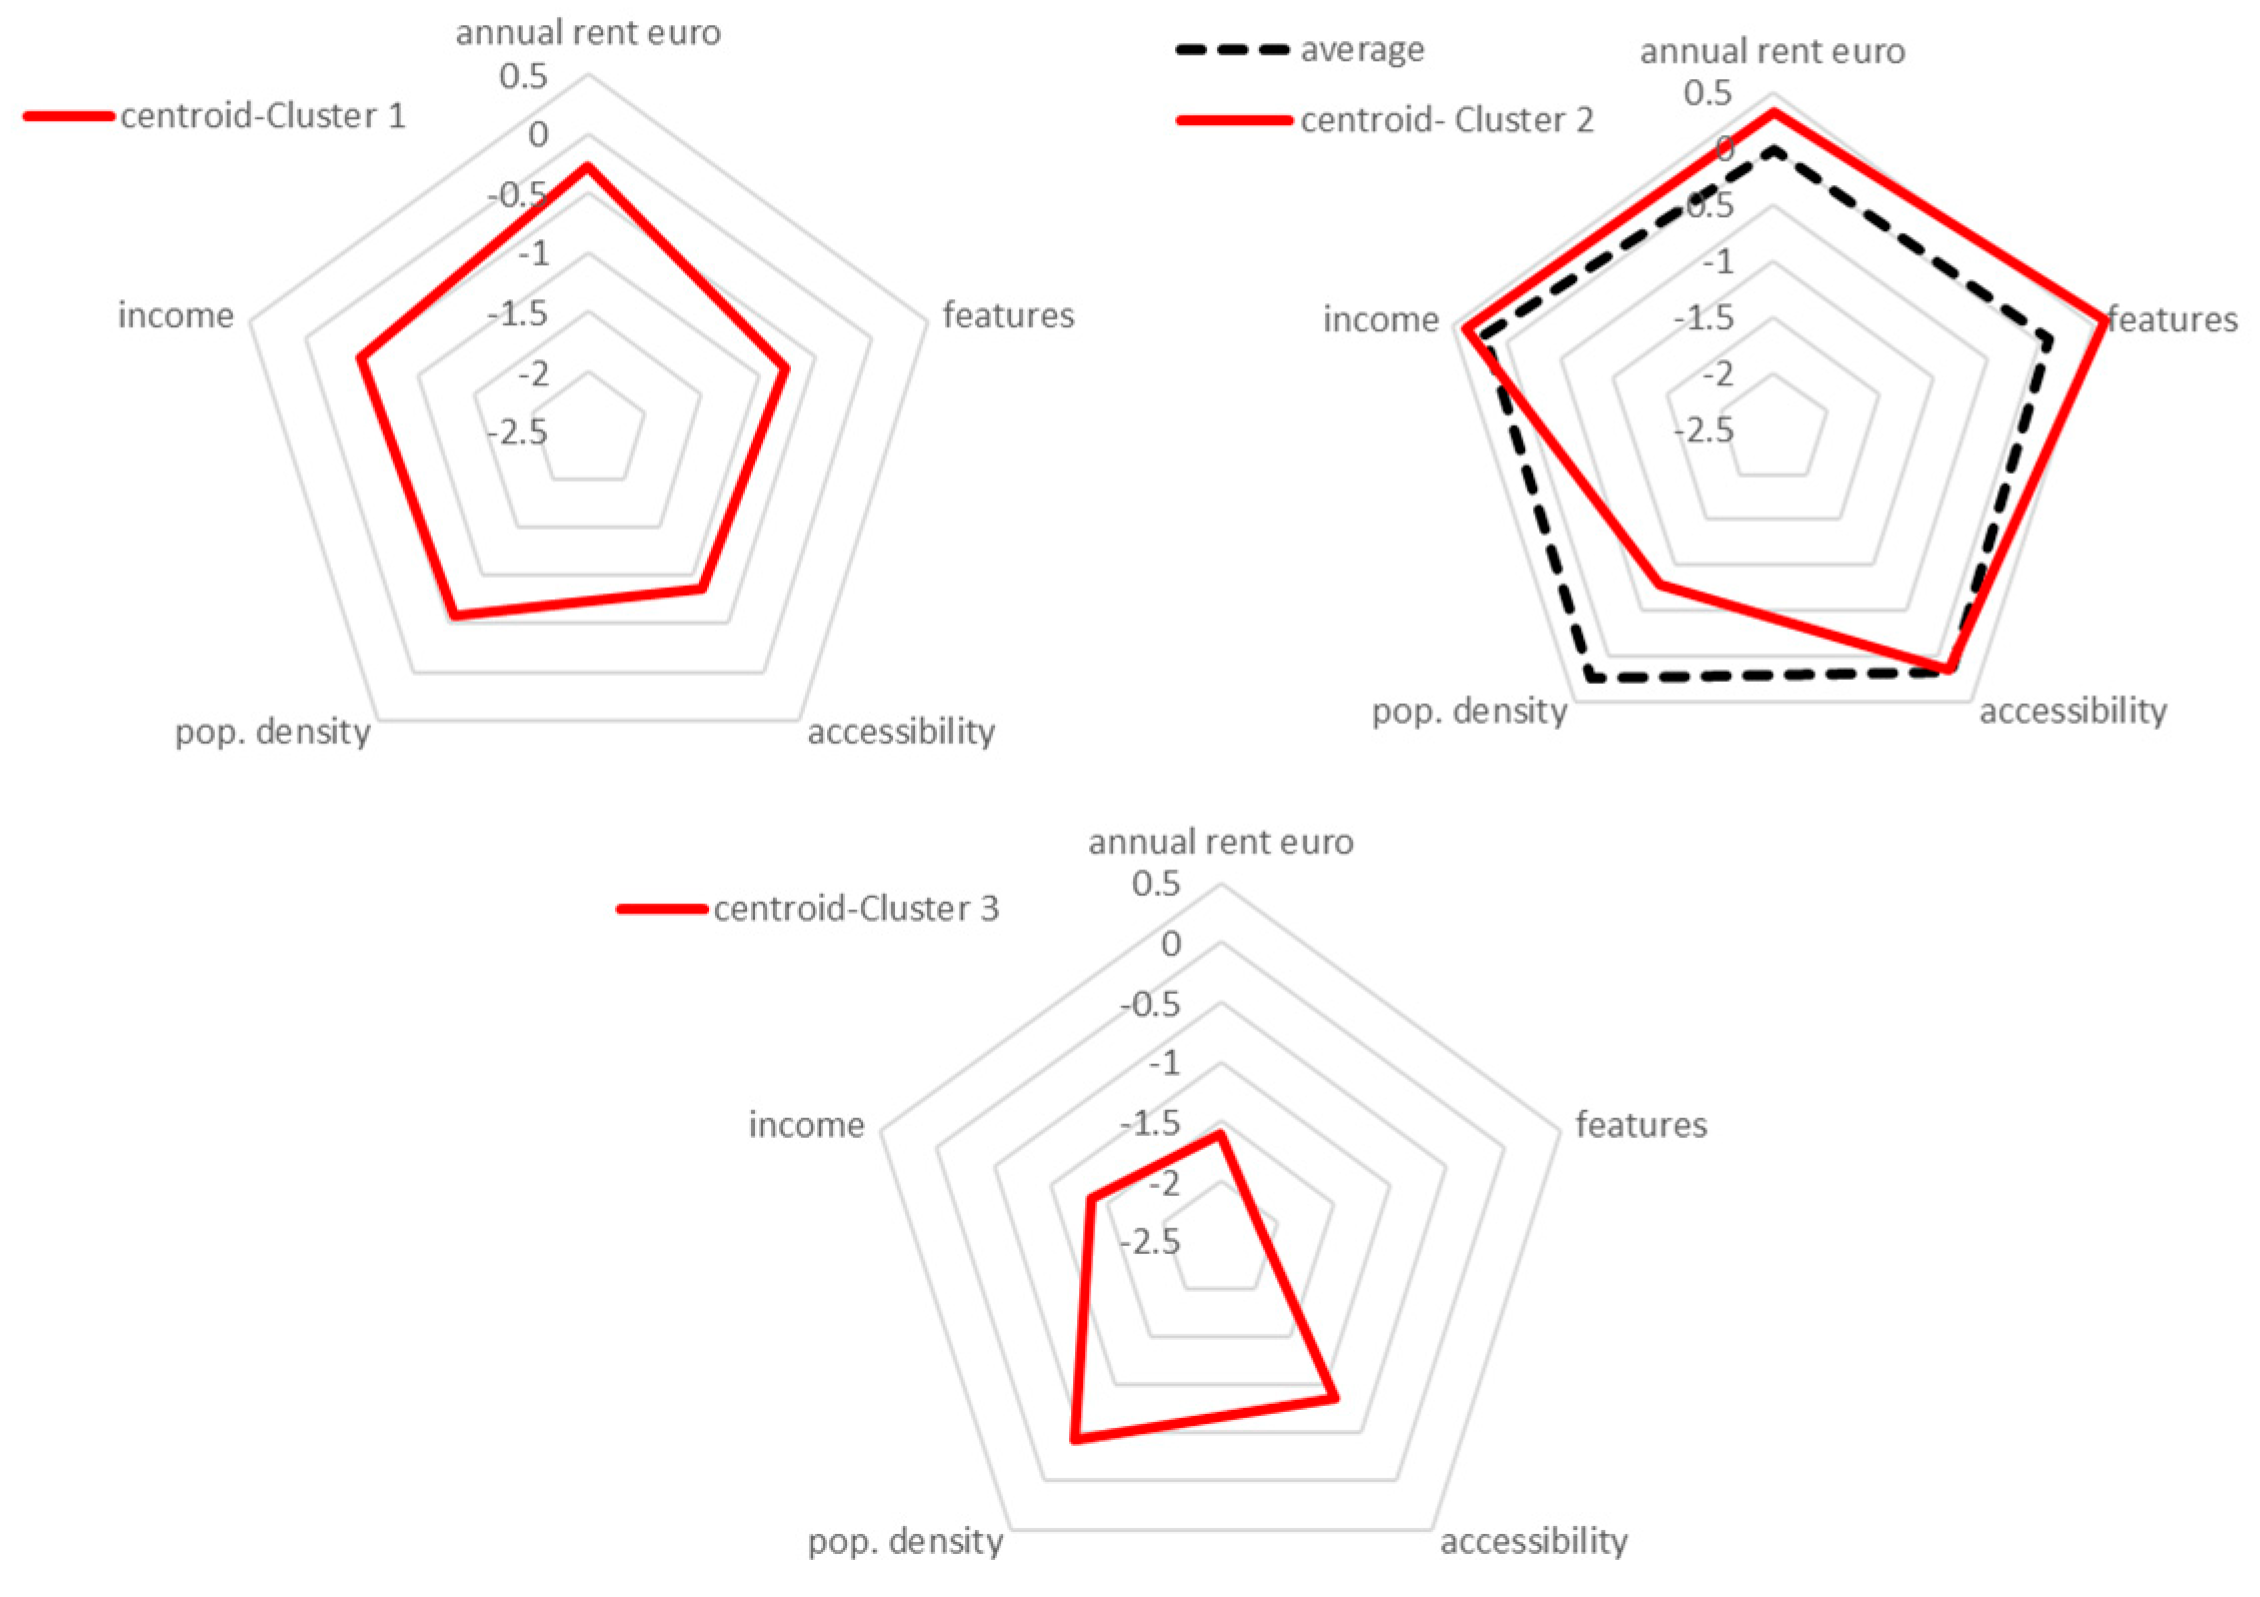
  • Centroid 1: annual rent of €70 per square meter; minimum real estate features score 5; accessibility score 4; population density 2801.91; population with income 15,000–26,000 as 35%, municipality: Bollate; sub-zone 2;
  • Centroid 2: annual rent of €44 per square meter; minimum real estate features score 1; accessibility score 3; population density 3412.67; population with income 15,000–26,000 as 32%. municipality: Legnano-semi-central; sub-zone 1.
  • Centroid 3: annual rent of €35 per square meter; minimum real estate features score 1; accessibility score 3; population density 3412.67; population with income 15,000–26,000 as 32%. Municipality: Legnano-suburb; sub-zone 1.
The number of clusters and number of classified elements in them highlights the existence of sub-market in the sample of agreed rents.
Only Cluster 1 can be considered a sub-market, as can be seen from the analysis on the robustness of the results of the cluster analysis. Clusters 2 and 3 do not identify a significant structure. The segment identified by cluster 1 is characterized by 267 agreed rents, while Cluster 2 and Cluster 3 are each characterized by one agreed rent.
The cluster analysis of the agreed rents within the Metropolitan City of Milan has highlighted only one segment, that of Cluster 1, in which the policies of social housing have been implemented consistently.
As a result, Cluster 1 appears to be the most significant to detect the coherence of the agreed rents for the Metropolitan City of Milan.
A further analysis by sub-zones of Cluster 1 highlighted the cluster’s internal differentiation based on the distance from the centroid, which is represented by the dimension of the sphere: the shorter the distance, the smaller the sphere, and the smaller the sphere, the bigger the coherence.
In particular, in Figure 12, the dimension of the sphere represents the distance, that is the dissimilarity of the agreed rent considered with the centroid agreed rent of reference for Cluster 1, that is with Bollate-centre-sub-zone 2 and for sub-zone 1.
In Figure 13, the dimension of the sphere represents the distance, that is the dissimilarity of the agreed rent considered with the centroid or agreed rent of reference for Cluster 1, that is with Bollate-center-sub-zone 2 and for sub-zone 2.
In Figure 14, the dimension of the sphere represents the distance, that is the dissimilarity of the agreed rent considered with the centroid or agreed rent of reference for Cluster 1, that is with Bollate-centre-sub-zone 2 and for sub-zone 3.
The analysis based on the clustering k-medoids, which aims to identify a similarity within a single cluster, has evidenced results that are quite articulated. In this regard, in order to propose a more structured discussion of the results we have achieved, we propose to follow a further analysis aimed at highlighting the internal differentiation of the cluster by a filtering based on the semantic of differentiation of the attractiveness of MACBETH applied to the clusters 1 for the Metropolitan City of Milan.
The semantic categories of MACBETH and the corresponding distances from the centroid are: extreme (>100), very strong (100–40), strong (40–20), moderate (20–10), weak (10–3), very weak (3–1), no difference (1–0).
We chose to attribute to the agreed rent falling in the semantic categories no difference, very weak, and weak, respectively, excellent coherence, very good, and a good coherence.
The analysis by sub-zones of Cluster 1 for the Metropolitan City of Milan highlighted the following cluster internal differentiations.
Figure 15 shows the location of the sub-zones 1 in the Metropolitan City of Milan in which the groupings of the agreed rents are identified with a very strong, strong, moderate, weak, and very weak distance to Cluster centroid 1 (see also Appendix A).
Figure 16 shows the location of the sub-zones 2 in the Metropolitan City of Milan in which the groupings of the agreed rents are identified with a strong or weak distance to Cluster centroid 1 (see also Appendix B).
Figure 17 shows the location of the sub-zones 3 in the Metropolitan City of Milan in which the groupings of the agreed rents are identified with a strong, weak, and very weak distance to Cluster centroid 1 (see also Appendix C).

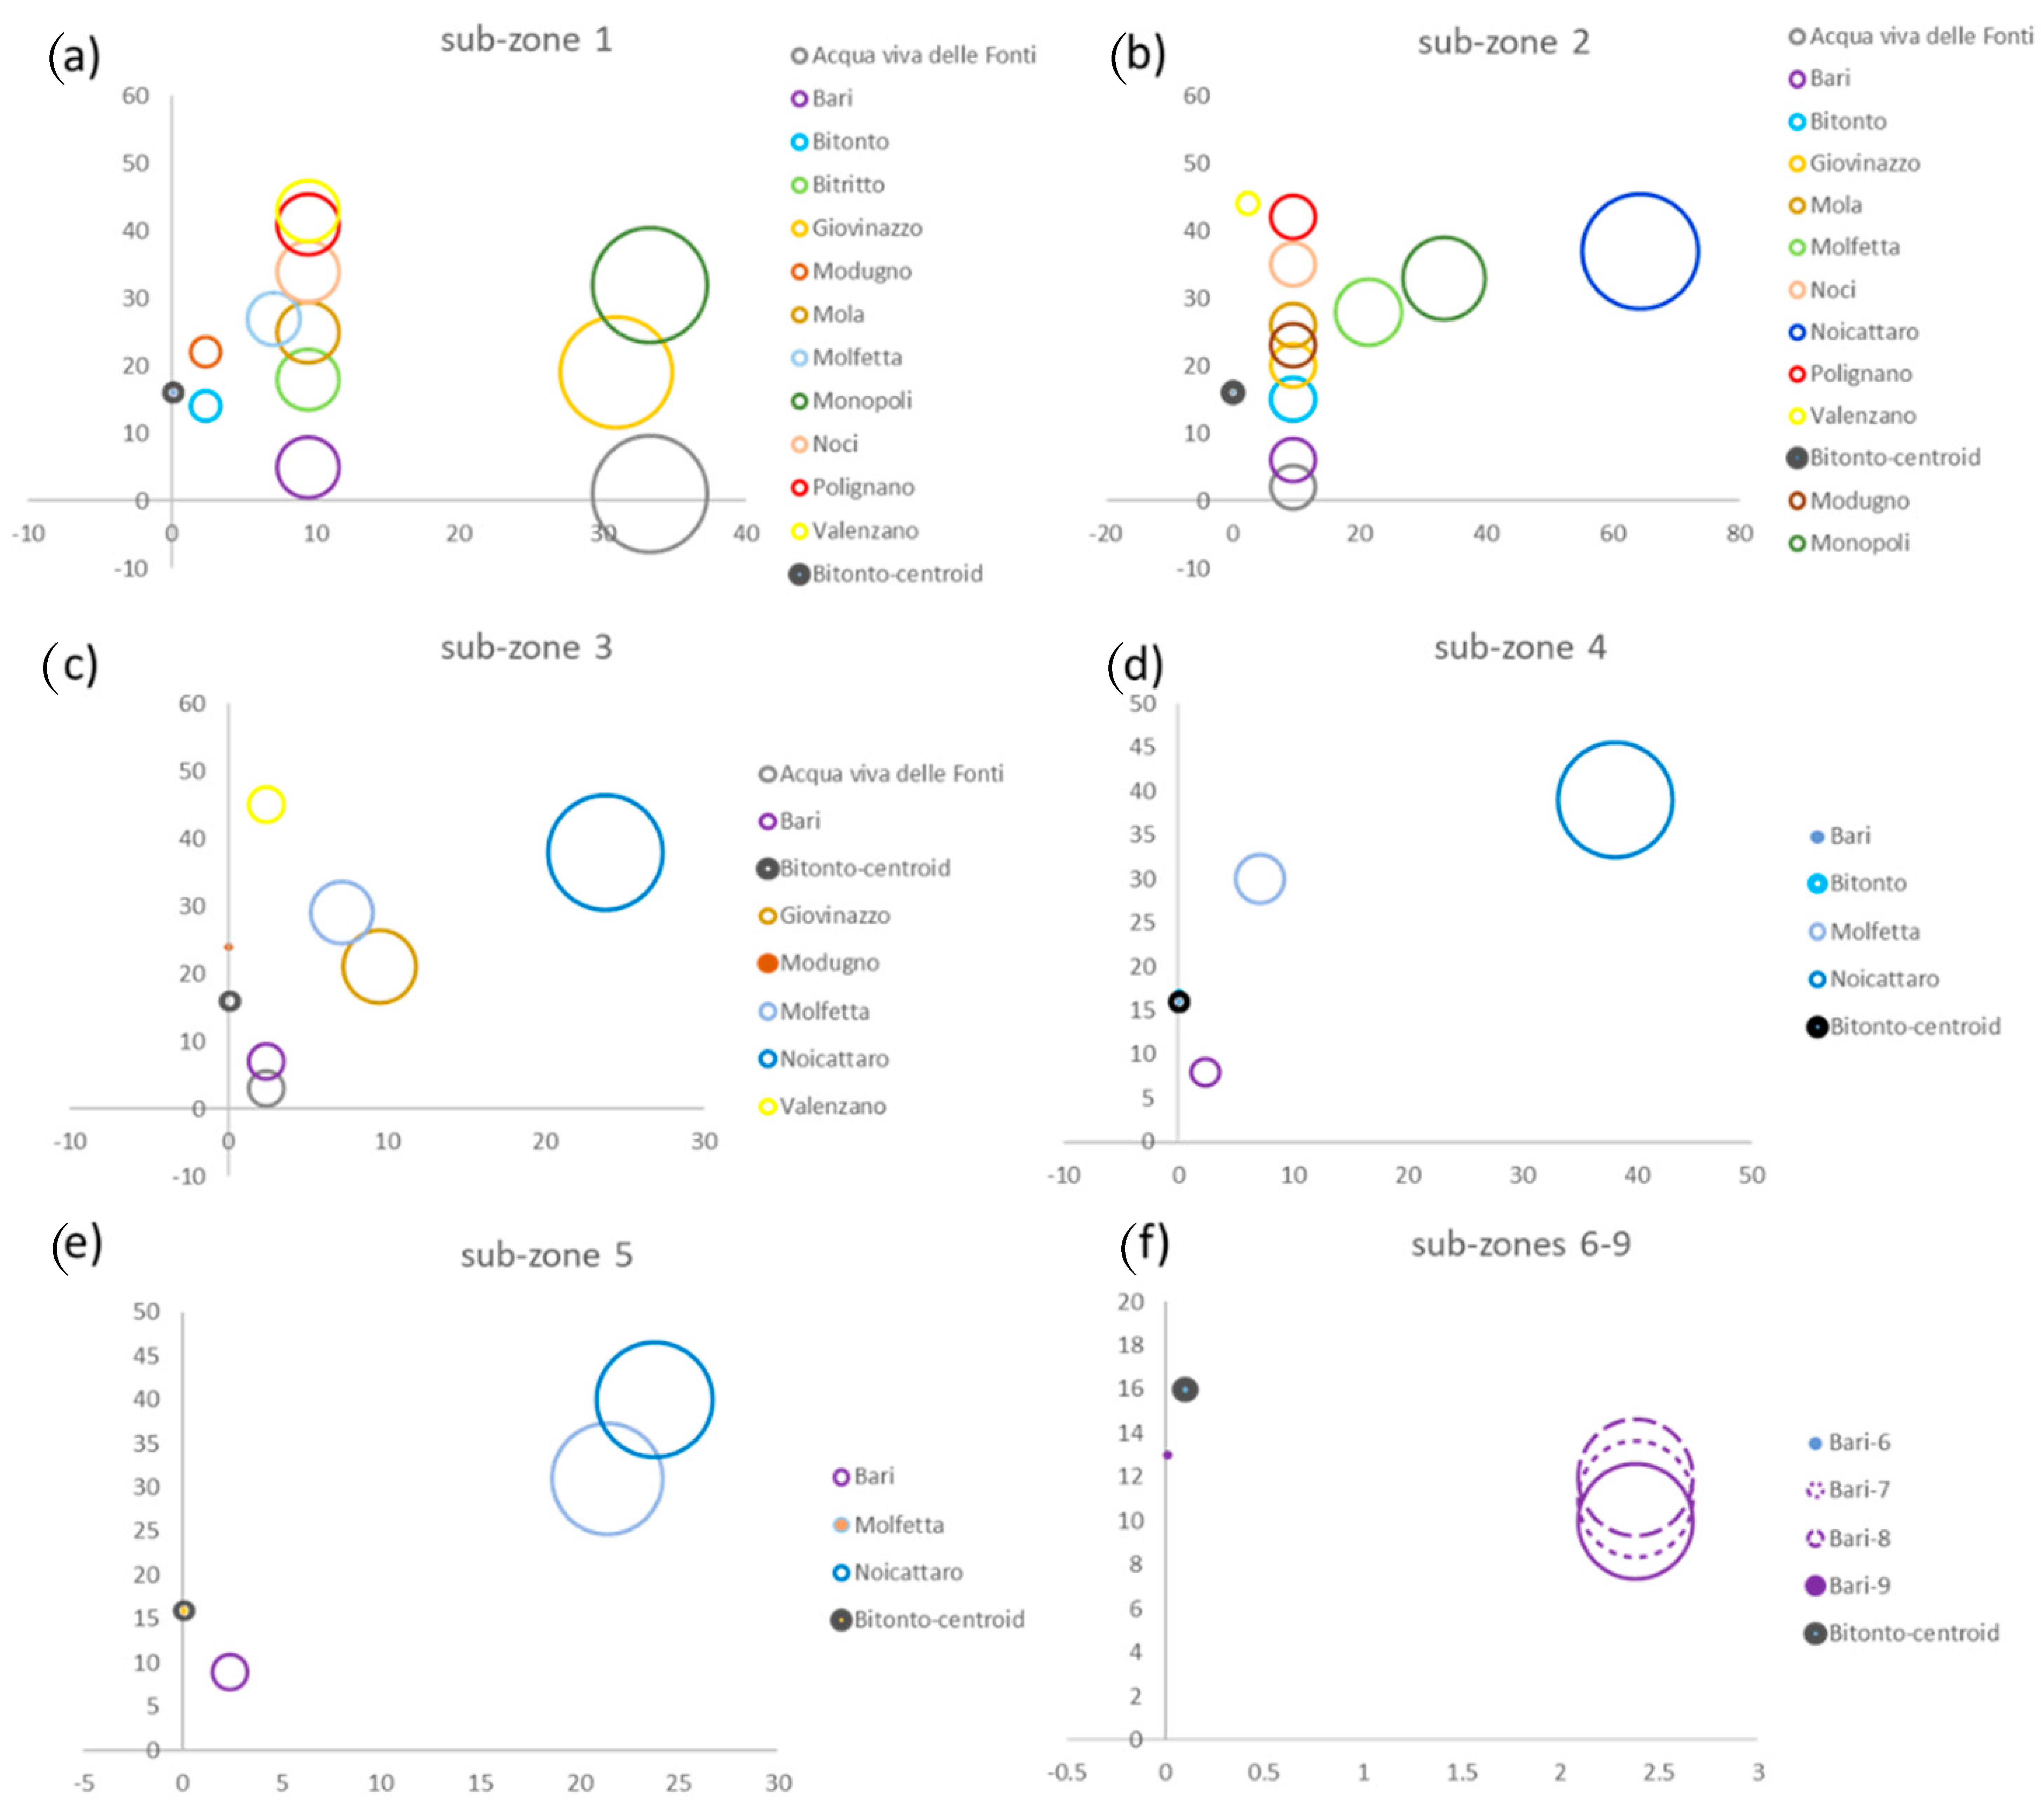
6.2.2. Results for the Metropolitan City of Bari

The analysis based on the k-medoids clustering of the second data set of agreed rents for the Metropolitan City of Bari highlighted the following partition into three clusters:
  • (agreed rent 4) Cluster   1 with centroid in agreed rent 4;
  • (agreed rents 1–3, 5–35, 37–45) Cluster   2 with centroid in agreed rent 16;
  • (agreed rent 36) Cluster   3 with centroid in agreed rent 3.
The value of SC for the Cluster 2 is 0.84, which, according to the values proposed for it by Kaufman and Rousseeuw, identifies a strong structure. The other clusters, i.e., Clusters 1 and 3, have a SC of 0 so in both cases, no substantial structure was found.
The three clusters structure is characterized by the three centroids that represent the center to which to report all agreed rents falling within the specific cluster. The three centroids (Figure 18) have the following values of the characteristics, which, in order to favor their understanding, are reported as the not-normalized values:
  • Centroid 1: annual rent of €26.04 per square meter; minimum real estate features score 5; accessibility score 4; population density 312.65; population with income 15,000–26,000 as 26%, municipality: Adelfia; sub-zone 1.
  • Centroid 2: annual rent of €22.32 per square meter; minimum real estate features score 4; accessibility score 3; population density 498.96; population with income 15,000–26,000 as 25%, municipality: Bitonto; sub-zone 3.
  • Centroid 3: annual rent of €14.28 per square meter; minimum real estate features score 3; accessibility score 3; population density 643.44; population with income 15,000–26,000 as 23%, municipality: Noicottaro; sub-zone 1.
In the case of the Metropolitan City of Bari, only Cluster 2 can be considered a sub-market, as can be seen from the analysis on the robustness of the results of the cluster analysis. Clusters 1 and 3 do not identify a significant structure. The segment identified by Cluster 2 is characterized by 43 agreed rents, while Cluster 1 and Cluster 3 are characterized by one agreed rent.
The cluster analysis of the agreed rents within the Metropolitan cIty of Bari highlighted the segment of Cluster 2, in which the policies of social housing were implemented in a coherent manner.
As a result, Cluster 2 appears to be the most significant to detect the coherence of the agreed rents for the Metropolitan City of Bari.
In particular, in Figure 19a, the dimension of the sphere represents the distance of the agreed rent considered with the centroid or agreed rent of reference for Cluster 2, that is the agreed rent for Bitonto-sub-zone 3 and those of the sub-zone 1.
In Figure 19b, the dimension of the sphere represents the distance of each agreed rent for the sub-zone 2 with the centroid of Cluster 2, namely Bitonto-sub-zone 3.
Similarly, in Figure 19c–f, the dimension of the sphere represents the distance, that is the dissimilarity of the agreed rent considered with the centroid or agreed rent of reference for Cluster 2, that is Bitonto-sub-zone 3 respectively with sub-zone 3, sub-zone 4, sub-zone 5, and sub-zones 6-7-8-9.
These last types of sub-zones were detected only for the municipality of Bari.
In addition, in the case of the Metropolitan City of Bari, we propose a further analysis aimed at highlighting the internal similarity of the Cluster 2 by a filtering based on the semantic categories of Macbeth.
The analysis by sub-zones of Cluster 2 for the Metropolitan City of Bari highlighted the following cluster internal differentiations.
For the agreed rents in sub-zone 1 of the Metropolitan City of Bari, the following groupings are identified, characterized by a strong (Acqua viva delle Fonti, Giovinazzo and Monopoli), moderate (Bari, Bitritto, Mola, Noci, Polignano and Valenzano), weak (Molfetta), and very weak (Bitonto sub-zone 1 and Modugno) distance to Cluster centroid 2.
For the agreed rents in sub-zone 2 of the Metropolitan City of Bari, the following groupings are identified, characterized by a very strong (Noicottaro), strong (Molfetta and Monopoli), moderate (Acqua viva delle Fonti, Bari, Bitonto sub-zone 2, Giovinazzo, Modugno, Mola, Noci, Polignano), and very weak (Valenzano) distance to Cluster centroid 2.
For the agreed rent in sub-zone 3 of the Metropolitan City of Bari, the following groupings are identified, characterized by a strong (Noicottaro), moderate (Giovinazzo), weak (Molfetta), very weak (Acqua viva delle Fonti, Bari, and Valenzano), and no difference (Modugno) centroid distance of cluster 2.
For the agreed rents in sub-zone 4 of the Metropolitan City of Bari, the following groupings are identified, characterized by a strong (Noicottaro), weak (Molfetta), very weak (Bari), and no difference (Bitonto-sub-zone 4) centroid distance of Cluster 2.
For the agreed rents in sub-zone 5 of the Metropolitan City of Bari, the following groupings are identified, characterized by a strong (Molfetta and Noicottato), very weak (Bari) centroid distance of Cluster 2.
For these agreed rents, the following groupings are identified: very weak (Bari sub-zone 6, 7, 8) and no difference (Bari sub-zone 9) centroid distance of cluster 2.

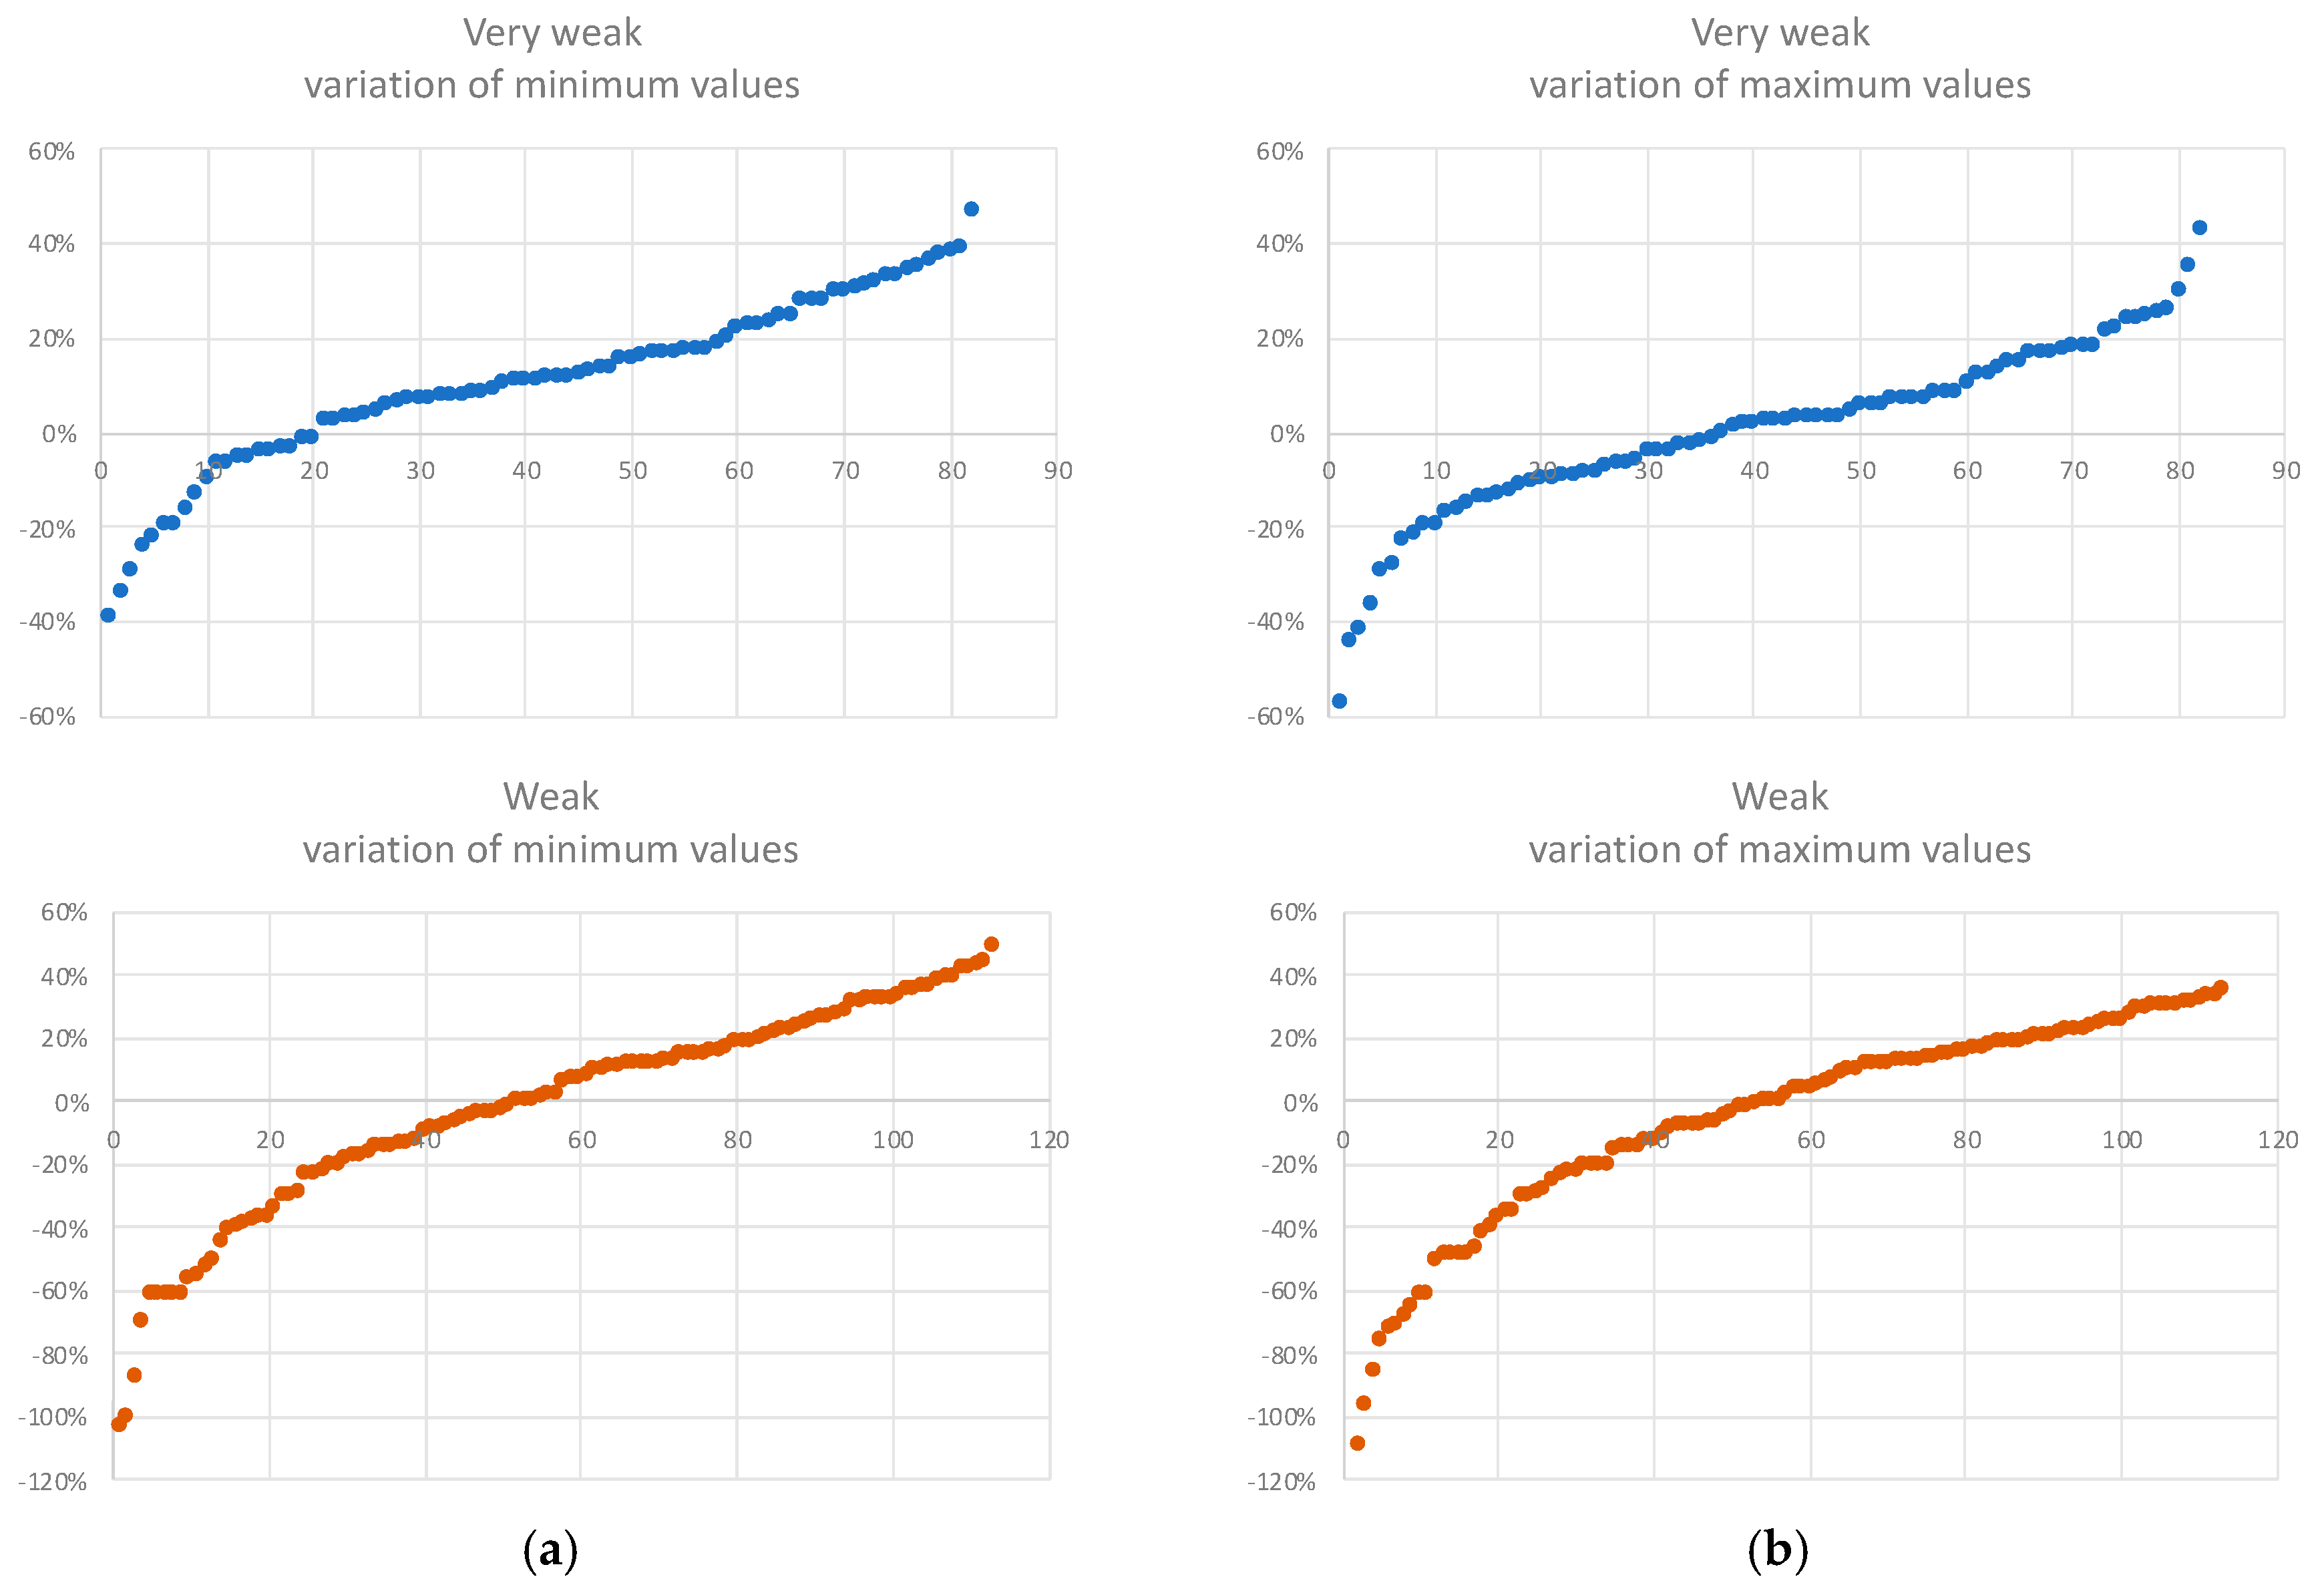
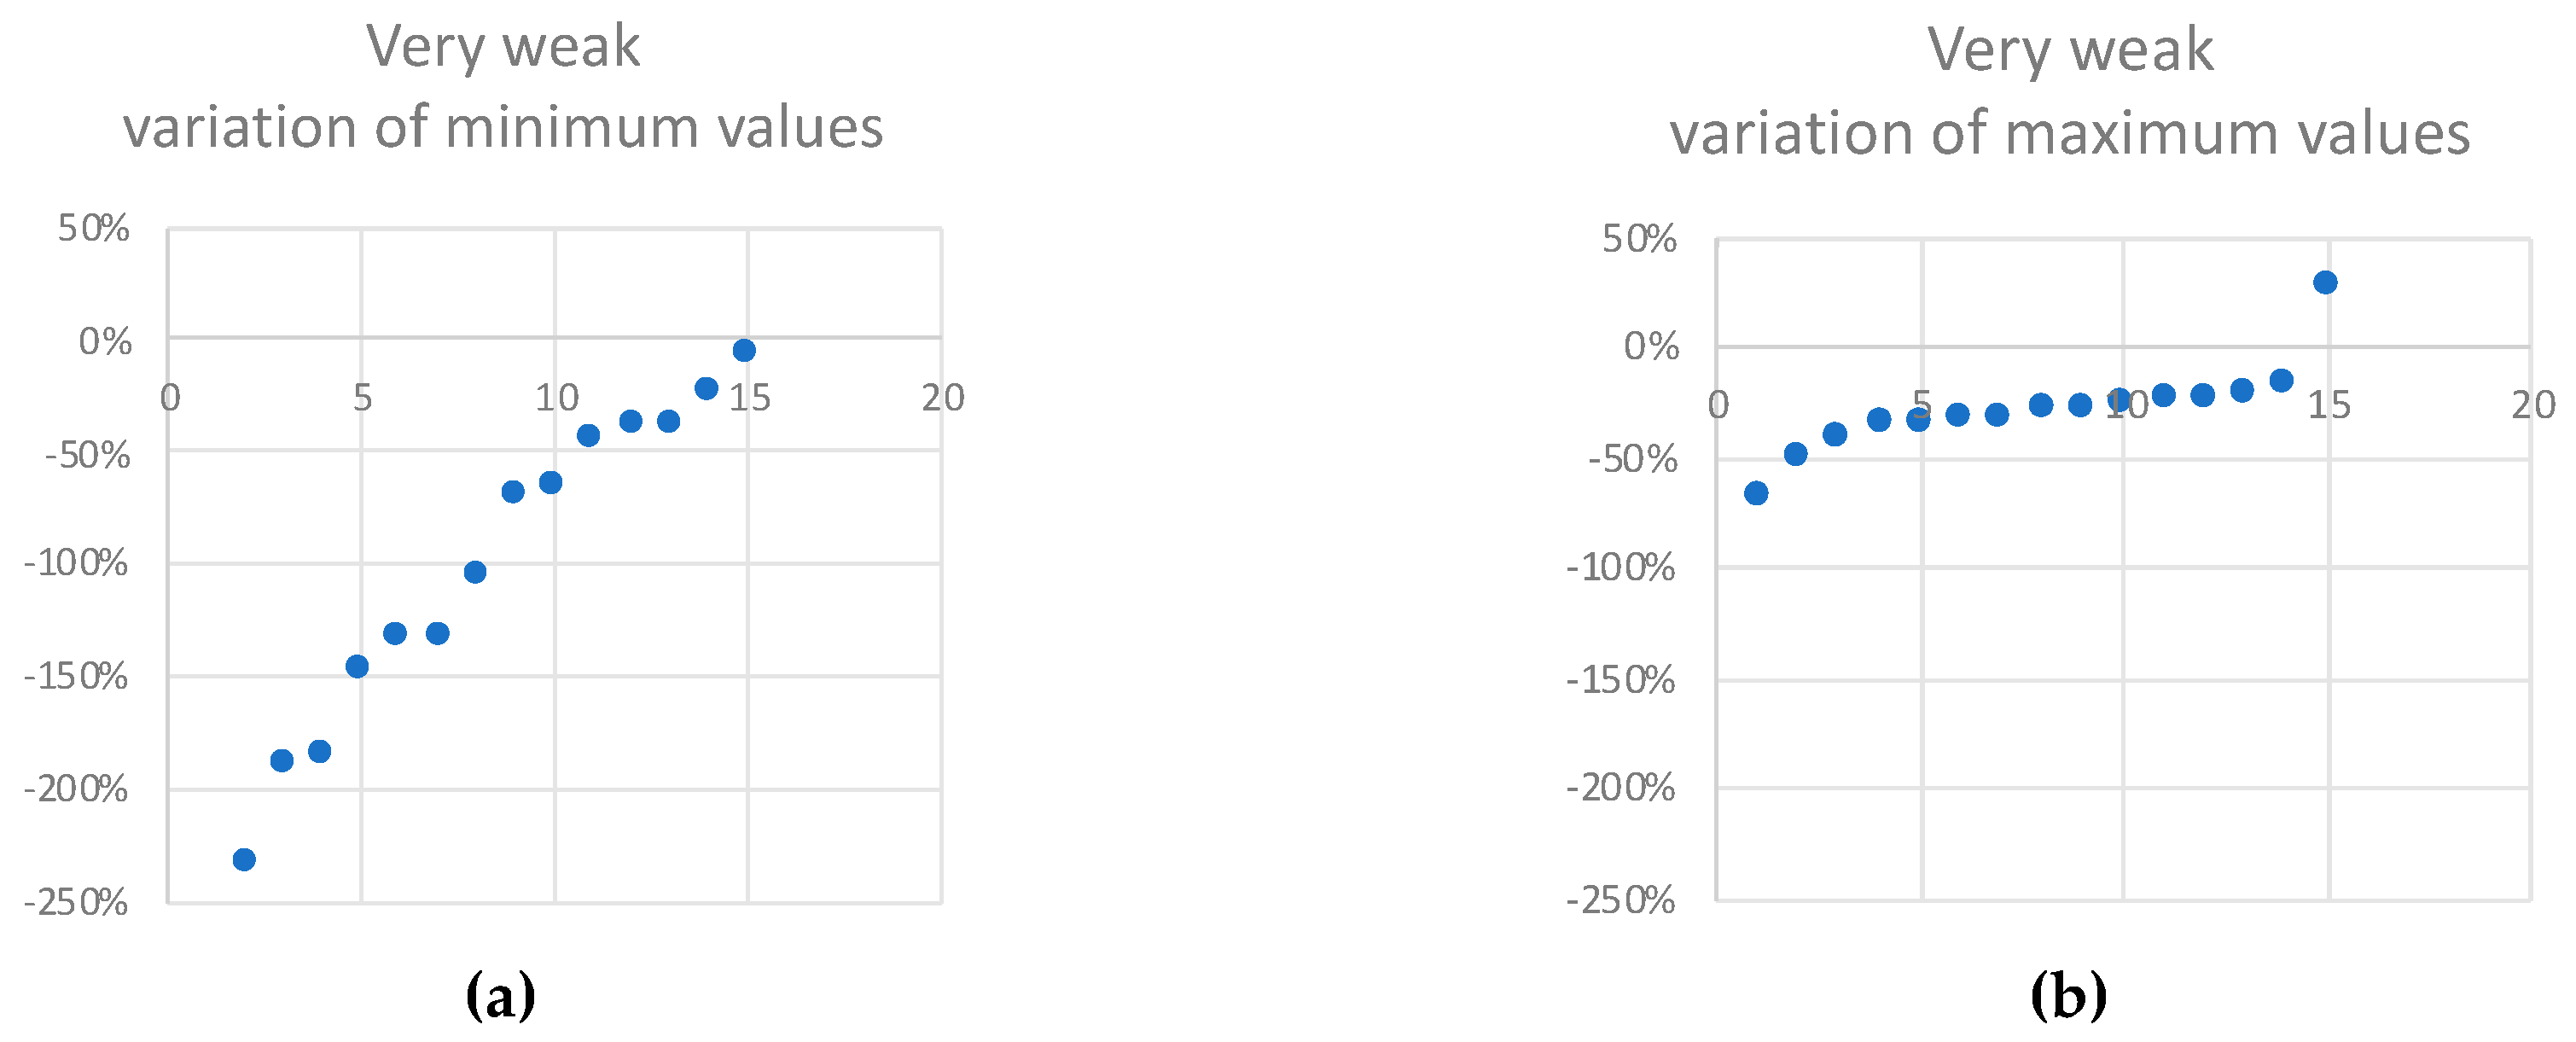
6.3. External Coherence of the Agreed Rents

To explore the external consistency of the agreed rents, they were compared to the OMI rents. In the OMI database, the rents of so-called “Abitazioni civili“ properties, which are housing units with average characteristics, were selected for each OMI zone that corresponds to the zones in all the municipalities of the case study. Subsequently, the percentage variation between the two rents was calculated, for both the minimum and maximum values. If the variation is negative, it means that the agreed rent is lower than the market rent and, therefore, is more affordable. If the variation is positive, it means the opposite.
Figure 20 shows the variation for all the agreed rents in the Milan Metropolitan City dataset that have a weak or very weak distance from the centroid, that is, for those rents that had strong internal cluster coherence. The results show that, on average, only one third of the agreed rents are lower than the OMI rents and therefore more affordable. The percentage is lowest for the lowest values in the very weak category (24.39%) (Figure 20a) and highest for the highest values in the weak category (Figure 20b).
Figure 21 shows that, on the other hand, the agreed rents in the Bari Metropolitan City dataset are always below the OMI rents, with the exception of one data point (Figure 21b), and always more affordable than market rents.

7. Discussion

The analysis based on the k-medoids clustering aims at identifying a dissimilarity of the agreed rents in the two metropolitan cities of Milan and Bari has highlighted in both cases two outliers, namely Cluster 2 and 3 in the case of Milan, and Cluster 1 and 3 in the case of Bari. The agreed rents cluster analysis can be used to verify the coherence of the social housing policies implemented in the two metropolitan areas under study.

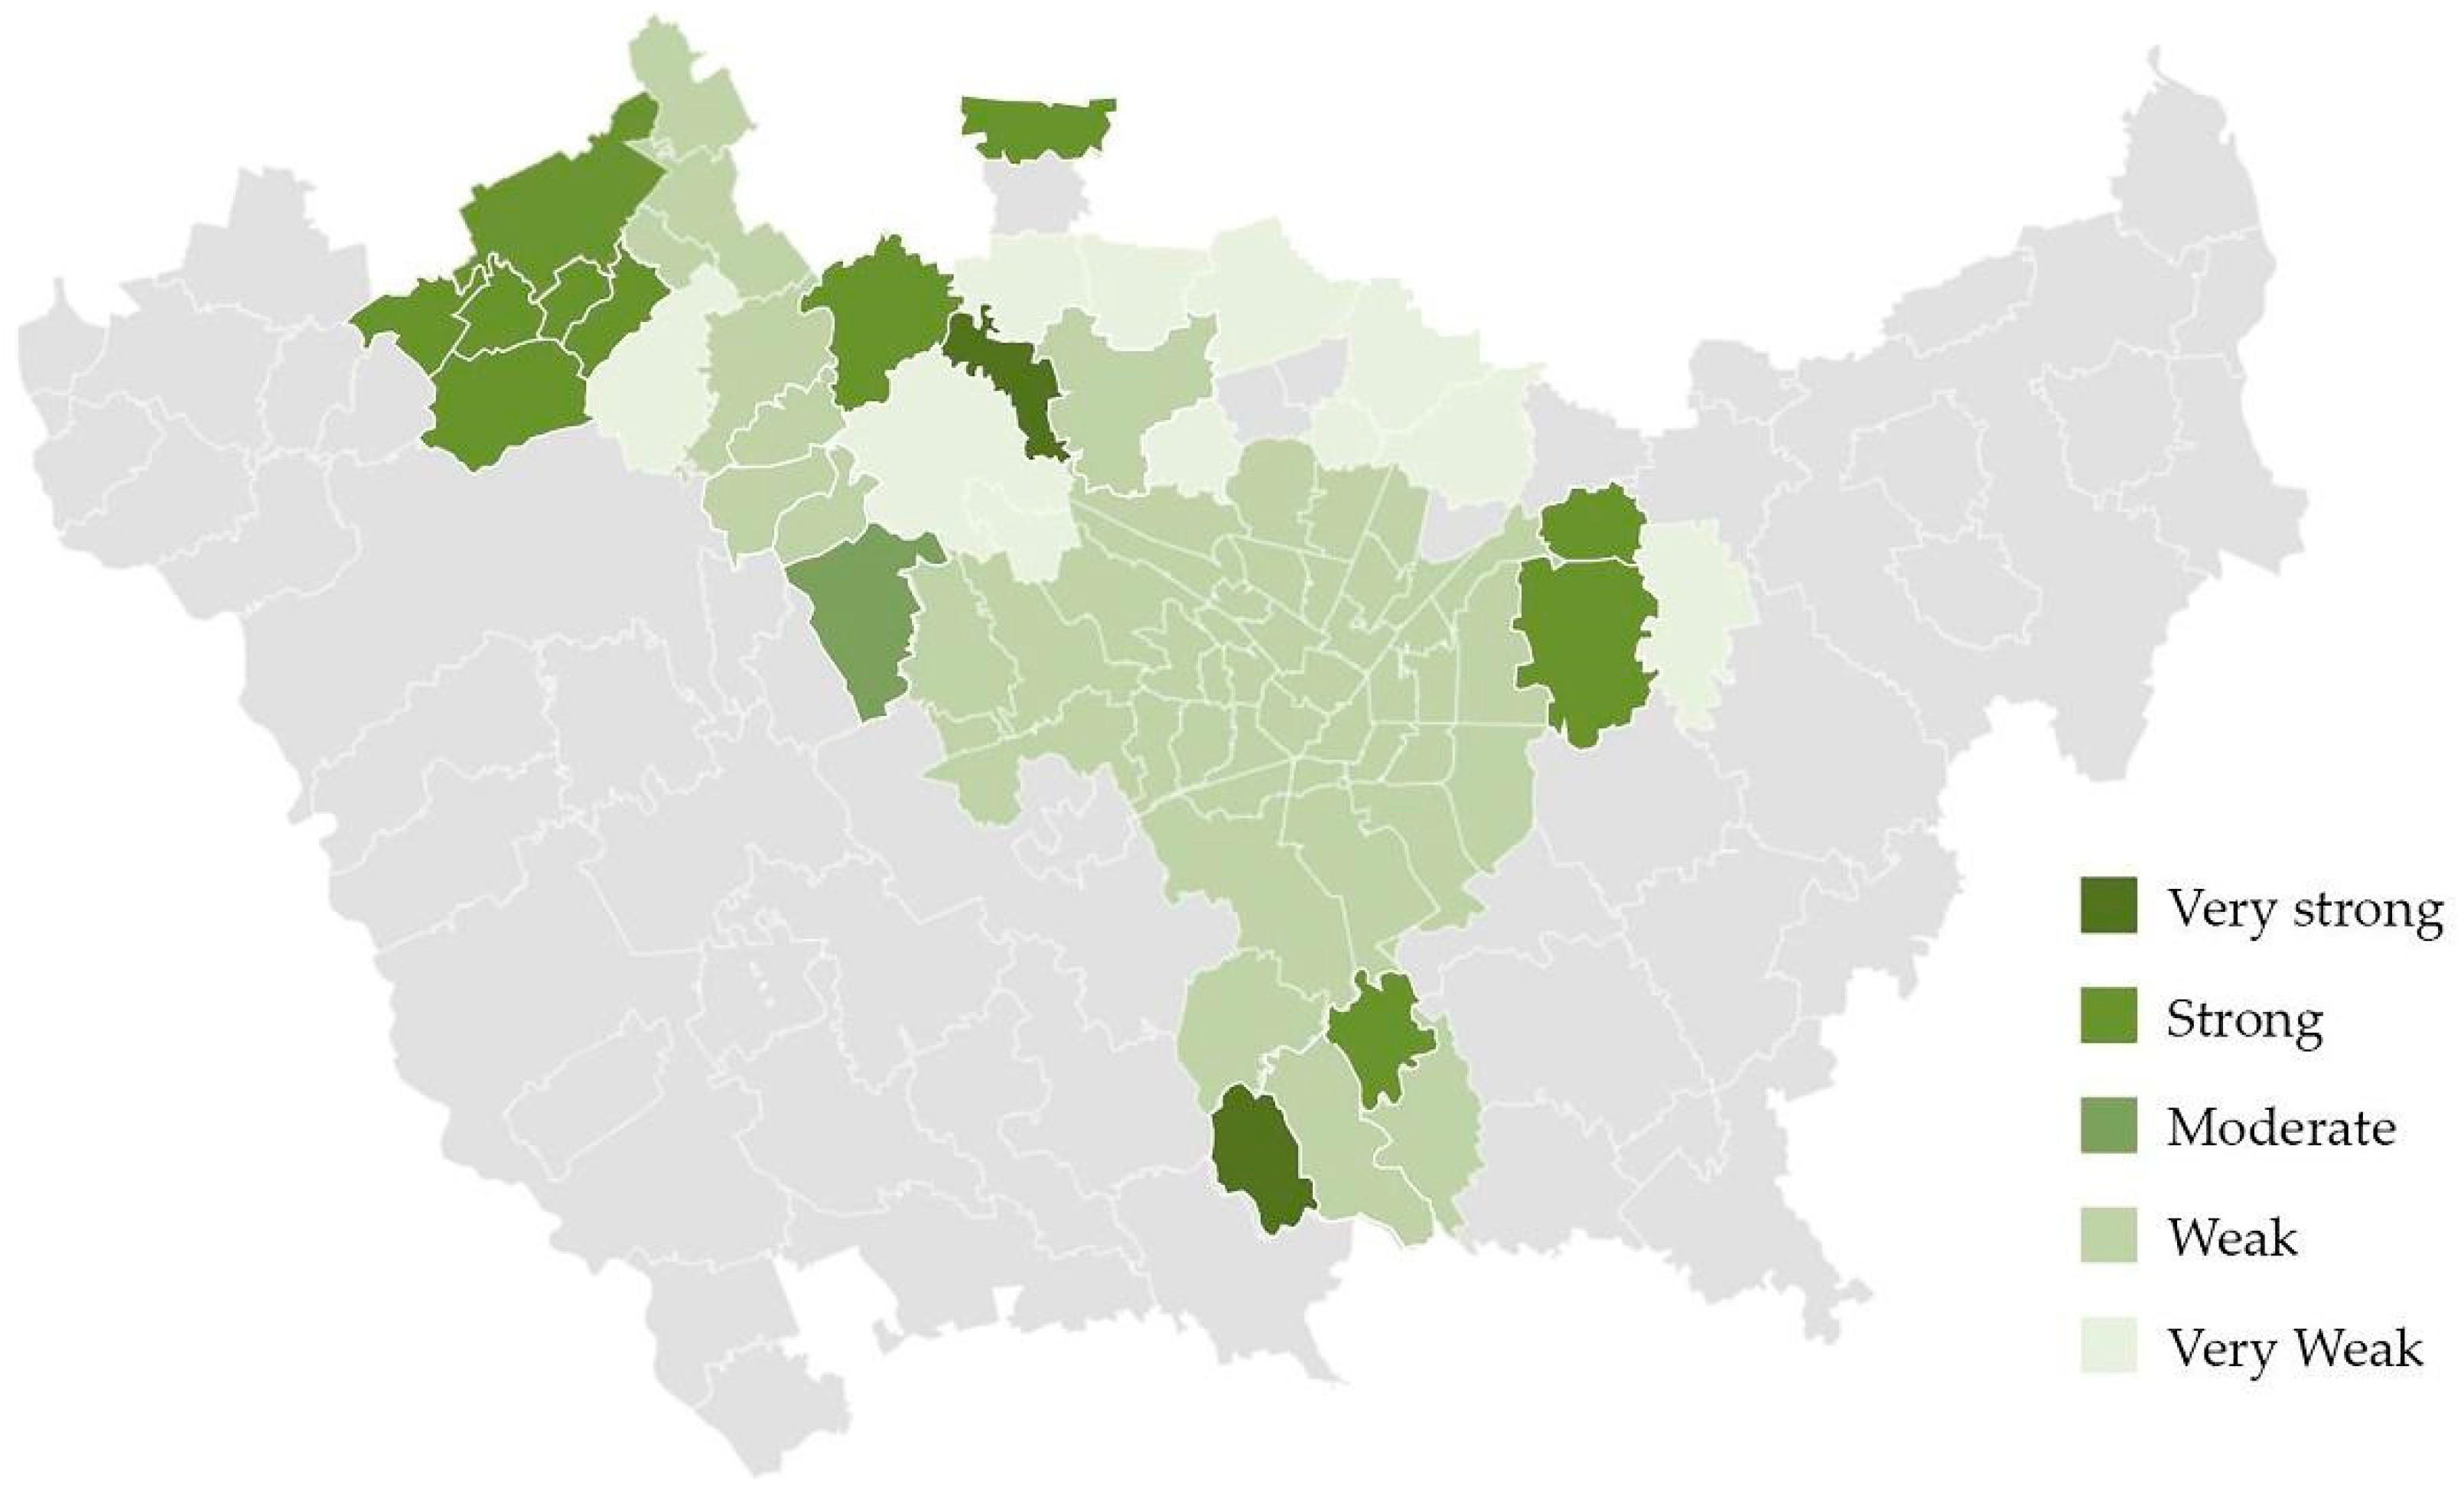
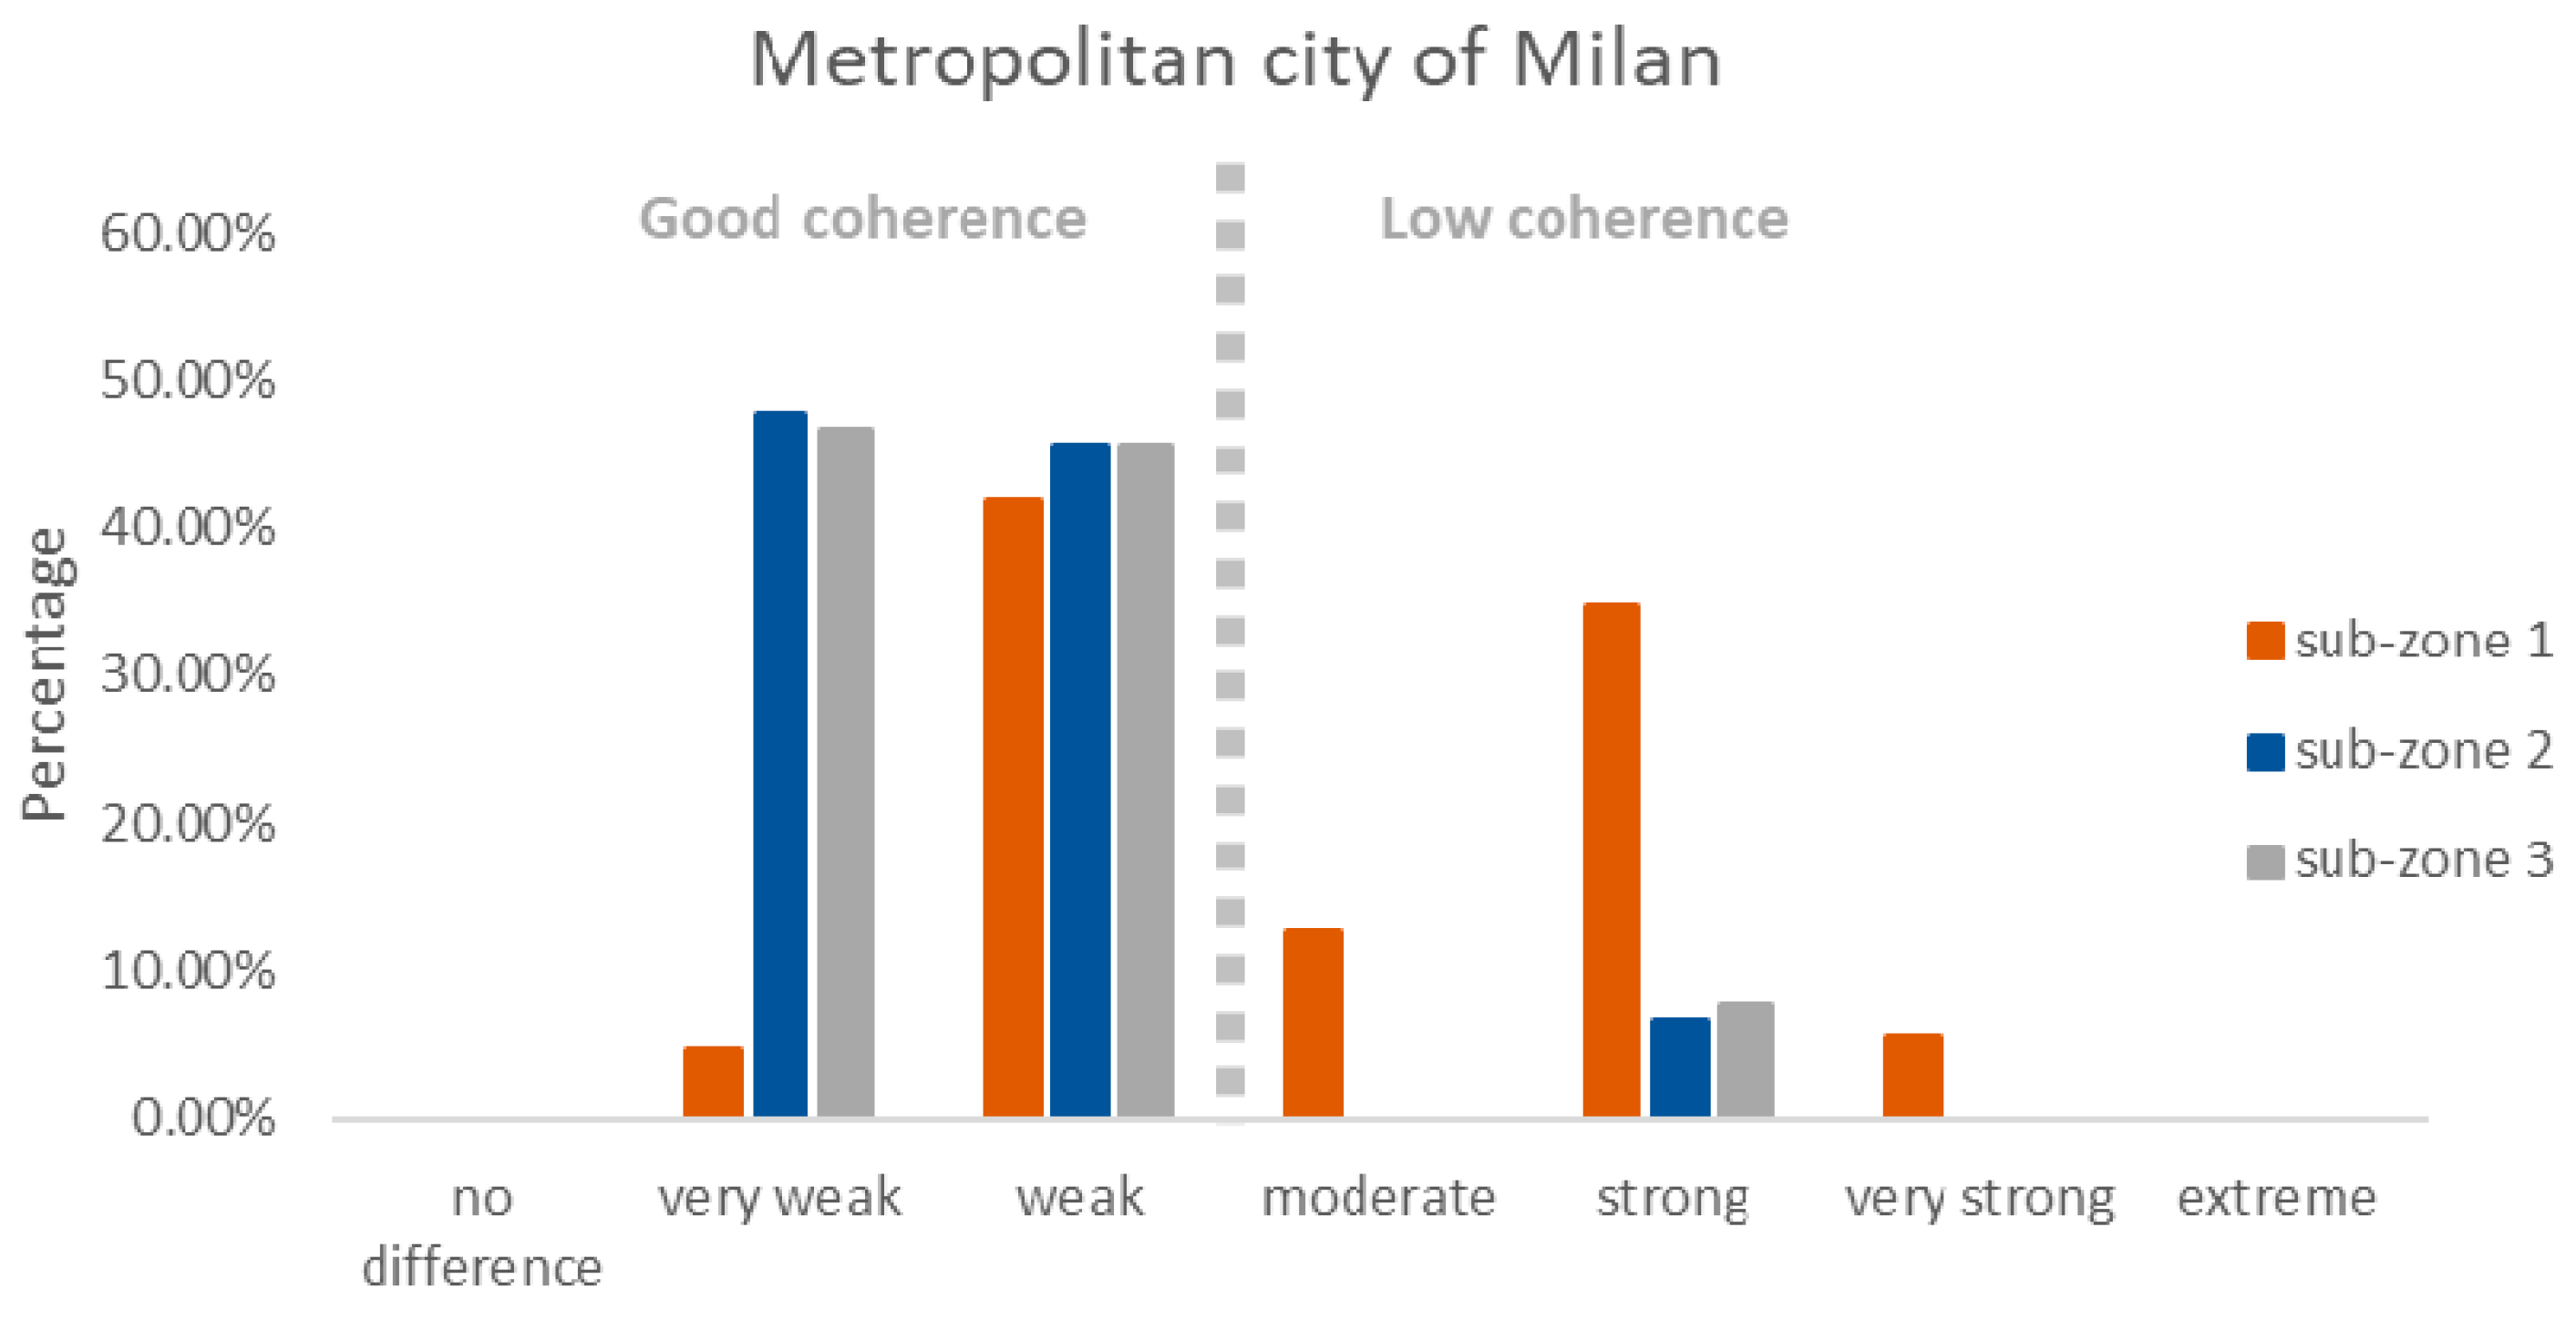
7.1. Coherence of the Agreed Rents in Two Metropolitan Cities Based on the Semantic Categories of MACBETH

The results of the analysis aimed at highlighting the internal similarity of the cluster by a filtering based on the semantic categories of MACBETH applied to Clusters 1 and 2, respectively, for the metropolitan cities of Milan and Bari can be aggregated to identify the percentages of the agreed rents that fall in areas characterized by good internal coherence and those with low coherence.

7.1.1. Coherence of the Agreed Rents in the Metropolitan City of Milan

The frequency analyses of the agreed rents for the different semantic categories of MACBETH and for the different sub-zones provide information on the degree of coherence within the cluster of such agreed rents.
In the Metropolitan City of Milan, this analysis highlighted the following degrees of coherence within the cluster of agreed rents and the different sub-zones (Figure 22).
Sub-zone 1 has a percentage of agreed rents of 5% in the very weak category, 42% in the weak category, 13% in the moderate category, 35% in the strong category, and 5% in the very strong category, so only 47% have a good and very good coherence.
Sub-zone 2 has a percentage of agreed rents of 48% in the very weak category, 45% in the weak category, 7% in the strong category, 5% in the very strong category, so 93% have good and very good coherence.
Sub-zone 3 has a percentage of agreed rents as 47% in the very weak category, 45% in the weak category, 7% in the strong category, 8% in the very strong category, so 92% have good and very good coherence.
These analyses show that the overall coherence of the agreed rents for the Metropolitan City of Milan have good and very good coherence in sub-zones 2 and 3, and less coherence in sub-zone 1.
If, on the one hand, the observed coherence of agreed rents shows equity in the implementation of SH policies at least for sub-zones 3,4 and 6–9, on the other hand there is no remodeling of the agreed rents based on sub-zones.

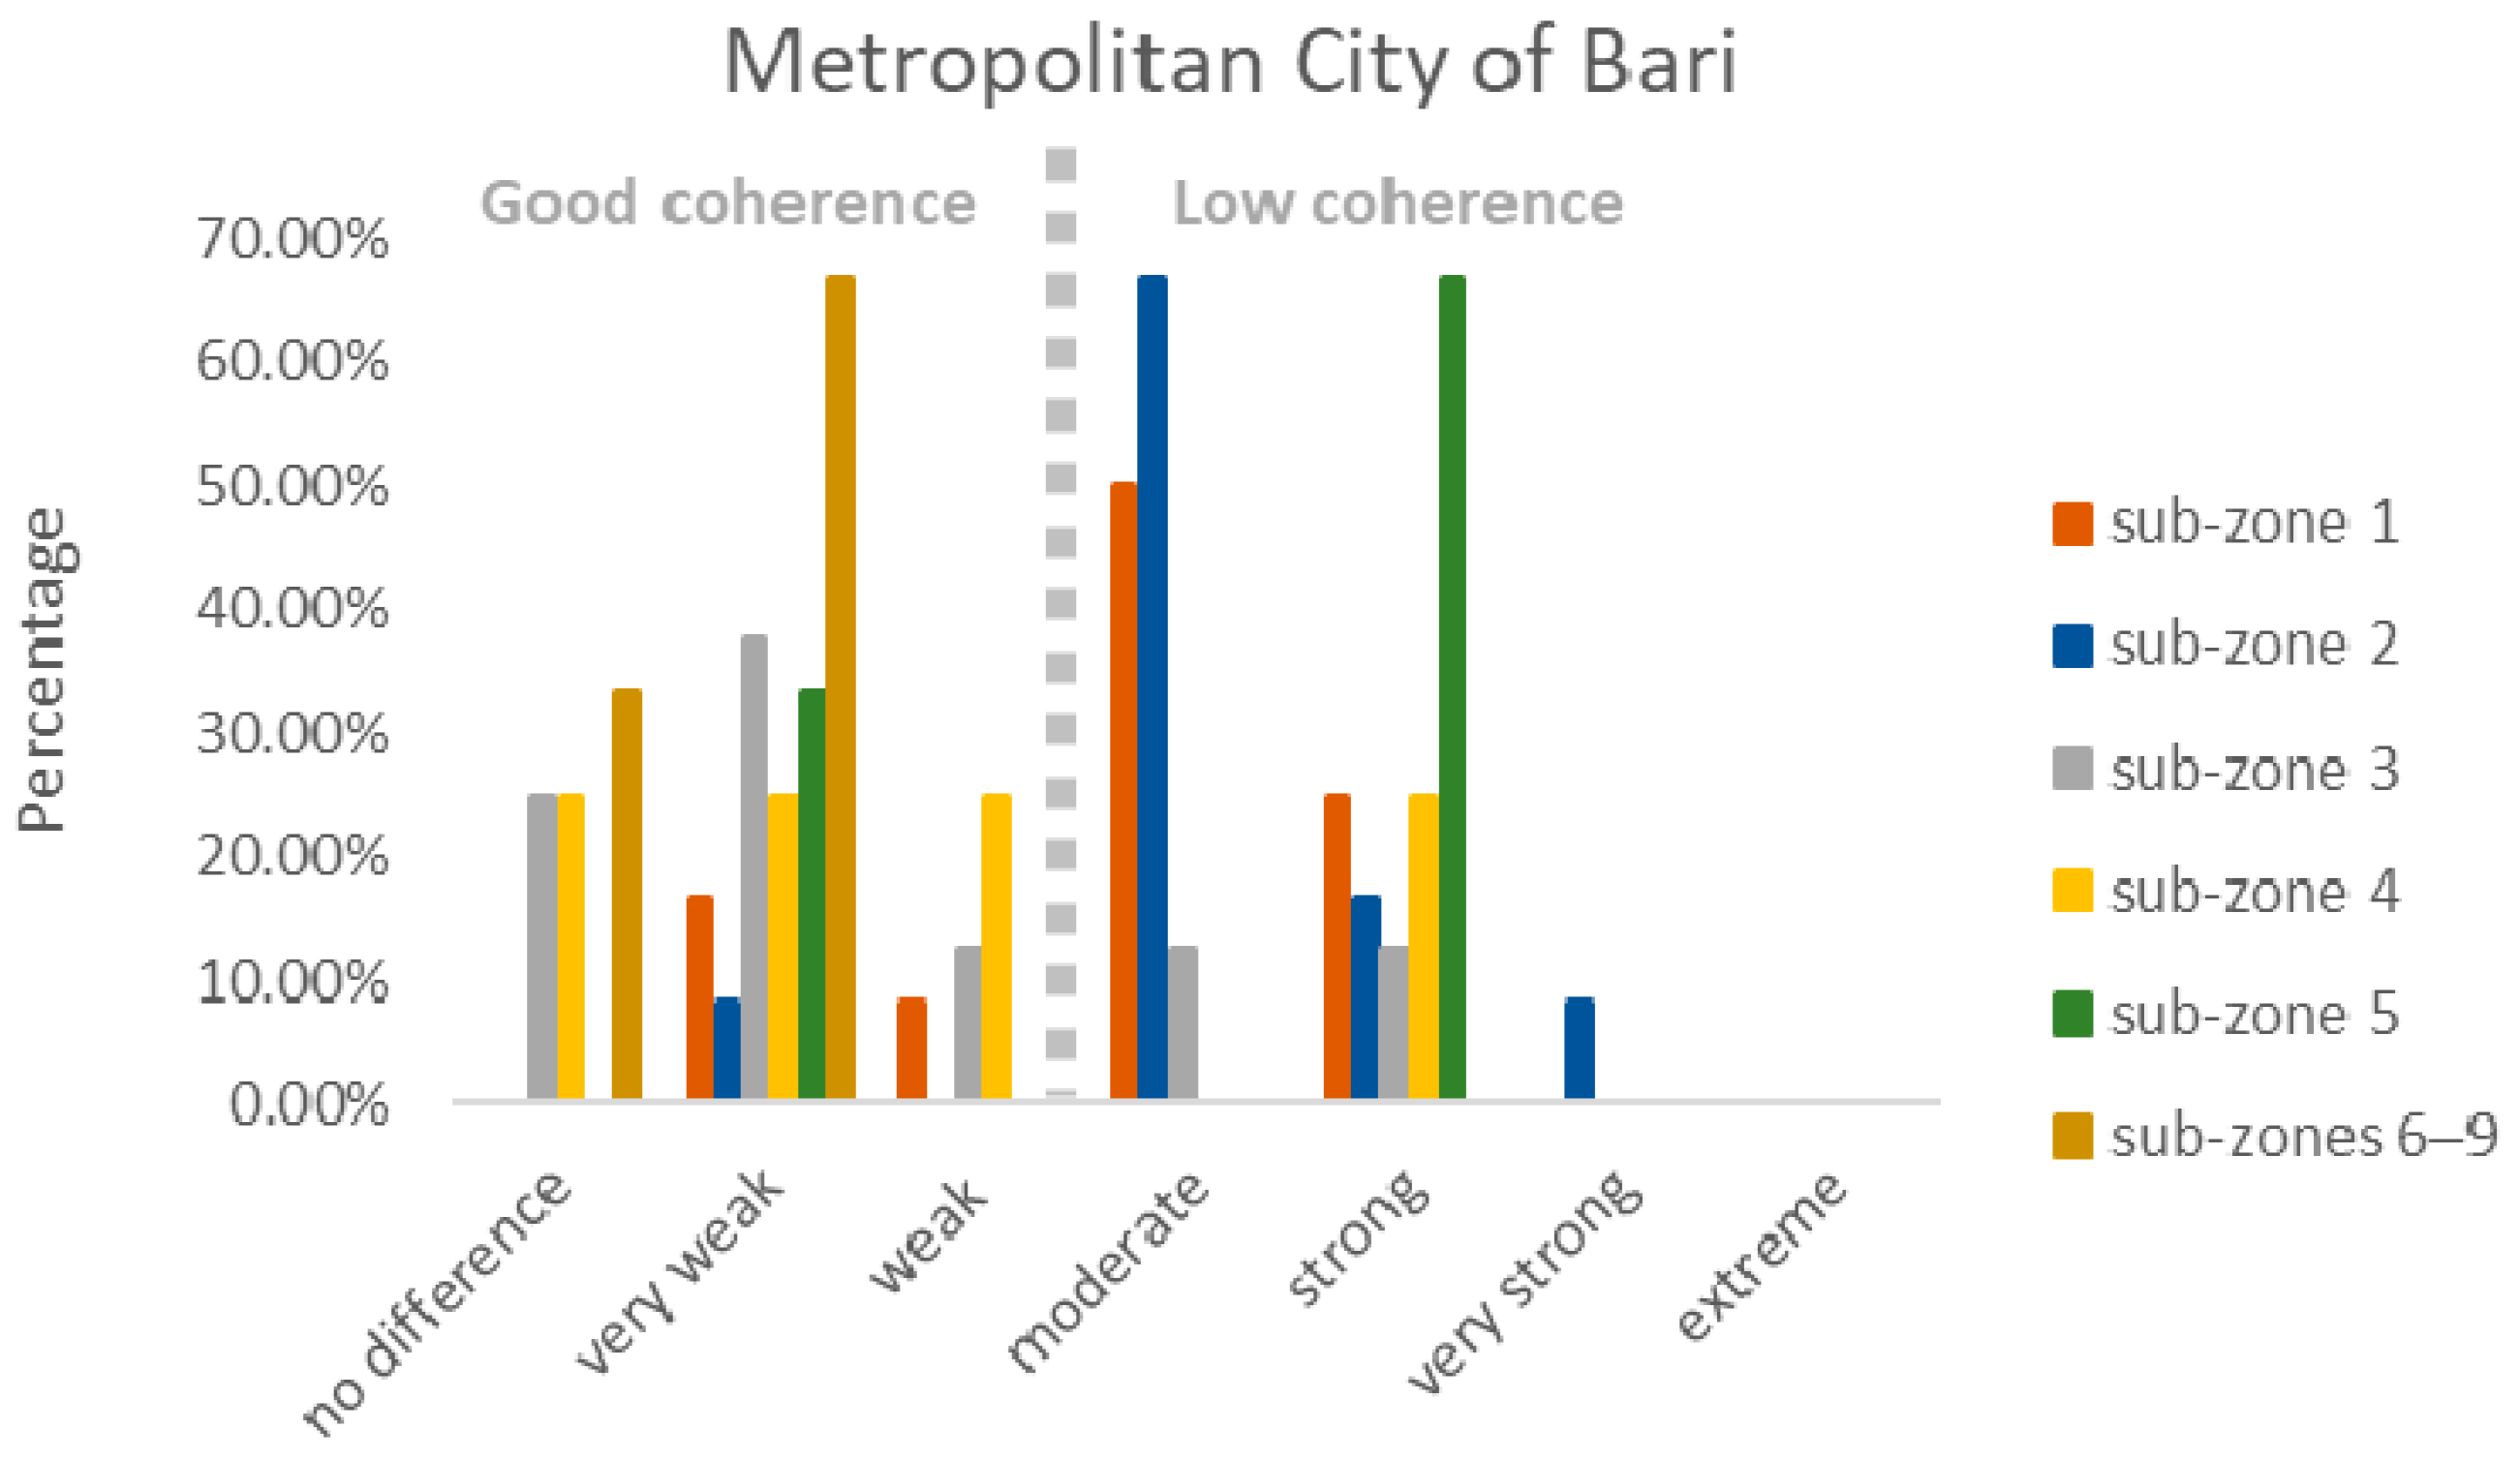
7.1.2. Coherence of the Agreed Rents in the Metropolitan City of Bari

The frequency analyses of the agreed rents for the different semantic categories of MACBETH and for the different sub-zones provide information on the degree of coherence within the cluster of such agreed rents (Figure 23).
The semantic category that most characterizes sub-zones 1 and 2 is the moderate one, with a percentage of 50% in the first case and 67% in the second case of the agreed rents falling within this class; this implies a lack of coherence of such reference agreed rents to the centroid.
Sub-zone 3 has a percentage of agreed rents of 25% in the no difference category, therefore coinciding with the centroid, highlighting an excellent coherence, and has a percentage of agreed rents of 38% in the very weak category and therefore very consistent with it.
Sub-zone 4 has the same percentage of agreed rents of 25% in the category no difference, very weak, and weak, therefore with excellent, very good, and good overall coherence with the centroid, only 25% of them belong to the strong category.
The 33% of agreed rents in sub-zone 5 belong to the very weak category, thus with very good coherence, while 67% belong to the strong category, thus with a greater distance from the centroid.
Sub-zones 6–9, that concern only the municipality of Bari, have 33% of the agreed rent coinciding with the centroid and 67% belonging to the very weak category, so overall they have a very good coherence to the centroid.
These analyses show that the overall coherence of the agreed rents for the Metropolitan City of Bari have good and very good coherence for sub-zones 3, 4, and 6–9, and have low coherence for sub-zones 1, 2, and 5.
If, on the one hand, the observed coherence of agreed rents shows equity in the implementation of SH policies at least for sub-zones 3, 4, and 6–9, on the other hand there is no remodeling of the agreed rents based on sub-zones.

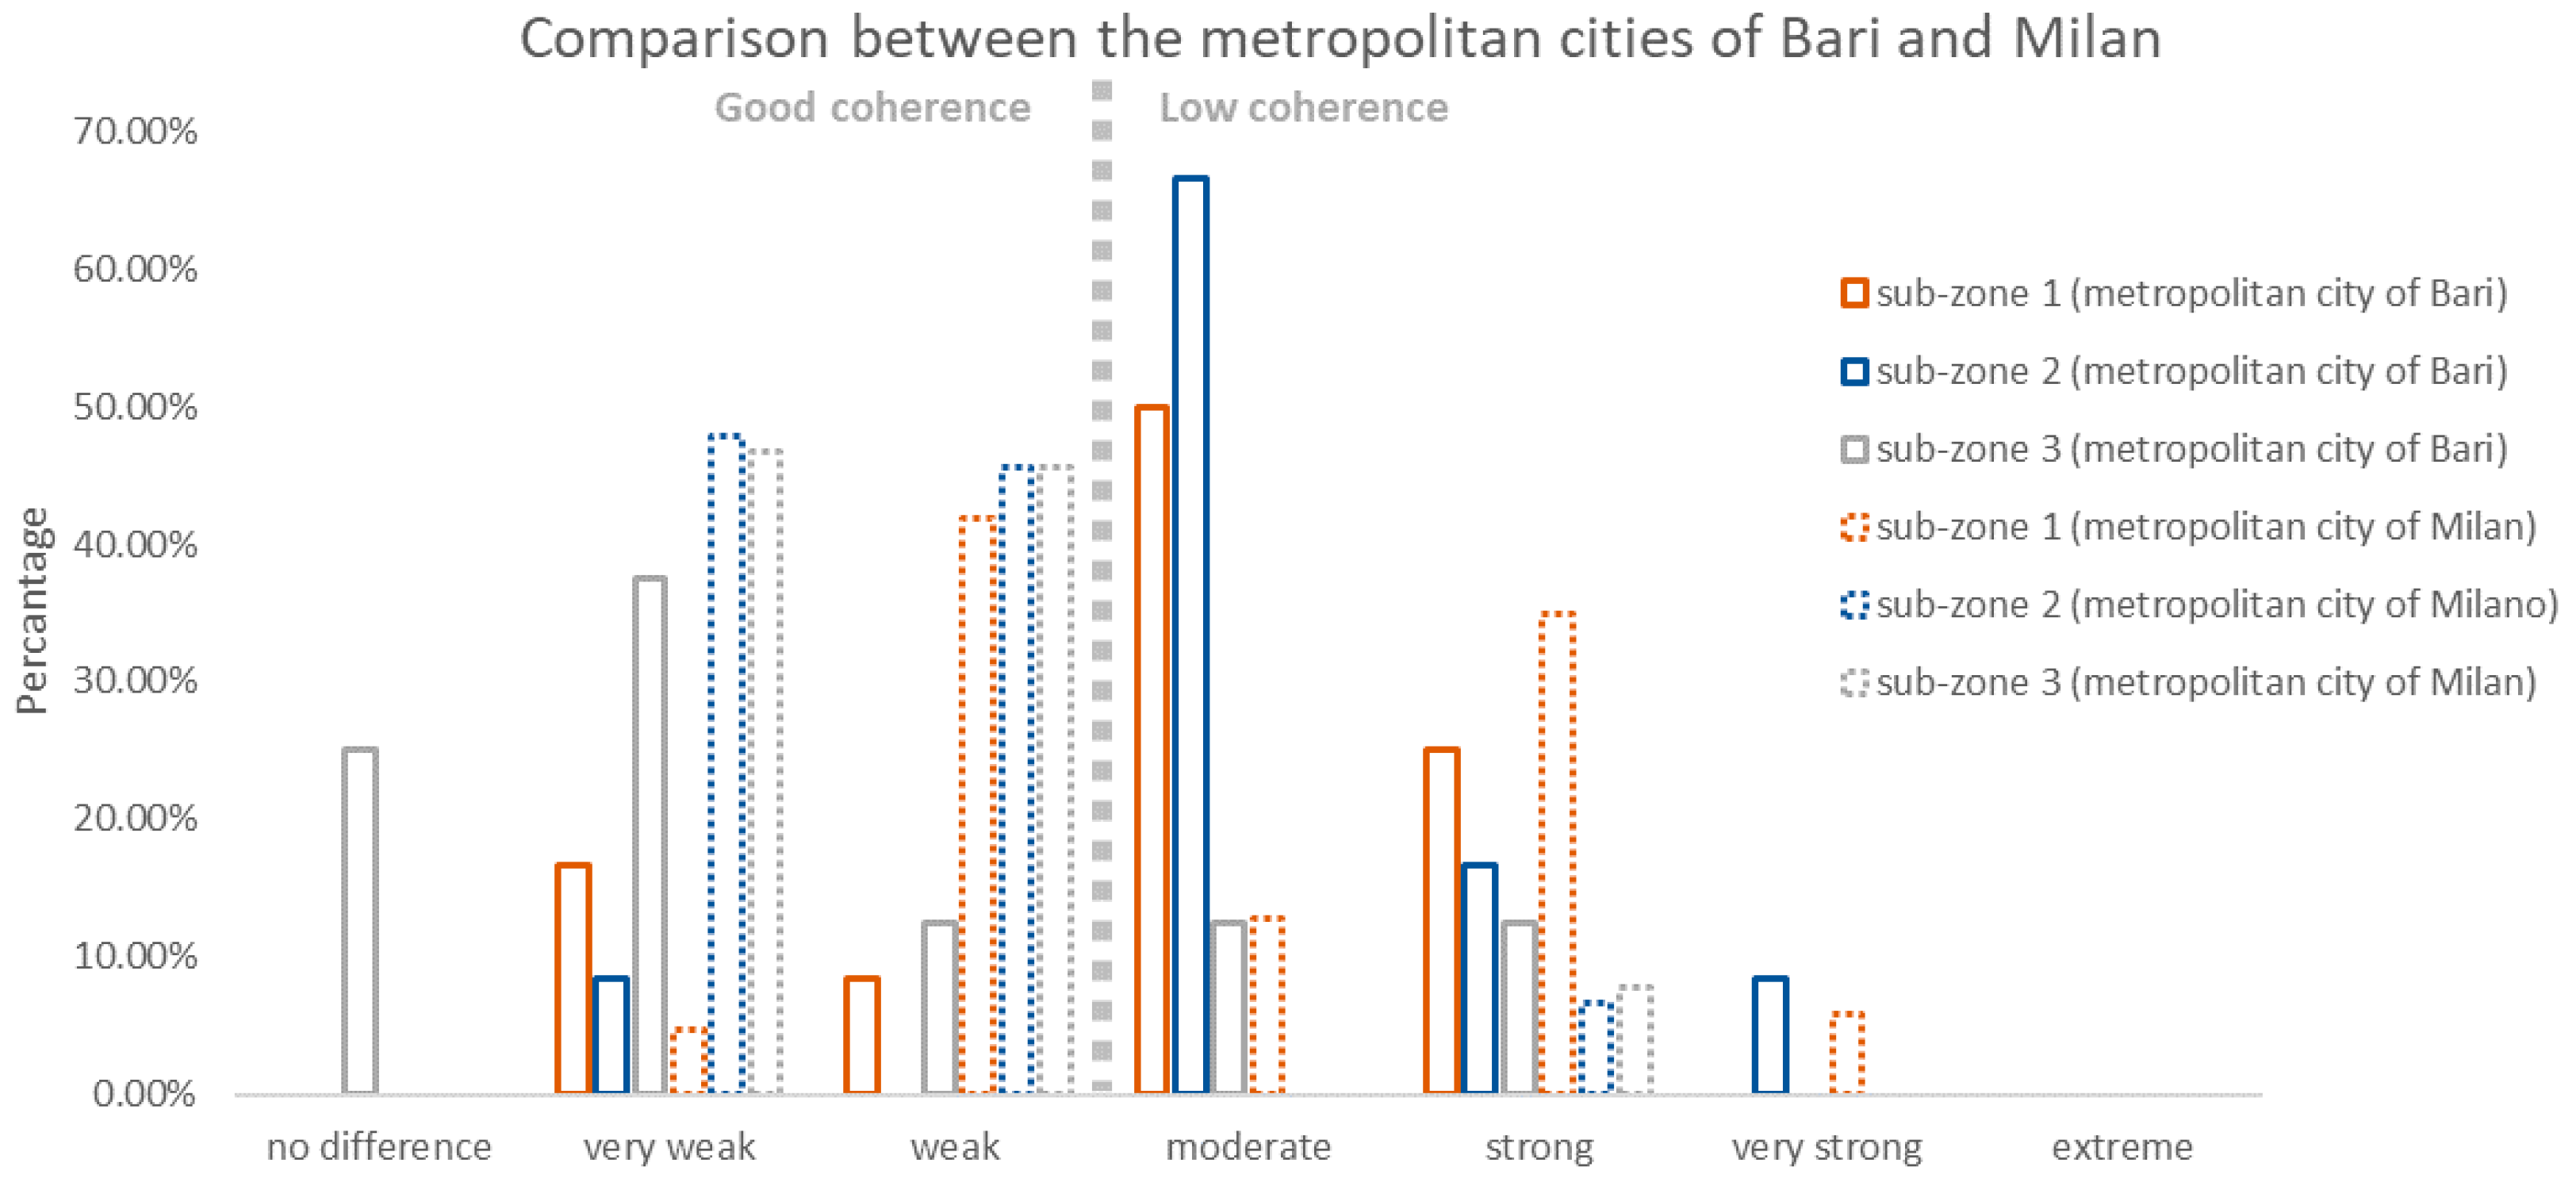
7.2. Comparison of the Coherence of the Agreed Rents in the Two Metropolitan Cities

The k-medoids clustering analysis implemented on the sample of the agreed rents signed in the two metropolitan cities analyzed has in both cases identified only one significant grouping of Cluster 2 for the Metropolitan City of Bari and Cluster 1 for the Metropolitan City of Milan.
The analysis showed that the agreed rents for the two metropolitan cities have good coherence for sub-zone 3, which in both cases are not equivalent, as in the case of Milan they identify the best zones and in the case of Bari the worst, showing a lack of coherence of the agreed rents between the two zones (Figure 24).
A comparison of the two clusters representative for the two metropolitan cities based on the cumulative frequency up to the weak category shows different percentages for sub-zone 2 of Milan and Bari, in the first case 92% and in the second case 25%, despite being the corresponding zones for the reasons mentioned.
With the values recorded for the five characteristics considered, the comparison of the Cluster 2 centroids for the Metropolitan City of Bari and the Cluster 1 for the Metropolitan City of Milan shows a total coherence for the rent value and percentage of the population with an income between €15,000 and €26,000, as well as for the territorial accessibility and population density, and also for the real estate characteristics provided for the reference agreed rent (Figure 25).

8. Conclusions

To make SH rents fair, affordable, and below market rents, governments must set certain legal thresholds by choosing benchmark rents, which should be easy to apply as well as flexible and updatable to represent segments of the housing market in different areas of the same city or between different cities in the same territory. In the case of Italian law, the benchmark rents are based on local territorial agreements between landlords and tenant associations. Therefore, these agreed rents have the advantage of being renewed every year and diversified by city and area, although they are not mandatory and do not exist for all Italian municipalities.
The analysis of the agreed rents through cluster analysis showed that although there is good internal consistency between the groups of rents, there are numerous areas or municipalities where the dissimilarities are strong or very strong. Thus, the use of the agreed rents as benchmark rents for SH causes inefficiencies and spatial inequalities. The comparison between agreed and OMI rents showed that the results are diversified, but more importantly, that many agreed rents are higher than OMI rents and, consequently, than market rents.
This study was already applied to two large metropolitan cities, but the research could be extended to other Italian cities and territories and learn about the spatial consequences of legal regulations. The further results obtained can also be processed to develop a national mapping of fair and affordable rent gradients.
However, the results so far show that the rule by law therefore has limited effectiveness and would need to be complemented by monitoring tools, such as cluster analysis, to know which cases need corrective measures to be taken to make rents fair and affordable for low-income households.

Author Contributions

Conceptualization, G.N. and M.R.T.; methodology G.N. and M.R.T.; validation, G.N., M.R.T. and S.B.; formal analysis, M.R.T.; investigation, M.R.T. and S.B.; data curation, M.R.T. and S.B.; writing—original draft preparation, G.N., M.R.T. and S.B.; writing—review and editing, G.N., M.R.T. and S.B. All authors have read and agreed to the published version of the manuscript.

Funding

This research received no external funding.

Acknowledgments

The authors did not receive funds for supporting the research work or for covering the costs to publish in open access.

Conflicts of Interest

The authors declare no conflict of interest.

Appendix A

Table A1. Groupings of locations in the sub-zones 1 of the Metropolitan City of Milan with respect to the centroid of Cluster 1.
Typology of Distance Municipalities in the Metropolitan City of Milan
Very strongArese 1–2; Basiglio-Milano 3; Basiglio-Historic centre; Legnano-Central
StrongBusto Garolfo; Canegrate; Cerro Maggiore; Dairago; Lainate 1–2; Locate di Triulzi; Nerviano; Milano-Microzone: C02, C03, C05, C09, C10, C11; Milano-Microzone: C01, C06, C07, C08, C12, D09, D11, D12, D14, D29; Milano-Microzone:D10, D13, D15, D23, D28; Milano-Microzone: D07, D08, D16, D24, D27; Milano-Microzone: D02, D04, D05, D06, D17, D18, D19, D20, D21, D22, D25; Milano-Microzone: D01, D26, E01, E02, E03; Milano-Microzona:D03; Opera-Residential; Opera-Industrial; Opera-Agricultural; Rescaldina; Rozzano-Aler; Rozzano 1–2; San Giorgio; San Vittore Olona, Segrate; Settimo milanese 1–2; Solaro; Villa Cortese; Vimodrone
ModerateCornaredo 1–2; Milano-Microzone: A01-A04, B01, B02; Milano-Microzone: B03, B05, B06, C04; Milano-Maggiolina; Milano-Caprilli San Siro; Segrate 1–4; Vimodrone
WeakBollate-centre; Bollate-Cassina nuova; Bollate-Cascina del sole; Bresso 1–2; Cinisello Balsamo-Historic centre; Cinisello Balsamo-San Eusebi; Cinisello Balsamo-Crocetta; Cinisello Balsamo; Garbagnate Milanese-Central; Garbagnate Milanese-Semi-central; Garbagnate Milanese-Suburbs; Garbagnate Milanese-Suburbs; Paderno Dugnano; Parabiago-Centre and Ravello; Parabiago-Hamlets, suburbs; Pero-Centre; Pero; Pieve Emanuele-Residential, Pieve Emanuele-Residential; Pieve Emanuele-Agricultural; Pieve Emanuele-Agricultural; Pioltello- Limito, Pioltello-Satellite district and Piazza Garibaldi; Pioltello- Industrial and agricultural; Pogliano; Pregnana Milanese; Rho 1–3; Senago-Centre; Senago-Suburbs; Sesto-Marelli; Sesto-Piazza Garibaldi; Sesto-Pelucca; Cascina Gatti; Parpagliona; Vanzago
Very weakNovate Milanese; Pieve Emanuele-Tolcinasco; Pioltello-San Felice; Pioltello-Nuova Seggiano

Appendix B

Table A2. Groupings of locations in the sub-zones 2 of the Metropolitan City of Milan with respect to the centroid of Cluster 1.
Typology of Distance Municipalities in the Metropolitan City of Milan
Very strongArese 1–2; Basiglio-Milano 3; Legnano-Central; Legnano-Semi-central; Legnano-Suburbs
Strong
Moderate
WeakBusto Garolfo; Canegrate; Cerro Maggiore; Cornaredo; Dairago; Lainate 1–2, Locate di Triulzi; Nerviano; Milano-Microzone: A01-A04, B01, B02; Milano-Microzone: B03, B05, B06, C04; Milano-Microzone: C02, C03, C05, C09, C10, C11; Milano-Microzone: C01, C06, C07, C08, C12, D09, D11, D12, D14, D29; Milano-Microzone: D10, D13, D15, D23, D28; Milano-Microzone: D07, D08, D16, D24, D27, Milano-Microzone: D02, D04, D05, D06, D17, D18, D19, D20, D21, D22, D25; Milano-Microzone: D01, D26, E01, E02, E03; Milano-Microzona: D03; Milano-City Life Porta Nuova; Milano-Maggiolina; Milano-Caprilli San Siro; Opera-Residential; Opera-Industrial; Opera-Agricultural; Rescaldina; Rozzano-Aler; Rozzano-Ponte Sesto; Cassino; Rozzano historic centre; Vallembrosia; Rozzano-Quinto de’ Stampi; San Giorgio; San Vittore Olona; Segrate 1–5; Settimo milanese 1–2; Solaro; Villa Cortese; Vimodrone 1–2
Very weakBasiglio-historic centre; Bollate-centre; Bollate-Cassina nuova; Bollate-Cascina del sole; Bresso 1–2; Cinisello Balsamo-historic centre; Cinisello Balsamo-San Eusebio; Cinisello Balsamo-Crocetta; Cinisello Balsamo; Cornaredo; Garbagnate Milanese-Central; Garbagnate Milanese-Semi-centra; Garbagnate Milanese-Suburbs 1–2; Novate Milanese; Paderno Dugnano; Parabiago-Central and Ravello; Parabiago-suburbs; Pero-Central; Pero; Pieve Emanuele-Residential 1–2; Pieve Emanuele-Tolcinasco; Pieve Emanuele-Agricultural 1–2; Pioltello-San Felice; Pioltello-Nuova Seggiano; Pioltello-Limito; Pioltello-Satellite district and Piazza Garibaldi; Pioltello-Industrial and agricultural; Pogliano; Pregnana Milanese; Rho 1–3; Senago-Centre; Senago-Suburbs; Sesto-Marelli; Sesto-Rondinella, Rondò, Station; Sesto-Pelucca, Cascina, Gatti, Parpagliona, Sesto-Torretta; Vanzago

Appendix C

Table A3. Groupings of locations in the sub-zones 3 of the Metropolitan City of Milan with respect to the centroid of Cluster 1.
Typology of Distance Municipalities in the Metropolitan City of Milan
Very strong
StrongArese 1–2; Basiglio-Milano 3; Basiglio-Historic centre; Legnano-Central; Legnano-Semi-central; Legnano-Suburbs
Moderate
WeakBusto Garolfo; Canegrate; Cerro Maggiore; Dairago; Lainate 1–2; Locate di Triulzi; Nerviano; Milano-Microzone: A01-A04, B01, B02; Milano-Microzone: B03, B05, B06, C04; Milano-Microzone: C02, C03, C05, C09, C10, C11; Milano-Microzone: C01, C06, C07, C08, C12, D09, D11, D12, D14, D29; Milano-Microzone: D10, D13, D15, D23, D28;, Milano-Microzone: D07, D08, D16, D24, D27; Milano-Microzone: D02, D04, D05, D06, D17, D18, D19, D20, D21, D22, D25; Milano-Microzone: D01, D26, E01, E02, E03; Milano-Microzona: D03; Milano-City Life Porta Nuova; Milano-Maggiolina; Milano-Caprilli San Siro; Opera-Residential; Opera-Industrial; Opera-Agricultural; Rescaldina; Rozzano-Aler; Rozzano-Ponte Sesto, Cassino; Rozzano-Vecchia, Vallembrosia, Rozzano; San Giorgio; San Vittore Olona; Segrate 1–5; Settimo milanese 1–2; Solaro, Vanzago; Villa Cortese; Vimodrone 1–2
Very weakBollate-Centre; Bollate-Cassina nuova; Bollate-Cascina del sole; Bresso 1–2; Cinisello Balsamo- historic centre; Cinisello Balsamo-San Eusebio; Cinisello Balsamo-Crocetta; Cinisello Balsamo; Cornaredo 1–2; Garbagnate Milanese-Central; Garbagnate Milanese-Semi-central; Garbagnate Milanese-Suburbs; Garbagnate Milanese-Suburbs; Novate Milanese; Paderno Dugnano; Parabiago-Central and Ravello; Parabiago- suburbs; Pero-Central; Pero; Pieve Emanuele-Residential; Pieve Emanuele-Residential; Pieve Emanuele-Tolcinasco; Pieve Emanuele-Agricultural 1–2; Pioltello-San Felice; Pioltello-Nuova Seggiano; Pioltello-Limito; Pioltello-Satellite district and Piazza Garibaldi; Pioltello-Industrial and agricultural, Pogliano; Pregnana Milanese; Rho 1–3; Senago-Centre, Senago-Suburbs; Sesto-Marelli; Sesto-Rondinella, Rondò, Station; Sesto-Pelucca, Cascina Gatti, Parpagliona; Sesto-Torretta

References

  1. Marcuse, P. Whose right(s) to what city? In Cities for People, Not for Profit: Critical Urban Theory and the Right to the City, 1st ed.; Brenner, N., Marcuse, P., Mayer, M., Eds.; Routledge: London, UK, 2012; pp. 24–41. [Google Scholar]
  2. Aalbers, M.; Gibb, K. Housing and the right to the city: Introduction to the special issue. Int. J. Hous. Policy 2014, 14, 207–213. [Google Scholar] [CrossRef]
  3. Disney, R.; Luo, G. The Right to Buy public housing in Britain: A welfare analysis. J. Hous. Econ. 2017, 35, 51–68. [Google Scholar] [CrossRef]
  4. Napoli, G.; Giuffrida, S.; Trovato, M.R. Fair Planning and Affordability Housing in Urban Policy. The Case of Syracuse (Italy). In International Conference on Computational Science and Its Applications; Springer: Cham, Switzerland, 2016; pp. 46–62. [Google Scholar] [CrossRef]
  5. Bottero, M.; Ambrosini, G.; Callegari, G. Valuing the Impact of Social Housing Renovation Programs: An Application of the Social Return on Investment (SROI). In Appraisal: From Theory to Practice; Springer: Cham, Switzerland, 2016; pp. 291–302. [Google Scholar] [CrossRef]
  6. Marta, B.; Giulia, D. Addressing Social Sustainability in Urban Regeneration Processes. An Application of the Social Multi-Criteria Evaluation. Sustainability 2020, 12, 7579. [Google Scholar] [CrossRef]
  7. Desvallées, L. Low-carbon retrofits in social housing: Energy efficiency, multidimensional energy poverty, and domestic comfort strategies in southern Europe. Energy Res. Soc. Sci. 2021, 85, 102413. [Google Scholar] [CrossRef]
  8. Vakalis, D.; Patino, E.D.L.; Opher, T.; Touchie, M.; Burrows, K.; MacLean, H.; Siegel, J. Quantifying thermal comfort and carbon savings from energy-retrofits in social housing. Energy Build. 2021, 241, 110950. [Google Scholar] [CrossRef]
  9. Saiu, V. Evaluating Outwards Regeneration Effects (OREs) in Neighborhood-Based Projects: A Reversal of Perspective and the Proposal for a New Tool. Sustainability 2020, 12, 10559. [Google Scholar] [CrossRef]
  10. Al Mulhim, K.A.M.; Swapan, M.S.H.; Khan, S. Critical Junctures in Sustainable Social Housing Policy Development in Saudi Arabia: A Review. Sustainability 2022, 14, 2979. [Google Scholar] [CrossRef]
  11. Odoyi, E.J.; Riekkinen, K. Housing Policy: An Analysis of Public Housing Policy Strategies for Low-Income Earners in Nigeria. Sustainability 2022, 14, 2258. [Google Scholar] [CrossRef]
  12. Alqahtany, A. Affordable housing in Saudi Arabia’s vision 2030: New developments and new challenges. Int. J. Hous. Mark. Anal. 2020, 14, 243–256. [Google Scholar] [CrossRef]
  13. Guarini, M.R.; Battisti, F. A Model to Assess the Feasibility of Public–Private Partnership for Social Housing. Buildings 2017, 7, 44. [Google Scholar] [CrossRef]
  14. Napoli, G.; Trovato, M.R.; Giuffrida, S. Housing Affordability and Income-threshold in Social Housing Policy. Procedia-Soc. Behav. Sci. 2016, 223, 181–186. [Google Scholar] [CrossRef]
  15. Napoli, G. The economic sustainability of residential location and social housing. An application in Palermo city. Aestimum 2016, 257–277. [Google Scholar] [CrossRef]
  16. Della Spina, L.; Calabrò, F.; Rugolo, A. Social Housing: An Appraisal Model of the Economic Benefits in Urban Regeneration Programs. Sustainability 2020, 12, 609. [Google Scholar] [CrossRef]
  17. Berto, R.; Cechet, G.; Stival, C.A.; Rosato, P. Affordable Housing vs. Urban Land Rent in Widespread Settlement Areas. Sustainability 2020, 12, 3129. [Google Scholar] [CrossRef]
  18. Stone, M. , Burke, T., Ralston, L. The Residual Income Approach to Housing Affordability: The Theory and the Practice, 1st ed.; AHURI Positioning Paper No. 139; AHURI: Melbourne, Australia, 2011; pp. 44–61. [Google Scholar]
  19. Napoli, G. Housing Affordability in Metropolitan Areas. The Application of a Combination of the Ratio Income and Residual Income Approaches to Two Case Studies in Sicily, Italy. Buildings 2017, 7, 95. [Google Scholar] [CrossRef]
  20. Osservatorio del Mercato Immobiliare—OMI. Real Estate Prices. Available online: https://www.agenziaentrate.gov.it/portale/schede/fabbricatiterreni/omi/banche-dati/quotazioni-immobiliari (accessed on 26 September 2020).
  21. Housing Europe. State of Housing in the 2019. Available online: https://www.housingeurope.eu (accessed on 26 September 2020).
  22. Eurostat. Income and living conditions. Available online: https://ec.europa.eu/eurostat/web/income-and-living-conditions/data/database (accessed on 26 September 2020).
  23. Nomisma. La Condizione Abitativa in Italia. Dalle Esperienze di Housing Sociale Alla Risposta del Piano Nazionale di Edilizia Abitativa e del Piano Casa. 2010. Available online: https://www.nomisma.it/la-condizione-abitativa-in-italia (accessed on 26 September 2020).
  24. Battaglia, R. Housing Sociale: Così la Cassa Depositi e Prestiti Risponde All’emergenza Casa. In Bolle, Crisi, Speculazione: Il Mattone Scricchiola. 2020. Available online: https://valori.it/dossier/gennaio2020 (accessed on 26 September 2020).
  25. Susanna, A. L’Housing Sociale Come Opportunità di Trasformazione Urbana e Sociale. In Proceedings of the Il Valore Sociale Degli Interventi di Social Housing: Il Progetto di Riqualificazione Urbana Della Ex-Manifattura Tabacchi di Perugia, Torino, Italy, 6 October 2016. [Google Scholar]
  26. Carriero, A.; Antellini Russo, F.; Screpanti, S.; Alterio, D. Social Housing. Il mercato immobiliare in Italia: Focus sull’edilizia sociale, CDP—Cassa Depositi e Prestiti. 2014. Available online: https://www.cdp.it/resources/cms/documents/3524753ef427665f31b668b176f7c5bf.pdf (accessed on 26 September 2020).
  27. CDP Investimenti SGR. Housing Sociale. Stato Attuale in Italia e Nei Principali Paesi Europei. 2017. Available online: http://www.unioneinquilini.it/public/doc/cassa_depositi_e_prestiti_dati_su_social_housing_in_italia_e_in_europa.pdf (accessed on 22 July 2020).
  28. Banca d’Italia. Survey on the Budgets of Italian Households. Available online: https://www.bancaditalia.it/pubblicazioni/indagine-famiglie/bil-fam2016/Statistiche_IBF_20180312.pdf (accessed on 26 September 2020).
  29. Istituto Nazionale di Statistica—ISTAT. Le Statistiche Dell’istat Sulla Povertà—Anno 2019. Available online: https://www.istat.it/it/files/2020/06/REPORT_POVERTA_2019.pdf (accessed on 26 September 2020).
  30. ISTAT. Available online: http://dati.istat.it/Index.aspx (accessed on 20 July 2020).
  31. Gazzetta Ufficiale. Italian and Regional Laws and Regulations on Social Housing. Available online: www.gazzettaufficiale.it (accessed on 26 September 2020).
  32. Bari Social Housing, Avviso per la Selezione di Candidature per Assegnazione di Alloggi in Locazione e Vendita Convenzionata. Available online: http://barisocialhousing.it/wp-content/uploads/2019/06/Avviso-di-selezione_BSH.pdf (accessed on 8 May 2022).
  33. Mila Census. Summarised Census Data. Available online: www.ottomilacensus.istat.it (accessed on 26 September 2020).
  34. Tuttitalia. Data on Italian Municipalities. Available online: www.tuttitalia.it (accessed on 26 September 2020).
  35. Presidenza del Consiglio dei Ministri. Dipartimento per Gli Affari Regionali e le Autonomie. I Dossier Delle Città Metropolitane. Città Metropolitana di Milano. 2017. Available online: http://www.affariregionali.it/media/170177/dossier-citt%C3%A0-metropolitana-di-milano.pdf (accessed on 26 September 2020).
  36. Presidenza del Consiglio dei Ministri. Dipartimento per Gli Affari Regionali e le Autonomie. I Dossier Delle Città Metropolitane. Città Metropolitana di Bari. 2017. Available online: http://www.affariregionali.it/media/170173/dossier-citt%C3%A0-metropolitana-di-bari.pdf (accessed on 26 September 2020).
  37. Sunia. Local Agreements. Available online: https://www.sunia.it/accordi-territoriali (accessed on 26 September 2020).
  38. Grigsby, W.G. Housing Market and Public Policy; Philadelphia University of Pennsylvania Press: Pennsylvania, PA, USA, 1963. [Google Scholar]
  39. Allen, M.T.; Springer, T.M.; Waller, N.G. Implicit pricing across residential rental submarkets. J. Real Estate Financ. Econ. 1995, 11, 137–151. [Google Scholar] [CrossRef]
  40. Goodman, A.C.; Thibodeau, T.G. Housing market segmentation and hedonic prediction accuracy. J. Hous. Econ. 2003, 12, 181–201. [Google Scholar] [CrossRef]
  41. Jasińska, E.; Preweda, E. The application of factorial analysis in the classification of the attributes of real estates. Gepdezja 2005, 11, 203–212. [Google Scholar]
  42. Abraham, J.M.; Goetzmann, W.N.; Wachter, S.M. Homogeneous Groupings of Metropolitan Housing Markets. J. Hous. Econ. 1994, 3, 186–206. [Google Scholar] [CrossRef]
  43. Bourassa, S.C.; Hamelink, F.; Hoesli, M.; Macgregor, B.D. Defining housing market. J. Hous. Econ. 1999, 8, 160–183. [Google Scholar] [CrossRef]
  44. Basu, S.; Thibodeau, T.G. Analysis of Spatial Autocorrelation in House Prices. J. Real Estate Financ. Econ. 1998, 17, 61–85. [Google Scholar] [CrossRef]
  45. Goodman, A.C.; Thibodeau, T.G. The Spatial Proximity of Metropolitan Area Housing Submarkets. Real Estate Econ. 2007, 35, 209–232. [Google Scholar] [CrossRef]
  46. Hwang, S.; Thill, J.C. Delineating Urban Housing Submarkets with Fuzzy Clustering. Environ. Plan. B Plan. Des. 2009, 36, 865–882. [Google Scholar] [CrossRef]
  47. Hruschka, H. Market definition and segmentation using fuzzy clustering methods. Int. J. Res. Mark. 1986, 3, 117–134. [Google Scholar] [CrossRef]
  48. Gan, G.; Ma, C.; Wu, J. Data Clustering: Theory, Algorithms, and Applications. In ASA-SIAM Series on Statistics and Applied Mathematics; Society for Industrial and Applied Mathematics: Philadelphia, PA, USA, 2007. [Google Scholar] [CrossRef]
  49. Kaufman, L.; Rousseeuw, P.J. Partitioning Around Medoids (Program PAM). In Finding Groups in Data: An Introduction to Cluster Analysis; John Wiley & Sons, Inc.: New York, NY, USA, 1990. [Google Scholar]
  50. Bana e Costa, C.A.; De Corte, J.-M.; Vansnick, J.-C. On the Mathematical Foundation of MACBETH. In Multiple Criteria Decision Analysis: State of the Art Surveys; Springer: New York, NY, USA, 2005; pp. 409–437. ISBN 978-0-387-23067-2. [Google Scholar] [CrossRef]
  51. Trovato, M.R.; Clienti, C.; Giuffrida, S. People and the City: Urban Fragility and the Real Estate-Scape in a Neighborhood of Catania, Italy. Sustainability 2020, 12, 5409. [Google Scholar] [CrossRef]
  52. Gabrielli, L.; Giuffrida, S.; Trovato, M.R. Gaps and Overlaps of Urban Housing Sub-market: Hard Clustering and Fuzzy Clustering Approaches. In Appraisal: From Theory to Practice; Springer: Cham, Switzerland, 2016; pp. 203–219. [Google Scholar] [CrossRef]
  53. Gabrielli, L.; Giuffrida, S.; Trovato, M.R. From Surface to Core: A Multi-Layer Approach for the Real Estate Market Analysis of a Central Area in Catania; ICCSA 2015, LCNS 9157; Gervasi, O., Murgante, B., Misra, S., Eds.; Springer: London, UK, 2015; Volume III, pp. 284–300. [Google Scholar] [CrossRef]
  54. Napoli, G.; Giuffrida, S.; Valenti, A. Forms and Functions of the Real Estate Market of Palermo (Italy). Science and Knowledge in the Cluster Analysis Approach. In Appraisal: From Theory to Practice; Stanghellini, S., Morano, P., Bottero, M., Oppio, A., Eds.; Springer: Cham, Switzerland, 2016; pp. 191–202. [Google Scholar] [CrossRef]
Figure 1. Social housing in the European Union and the United Kingdom in 2019 (source: Housing Europe).
Sustainability 14 07172 g001
Figure 2. Overcrowding (a) and overburden (b) housing rates in EU-27 and other countries in 2018 (source: Eurostat).
Sustainability 14 07172 g002
Figure 3. Social housing funds in 2020 (source: Battaglia 2020).
Sustainability 14 07172 g003
Figure 4. Functional mix in social housing and types of lease in 2020 (source: Battaglia 2020).
Sustainability 14 07172 g004
Figure 5. Territorial distribution of SH interventions financed by the FIA by geographical area (a) and of SH units by region (b) (source data: CDP Investimenti SGR, 2016).
Sustainability 14 07172 g005
Figure 6. Absolute and relative poverty of households and population in Italy in 2019 (data source: ISTAT).
Sustainability 14 07172 g006
Figure 7. Percentage of inhabitants and gross domestic product (GDP) by Italian region (source: ISTAT 2019).
Sustainability 14 07172 g007
Figure 8. Taxpayers by annual income brackets and geographical area (a); by low and lower middle income and by Italian region (b) in 2019 (source: ISTAT).
Sustainability 14 07172 g008
Figure 9. Location of the two case studies in Italy.
Sustainability 14 07172 g009
Figure 10. Towns of the case study of the Metropolitan City of Milan.
Sustainability 14 07172 g010
Figure 11. The three centroid clusters of the agreed rent dataset for the Metropolitan City of Milan identified based on k-medoids clustering analysis.
Sustainability 14 07172 g011
Figure 12. The internal differentiation of Cluster 1 elements based on distance from its centroid (sub-zones 1).
Sustainability 14 07172 g012
Figure 13. The internal differentiation of Cluster 1 elements based on distance from its centroid (sub-zones 2).
Sustainability 14 07172 g013
Figure 14. The internal differentiation of Cluster 1 elements based on distance from its centroid (sub-zones 3).
Sustainability 14 07172 g014
Figure 15. Location of the sub-zones 1 in the Metropolitan City of Milan according to the internal differentiation of Cluster 1 elements based on distance from its centroid.
Sustainability 14 07172 g015
Figure 16. Location of the sub-zones 2 in the Metropolitan City of Milan according to the internal differentiation of Cluster 1 elements based on distance from its centroid.
Sustainability 14 07172 g016
Figure 17. Location of the sub-zones 3 in the Metropolitan City of Milan according to the internal differentiation of Cluster 1 elements based on distance from its centroid.
Sustainability 14 07172 g017
Figure 18. The three clusters of the rent dataset for the Metropolitan City of Bari identified based on k-medoids clustering analysis.
Sustainability 14 07172 g018
Figure 19. The internal similarity of Cluster 2 elements based on distance from its centroid: (a) in the sub-zone 1; (b) in the sub-zone 2; (c) in the sub-zone 3; (d) in the sub-zone 4; (e) in the sub-zone area 5; (f) in the sub-zones 6–9.
Sustainability 14 07172 g019
Figure 20. Variation of the minimum (a) and maximum (b) agreed rent over the OMI’s rents in the Metropolitan City of Milan.
Sustainability 14 07172 g020
Figure 21. Variation of the minimum (a) and maximum (b) agreed rent over the OMI’s rents in the Metropolitan City of Bari.
Sustainability 14 07172 g021
Figure 22. Percentage of the agreed rents for the different sub-zones based on the semantic categories of MACBETH.
Sustainability 14 07172 g022
Figure 23. Percentage of the agreed rents for the different sub-zones based on the semantic categories of MACBETH.
Sustainability 14 07172 g023
Figure 24. Comparison between the percentage of the agreed rents for the different sub-zones of the two metropolitan cities of Bari and Milan.
Sustainability 14 07172 g024
Figure 25. Comparison between the two centroids of the most representative clusters for the metropolitan cities of Bari and Milan.
Sustainability 14 07172 g025
Table 1. Economic data of a notice for the allocation of SH units in Bari (2019) (source data: Bari Social Housing).
City and
Neighborhood
Household Income
Thresholds
Housing Unit
Size
Agreed RentsAgreed Rent with
Redemption Right
MinMaxMinMaxMinMax
€/year€/yearSq.mSq.m€/year€/year€/sq.m year€/sq.m year
Bari—Santo Spirito768045,7794054256034566494
627339684672
759148005824
Table 2. Statistics of metropolitan cities of Milan and Bari in 2019 (source: ISTAT).
Metropolitan City
of Milan
Metropolitan City
of Bari
Geographic areaNorthern ItalySouthern Italy
RegionLombardiaPuglia
Capital cityMilanBari
Municipalities (No.)13341
Area (km2)1575.653825
Percentage of regional area (%)6.60%19.57%
Area of the capital city (km2)181.67116.17
Inhabitants (No.)3,250,0771,234,997
Percentage of regional inhabitants (%)30.0832.19
Inhabitants of the capital city (No.)1,395,980316,491
Pro-capite GDP * (€/year)46,12822,319
* data year 2014.
Table 3. Characteristics of groups and subgroups in the homogeneous zones.
GroupSubgroupCharacteristics
Type AA1Internal bathroom completes with all elements (cup, sink, bathtub or shower) and with at least one window or mechanical ventilation device
A2Essential and functional technological systems: Drinking water supply; plant prepared for the installation of the water heater; electrical system; gas system
Type BB1Habitable kitchen with at least one window
B2Lift for living units located on the 2nd floor or upper floor
B3Normal maintenance status of the building unit and for all its constituent elements: technological systems, fixtures, floors, walls, and ceilings
B4Technological systems complying with the sanitary and safety regulations in force on the date of conclusion of the agreed rent
B5Central heating or autonomous
Type CC1Double bathroom of which at least one complete with all the elements (cup; sink; bathtub or shower) and with at least one window or mechanical ventilation device
C2Garage or carport (exclusive or shared)
C3Communal garden
C4Good maintenance status of the real estate unit and for all its constituent elements: technological systems of the house, fixtures, floors, walls, and ceilings
C5Normal maintenance status of the building and for all its constituent elements: common technological systems, facades, roofs, stairs, and internal common zones
C6Armored doors and double glazing
C7Proximity of the house to all services: Metro station, tram network, shops, and social services
Type DD1Presence of accessory elements: Balconies or terrace
D2Presence of functional elements: Cellar or attic
D3Apartments with an age of less than 30 years, except for buildings of value, although not bound by law
D4Absence of specific sources of environmental and noise pollution
D5Exterior view of value
D6Private garden or exclusive open space
D7Uncovered parking space
D8Apartments that in the last 10 years have been the subject of building intervention maintenance for which is required the declaration in the municipality of the beginning of activity (SCIA—Signaling Certified Beginning Activity)
D9Terrace of more than 20 square meters
Table 4. Database for the Metropolitan City of Milan (13/269 elements).
MunicipalitySub-ZoneMinimum Annual RentMinimum Real Estate FeaturesAccessibilityPop. Density€15,000 < pop.
Income < €26,000
€/sq.mScoreScoreInhab./sq.km%
Arese160.00133000.4626.54%
268.00533000.4626.54%
375.00833000.4626.54%
154.00133000.4626.54%
262.00533000.4626.54%
368.00833000.4626.54%
Basiglio190.00123000.4617.75%
296.0052952.1817.75%
3101.0082952.1817.75%
165.0012952.1817.75%
271.0052952.1817.75%
379.0082952.1817.75%
Bollate160.00142801.9134.89%
Table 5. Database for the Metropolitan City of Bari (12/45 elements).
MunicipalitySub-ZoneMinimum Annual RentMinimum Real Estate FeaturesAccessibilityPop. Density€15,000 < pop.
Income < €26,000
€/sq.mScoreScoreInhab./sq.km%
Acqua viva Fonti121.0033155.1728.53%
219.2053155.1728.53%
327.8463155.1728.53%
Bari121.00352745.6926.78%
222.80452745.6926.78%
340.92452745.6926.78%
424.00552745.6926.78%
520.76552745.6926.78%
618.60552745.6926.78%
721.00552745.6926.78%
819.80552745.6926.78%
924.60652745.6926.78%
Publisher’s Note: MDPI stays neutral with regard to jurisdictional claims in published maps and institutional affiliations.

