Article

Assessment of Soil Salinization Risk by Remote Sensing-Based Ecological Index (RSEI) in the Bosten Lake Watershed, Xinjiang in Northwest China

1
College of Geography and Remote Sensing Sciences, Xinjiang University, Urumqi 830046, China
2
Key Laboratory of Oasis Ecology Ministry of Education, Xinjiang University, Urumqi 830046, China
3
Institute of Geography and Tourism, Xinjiang Normal University, Urumqi 830054, China
*
Author to whom correspondence should be addressed.
Sustainability 2022, 14(12), 7118; https://doi.org/10.3390/su14127118
Submission received: 27 April 2022 / Revised: 26 May 2022 / Accepted: 8 June 2022 / Published: 10 June 2022
(This article belongs to the Special Issue Land Use Change, Air Quality and Environmental Pollution Government)

Abstract

:
Accurate real-time information about the spatial and temporal dynamics of soil salinization is crucial for preventing the aggravation of salinization and achieving sustainable development of the ecological environment. With the Bosten Lake watershed as the study area, in this study, the regional risk factors of soil salinization were identified, the salinization information was extracted, and the remote sensing-based ecological index (RSEI) of soil salinization was assessed through the combined use of remote sensing (RS) and geographic information system (GIS) techniques and measurements of soils samples collected from various field sites. The results revealed that (1) a four period (1990, 2000, 2010, and 2020) RS dataset on soil salinization allowed for the accurate classification of the land use/land cover types, with an overall classification accuracy of greater than 90% and kappa values of >0.90, and the salt index (SI), an RS-derived risk factor of soil salinization, was significantly correlated with the actual measured salt content of the surface soils. (2) The RS-derived elevation and normalized difference vegetation index (NDVI) were significantly correlated with the SI-T. (3) An integrated risk assessment model was constructed for the soil salinization risk in the Bosten Lake watershed, which calculated the integrated risk index values and classified them into four risk levels: low risk, medium risk, high risk, and extremely high risk. (4) Due to the combined effect of the surface water area and terrain, the soil salinization risk gradually decreased from the lake to the surrounding areas, while the corresponding spatial range increased in order of decreasing risk. The areas with different levels of soil salinization risk in the study area during the last 30 years were ranked in decreasing order of medium risk > high risk > extremely high risk > low risk. These findings provide theoretical support for preventing and controlling soil salinization and promoting agricultural production in the study area.

1. Introduction

Soil salinization is one of the main forms of land degradation in arid and semi-arid regions, and its occurrence and evolution are complex dynamic processes involving numerous coupled factors such as climate, hydrology, parent materials, and vegetation [1,2]. Soil salinization is generally prone to occur in areas with an arid climate, high soil evaporation, a high groundwater table, and a high soluble salt content. Soil salinization directly and indirectly affects agricultural production and the sustainability of resources and environmental development. Proper assessment and prevention of soil salinization are of great practical importance for promoting agricultural production and sustainable regional development [3]. Studies have been extensively conducted on salinization from various aspects, including botany, economics, soil science, ecology, and the environment [4,5,6]. In the 1970s, remote sensing (RS) technology was introduced in salinization research to obtain RS images, leading to a shift from manual methods to computer-based methods of extracting salinization information [7,8,9,10]. Microwave technology has gradually come to play a vital role in the real-time monitoring of soil salinization. For example, Taylor [11] monitored the spatial dispersion of saline land in the irrigation area near West Victoria, Australia, based on RS data and confirmed that saline land and non-saline land can be distinguished to the maximum extent using the L-band of the spectrum. In recent years, research on soil salinization in China has been mainly conducted in the Yellow River Delta [12], the Songnen Plain in northeastern China [13], and the oasis areas in the hinterland of Xinjiang [13]. Due to the special geographical location and climate of these regions, the occurrence and evolution of primary salinization, as well as the occurrence and evolution of secondary salinization, under inappropriate human activities have gradually received attention. Research efforts in China have mainly aimed to improve the ecological environment in salinized areas by developing soil water-salt transport models and improving saline soils [14,15,16,17,18].
Since the 1990s, numerous studies have been conducted to explore the basic theories and methods for the assessment of ecological risks associated with water and natural hazards, heavy metals in sediments, land use, and regional development [18,19,20,21,22,23,24]. Ecological risk assessment has been developed over many years, shifting from a focus on the ecological risks of chemical pollution to the ecological risks on the landscape and regional scales. In addition, the assessment has become more comprehensive, with a focus on understanding the characteristics of complex ecosystems and considering them in each stage of regional ecological risk assessment. For ecological risks in arid watersheds, Zhang et al. [25] investigated the spatial and temporal variations in the landscape ecological risk in the Ebinur Lake region, but they did not consider the impact of soil salinization on the wetland ecological risk.
In the above context, the Bosten Lake watershed, a basin subject to strong human activities, was selected as the study area. Through the combined use of RS and geographic information system (GIS) techniques and measurements of soil samples collected from various field sites, in this study, the risk factors of soil salinization in the study area were identified, the regional salinization information was extracted, and the integrated risk index of soil salinization was assessed. The main objectives of this study were (1) to identify the RS-derived factors indicative of soil salinization risk in the watershed; (2) to analyze the relationship between each RS-derived factor and the measured soil salt content; and (3) to establish a risk assessment index system for soil salinization in arid areas and construct a soil salinization risk model, which is of great practical importance for analysis of the status and risk assessment of regional soil salinization.

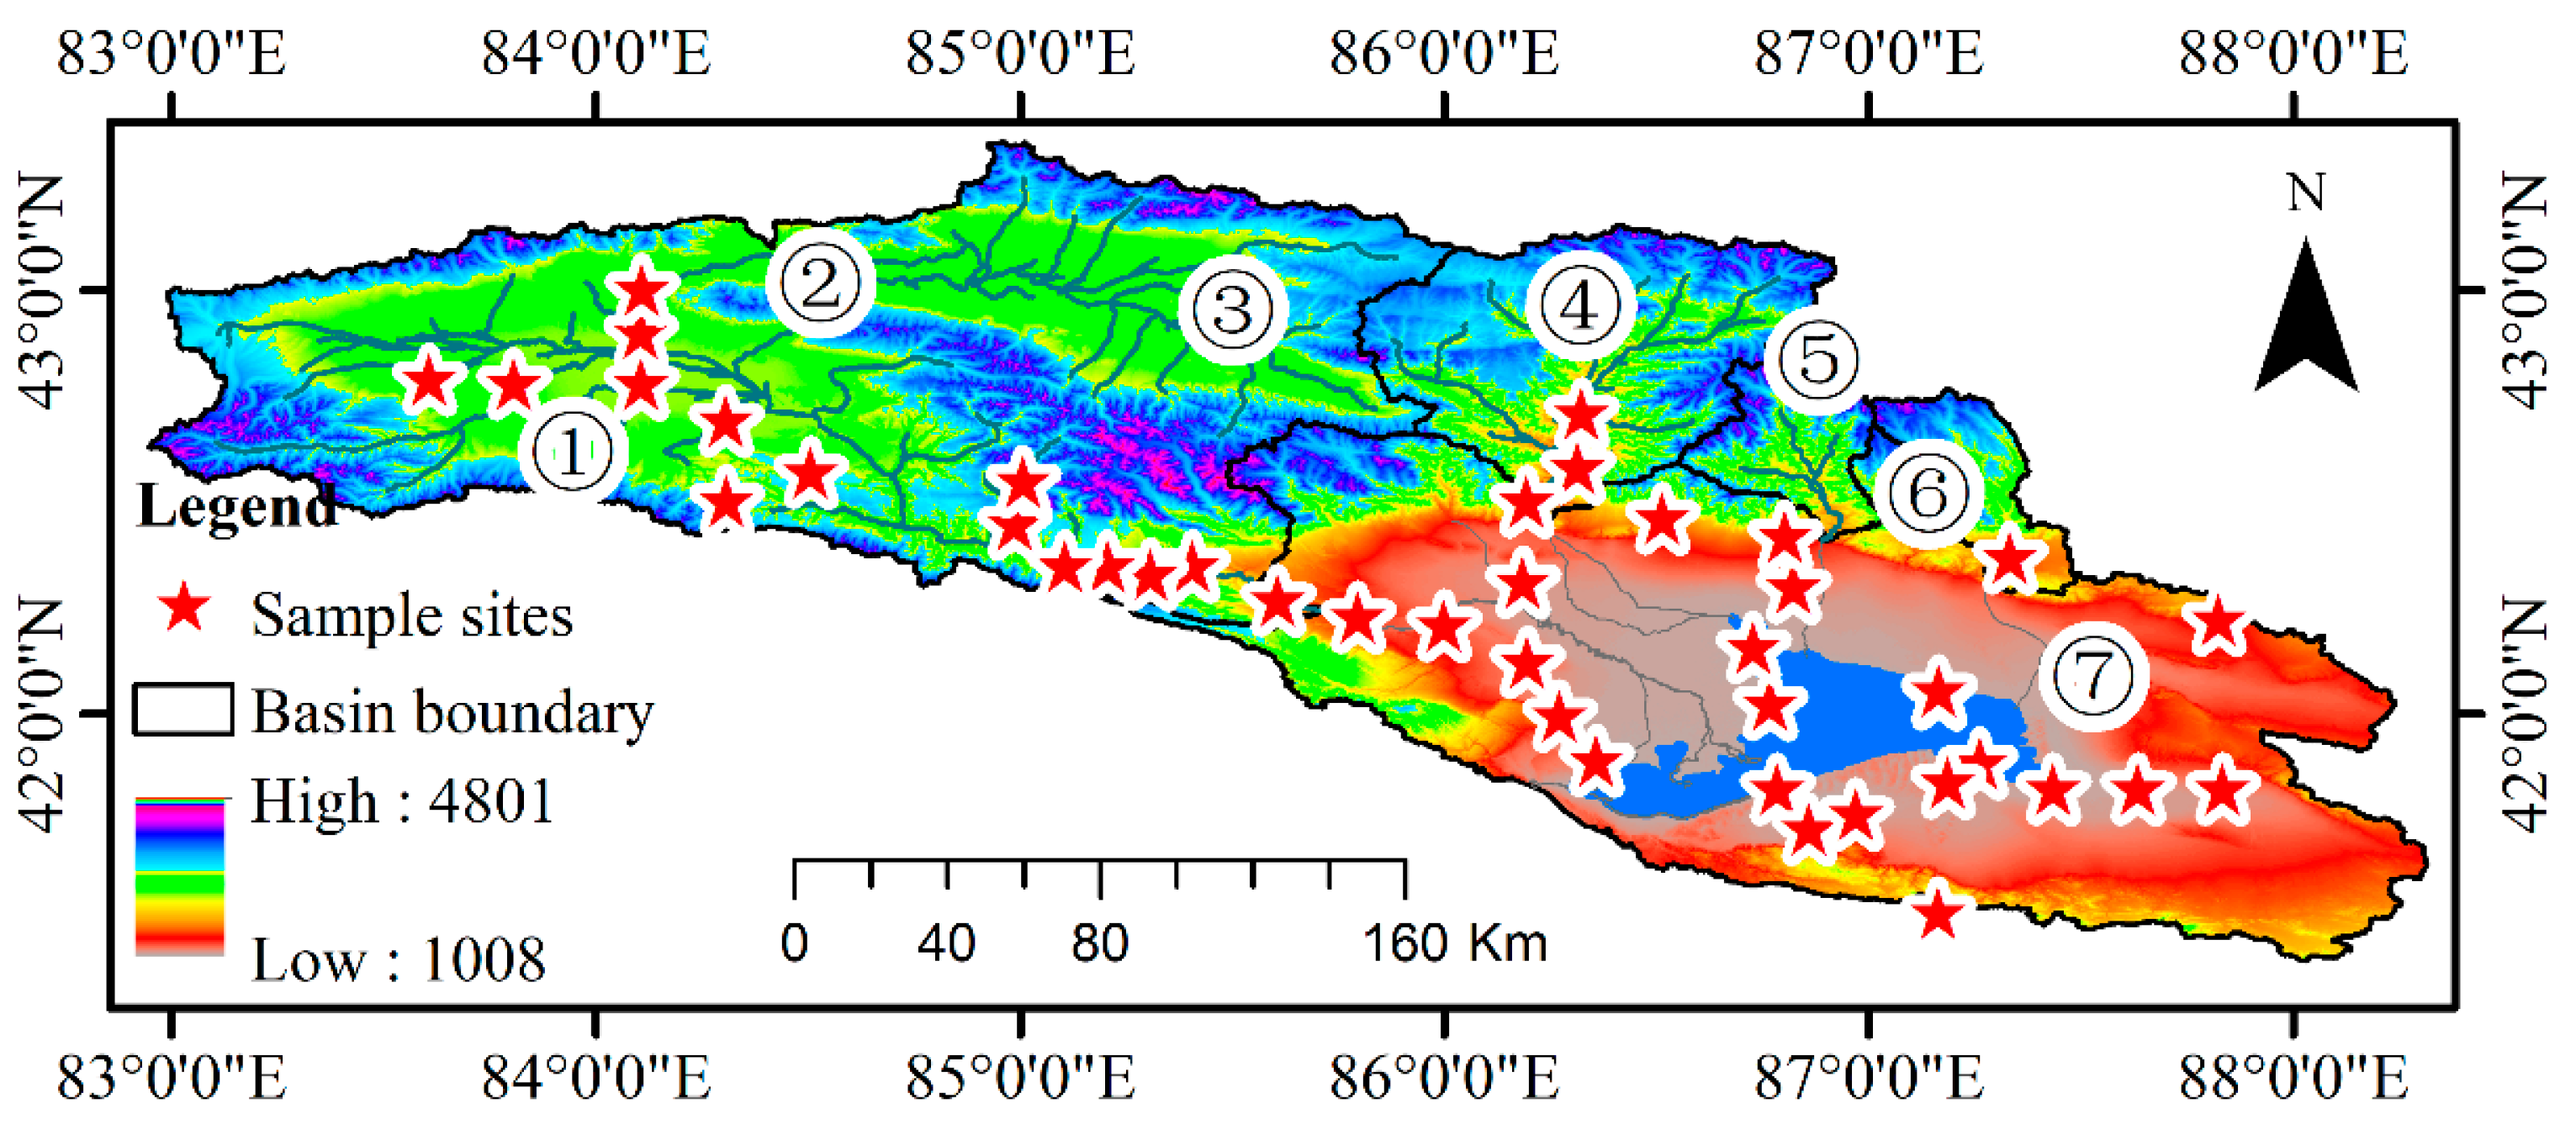
2. Overview of the Study Area

The Bosten Lake watershed (82°54′10″–88°21′06″ E, 41°21′19″–43°21′34.8″ N) is located in the Bayin’guoleng Mongol Autonomous Prefecture in Xinjiang, with a total area of about 43,930 km2 and elevations of 1008–4801 m. The regional terrain is generally high in the northwest and low in the southeast. The study area mainly consists of the Kaidu River watershed (including the Great Youerdusi Basin and the Little Youerdusi Basin), the Huangshuigou River watershed, the Qingshui River watershed, the Ushtala River watershed, the Yanqi Basin, and more than 20 temporary river basins (Figure 1). The Bosten Lake watershed has a temperate continental arid climate, with a long sunshine duration, a mean annual evaporation of 2368 mm, and a mean annual precipitation of only about 60 mm (more than 80% of which occurs in summer). The rivers in the basin are mainly recharged by alpine snowmelt and ice-melt, as well as rainfall. The regional landscape varies with elevation, mainly including glacial snow belt, meadow steppe belt, oasis plain, desert steppe belt, desert belt, and the Bosten Lake waters in order of decreasing elevation. The Bosten Lake is surrounded by mountains and has a typical continental desert climate, which is characterized by a dry spring with little precipitation, a dry and hot summer, a cool fall, and a cold winter [26].

3. Materials and Methods

3.1. Data Sources

Cloud-free Landsat OLI (Operational Land Image) and Thematic Mapper (TM) images with medium spatial resolutions were used in this study. Four RS images of the study area acquired on different dates in the fall, namely, a Thematic Mapper (TM) RS image acquired in August, 1990, in September, 2000, and two Operational Land Imager (OLI) RS images acquired in October, 2010, and October, 2020, were used as the base datasets for the study area, all of which were obtained from the United States Geological Survey (USGS) website (http://glovis.usgs.gov/, accessed on 11 May 2021) [27]. The RS images were good quality and were free of clouds, fog, and snow. The RS images were subjected to radiometric correction and orthorectification using a 30 m resolution digital elevation model (DEM).
Field surveys were conducted in the Bosten Lake watershed from 13 July 2020 to 23 August 2020. Specifically, surface soil samples were collected from 43 sites on the north and south shores of the Bosten Lake, as well as in the Kaidu River watershed (Figure 1). Two kilograms of topsoil (0–20 cm) taken from each sample point was loaded into plastic bags for analysis in the laboratory. The samples were transported back to the laboratory for analysis. (1) The soil samples were allowed to air-dry indoors. (2) The air-dried samples were ground, crushed, and passed through a 2 mm sieve. (3) Then, 20 g of soil sample was weighed and mixed with 100 mL of deionized water (i.e., a water-soil ratio of 5:1, v/w) to form a soil slurry. (4) The soil salt content was determined using a conductivity/salinity meter (Orion 115 A+, Thermo Fisher, Boston, MA, USA), with a relative accuracy of ±0.1 mV or 0.05%; and the soil pH was measured using a pH electrode.

3.2. Selection and Calculation of Risk Assessment Factors for Soil Salinization

The occurrence and evolution of soil salinization in the Bosten Lake watershed is jointly controlled by multiple factors. The intensity and distribution of each factor and the combination of multiple factors affect the probability of salinization, leading to great uncertainty in predicting the occurrence and evolution of soil salinization. Therefore, the choice of factors will affect the accuracy of the determination of the soil salinization risk.
The soil salinization risk in a given region, such as the watershed in this study, can be assessed in terms of the land use type, vegetation index, salt index, and topography, according to the Provisional Regulations for Ecological Function Zoning issued by the Environmental Protection Administration of China [28]. Given the actual situation of the watershed and the availability of data, the above four factors were adopted as the risk factors of soil salinization. Single-factor risk assessment was conducted using each of these factors, and then an integrated risk assessment model was constructed considering the weights of each factor.
  • Land use/land cover
In view of its special geographical environment, the study area was classified into six land use/land cover (LULC) types, namely, water bodies, forests and grassland, saline land, farmland, deserts, and other, by interpreting the regional RS images based on the Chinese Land Use Classification Criteria (GB/T21010-2017). The other category mainly included the Gobi Desert and mountains.
  • Salt index
Comparison of the spectral characteristics of the general surface features with the spectral characteristics of the saline soils has demonstrated that the soil salt index (SI) constructed using the blue and red bands of RS images can reflect the degree of soil salinization well [28]. Therefore, the soil SI was constructed in this study. Specifically, the 450 nm and 685 nm bands of the Landsat TM and OLI images were used to construct the SI as follows:
SI = Red NIR × 100
where Red is the reflectance in the red band and NIR is the reflectance in the near-infrared (NIR) band.
  • Normalized difference vegetation index
The normalized difference vegetation index (NDVI) is currently the most widely used vegetation index in research on vegetation distribution and soil salinization [29]. It is defined as the difference between the reflectances observed in the NIR band and the red band divided by the sum of the two reflectance values:
NDVI = NIR R NIR + R
where NIR is the reflectance of an image pixel in the NIR band, and Red is the reflectance of the same image pixel in the red band. The NDVI was chosen as one of the main risk factors of soil salinization in this study for two reasons. First, the NDVI is related to vegetation and is also affected by the spectral reflectances from various backgrounds such as soils, wet ground, snow, dead leaves, and rough surfaces. Second, the NDVI is sensitive to changes in the soil.
  • Landscape morphology
Soil salinization is closely related to landscape morphology, with different elevations leading to different types of saline soils and salinization levels [24]. Therefore, elevation was considered to be an important factor affecting the salinity risk level in this study. The Bosten Lake watershed consists of four sub-watersheds separated by high mountains (Figure 2). The Great Youerdusi Basin, the Little Youerdusi Basin, and the Yanqi Basin are gently sloping. The slope distribution is influenced by the geomorphology, and the slope of each sub-watershed is greatest in the high mountainous areas, followed by the midland mountainous areas. The slopes in the Greater Youerdusi Basin, the Little Youerdusi Basin, and the Yanqi Basin are relatively small.

3.3. Integrated Risk Assessment of Soil Salinization

The integrated risk index of soil salinization can be constructed in a manner similar to that of the remote sensing-based ecological index (RSEI), an integrated indicator of the ecological risk, namely, by using a weighted average method as follows [30,31]:
ERI = i = 1 m x × w i
where m is the number of all the risk factors of soil salinization; xi and wi are the values for the risk factors of soil salinization and weight of risk factor i, respectively.
Specifically, the soil salinization risk in the Bosten Lake watershed was comprehensively assessed using a weighted index method according to the method used in a previous study [32]. The special geographical factors of the study area were considered, and the following two assumptions were made. (1) The sum of the weights of the risk factors was equal to one; and (2) each risk factor had the same weight of 0.25.
The integrated risk index of soil salinization was calculated for each image index, and each calculated value was classified into one of four risk levels (levels 1–4), with a lower level indicating a lower risk. This assessment scheme allowed the risk status of the soil salinization to be reflected to some extent, thereby serving as an important basis for evaluating the salinization risk levels of soils.
The integrated risk levels of soil salinization in the Bosten Lake watershed are presented in Table 1 [30]. The risk index values of soil salinization calculated using the Raster Calculator ranged from 1 to 4. According to Li et al. [33] and Yao et al. [34] and considering the characteristics of the study area, the risk index values were classified into four risk levels based on the natural inflection points: low risk (RSEI < 1), medium risk (1 ≤ RSEI < 2), high risk (2 ≤ RSEI < 3), and extremely high risk (3 ≤ RSEI < 4). The higher the risk index is, the more unstable the system is, and the lower the potential of the system is.

4. Results and Analysis

4.1. Single-Factor Assessment of Soil Salinization Risk in the Bosten Lake Watershed

4.1.1. Soil Salinization Risk Assessment in Terms of LULC Types

The regional LULC types in1990, 2000, 2010, and 2020 are shown in Figure 3, and the overall classification accuracy is presented in Table 2. As is shown by Table 2, the RS image-based LULC classification accuracy was high in all three periods, exceeding 96%. As is shown in Figure 3, the main LULC type in the Kaidu River watershed was forest and grassland, while the LULC types in the Yanqi Basin, the only agricultural area in the study region, were mainly farmland, desert, water bodies, and saline land. In contrast, the other four sub-basins had relatively diverse LULC types. As is shown in Figure 4, the saline land area of the Bosten Lake watershed was greatest in 2010 when it reached the highest level during the 20-year study period (2010–2020), and it was lowest in 2020, with a drastic decrease from 2010 to 2020. Accordingly, the risk of soil salinization was highest in 2010.

4.1.2. Soil Salinization Risk Assessment in Terms of SI

The soil salt content is an important indicator of the degree of soil salinization. The measured salt contents of 43 surface soil samples collected in the summer in 2020 were subjected to correlation analysis with the corresponding SI (Figure 4). The results showed that the correlation coefficient (R2) between the RS image-derived SI and the measured soil salt contents reached 0.72, suggesting that it may be possible to use the derived SI to reflect the actual spatial distribution of soils with different degrees of salinization in the study area.
Figure 5 illustrates the spatial distribution of the SI in the three periods. It is evident that the degree of soil salinization in the Bosten Lake watershed gradually decreased from the lake area to the surrounding area. The Bosten Lake area is located in the central depression in the study area, and, thus, it has a low elevation and a high groundwater table, leading to extremely low vegetation coverage. The southern shore of the lake is surrounded by sand dunes, and, thus, the vegetation is sparse, leading to a high degree of soil salinization in the areas surrounding the lake. The southeastern part of the study area has high elevations and is located in the eastern part of the Yanqi Basin, where the vegetation coverage is low and the topographic variation is small, which facilitates salt accumulation, leading to a high degree of soil salinization. From 1990 to 2020, the center of the area with a high SI gradually shifted from northwest of the lake to southeast of the lake. In particular, the surface water area of Bosten Lake reached the maximum value in 2000, with the range of saline soils expanding towards the areas surrounding the lake.

4.1.3. Soil Salinization Risk Assessment in Terms of NDVI

The NDVI was negatively correlated with the SI (Figure 6), with R2 = 0.95. As the salt content of the surface soils increased, the vegetation coverage decreased, and the original vegetation species in the watershed were gradually replaced by salt-tolerant spices such as Tamarix chinensis, Kalidium spp., and Halogeton spp. When the soil salt content increased to a certain level, the high salt stress prevented the normal growth of vegetation and the vegetation coverage dropped to zero, forming a heavily saline area.
As is shown in Figure 7, the surface water area of Bosten Lake was largest in 2000, with a high salt content and small NDVI. In contrast, in 2010 the surface water area was the smallest during the three periods, the soil salt content was low, and the NDVI was large. This is attributed to the following facts. (1) The study area, which is located in the arid zone in Xinjiang, has a typical temperate continental climate with dry weather and scarce precipitation. (2) Bosten Lake is mainly recharged by the Kaidu River, the Huangshuigou River, and the Qingshui River, all of which originate from the Tianshan Mountains. (3) In summer, the water supply of these rivers is mainly alpine snowmelt, with a smaller contribution from atmospheric precipitation. Although the NDVI is positively correlated with the atmospheric precipitation in the same period in a certain sense, an exception may apply when the temperature is so high that the amount of glacial meltwater is large enough to increase the surface water area of the lake and decrease the NDVI in the surrounding areas. In such a scenario, the intensive evaporation under the high temperatures leads to a sharp increase in the salt content of the surface soils. The above reasoning explains why the surface water area of Bosten Lake was the largest in 2000, with a high soil salt content and low NDVI, and why it was the smallest in 2010, with a low soil salt content and high NDVI.

4.1.4. Soil Salinization Risk Assessment in Terms of Topography

The study area was divided into four elevation ranges, namely, 1008–1859 m, 1859–2748 m, 2748–3348 m, and 3348–4801 m, to assess the impact of topography on the soil salinization risk. Specifically, the relationship between the SI and elevation was examined along two typical transects with distinctly different elevations. Transect 1 extended along the canyons and mountains of the Qingshui River and Huangshuigou River watersheds where the topographic variations are large. Transect 2 extended across the flat area in the southwestern part of the Yanqi Basin (Figure 8) where the topographic variations are small.
Transect 1 was located in the upstream area of the sub-watershed northwest of the lake and in the upwind direction to the lake. As is shown in Figure 9a, the elevation variations along transect 1 were generally not large, except for drastic variations in some local areas. Starting from image pixel 601, the elevation dropped sharply from 2000 m to 1000 m and the SI increased from 40 to 80, with peak values, suggesting that low terrain favors the accumulation of soil salts. From image pixels 1001 to 1401, the terrain rose gradually and the SI decreased drastically. In contrast, transect 2 exhibited a slow but obvious increase in elevation (Figure 9b), which was accompanied by a decrease in the SI. Starting from image pixel 201, the elevation significantly increased and the SI continuously decreased, implying a significant correlation between the two. These observations indicate that topography was one of the main causes of soil salt accumulation at the regional scale in this watershed.
To better clarify the relationship between salt accumulation and topography, the 2500 SI data points along the two transects and the corresponding 2500 elevation data points were subjected to regression analysis (Figure 10). The results revealed that the SI was significantly quadratic correlated with elevation, suggesting that topography is a key factor to consider when performing integrated assessment of the soil salinization risk.

4.2. Integrated Assessment of Soil Salinization Risk in the Bosten Lake Watershed

The integrated soil salinization risk levels are shown in Figure 11. They decreased gradually from the lake to the surrounding areas. In particular, the areas surrounding the lake have low terrain since they are situated inside the central depression of the Yanqi Basin where the groundwater table is high. These poor natural conditions lead to extremely low vegetation coverage in general and almost no vegetation in some areas in particular, which in turn leads to a high soil salinization risk. In contrast, the area north of the lake has high elevations with small topographic variations and a high vegetation coverage, which is not favorable to the accumulation of soil salts and thus leads to a low soil salinization risk.
The temporal trend of the area at a given level of soil salinization risk is presented in Table 3. The extremely high risk areas in the Bosten Lake watershed decreased from 14,904 km2 in 2000 to 11,683.11 km2 in 2020, with a total reduction of 3221.12 km2 over the 20-year period. This was mainly due to the integrated ecological management in the watershed. The high risk areas increased by 1503.71 km2 during 2000–2020, gradually expanding outward from the lake. In particular, some of the bare land around the lake degraded to saline land. This was mainly due to the influence of the climate and groundwater on the bare land. The areas with the widest distribution in the study area were the medium risk areas, which accounted for more than 40% of the study area. The medium risk areas increased and then decreased during the study period, namely, increasing from 24,178.98 km2 in 2000 to 27,629.50 km2 in 2010 and then decreasing to 26,632.15 km2 in 2020. This trend was mainly due to the gradual expansion of the high risk areas from the lake area towards the periphery of the study area as a result of the gradual transformation of low risk areas to high risk areas. This was mainly attributed to both the shrinkage of the surface water area of Bosten Lake and global warming, which led to decreased vegetation coverage and increased soil evaporation, ultimately leading to the accumulation of salt in the surface soils. Accordingly, the low risk areas decreased from 5350.13 km2 in 1990 to 2222.5 km2 in 2020.

5. Discussion

The results revealed that the areas with high SI values in the Bosten Lake watershed were mainly concentrated in the southwest of the lake, and the degree of soil salinization gradually decreased with increasing distance from the lake. This pattern is attributed to the fact that the areas surrounding the lake have low terrain since they are situated inside the central depression of the study area where the groundwater table is high. These poor natural conditions led to extremely low vegetation coverage in general and almost no vegetation in some areas in particular, which in turn led to a high degree of soil salinization in the areas surrounding the lake. Moreover, the shrinkage of the surface water area of Bosten Lake and the decline of the lake water level in recent years have led to the gradual evolution of the water body into a wetland with lower elevations compared to the surrounding areas, thereby favoring water and salt accumulation. In addition, the strong evaporation in the lakeside areas in the Yanqi Basin has resulted in a high salt content in the surface soil layer and even salt incrustation in some places [35,36,37].
The dynamics of soil salinization are mainly influenced by both natural and human factors. The natural factors that were responsible for the soil salinization dynamics in the study over the past 40 years were mainly climatic and hydrologic factors, while the main human factor was the irrational use of water resources. Climate is the driving force of soil salinization, and the regional climate in the Bosten Lake watershed is becoming warmer and more humid due to global climate change. Under climate warming and humidification, the lake water level has been rising since 2013, which was mainly due to the increase in the lake water supply from snowmelt and ice-melt as the precipitation and temperature increase in the mountains [34]. The changes in the lake water level and increase in air temperature have led to a significant increase in soil salinization in the lake area. The Yanqi Basin is the main area with agricultural production and a high population density in the watershed. This basin has experienced farmland expansion and the over-exploitation of surface water/groundwater, which has led to the continuous discharge of a large amount of highly mineralized, farmland drainage water into the lake, causing an increase in the salt content of the lake water and surrounding areas [38,39]. In addition, reservoirs and irrigation/drainage channels have been constructed to allocate the water resources in order to achieve full utilization of the water resources, but this anthropogenic practice has changed the number and spatial distribution of the water bodies. As a consequence, the wetlands are less replenished by water than before and thus have undergone aridification and salinization. As was discussed above, there is a high risk of future soil salinization in the Bosten Lake watershed under the combined influence of climate change and human activities.

6. Conclusions

Accurate real-time information about the spatial and temporal dynamics of soil salinization is crucial for preventing the aggravation of salinization and achieving sustainable development of the ecological environment. With the Bosten Lake watershed as the study area, in this study, the regional risk factors of soil salinization were identified, the regional salinization information was extracted, and the remote sensing-based ecological index (RSEI) of soil salinization was assessed through the combined use of remote sensing (RS) and geographic information system (GIS) techniques and measurements of soils samples collected from various field sites. The results revealed that:
(1)
A four period (1990, 2000, 2010, and 2020) RS dataset on soil salinization allowed for the accurate classification of the land use/land cover types, with an overall classification accuracy of greater than 90% and kappa values of >0.90, and the salt index (SI), an RS-derived risk factor of soil salinization, was significantly correlated with the actual measured salt content of the surface soils.
(2)
The RS-derived elevation and normalized difference vegetation index (NDVI) were significantly correlated with the SI-T.
(3)
An integrated risk assessment model was constructed for the soil salinization risk in the Bosten Lake watershed, which calculated the integrated risk index values and classified them into four risk levels: low risk, medium risk, high risk, and extremely high risk.
(4)
Due to the combined effect of the surface water area and terrain, the soil salinization risk gradually decreased from the lake to the surrounding areas, while the corresponding spatial range increased in order of decreasing risk. The areas with different levels of soil salinization risk in the study area during the last 30 years were ranked in decreasing order of medium risk > high risk > extremely high risk > low risk.

Author Contributions

Methodology—software, Y.R.; writing—review and editing, J.H. All authors have read and agreed to the published version of the manuscript.

Funding

This research was funded by National Natural Science Foundation of China, grant number U1703341.

Institutional Review Board Statement

The study did not require ethical approval.

Informed Consent Statement

Not applicable.

Data Availability Statement

The study did not report any data.

Acknowledgments

This research was carried out with the financial support provided by the National Natural Science Foundation of China (U1703341). The authors wish to thank the referees for providing helpful suggestions for the improvement of the manuscript.

Conflicts of Interest

The authors declare no conflict of interest.

References

  1. Akter, F.; Bishop, T.; Vervoort, R.W. Space-time modelling of groundwater level and salinity. Sci. Total Environ. 2021, 776, 145865. [Google Scholar] [CrossRef] [PubMed]
  2. Khajehzadeh, M.; Afzali, S.F.; Honarbakhsh, A.; Ingram, B. Remote sensing and gis-based modeling for predicting soil salinity at the watershed scale in a Semi-arid region of Southern Iran. Arab. J. Geosci. 2022, 15, 423. [Google Scholar] [CrossRef]
  3. Wang, Z.; Zhang, F.; Zhang, X.; Chan, N.W.; Wang, Y. Regional suitability prediction of soil salinization based on remote-sensing derivatives and optimal spectral index. Sci. Total Environ. 2021, 775, 145807. [Google Scholar] [CrossRef] [PubMed]
  4. Wang, X.; Zhang, F. Extracting soil salinization information with a fractional-order filtering algorithm and grid-search support vector machine (GS-SVM) model. Int. J. Remote Sens. 2020, 41, 953–973. [Google Scholar] [CrossRef]
  5. Berdimuratov, M.K.; Lyashko, S.I.; Nomirovskii, D.A. Modeling and optimization of salinization of irrigated soil. J. Math. Sci. 2020, 96, 20–30. [Google Scholar] [CrossRef]
  6. Wang, R.Z. Plant functional types and their ecological responses to salinization in saline grasslands, Northeastern China. Photosynthetica 2004, 42, 511–519. [Google Scholar] [CrossRef]
  7. Wang, X.; Zhang, F.; Ding, J.; Kung, H.-t.; Latif, A. Estimation of soil salt content in the Ebinur Lake Wetland National Nature Reserve (ELWNNR), Northeast China based on the Bootstrap-BP neural network model and optimal spectral index. Sci. Total Environ. 2004, 615, 918–930. [Google Scholar] [CrossRef]
  8. Zhou, X.; Zhang, F.; Liu, C.; Kung, H.T.; Johnson, V.C. Soil salinity inversion based on novel spectral index. Environ. Earth Sci. 2021, 80, 501. [Google Scholar] [CrossRef]
  9. Masoud, A.A.; Koike, K. Arid land salinization detected by remotely-sensed land cover changes: A case study in the Siwa region, NW Egypt. J. Arid. Environ. 2006, 66, 151–167. [Google Scholar] [CrossRef]
  10. Qi, G.; Chang, C.; Yang, W.; Gao, P.; Zhao, G. Soil salinity inversion in coastal corn planting areas by the satellite-uav-ground integration approach. Remote Sens. 2021, 13, 3100. [Google Scholar] [CrossRef]
  11. Taylor, G.M.R. Pharmacogenetics of the human beta-adrenergic receptors. Pharm. J. 2007, 7, 29–37. [Google Scholar] [CrossRef] [PubMed] [Green Version]
  12. Chen, H.; Zhao, G.; Chen, J.; Wang, R.; Gao, M. Remote sensing inversion of saline soil salinity based on modified vegetation index in estuary area of Yellow River. Trans. Chin. Soc. Agric. Eng. 2015, 31, 107–114. (In Chinese) [Google Scholar]
  13. Bin, L.; Wang, Z.; Liang, Z.; Chi, C. Quality of Groundwater in Soil Areas in Da’an City and Soil Salinization Risk of Using the Water for Irrigation. J. Ecol. Rural Environ. 2006, 22, 20–24, 61. (In Chinese) [Google Scholar]
  14. Bui, E.N.; Henderson, B.L. Vegetation indicators of salinity in northern Queensland. Austral Ecol. 2003, 28, 539–552. [Google Scholar] [CrossRef]
  15. Muhetaer, N.; Nurmemet, I.; Abulaiti, A.; Xiao, S.; Zhao, J. A quantifying approach to soil salinity based on a radar feature space model using alos palsar-2 data. Remote Sens. 2022, 14, 363. [Google Scholar] [CrossRef]
  16. Liu, D. Soil moisture and salinity inversion based on new remote sensing index and neural network at a salina-alkaline wetland. Water 2021, 13, 2762. [Google Scholar]
  17. Zhang, X.; Huang, B. Prediction of soil salinity with soil-reflected spectra: A comparison of two regression methods. Sci. Rep. 2019, 9, 5067. [Google Scholar] [CrossRef]
  18. Song, C.-C.; Deng, W.; Li, Q.-S.; Wang, Z.C.; Zhang, G.H. Techniques of Controlling Secondary Soil Salinization in the West of Songnen Plain. Sci. Geogr. Sin. 2002, 22, 610–614. (In Chinese) [Google Scholar]
  19. Yan, Y.; Quanjiu, W. Analysis Water and Salt Transport Characteristic of Irrigation with Saline Water on Alkaline and Saline Soil. J. Soil Water Conserv. 2008, 22, 13–19. (In Chinese) [Google Scholar]
  20. Wallace, R.N.; Hope, B.K. Quantitative consideration of ecosystem characteristics in an ecological risk assessement: A case study. Hum. Ecol. Risk Assess. 2002, 8, 1805–1814. [Google Scholar] [CrossRef]
  21. Efroymson, R.A.; Murphy, D.L. Ecological risk assessment of multimedia hazardous air pollutants: Estimating exposure and effects. Sci. Total Environ. 2001, 274, 219–230. [Google Scholar] [CrossRef]
  22. Naito, W.; Miyamoto, K.; Nakanishi, J.; Masunaga, S.; Bartell, S.M. Application of an ecosystem model for aquatic ecological risk assessment of chemicals for a Japanese lake. Water Res. 2002, 36, 1–14. [Google Scholar] [CrossRef]
  23. Sungur, A.; Vural, A.; Gundogdu, A.; Soylak, M. Effect of antimonite mineralization area on heavy metal contents and geochemical fractions of agricultural soils in gümühane province, turkey. Catena 2020, 184, 104255. [Google Scholar] [CrossRef]
  24. Vural, A.; Akpinar, İ.; Sipahi, F. Mineralogical and Chemical Characteristics of Clay Areas, Gümüşhane Region (NE Turkey), and Their Detection Using the Crósta Technique with Landsat 7 and 8 Images. Nat. Resour. Res. 2021, 30, 3955–3985. [Google Scholar] [CrossRef]
  25. Zhang, Y.; Zhang, F.; Zhou, M.; Li, X.-H.; Ren, Y.; Wang, Y. Landscape ecological risk assessment and its spatio-temporal variations in Ebinur Lake region of inland arid area. Chin. J. Appl. Ecol. 2016, 27, 233–242. (In Chinese) [Google Scholar]
  26. Xi, C.; Wu, J.; Qi, H. Simulation of climate change impacts on streamflow in the Bosten Lake basin using an artificial neural network model. J. Hydrol. Eng. 2008, 13, 180–183. [Google Scholar]
  27. Wang, X.; Zhang, F.; Kung, H.T.; Johnson, V.C. New methods for improving the remote sensing estimation of soil organic matter content (SOMC) in the ebinur lake wetland national nature reserve (elwnnr) in Northwest China. Remote Sens. Environ. 2018, 218, 104–118. [Google Scholar] [CrossRef]
  28. Tripathi, N.K.; Rai, B.K.; Dwivedi, P. Spatial modeling of soil alkalinity in GIS environment using IRS data. In Proceedings of the 18th Asian Conference on Remote Sensing, Kuala Lumpur, Malaysia, 20–24 October 1997; pp. 81–86. [Google Scholar]
  29. Wang, F.; Ding, J.; Wu, M. Remote sensing monitoring models of soil salinization based on NDVI-SI feature space. Trans. Chin. Soc. Agric. Eng. 2010, 26, 168–173. [Google Scholar]
  30. Wang, Z.; Li, G.; Li, X.; Shan, S.; Zhang, J.; Li, S.; Fan, J. Characteristics of moisture and salinity of soil in Taklimakan desert, China. Water Sci. Technol. A J. Int. Assoc. Water Pollut. Res. 2012, 66, 1162–1170. [Google Scholar] [CrossRef]
  31. Fuchsman, P.; Lyndall, J.; Bock, M.; Lauren, D.; Capdevielle, M. Terrestrial ecological risk evaluation for triclosan in land-applied biosolids. Integr. Environ. Assess. Manag. 2010, 6, 405–418. [Google Scholar] [CrossRef]
  32. Zhao, J. “Interim regulations on ecological functional area” is published by SEPA (state environmental protection administration). China Econ. Trade Her. 2002, 19, 41. (In Chinese) [Google Scholar]
  33. Li, Z.; Li, W.; Shi, H.; Jia, X. Gray Model for Ecological Risk Assessment and Its Application in Salinization Oasis Agroecosystem. J. Desert Res. 2002, 22, 617–622. (In Chinese) [Google Scholar]
  34. Yao, J.; Yang, J.; Chen, X.; Yu, S.; Li, X. Evaluating soil salinization risk in typical coastal reclaimed regions in North Jiangsu Province. Chin. J. Eco-Agric. 2010, 18, 1000–1006. (In Chinese) [Google Scholar] [CrossRef]
  35. Liu, J.; Zhang, L.; Dong, T.; Wang, J.; Fan, Y.; Wu, H.; Geng, Q.; Yang, Q.; Zhang, Z. The applicability of remote sensing models of soil salinization based on feature space. Sustainability 2021, 13, 13711. [Google Scholar] [CrossRef]
  36. Qin, X.; Kong, C.; Ren, Y. The application of remote sensing technology to soil salinization in yanqi basin. Lect. Notes Electr. Eng. 2012, 113, 891–896. [Google Scholar]
  37. Liu, Y.F.; Cao, Y.L.; Ouyang, Z.P. Information statistical analysis of influencing factors of soil salinization in Yanqi Basin. Environ. Sci. Technol. 2010, 33, 23–27. [Google Scholar]
  38. Yuan, X.; Yang, D.H. Study on the aqueous environment problems of the Bosten lake, Xinjiang. Arid. Zone Res. 2008, 497, 571–581. [Google Scholar]
  39. Wang, S.; Wang, S. Land use/land cover change and their effects on landscape patterns in the Yanqi Basin, Xinjiang (China). Environ. Monit. Assess. 2013, 185, 9729–9742. [Google Scholar] [CrossRef]
Figure 1. Schematic map of the study area and the distribution of the sampling sites. (① Dayousi basin; ② Kaidu basin; ③ Xiaoyousi basin; ④ Huangshuigou basin; ⑤ Qingshuihe basin; ⑥ Wushita basin; ⑦ Yanqi basin).
Sustainability 14 07118 g001
Figure 2. Elevation classification of Bosten Lake Watershed (the elevation was divided into four grades and different weights were used to calculate the salinization risk).
Sustainability 14 07118 g002
Figure 3. Areas of different land use/land cover types in the Bosten Lake watershed during different periods (the area of farmland and saline land expanded significantly from 1990 to 2020).
Sustainability 14 07118 g003aSustainability 14 07118 g003b
Figure 4. Relationship between the salt index and the measured salt content of the surface soil.
Sustainability 14 07118 g004
Figure 5. Spatial distribution of the salt index in the Bosten Lake watershed during different periods (Yanqi Basin is the most serious salinization area).
Sustainability 14 07118 g005
Figure 6. Relationship between the salt index and the normalized difference vegetation index (the NDVI was negatively correlated with the SI, with R2 = 0.95).
Sustainability 14 07118 g006
Figure 7. Normalized difference vegetation index of the Bosten Lake watershed.
Sustainability 14 07118 g007aSustainability 14 07118 g007b
Figure 8. Digital elevation model and SI of the research area.
Sustainability 14 07118 g008
Figure 9. Relationship between the salt index and elevation along (a) transect 1 and (b) transect 2.
Sustainability 14 07118 g009
Figure 10. Digital elevation map and salt index map of the study area in 2020, the SI was significantly quadratic correlated with elevation, R2 is 0.64.
Sustainability 14 07118 g010
Figure 11. Distribution of soil salinization risk levels in the Bosten Lake watershed.
Sustainability 14 07118 g011aSustainability 14 07118 g011b
Table 1. Evaluation factor ecological risk assessment.
Risk GradeLand Use/Cover TypeNormalized Vegetation Index/%Normalized Salinity Index/%Elevation/mAssignment
Low risk areaWater body, Forest-grass land80–1000–201008~18591
Medium risk areaDesert, Other land60–8020–401859~27482
High risk areaWetland40–6040–602748~33483
Extremely high risk Saline land20–4060–803348~48014
Table 2. Accuracy table of the LUCC classification image in the study area.
YearTotal Accuracy/%Kappa
199097.440.97
200097.800.97
201098.230.97
202096.440.96
Table 3. Statistics of the assessment results of the soil salinization risk in the Bosten Lake watershed.
Risk Grade1990200020102020
Area/km2Ratio/%Area/km2Ratio/%Area/km2Ratio/%Area/km2Ratio/%
Low risk area5350.138.973561.195.971902.333.192222.53.73
Medium risk area25,891.4943.4324,178.9840.5527,629.5046.3426,632.1544.67
High risk area17,140.5028.7516,972.0528.4616,140.5027.0718,475.7630.99
Extremely high risk area11,234.3518.8414,904.2325.0113,644.1422.8811,683.1119.59
Publisher’s Note: MDPI stays neutral with regard to jurisdictional claims in published maps and institutional affiliations.

