1. Introduction
The introduction of electric vehicles (EVs) brings the idea of vehicle-to-grid (V2G) and grid-to-vehicle (G2V) into the energy market, which will convert the overloaded network into a valuable source. EVs are supplied with proper control methods to fatten the load, shave the peak, and regulate the frequency. EV charging and discharging via a bidirectional power flow in a smart grid (SG) is expected to decrease the cost of subsidiary (reserved) energy production and improve the system’s robustness [
1]. In more detail, as an example, when many EVs begin charging simultaneously throughout peak energy consumption periods, the large power generators must begin the subsidiary generators (with a shorter response time) to supplement the energy demand, and this results in a delay for the subsidiary generators to begin producing energy. Ten to fifteen min is needed for energy to be provided. Ref [
2] proposes game theory structures such as the energy grid, EVs, and smart communities, providing insight into possible optimization techniques for achieving efficient and intelligent energy management. In spite of this, large penetrations of EVs into the electrical system raise issues regarding the impact on electrical system stability and operational costs [
3].
Refs [
4,
5] examined a centralized information center operator as the aggregator for gathering energy consumption demand and further commanding the transfer of energy in the traditional EV discharging/charging method. Utilizing the aggregator, control methods are used for controlling power flow during peak and off-peak hours, respectively. Since the behavior of EV users is uncontrollable, EVs are considered a widely distributed power load on the power grids. This makes it possible to schedule the exchange of energy, even if a predetermined scheduling process does not consider every factor affecting the electrical grid [
6]. Although SG aggregators are designed for decentralizing traditional energy grids and supporting micro-distributed renewable generators, they compromise the purpose of the SGs [
7]. As a result of the centralized-based system, decision-making is delayed and grid participants’ autonomy is undermined, in that users cannot control the discharging or charging of their processes. The current average cost of electricity that users are paying at the time of consumption is generally not indicative of the actual wholesale costs. When operating costs vary, it is difficult to adjust to fluctuating power demand [
8,
9].
Several control methods for EV discharging and charging techniques have been presented before to control the duration and amount of energy transferred in order to enhance grid performance. Smart charging planning for low-voltage residential grids based on the state-of-charge (SOC) amounts like battery residual and battery capacity, thus impacting the entire grid offloading, is presented in ref [
5]. In ref [
4], automatic generation control signals are applied for regulating EV discharging and charging schedules for enhancing the frequency regulation service’s efficiency is examined by considering the dynamic departure time and arrival time of EVs. Ref [
10] examined an aggregated based on the optimization model of the EV charging process by considering the stochastic characteristics of the charging process and applied the Genetic Algorithm (GA) for determining the parameters of the system model. The proposed EV discharging/charging schedule algorithms in [
5] assumed static parameters for the EV’s accessible charging time. It is important to note that in [
4,
10] the suggested charging layout was on the basis of parameter estimations and theoretical calculations which did not completely account for the flexibility of EVs. Thus, it would be difficult for the blockchain (BC) platform to be adapted to the kinds of battery and consumer behavior associated with EVs.
Due to a large number of EV charging and dispatching demands, a BC idea has been developed for providing peer-to-peer transferred structures, which utilize decentralized storage for whole transferred information data. Therefore, BC technology will enable a non-trusting network to eliminate the operational costs of the intermediaries, which would result in a cheaper, faster, and more reliable way of reflecting fluctuating wholesale costs to consumers. BC technology can also shift high-load equipment to off-peak hours for reducing energy prices and assist in reducing the overloaded peaks [
11,
12]. Therefore, ref [
13] examined a new scheme to trade energy on the basis of BC technology for adopting the decentralized and competitive environment of local energy production, however, the BC was only utilized as a data storage warehouse for transaction recording. A detailed analysis of the economic assessment of the market mechanism for local energy trading can be found in ref [
14]. According to ref [
15], BCs and decentralized consensus methods were applied for coordinating the planning of distributed power sources in a microgrid and guaranteeing fair payments with no need for a centralized aggregator.
In order to charge EVs on a large scale, simple control methods are required for reducing operating delay and investment costs. As a result, an adaptive EV discharging/charging planning algorithm is presented in this study according to the BC platform, called Adaptive BC-based EV Participation (AdBEV) for executing the data sharing and decision-making method.
As a method of solving the problem, the Iceberg order management algorithm [
16] is widely applied in the digital financial trading market and is assumed a powerful machine learning approach that can be used for managing EV discharging and charging demands. In summary, the study makes the following contributions:
- (1)
A new EV participation method, which can introduce the idea of decentralized EV discharging and charging on a BC-enabled SG system is presented in this study.
- (2)
A discharging and charging plan issue related to EVs on the BC-enabled SG network is formulated for the EV charging schedule.
- (3)
The AdBEV layout on the basis of the iceberg order algorithm, which executes the optimal order process for matching the SG electricity discharging and charging demand is proposed in order to reduce the power fluctuation level.
- (4)
AdBEV has been shown to have a better power fluctuation level in comparison with the benchmark method that utilizes GA. Besides, it has been shown that the suggested algorithm achieves low computation prices in comparison with the benchmark layout in the Ethereum platform.
Following are the remaining parts of this study. The system model according to the matching imbalances of the EV consumer profile related to discharging/charging is built in
Section 2. The problem formulation and the algorithm definition are presented in
Section 3. The simulation outcomes and the AdBEV vs. GA comparison are demonstrated in
Section 4.
Section 5 presents the conclusions.
2. System Model
As an extension to the system model developed in [
17], a residential district that has a substation transformer whose maximum power capacity is
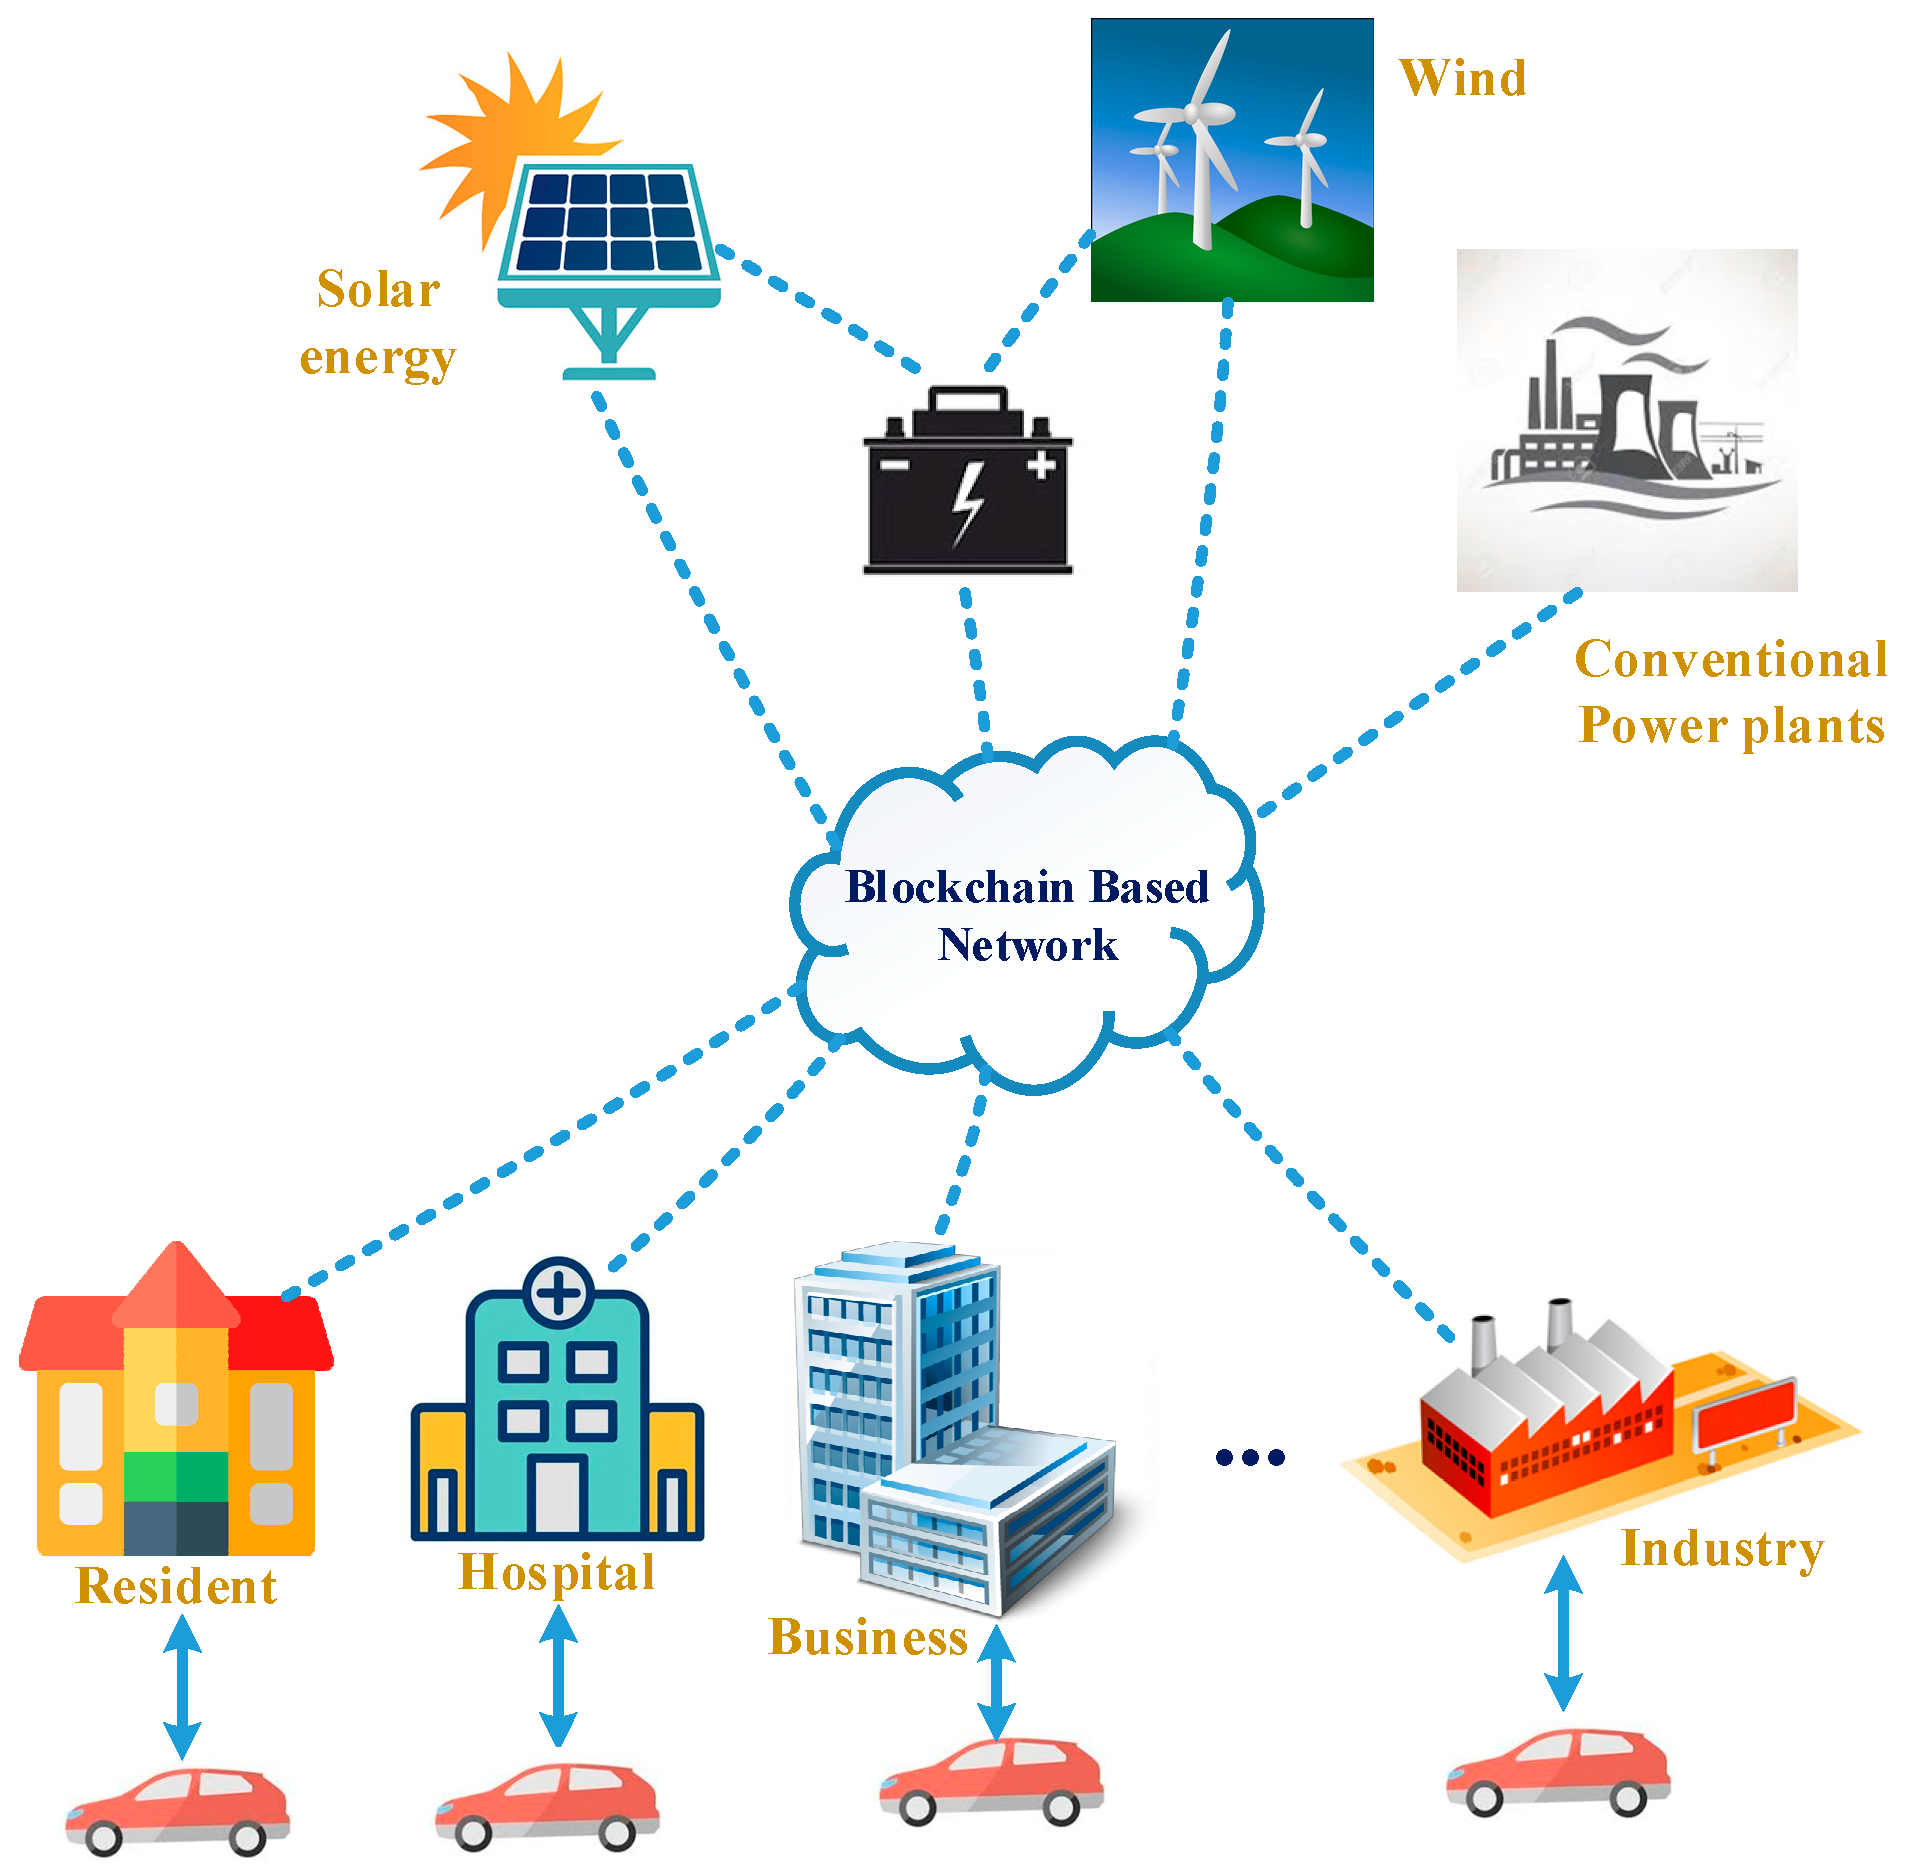
, is considered here. On the supplier side, there are traditional extend power plants, distributed micro renewable generators, and storage. In addition, the user power loads, such as residential areas and hospitals, are linked to the public BC energy exchange platform that allows for the transmission, encryption, and storage of information about electricity supply and demand.
Figure 1 illustrates the architecture of the power network including the public BC platform to trade power.
This model assumes that EVs can publish and transmit the discharging or charging orders to the SG public BC trading platform. EVs are able to be charged and discharged using a programmable charging installation. Using this design, the grid operator will be able to switch the power transmission for the EV instantly on/off (presuming the switches are complicated).
Figure 2 illustrates the process for processing the transaction in the BC platform. Driver owners initiate the power orders including buying and selling, and once the identity of the initiator has been verified, orders can be entered on the BC-based trading platform. After that, the AdBEV layout is used to process the orders, which are then published in the open order book. Peers in the grid transact and verify the matched orders. Both parties must confirm orders before they can be stored in a distributed manner.
where
represents the EV status matrix as Equation (2). It should be noted that in our research, we considered 100 households, where every household is assumed to own an EV. Hence, the diminution of this matrix of our research is 100 × 1.
Battery residual for every EV is
and the predicted SOC when charging determines the power demand for EV is
. The formula looks like this:
When scheduling EV discharging/charging, it is essential to take into consideration how many EVs remain linked to the system in order to determine the maximum waiting time for the order. According to this study, the duration of the charging, and the amount of energy transferred, are combined to predict the hourly charging demand pattern throughout the day for achieving minimal energy fluctuations and consumer satisfaction.
Profiles of vehicle activity related to the normal residential EV charging demands are modeled using [
18]. The pattern of the charging demand on a daily basis can be inferred by combining the duration of the charging and the amount of energy transferred. Equation (3) can be used to model the amount of energy transferred during EV charging based on the balance between complexity and precision, and this is expressed using a time segment vector
comprised of the percentage of stay-on-line EV in Equation (4).
The
refers to the first time step and while
refers to the second time step elapsed that can enable the formation of a certain fitting in
order of sine series. The
shows the order for the total of sine series derived from the Matlab curve fitting toolbox, in which
indicates the model complexity of the sum of the sines. The parameters in the sum of the sine series are shown by the
,
, and
. In view of the charging load profile (LP) indication that a specific number of EVs should remain online during the procedure, Equation (4) is rewritten accordingly:
Here, the whole number of EVs in an area is shown by Ω. The power demand for one-time segment changes during every iteration of order execution. Accordingly, Equation (2) is reformulated with the amount of power exchange
according to the order category:
Therefore, the whole residential load is described as the total demand for EV discharging/charging and LP excluding EV for formulating EV charging problems.
Here, the power load excluding EV is shown by . Aggregating the above random process (7) with the suggested algorithm can solve the EV discharging/charging scheduling problem. In order to enhance the operation of the electric grid, it is advisable not to exceed the peak transformer substation load following the implementation of EV discharging and charging to the residential electricity demand. In limitation (8), the error item shows power losses or branch overloaded plus the total power load should not exceed the substation power capacity . Hence, there is a maximum number of EV max, which is employed in the system to prevent exceeding the substation capacity. The levels of the voltage in buses have been limited, and cannot exceed the minimum and maximum limits in limitation (9).
3. Formulation of the Problem and Explanation of the Algorithm
EV discharging and charging demand is scheduled to minimize the effect of consuming or injecting excessive amounts of energy on the network. The paper examines an adaptive discharging/charging method for different kinds of EVs for flattening the LP of transformer substations in distribution networks.
A. Formulation of the problem
As input data, the daily 30 min power interchange order book profile of a residential grid has been used, with EV charging/discharging demands on a daily basis as the decision parameter. A schedule that is adaptive for filling in the gaps in the residential LP is essential for equalizing the level of alternation of the entire system. Accordingly, the total function of utility for measuring the level of alternations in 2-time parts of a network is:
Here, the total power alternation level during 24 h with 30 min temporal resolution is shown by
,
and the overall power in the transformer at hour
and
is represented by
This system is aimed at minimizing the power alternation level criteria
of the total energy network using a set of variables to be optimized for related
and its related
, as shown below:
Using Equation (12), the charging and discharging power from EVs is limited to the order demand based on the existing EV number and the obtained . In Equation (13), the initial SOC is set between (0,1). Despite the fact that this limitation might lead to a less flattened power LP, users’ requirements are met as a consequence of this limitation. The limitation (14) ensures that the maximum SOC following charging is not greater than the EV battery capacity for every EV . As explained in (13), an EV could have just 2 states, one being connected to the network and one being disconnected.
As Equation (15) has a binary constraint for EV connection state , the formulation of the issue is a mixed combinatorial nonconvex issue. The optimal solution to this problem is not a systematic method with an effective computational method. The optimization problem can be to determine how many EVs should be used for transferring energy (discharging/charging) to reduce the total power fluctuations. It should be noted that the required infrastructures to deploy the proposed technique are including, but are not limited to, open cloud, reliable and scalable hardware, updated software, a stable internet connection, databases, battery, several energy resources, different levels of load demand, EV, point of sales terminals, crypto automated teller machines (ATMs), etc.
B. ADBEV layout
This part proposes an AdBEV layout for solving this issue by utilizing the power exchange book as a trading system. A scheduling result in the previous time slot can affect the power demand in the next one as well. The grid system needs to be kept at a minimum power fluctuation so as to provide the total power charging demand of EVs.
a. Normal electricity exchange order
In the case of a small quantity power exchange order, the demand has been formatted as an input that can be sent to the power exchange stand book
via a vector as shown below:
Here, the specific identifier for the discharging/charging initiators is shown by the
in which they are EVs or other equipment, the confirmed agent price for the power order is represented by the
, the power demand amount of the order is shown by the
, and
presents a matrix showing if it is a power discharging or charging order:
To produce every matched trade, the solution must be used in the existing book
for each inserted order message, and whole non-error output must be directed to the
. The trade information format can be described in the following way:
Here, the and indicate the matched power buy and sell order identifier respectively, this matched price in pence is shown by the and the matched amount for the order is represented by the . The solutions must display the existing full order book in the previous format upon receiving an order message and upon receiving every matching entry in the book.
b. ICEBERG power interchange structure
An extend user can hold an overall exchange demand
and intend to liquidate it before time
, in which case the peak size
and a limit
to the demand of the iceberg are assigned. The latter exceeds the initial optimal bid price
on the charging side, as shown below:
The first portion of the order cannot be quickly executed, and the reverse is also true.
For ensuring the smooth running of the iceberg power exchange and the advantage achieved by participants, choosing the right price is critical. Based on ref [
16], a jump-diffusion process is used to model the optimal charging price
. This paper aimed at building an electricity exchange market for EV consumers, to find a guide price related to every period of time, when
, the extensively applied geometric Brownian motion for the stock price is adopted for modeling the real-time power price on a daily basis:
Here, it is possible to set the percentage drift
and percentage volatility
as constants, and a Wiener process is shown by
. So, the next equations allow obtaining the optimal iceberg price
for a certain top price value
:
In Equation (22), the iceberg format is given by the vector integrating the order optimal price
and the overall demand
. In theory,
shows the peak for a single trading period that will never exceed
:
Based on the priority function, both normal and iceberg power exchanges must be depicted in the order book:
Here, the ranking for the price is shown by
and the ranking for generation time is indicated by
, and
for building a price-competitive market. In
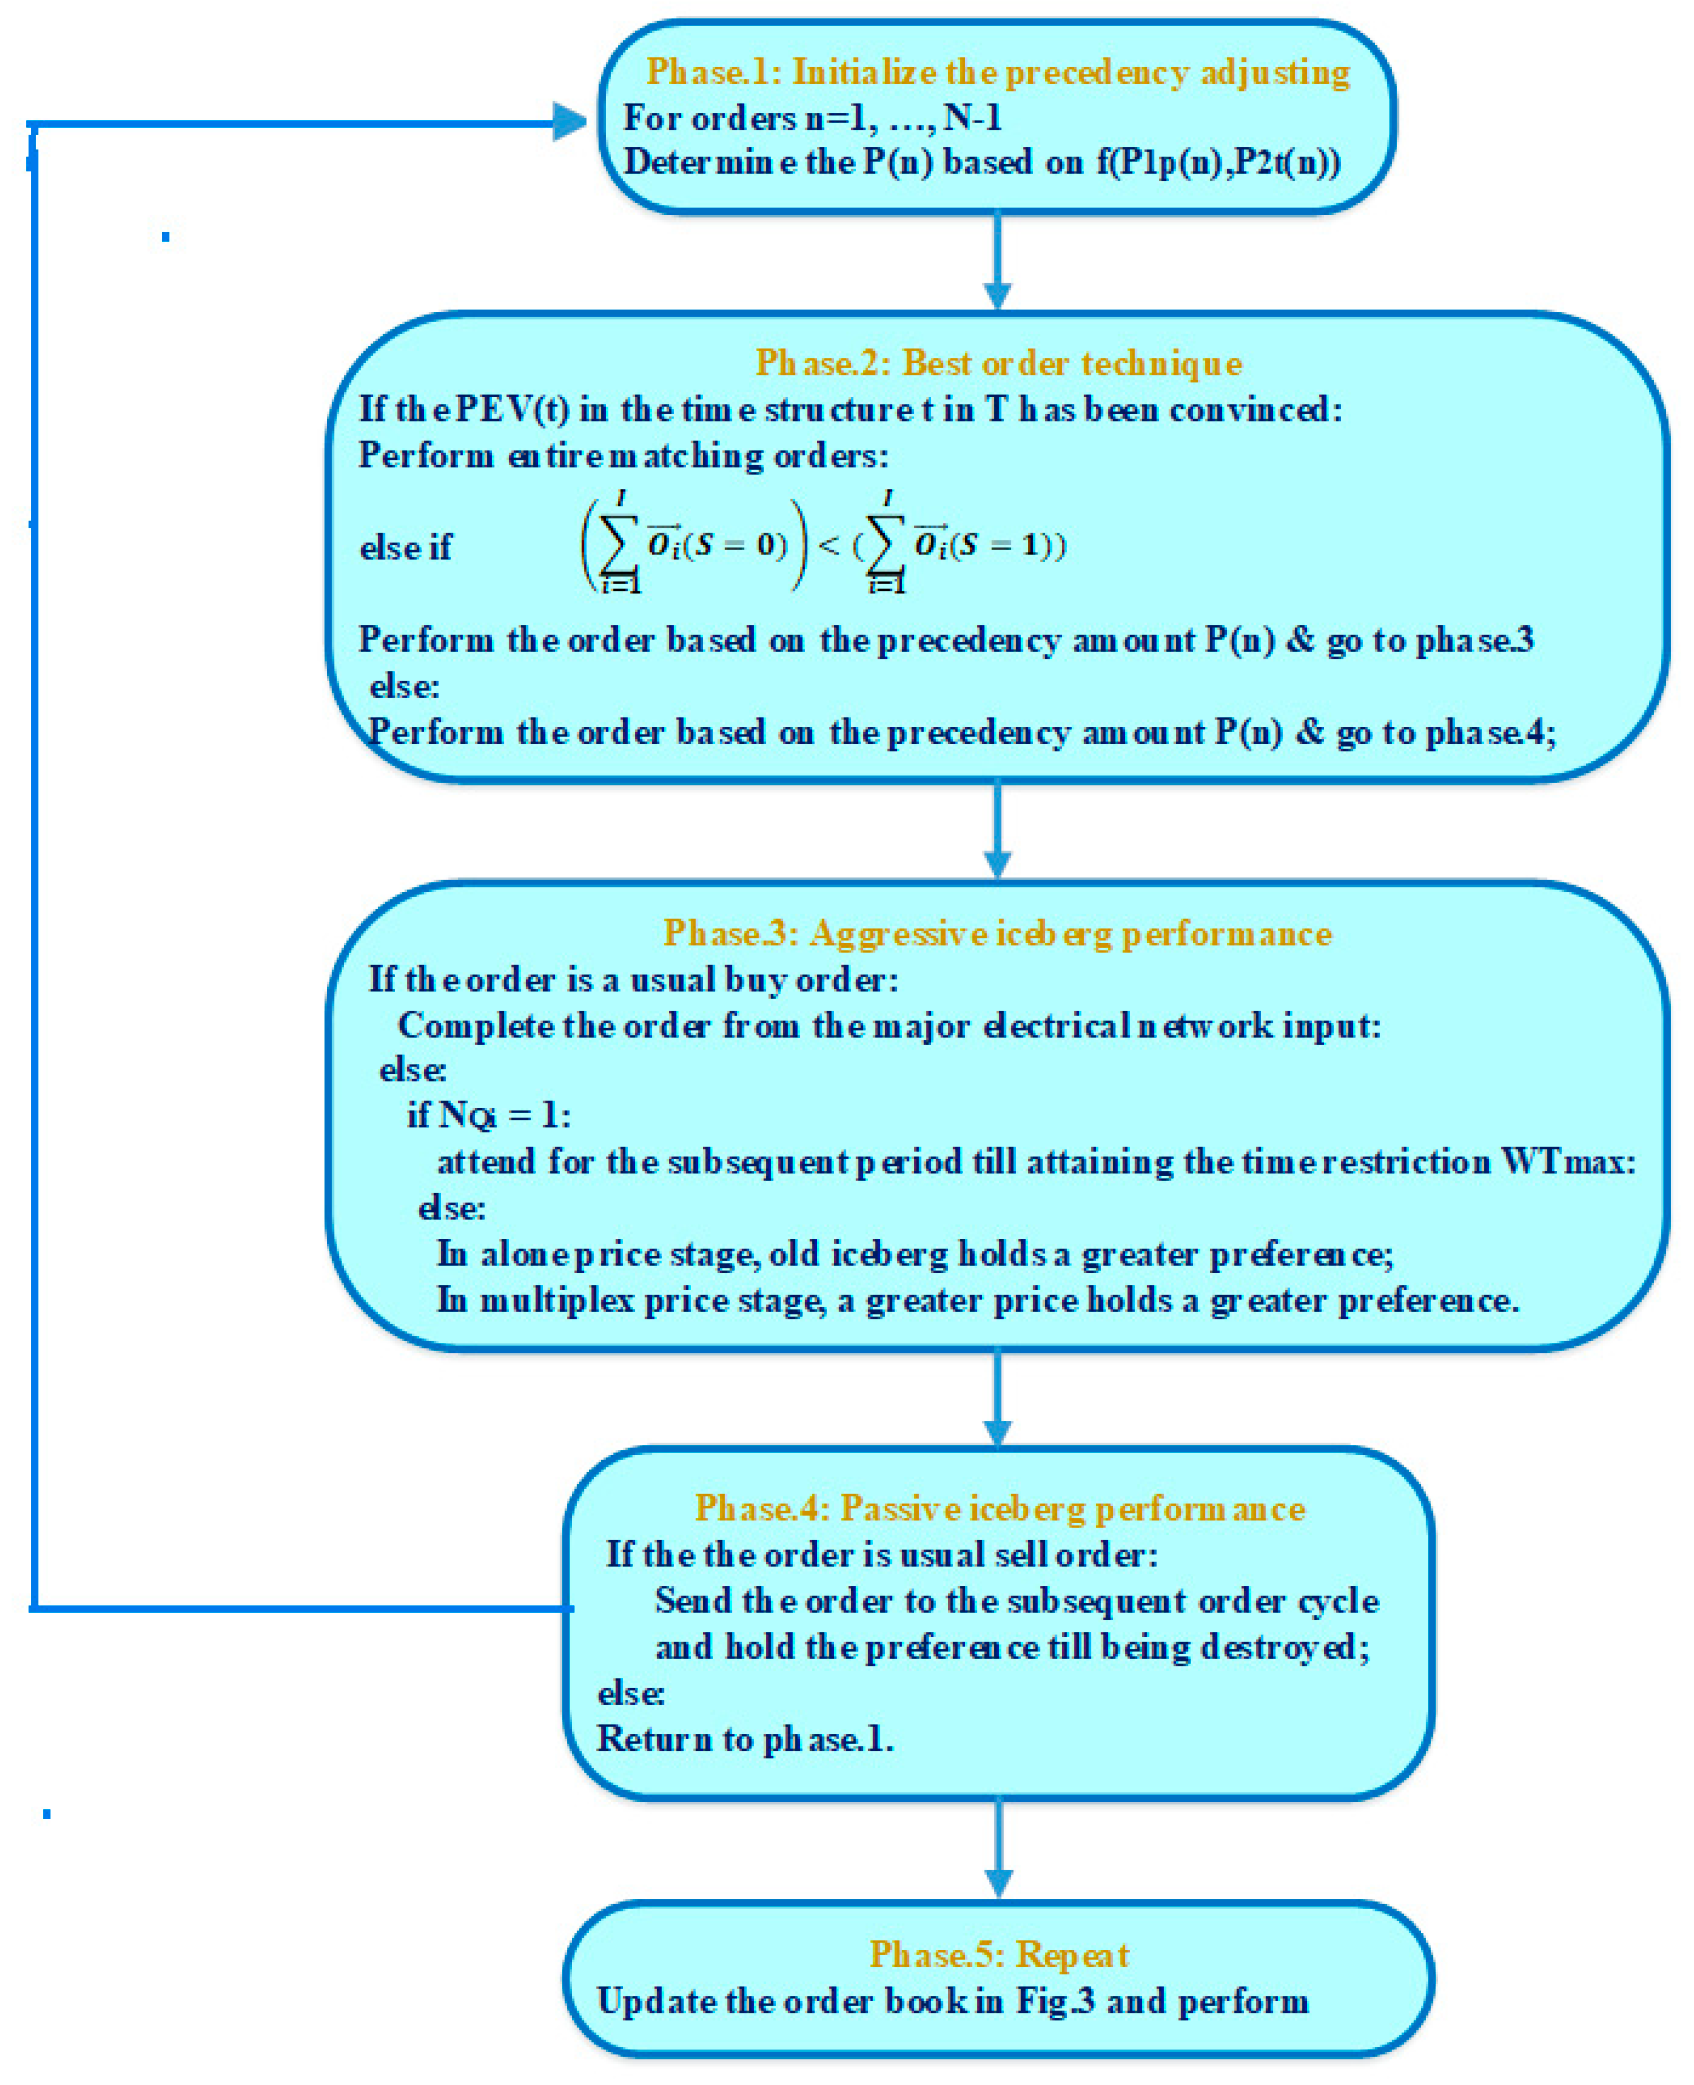
Figure 3, the algorithm first determines the normal and iceberg orders after initializing the demand for power discharging and charging. Following that, entire orders are sorted based on the ranking function
for matching them for exchange. Following the execution of entire orders in every trade frame period, provides a respective response for the orders.
Figure 4 illustrates the optimal order method for matching the power discharging and charging demand for three different scenarios. The algorithm can execute whole matching orders in the order of price ranking provided that the power demand is satisfied in a manner that minimizes power fluctuations. Those orders whose priority amounts are the highest are executed initially, even when the overall amount of power sell orders is lower compared to the overall amount of power buy orders. Afterward, the iceberg execution strategy has been applied to the unmatched electricity demand orders for matching the orders in the one-time frame
Iceberg orders that equal 1
are held until the next cycle with a similar priority value, or, they are allocated new priorities. When there are a larger number of sell orders, the iceberg execution is applied to passively wait for the next cycle execution. Order books are built and updated for every time frame
.
Because AdBEV can optimize charging patterns in day-ahead markets, when one day all the time slots have been allocated, the suggested scheduling layout can execute just once a day according to the prior EV arrival pattern and residential LPs.
4. Simulation Outcomes
A. Experiment setup
AdBEV is evaluated using the residential region substation transformer with a serving 100 households. Every household is assumed to own an EV. Taking into account the different kinds of EVs in the market, 2 kinds of the most common battery sizes of (Toyota Prius), and (Tesla model S) are selected. In terms of charging rates, various manufacturers have various connector kinds, with slow charging and fast charging compatible with and chargers, respectively. Based on the charging port availability, the number of EVs for fast and slow charging has been assigned at a ratio of 1:4 in the simulation procedure. There are 2 parts to the EV charge connection state, the first one is between 06:00 and 18:00, and the other one is between 18:30 and 05:30 (+1). EV batteries have an initial residual voltage created at random, while the battery level following charging has been assigned to 80% for battery protection, whereas the SOC following discharging has been assigned to 50% to make it easier to use.
The Ethereum platform is used for implementing the developed algorithm by taking into account the distributed trading platform for the power interchange market. Platforms such as Ethereum allow consumers running distributed applications on public BCs [
19]. The Solidity language with version 0.4.0 has been applied for deploying the suggested smart contract for executing the AdBEV layout. As a result, gas consumption from the Ethereum platform can provide a direct indication of the algorithm’s operational difficulty. Consumers of the public BC platform must pay
gas costs for executing smart contract commands in the Ethereum platform [
20]. The cost of executing a complicated algorithm vastly increases the trade cost for the power, as the number of peers in the grid increases.
The simulation consists of 2 kinds of orders: iceberg and normal orders based on Equations (5) and (16). Applying iceberg orders can decrease the power load fluctuations caused by large trading volume orders. For the simulation, the iceberg and normal orders have a ratio of about 1:1. Furthermore, the peak size of the trading quantity (Q) for every order has been set at 4 kW.
Table 1 shows the simulation of a partial order book. The system model determines data architecture (described in
Section 2). Orders on the buy-side have been ranked in ascending order based on the cost, while they are ranked in descending order on the sell-side that is comparable to a stock exchange market with price competition. Those iceberg orders are highlighted with bold figures in the quantity (Q) column. This exchange process with the order input is simulated for calculating the total cost fluctuation based on the real-time price.
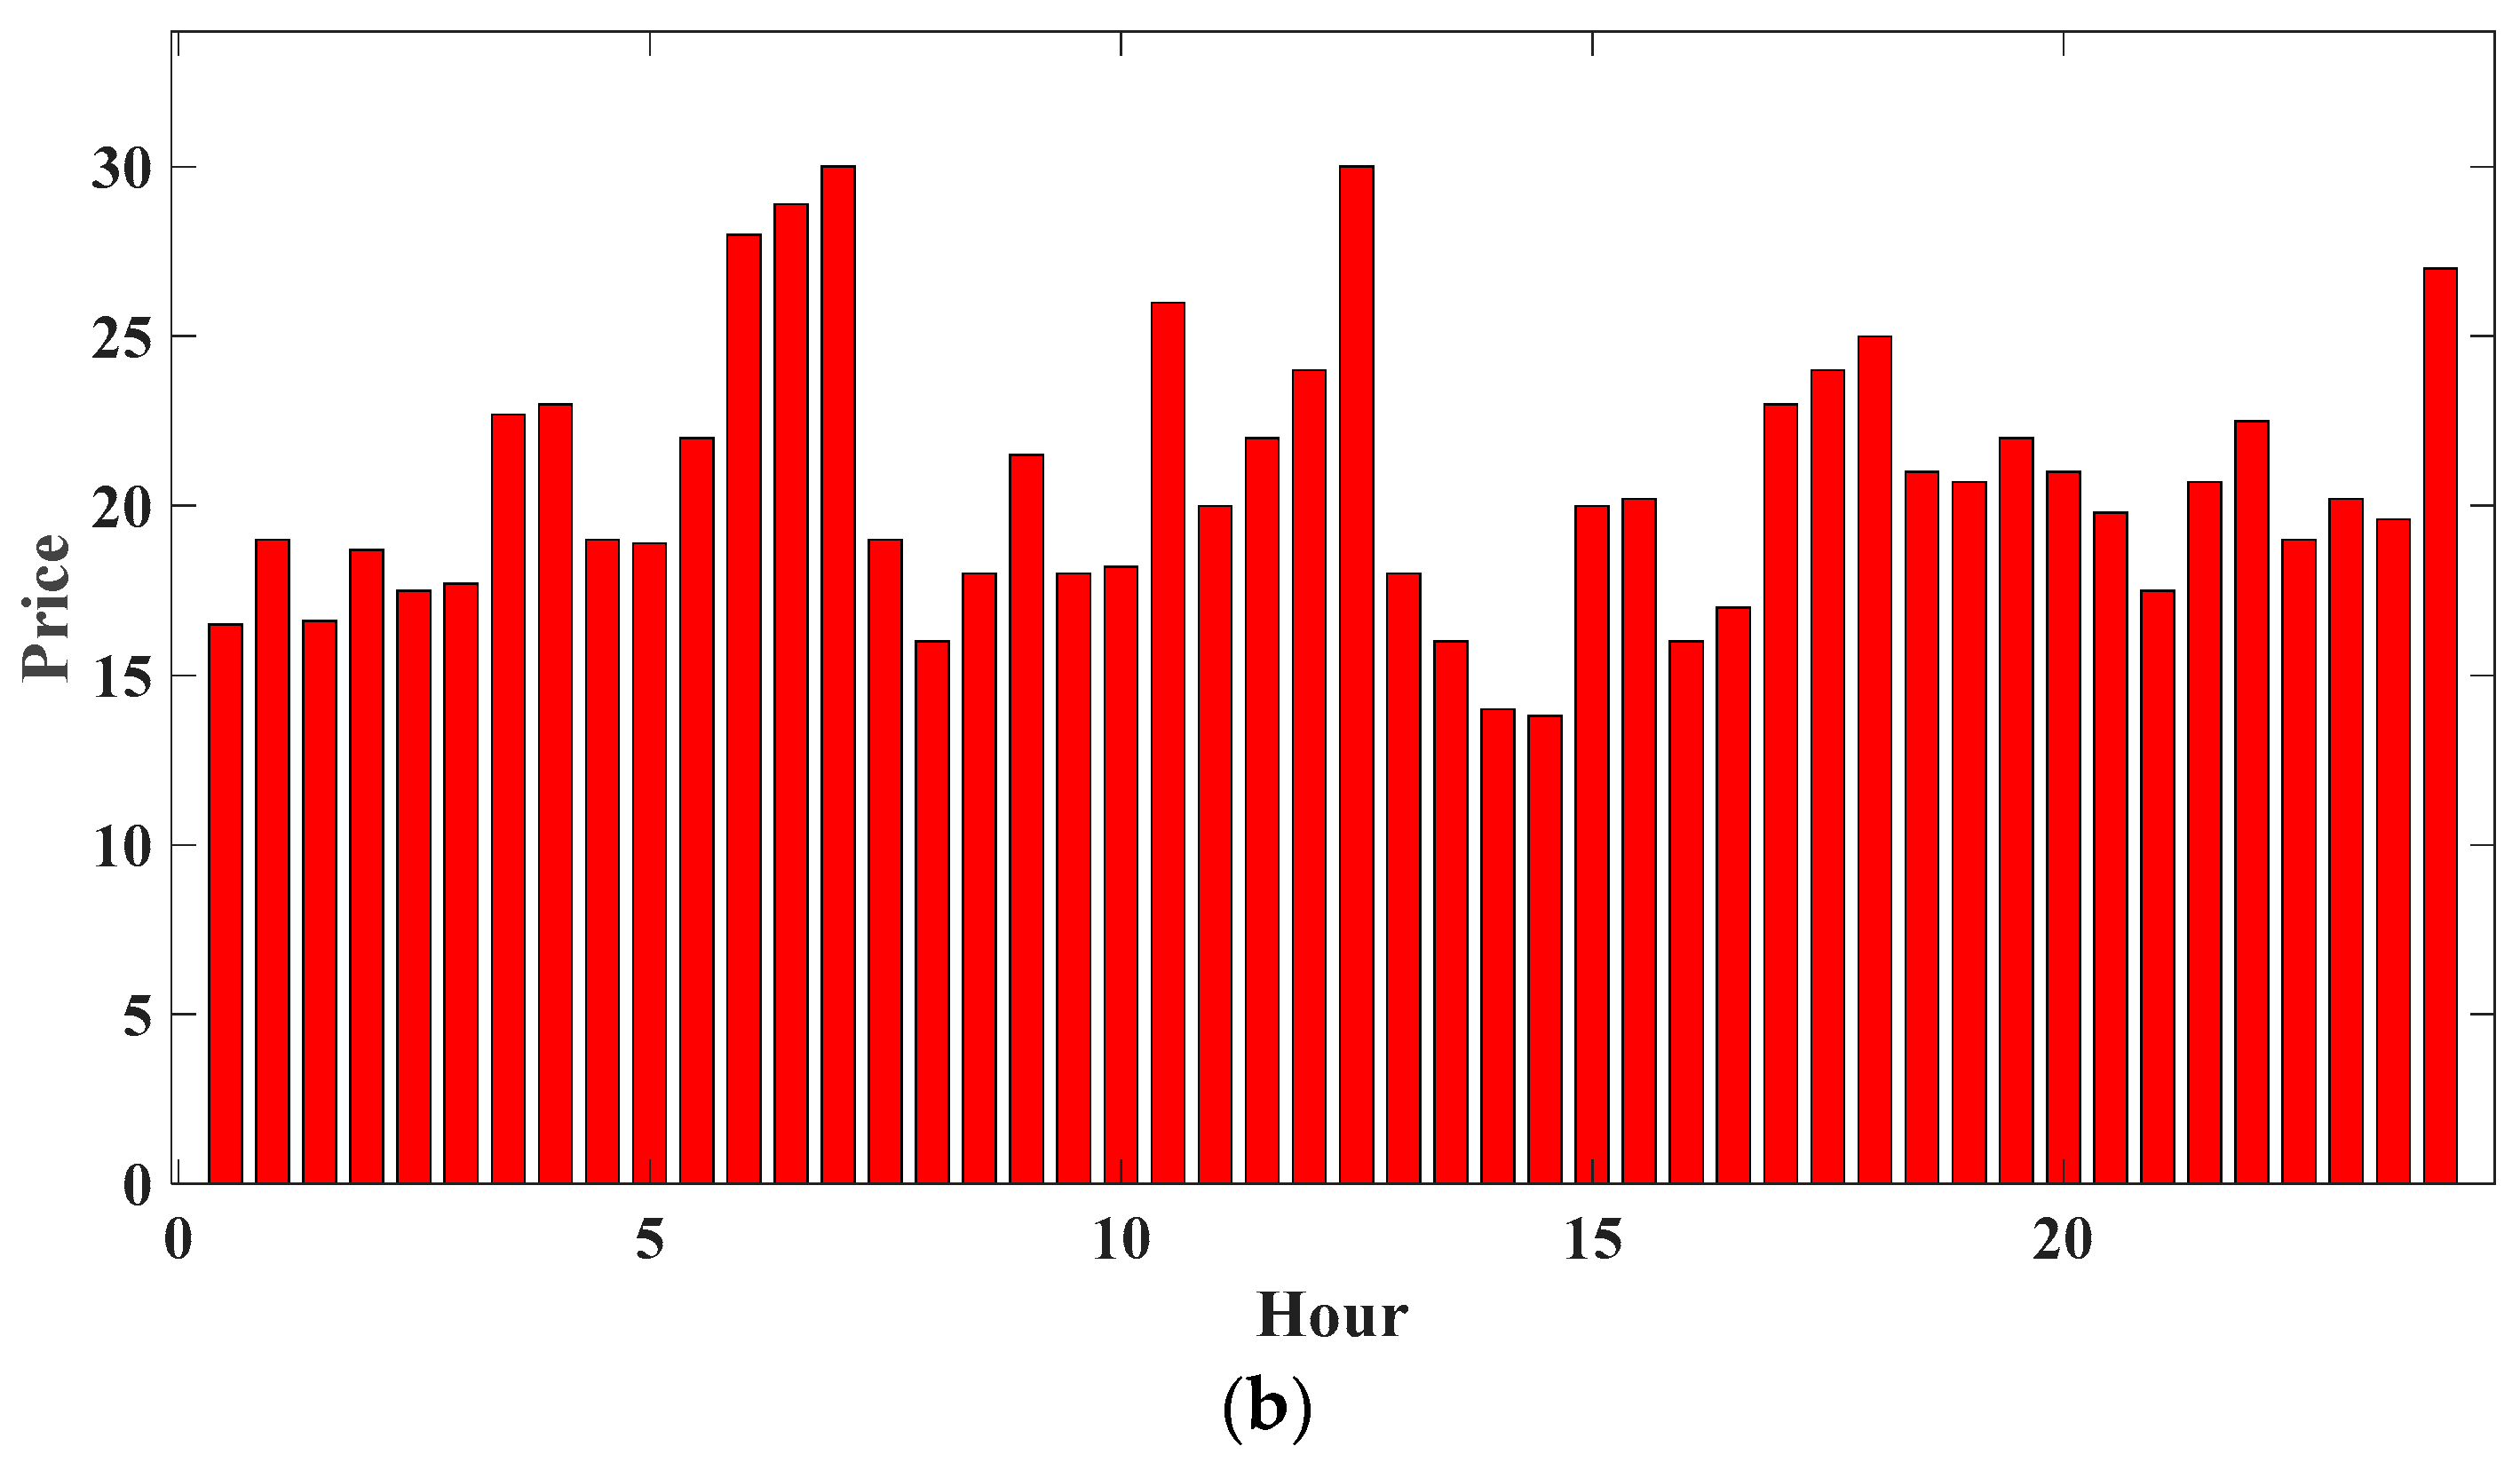
Prices of power exchange markets vary based on the iceberg order execution algorithm, in which the drift of the optimal bid cost is taken as constant. It is assumed that a simple scenario is used for keeping the setup tractable for exposition: the optimal bid cost shows a zero-drift
before iceberg orders are submitted. As a result, the original cost fluctuation interval has been assigned at
based on the local area and as a consequence, the order price
has been adjusted throughout particular times of the day for simulating the retail power costs as shown in
Figure 5. Every hour’s price has been determined from the average price of whole deal orders for every time interval from the order book.
B. Power alteration amount minimization
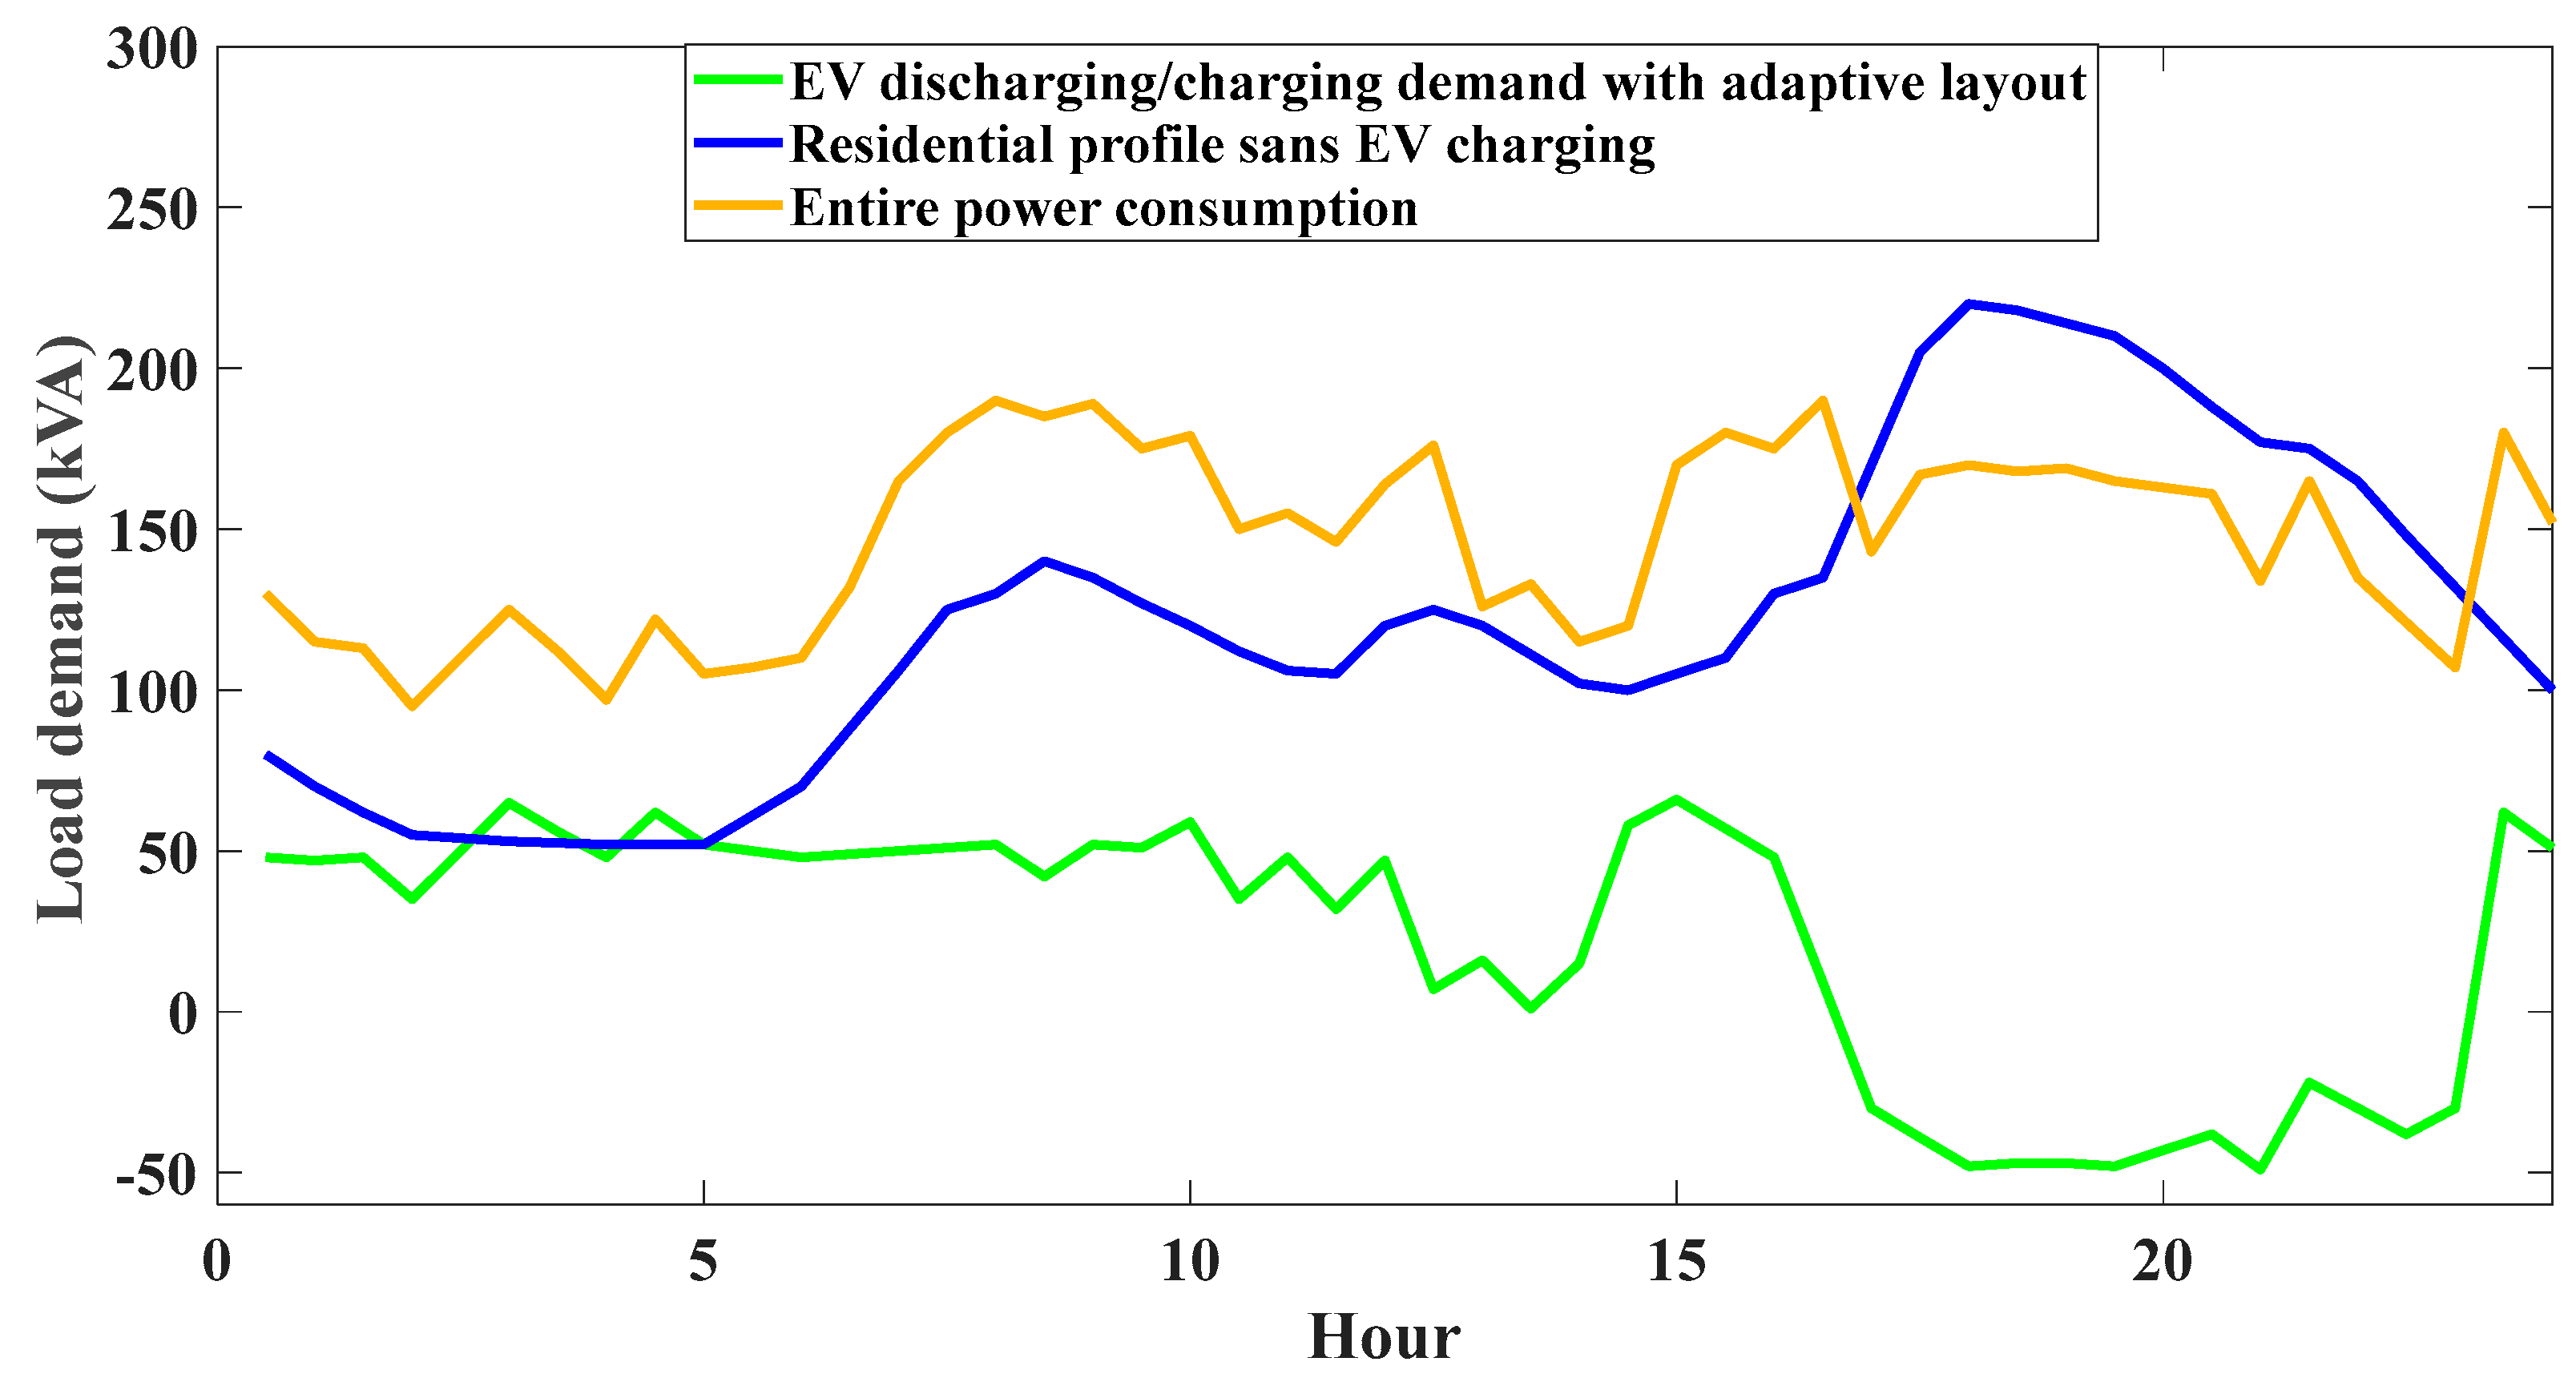
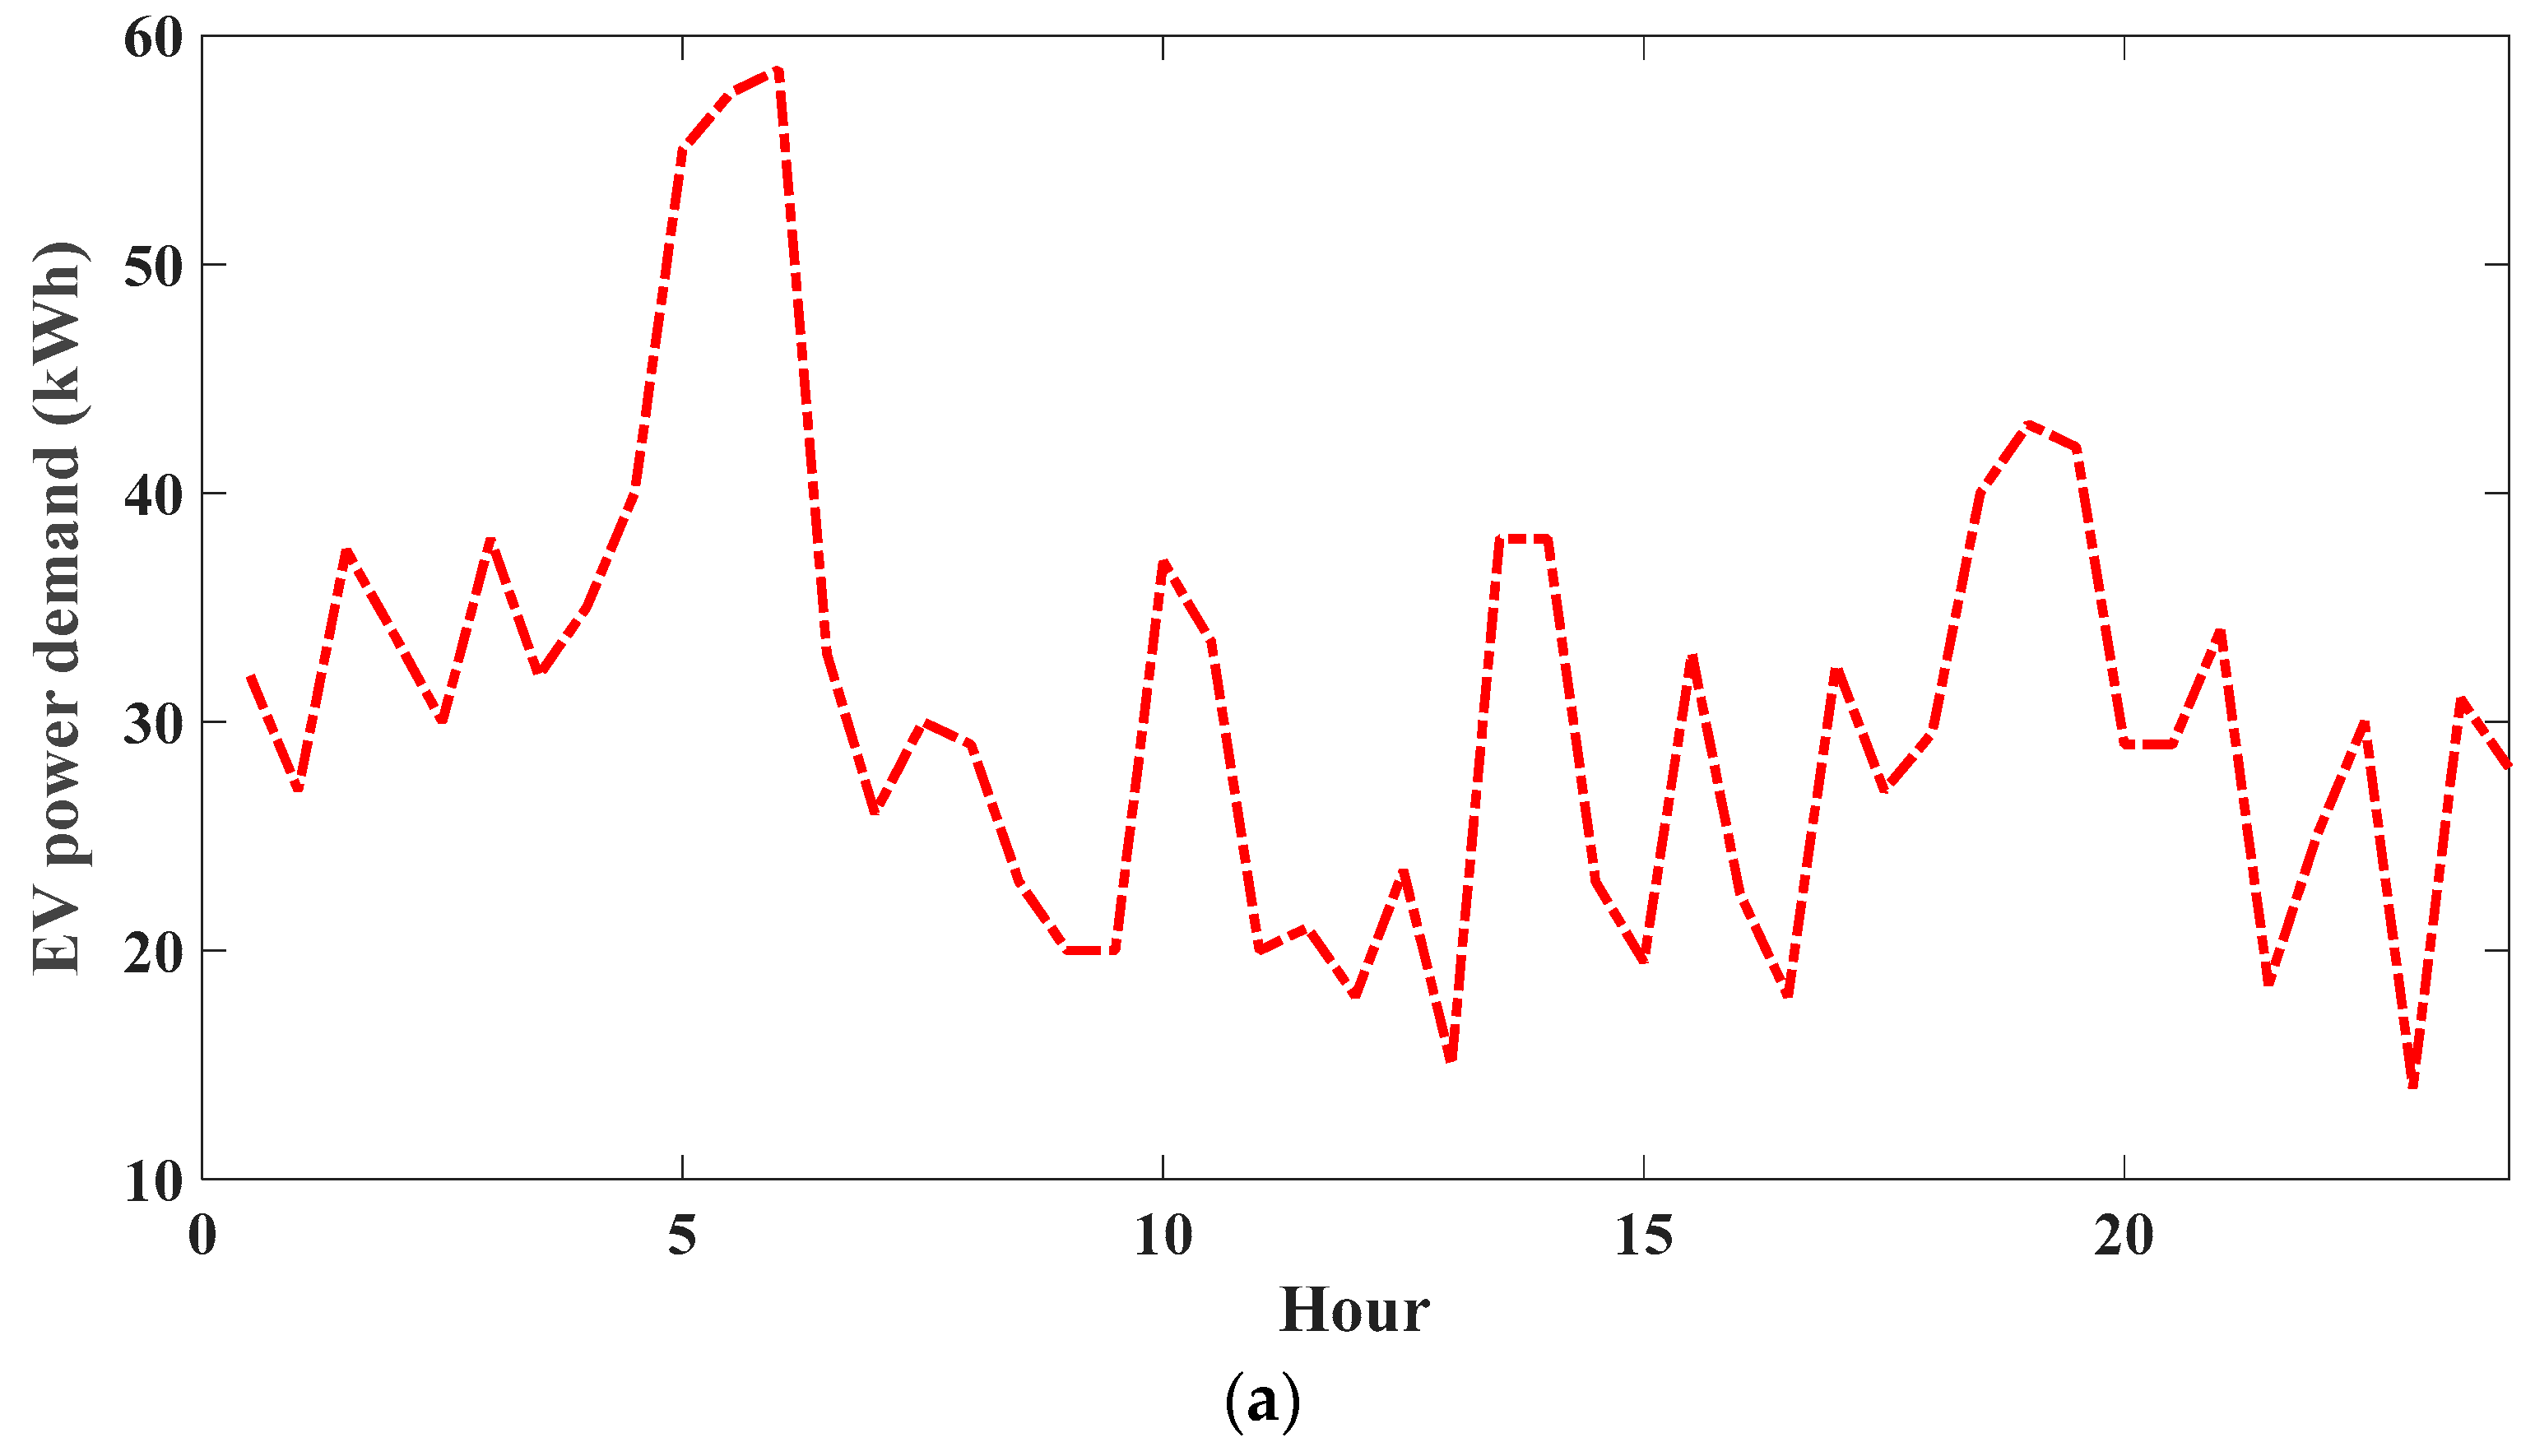
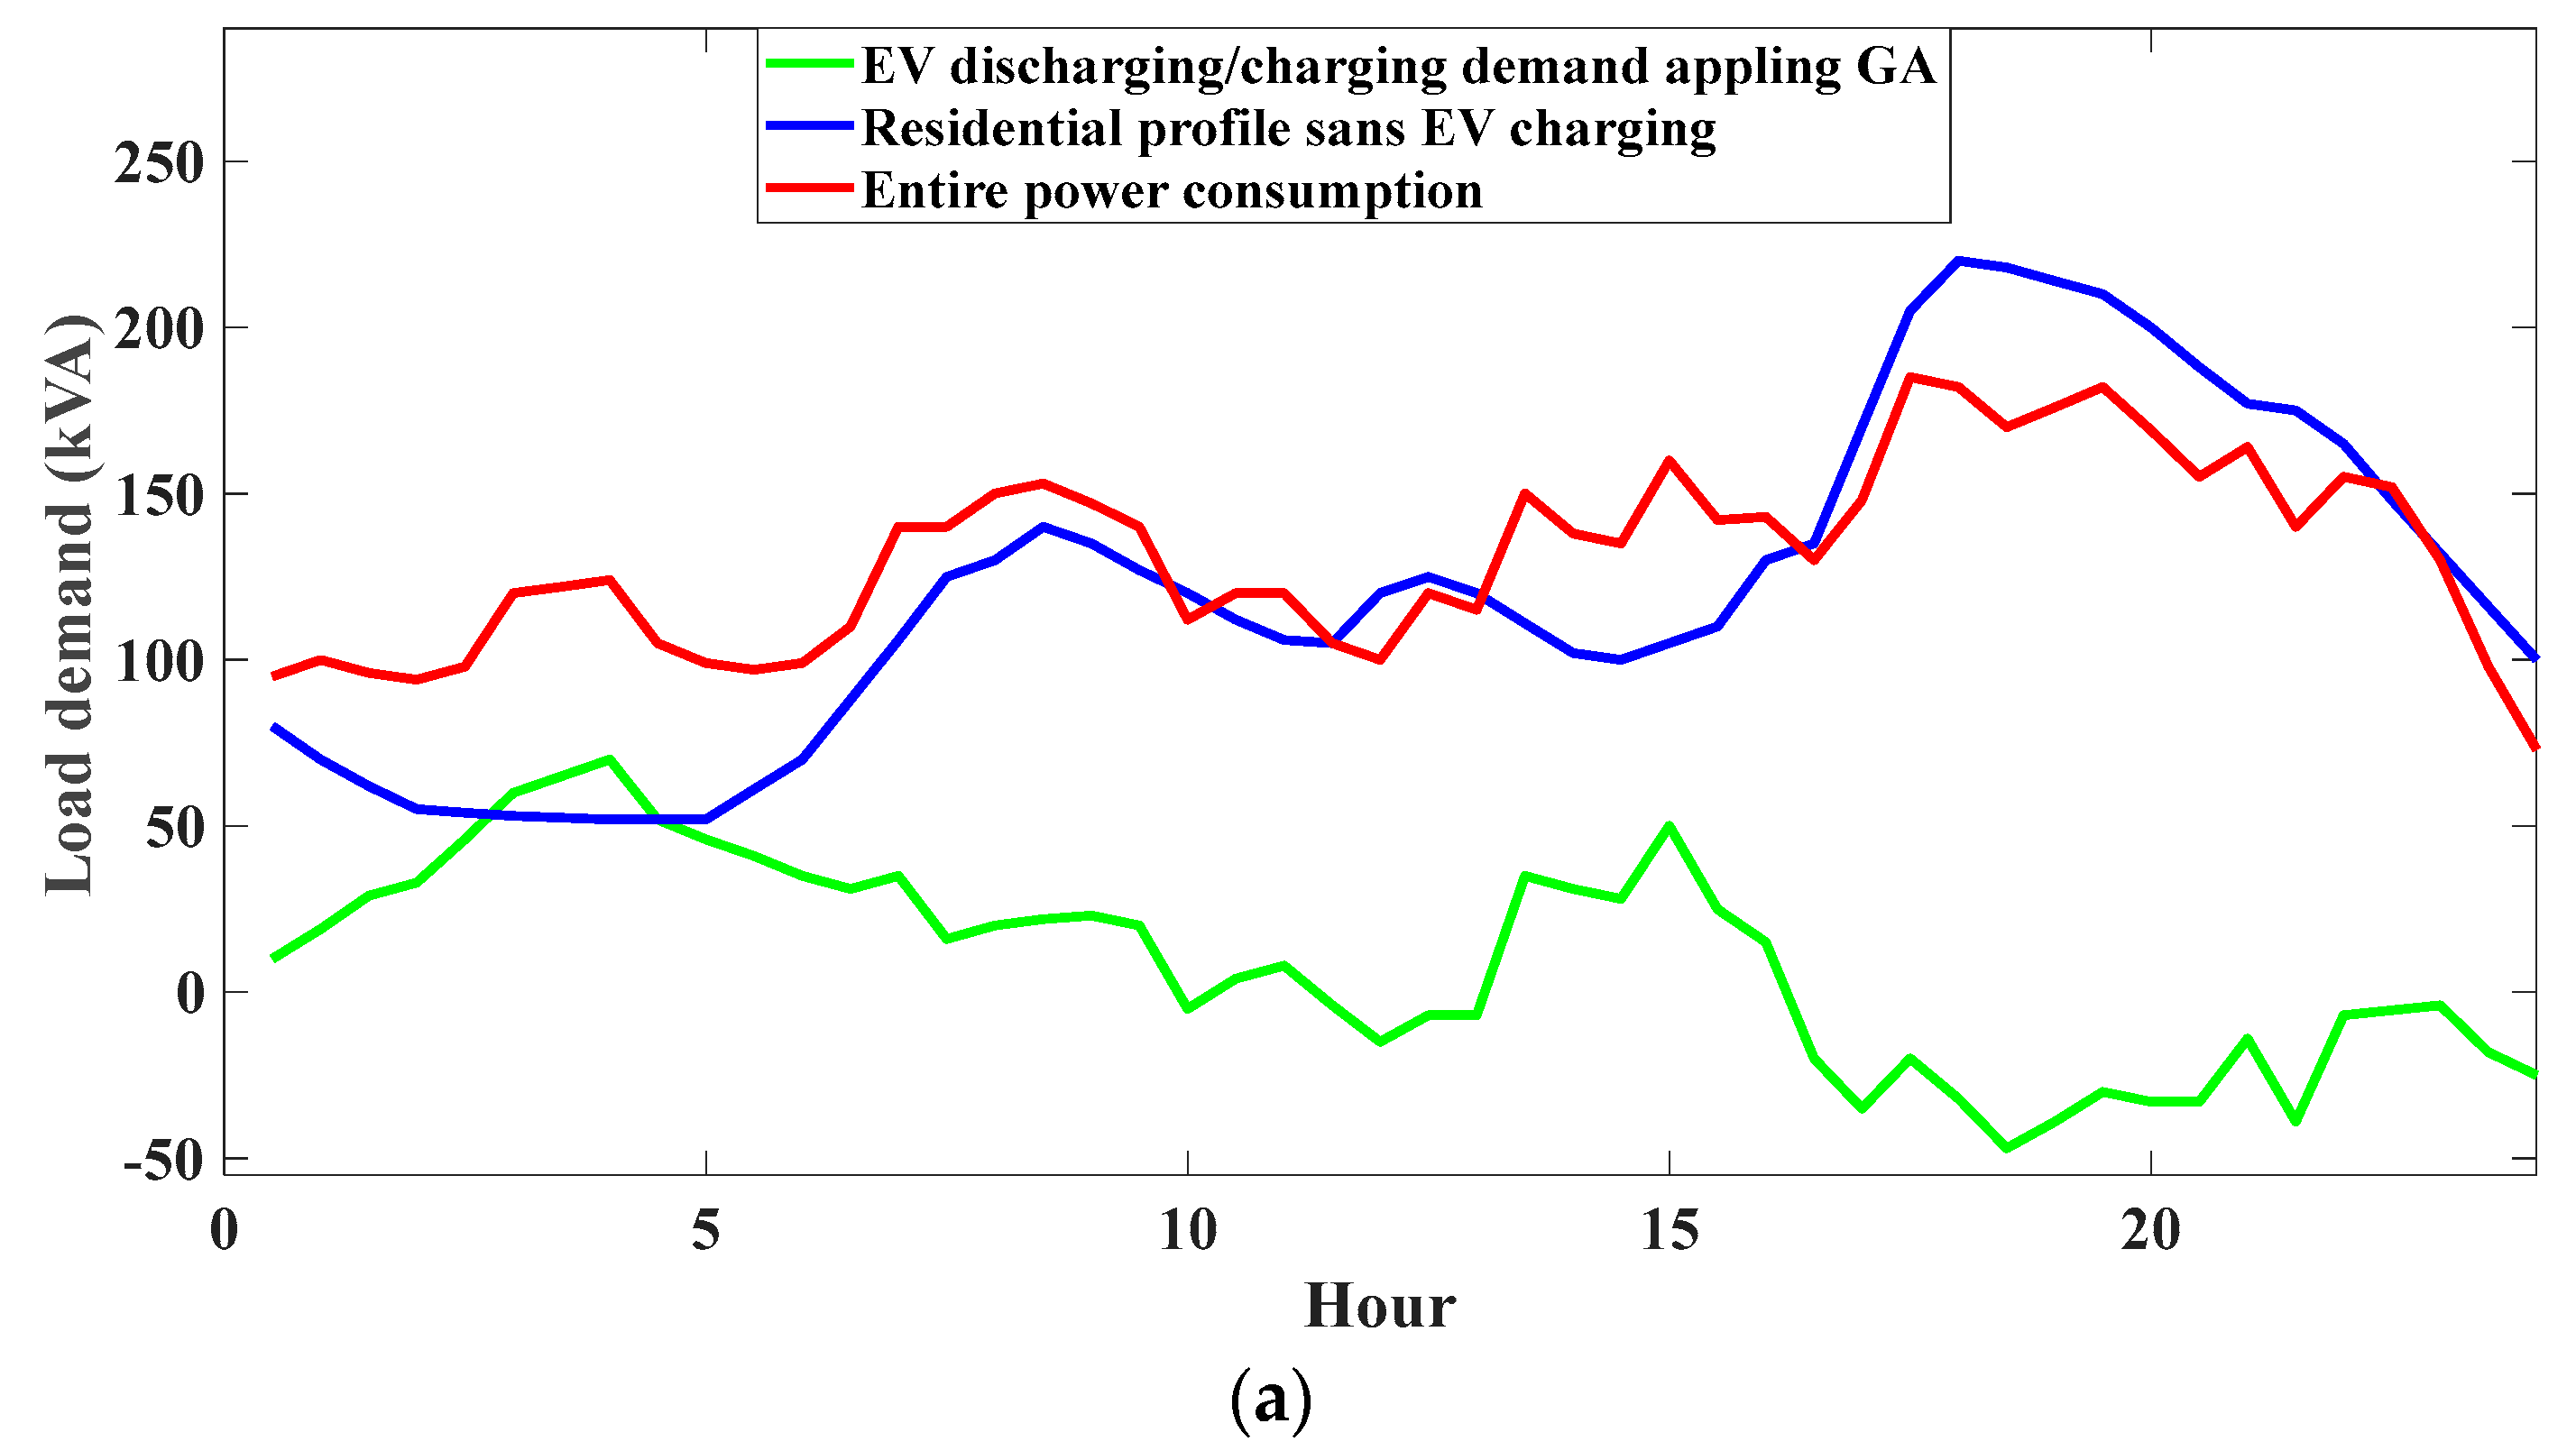
Figure 6 illustrates the impact of the algorithm on the power load alternation. Here is a comparison of the daily half-hourly resolution of LP in a residential area excluding each EV charging scheduling optimization (top panel) and with scheduling method utilizing GA (bottom panel). The daily profile of the domestic residential from the Elexon report is used in the simulation [
21]. Charging demand of EV and residential load is represented by the red dashed line v in every timeframe. Because of the high number of charging requirements during this period, the overall electricity consumption at 20:30 exceeds the power capacity, with
by Equations (7)–(9). As described in [
17], following the application of a planning algorithm, the load of charging has been moved to the off-peak time and the discharging characteristics have been taken into account.
The suggested AdBEV scheduling layout allows EVs for generating discharging and charging orders for the market based on their states of connection, battery capacities, and discharging/charging limitations. By using the proposed algorithm, the total power demand fluctuation level can be reduced, with the optimized outcome
with the algorithm being
, determined through Equations (7) to (9), which results in a reduction of 25.9 by comparison with the
applying the GA scheduling algorithm.
Figure 7 illustrates how the index P is better suited to flatten consumption loads by applying the optimized EV charging layout in ref [
17]. In addition, by increasing the number of EVs in the system, the
would rise linearly since the SOC is assumed to be normally distributed [
10]. The total utility function Equation (8) shows that the power fluctuation level
has been aggregated with the absolute difference of power consumption over two consecutive hours, in which the ability to minimize power fluctuation increases linearly as
increases.
C. Discussion and analyzing computation cost
The computational complexity should be noted because calculation complexity directly affects exchange performance and cost. A
gas computation can correspond to a low-level operation in the Ethereum Virtual Machine, in which every opcode can have its own
gas. The operators
add applies
gas, whereas multiplication 2 integers apply
gas. The total gas cost is 21,000
gas as a base despite not having interacted with the contract, and every
gas resulting from running a contract plus 21,000
gas is included in the overall
gas. As shown in
Figure 8, the theoretical computation cost for Ethereum based on the number of peers for every system is modeled [
22,
23,
24]. As it is inferred from
Figure 5, the power cost goes up from 6:00 to 8:00, 11:00 to 13:00, and 17:00 to 19:00 corresponding to the higher energy demand
for EV charging periods. In
Figure 6, it is seen that when the GA scheduling algorithm is used, the peak time power consumption is reduced with less energy fluctuation index at
. In comparison to the
PPFL index with no scheduling algorithm, there is a
reduction in the index, and the transformer load has been reduced. It is deduced from the results that as the number of EVs in the system increases, the
will linearly since the SOC is assumed to be normally distributed. Moreover, it is observed that the total utility function, as calculated and represented in Equation (8), shows that the power fluctuation level
has been aggregated with the absolute difference in power consumption over two consecutive hours. The simulation results show that the proposed technique not only helps the policymakers to reduce the price but also provides a dynamic and transparent environment that can mitigate possible fraud within the system. The appropriate performance and high quality of the proposed model are well proved in the results.


