Article

Effects of Technology Commercialization Proactiveness on Commercialization Success: The Case of ETRI in Korea

1
Electronics and Telecommunications Research Institute, 218 Gajeong-ro, Yuseong-gu, Daejeon 34129, Korea
2
Graduate School of Management of Technology, Sungkyunkwan University, 2066 Seobu-ro, Jangan-gu, Suwon 16419, Korea
*
Author to whom correspondence should be addressed.
Sustainability 2022, 14(12), 7056; https://doi.org/10.3390/su14127056
Submission received: 29 April 2022 / Revised: 7 June 2022 / Accepted: 8 June 2022 / Published: 9 June 2022

Abstract

:
Public technology transfer and technology commercialization are attracting worldwide attention, but the research on the commercialization of technology transferred from government-funded research institutes (GRIs) to small- and medium-sized enterprises (SMEs) is scarce. This study aims to identify and prioritize the factors contributing to the commercialization success of technologies transferred from GRIs to SMEs and to quantitatively present their importance. We proposed novel concepts of SMEs’ and GRIs’ technology commercialization proactiveness (SME TCP and GRI TCP) as two main success factors. We conducted hierarchical logistic regression analysis and decision tree analysis for 301 SME cases that adopted technology between 2013 and 2016 from Electronics and Telecommunications Research Institute (ETRI), a representative GRI in Korea. As a result, SME TCP was measured based on technology transfer expenditure (TTE), and frequency (TTF) was confirmed to be the most important factor. In particular, the success rate was higher when TTE exceeded 151 M KRW, or TTF was three or more. In addition, the success rate varied greatly depending on GRI TCP, namely the degree and the type of GRI researchers’ support. These findings can be used as primary data when establishing policies to promote cooperation between SMEs and other GRIs and provide practical implications for both technology providers and adopters.

1. Introduction

The coronavirus disease 2019 has accelerated the realization of digital transformation [1,2,3]. According to Satya Nadella, Microsoft CEO, “We’ve seen two years of digital transformation in 2 months” [4]. Technology is changing at a previously unimaginable rate. In the past, the latest technologies were considered the exclusive property of high-tech companies. However, nowadays, it transcends industrial boundaries and has become necessary for every company [2]. Thus, the continued development of core technologies is essential for the sustainability of companies [5].
Park and Glenn [6] have warned that companies failing to adopt accelerating technological changes might go out of business, leading to personal bankruptcy and even a national crisis. In Korea, small- and medium-sized enterprises (SMEs) account for 99.9% of all enterprises and 83.1% of total employment and are closely related to the national economy [7,8]. However, these enterprises find it challenging to develop core technologies independently [9,10]. Therefore, SMEs must find other ways to reinforce their technological capabilities within a short period of time and escape the crisis [11,12].
Public research institutes (PRIs) such as the National Institute of Standards and Technology in the U.S. and the Fraunhofer Society in Germany have played a pivotal role in national R&D activities [13,14]. Recently, technology commercialization of R&D results has been emphasized [15]. Countries around the world have considered public technology transfer as a means to improve the technological competence of companies and have established diverse policies to facilitate the transfer [16,17,18]. However, tangible results are insufficient in the commercialization of public technology despite such efforts [19,20]. Existing research tended to focus only on technology transfer from PRIs rather than technology commercialization [20,21]. However, since corporate performance is reflected in the national economy, much attention should be paid to increasing the commercialization success rate.
Prior studies have been conducted on the success factors of technology transfer and technology commercialization [22,23,24,25]. However, in many cases, the concepts of technology transfer and technology commercialization were often confused, and since the examined technology providers were not restricted to PRIs, there was a limitation in that their overall scope was considerably broad. Furthermore, government-funded research institutes (GRIs) and universities were often treated equally as PRIs despite the differences in roles, functions, and competencies of institutions [26]. Notably, research on the commercialization of technology transferred from GRIs to SMEs is limited [9].
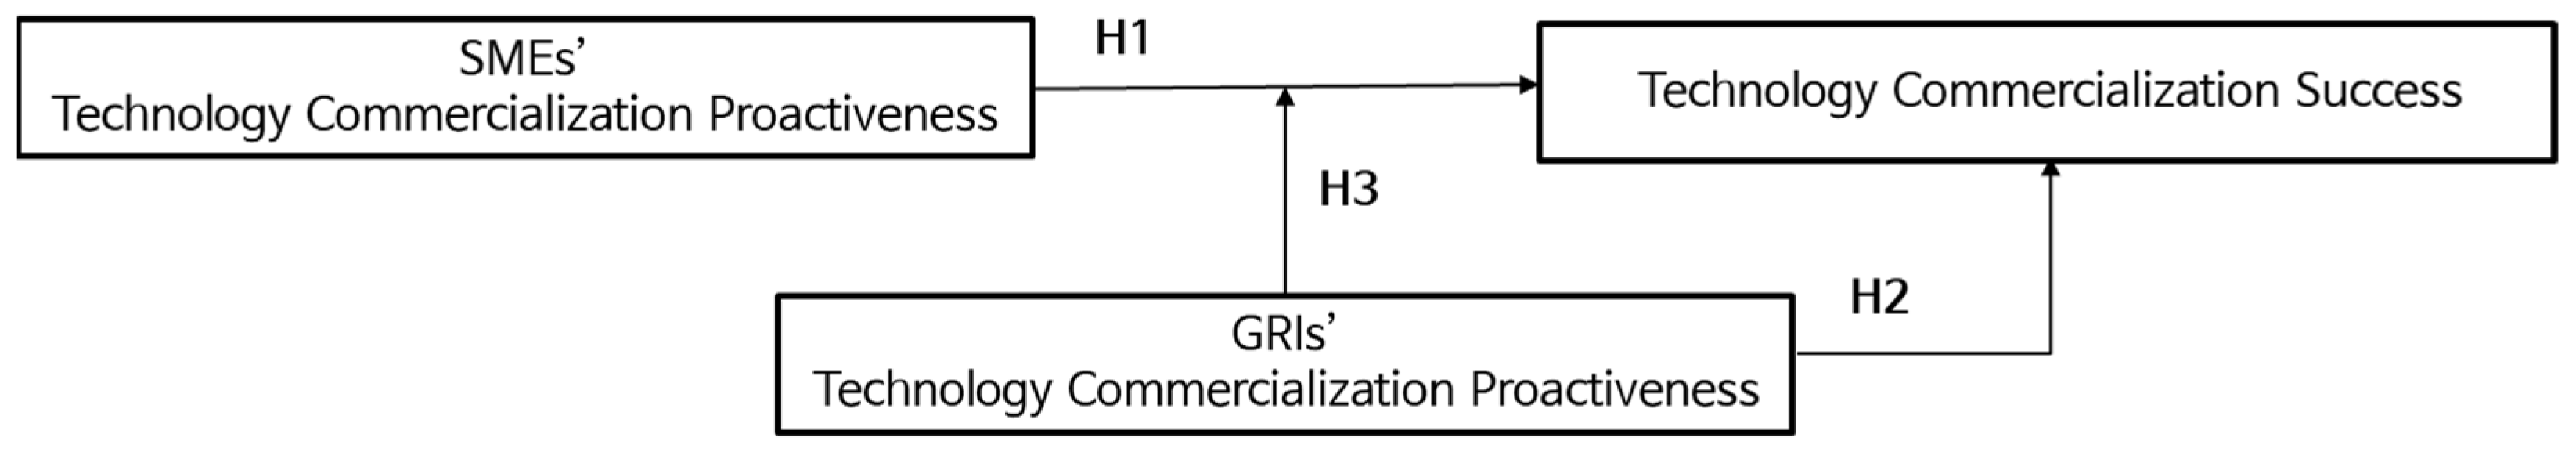
We aim to identify factors that contribute to the commercialization success of technologies transferred from GRIs to SMEs, set priorities, and quantitatively present their importance. We first focused on the two success factors mentioned most often in previous studies. These are companies’ willingness to commercialize technology [20,27,28,29,30] and cooperative partnerships between a technology provider and an adopter [19,21,22,31,32]. However, there is another problem in that although the importance of these two factors is recognized, it is difficult to objectively measure them. To solve this problem, we presented novel concepts of SMEs’ and GRIs’ technology commercialization proactiveness (TCP) (hereinafter called SME TCP and GRI TCP, respectively) and then defined their objective measurement indicators.
Hierarchical logistic regression analysis and decision tree analysis were performed on technology transfer cases between SMEs and Electronics and Telecommunications Research Institute (ETRI). ETRI is a leading Korean GRI in terms of the number of quality patents filed, the number of technologies transferred, and diverse support programs [19,33,34]. The commercialization status survey data on SMEs in 2019, ETRI’s internal data, and officially announced company information were used for analysis.
This paper is organized as follows. Section 1 explains the background and purpose of this study. Section 2 reviews previous studies on public technology transfer and commercialization and explains the concept of SME TCP and GRI TCP. Section 3 addresses the research model, data collection method, operational definition of variables, and research methods. Section 4 discusses the results of the empirical analysis. Finally, Section 5 presents conclusions and suggestions.

2. Theoretical Background and Research Hypotheses

2.1. Public Technology Transfer and Commercialization

In prior studies, the concepts of “technology transfer” and “technology commercialization” have been used interchangeably depending on the subject and research topic [21]. Furthermore, various technology providers such as domestic and foreign companies and other departments within a company were considered as well as PRIs; the scope of the studies was too broad to adequately represent the characteristics of public technology providers.
Hence, we limited the definition of technology transfer, according to the definition of Roh et al. [29], to “the transfer of intellectual property such as accumulated technology, knowledge, and know-how developed for the achievement of a specific purpose through contract and negotiation between the parties to the technology transfer”. We defined technology commercialization as “developing, producing, and selling products using technology, or improving related technology in the process” from the Technology Transfer and Commercialization Promotion Act [35]. The definition of PRIs as technology providers also differed slightly among studies. Following D. Park and K. Cho [26] and Lee and Lee [15], we categorized PRIs into GRIs and universities in this study.
In the early 1980s, the U.S. established the Bayh–Dole Act and the Stevenson–Wydler Act to strengthen the technology transfer of PRIs. Germany has also made strategic efforts to strengthen the competitiveness of SMEs through public technology transfer [13]. In Germany, GRI is operated by four large research groups. Among them, the Fraunhofer Society was established in 1949 to support the research needs of industries [36]. The Singaporean government also attaches great importance to the linkage between R&D and business. Therefore, Singapore universities have a strong link with industry to commercialize research results or contribute to society [14]. Meanwhile, Korea enacted the Technology Transfer Promotion Act in 2000. Currently, various policies are being implemented, such as the seventh Technology Transfer and Commercialization Promotion Plan and the fourth Basic Plan for Research Results Management and Utilization in Korea. Accordingly, the quantitative growth of technology transfer is increasing at a rate of 7% per year [37]. However, the success rate of public technology commercialization remains less than 15% [38]. Thus, qualitative growth is disappointing when compared to quantitative growth.
From an academic perspective, studies of technology transfer and commercialization began in the U.S. in the 1980s. They have also been actively conducted in Korea [28]. However, as earlier studies were mainly conducted from a technology supplier’s perspective, the research theme was focused on the technology transfer of developed R&D results [39,40,41,42,43]. The spread of R&D results is vital, but we need to focus more on technology commercialization success in order to create a sustainable economic performance for companies and the country [22,23,24].
Chung and Hyun [23], Bozeman et al. [24], Lee [25], and Hsu et al. [44] have identified success factors for technology transfer and commercialization based on analyses of several studies as summarized in Table 1a.
Min and Kim [28] and Min et al. [32] have investigated the impact of technologies transferred from PRIs on commercialization success. Consequently, the support of researchers after technology transfer and the company’s absorption capability can positively affect commercialization success. Kim [27] has emphasized that the studies on public technology commercialization should be conducted from a technology adopter’s perspective rather than from a provider’s perspective. Agrawal [31] has analyzed the impact of inventors’ participation on the economic performance of companies. The author has concluded that the strategy of engaging the inventor can favorably influence the success of entrepreneurial commercialization. Jung et al. [21] and Yun et al. [30] have analyzed commercialization success and/or failure factors in technology transfers from GRIs. They found that a company’s marketing capability, a developer’s cooperation, a CEO’s willingness, the market size, and technology originality were major success factors.
Meanwhile, some studies have limited technology suppliers to GRIs and technology adopters to SMEs. Lee and Cho [19] have empirically analyzed the effects of the researchers’ involvement after technology transfer on commercialization success. They found that researchers’ continuous technical support was associated with a success rate that was approximately five times higher than the cases without such subsequent support. Roh et al. [29] have examined the effects of technology transfer efforts and technological cooperation objectives of SMEs and venture companies on sales performance. They concluded that the degree of effort was important for improving business performance. Based on a case study, Lim et al. [20] found the following success factors: new technology transfer acquisition strategy, technology absorption capability, and willingness to commercialize. Bong [22] has examined the effects of a technology provider’s subsequent support on corporate performance through empirical survey data on public technology-based startups. They confirmed that linkage with the technology provider contributed to the success of technology commercialization and the company’s survival and growth.
Table 1b summarizes the success factors of public technology commercialization identified in previous studies. Many studies have found that the willingness to commercialize technology and a cooperative partnership are significant success factors. In this study, we hypothesized that companies’ willingness and technical involvement of technology suppliers after technology transfer could positively affect commercialization success.

2.2. GRIs and SMEs

As mentioned previously, existing studies were conducted without distinguishing between universities and GRIs as providers of public technology. However, the characteristics of these institutions have major differences in the attitude toward technology transfer, level of participation in technology development, and economic profitability. Thus, they must be analyzed separately [9,26].
And companies show significant differences in their ability to raise funds, absorb the technology and attract human resources. They also display different degrees of reliance on external technology, depending on their size. A survey report on public technology transfer in Korea [38] has shown that SMEs account for 90% of the total technology transfer contracts. Unlike SMEs, large corporations with a sufficient number of developers are increasing their own R&D performances, whereas SMEs show growing cooperation with GRIs. As SMEs form the backbone of the national economy, we must focus on the characteristics of SMEs.
Despite its importance, only a few studies on public technology commercialization, particularly from GRIs to SMEs, have been conducted so far. The main reason seems to be the difficulty of data acquisition due to the confidentiality of business information, according to Lee and Cho [19] and Min and Kim [28].

2.3. Technology Commercialization Proactiveness (TCP)

2.3.1. SME TCP

The actual effect of public technology commercialization depends on a company’s growth and profit. As a company is an entity that commercializes technology and produces the final result, its willingness to commercialize is inevitably essential. In early studies presented in Table 1, the willingness for technology commercialization is expressed in terms of support and/or willingness of the CEO, entrepreneurship, and technology transfer efforts. Other studies have emphasized the involvement of top management in the technology transfer process [45] and the active attitude of technology adopters [46]. Tidd [47] has also treated a CEO’s will to innovate as a primary success factor in a study addressing technological innovation and its achievements. Park [48] and Kang [49] have stated that a CEO’s willingness is a strong driving force for corporate innovation, especially in SMEs.
Previous studies have generally measured the concept of a company’s willingness to commercialize through responses to survey questions on Likert scales ranging from 1 to 5 [25,30,50]. However, these studies have a weakness in that their results have a large variance depending on respondents’ inclinations and circumstances, making standardization impossible. Accordingly, to ensure research objectivity, a new quantitative measurement tool is required.
Roh et al. [29] have attempted to measure the degree of a company’s efforts based on the number of technology transfer experiences. Bae and Chung [51] have examined the relationship between technical cooperation activities and corporate performance. They then measured the degree of technical cooperation efforts by formal and/or informal technological cooperation frequency. Under the assumption that a company that regards public technology as an important knowledge source would not consider the transfer of technology as a one-time event, technology transfer frequency (TTF) could be an objective measure of its willingness.
Kim [27] used licensing fees as an explanatory variable in a study to investigate the success factors of technology commercialization. Many studies have explored the relationship between corporate R&D activities and performances using R&D investment as the main explanatory variable [52,53,54,55]. However, only a few studies have used investment in technology transfer or technology transfer expenditure (TTE) as an explanatory variable. For SMEs with limited resources, the amount of TTE reflects a significant will. Thus, it can be the most direct measure.
The fact that previous studies have considered willingness or attitude as a success factor for technology commercialization is in agreement with Fishbein and Ajzen’s theory of reasoned action (TRA) [56]. Their theory posits that attitudes toward a behavior affect behavioral intention and ultimately lead to a certain behavior. However, provided that TRA could not fully predict behavior by behavioral intent, Ajzen [57] presented the theory of planned behavior, adding a third variable called perceived behavioral control, that is, assuming that appropriate circumstances must be provided for an action to be performed. Additional efforts to explain the relationship between attitude, intention, and action are ongoing, including Davis’s technology acceptance model [58]. An active intention or will can lead to action in most cases, but not in all cases. Therefore, terms such as technology commercialization intention or willingness are insufficient to express the TTF and TTE of a company that is actually showing a behavior. Thus, this study presents the concept of TCP, which focuses on action, and determines whether it affects a company’s success. This study posits the following hypotheses:
Hypothesis 1 (H1).
SME TCP has a positive effect on technology commercialization success.
Hypothesis 1a (H1a).
SME TTF has a positive effect on technology commercialization success.
Hypothesis 1b (H1b).
SME TTE has a positive effect on technology commercialization success.

2.3.2. GRI TCP

O’Regan and Kling [12] have claimed that outsourcing by small companies can lead to competitive advantage and promotes profitability. Link and Scott [18] have also found that a company’s use of public technology helps reduce costs and increases its return on investment. However, various risks of market failure exist in the process of adopting and commercializing public technologies [31,59]. In particular, for SMEs, a major problem is the asymmetry in technical skills with technology providers [60,61]. Hansen [62] has also pointed out that, without mutual ties, tacit knowledge is not transmitted sufficiently, leading to difficulties in technology transfer [63,64]. Thus, cooperative partnerships with technology providers are essential for overcoming various difficulties.
Normally, researchers’ support after technology transfer can help a company’s technology commercialization success [65]. However, almost no cases have demonstrated how a company’s success rate changes depending on the degree and type of support received by a company. Therefore, this study empirically analyzes how commercialization success rate varies according to the type and degree of support provided by ETRI to SMEs after technology transfer.
ETRI has been actively making various efforts, such as creating an organization dedicated to technology commercialization in 2000 to promote and extend the commercialization of R&D results. It also provides various support programs, such as researcher dispatch, consulting, and additional R&D support programs to ensure that SMEs can secure market competitiveness based on their technological prowess. We defined the support of GRI researchers as GRI TCP, and following Lee and Cho [19], we divided researchers’ support into full involvement and partial involvement for analysis. Accordingly, we posit the following hypotheses:
Hypothesis 2 (H2).
GRI TCP has a positive effect on technology commercialization success.
Hypothesis 2a (H2a).
GRI researchers’ full involvement has a positive effect on technology commercialization success.
Hypothesis 2b (H2b).
GRI researchers’ partial involvement has a positive effect on technology commercialization success.
However, as a company is an entity that drives commercialization results, researchers’ involvement is auxiliary. Thus, whether GRI TCP has a moderating role as well as the main effect should be verified. Accordingly, this study posits the following hypotheses:
Hypothesis 3 (H3).
GRI TCP reinforces the positive effect of SME TCP on technology commercialization success.
Hypothesis 3a (H3a).
GRI researchers’ full involvement reinforces the positive effect of SME TTF on technology commercialization success.
Hypothesis 3b (H3b).
GRI researchers’ partial involvement reinforces the positive effect of SME TTF on technology commercialization success.
Hypothesis 3c (H3c).
GRI researchers’ full involvement reinforces the positive effect of SME TTE on technology commercialization success.
Hypothesis 3d (H3d).
GRI researchers’ partial involvement reinforces the positive effect of SME TTE on technology commercialization success.

3. Research Methods

3.1. Research Model

In order to investigate the effects of SME TCP and GRI TCP on technology commercialization success, this study developed a research model, as shown in Figure 1. SME TCP, measured by TTF and TTE, was used as an independent variable. GRI TCP was measured by the number of support programs implemented in each company after the technology transfer. Additionally, we examined whether GRI TCP had a moderating effect on the relationship between SME TCP and technology commercialization success. We also identified and prioritized the success factors and quantitatively presented their importance.
In this process, six subdivided research models were presented, which were explained in detail in Section 4.

3.2. Operational Definitions of the Variables

3.2.1. SME TCP

Among the components of SME TCP, TTF refers to the total number of technology transfers, and TTE represents the sum of licensing fees of an SME over a certain period of time. As the policy and definition of technology transfer and royalties and licensing fees may differ by the technology supplier, we need to understand policies and characteristics of ETRI. The Korean government recommends that public technology be transferred to many companies. Therefore, non-exclusive contracts occur more frequently than exclusive contracts [38]. The cases analyzed in this study have no exclusive contract. Moreover, a certain percentage based on the government budget invested in developing technology is presented as a guideline for setting royalties and licensing fees. ETRI’s internal technology transfer deliberative committee determines the final value.

3.2.2. GRI TCP

GRI TCP was measured by the number of programs supported by researchers for each SME between 2014 and 2016. Types of support programs for ETRI were divided into four categories: short-term dispatch of research personnel (GRI_1), long-term dispatch of research personnel (GRI_2), consulting (GRI_3), and additional R&D for commercialization (GRI_4). GRI_1 is a program that dispatches researchers to companies for less than one month. It applies to an average of 170 companies per year. GRI_2 is a program that dispatches researchers for more than four months. In particular, ETRI has three similar GRI_2s. Approximately 70 companies are supported annually. GRI_3 is a form of assistance that occasionally provides technical advice for one year. The average annual number of beneficiaries of the GRI_3 program was 170 during the provided period. GRI_4 provides both research manpower and funding for one year to perform additional R&D to meet the needs of the enterprises. However, due to budgetary constraints, this program was provided to only 30 companies between 2014 and 2016.
This study classifies these support programs into GRI researchers’ full involvement program (GRI_Full) and partial involvement program (GRI_Partial). GRI_Full is defined as the sum of GRI_1, GRI_2, and GRI_4, whereas GRI_Partial is defined as GRI_3.

3.2.3. Control Variables

Based on a review of previous studies, several control variables were added. The first control variable was the joint research experience. There have been conflicting arguments for this variable. Park et al. [66] and Choi and Lee [67] claimed that joint research experience increased the implementation of technology commercialization. However, Saavedra and Bozeman [68] and Park et al. [69] concluded that the development of research institutions and companies should be separate. This study assigned a value of 1 if an SME had joint research experience prior to technology transfer and a value of 0 otherwise.
The second control variable was whether a company was an innovative one (hereinafter called venture business and Innobiz company). “Venture business”, which is used in various ways as a policy target depending on the country, has no clear definition. In Korea, a company that is recognized as needing support by the government due to relatively high technological and growth potential is regarded as venture business. Conversely, “Innobiz company” refers to a company that can secure technological competitiveness or has future growth potential through innovation activities. An innovative company is assigned a value of 1, while a non-innovative company is assigned a value of 0.
Regarding the company size, it has been argued that larger companies are associated with more active innovation. However, the opposite argument has also been made [70,71,72]. This study used the number of employees and R&D personnel as of 2019 for the analysis. Additionally, to control for the effect of company age, the period of company operation from establishment to 2019 was added as a control variable.

3.2.4. Technology Commercialization Success

In the survey, the commercialization status of the transferred technology was scored based on four categories: “success”, “progress”, “on-hold”, and “abandonment”. Success refers to achievements such as product production, narrowing the technology gap with competitors, and shortening of the development period after technology transfer. Progress indicates that efforts are being made for commercialization. On-hold implies the existence of a commercialization plan without investing in human or material resources. Finally, abandonment indicates the absence of a commercialization plan for the transferred technology. However, considering that a sufficient time of 3–6 years had passed after technology transfer in 2013–2016, responses of progress and on-hold were also classified as failure.
Table 2 sums up the variables and their operational definitions in this study.

3.3. Analysis Techniques

Data mining is the process of extracting valuable information from the stored data on large scale [77]. This study utilized a classification most commonly used in data mining. It is used to predict which group the input data belong to when the target variable is nominal. There are several classification techniques, including logistic regression analysis (LRA) and decision tree analysis (DTA). Previous studies that analyzed success factors of technology commercialization most commonly used LRA [19,22,28,30,31] and rarely used DTA [21].
A combination of analytical methods is frequently used to exploit strengths and differences of various methodologies. For example, among classification techniques, LRA and DTA are often used together. Kim [78] has tried to make more accurate predictions using both analysis methods. Kweon [79] has compared the accuracy and sensitivity of these two methods and presented a more helpful approach. Aksu and Keceoglu [80] have argued that using multiple methods could yield more potent results.
LRA is a parametric method that involves an assumption about population distribution when making an inference about a parameter. Typically, the result is interpreted using odds ratio (OR), which indicates the ratio between the probability that an event will occur and that an event will not occur. Additionally, applying the hierarchical logistic regression analysis (HLRA) presented by Baron and Kenny [81], the main effects of independent and moderator variables on a dependent variable and the moderating impact due to the interaction can be examined.
Unlike LRA, DTA is a non-parametric method that does not assume population distribution. It is used to examine whether a particular situation will occur. It is also used to visualize the degree of influence and interrelationship of attributes that affect the outcome. Variables are arranged in a hierarchical tree structure in the order of the most significant influence. Furthermore, DTA does not require statistical assumptions. Thus, it is a valuable tool for effectively analyzing interactive relationships among various causes.
By taking advantage of both analysis methods, we attempted to obtain abundant academic and practical results. Data were interpreted using SPSS 28.0. First, characteristics of subject companies were analyzed using descriptive statistical and frequency analyses. Second, correlation and multicollinearity analyses were performed. Third, statistically significant variables were identified by examining the relationship between SME TCP, GRI TCP, and a company’s technology commercialization success through HLRA, and hypotheses were tested. Fourth, success factors considering interrelationships among the factors were identified through DTA. A chi-squared automatic interaction detection algorithm was used for DTA.

3.4. Data Collection

In this study, we utilized the data from a commercialization status survey conducted in 2019. The subject of analysis was limited to contracts concluded between ETRI and SMEs in 2013–2016. This was because these companies were eligible for support during that period when ETRI’s support program was the strongest (2014–2016). Among a total of 695 companies that adopted technology between 2013 and 2016, 643 were SMEs. Among these SMEs, 371 questionnaires were retrieved (response rate of 57.7%). If a company’s information was unknown, it was excluded from the analysis. Finally, a total of 301 SMEs was analyzed.
SUCCESS, CoRND, INNO, N_E, N_R, and AGE were obtained from the results of the survey. We obtained additional information on INNO, N_E, N_R, and AGE from NICE Information Service [82], Cretop [83], and each company’s official website, and TTF, TTE, GRI_Full, and GRI_Partial were obtained from ETRI’s internal data.

4. Results

4.1. Descriptive Statistics

Table 3 lists the characteristics of the 301 companies. As TTF and TTE increased, the proportion of companies that succeeded in technology commercialization increased significantly. As N_E and N_R increased, the success rate increased slightly. Companies having joint research experience with innovative companies generally had a higher success rate. The relationship between age and commercialization success was unclear. In addition, regardless of the type of support provided by GRI researchers, the greater the amount of support, the higher the success rate of the company. However, the number of SMEs that received support from researchers was not quite high. In particular, only 15 and 20 companies benefited from GRI_2 and GRI_4, respectively.
Table 4 shows descriptive statistics of variables. To satisfy normal distribution criteria of |skewness| < 3 and |kurtosis| < 8 [84], natural logarithm of N_E, N_R, TTF, and TTE was obtained.
Table 5 presents the results of the correlation analysis of variables. In order to avoid multicollinearity, which could occur in hierarchical regression analysis, the analysis was conducted after the mean centering of continuous variables. Provided that a strong correlation (r = 0.842) between N_E and N_R, N_E was excluded from subsequent analysis. In addition, multicollinearity was not an issue because the variance inflation factor (VIF) was less than 10 [85].

4.2. Results of the Hierarchical Logistic Regression Analysis

HLRA was conducted to verify the effects of SME TCP and GRI TCP on technology commercialization success. In the first stage, independent variables TTF and TTE were input together with control variables. In the second stage, control variables GRI_Full and GRI_Partial were additionally input. Finally, in the third stage, independent, moderator, and interaction variables were input together.
Table 6 summarizes HLRA results. The logistic regression model was statistically significant in the first stage (Hosmer and Lemeshow: χ2 = 9.224, p = 0.324), second stage (Hosmer and Lemeshow: χ2 = 3.715, p = 0.882), and third stage (Hosmer and Lemeshow: χ2 = 2.067, p = 0.919). Meanwhile, the explanatory power of the regression model was 28.2% (Negelkerke R2 = 0.282) in the first stage, 34.2% (Negelkerke R2 = 0.342) in the second stage, and 42.9% (Negelkerke R2 = 0.429) in the third stage. As variables were input by stage, the value of −2LL gradually decreased to 262.159, 247.067, and 224.099, while Negelkerke R2 increased. Overall, the goodness of fit of the model was satisfactory.
After verifying the significance of regression coefficients, Ln(TTF) (OR = 2.346, p < 0.01) and Ln(TTE) (OR = 2.486, p < 0.01) were positively significant in Model 1. That is, if Ln(TTF) increased by one unit, the success rate also increased by approximately 2.346 times. Similarly, if Ln(TTE) increased by 1, the success rate also increased by 2.486 times. In Model 2, Ln(TTF) (OR = 1.716, p < 0.1), Ln(TTE) (OR = 2.241, p < 0.01), GRI_Full (OR = 1.747, p < 0.05), and GRI_Partial (OR = 1.383, p < 0.1) were all positively significant. When GRI researchers increased their full involvement by once more, the success rate of technology commercialization increased by 1.747 times. Similarly, when GRI researchers made one more partial involvement, the success rate increased by 1.383 times. Thus, the effects of SME TCP and GRI TCP on technology commercialization success were positive, supporting Hypotheses 1 and 2.
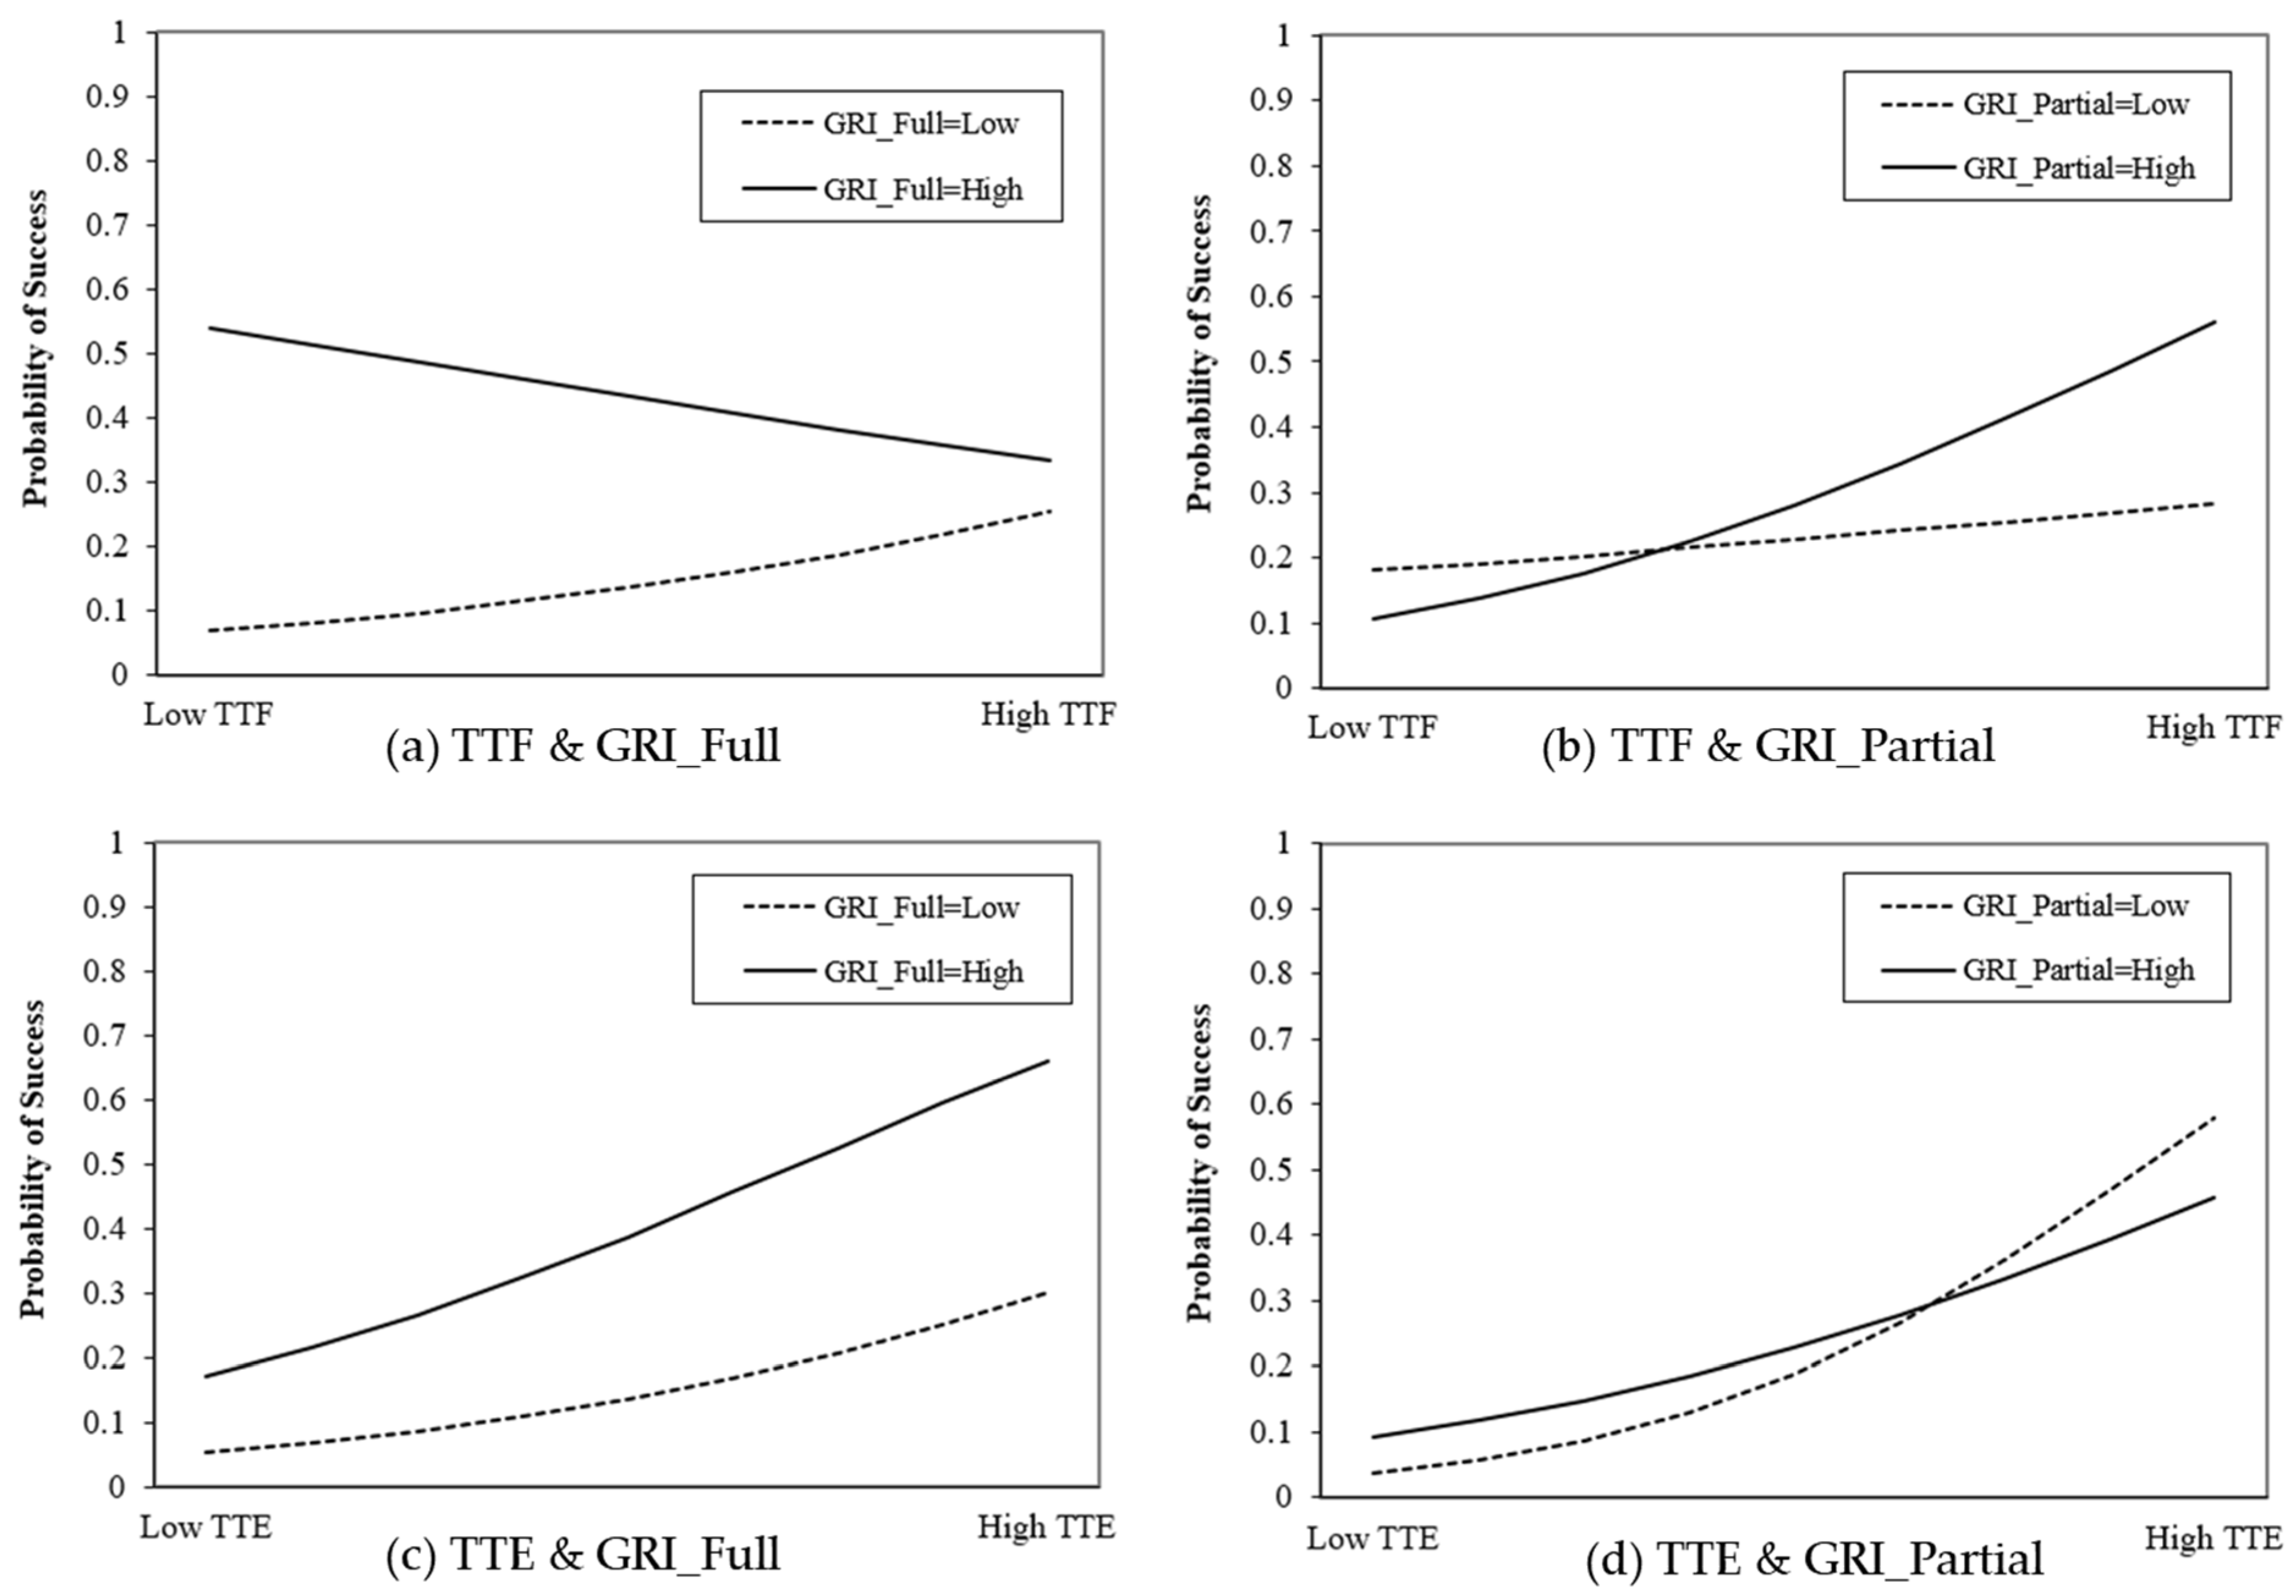
However, in Model 3, Ln(TTF), Ln(TTE), GRI_Full, and GRI_Partial were found to have a positive relationship with commercialization success, whereas the interaction term had both positive and negative effects concurrently. Basically, interaction effects between Ln(TTF) and GRI_Partial (OR = 5.539, p < 0.01) and between Ln(TTE) and GRI_Full (OR = 1.095, p < 0.1) were positive. Conversely, interaction effects between Ln(TTF) and GRI_Full (OR = 0.288, p < 0.05) and between Ln(TTE) and GRI_Partial (OR = 0.363, p < 0.05) were negative. Thus, Hypothesis 3 was partially supported.
Moderating effects can be divided into enhancing, buffering, and interference effects. When an independent variable, moderator variable, and interaction variable have a positive relationship with a dependent variable, an enhancing effect creates synergy between them. Conversely, an interference effect arises when an independent variable and moderator variable have a positive relationship with a dependent variable, whereas an interaction variable and a dependent variable have a negative relationship. Therefore, in this case, the higher the moderator variable, the weaker the influence of an independent variable on a dependent variable [86]. The nature of the interaction can be confirmed by Dawson’s [87] slope, as shown in Figure 2. Figure 2b,c show the enhancing effects. Figure 2a,d show interference effects.
Table 7 presents the prediction accuracy of commercialization success based on the HLRA classification table. Specificities (i.e., the rate of predicting failure (0) as failure (0)) were similar at 94.0%, 95.3%, and 93.1% for each model, respectively. Sensitivity (i.e., the rate of predicting success (1) as success (1)) increased by 34.8%, 40.6%, and 49.3%, respectively. Finally, accuracy (i.e., the proportion of prediction identical to the actual category among all data) improved to 80.4%, 82.7%, and 83.1%, respectively, by the analysis stage.

4.3. Results of the Decision Tree Analysis

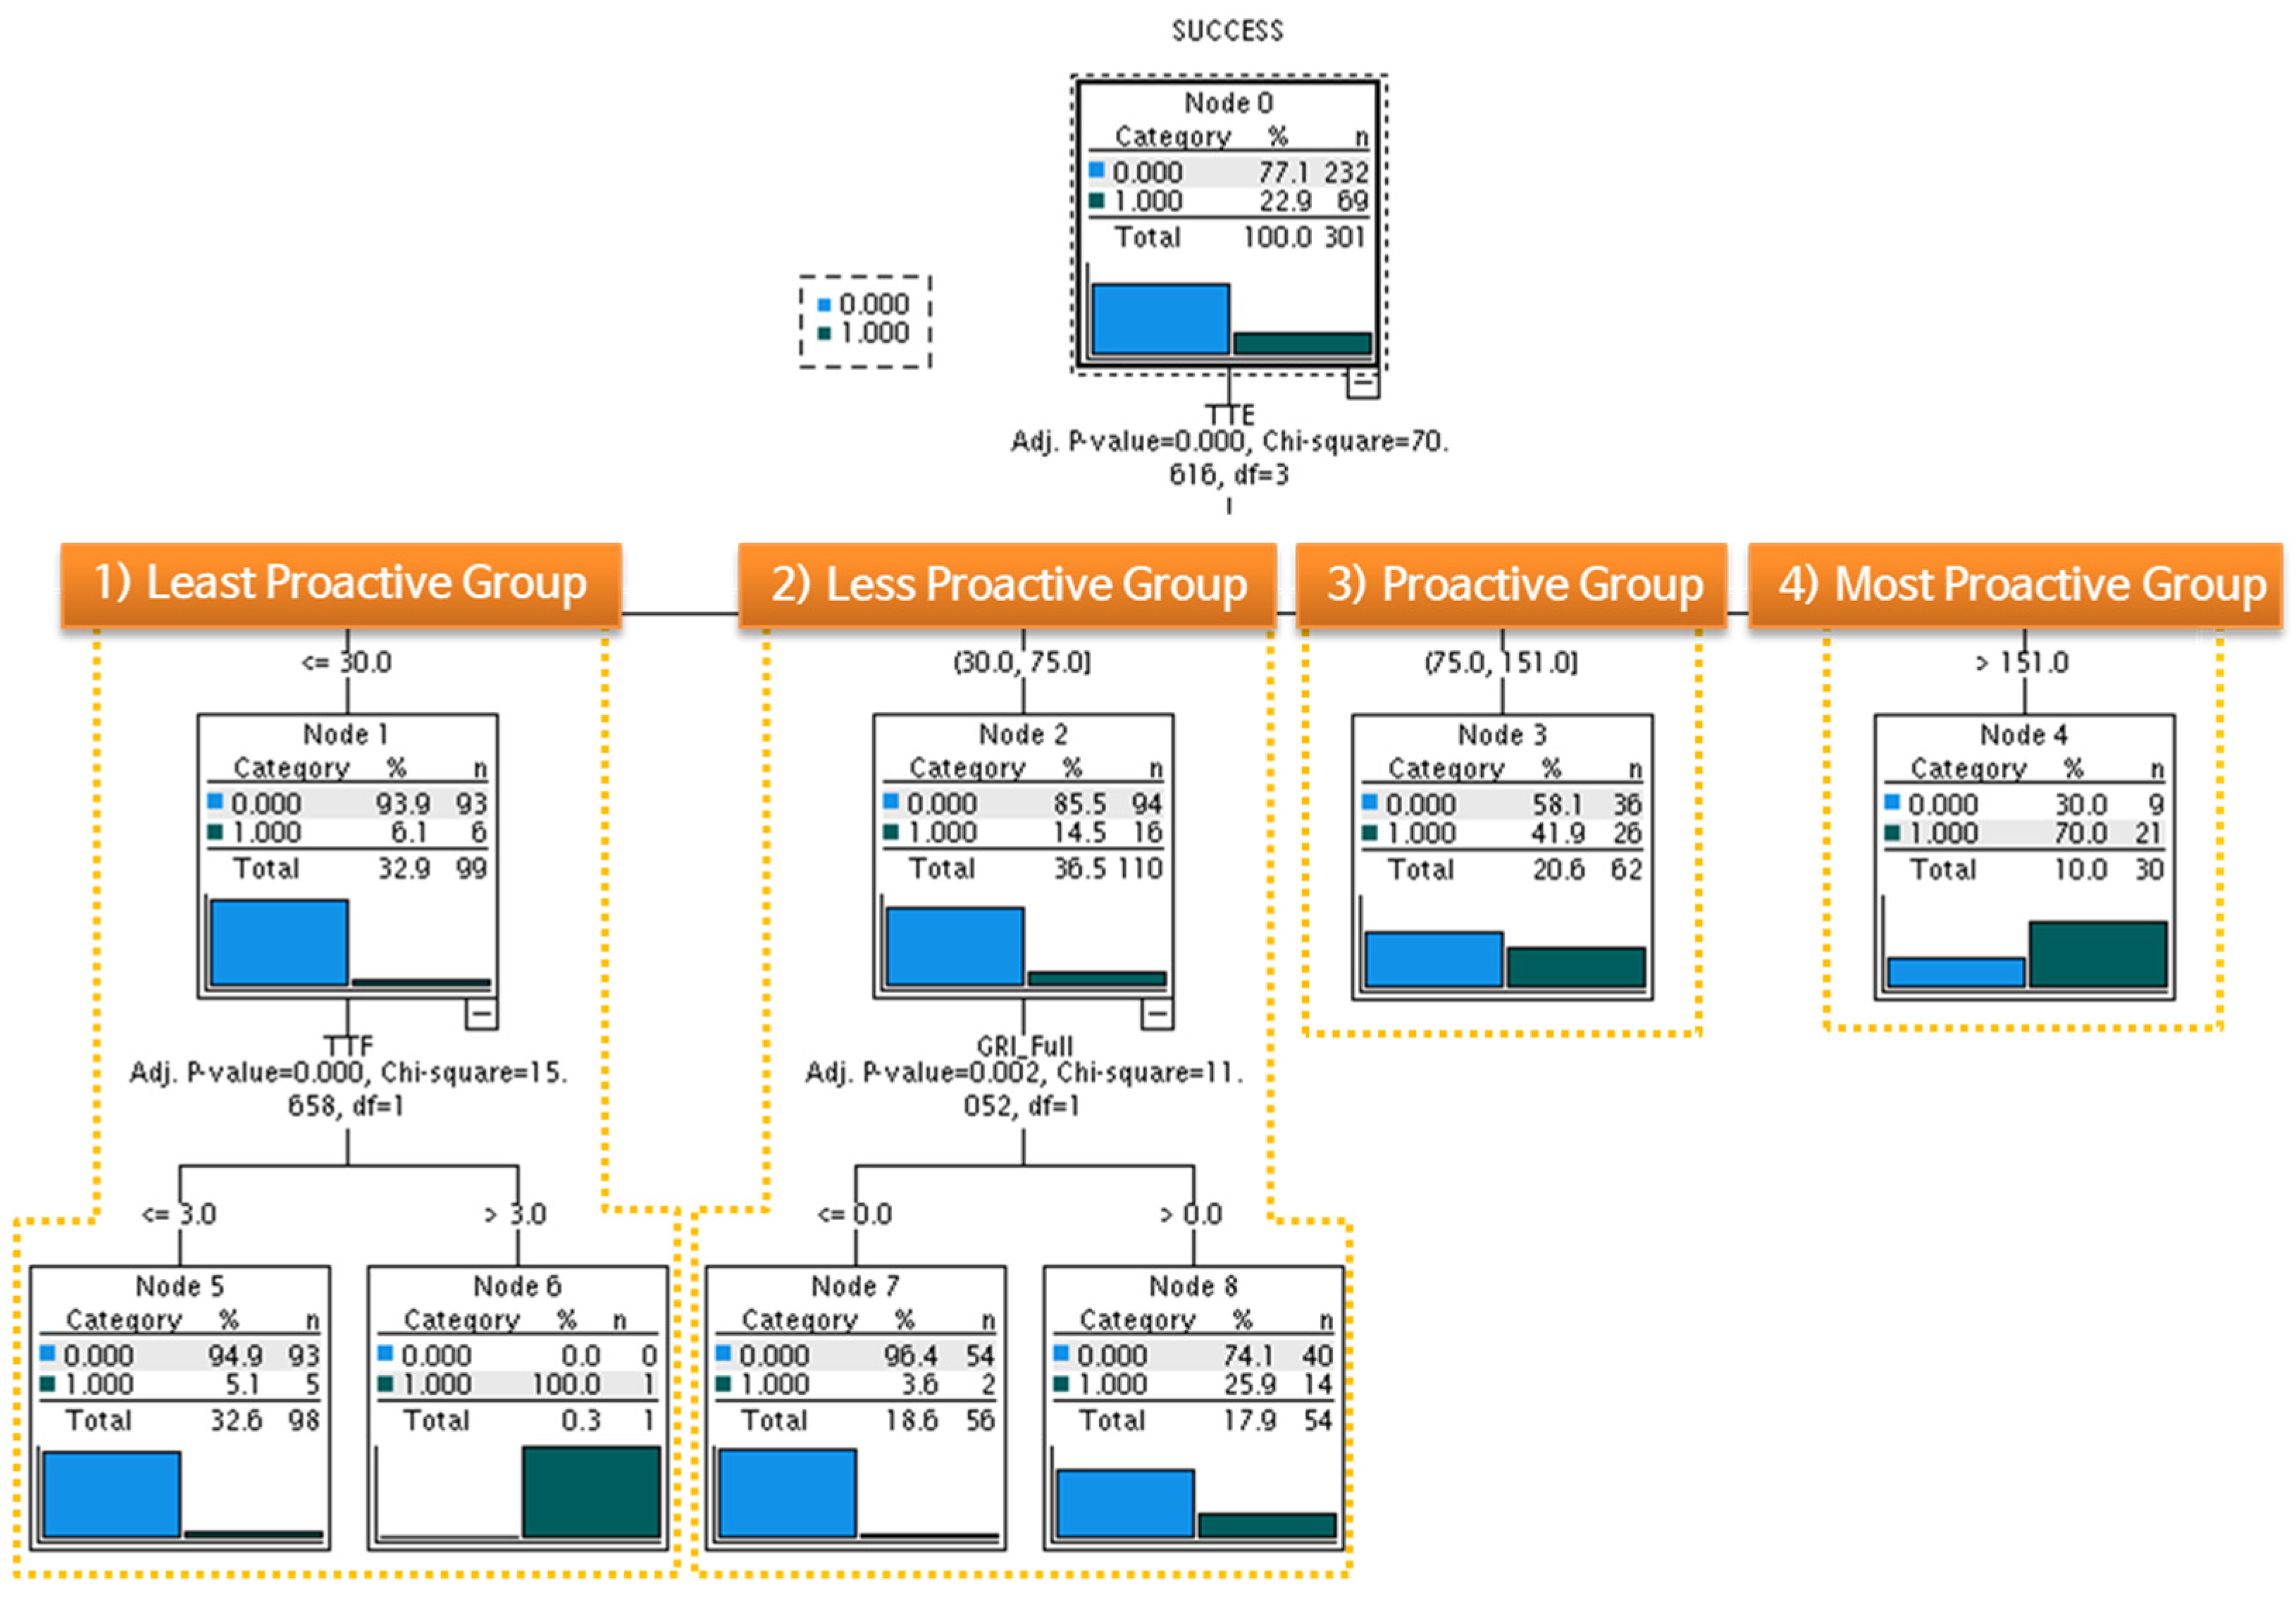
Figure 3 shows DTA results for Model 4, wherein TTF, TTE, GRI_Full, GRI_Partial, and control variables were input. Variables in the upper nodes have a more crucial influence on the success than in the lower nodes. The most important factor determining the success was TTE. Companies are divided into four groups according to the amount of TTE, with higher TTE implying higher SME TCP. Thus, we named each group as follows: (1) least proactive group, TTE ≤ 30 M KRW; (2) less proactive group, 30 M KRW < TTE ≤ 75 M KRW; (3) proactive group, 75 M KRW < TTE ≤ 151 M KRW; and (4) most proactive group, TTE > 151 M KRW. Success rates for these four groups were 6.1%, 14.5%, 41.9%, and 70.0%, respectively. The higher the SME TCP, the more rapid the improvement of the commercialization success rate. For the least proactive group, TTF was found to be the second most important success factor. In this case, the success rate was meager (i.e., 5.1%) when TTF was less than or equal to three (Node 5). When TTF was more than four (Node 6), the success rate was 100%, but it was difficult to generalize this result because there was only one applicable company. The group most affected by GRI researchers’ support was the less proactive group. Researchers’ full involvement in this group increased the success rate by 7.2 times, from 3.6% (Node 7) to 25.9% (Node 8). Meanwhile, GRI_Partial was not observed in this DTA result.
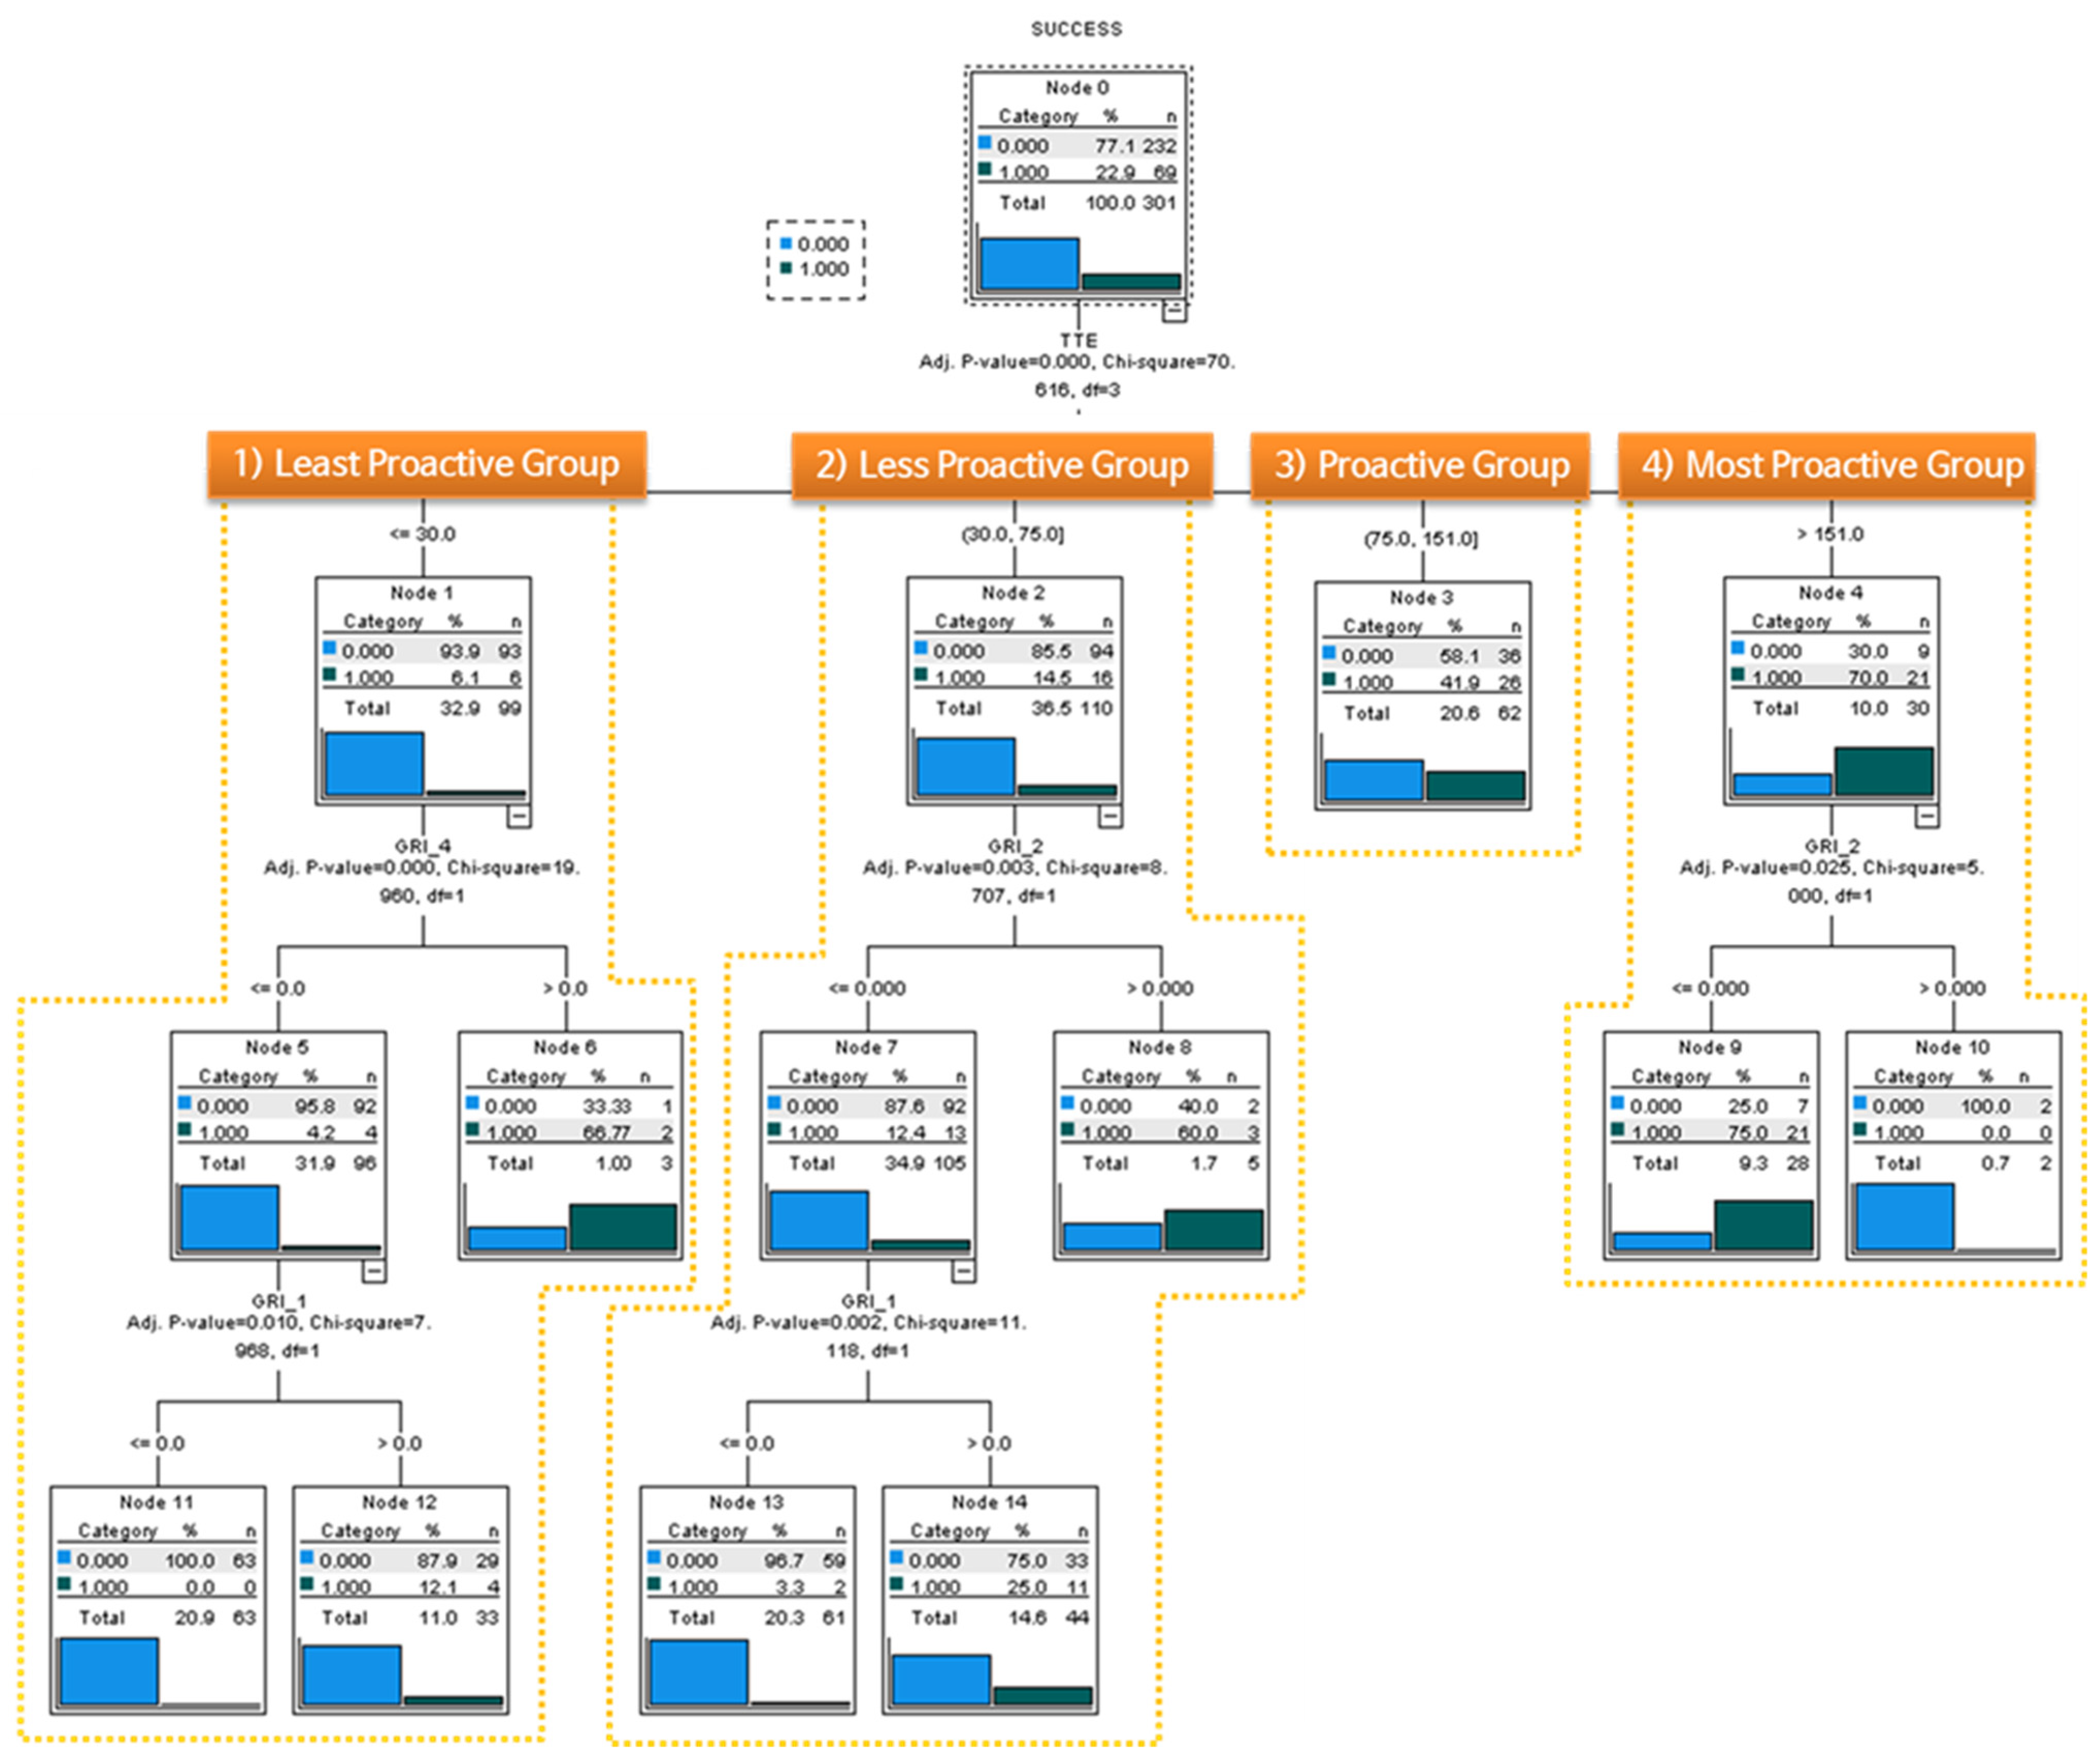
For the analysis by types of the GRI’s support programs, Model 5 was analyzed. Here, GRI_1, GRI_2, GRI_3, and GRI_4 were used as explanatory variables rather than GRI_Full and GRI_Partial.
Figure 4 shows the results. TTE appeared in the highest node again. The success rate for the least proactive group was 66.7% when GRI_4 was supported (Node 6). It was 12.1% when GRI_1 was supported (Node 12). Considering that the 99 SMEs in the least proactive group had a success rate of 6.1% (Node 1), GRI_4 increased the success rate by 11 times, and GRI_1 doubled the success rate. For the 110 SMEs in the less proactive group, the success rate was 14.5% (Node 2). When supporting GRI_2, the success rate increased by more than four times, up to 60% (Node 8). When supporting GRI_1, the success rate was increased to 25% (Node 14), which was more than 7.5 times higher than that of non-supported companies (Node 13). Success rates of proactive and most proactive groups were 41.9% (Node 3) and 70% (Node 4), respectively. However, as an exceptional example, while the two companies that provided GRI_2 in the most proactive group all failed (Node 10), the success rate of companies without support was high at 75% (Node 9).
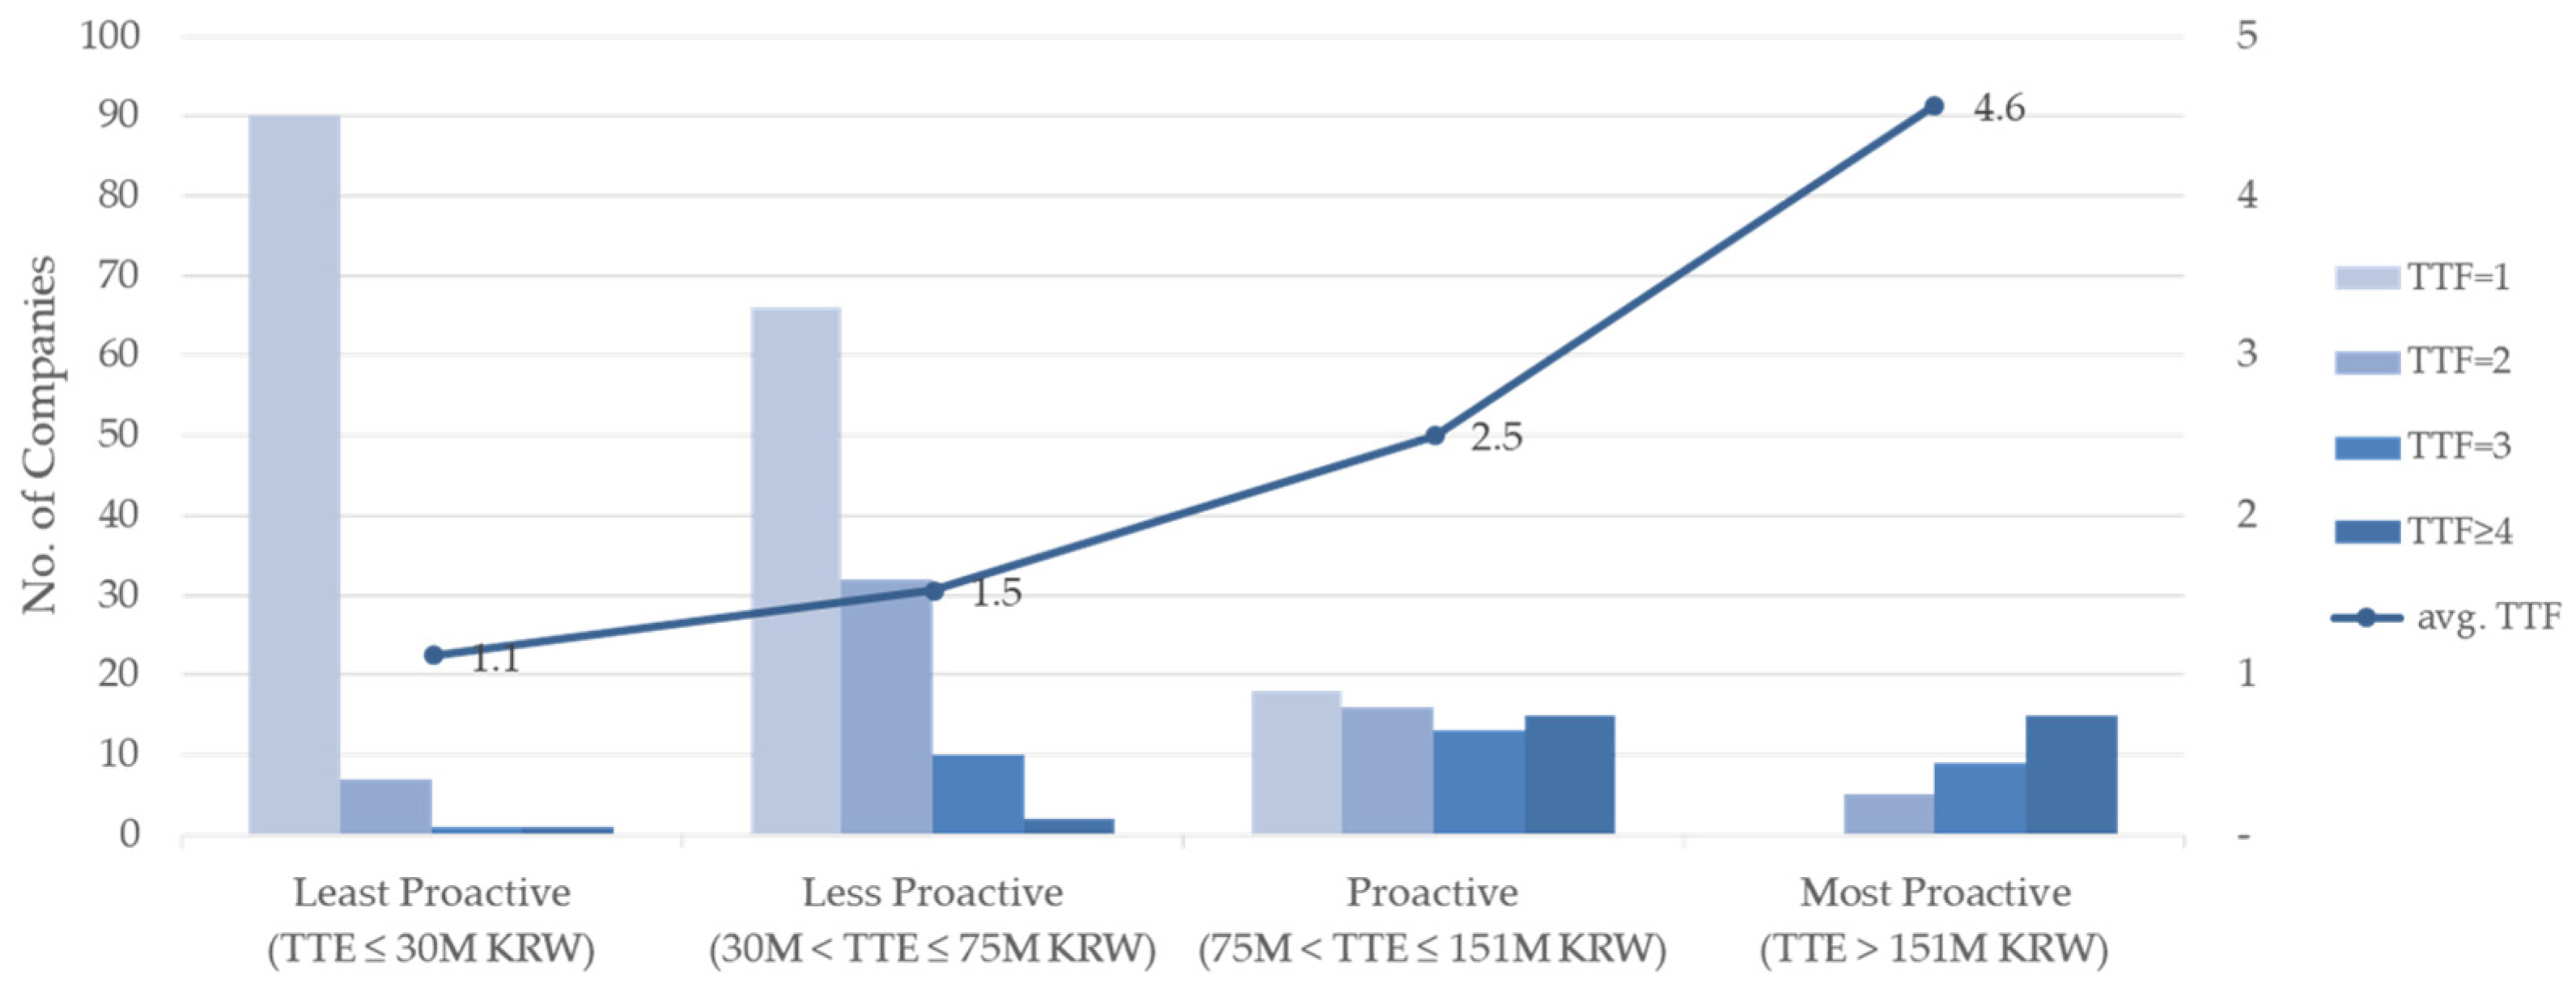
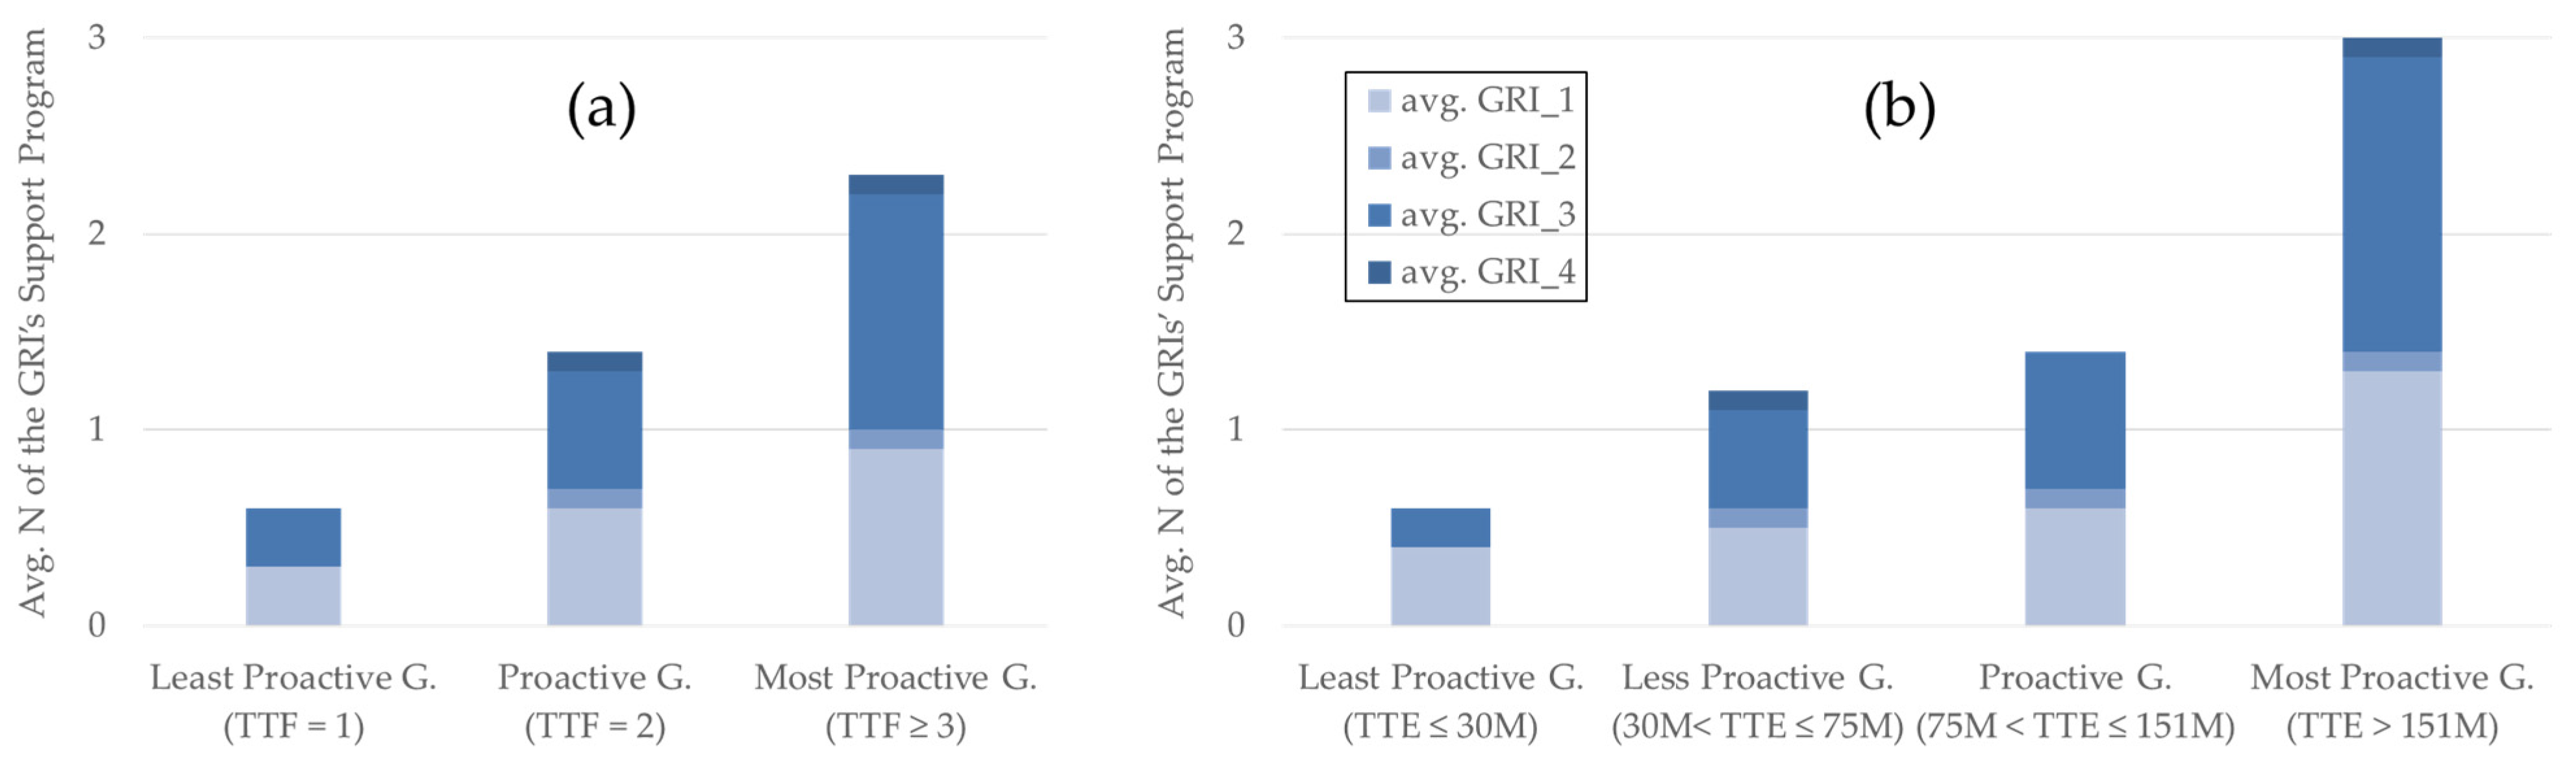
In DTA results, TTE was found to be the most critical success factor. In contrast, the effect of TTF was not observed. Therefore, the importance of TTF might have been overlooked. This issue needs to be investigated further. As shown in Figure 5, TTF increased as TTE increased. The average TTF of groups one, two, three, and four divided by TTE was 1.1, 1.5, 2.5, and 4.6, respectively. Thus, companies with a higher TCP tended to have higher TTE and TTF simultaneously.
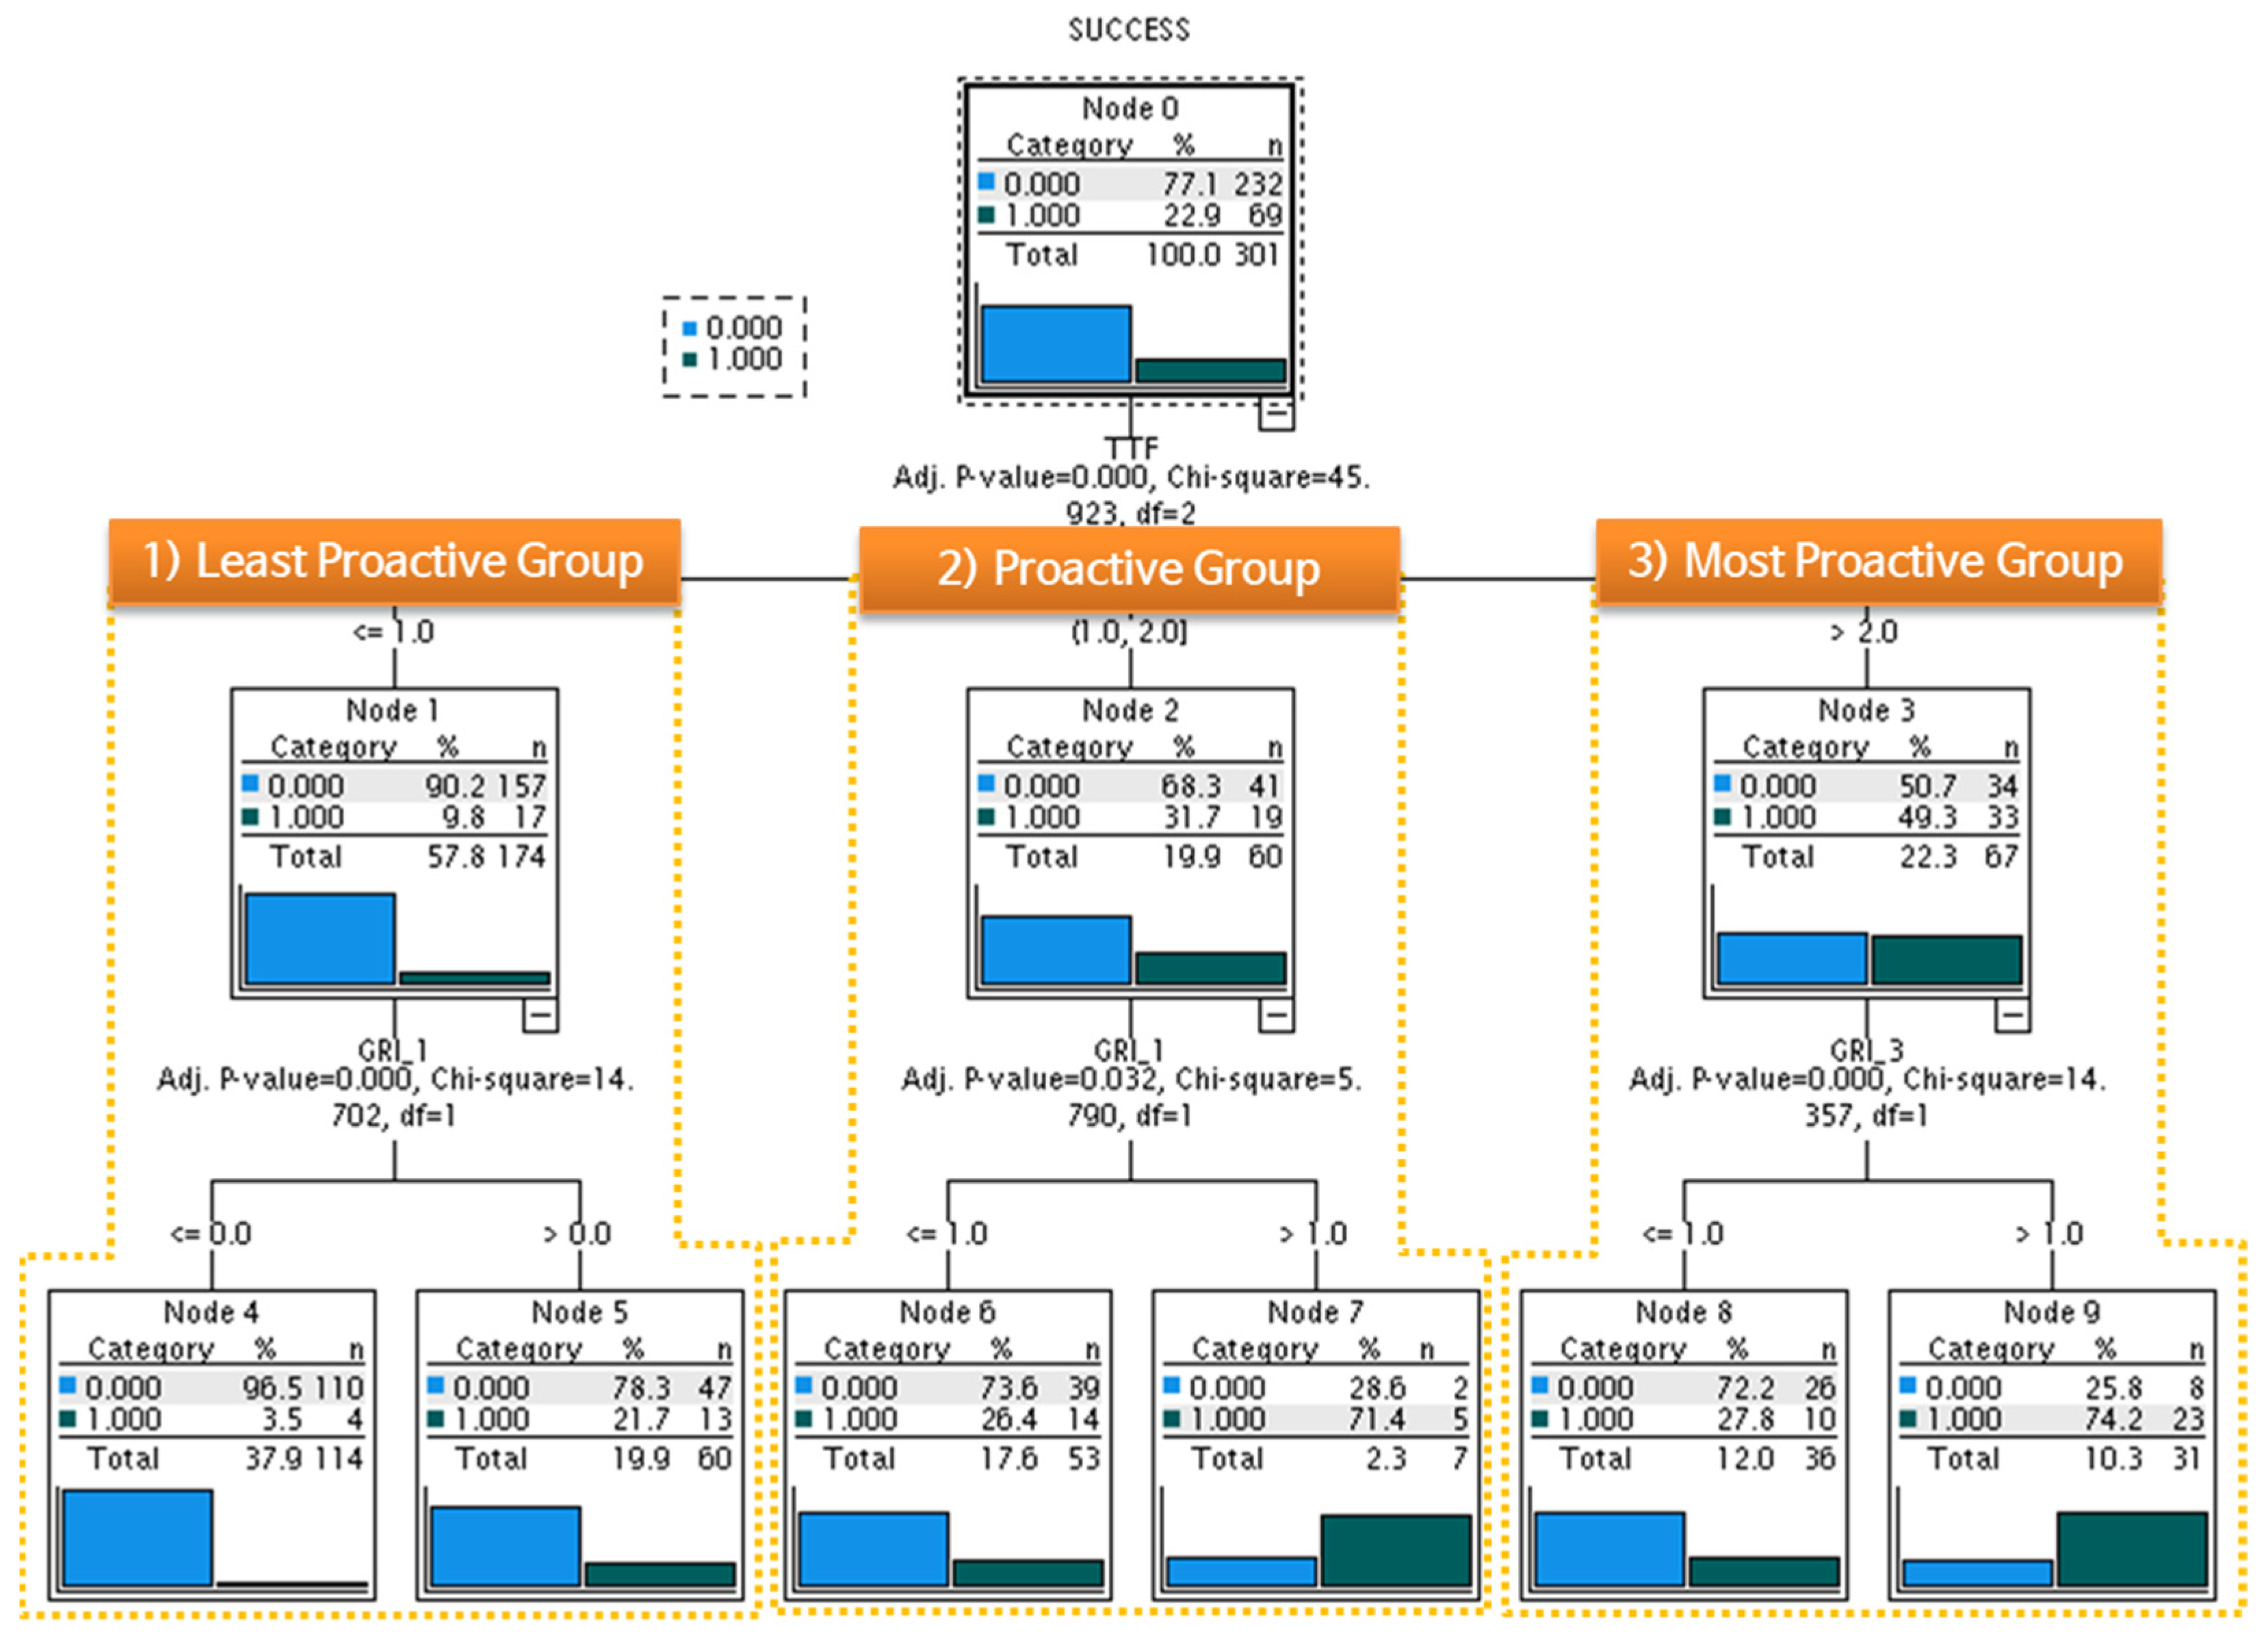
Figure 6 illustrates DTA results for Model 6 excluding TTE to examine the effect of TTF. In this case, the TTF was shown at the top node. Companies were divided into three groups based on the degree of TTF, with many TTF implying high SME TCP. Hence, each group was called as follows: (1) least proactive group, TTF = 1, (2) proactive group, TTF = 2, and (3) most proactive group, TTF ≥ 3. As TTF increased, the success rate increased by more than five times, from 9.8% (Node 1) to 49.3% (Node 3). In particular, when GRI_3 was supported twice or more for the most proactive group, the success rate was 74.2% (Node 9), which was the highest value in the decision tree. Meanwhile, when GRI_1 was supported twice or more for the proactive group, the success rate was as high as 71.4% (Node 7).
Table 8 illustrates the prediction accuracy for commercialization success of Models 4, 5, and 6 based on the DTA classification table. Specificities for Models 4, 5, and 6 were 96.1%, 95.7%, and 95.7%, respectively. Sensitivities were 31.9%, 37.7%, and 40.6%, respectively. Compared with the prediction accuracy for Models 1, 2, and 3 of LRA shown in Table 7, the specificity was slightly higher while the sensitivity was slightly lower. Accuracies were 81.4%, 82.4%, and 83.1% for Models 4, 5, and 6, respectively, similar to LRA results.

4.4. Summary of the Analysis Results

We obtained various analysis results by performing HLRA and DTA. Table 9 shows the input explanatory variables and analysis method for each of the six research models.
Table 10 summarizes the hypothesis test results. The HLRA verified our hypotheses that both SME TCP and GRI TCP played a positive role in technology commercialization success, and GRI TCP played a partially positive moderating role between SME TCP and technology commercialization success. Therefore, providing GRI researchers’ full involvement to companies that invest heavily in technology transfer and providing GRI researchers’ partial involvement to those who receive technology multiple times are effective methods to increase the success rate.
DTA identified success factors considering the interrelationships among various factors not revealed in the statistical analysis. As a result, the most critical success factor was TTE, and the importance of TTF was confirmed. Companies were classified into four groups according to TTE level and three groups according to TTF degree. Table 11 shows the effects of GRI researchers’ support programs for each group on the success rate.

5. Conclusions and Suggestions

In order to examine factors that contribute to the successful commercialization of technology from GRIs to SMEs, this study analyzed the case of ETRI in Korea. Several studies in the past demonstrated technology adopters’ willingness and cooperative partnerships as success factors for public technology commercialization. As these factors are abstract and complex to quantify objectively, we proposed a new concept of SME TCP and GRI TCP. We used a company’s TTF and TTE as measurement indicators for SME TCP. GRI TCP was measured by the number of GRI researchers’ support programs to a company after technology transfer.
Results of HLRA confirmed that TTF, TTE, and both full and partial involvement of researchers in the technology commercialization process positively affected technology commercialization success. The moderating effect of GRI TCP on SME TCP and the success of technology commercialization were verified. Therefore, consistently supporting researchers’ partial involvement programs for companies with high TTF and full involvement programs for companies with high TTE is significant.
The result of DTA indicated that SME TCP, especially TTE, was the primary and most crucial success factor. Additionally, further analysis confirmed the importance of both TTF and TTE. In particular, the success rate was higher when TTE exceeded 151 M KRW or TTF was three or more. This implies that the possibility of successful technology commercialization can be raised if SMEs consider GRIs as continuous partners and continue to receive technologies. According to the degree of SME TCP, companies were classified into four groups: the least proactive group, less proactive group, proactive group, and most proactive group. Types and degrees of researchers’ support programs that increased the success rate for each group were also revealed.
Although GRI TCP was also found to be an essential factor, companies should be more proactive than GRIs since the main players in promoting the commercialization of public technology are SMEs, and the role of GRIs is auxiliary. As shown in Figure 7, as SME TCP increased, the degree of the GRIs’ support increased proportionally. In general, GRI researchers tend to avoid participating in a commercial R&D environment [19,39]. However, SME TCP ultimately leads to the active participation of researchers.
The significance of this study is as follows. First, from an academic perspective, this study extended the research on success factors of public technology commercialization by empirically analyzing the case of SMEs and ETRI, which has excellent technology development and technology transfer performance. Second, we proposed new concepts of SME TCP and GRI TCP and made it possible to objectively measure them using TTF, TTE, and the degree of GRI researchers’ support. Third, we used various data, such as actual technology transfer information of companies, ETRI’s SME support history data, a survey result, and the official information of the companies, to secure the objectivity of the research. Fourth, various conclusions obtained through HLRA and DTA in this study provide primary data to policy makers and provide practical implications for both SMEs and GRIs.
Based on the analysis results, we offer three suggestions to promote the commercialization success of technology from GRIs to SMEs. First, SMEs that play a key role must have TCP. The higher the level of SME TCP, the greater the commercialization success rate. Companies with high TTE also had high TTF, indicating that they did not consider technology transfer as a one-time event. Ultimately, what is required in advance is a company’s decision to adopt public technology and cooperate continuously with GRIs. Second, GRI researchers’ support after technology transfer catalyzes an increase in SMEs’ technology commercialization success rate. Thus, a policy that encourages researchers to participate more actively in commercial processes is required. In Korea, due to a project-based system (PBS), researchers encounter difficulties even if they are willing to support companies [30,88]. Accordingly, a system that renders the relationship with SMEs sustainable by encouraging GRI researchers to actively participate in the technology commercialization process through PBS improvement and incentive provision is required. Third, the excessive licensing fee is the greatest barrier to SMEs’ public technology commercialization [89]. In this study, the proactive group’s TTE was more than 75 M KRW. This is equivalent to the labor cost of one or two skilled developers in an SME, which is not an amount that can be easily provided. Therefore, sufficient technology finance support is necessary to encourage companies to participate in public technology commercialization.
Despite these important findings, this study has the following limitations, which need to be addressed in further studies. First, a company’s performance was measured simply as the success or failure of technology commercialization. In order to obtain more meaningful results, research on the impact of technology commercialization on business performance and society should be conducted. Further, the criteria for determining the precise contribution of technology to a company’s financial performance and social development and the related time-series data must be obtained. Second, this study only analyzed cases of specific research institutions in the field of information and communications technology. Thus, its application to all GRIs, in general, may be difficult. The research field and scope of development for the technology being pursued by a GRI may vary significantly. Accordingly, a company’s project field and technological characteristics may differ from those of the companies investigated in this study. Additionally, the content of researchers’ support programs after technology transfer may vary from GRI to GRI. Therefore, in future research, an in-depth analysis that subdivides the characteristics of GRIs, the technical fields, and support programs will be required. Finally, SME TCP was measured only with TTF and TTE. The explanatory power of the research model can be strengthened if various other factors such as additional technology transfers, additional development funds, and employment of research personnel are included.

Author Contributions

Conceptualization, J.-K.K. and K.-T.C.; methodology, J.-K.K.; software, J.-K.K.; validation, J.-K.K. and K.-T.C.; formal analysis, J.-K.K.; investigation, J.-K.K.; resources, J.-K.K.; data curation, J.-K.K.; writing—original draft preparation, J.-K.K.; writing—review and editing, J.-K.K. and K.-T.C.; visualization, J.-K.K.; supervision, K.-T.C. All authors have read and agreed to the published version of the manuscript.

Funding

This research received no external funding.

Institutional Review Board Statement

Not applicable.

Informed Consent Statement

Not applicable.

Data Availability Statement

Not applicable.

Acknowledgments

This work was supported by Electronics and Telecommunications Research Institute (ETRI) funded by the Korean government [21ZV1110, Promotion of Expansion and Commercialization for ETRI R&D Results].

Conflicts of Interest

The authors declare no conflict of interest.

References

  1. Kotler, P.; Stigliano, G. Retail 4.0; Lee, S., Ed.; Gilbut Inc.: Seoul, Korea, 2020. [Google Scholar]
  2. KT EMRI (Economic Management Research Institute). Corona Economics; HANS Media: Seoul, Korea, 2020. [Google Scholar]
  3. Elnaj, S. The ‘New Normal’ and the Future of Technology after the COVID-19 Pandemic. Available online: https://www.forbes.com/sites/forbestechcouncil/2021/01/25/the-new-normal-and-the-future-of-technology-after-the-covid-19-pandemic/?sh=3d9628dd6bbb (accessed on 24 January 2022).
  4. Microsoft Corp. Available online: https://news.microsoft.com/en-my/2020/05/04/2-years-of-digital-transformation-in-2-months/ (accessed on 20 August 2021).
  5. Chung, D. Technology Quotient, TQ; ChungRim Publishing: Seoul, Korea, 2017. [Google Scholar]
  6. Park, Y.S.; Glenn, J. World Future Report 2021; Business Books: Seoul, Korea, 2020. [Google Scholar]
  7. MSS (Ministry of SMEs and Startups). Basic Statistics of Small and Medium-Sized Enterprises in 2018. Available online: https://www.mss.go.kr/site/smba/ex/bbs/View.do?cbIdx=288&bcIdx=1022368 (accessed on 15 August 2021).
  8. USTR (The Office of the United States Trade Representative). Available online: https://ustr.gov/trade-agreements/free-trade-agreements/transatlantic-trade-and-investment-partnership-t-tip/t-tip-12 (accessed on 18 August 2021).
  9. Liu, H.; Subramanian, A.M.; Hang, C. Marrying the Best of Both Worlds: An Integrated Framework for Matching Technology Transfer Sources and Recipients. IEEE Trans. Eng. Manag. 2020, 67, 70–80. [Google Scholar] [CrossRef]
  10. MIST (Ministry of Science and ICT). 2020 Survey on Actual State of ICT SMEs. Available online: https://www.msit.go.kr/bbs/view.do?sCode=user&mId=99&mPid=74&pageIndex=&bbsSeqNo=79&nttSeqNo=3173366&searchOpt=ALL&searchTxt= (accessed on 1 September 2021).
  11. Chesbrough, H.W. Open Innovation: The New Imperative for Creating and Profiting from Technology; Harvard Business School Press: Boston, MA, USA, 2006. [Google Scholar]
  12. O’Regan, N.; Kling, G. Technology outsourcing in manufacturing small- and medium-sized firms: Another competitive resource? R D Manag. 2011, 41, 92–105. [Google Scholar] [CrossRef]
  13. Trela, K.; Campbell, Y.; Dornbusch, F.; Pohle, A. How to Find New Industry Partners for Public Research: A Classification Approach. IEEE Trnas. Eng. Manag. 2021, 68, 1214–1231. [Google Scholar] [CrossRef]
  14. STEPI (Science & Technology Policy Institute). Recommendation for Promoting Technology Commercialization; STEPI: Sejong, Korea, 2009. [Google Scholar]
  15. Lee, S.; Lee, H. Measuring and comparing the R&D performance of government research institutes: A bottom-up data envelopment analysis approach. J. Informetr. 2015, 9, 942–953. [Google Scholar]
  16. Mowery, D.C.; Nelson, R.R.; Sampat, B.N.; Ziedonis, A.A. The growth of patenting and licensing by U.S. universities: An assessment of the effects of the Bayh–Dole act of 1980. Res. Policy 2001, 30, 99–119. [Google Scholar] [CrossRef]
  17. Kochenkova, A.; Grimaldi, R.; Munari, F. Public policy measures in support of knowledge transfer activities: A review of academic literature. J. Technol. Transf. 2016, 41, 407–429. [Google Scholar] [CrossRef]
  18. Link, A.N.; Scott, J.T. The economic benefits of technology transfer from U.S. federal laboratories. J. Technol. Transf. 2019, 44, 1416–1426. [Google Scholar] [CrossRef] [Green Version]
  19. Lee, S.; Cho, K. A Study on the Impact of Researcher’s Commercialization Support on the Success of Commercialization after Technology Transfer: A Case of ETRI. J. Technol. Innov. 2017, 25, 35–57. [Google Scholar] [CrossRef]
  20. Lim, I.; Lee, S.M.; Lee, J. A Study on the Success Factors of Technology Transfer and Commercialization in the High-Technology Industry: Collaboration between KETI and Probe Card Company. J. Korea Technol. Innov. Soc. 2014, 17, 490–518. [Google Scholar]
  21. Jung, M.; Lee, Y.; Lee, H. Classifying and prioritizing the success and failure factors of technology commercialization of public R&D in South Korea: Using classification tree analysis. J. Technol. Transf. 2015, 40, 877–898. [Google Scholar]
  22. Bong, K.H. Determinants of Growth of Public Technology Based Start-up: Focused on Subsequent Support of Technology Subject. Knowl. Manag. 2020, 21, 41–58. [Google Scholar]
  23. Chung, B.; Hyun, B. Analysis of Success factors of Technology Transfer and Commercialization through Systematic Literature Review. Asia-Pac. J. Multimed. Serv. Converg. Art. Humanit. Sociol. 2018, 8, 79–90. [Google Scholar]
  24. Bozeman, B.; Rimes, H.; Youtie, J. The evolving state-of-the-art in technology transfer research: Revisiting the contingent effectiveness model. Res. Policy 2015, 44, 34–49. [Google Scholar] [CrossRef]
  25. Lee, Y. Success Factors of Commercialization in IT Technology. J. Technol. Innov. 2004, 12, 259–276. [Google Scholar]
  26. Park, D.S.; Cho, K.T. What factors contribute to the creation of spin-offs? The case of government-funded research institutes in Korea. Asian J. Technol. Innov. 2019, 27, 135–151. [Google Scholar] [CrossRef]
  27. Kim, J. A Research on the Impacts of Technology Transfer in Government-sponsored Research to the Growth of Technology Licensees. J. Korea Technol. Innov. Soc. 2017, 20, 1159–1191. [Google Scholar]
  28. Min, J.; Kim, Y. A Study of Success Factors in Public Technology Transfer: The Implications of Licensee’s Motivation. J. Intellect. Prop. 2015, 10, 225–256. [Google Scholar] [CrossRef]
  29. Roh, D.; Hwang, K.; Park, H. The impact of open innovation activities on performance of Korean IT SMEs·Venture: Technology Transfer Experiences and Technological Collaborations. Korean Soc. Bus. Ventur. 2017, 12, 33–46. [Google Scholar]
  30. Yun, Y.; Kim, Y.B.; Kang, J.S.; Jeong, G.S. A Study of Influencing Factors through the Follow-up on Commercialization of Transferred Technology from Government Funded Research Lab: A Case Study of A-institute. J. Korean Inst. Ind. Eng. 2015, 41, 105–114. [Google Scholar]
  31. Agrawal, A. Engaging the inventor: Exploring licensing strategies for university inventions and the role of latent knowledge. Strat. Manag. J. 2006, 27, 63–79. [Google Scholar] [CrossRef]
  32. Min, J.; Vonortas, N.S.; Kim, Y. Commercialization of transferred public technologies. Technol. Forecast. Soc. Chang. 2019, 138, 10–20. [Google Scholar] [CrossRef]
  33. EPO (European Patent Office). Patents and the Fourth Industrial Revolution. Available online: http://www.obi.gr/wp-content/uploads/2020/12/patents_and_the_fourth_industrial_revolution_study_2020_en.pdf (accessed on 18 August 2021).
  34. ETRI (Electronics and Telecommunications Research Institute). Available online: https://www.etri.re.kr/engcon/sub1/sub1_08.etri (accessed on 20 August 2021).
  35. Ministry of Government Legislation. The Act on the Promotion of Technology Transfer and Commercialization. Available online: http://www.law.go.kr/lsInfoP.do?lsiSeq=162415&efYd=20141119#0000 (accessed on 6 August 2021).
  36. CESIS Working Paper Series in Economics and Institutions of Innovation. Research Institutes in Germany: Basic and Applied Science institutionalized? Available online: http://urn.kb.se/resolve?urn=urn:nbn:se:kth:diva-50909 (accessed on 7 June 2022).
  37. KISTEP (Korea Institute of S&T Evaluation and Planning). 2018 National R&D Project Performance Analysis Report; KISTEP: Eumseong, Korea, 2020. [Google Scholar]
  38. MOTIE (Ministry of Trade, Industry and Energy). Technology Transfer and Commercialization Status Survey Report 2019; MOTIE: Sejong, Korea, 2019.
  39. Thursby, J.G.; Kemp, S. Growth and productive efficiency of university intellectual property licensing. Res. Policy 2002, 31, 109–124. [Google Scholar] [CrossRef]
  40. Link, A.N.; Siegel, D.S. Generating science-based growth: An econometric analysis of the impact of organizational incentives on university–industry technology transfer. Eur. J. Financ. 2005, 11, 169–181. [Google Scholar] [CrossRef]
  41. Bercouitz, J.; Burton, R.; Feldman, M.; Feller, I. Organizational structure as a Determinant of Academic Patent and Licensing Behavior: An exploratory study of Duke, Johns Hopkins, and Pennsylvania State Universities. J. Technol. Transf. 2001, 26, 21–35. [Google Scholar] [CrossRef]
  42. Jaffe, A.B.; Lerner, J. Reinventing Public R&D: Patent Policy and the Commercialization of National Laboratory Technologies. RAND J. Econ. 2001, 32, 167–198. [Google Scholar]
  43. Park, J.; Ryu, T.; Gibson, D.V. Facilitating public-to-private technology transfer through consortia: Initial evidence from Korea. J. Technol. Transf. 2009, 35, 237–252. [Google Scholar] [CrossRef]
  44. Hsu, D.W.L.; Shen, Y.-C.; Yuan, B.J.C.; Chou, C.J. Toward successful commercialization of university technology: Performance drivers of university technology transfer in Taiwan. Technol. Forecast. Soc. Chang. 2015, 92, 25–39. [Google Scholar] [CrossRef]
  45. Evan, W.M.; Olk, P. Technology Transfer in Consortia and Strateilic Alliances; Rowman & Littlefield Publishers, Inc.: Lanham, MD, USA, 1992. [Google Scholar]
  46. Spann, M.S.; Adams, M.; Souder, W.E. Improving federal technology commercialization: Some recommendations from a field study. J. Technol. Transf. 1993, 18, 63–74. [Google Scholar] [CrossRef]
  47. Tidd, J. Managing Innovation: Integrating Technological, Market, and Organizational Change; John Wiley & Sons: Chichester, UK, 2013. [Google Scholar]
  48. Park, R.Y. The Relationships between Technological Innovation and Its Determinants in Korean Small Medium Firms. Asia Pac. J. Small Bus. 1998, 20, 119–147. [Google Scholar]
  49. Kang, S. An Empirical Study on Technology innovation Readiness, Technology Innovation Capability, and Innovation Performance. Bus Manag. Rev. 2014, 47, 29–41. [Google Scholar]
  50. Yeo, I.K. A Study on the Public Technology Transfer Promotion Strategy through Analysis of Influence Factors for Transfer Performance. Ph.D. Thesis, Konkuk University, Seoul, Korea, 2009. [Google Scholar]
  51. Bae, Z.T.; Chung, J.W. Relationships Between Technological Cooperation Activities and Performance of Small and Medium sized Companies in Korea. Asia Pac. J. Small Bus. 1997, 19, 273–296. [Google Scholar]
  52. Hirschey, M. Intangible Capital Aspects of Advertising and R&D Expenditures. J. Ind. Econ. 1982, 30, 375–390. [Google Scholar]
  53. Tubbs, M. The Relationship between R&D and company performance. Res. Technol. Manag. 2007, 50, 23–30. [Google Scholar]
  54. Rocha, F. Inter-Firm Technological Cooperation: Effects Of Absorptive Capacity, Firm-Size And Specialization. Econ. Innov. New Technol. 1999, 8, 253–271. [Google Scholar] [CrossRef]
  55. Morbey, G.K. R&D expenditures and profit growth. Res. Technol. Manag. 1989, 32, 20–23. [Google Scholar]
  56. Fishbein, M.; Ajzen, I. Belief, attitude, intention, and behavior: An introduction to theory and research. Philos. Rhetor. 1977, 10, 177–189. [Google Scholar]
  57. Ajzen, I. The theory of planned behavior. Organ. Behav. Hum. Decis. Process 1991, 50, 179–211. [Google Scholar] [CrossRef]
  58. Davis, F.D. Perceived Usefulness, Perceived Ease of Use, and User Acceptance of Information Technology. MIS Q. 1989, 13, 319–340. [Google Scholar] [CrossRef] [Green Version]
  59. Hellmann, T. The role of patents for bridging the science to market gap. J. Econ. Behav. Organ. 2007, 63, 624–647. [Google Scholar] [CrossRef]
  60. Albors-Garrigos, J.; Zabaleta, N.; Ganzarain, J. New R&D management paradigms: Rethinking research and technology organizations strategies in regions. R&D Manag. 2010, 40, 435–454. [Google Scholar]
  61. Kotha, R.; George, G.; Srikanth, K. Bridging the Mutual Knowledge Gap: Coordination and the Commercialization of University Science. Acad. Manag. J. 2013, 56, 498–524. [Google Scholar] [CrossRef]
  62. Hansen, M.T. Collaboration: How Leaders Avoid the Traps, Create Unity, and Reap Big Results; Harvard Business Press: Boston, MA, USA, 2009. [Google Scholar]
  63. Polanyi, M. The Tacit Dimension; Anchor Books: New York, NY, USA, 1967. [Google Scholar]
  64. Hansen, M.T. The Search-Transfer Problem: The Role of Weak Ties in Sharing Knowledge across Organization Subunits. Adm. Sci. Q. 1999, 44, 82–111. [Google Scholar] [CrossRef] [Green Version]
  65. Soares, T.J.; Torkomian, A.L.V.; Nagano, M.S. University regulations, regional development and technology transfer: The case of Brazil. Technol. Forecast. Soc. Chang. 2020, 158, 120129. [Google Scholar] [CrossRef]
  66. Park, W.; Kim, E.; Park, H. An Empirical Analysis of the Influence Factors on Private-Public R&D Collaboration of Small and Medium-Sized Enterprises in ICT Sector. Asia Pac. J. Small Bus. 2016, 38, 25–44. [Google Scholar]
  67. Choi, Y.H.; Lee, J.J. Determinants of Effective Technology Transfer to SMEs: A Case of Technology Property Rights Concession Program in Korea. Korean Assoc. Policy Stud. 1998, 7, 353–372. [Google Scholar]
  68. Saavedra, P.; Bozeman, B. The “Gradient Effect” in Federal Laboratory-Industry Technology Transfer Partnerships. Policy Stud. J. 2004, 32, 235–252. [Google Scholar] [CrossRef]
  69. Park, J.; Youn, S.; Park, B. Commercialization Success Factors of Transfer Technology from Public R & D and Enhancing Performance. J. Korea Technol. Innov. Soc. 2015, 18, 28–48. [Google Scholar]
  70. Rothwell, R. Innovation and firm size: A case for dynamic complementarity; or, is small really so beautiful? J. Gen. Manag. 1983, 8, 5–25. [Google Scholar] [CrossRef]
  71. Luigi, A.; Concetto Paolo, V. Firm Size and Sustainable Innovation: A Theoretical and Empirical Analysis. Sustainability 2019, 11, 2775. [Google Scholar]
  72. Jung, S.; Kwak, G. Firm Characteristics, Uncertainty and Research and Development (R&D) Investment: The Role of Size and Innovation Capacity. Sustainability 2018, 10, 1668–1681. [Google Scholar]
  73. Park, S.; Cho, K. Relationship Between R&D Outsourcing and Innovation Performance: Based on Resource Based View. Korean Manag. Sci. Rev. 2019, 36, 13–37. [Google Scholar]
  74. Ko, D.; Moon, H.; Lee, S. A Study on the Effect of Government R&D Supports on Firm’s Innovation Activities. Korean J. Bus. Adm. 2015, 28, 1325–1344. [Google Scholar]
  75. Audretsch, D.B.; Lehmann, E.E. Mansfield’s Missing Link: The Impact of Knowledge Spillovers on Firm Growth. J. Technol. Transf. 2004, 30, 207–210. [Google Scholar] [CrossRef]
  76. Grimpe, C.; Kaiser, U. Balancing Internal and External Knowledge Acquisition: The Gains and Pains from R&D Outsourcing. J. Manag. Stud. 2010, 47, 1483–1509. [Google Scholar]
  77. Han, J.; Pei, J.; Kamber, M. Data Mining: Concepts and Techniques; Elsevier Science & Technology: Amsterdam, The Netherlands, 2011. [Google Scholar]
  78. Kim, Y.S. Chun Ratio Models for Data Plan Using Logistic Regression and Decision Tree Analysis: Case Study of a Wireless Telecom Company in Korea. J. Korean Data Anal. Soc. 2006, 8, 1915–1926. [Google Scholar]
  79. Kweon, Y.-R. The Comparative Analysis of Predictors of Suicidal Ideation on Middle School Students Using Decision Tree and Logistic Regression. J. Korean Data Anal. Soc. 2010, 12, 3103–3115. [Google Scholar]
  80. Aksu, G.; Keceoglu, C.R. Comparison of Results Obtained from Logistic Regression, CHAID Analysis and Decision Tree Methods. Eurasian J. Educ. Res. 2019, 19, 115–134. [Google Scholar] [CrossRef] [Green Version]
  81. Baron, R.M.; Kenny, D.A. The moderator–mediator variable distinction in social psychological research: Conceptual, strategic, and statistical considerations. J. Pers. Soc. Psychol. 1986, 51, 1173–1182. [Google Scholar] [CrossRef]
  82. NICE Iinformation Service. Available online: http://www.niceinfo.co.kr/ (accessed on 31 July 2021).
  83. Cretop. Available online: http://www.cretop.com/ (accessed on 31 July 2021).
  84. West, S.G.; Finch, J.F.; Curran, P.J. Structural Equation Models with Nonnormal Variables: Problems and Remedies; Sage Publications, Inc.: New York, NY, USA, 1995. [Google Scholar]
  85. Myers, R.H. Classical and Modern Regression with Applications; PWS-KENT: Boston, MA, USA, 1990. [Google Scholar]
  86. Bae, B. Analysis of Modulating Effect and Mediating Effect by SPSS/Amos/LISREL/SmartPLS; Chungram: Seoul, Korea, 2018. [Google Scholar]
  87. Dawson, J.F. Moderation in Management Research: What, Why, When, and How. J. Bus. Psychol. 2014, 29, 1–19. [Google Scholar] [CrossRef]
  88. Kim, H.; Shim, Y.B. An Exploratory Study on the Interaction Model of Institutional Change of Government-Funded Research Institutes: Focused on R&D Funding Systems. J. Digit. Policy Manag. 2013, 11, 29–43. [Google Scholar]
  89. Han, S.; Lee, M. The Promotion Plan on Public Technology Transfer and Commercialization for Small and Medium-sized Enterprises in the Perspectives of Technology Suppliers, Technology Consumers, and Policy. Innov. Stud. 2019, 14, 265–307. [Google Scholar] [CrossRef]
Figure 1. Research model.
Sustainability 14 07056 g001
Figure 2. Moderating effect of GRI TCP on SME TCP commercialization success relationship.
Sustainability 14 07056 g002
Figure 3. Technology commercialization success prediction decision tree for Model 4.
Sustainability 14 07056 g003
Figure 4. Technology commercialization success prediction decision tree for Model 5.
Sustainability 14 07056 g004
Figure 5. TTF of each of the four groups divided according to TTE.
Sustainability 14 07056 g005
Figure 6. Technology commercialization success prediction decision tree for Model 6.
Sustainability 14 07056 g006
Figure 7. Relationship between GRI TCP and (a) TTF, (b) TTE.
Sustainability 14 07056 g007
Table 1. Success factors for (a) technology transfer and technology commercialization and (b) public technology commercialization.
Factor Classification (a) Technology Transfer and Commercialization(b) Public Technology Commercialization
Technology providerR&D capabilitynumber of papers and patents, research capacity, research facilities, etc. [20]
Management abilityR&D budget, resource allocation capacity, administrative capability, etc.-
Technology diffusion capabilitysize of a technology licensing organization, technology transfer experience, technology marketing activities [20]
Technology adopterTechnology absorption capacitynumber of developers, ability to utilize technology, dedicated technology adoption team, etc. [20,28]
Technology commercialization willingnesswillingness and support of owner, entrepreneurship, efforts for technology transfer, etc. [20,27,28,29,30]
Technology Commercialization capabilitymarketing capability, commercialization capability, understanding customer needs, etc. [21,32]
TechnologyTechnology characteristicscompatibility, complexity, maturity, etc. [30]
Intellectual property rightspatent application/registration status, industrial applicability-
Technology trading markettransaction brokerage, consulting, legal service, technology valuation, etc.-
EnvironmentGovernment supportR&D projects, funding support, related laws and institutions-
Commercialization environment technology financing, industrial characteristics, market size, market volatility, competitive situation, etc. [30,32]
Cooperation partnershipcollaborative relationships, communications, trust, etc. [19,21,22,31,32]
Table 2. Variables and Operational definitions.
VariableOperational DefinitionSourceRefs.
Independent variablesSME TCPTTFTechnology transfer frequency of a company (2013–2016)internal data [29,51]
TTETechnology transfer expenditure of a company (2013–2016) [27,52,53,54,55]
GRI TCPGRI_FullNumber of GRI researchers’ full involvement programs (GRI_1 + GRI_2 + GRI_4) for a company (2014–2016)internal data [19,31,32]
GRI_1: short-term dispatch of research personnel
GRI_2: long-term dispatch of research personnel
GRI_4: additional R&D for commercialization
GRI_PartialNumber of GRI researchers’ partial involvement program (GRI_3) for a company (2014–2016)
GRI_3: consulting
Dependent variableSUCCESSCommercialization success: 1, failure: 0survey [19,28,30,73]
Control variablesCoRNDJoint research experience: yes 1, no 0survey [66,67,68,69]
INNOInnovative business: 1, non-innovative business: 0survey, official data [73,74]
N_ENumber of employees [12,27,28,31]
N_RNumber of R&D personnel [22,69]
AGECompany age: 2019—the year of establishment [28,73,75,76]
Table 3. Basic characteristics of the companies and rate of commercialization success.
DivisionNo.Ratio (%)No. of SuccessSuccess Ratio (%)
AGE22+196.3315.8
15–2110635.22624.5
8–1410735.52422.4
0–76922.91623.2
N_E51+7324.32534.2
21–507223.91622.2
11–207424.61621.6
1–108227.21214.6
N_R21+6521.62233.8
11–204815.91225.0
6–108528.21821.2
0–510334.21716.5
INNOInnovative25384.16023.7
Non-innovative4815.9918.8
CoRNDHave experience21069.85325.2
No experience9130.21617.6
TTF4+3411.31852.9
33311.01545.5
26019.91931.7
117457.8179.8
TTE (KRW)151M–3010.02170.0
75M–151M6220.62641.9
30M–75M11036.51614.5
–30M9932.966.1
GRI_12–3278.91451.9
110735.53431.8
016755.52112.6
GRI_2220.72100.0
1134.3538.5
028695.06221.7
GRI_32–36722.33247.7
1248.0729.2
021069.83014.3
GRI_41206.61050.0
028193.45921.0
GRI_Full2–44013.32152.5
110835.93128.7
015350.81711.1
GRI_Partial2–36722.33247.7
1248.0729.2
021069.83014.3
Table 4. Descriptive statistics of the variables.
VariableNMin.Max.MeanS. D.SkewnessKurtosis
AGE30133913.116.3510.5570.276
Ln(N_E)30106.653.081.3070.31−0.133
Ln(N_R)30105.32.361.0180.4750.074
Ln(TTF)30102.40.440.581.0410.126
Ln(TTE)30106.233.940.899−0.6662.967
GRI_1301030.550.6941.1210.87
GRI_2301020.060.2584.96626.571
GRI_3301030.550.9021.2460.023
GRI_4301010.070.2493.49910.312
GRI_Full301040.660.7951.1731.188
GRI_Partial301030.550.9021.2460.023
Table 5. Correlation analysis of the variables.
12345678910VIF
11 -
20.403 **1 1.899
30.386 **0.585 **1 1.630
40.354 **0.392 **0.285 **1 1.614
50.357 **0.407 **0.338 **0.493 **1 1.559
6−0.0010.1090.0880.0600.0781 1.338
70.0430.0420.1070.0640.0370.138 *1 1.223
80.0840.261 **0.239 **0.208 *0.116 *0.216 **0.187 **1 1.234
90.162 **0.150 **0.233 **0.134 *0.139 *0.475 **0.401 **0.270 **1 4.217
100.140 *0.216 *0.238 **0.122 *0.170 **0.358 **0.369 **0.277 **0.842 **13.739
* p < 0.05, ** p < 0.01. 1: SUCCESS, 2: Ln(TTF), 3: Ln(TTE), 4: GRI_Full, 5: GRI_Partial, 6: AGE, 7: INNO, 8: CoRND, 9: Ln(N_E), 10: Ln(N_R).
Table 6. HLRA results.
VariablesModel 1Model 2Model 3
BS.EEXP(B)BS.EEXP(B)BS.EEXP(B)
Control variablesCoRND−0.2080.3820.812−0.3230.4010.724−0.6710.4310.511
INNO0.0660.4771.0680.0250.4911.026−0.0320.5270.968
Ln(N_R)0.1610.1721.1750.1490.1831.1610.2460.1921.279
AGE−0.0350.0290.966−0.0310.0290.969−0.0400.0310.961
Independent variables Ln(TTF)0.8530.3432.346 **0.5400.3641.716 0.5090.4111.664
Ln(TTE)0.9110.2772.486 **0.8070.2862.241 **1.1690.3293.220 ***
Moderator variablesGRI_Full 0.5580.2281.747 *0.9520.2852.592 ***
GRI_Partial 0.3240.1901.383 0.3020.2441.353
Interaction variablesLn(TTF) × GRI_Full −1.2430.5660.288 *
Ln(TTF) × GRI_Partial 1.7120.5275.539 **
Ln(TTE) × GRI_Full 0.0910.4471.095
Ln(TTE) × GRI_Partial −1.0130.4040.363 *
−2LL262.159247.067224.099
Negelkerke R20.2820.3420.429
Hosmer and Lemeshow: χ29.224 (p = 0.324)3.715 (p = 0.882)2.067 (p = 0.919)
 p < 0.1, * p < 0.05, ** p < 0.01, *** p < 0.001.
Table 7. HLRA classification table.
ObservedModel 1Model 2Model 3
Predicted% CorrectPredicted% CorrectPredicted% Correct
010101
SUCCESS021814Specificity 94.02211195.32161693.1
14524Sensitivity 34.8412840.6353449.3
Overall % Accuracy 80.4 82.7 83.1
Table 8. DTA classification table.
ObservedModel 4Model 5Model 6
Predicted% CorrectPredicted% CorrectPredicted% Correct
010101
SUCCESS02239Specificity 96.12221095.72221095.7
14722Sensitivity 31.9432637.7412840.6
Overall % Accuracy 81.4 82.4 83.1
Table 9. Six detailed research models and analysis methods.
Model No.Explanatory VariablesAnalysis Method
Model 1CoRND, INNO, Ln(N_R), AGE, Ln(TTF), Ln(TTE)HLRA
Model 2CoRND, INNO, Ln(N_R), AGE, Ln(TTF), Ln(TTE), GRI_Full, GRI_Partial
Model 3CoRND, INNO, Ln(N_R), AGE, Ln(TTF), Ln(TTE), GRI_Full, GRI_Partial,
Ln(TTF) × GRI_Full, Ln(TTF) × GRI_Partial, Ln(TTE) × GRI_Full, Ln(TTE) × GRI_Partial
Model 4CoRD, INNO, N_R, AGE, TTF, TTE, GRI_Full, GRI_PartialDTA
Model 5CoRD, INNO, N_R, AGE, TTF, TTE, GRI_1, GRI_2, GRI_3, GRI_4DTA
Model 6CoRD, INNO, N_R, AGE, TTF, GRI_1, GRI_2, GRI_3, GRI_4DTA
Table 10. Results of the research hypothesis tests.
Hypothesis ContentTest Results
H1.SME TCP has a positive effect on technology commercialization success.Accepted
H1a.SME TTF has a positive effect on technology commercialization success.Accepted
H1b.SME TTE has a positive effect on technology commercialization success.Accepted
H2.GRI TCP has a positive effect on technology commercialization success.Accepted
H2a.GRI researchers’ full involvement has a positive effect on technology commercialization success.Accepted
H2b.GRI researchers’ partial involvement has a positive effect on technology commercialization success.Accepted
H3.GRI TCP reinforces the positive effect of SME TCP on technology commercialization success.Partially accepted
H3a.GRI researchers’ full involvement reinforces the positive effect of SME TTF on technology commercialization success.Rejected
H3b.GRI researchers’ partial involvement reinforces the positive effect of SME TTF on technology commercialization success.Accepted
H3c.GRI researchers’ full involvement reinforces the positive effect of SME TTE on technology commercialization success.Accepted
H3d.GRI researchers’ partial involvement reinforces the positive effect of SME TTE on technology commercialization success.Rejected
Table 11. Effects of GRI TCP on the commercialization success by the SME TCP group.
Groups Depending on SME TCPGRIs’ SupportSuccess Rate
TTE(1) Least proactive group (TTE ≤ 30M KRW)GRI_4 ≥ 14.2% → 66.7%
GRI_1 ≥ 10.0% → 12.1%
(2) Less proactive group (30M < TTE ≤ 75M KRW)GRI_2 ≥ 112.4% → 60.0%
GRI_1 ≥ 13.3% → 25.0%
(3) Proactive group (75M < TTE ≤ 151M KRW)-41.9%
(4) Most proactive group (TTE > 151M KRW)-70.0%
TTF(1) Least proactive group (TTF = 1)GRI_1 ≥ 13.5% → 21.7%
(2) Proactive group (TTF = 2)GRI_1 ≥ 226.4% → 71.4%
(3) Most proactive group (TTF ≥ 3)GRI_3 ≥ 227.8% → 74.2%
Publisher’s Note: MDPI stays neutral with regard to jurisdictional claims in published maps and institutional affiliations.

