Article

Analysis of Spring Community Structure and Evaluation of Ecological Niche in Tangshan Marine Ranching, China

1
College of Fisheries and Life Science, Dalian Ocean University, Dalian 116023, China
2
College of Marine Science and Environment, Dalian Ocean University, Dalian 116023, China
3
East China Sea Fisheries Research Institute, Chinese Academy of Fishery Sciences, Shanghai 200092, China
4
Tangshan Marine Ranching Co., Ltd., Tangshan 063610, China
*
Author to whom correspondence should be addressed.
Sustainability 2022, 14(12), 6999; https://doi.org/10.3390/su14126999
Submission received: 25 April 2022 / Revised: 25 May 2022 / Accepted: 3 June 2022 / Published: 8 June 2022
(This article belongs to the Section Sustainability, Biodiversity and Conservation)

Abstract

:
To investigate the fishery community structure in spring at the early stage of construction of Tangshan Marine Ranching, in China. This study analyzed the relationship between species composition, diversity and community structure of fishery resources in marine ranching using survey data from March, April, and May 2017. The results showed that a total of 53 species of organisms occurred in the spring in the waters inside and outside the reef area of the marine pasture. Among them, 20 species of fish were among the chordates. 16 species of arthropods, including 6 species of shrimps and 8 species of crabs. Ten species of mollusks, including 6 species of snails. 5 species of echinoderms, 1 species of annelids, and 1 species of Cnidaria). The diversity index, evenness index and richness index outside the reef area of marine ranching in spring were greater than those in the reef area. According to cluster analysis and non-metric multidimensional scale ranking analysis, the biological communities inside and outside the reef area can be divided into four groups, with the similarity of the communities in the reef area being greater. The Abundance-Biomass Comparison curves (ABC curve) indicated that the biological communities within and outside of the reef had been moderately disturbed. The relative importance index and niche analysis demonstrated that there had been sufficient bait in the reef area, and the ecological structure of the marine ranching was taking shape.

1. Introduction

Recent years have witnessed a decline in the quality of aquatic products [1] due to the prevalence of disease outbreaks in aquaculture species and the abuse of fisheries drugs. Currently, the ever-increasing intensity of human fishing activities and the selection of unsuitable fishing gear have resulted in not only a gradual depletion of resources but also a significant alteration in the structure of fishery resources in many ocean regions around the world [2,3]. Artificial reefs are one option for enhancing the sustainability of aquaculture [4], which can optimize the marine environment, improve the structure of fishery resources in the sea, and reduce the amount of fishing in the sea [5]. It has been demonstrated that the scientific placement of artificial reefs and the construction of marine ranches can improve the habitat of marine biology, increase the amount of biological resources, and improve fishery yields and catch quality [6,7,8,9,10,11]. As of 2020, 136 national-level marine ranching demonstration areas have been constructed along the Chinese coast. The construction of marine ranching in China began in the early 1970s, and large-scale construction began in the early 21st century. The immediate economic benefits of marine ranching in China are estimated at 31.9 billion yuan per year, while the ecological benefits are valued at 60.4 billion yuan per year [12].
In the 1950s, Tangshan sea area in China was very rich in fishery resources, with high-quality fishing grounds such as Daqing River fishing grounds and Nanbu fishing grounds. However, in the 1970s and 1980s, due to the continuous high intensity fishing, the fishery resources gradually declined, and the main fishing species changed from Larimichthys polyactis (Bleeker, 1877), striped bass Trichiurus lepturus (Linnaeus, 1758), Paralichthys olivaceus (Temminck and Schlegel, 1846) and other higher trophic level fishes to Setipinna tenuifilis (Valenciennes, 1848), Oratosquilla oratoria (De Haan, 1844), Acetes chinensis (Hansen, 1919) and other small pelagic fishes and crustaceans with lower trophic levels and shorter life cycles [13]. In order to restore fishery resources, optimize the structure of biological communities and improve the marine ecological environment, the central and local governments of China have invested in the construction of large-scale habitat restoration projects in Tangshan sea area since the beginning of the 21st century, establishing the Laoting Marine Nature Reserve [14] and planning the construction of Tangshan Marine Ranching. Tangshan Marine Ranching is located in the northern Bohai Sea of China, one of the highest latitude marine pasture demonstration areas in China, with a unique ecological environment and historically an important habitat for Larimichthys polyactis (Bleeker,1877), Trichiurus lepturus (Linnaeus, 1758) and Paralichthys olivaceus (Temminck & Schlegel, 1846), with a significant decrease in resource density since the 1990s. artificial fish reefs began to be placed in late 2015 and took shape by late 2016. In order to comprehend the impact of artificial reefs on the structure of biological communities in the early stage of reefs construction., This study evaluated the characteristics of biological communities inside and outside the reef area, as well as the effect of the initial stage of reef construction on the structure of marine biological communities. The study of the effect of marine ranches on the structure of biological communities has garnered the interest of academics from around the world.
There are currently numerous reports on the characteristics of fishery communities in China’s various sea regions. Yu Songli et al. [15] utilized biodiversity, the ABC curve method, cluster analysis, non-metric multidimensional scale analysis, ecological niche breadth, and trophic level structure analysis to investigate the characteristics of fishery community structure and trophic level changes in the Sanmen Bay sea area. Li Tao et al. [16] studied seasonal changes in the community structure of fishery resources in the nearshore waters of the southern Shandong Peninsula using biodiversity and cluster analysis. Liu Xiuze et al. [17] studied the structure of fishery resources in the coastal waters of Liaoning Province using ecological dominance, species similarity coefficient, community diversity index, community seasonal turnover index, and migration index. Zhang Rongliang et al. [18] studied the characteristics of bottom fishery communities of artificial and natural reefs near Yantai by measuring environmental factors, biodiversity, community similarity analysis and community-environment correlation analysis. The majority of research in Tangshan ocean regions has focused on abiotic environmental analysis [19], ecological carrying capacity [20], and Simple analysis of fishery community structure [21]. However, a comprehensive analysis of the community structure and studies related to biological ecological niches in Tangshan marine ranching have not been published. This study analyzed the differences in biological community structure inside and outside the artificial reef area based on survey data collected during the early construction of Tangshan Marine Ranch in spring 2017 (March, April, and May), with the hope of contributing to the study of revealing the effects of the early construction phase of marine ranches on biological community structure.

2. Methods

2.1. Methods of Study

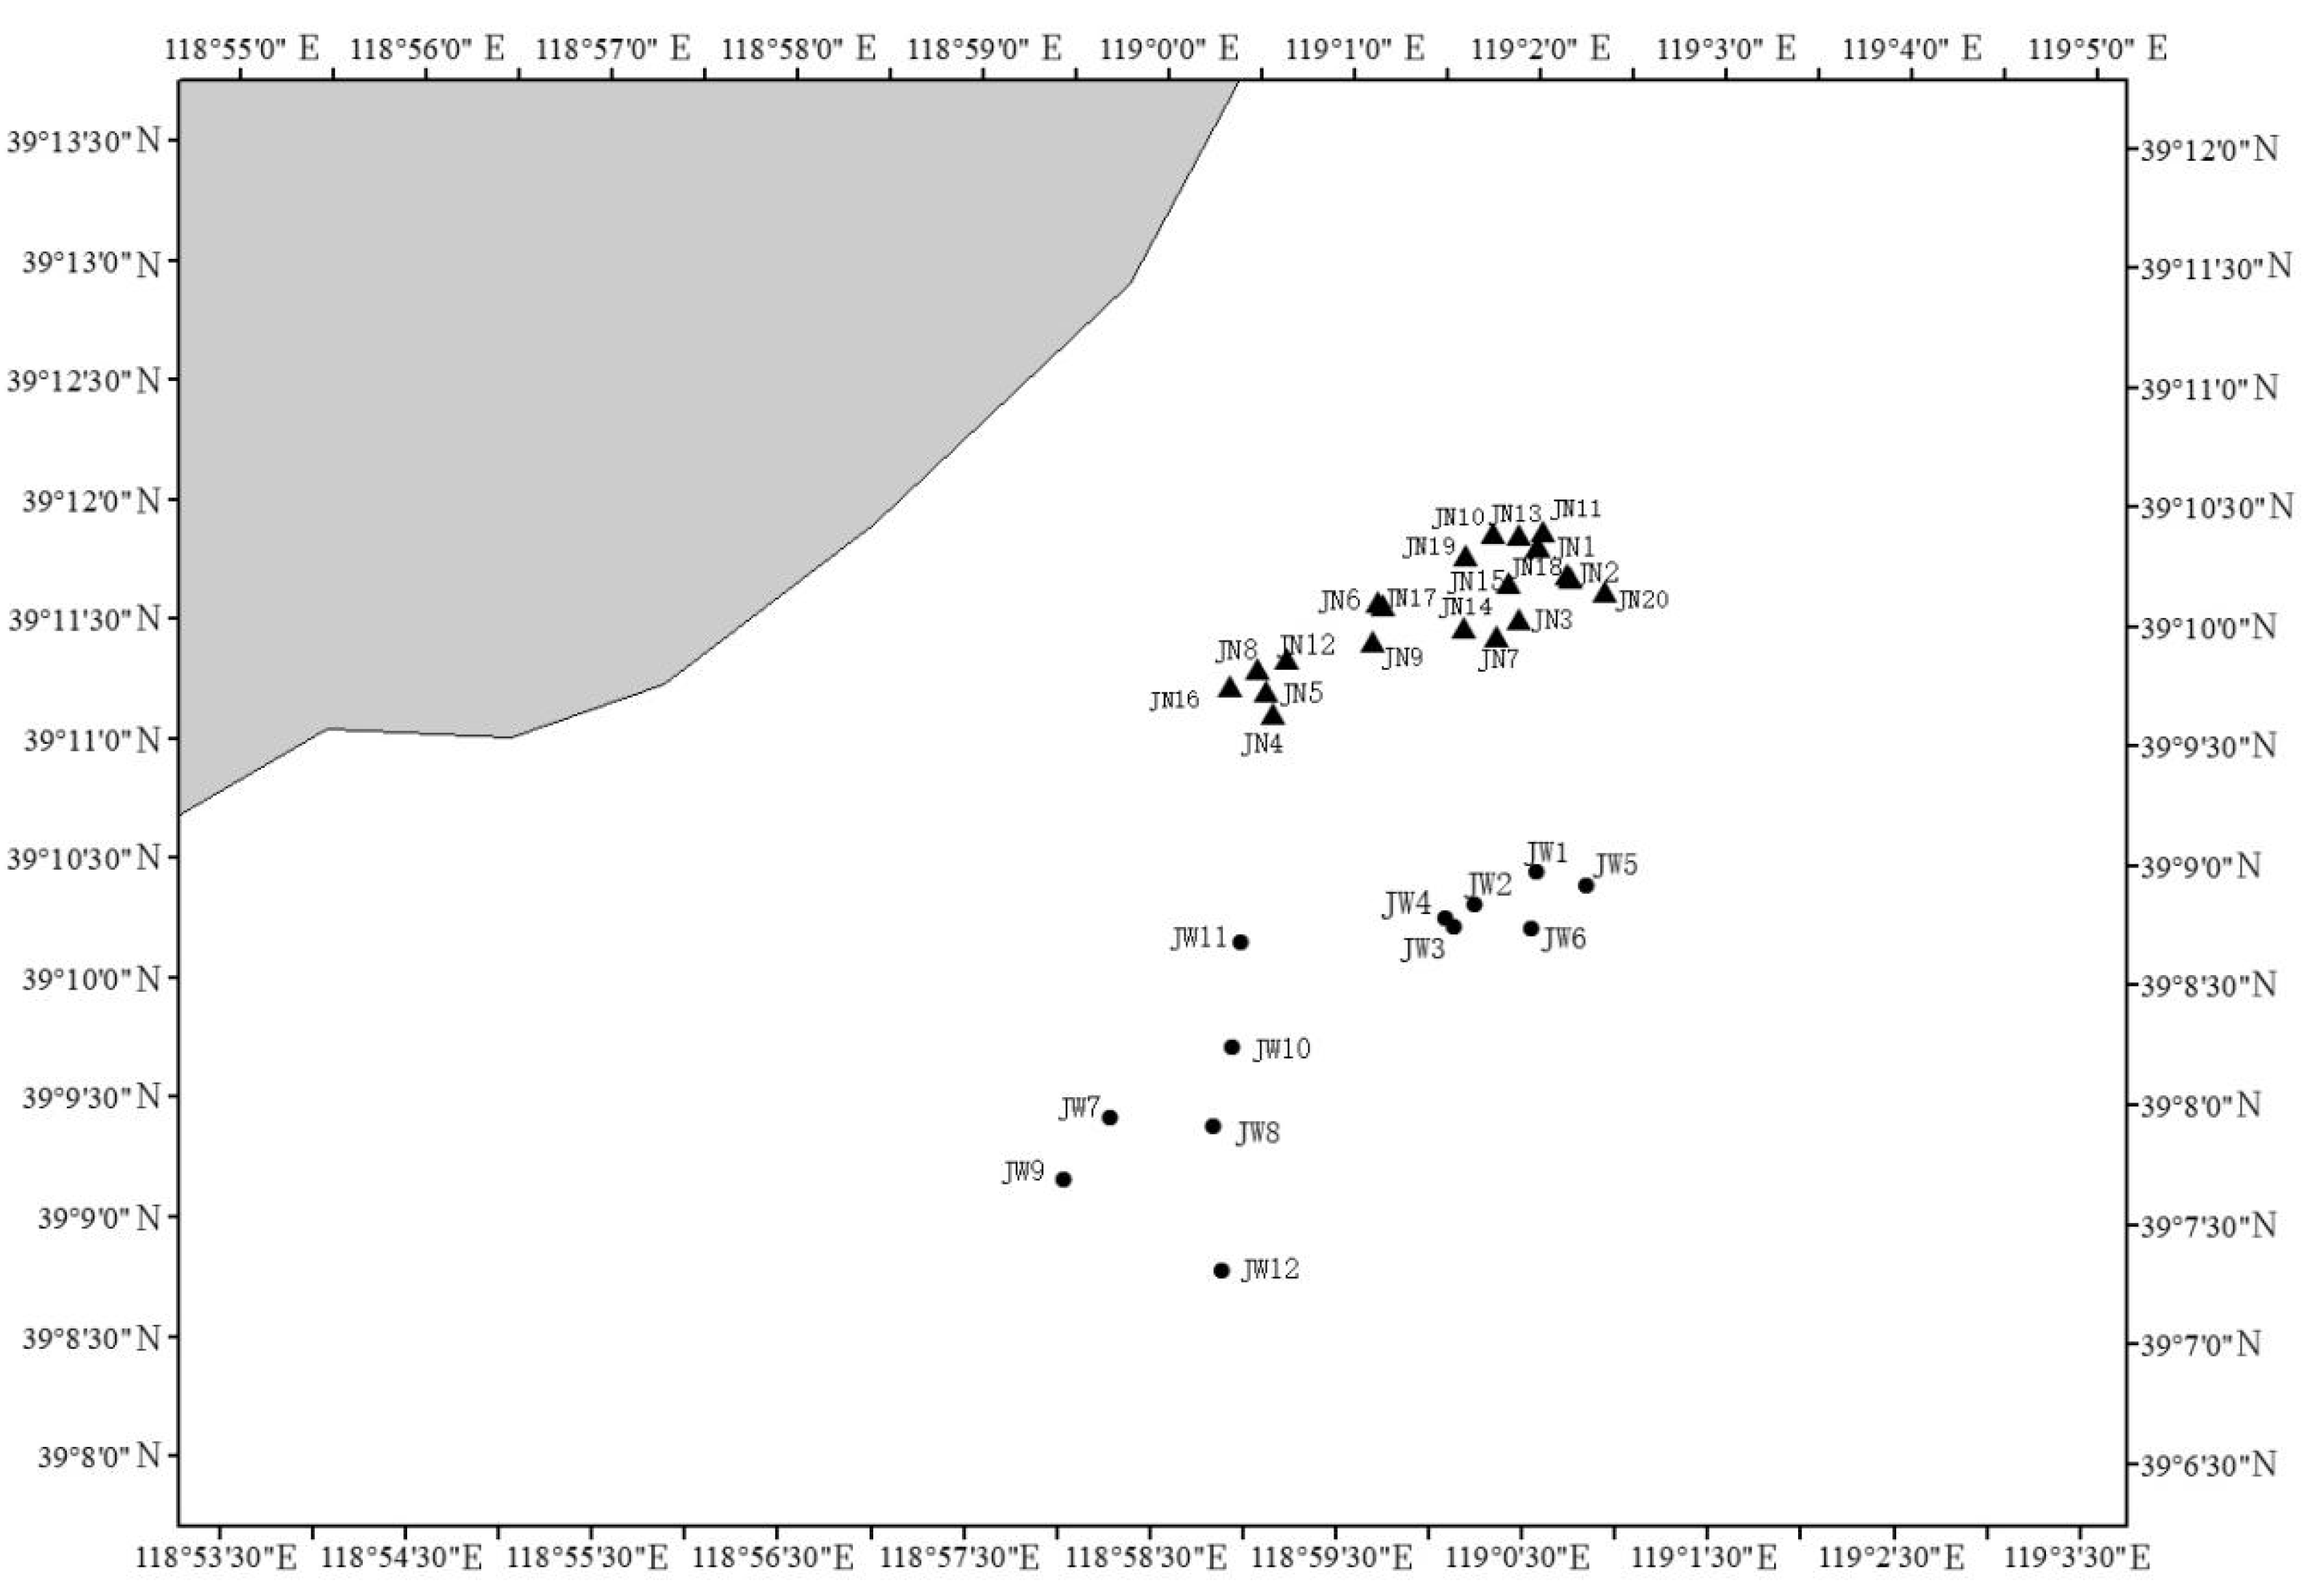
The biological resources survey was conducted in the months of March, April, and May of 2017, and the survey area consisted primarily of the reef area (20 stations in total) and areas outside the reef area (12 stations in total) (Figure 1). The average tidal difference in the sea is 200 cm, the maximum current speed is 36.5 cm/s, the waves are mainly wind waves, the average water depth outside the reef area is 18 m, the substrate is mud and sand both inside and outside the reef area, the water temperature varies from 0 to 25 °C throughout the year.. The majority of the survey nets consist of cage traps (with 35 mm mesh size, 10 m length, 300 mm width and 190 mm height), bottom gillnets (with 50 mm mesh size, 50 m length and 1.6 m height) and upper gillnets (with 80mm mesh size, the length of 50 m and the height of 1.4 m). The nets were taken back after 24 h.

2.2. Analytical Methods

2.2.1. Community Diversity Analysis

In this study, Shannon-Wiener index, Pielou evenness index, Margalef richness index and Pinkas relative importance index were used to analyze the biodiversity of the community, with the following formula:
Shannon Wiener diversity index (H’) analysis [22]:
H = i = 1 S ( P i ln P i )
Pielou homogeneity index (J) analysis [23]:
J = H / lnS
Margalef richness index (D) analysis [24]:
D = ( S 1 ) / ln N
Pinkas relative importance index (|R|) analysis [25]:
| R | = ( Ni + Wi )   ×   Fi ×   10 4
In the formula, S is the total number of species, Pi is the ratio of the number of individuals of the ith species to the total number of samples (N); Ni is the ratio of the number of the ith species to the number of all species in samples; Wi is the ratio of the ith species to all species in samples; Fi is the frequency value of the ith species at surveyed stations. When 1 ≤ H’ ≤ 3, the community is moderately disturbed; When 0 < H’ < 1, it indicates that the community is moderately disturbed [15]. If |R| ≥ 1000, it is the dominant species; if 100 ≤ |R| < 1000, it is the important species; if 10 ≤ |R| < 100, it is the common species, and if |R| < 10, it is the rare species. When H’ > 3, it indicates that the fishery biological community is undisturbed [26].

2.2.2. Community Structure Analysis

Cluster analysis was used to analyze the communities inside and outside the reef area in spring. Firstly, the biomass of the stations inside and outside the reef area was square root transformed to balance the effectiveness of rare species and also to stabilize the role of dominant species in the community. In solving the Bray-Curtis similarity coefficient matrix, non-metric multidimensional scaling (NMDS) was used for two-dimensional scale ranking and hierarchical clustering cluster to study the fishery biome structure. The results were evaluated according to the reliability of the results of non-metric multidimensional scaling analysis based on the Stress coefficient. When Stress < 0.5, it means that the ranking results are better representative; When 0.05 ≤ Stress < 0.1, the sorting result is credible; When 0.1 ≤ Stress < 0.2, it indicates that the sorting result has certain explanatory significance; When Stress > 0.2, it means that the ranking results can not correctly explain the community relationship [27,28]. In this study, primer software was used for cluster analysis.

2.2.3. Abundance Biomass Curve (ABC Curve)

This method, first proposed by Warwick in 1986, is a way to determine the degree of disturbance in a community based on the relative position of the abundance curve and the biomass dominance curve in the same coordinate system. If the biomass curve is higher than the abundance curve, the community is “undisturbed”; if the abundance curve is above the biomass curve, the community is “severely disturbed”; if the two lines basically intersect, the community is “moderately disturbed” [29]. The statistic is expressed as W by the following equation [29]:
w = i = 1 S B i A i 50 ( S 1 )
where S is the number of biological species, Bi is the cumulative percentage of biomass corresponding to species i, and Ai is the cumulative percentage of abundance corresponding to species i. if W > 0, the community is undisturbed; If W < 0, the community is disturbed; If the W value approaches 0, the community will be moderately disturbed. The closer the W value is to 1, it means that the richness of each species tends to be the same, on the contrary, the W value is close to −1.

2.2.4. Niche Breadth and Niche Overlap

The niche breadth index adopts the Shannon index [22]:
B i = j = 1 R ( P ij ln P ij )
Niche overlap adopts Pianka index [30]:
Q ik = j = 1 R ( P i j P k j ) / j = 1 R P i j 2 j = 1 R P k j 2
where Pij is the ratio of the ith species’ abundance at station j to the total abundance at station j. Pkj is the ratio of the abundance of the kth species at station j to the total abundance at station j. Bi is the niche breadth of the ith species; The value range of Bi is [0, R], and R is the total number of stations investigated. The greater the value of Bi, the greater the niche breadth of the species, which means that the species has greater utilization of resources. When Bi ≥ 2.0, it is a wide niche species, when 1.0 ≤ Bi < 2.0, it is a medium niche species, and when Bi < 1.0, it is a narrow niche species; Qik represents the ecological overlap index of i species and k species, and the value range is [0,1]. The larger the Qik value, the stronger the similarity and inter-species competition between the i species and the k species in resource utilization. According to the classification standard of Wathne et al. (2000), the niche overlap value is divided into three levels. If Qik > 0.6, it means that the niche overlap degree is high; 0.3 < Qik < 0.6, indicating low niche overlap; Qik < 0.3 indicates low niche overlap [31].

3. Results

3.1. Composition Type

This spring survey uncovered a total of 53 species from distinct animal groups. 41 of which were found in the reef area, including 15 species of fish, 13 species of crustaceans and 4 species of snails. A total of 39 species were found outside the reef area, including 14 species of fish, 12 species of crustaceans, and 5 species of snails. (Table 1).

3.2. Diversity Characteristics

Following calculation, the reef area’s diversity index (Table 2), evenness index (Table 3) and richness index (Table 4) can be obtained. In spring, the average value of diversity index (H’) within the reef area was 1.34, with the highest value at station JN1 (2.09), and the lowest value at station JN6 (0.65). The average value of the evenness index (J) in the reef area was 0.67, with the highest at station JN3 (0.86) and the lowest at station JN8 (0.45), The average value of the richness index (D) in the reef area was 1.62, with the highest value at the station JN1 (3.94) and the lowest value at the station JN7 (0.74). In the spring, the average value of the diversity index (H’) outside the reef area was 1.69, with the highest value (2.22 at the station JW8 and the lowest at the station JW3). Outside the reef area, the average value of the evenness index (J) was 0.73, with the highest value at the station JW4 (0.86), and the station JW3 having the lowest value (0.53). Outside the reef, the average value of the richness index (D) was 2.18, with the station JW9 having the highest value (3.23), and the station JW4 having the lowest (1.04).

3.3. Analysis of Dominant Species

Based on the analysis of the relative importance index of organisms inside and outside the reef area in Table 5 and Table 6, there were four dominant species in the reef area of the marine ranching during the spring: Charybdis japonica (A.Milne. EdWards, 1861), Sebastes schlegelii (Hilgendorf, 1880), Asierias rollestoni (Lütken, 1871) and Rapana venosa (Valenciennes, 1846). Important species included Hexagrammos otakii (Jordan and Starks, 1895), Palaemon gravieri (Yu, 1930) and Chaeturichthys stigmatias (Richardson, 1844). Outside of the reef area, Asierias rollestoni, Charybdis japonica, Palaemon gravieri and Hexagrammos otakii were the dominant species. Sebastes schlegelii,Leptochela gracilis (Stimpson, 1860), Lysmata vittata (Johannes Govertus de Man, 1888), Diogenes edwardsii (De Haan, 1849), Chaeturichthys stigmatias,Crangon affinis (De Haan, 1849), Rapana venosa (Valenciennes, 1846), Alpheus japonicus (Miers, 1879)were eight important species.

3.4. Community Structure Analysis

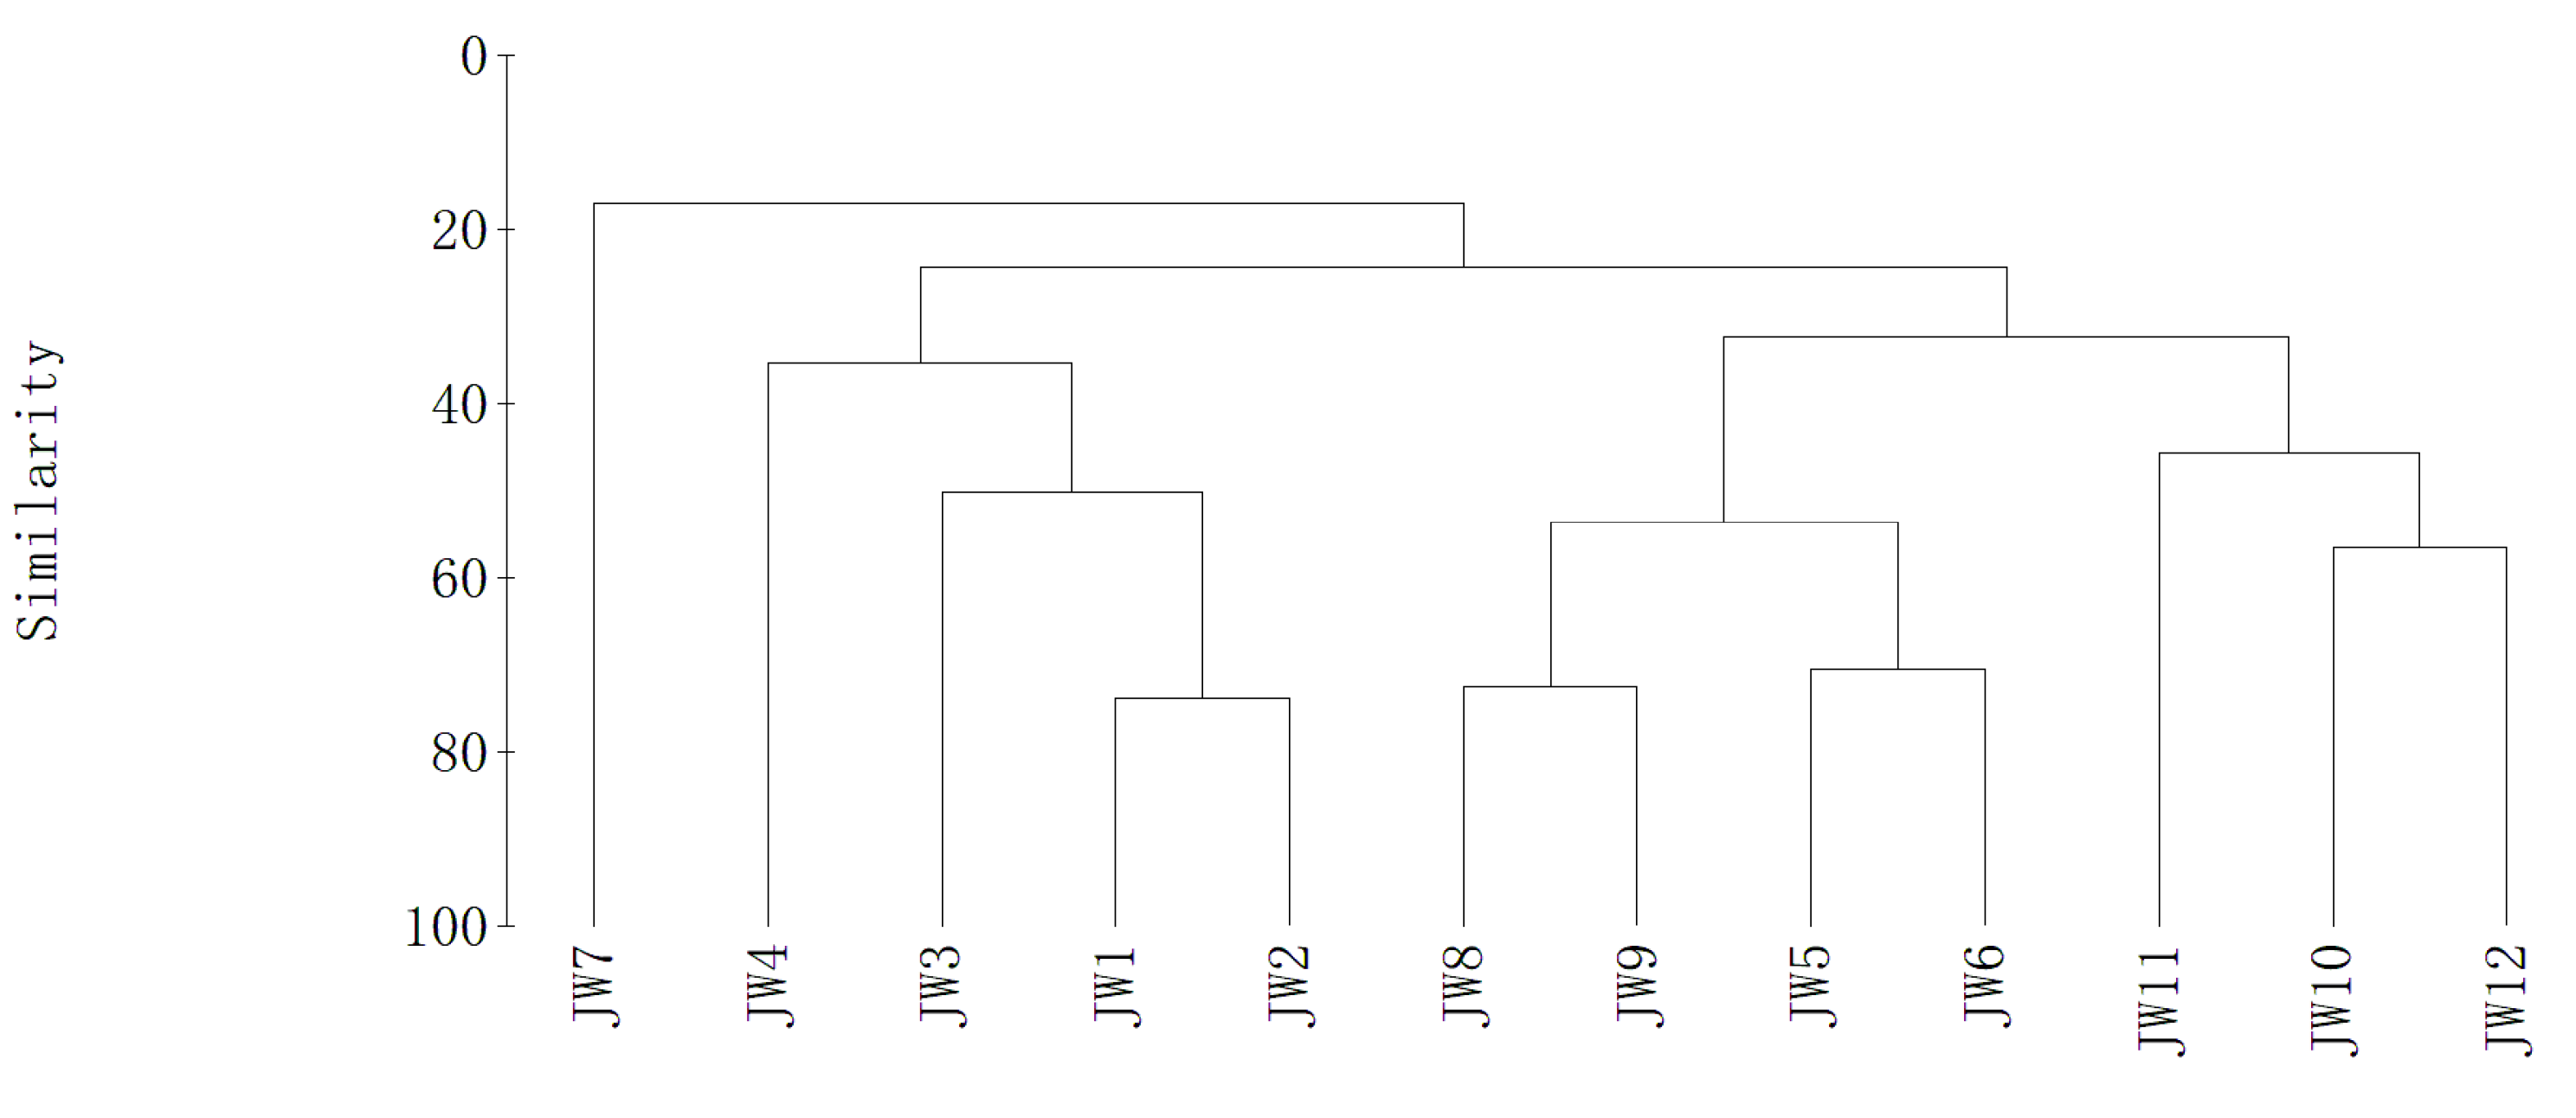
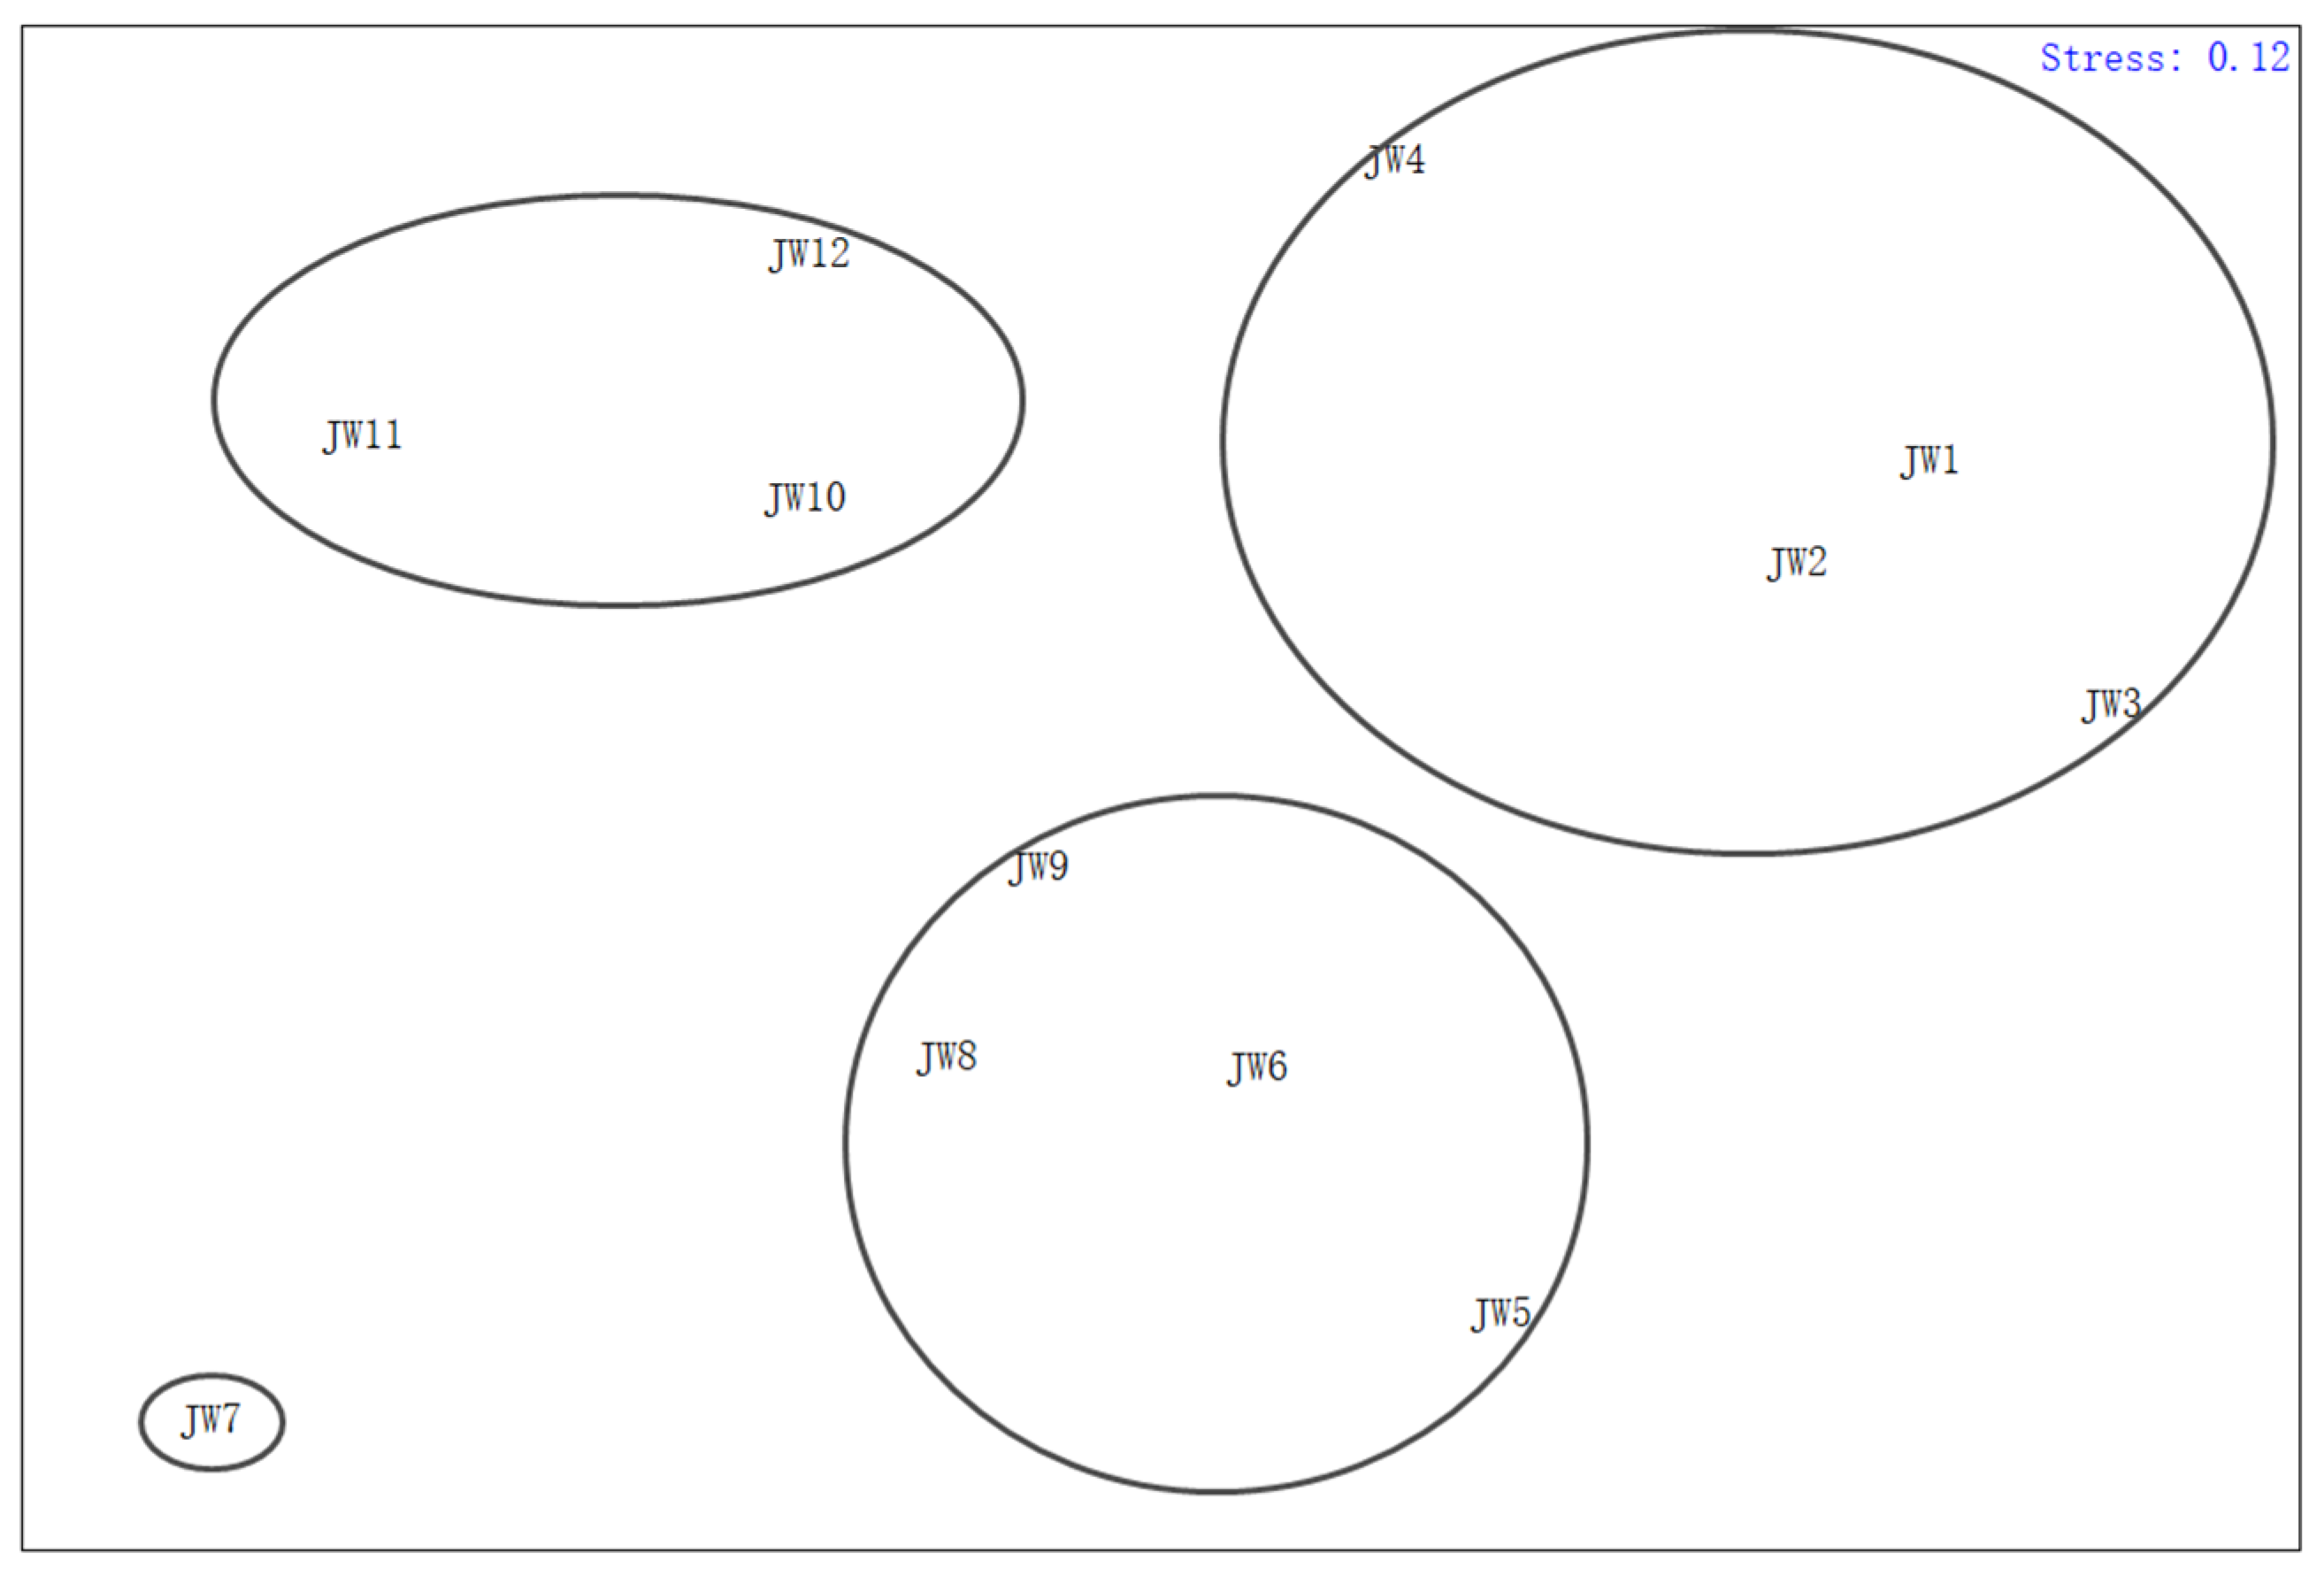
After analyzing the biomass inside and outside the reef area of Tangshan marine ranching in spring, it was obtained that the closer the stations were, the greater the similarity coefficient of the stations were. As can be seen from Figure 2 and Figure 3, the spring clustering of various stations within the reef area at a 38% similarity level can be divided into four groups, Group I (JN2, JN7 and JN15), Group II (JN1 and JN3), Group III (JN16 and JN20), and Group IV consisting of the remaining 13 stations within the reef. The stations outside the reef area clustered at 35% similarity level can be divided into four groups, namely Group I (JW5, JW6, JW8 and JW9), Group II (JW10, JW11 and JW12), Group III (JW1, JW2, JW3 and JW4), and Group IV (JW7). The two-dimensional scalar ranking plots conducted inside and outside the reef area showed a Stress value of 0.12, which proved that the results of the cluster analysis performed on the stations inside and outside the reef area were indicated with some interpretative significance, and the results of their cluster analysis could also be represented by the two-dimensional scalar ranking plots (Figure 4 and Figure 5).

3.5. ABC Curve

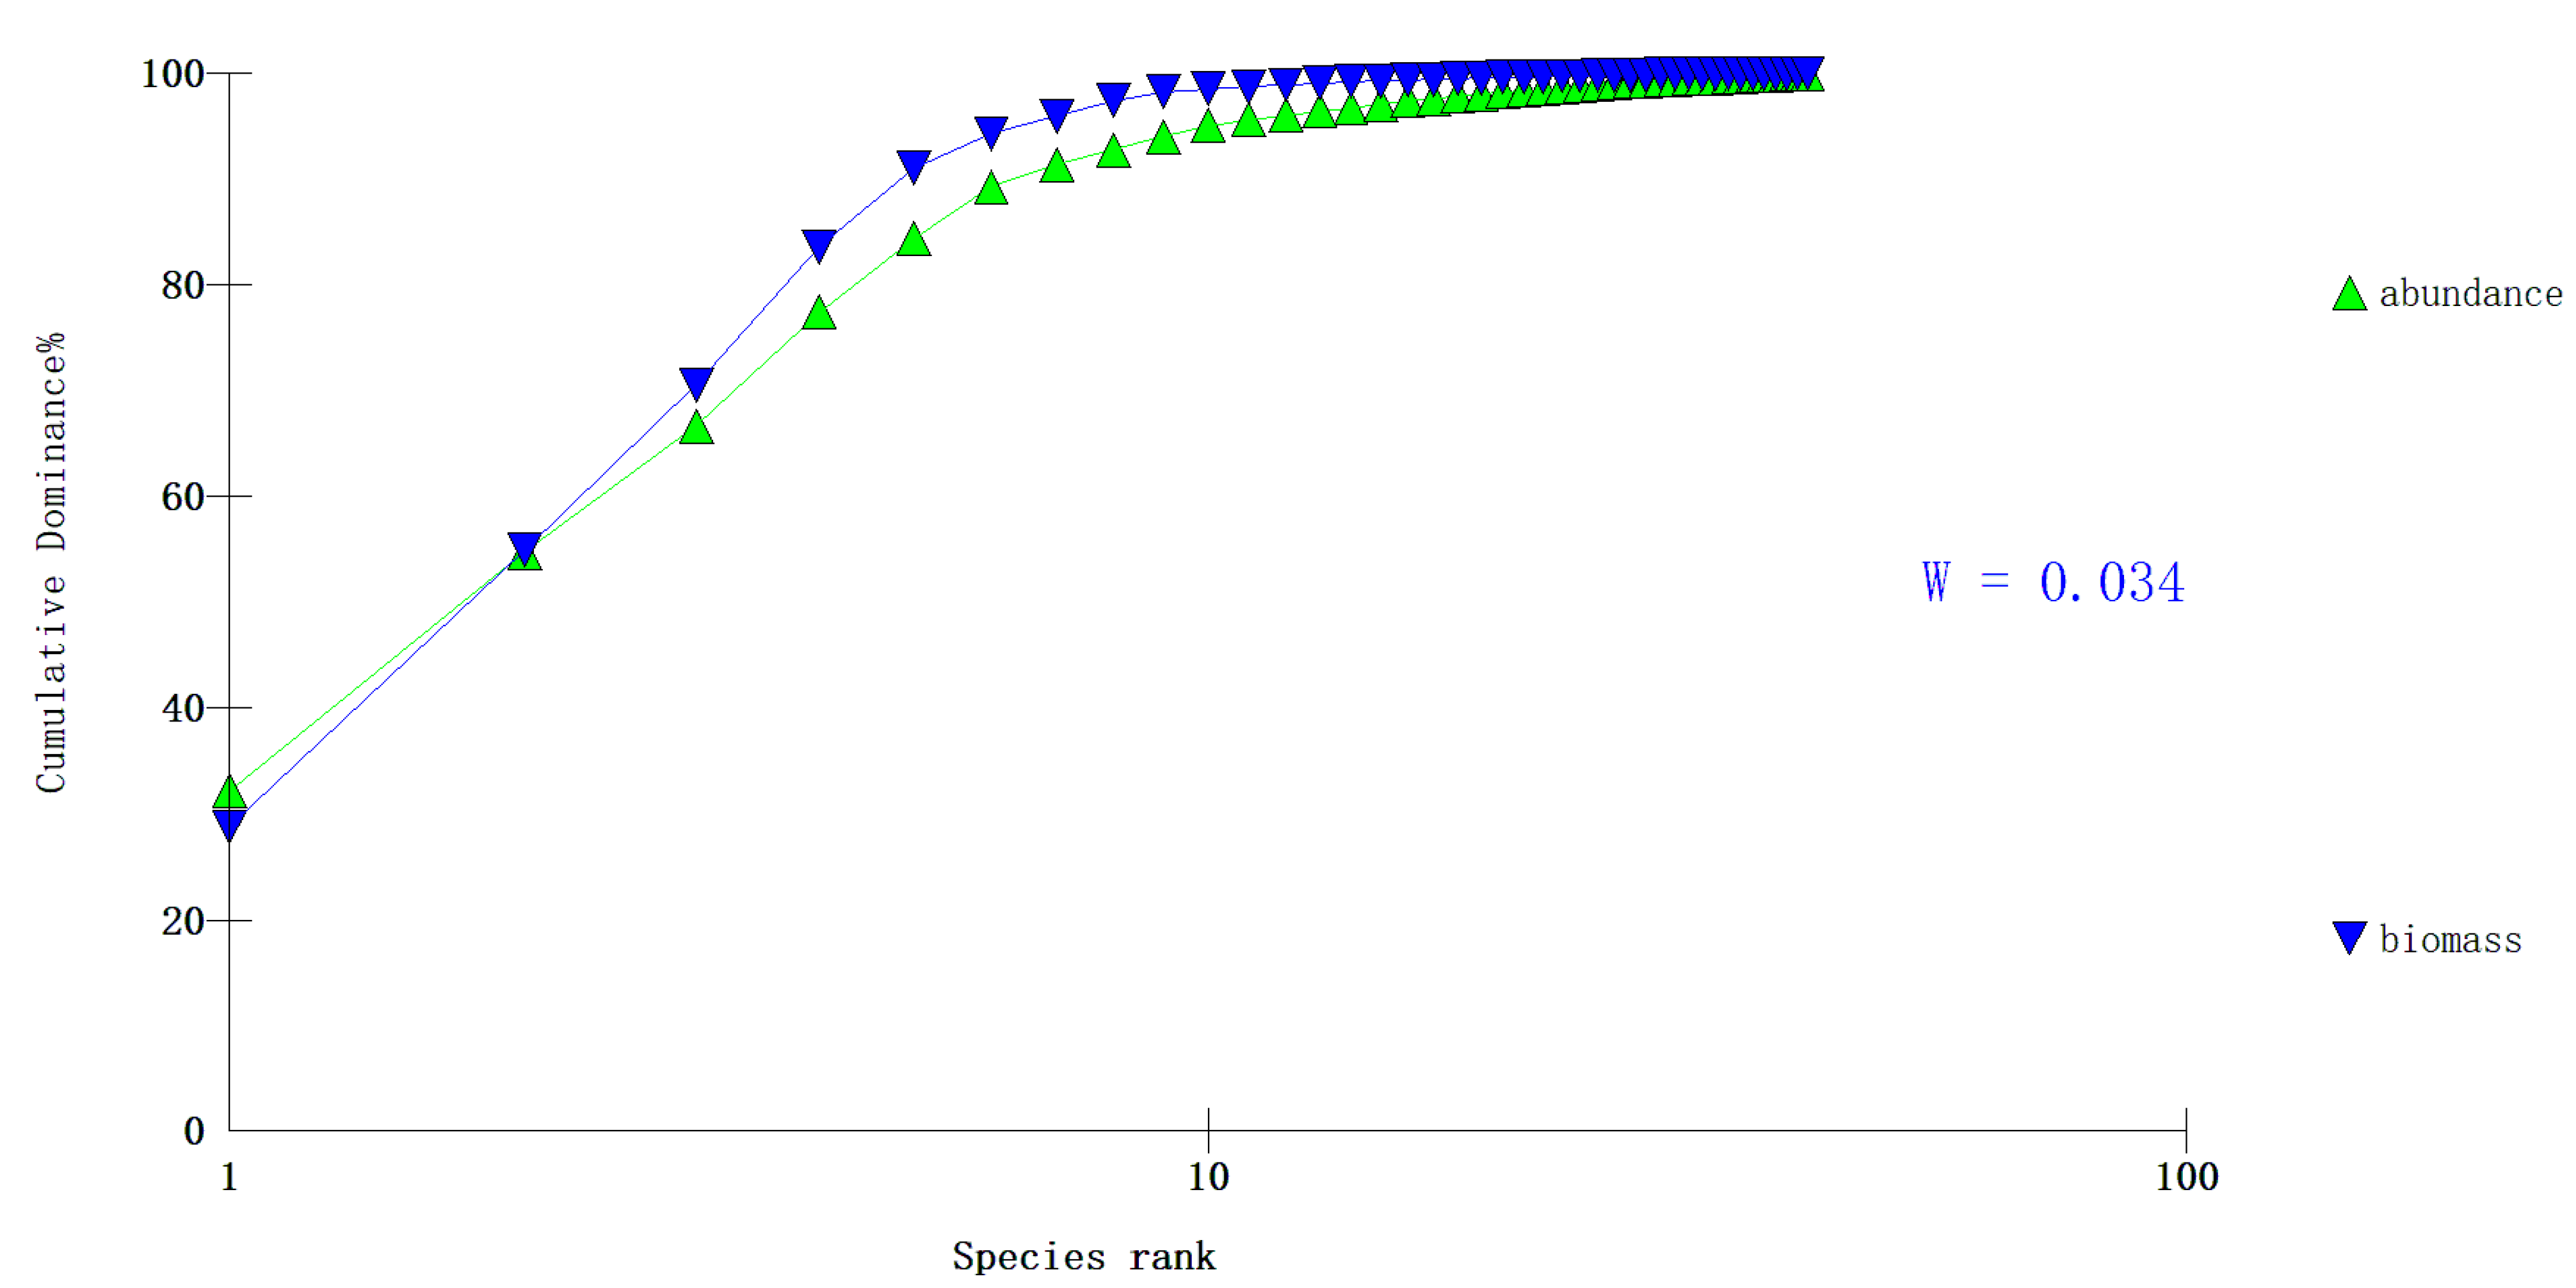
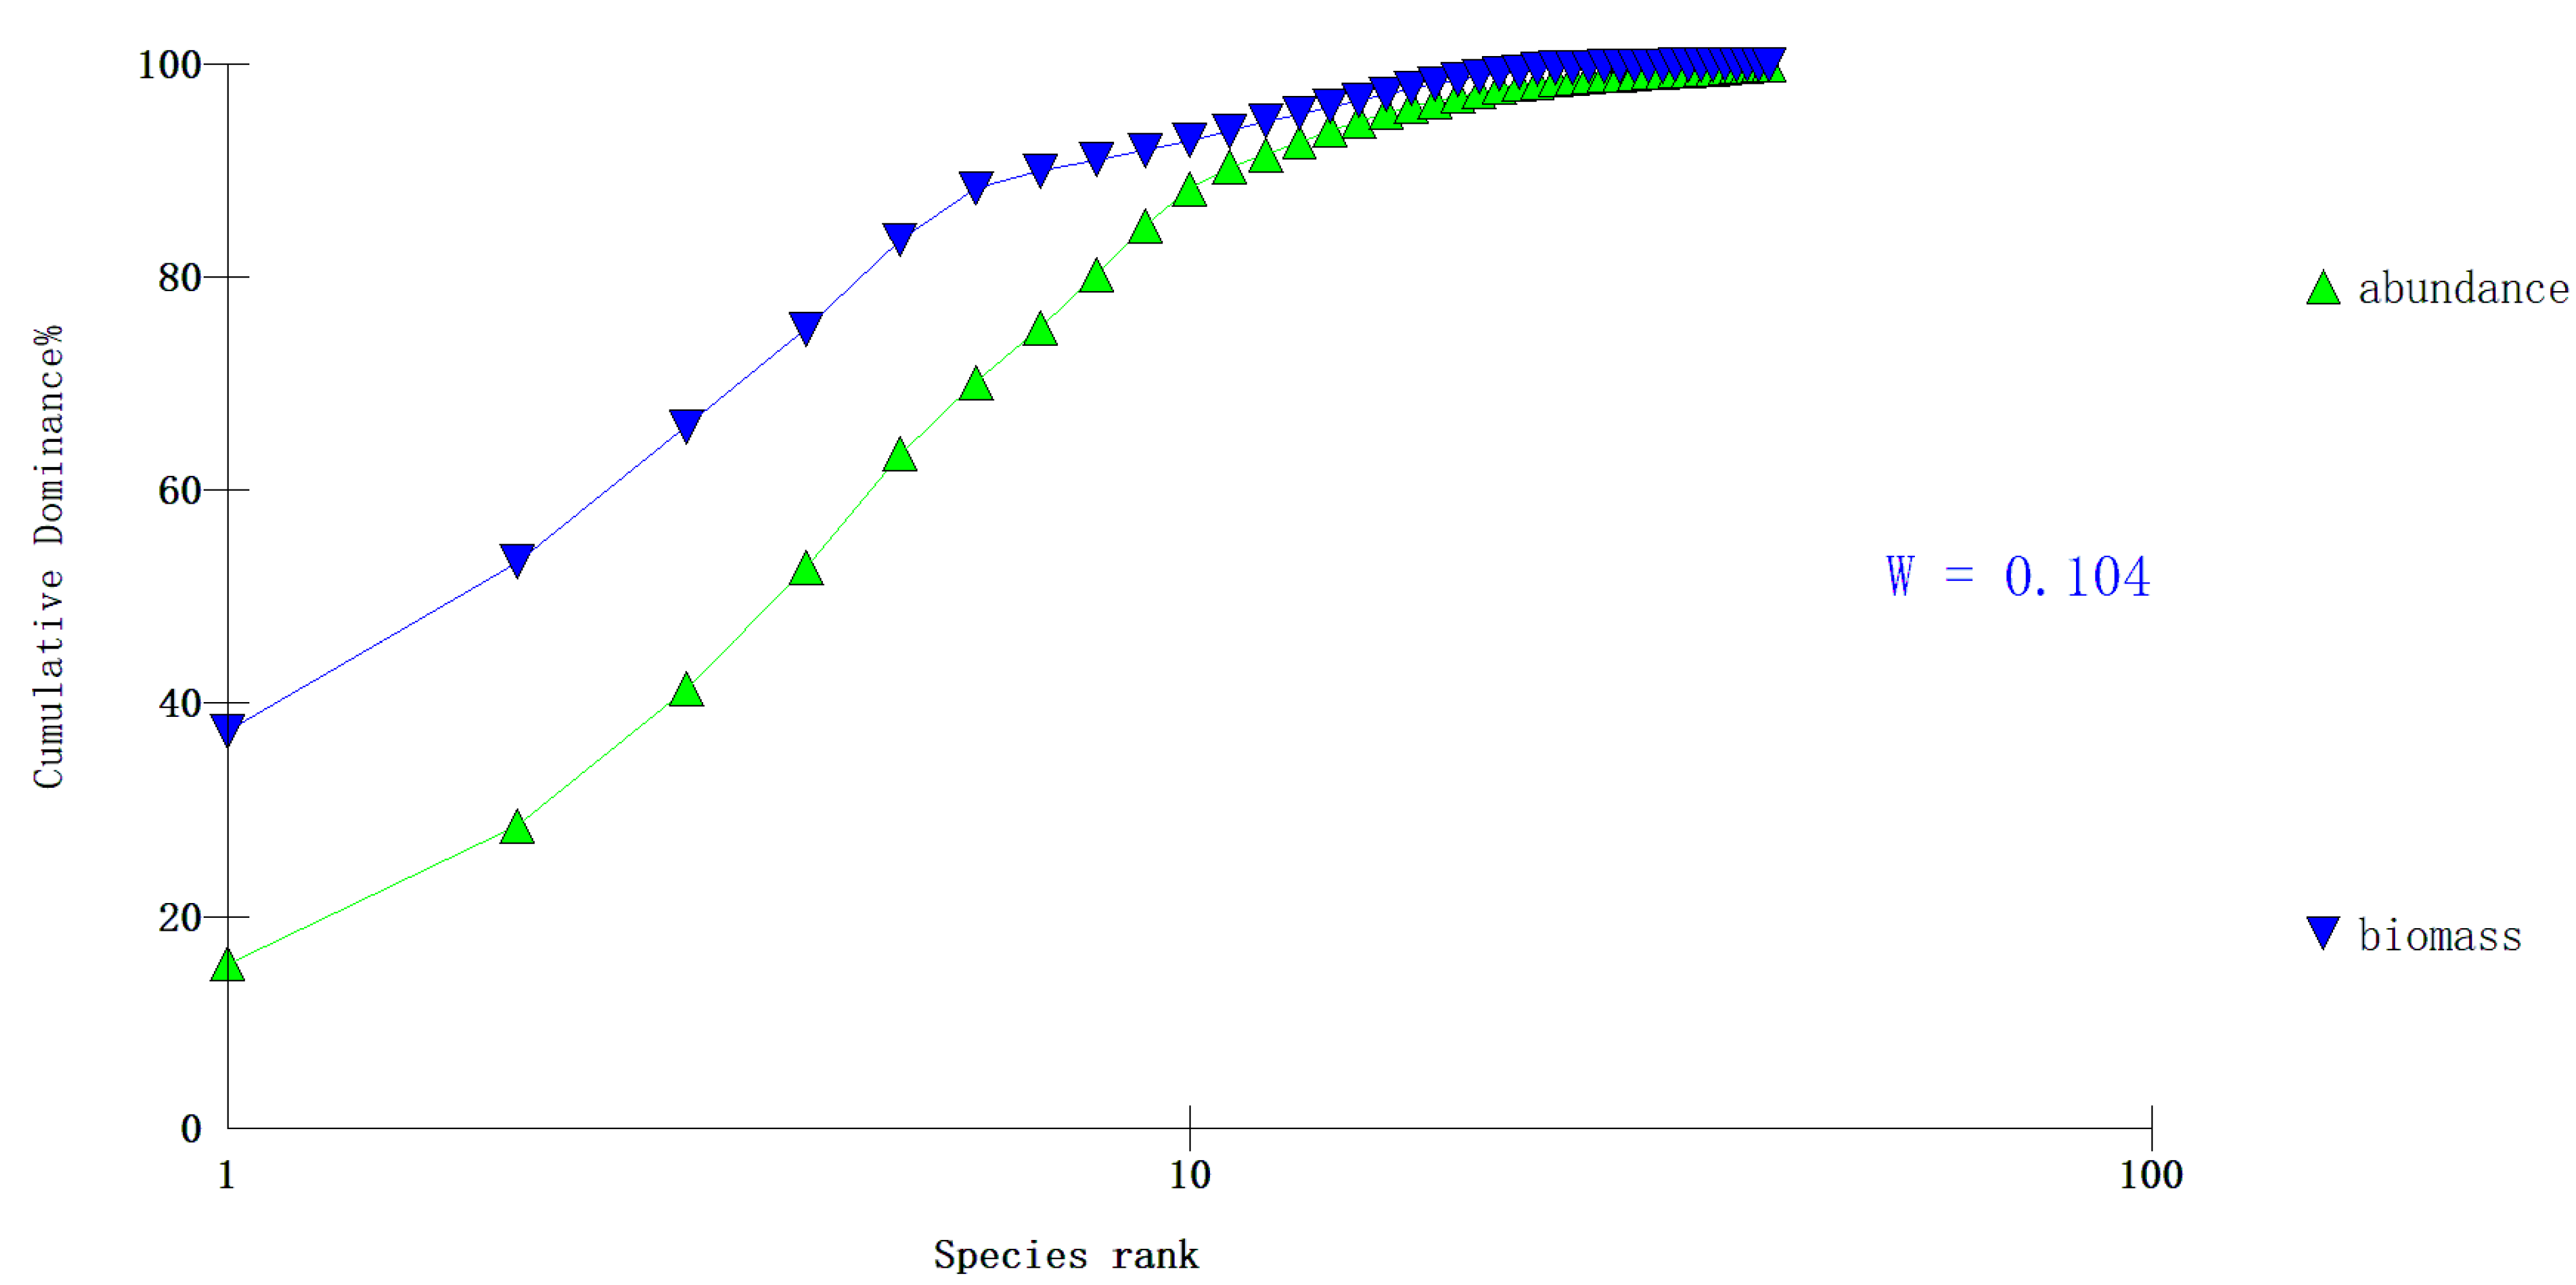
According to the ABC curve plotted by the proportion of biomass and abundance of each species in the total catch of the two areas inside and outside the reef area of Tangshan marine ranching in spring, the biomass curve was higher than the abundance curve in the ABC curve outside the reef area; the ABC curve inside the reef area was higher than the biomass curve first, and as the species rank increases, the abundance curve intersects with the biomass curve and the biomass curve started to be higher than the abundance curve. The biomass curve started to be higher than the abundance curve. The W values inside and outside the reef area were greater than 0. The W value outside the reef area was 0.104 and inside the reef area was 0.034, which indicated that the biological communities inside and outside the reef area were moderately disturbed, with the biological communities inside the reef area being more disturbed (Figure 6 and Figure 7).

3.6. Niche Breadth

According to Table 7 and Table 8, the niche width values in the reef area of Tangshan marine pasture in spring ranged from 0.02 to 5.06, with Charybdis japonica having the highest value and Trachidermus fasciatus (Heckel, 1837), Pisidia serratifrons (Stimpson, 1858), Chlorostoma rustica (Gmelin, 1928) having the lowest. There were 5 wide niche species, 2 medium ecotone species, and 34 narrow ecotone species. The niche width values in the control area outside the reef area in spring ranged from 0.02 to 2.73, with Asierias rollestoni having the largest ecotone width value and Cynoglossus joyneri (Günther, 1878) having the smallest. There were 2 brode niche species, 6 medium niche species, and 32 narrow niche species.

3.7. Niche Overlap

As shown in Table 9 and Table 10, the niche overlap of fishery species inside and outside the reef area of Tangshan marine ranching in spring was uneven, and the range of Q values was [0,1]. There were 25 pairs with high overlap in the reef area, accounting for 8.33% of the total number of pairs. The largest overlap value was 1 for the group of Takifugu niphobles (Jordan & Snyder, 1901) and Paralichthys olivaceus (Temminck & Schlegel, 1846), followed by 36 pairs of medium overlap, representing 12% of the total number of pairs, 239 pairs of low overlap, representing 79.67% of the total number of pairs, and 152 pairs with no overlap. Outside of the reef area, there were 27 pairs of highly overlapping pairs outside the reef area, accounting for 11.69% of the total number of pairs, among which the overlap value of two groups of ecological niches, Takifugu niphobles and Cynoglossus joyneri, Glossaulax didyma (Azuma, 1961) and Konosirus punctatus (Temminck & Schlegel, 1846), was the largest at 1, 27 pairs with medium overlap, representing 11.69% of the total number of pairs, 177 pairs with low overlap, representing 76.6% of the total number of pairs, and 108 pairs with no overlap.

4. Discussion

4.1. Species Composition Analysis

A total of 53 species were found in the survey inside and outside the reef area, including 41 species in the reef area and 40 species outside the reef area. Among them, 30 species of swimming animals were found in the reef area and 27 species of swimming animals were found outside the reef area. Most fish were benthic and reef fish, such as Sebastes schlegelii, Hexagrammos otakii. In addition, due to its proximity to the estuary, a small number of hygrosaline fish, such as Trachidermus fasciatus, Parachaeturichthys polynema, Tridentiger bifasciatus (Steindachner,1881), etc., can appear near the estuary.
Based on the spring survey of the Tangshan sea by Duxiao et al. in 2012, the dominant spring species in the Tangshan sea were Loligo japonica (Hoyle, 1885), Crangon affinis, Oratosquilla oratoria, which were both cephalopods and crustaceans [21]. The dominant species within a reef region were Charybdis japonica, Sebastes schlegelii, Asierias rollestoni, Rapana venosa, The preponderance of waters off reefs was Asierias rollestoni, Charybdis japonica, Palaemon gravieri, Hexagrammos otakii. From the comparison of the dominant species inside and outside the reef area, the relative importance index of Asierias rollestoni in the reef area was much lower than that outside the reef area, which objectively proves that due to the construction of the marine ranching, the Asierias rollestoni, which had a significant impact on the marine biological community. The status of the more dangerous creatures was slowly declining. Meanwhile, since Charybdis japonica was the main dominant species in the reef area, this organism can provide a rich food base for the whole ecosystem. The reason for this may be that the marine ranching are still in the early stage of construction due to the enhancement of prawns, crabs and fishes, which made creatures such as Sebastes schlegelii and Charybdis japonica occupy the main position of the biome for a short period. Overall, there had been harvest from marine pasture construction, the ecological status of this pest organism like the Asierias rollestoni had improved compared to control waters off reefs, and the abundance of bait organisms like the Charybdis japonica and Palaemon gravieri species selected by r will result in an abundance of bait communities on reefs compared to off reefs control waters, And thus improved the diversity of biological communities within a reef area so that species richness is higher and community structure is more stable.
In conclusion, due to the abundance of bait organisms such as crustaceans and shrimp in marine ranching, it is recommended that the enhancement on fishes with lower trophic grade may be increased appropriately, but that the amount of enhancement should be considered in order to avoid a situation in which the number of bait organisms decreases sharply as a result of excessive release.

4.2. Biome Diversity

The indexes of diversity are important indexes characterizing the community structure, and each index is mainly influenced by natural and human factors together [32]. By comparing the diversity of biological communities inside and outside the reef area of Tangshan marine ranching in spring, it was found that the biological communities inside and outside the reef area of Tangshan marine ranching were disturbed to different degrees in spring, and the values of H’ (diversity index), J (evenness index) and D (richness index) inside the reef area were lower than those outside the reef area. This indicated that the reef community was disturbed to a higher degree, while the biological species outside the reef were richer and more equally distributed. The results of this study contradicts the findings of Clark et al. (1999) [33] and Scott et al. (2015) [34] that the values of the biodiversity index indices within the reef area are higher than those outside the reef area. The main reasons for this are the artificial disturbance factors, such as the enhancement of shrimps, crabs, fish, etc., which increase the number of proliferating species in a short period of time, making the utilization of the enhancement species higher and more widely distributed. The placement of artificial reefs had caused physical disturbances to the living environment of organisms, such as the substrate environment under the influence of the flow field from the original small particle size of the sediment substrate to rock reefs and bigger particle size of sand, and the noise generated by an excessive number of vessels during the early stages of reef development.

4.3. Characteristics of Biome Structure

By cross-referencing the results of cluster analysis with NMDS analysis, it can be seen that the stations within the reef area in spring Tangshan sea can be divided into four groups at the level of similarity coefficient of 38%; the stations outside the reef area can also be divided into four groups at the level of similarity coefficient of 35%, and the clustering results are verified and analyzed by NMDS, and the two-dimensional dot plot ranking results of NMDS Stress value is 0.12, which means that the two-dimensional dot plot of NMDS The results have some interpretative significance and are acceptable. In general, the community structure inside and outside the reef area is relatively stable, and the reason for the higher species similarity within the reef area may be due to the fact that the marine ranching is in the early stage of construction, and the species was released in the reef area, which makes the r-selected species such as Charybdis japonica in the reef area reproduce and grow rapidly in the reef area, thus leading to the higher station similarity within the reef area [35].
The analysis of the ABC curve of this study showed that W > 0 inside and outside the reef area, which has been reduced by disturbance in this sea compared to the results of Du Xiao et al. (2012) (W < 0) [21]. This result indicated that the spring Tangshan marine ranching was disturbed to a moderate degree, and lower W values in the reefs than outside indicated greater disturbance in the reefs,,which was consistent with the biodiversity analysis. The reason for this could also be attributed to the fact that marine ranching was in the early stages of construction, which had an impact on the living environment of marine species, such as the impact of noise coming from ships and the impact of oil pollution on the habitat environment of organisms within the sea.

4.4. Niche Breadth and Niche Overlap

Niche breadth represents the utilization of environmental resources by biological populations. [36] From the niche breadth analysis of this study, there were more species in the reef area with a broad niche, such as Charybdis japonica and Sebastes schlegelii, Asierias rollestoni, and Rapana venosa were also dominant species in the reef area, and Charybdis japonica did not appear only at stations JN3 and JN15. The broad niche species Asierias rollestoni and Palaemon gravieri were all dominant species outside the reef area, and Asierias rollestoni did not appear only at station JW7. But not all of broad niche species were dominant, i.e., the relative importance index is not perfectly positively correlated with niche breadth, as Hexagrammos otakii fish in the reef area were the broad niche species but not the dominant species, and Hexagrammos otakii outside the reef area were with Charybdis japonica as the dominant species but not the broad niche species.
One aspect of understanding community structure is to measure the degree of overlap in resource use by different biological species in a biome [36]. Niche overlap can be used to analytically represent the potential competitive relationship between two species in a biome and the degree of similarity in their use of the environment and resources. However, the phenomenon of overlapping ecological niches does not necessarily indicate a competitive relationship between two species, but may also be a mutually coordinated symbiotic relationship, depending mainly on the amount of resources available to the two species.
The niche overlap value of of species with economic value in the reef area ranged from 0 to 1, and the distribution was uneven, which may be because the marine ranching were in the early stage of construction and the environment was more diversified. Among them, the niche overlap value of Takifugu niphobles and Paralichthys olivaceus (Temminck & Schlegel, 1846) is the largest at 1. Takifugu niphobles is a warm-temperature offshore fish, mainly inhabiting rocky reefs and sandy bottom waters, and Paralichthys olivaceus is a cold-temperature bottom fish, inhabiting the continental shelf waters with a sandy bottom. Both species have similar habitats and feed on crustaceans and other small fishes, and both occur only once at JN20 within the reef. The reason for such a high niche overlap may be due to the high overlap of their stations and similar living habits. The distribution of the niche overlap value of of species with economic value outside a reef region ranged from 0~1, among which the overlap value of Takifugu niphobles and Cynoglossus joyneri, Glossaulax didyma and Konosirus punctatus are the largest at 1. Both Takifugu niphobles and Cynoglossus joyneri are benthic fish, and both feed on crustaceans and small fish, and both only appear at station JW5 outside the reef, and the reasons for such a high niche overlap may be the result of the high overlap of their stations and similar habits. In the group of Glossaulax didyma and Konosirus punctatus, Glossaulax didyma is a carnivore inhabiting the bottom of the intertidal zone and mainly feeds on shellfish; Konosirus punctatus is a shallow-sea fish that mainly feeds on plankton; There was no obvious similarity inhabit, and both species only appeared in the JW11 staion. The reason for the higher ecological niche overlap value could be the high station overlap rate of the two species.
The fact that two species with a niche overlap value of 0 does not indicate that they are completely independent. For instance, Agrammus agrammus and Cynoglossus joyneri feed on crustaceans within the reef area, whereas Zoarces slongatus (Kner, 1868) and Cynoglossus joyneri feed on crustaceans outside the reef area. The reason may be that the scope of the investigation is limited, and the sampling amount is related to the differences in environmental resource occupied by species.

5. Conclusions

This study showed that there were sufficient bait organisms and that the biological community was relatively stable at the beginning of the construction of Tangshan Marine Ranching. Although disturbances to the biological community may have been caused by a variety of factors at the beginning of construction, the disturbances to the biological community are gradually decreasing, indicating that the ecological engineering construction of Tangshan Marine Ranching is taking shape.
It was suggested to modify the time of fishery enhancement target species such as Charybdis japonica, Sebastes schlegelii. The original time of fishery enhancement was September every year. According to the study by Xu, X.H et al. (2010) [37], the reproductive period of Charybdis japonica is from May to September, and the suitable water temperature is 17.5–23.5 °C, and the feeding quantity increases as the water temperature rises;so it was suggested that the enhancement time is from July to August in summer [38]. Sebastes schlegelii is an ovoviviparous fish that feeds on juveniles of the same species [39]. Therefore, the fishery enhancement can be considered in the summer months of July to August after the reproductive period to avoid feeding juveniles of the same species, which can diminish the effect of fishery resource enhancement.
By modifying the enhancement time to obtain better ecological benefits, the number of target enhancement species can reach a certain commercial scale sooner, which can result in greater economic benefits; however, the amount of stocking should not exceed the enhancement carrying capacity so as not to reduce the survival rate of target species and economic benefits due to intra-species competition.
Author Contributions

Data curation, J.L., M.X. and Y.Z.; Investigation, J.L., J.Y. and L.C.; Methodology, J.L.; Project administration, Z.Y.; Resources, Z.Y.; Software, J.L. and Z.W.; Supervision, Z.Y.; Visualization, J.L.; Writing—original draft, J.L.; Writing—review & editing, T.T. All authors have read and agreed to the published version of the manuscript.

Funding

This research was funded by National Key R&D Program of China grant number 2019YFD0901302.

Institutional Review Board Statement

The experimental protocols were approved by the Animal Care and Protection Committee of Dalian Ocean University.

Informed Consent Statement

Not applicable.

Data Availability Statement

The data presented in this study are available on request from the corresponding author.

Conflicts of Interest

The authors declare no conflict of interest.

References

  1. Yang, H. Review and Prospect of Marine Ranch Construction in my country. Chin. J. Fish. 2016, 40, 1133–1140. [Google Scholar]
  2. Muawanah, U.; Pomeroy, R.S.; Marlessy, C. Revisiting fish wars: Conflict and collaboration over fisheries in Indonesia. Coast. Manag. 2012, 40, 279–288. [Google Scholar] [CrossRef]
  3. Asha, C.V.; Suson, P.S.; Retina, C.I.; Nandan, S.B. Decline in diversity and production of exploited fishery resources in Vembanad wetland system: Strategies for better management and conservatison. Open J. Mar. Sci. 2014, 4, 344. [Google Scholar] [CrossRef]
  4. Israel, D.; Gallo, C.; Angel, D.L. Benthic artificial reefs as a means to reduce the environmental effects of cod mariculture in Skutulsfjörður, Iceland. Mar. Biodivers. 2017, 47, 405–411. [Google Scholar] [CrossRef]
  5. Luiyi, H.; Hui, C.; Yanli, T.; Qian, Y.; Xinxin, W. Comparison of three ways to assess the influence range of different artificial reefs. Int. J. Eng. Technol. 2017, 9, 105. [Google Scholar] [CrossRef] [Green Version]
  6. Walker, B.K.; Henderson, B.; Spieler, R.E. Fish assemblages associated with artificial reefs of concrete aggregates or quarry stone offshore Miami Beach, Florida, USA. Aquat. Living Resour. 2002, 15, 95–105. [Google Scholar] [CrossRef]
  7. Diamant, A.; Tuvia, A.; Baranes, A.; Golani, D. An analysis of rocky coastal eastern Mediterranean fish assemblages and a comparison with an adjacent small artificial reef. J. Exp. Mar. Biol. Ecol. 1986, 97, 269–285. [Google Scholar] [CrossRef]
  8. Rilov, G.; Benayahu, Y. Vertical artificial structures as an alternative habitat for coral reef fishes in disturbed environments. Mar. Environ. Res. 1998, 45, 431–451. [Google Scholar] [CrossRef]
  9. Santos, M.N.; Monteiro, C.C. Comparison of the catch and fishing yield from an artificial reef system and neighbouring areas off Faro (Algarve, South Portugal). Fish. Res. 1998, 39, 55–65. [Google Scholar] [CrossRef]
  10. Santos, M.N.; Monteiro, C.C. The Olhao artificial reef system (south Portugal): Fish assemblages and fishing yield. Fish. Res. 1997, 30, 33–41. [Google Scholar] [CrossRef]
  11. Du, Y.W.; Jiang, J.; Li, C.H. Ecological efficiency evaluation of marine ranching based on the Super-SBM model: A case study of Shandong. Ecol. Indic. 2021, 131, 108174. [Google Scholar] [CrossRef]
  12. Yu, H.; Wang, Y.; Yin, W.; Li, D. Policy network analysis of China’s ocean ranching policy: Network structure, actors and interaction. Marine Policy 2022, 140, 105070. [Google Scholar] [CrossRef]
  13. Jin, X. Research on the change of main fishery biological resources in the Bohai Sea. China Fish. Sci. 2000, 4, 22–26. [Google Scholar]
  14. Jin, X.; Tang, Q. The structure, quantity distribution and changes of fishery resources in the Bohai Sea. China Fish. Sci. 1998, 3, 19–25. [Google Scholar]
  15. Yu, S.; Wang, Y.; Han, X.; Zhang, Y.; Lai, H.; Zhang, K.; Zhang, L.; Shui, B. Changes in community structure and trophic level characteristicsof fisheries organisms in Sanmen Bay waters. J. Dalian Ocean Univ. 2021, 36, 478–487. [Google Scholar]
  16. Li, T.; Zhang, X.; Zhang, P.; Huang, G. Seasonal Variation on Community Structure of Fishery Resources in the Coastal Waters of Southern Shandong Peninsular. J. Ocean Univ. China Nat. Sci. Ed. 2011, 41, 41–50. [Google Scholar]
  17. Liu, X.; Dong, J.; Yu, X.; Sun, M.; Wang, B.; Wang, X. Fishery resource structure in coastal waters of Liaoning Province. Mar. Fish. 2014, 36, 289–299. [Google Scholar]
  18. Zhang, R.; Liu, H.; Sun, D.; Hou, Z.; Zhao, J. Characteristics of Benthic Fishery Community at Natural Ree and Ariticfical Reefs Located in Yantai Offshore Area. Ocean Lakes 2021, 52, 697–707. [Google Scholar]
  19. Li, C.W.; Cui, L.T. Changes in nutrient salts and their structure in the nearshore waters of Tangshan Bay under the influence of human activities. J. Appl. Ecol. 2016, 27, 307–314. [Google Scholar] [CrossRef]
  20. Yin, Z. Estimating Ecological Carrying Capacity and Management of Enhancement Species in Tangshan Marine Ecosytem (Bohai Sea, China) Based on Ecosystem Model. Available online: https://www.grocentre.is/static/gro/publication/689/document/Zengqiang18prf.pdf (accessed on 24 April 2022).
  21. Du, X.; Han, Z.; Wang, Y.; Xu, H.; Zheng, W.; Wang, F.; Hu, C.; Li, L.; Shui, B. Study on the community diversity of fisheries resources in Tangshan Bay. Chin. J. Fish. 2014, 38, 697–705. [Google Scholar]
  22. Shannon, C.E.; Weaver, W. The Mathematical Theory of Communication; University of Illinois Press: Champaign, IL, USA, 1948. [Google Scholar]
  23. Pielou, C. Mathematical Ecology; Wiley: New York, NY, USA, 1977. [Google Scholar]
  24. Roughgarden, J.; May, R.M.; Levin, S.A. (Eds.) Perspectives in Ecological Theory; Princeton University Press: Princeton, NJ, USA, 2014; Volume 986. [Google Scholar]
  25. Pinkas, L. Food habits of albacore, bluefin tuna and bonito in California waters. Calif. Dept. Fish Game Fish Bull. 1971, 152, 1–105. [Google Scholar]
  26. Zhu, X.; Tang, Q. Structuring dominant components within fish community in Bohai Sea system. Studia Mar. Sinica 2002, 44, 159–168. [Google Scholar]
  27. Khalaf, M.A.; Kochzius, M. Change in trophic community structure of macrobenthic fauna in subtidalareas of the Yangtze River Estuary in spring. Zool. Res. 2007, 28, 47–52. [Google Scholar]
  28. Clarke, K.R.; Gorley, R.N.; Somerfield, S.J.; Warwick, R.M. Change in Marine Communities: An Approach to Statistical Analysis and Interpretation; PRIMER-E, Ltd.: Plymouth, UK, 2014. [Google Scholar]
  29. Warwick, R.M. A new method for detecting pollution effects on marine macrobenthic communities. Mar. Biol. 1986, 92, 557–562. [Google Scholar] [CrossRef]
  30. Pianka, E.R. The structure of lizard communities. Annu. Rev. Ecol. Syst. 1973, 4, 53–74. [Google Scholar] [CrossRef] [Green Version]
  31. Wathne, J.A.; Haug, T.; Lydersen, C. Prey preference and niche overlap of ringed seals Phoca hispida and harp seals P. groenlandica in the Barents Sea. Mar. Ecol. Prog. Ser. 2000, 194, 233–239. [Google Scholar] [CrossRef]
  32. Washington, H.G. Diversity, biotic and similarity indices: A review with special relevance to aquatic ecosystems. Water Res. 1984, 18, 653–694. [Google Scholar] [CrossRef]
  33. Clark, S.; Edwards, A.J. An evaluation of artificial reef structures as tools for marine habitat rehabilitation in the Maldives. Aquat. Conserv. Mar. Freshw. Ecosyst. 1999, 9, 5–21. [Google Scholar] [CrossRef]
  34. Scott, M.E.; Smith, J.A.; Lowry, M.; Taylor, M.D. The influence of an offshore artificial reef on the abundance of fish in the surrounding pelagic environment. Mar. Freshw. Res. 2015, 66, 429–437. [Google Scholar] [CrossRef]
  35. Li, H.M.; Cai, L.Z.; Lin, L.Z.; Yao, J.B. Hierarchical clustering and non-metric multidimensional scalar ranking of benthic community structure in the intertidal zone of Shenzhen Bay. J. Xiamen Univ. Nat. Sci. Ed. 2001, 3, 735–740. [Google Scholar]
  36. Staudinger, M.D.; McAlarney, R.J.; McLellan, W.A.; Pabst, D.A. Foraging ecology and niche overlap in pygmy (Kogia breviceps) and dwarf (Kogia sima) sperm whales from waters of the US mid-Atlantic coast. Mar. Mammal Sci. 2014, 30, 626–655. [Google Scholar] [CrossRef]
  37. Xu, X.H.; Yan, B.L.; Zheng, J.S.; Xu, J.T.; Xu, G.C.; Wu, J.X. Study on the development of sex gland and reproductive cycle of Charybdis Japonica (A. Milne-Edwards). Trans. Oceanol. Limnol. 2010, 2, 29–36. [Google Scholar]
  38. Cungen, Y.; Haitang, S.; Guangzhan, Y. The quantity distribution and biological property of Charybdis japonica in the East China Sea. J. Shanghai Fish. Univ. 2005, 14, 40–45. [Google Scholar]
  39. Chin, B.S.; Nakagawa, M.; Noda, T.; Wada, T.; Yamashita, Y. Determining optimal release habitat for black rockfish, Sebastes schlegelii: Examining growth rate, feeding condition, and return rate. Rev. Fish. Sci. 2013, 21, 286–298. [Google Scholar] [CrossRef]
Figure 1. Fishery resources investigation stations in Tangshan marine ranching. Note: JN stands for the station within the artificial reef area, while JW stands for the station outside the artificial reef area.
Sustainability 14 06999 g001
Figure 2. Cluster analysis of communities in the reef.
Sustainability 14 06999 g002
Figure 3. Cluster analysis of communities outside the reef area.
Sustainability 14 06999 g003
Figure 4. Non-metric multidimensional scaling map of communities in the reef area.
Sustainability 14 06999 g004
Figure 5. Non-metric multidimensional scaling map of communities outside the reef area.
Sustainability 14 06999 g005
Figure 6. ABC curve in the reef area of Tangshan marine ranching.
Sustainability 14 06999 g006
Figure 7. ABC curve outside the reef area of Tangshan marine ranching.
Sustainability 14 06999 g007
Table 1. A summary of organisms inside and outside the reef area. (Note: “●” Indicates that the species has appeared in this area).
PhylumSpecies NameWithinOutsidePhylumSpecies NameWithinOutside
ChordataSebastes schlegeliiArthropodPalaemon gravieri
Chaeturichthys stigmatiasAlpheus japonicus
Parachaeturichthys polynemaCrangon affinis
Hexagrammos otakiiLeptochela gracilis
Agrammus agrammus Lysmata vittata
Chirolophis japonicus Acetes chinensis
Ernogrammus hexagrammus Charybdis japonica
Zoarces slongatus nipponensis
Enedrias fangiEucrate alcocki
Tridentiger barbatusEucrate crenata
Tridentiger bifasciatus Diogenes edwardsii
Tridentiger trigonocephalusDorippe japonica
Trachidermus fasciatus Xanthidae
Konosirus punctatus Pisidia serratifrons
Platycephalus indicus Oratosquilla oratoria
Cynoglossus joyneri Sphaeroma
Takifugu niphoblesMolluskRapana venosa
Cynoglossus joyneriNassarius variciferus
Paralichthys olivaceus Nassarius siquijorensis
Acanthogobius elongata Glossaulax didyma
EchinodermataAsierias rollestoniChlorostoma rustica
Amphiura vadicola Nassarius succinctus
Temnopleurus hardwickiiOctopus variabilis
Caudina similisOctopus ocellatus
Apostichopus japonicus Scapharca broughtonii
AnnelidNereis succineaLeionucula tenuis
CnidariaActiniaria
Table 2. Diversity index within and outside the artificial reef area.
RegionShannon-Weaver Diversity Index (H’)
X ± SDMaximumMinimum
within1.34 ± 0.372.090.65
outside1.69 ± 0.372.221.17
Table 3. Evenness index inside and outside artificial reef area.
RegionPielou’s Evenness Index (J)
X ± SDMaximumMinimum
within0.67 ± 0.130.860.45
outside0.73 ± 0.110.860.53
Table 4. Richness indexes inside and outside artificial reef area.
RegionMargalef Richness Index (D)
X ± SDMaximumMinimum
within1.62 ± 0.773.490.74
outside2.18 ± 0.693.231.04
Table 5. Relative importance index of organisms in the reef area.
Species|R|Species|R|
Charybdis japonica4625.22Alpheus japonicus2.3
Sebastes schlegelii4368.5Apostichopus japonicus2.11
Asierias rollestoni1548.31Tridentiger bifasciatus1.77
Rapana venosa1541.62Scapharca broughtonii1.76
Hexagrammos otakii860.89Agrammus agrammus1.12
Palaemon gravieri429.76Leptochela gracilis0.98
Chaeturichthys stigmatias156.64Acetes chinensis0.74
Octopus ocellatus88.23Paralichthys olivaceus0.61
Oratosquilla oratoria56.05Tridentiger barbatus0.61
Lysmata vittata41.44Glossaulax didyma0.48
Octopus variabilis30.79Takifugu niphobles0.47
Enedrias fangi12.2Parachaeturichthys polynema0.44
Diogenes edwardsii8.39Cynoglossus joyneri0.39
Tridentiger barbatus6.87Trachidermus fasciatus0.36
Chirolophis japonicus5.64Dorippe japonica0.34
Ernogrammus hexagrammus4.12Temnopleurus hardwickii0.31
Caudina similis3.99Eucrate crenata0.29
Crangon affinis3.76Pisidia serratifrons0.25
Nassarius variciferus3.48Amphiura vadicola0.25
Pugettia nipponensis3.3Chlorostoma rustica0.25
Nereis succinea3.24
Table 6. Relative importance index of organisms outside reef area.
Species|R|Species|R|
Asierias rollestoni4614.22Cynoglossus joyneri8.32
Charybdis japonica1702.12Nassarius variciferus6.72
Palaemon gravieri1239.1Octopus variabilis5.45
Hexagrammos otakii1074.88Zoarces slongatus4.66
Sebastes schlegelii974.66Nereis succinea4.15
Leptochela gracilis768.28Nassarius succinctus3.39
Lysmata vittata556.38Nassarius siquijorensis2.76
Diogenes edwardsii374.07Cynoglossus joyneri2
Chaeturichthys stigmatias260.53Glossaulax didyma1.4
Crangon affinis249.5Leionucula tenuis1.35
Rapana venosa239.78Temnopleurus hardwickii1.29
Alpheus japonicus233.78Eucrate alcocki0.93
Tridentiger barbatus99.61Actiniaria0.85
Oratosquilla oratoria69.73Konosirus punctatus0.84
Parachaeturichthys polynema39.26Dorippe japonica0.83
Platycephalus indicus29.08Acanthogobius elongata0.79
Pugettia nipponensis23.04Tridentiger trigonocephalus0.76
Caudina similis14.71Xanthidae0.74
Enedrias fangi12.83Sphaeroma0.66
Takifugu niphobles11.37
Table 7. Niche breadth in the reef area.
No.SpeciesNiche BreadthNo.SpeciesNiche Breadth
1Charybdis japonica5.0622Chirolophis japonicus0.13
2Sebastes schlegelii4.2823Ernogrammus hexagrammus0.12
3Asierias rollestoni3.4424Acetes chinensis0.11
4Rapana venosa2.5925Agrammus agrammus0.09
5Hexagrammos otakii2.426Apostichopus japonicus0.08
6Palaemon gravieri1.4627Tridentiger trigonocephalus0.08
7Chaeturichthys stigmatias1.0128Paralichthys olivaceus0.07
8Octopus ocellatus0.8829Dorippe japonica0.07
9Oratosquilla oratoria0.8330Takifugu niphobles0.07
10Lysmata vittata0.6531Glossaulax didyma0.07
11Enedrias fangi0.4632Scapharca broughtonii0.06
12Diogenes edwardsii0.3833Leptochela gracilis0.06
13Crangon affinis0.3434Amphiura vadicola0.06
14Tridentiger barbatus0.3235Parachaeturichthys polynema0.05
15Octopus variabilis0.2536Eucrate crenata0.04
16Nereis succinea0.2237Temnopleurus hardwickii0.04
17Alpheus japonicus0.2238Cynoglossus joyneri0.03
18Caudina similis0.239Trachidermus fasciatus0.02
19Nassarius variciferus0.1840Pisidia serratifrons0.02
20Pugettia nipponensis0.1841Chlorostoma rustica0.02
21Tridentiger bifasciatus0.15
Table 8. The outside of the reef niche breadth.
No.SpeciesNiche BreadthNo.SpeciesNiche Breadth
1Asierias rollestoni2.7321Tridentiger trigonocephalus0.16
2Palaemon gravieri2.7322Nassarius succinctus0.14
3Charybdis japonica1.6323Glossaulax didyma0.1
4Hexagrammos otakii1.624Zoarces slongatus0.09
5Leptochela gracilis1.4825Takifugu niphobles0.09
6Diogenes edwardsii1.3926Nassarius siquijorensis0.08
7Lysmata vittata1.1327Eucrate alcocki0.07
8Crangon affinis1.1228Acanthogobius elongata0.07
9Alpheus japonicus0.9729Platycephalus indicus0.13
10Chaeturichthys stigmatias0.7530Leionucula tenuis0.07
11Sebastes schlegelii0.6231Dorippe japonica0.06
12Tridentiger barbatus0.5132Konosirus punctatus0.06
13Oratosquilla oratoria0.4933Xanthidae0.06
14Rapana venosa0.3434Temnopleurus hardwickii0.04
15Parachaeturichthys polynema0.3135Actiniaria0.04
16Nassarius variciferus0.2336Sphaeroma0.04
17Pugettia nipponensis0.2137Cynoglossus joyneri0.04
18Caudina similis0.1938Octopus variabilis0.03
19Enedrias fangi0.1839Cynoglossus joyneri0.02
20Nereis succinea0.16
Table 9. Niche overlap index of fishery resources with economic value in the reef area of Tangshan marine ranching.
NO.A1A2A3A4A5A6A7A8A9A10A11A12A13A15A16A17A18A19A20A21A22A23A24
A20.00
A30.000.00
A40.09 0.02 0.00
A50.00 0.00 0.00 0.14
A60.00 0.00 0.00 0.16 0.00
A70.58 0.00 0.00 0.13 0.00 0.00
A80.01 0.87 0.00 0.03 0.00 0.00 0.16
A90.00 0.45 0.00 0.05 0.00 0.00 0.00 0.00
A100.00 0.00 0.00 0.03 0.00 0.00 0.77 0.19 0.00
A110.33 0.00 0.00 0.10 0.00 0.00 0.71 0.16 0.00 0.67
A120.00 0.89 0.00 0.00 0.00 0.00 0.00 0.98 0.00 0.00 0.00
A130.00 0.38 0.51 0.06 0.00 0.00 0.02 0.01 0.86 0.00 0.03 0.00
A140.00 0.32 0.00 0.34 0.10 0.00 0.00 0.00 0.71 0.00 0.00 0.00 0.61
A150.00 0.00 0.00 0.64 0.18 0.00 0.08 0.03 0.00 0.00 0.00 0.00 0.02
A160.00 0.31 0.21 0.20 0.09 0.59 0.03 0.01 0.69 0.02 0.02 0.00 0.70 0.07
A170.33 0.00 0.16 0.32 0.02 0.00 0.36 0.09 0.00 0.00 0.38 0.00 0.15 0.47 0.06
A180.58 0.00 0.00 0.45 0.09 0.00 0.44 0.05 0.00 0.00 0.19 0.00 0.03 0.47 0.07 0.66
A190.01 0.35 0.17 0.58 0.27 0.18 0.08 0.24 0.31 0.06 0.04 0.23 0.36 0.62 0.55 0.15 0.19
A200.00 0.00 0.00 0.49 0.15 0.00 0.00 0.00 0.00 0.00 0.00 0.00 0.00 0.41 0.10 0.00 0.58 0.30
A210.00 0.85 0.00 0.01 0.00 0.00 0.24 0.99 0.00 0.32 0.21 0.95 0.00 0.00 0.01 0.00 0.00 0.24 0.00
A220.00 0.00 0.00 0.03 0.00 0.00 0.77 0.19 0.00 1.000.67 0.00 0.00 0.00 0.02 0.00 0.00 0.06 0.00 0.32
A230.07 0.02 0.07 0.90 0.16 0.24 0.06 0.01 0.05 0.00 0.03 0.00 0.09 0.64 0.32 0.19 0.50 0.63 0.72 0.00 0.00
A240.00 0.00 0.00 0.26 0.00 0.69 0.13 0.05 0.00 0.00 0.00 0.00 0.03 0.28 0.49 0.56 0.40 0.17 0.00 0.00 0.00 0.26
A250.00 0.00 0.00 0.02 0.00 0.00 0.00 0.01 0.00 0.00 0.00 0.00 0.00 0.00 0.26 0.00 0.00 0.20 0.00 0.00 0.00 0.17 0.23
Notes: A1: Agrammus agrammus; A2: Apostichopus japonicus; A3: Glossaulax didyma; A4: Hexagrammos otakii; A5:Octopus ocellatus; A6: Cynoglossus joyneri; A7: Enedrias fangi; A8: Palaemon gravieri; A9: Temnopleurus hardwickii; A10: Paralichthys olivaceus; A11: Crangon affinis; A12: Leptochela gracilis; A13: Oratosquilla oratoria; A14: Scapharca broughtonii; A15: Ernogrammus hexagrammus; A16: Rapana venosa; A17: Chaeturichthys stigmatias; A18: Chirolophis japonicus; A19: Charybdis japonica; A20: Trachidermus fasciatus; A21: Caudina similis; A22: Takifugu niphobles; A23: Sebastes schlegelii; A24: Octopus variabilis; A25: Acetes chinensis.
Table 10. Niche overlap index of fishery resources with economic value outside the reef area of Tangshan marine ranching.
NO.B1B2B3B4B5B6B7B8B9B10B11B12B13B14B15B16B17B18B19B20B21
B20.26
B30.010.80
B40.010.090.07
B50.000.050.030.76
B60.00 0.01 0.00 0.43 0.07
B70.00 0.02 0.00 0.84 0.98 0.09
B80.05 0.01 0.00 0.38 0.38 0.09 0.34
B91.00 0.25 0.00 0.00 0.00 0.00 0.00 0.02
B100.03 0.00 0.00 0.25 0.22 0.07 0.20 0.97 0.00
B110.02 0.00 0.00 0.00 0.00 0.00 0.00 0.76 0.00 0.82
B120.02 0.00 0.00 0.00 0.00 0.00 0.00 0.76 0.00 0.82 1.00
B130.03 0.00 0.00 0.09 0.04 0.01 0.04 0.87 0.00 0.92 0.96 0.96
B140.01 0.00 0.00 0.52 0.58 0.28 0.53 0.52 0.00 0.38 0.00 0.00 0.11
B150.02 0.00 0.00 0.26 0.11 0.02 0.08 0.52 0.00 0.49 0.00 0.00 0.19 0.58
B160.00 0.00 0.00 0.72 0.99 0.07 0.97 0.33 0.00 0.17 0.00 0.00 0.03 0.53 0.00
B170.00 0.00 0.00 0.48 0.90 0.07 0.81 0.34 0.00 0.19 0.00 0.00 0.04 0.57 0.00 0.92
B180.00 0.00 0.00 0.38 0.00 0.98 0.03 0.06 0.00 0.05 0.00 0.00 0.00 0.32 0.00 0.00 0.00
B190.00 0.00 0.00 0.19 0.00 0.39 0.04 0.07 0.00 0.00 0.00 0.00 0.00 0.58 0.00 0.00 0.00 0.55
B200.00 0.00 0.00 0.19 0.00 0.39 0.04 0.07 0.00 0.00 0.00 0.00 0.00 0.58 0.00 0.00 0.00 0.55 1.00
B210.00 0.00 0.00 0.32 0.00 0.88 0.00 0.02 0.00 0.00 0.00 0.00 0.00 0.00 0.00 0.00 0.00 0.77 0.00 0.00
B220.94 0.46 0.14 0.12 0.12 0.01 0.11 0.15 0.93 0.09 0.03 0.03 0.06 0.09 0.08 0.10 0.10 0.00 0.00 0.00 0.00
Notes: B1: Sebastes schlegelii; B2: Chaeturichthys stigmatias; B3: Zoarces slongatus; B4: Palaemon gravieri; B5: Crangon affinis; B6: Leptochela gracilis; B7: Alpheus japonicus; B8: Charybdis japonica; B9: Octopus variabilis; B10: Rapana venosa; B11: Takifugu niphobles; B12: Cynoglossus joyneri; B13: Caudina similis; B14: Platycephalus indicus; B15: Temnopleurus hardwickii; B16: Parachaeturichthys polynema; B17: Enedrias fangi; B18: Oratosquilla oratoria; B19: Glossaulax didyma; B20: Konosirus punctatus; B21: Cynoglossus joyneri; B22: Hexagrammos otakii.
Publisher’s Note: MDPI stays neutral with regard to jurisdictional claims in published maps and institutional affiliations.