Abstract
Understanding the recovery rate of forest carbon stocks and biodiversity after disturbance, including fire, is vital for developing effective climate-change-mitigation policies and actions. In this study, live and dead carbon stocks aboveground, belowground, and in the soil to a 30 cm depth, as well as tree and shrub species diversity, were measured in a tropical lowland dry forest, 23 years after a fire in 1998, for comparison with adjacent unburned reference forests. The results showed that 23 years since the fire was insufficient, in this case, to recover live forest carbon and plant species diversity, to the level of the reference forests. The total carbon stock, in the recovering 23-year-old forest, was 199 Mg C ha−1 or about 90% of the unburned forest (220 Mg C ha−1), mainly due to the contribution of coarse woody debris and an increase in the 5–10 cm soil horizon’s organic carbon, in the burned forest. The carbon held in the live biomass of the recovering forest (79 Mg C ha−1) was just over half the 146 Mg C ha−1 of the reference forest. Based on a biomass mean annual increment of 6.24 ± 1.59 Mg ha−1 yr−1, about 46 ± 17 years would be required for the aboveground live biomass to recover to equivalence with the reference forest. In total, 176 plant species were recorded in the 23-year post-fire forest, compared with 216 in the unburned reference forest. The pioneer species Macaranga gigantea dominated in the 23-year post-fire forest, which was yet to regain the similar stand structural and compositional elements as those found in the adjacent unburned reference forest.
1. Introduction
Forests dominate carbon fixation by terrestrial ecosystems [1,2,3], and forest regrowth is essential for mitigating emissions from land-use change [4,5]. However, forest carbon stocks are at risk from human activities that degrade forests and from changing climate [6,7] that increases fire activity and associated emissions [8,9]. The 1997–1998 El Nino drought cycle in Indonesia triggered fires over millions of hectares of forest, causing smoke and pollution throughout southeast Asia [10]. The 1998 fires in East Kalimantan, Indonesia, were reported as one of Indonesia’s largest forest-fire disasters [11].
Forest-disturbance regimes have intensified in many parts of the world over the last several decades, driven largely by more frequent occurrences of the extreme fire weather associated with rapid climate change and increased human ignitions. These changes are making it more difficult to achieve the basic goals of forest-ecosystem management, which are to deliver ecological services to society, while conserving forest biological diversity and ecosystem function. Understanding the nature and rate of biodiversity recovery in disturbed regions is required, to identify management interventions for fostering restoration of both plant diversity and forest-ecosystem function.
The recovery of secondary forest carbon stocks, after fire disturbance, is a key contributor to climate-change mitigation. Not only in Indonesia, but globally, the extent of secondary forests has risen over time [12,13], while the area of primary forests has decreased [14]. In the long term, secondary forests will replace primary forests [15] and play an important role in global biomass turnover and carbon sequestration [16].
Although the immediate impact of fire on forest ecosystems has been widely studied, including in the tropical dryland forests of Indonesia [17,18,19], studies over decades of recovery are more limited, especially in tropical forests, where most disturbances are occurring. Multiple decades of forest regrowth are, likely, required for biomass to recover equivalent carbon to that emitted in a forest fire. Currently there are very few published studies from tropical forests that include all forest carbon pools [20,21]. Detailed measurements can help to reduce uncertainty, in estimates of the time required for forest regrowth to balance carbon losses [22]. Moreover, the recovery of forest carbon and plant biodiversity occurs at different rates after disturbance [23], with each varying according to forest type, climate and site factors, and degree of disturbance. This study aimed to analyze the recovery of plant biodiversity and of carbon stocks, in a secondary tropical forest of Indonesia, 23 years after fire. The broader aim is to enhance our understanding of carbon sequestration and the role of secondary forests in climate-change mitigation and biodiversity conservation.
2. Materials and Methods
2.1. Study Sites and Plot Design
The study area is a lowland dryland forest that is dominated by mixed dipterocarp species in the Bangkirai hills forest, at an elevation of 49–135 m (Figure S1), 58 km northwest of Balikpapan city, East Kalimantan, Indonesia (1°1′29″–1°1′47.1″ South, 116°0′52.3″–116°0′52.5″ East; Figure 1).
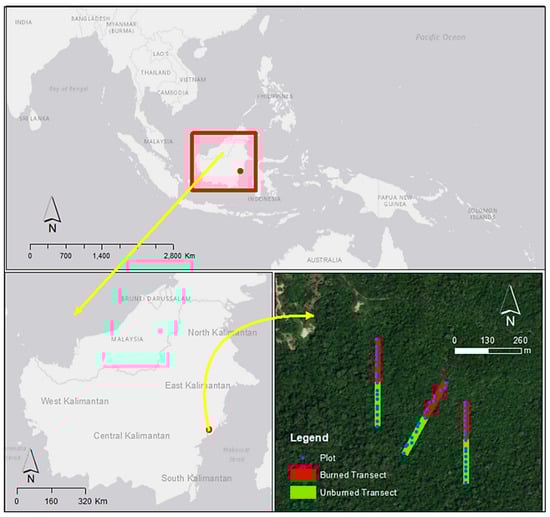
Figure 1.
The geographic location of the study sites in East Kalimantan, Indonesia.
Much of the forest in the area was burned through by large forest fires, following the long and extremely dry seasons of 1997–1998, as described by [11,24,25]. NOAA-AVHRR hotspots, acquired in March 1998, at East Kalimantan, Indonesia, are presented in Figure S2. Some forest areas in the Bangkirai hills, are dominated by Shorea laevis (bangkirai; Dipterocarpaceae) and managed as nature leisure parks. The study sites were established in these forests in an area with naturally regenerated forests, since 1998, and in adjacent unburned forests. At the time of field measurements, the regenerated stands were 23 years old. Previous studies have reported the impacts of the dry season and the ensuing forest fire on mixed dipterocarp forest in the Bangkirai hills, East Kalimantan (e.g., [26]). The 1998 fires in the Bangkirai hills resulted in forest areas with around 500–583 standing dead trees per ha, and the number of live trees decreased to between 488 and 1000 per ha. Forest fire reduced live basal areas by 45–85%, leaving between 5.92–20.87 m2 ha−1 basal areas of living trees in the burned area. Forest fires, also, have an impact on decreasing biodiversity, as the Shannon Diversity Index in burned areas is lower (<2) than in unburned areas.
Historical climate data at the site, based on WorldClim climate data version 2.1, for 1970–2000 [27], are shown in Figure S3. The average annual precipitation ranges from 2307 mm to 2313 mm in the Bangkirai hills, with the highest precipitation in March–April and the lowest in September–October. The average temperature is 26.3 °C, with a minimum of 23 °C and a maximum of 29.6 °C. An overview of forest-stand conditions in both the unburned and the 23-year post-fire areas, is presented in Figure 2.
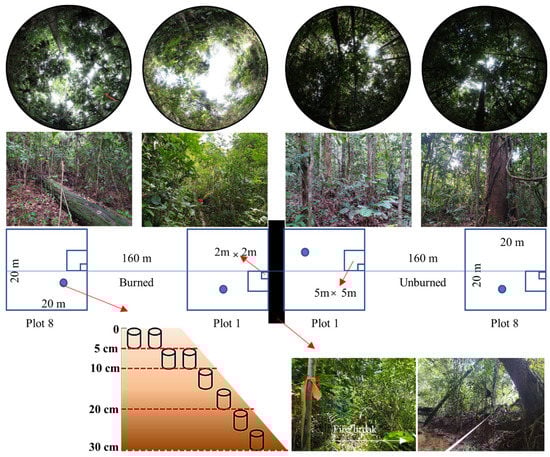
Figure 2.
Study-plot design.
Three 20 m wide × 320 m long transects were laid, to cross from the unburned forest into the burned forest, with 160 m of transect in each forest condition. On each transect, 8 plots per forest condition were established, spaced ±3 m apart, resulting in 3 sites and 48 plots total (24 plots in burned areas and 24 plots in unburned areas, Figure 2).
2.2. Stand Structure and Carbon Stock Assesment
All woody plants in the study plots were identified, to species level, and recorded. Plants were categorized into four size classes, according to developmental stage, height, and diameter, at a height of 1.3 m (diameter at breast height; DBH), i.e., (1) understory: height < 1.5 m, (2) sapling: DBH < 10 cm and height ≥ 1.5 m, (3) pole: 10 cm ≤ DBH < 20 cm, and (4) tree: DBH ≥ 20 cm. Trees with DBH ≥ 10 cm were measured in 20 m × 20 m plots. Smaller trees with DBH < 10 cm were measured in subplots of 5 m × 5 m. Understory trees (seedlings and shrubs) were counted in 2 m × 2 m plots [28].
Density and basal area (BA), to represent stand structure, were calculated as:
where Density = number of trees per ha (trees ha−1), A = plot area (ha), BA = basal area (m2 ha−1), and DBH = diameter at breast height (cm).
In each of these 2 m × 2 m plots, destructive biomass samples were taken from the understory, fine woody debris (FWD, diameter < 2.5 cm), and litter (live and dead leaves, tree fruits, small twigs, and branches, diameter < 0.6 cm) [29]. Coarse woody debris (CWD; diameter ≥ 2.5 cm) were measured for diameter, at the point of intersection with the 160 m long line transect [30]. CWD were classified by decay classes (sound and rotten). Samples from the sound and rotten classes were collected, for wood density and carbon-content analysis. Standing dead trees were measured in 20 × 20 m plots and classified as (1) standing dead trees without leaves, (2) standing dead trees without leaves and twigs, and (3) standing dead trees (only the stems). Soil was sampled in 5 cm increments, from the surface to a 30 cm depth, using a soil core (196.35 cm3), with sample intensity shown in Figure 2.
Sub-samples (circa 200 g) of FWD, understory, and litter were dried at 60 °C in the FORDA laboratory in Bogor, until the samples reached a constant weight. The volumetric-water-displacement method was used to calculate the wood density of CWD. The carbon contents of the understory, litter, FWD, CWD, and soil samples were determined, using a loss-on-ignition (LoI) method. The samples were analyzed at the laboratories of the Center for Research and Development of Agricultural Land Resources, Indonesia. In total, 1 g to 2 g samples of understory, litter, FWD, CWD, and soil were burned, for at least 6 h at 550 °C in a quenching furnace, and the residues were weighed. Organic matter was divided by a conversion factor of 1.922, to calculate the carbon content [31]. The carbon content of live and standing dead trees was assumed to be 0.47%, on a dry-weight basis [32].
Using the biomass equation for lowland tropical forests, from [33], the aboveground tree biomass (AGBT) was determined as:
where AGBT = aboveground tree biomass (kg), D = diameter at breast height (cm), and G = wood density (g cm−3). The total amount of aboveground tree biomass in an area was referred to as aboveground biomass (AGB, Mg ha−1).
A Monte Carlo simulation (n = 5000) was used to determine the recovery time, based on the value of the aboveground biomass Mean Annual Increment (MAI) and the aboveground biomass of the unburned forest as a reference. MAI (Mg ha−1 yr−1) was calculated as:
where t = the total years after a fire.
Belowground biomass (BGB, Mg ha−1) was calculated as a percentage of AGB, following the method of [34], using a root-to-shoot ratio of 0.207 for AGB < 125 Mg ha−1 and 0.212 for AGB ≥ 125 Mg ha−1. Deadwood was categorized into three categories, i.e., standing dead trees, CWD, and FWD. Standing-dead-tree biomass was reduced by 2.5 percent (for moderate defoliation) or 30 percent (in the absence of leaves, branches, or shoots), to account for the absence of leaves and branches [35].
Soil C-stock was determined using an equivalent mass method [36], as:
where is the mass of soil sample at depth h (Mg ha−1), BD is the bulk density at depth h (g cm−3), h is the depth of sample (cm), is the C fraction of the soil sample at depth h, and is the soil C content at depth h (Mg C ha−1).
Soil C stock was the sum of soil C stocks for each collected depth of 0–5 cm, 5–10 cm, 10–20 cm, and 20–30 cm. The sum of carbon in biomass (AGB, BGB, understory), dead organic matter (DOM), i.e., standing dead trees, CWD, FWD, litter, and soil to a 30 cm depth, formed the estimate of total ecosystem carbon.
2.3. Biodiversity Assesment
Frequency, density, and dominance of the relative value of the vegetation were calculated, and then, summed to generate an important value index (IVI) [37], as:
where IVI is the Important Value Index (%); FR is the relative frequency (%), a ratio of a species’ frequency to the total frequency; DR is relative density (%), a ratio of a species’s number of individuals to the total number of individuals for all species; and DomR was relative dominance (%), a ratio of a species’s basal area to the basal area of all species.
Species diversity was estimated using the diversity index of Shannon and Simpson, the evenness index, and species richness. Each index denotes a unique aspect of community diversity [38]. The diversity values were estimated using the vegan package [39] of R [40]. The diversity parameters of the evenness index of Pielou (J), the diversity index of Shannon (H′) and Simpson (D), and the species richness of Margalef (S) were calculated as:
where i and b are the logarithm bases, while pi is the relative abundance of the species.
The diversity index H′ > 2 shows that the community is stable [41]. The Simpson index D ranges from 0 to 1, with zero representing no dominance, and 1 representing maximum dominance. Decreased species richness and evenness reduce ecosystem productivity and stability, resulting in reduced functional diversity within the same ecosystem [42].
2.4. Statistical Analysis
A Tukey-Kramer analysis of variance established any statistical differences between the 23-year post-fire and unburned plots, where the differences were considered significant at the 5% level. The Jaccard index statistic [43] was used to measure the similarity and diversity of communities in burned and unburned plots as:
where the Jaccard index ranges from 0 to 1, c is the number of species shared between the two sites, and a and b are the numbers of species unique to either site. The greater the value of the Jaccard index, the closer the two communities are, in terms of species similarity.
Plant-species composition of both burned and unburned plots was analyzed using non-metric multidimensional scaling (MDS) ordination. The default monoMDS function, which contains a square root transformation Wisconsin and a different index, Bray–Curtis, was used to order a species matrix of the number of each plant species in each plot. The analysis was done with the vegan package, and ordination was visualized using the ggplot2 package [44].
Biophysical parameters, such as soil pH, temperature, humidity, and light intensity, were measured at the center of each plot. A digital soil analyzer tester meter was used to measure soil pH. Temperature, humidity, and light intensity were measured using a portable multi-functional anemometer.
3. Results
3.1. Site Biophysical Characteristics
Results of site biophysical characteristics are presented in Table 1. Burned sites were slightly hotter and drier than unburned sites. Light intensity in burned sites was almost seven times greater than in unburned sites (Table 1).

Table 1.
Biophysical condition of the observation sites.
3.2. Stand Carbon Stock Recovery
The total tree density (sapling, pole, and large tree) of the 23-year post-fire forest (5755 ± 226 trees ha−1) was significantly lower than the total tree density of the unburned forest (9067 ± 371 trees ha−1). In both forest conditions, saplings accounted for more than 90% of total tree density, followed by smaller trees (pole; 5%), while large trees contributed only 2% to the total tree density. Comparison for all pairs, using Tukey-Kramer, showed that seedling, pole, and large tree densities were not significantly different at the 0.05 level, while saplings showed a significant difference between the two forests (Figure 3a). The total basal area (sapling, pole, and large tree) of the 23-year post-fire forest (18.67 ± 1.97 m2 ha−1) was significantly less than the total tree density of the unburned forest (25.92 ± 1.01 m2 ha−1). Unburned forest had significantly higher basal area for all DBH categories, except for the 20–30 diameter class (Figure 3b).
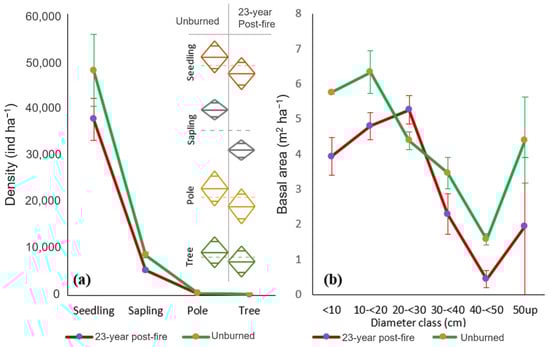
Figure 3.
Horizontal stand structures: (a) density and (b) basal area in the 23-year post-fire forest and in the unburned forest.
The aboveground biomass (AGB) from the sapling to the tree level in the 23-year post-fire forest (142.87 ± 36.33 Mg ha−1) was significantly less than the AGB of the unburned forest (264.60 ± 34.32 Mg ha−1). The combined AGB of the seedling and understory classes were similar among the unburned and 23-year post-fire forests. The total AGB value (trees + understory) of the 23-year post-fire forest was 143.57 ± 36.48 Mg ha−1, while the unburned forest was 265.30 ± 34.16 Mg ha−1.
The mean annual increment (MAI) of AGB in the 23-year post-fire forest was 6.24 ± 1.59 Mg ha−1 year−1. Based on Monte Carlo simulation, using MAI, it will require 46 ± 17 years to recover the live carbon pool to the unburned-forest level (Figure S4).
The Tukey-Kramer comparison showed no significant difference (0.05 level) between the belowground biomass of the 23-year post-fire forest and the unburned forest. BGB in the 23-year post-fire forest was 30.08 ± 7.91 Mg ha−1, compared to 56.24 ± 7.24 Mg ha−1 in the unburned forest.
In contrast, the 23-year post-fire forest had significantly higher deadwood mass (124.36 ± 33.16 Mg ha−1) than the unburned forest (64.24 ± 15.83 Mg ha−1; Figure 4). The litter mass of the 23-year post-fire (4.73 ± 0.92 Mg ha−1) and unburned forests (4.29 ± 0.29 Mg ha−1) were similar.
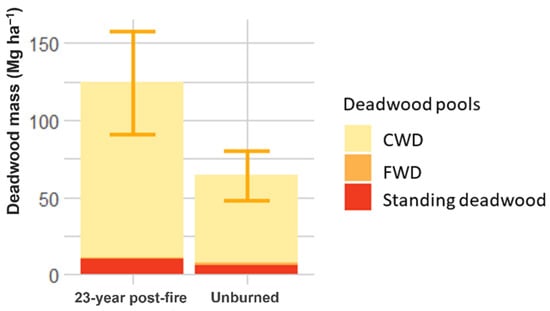
Figure 4.
Deadwood mass in the 23-year post-fire forest and in the unburned forest.
The soil bulk density and C-org values were not significantly different among the burned and unburned forests, for each of the sampled depths, except for the 5–10 cm soil horizon (Table 2). The soil carbon–organic content declined with soil depth (Figure 5b), while soil bulk density increased with soil depth (Figure 5a). Soil carbon stock to a 30 cm depth in the 23-year post-fire forest was 55.5 ± 5.13 Mg C ha−1, while in the unburned forest, it was significantly lower at 41.6 ± 2.68 Mg C ha−1.
Table 2.
Bulk density and C-org at 0–5 cm, 5–10 cm, 10–20 cm and 20–30 cm depth in the 23-year post-fire forest and in the unburned forest.
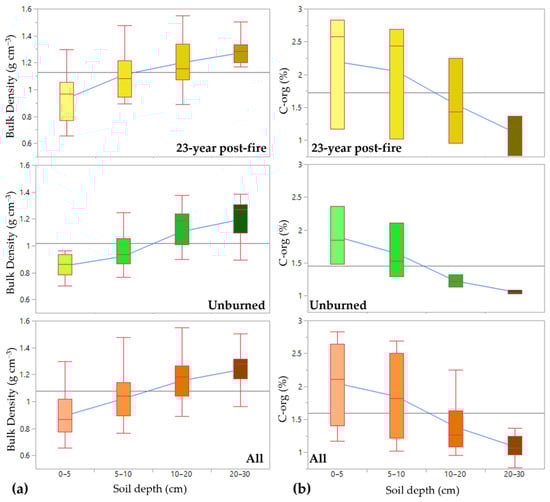
Figure 5.
The trend of bulk density (a) and C-org (b) values with increasing soil depth in the 23-year post-fire forest (top panels), in the unburned forest (middle panels) and the average of all burned and unburned forests samples together (bottom panels).
As in soil C-org, in other carbon pools (understory, litter, woody debris, sound deadwood, and rotten deadwood), the carbon fraction values in the 23-year post-fire forest and the unburned forest were not significantly different (Table 3).
Table 3.
Mean carbon fraction (%) in the understory, litter, woody debris, sound deadwood, and rotten deadwood.
The total carbon stock in unburned forests (219.78 ± 24.69 Mg C ha−1) was not significantly different from the burned, secondary forests (198.96 ± 33.14 Mg C ha−1). However, the distribution of carbon among pools was different between the two forests. In unburned forests, live tree biomass was the dominant carbon pool (146.58 ± 18.89 Mg C ha−1), followed by soil organic carbon (SOC) (41.62 ± 2.54 Mg C ha−1), and dead organic matter (DOM) (31.58 ± 9.53 Mg C ha−1). In contrast, in burned secondary forests, live tree biomass (79.17 ± 20.22 Mg C ha−1) and DOM (65.53 ± 19.02 Mg C ha−1) were similar, while SOC was 54.26 ± 11.32 Mg C ha−1 (Figure 6).
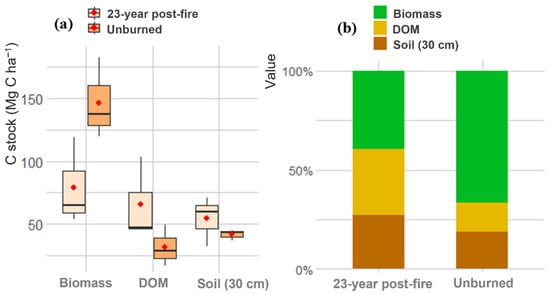
Figure 6.
C stocks (a) and percentage of carbon of each pool (b) in the 23-year post-fire forest and in the unburned forest.
3.3. Biodiversity Recovery
The unburned forests had higher numbers of plant species present than the burned forests (219 vs. 179). Unburned forests had higher numbers of taxa present than the burned forests, in all vegetation size categories, with 68 families and 146 genera recorded in unburned plots vs. 58 families and 126 genera in the 23-year post-fire forest. The five most abundant species were, likely, more dominant in the 23-year post-fire forest (IVI value of 83.9–135.8%) than in the unburned forest (IVI value of 59.1–77.5%; Table 4).
Table 4.
List of five species with the highest important value index (IVI), by growth level, in the 23-year post-fire forest and in the unburned forest.
The community similarity index (Jaccard index) of the unburned forest and the 23-year post-fire forest yields a ratio of 0.4, indicating that the post-fire forest has not yet reached a similar species composition, 23 years after the fire. The response of plant species composition to site circumstances was determined using non-metric multidimensional scaling (MDS; Figure 7). It can be seen that the 23-year post-fire forest was, still, compositionally different from the unburned forest. Several plots in the burned forest show the same composition as the unburned forest, possibly due to a neighboring effect.
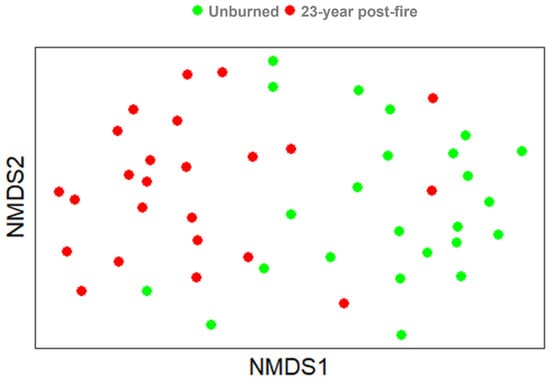
Figure 7.
Non-metric multidimensional scaling (NMDS) plot of species composition for the 23-year post-fire forest (red dots) and for the unburned forest (green dots).
The distribution of species diversity indicator values in the unburned and 23-year post-fire forests is given in the violin diagram, in Figure 8. Among the taxa levels, the unburned forest has a richness of 50 (family), 94.67 (genera), and 126 (species). In comparison, the 23-year post-fire forest had a reduced richness, of 41.67 (family), 71.33 (genus), and 91.67 (species). The level of diversity in a community, from the various taxonomic groups based on the Shannon and Simpson index, shows the same pattern with the value of H′ species > 3 in the unburned forest and the 23-year post-fire forest. Pielou’s evenness index (J) in the 23-year post-fire forest was as high as in the unburned forest, with a J value > 0.8.
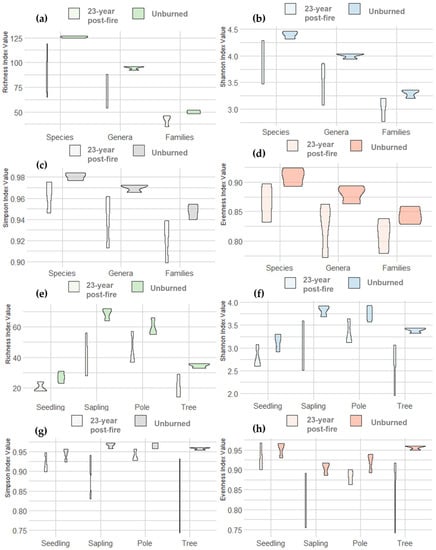
Figure 8.
Biodiversity on taxon levels: (a) species richness, (b) Shannon index, (c) Simpson index, and (d) J evenness index; biodiversity on growth levels: (e) species richness, (f) Shannon index, (g) Simpson index, and (h) J evenness index in the 23-year post-fire forest and in the unburned forest.
A similar trend was observed at tree category levels (seedlings, saplings, poles, and large trees). The 23-year post-fire forest had lower diversity indices than the unburned forest (Figure 8). At the sapling and pole levels, the 23-year post-fire forest and the unburned forest had higher species richness and diversity indices than on other growth levels. Sapling and pole levels in the unburned forest had an H′ > 3, which showed that the community was very stable. Meanwhile, at the large tree and seedling levels of the unburned forests and all growth levels, the 23-year post-fire forest had a stable community, with an H′ value between 2 to <3.
The species richness, Shannon index, Simpson index, and evenness at the taxon levels, were similar among the unburned forest and the 23-year post-fire forest (Table 5). Yet, the species richness index was significantly lower in the 23-year regrowth than in the unburned forests, in both saplings and large trees.
Table 5.
Diversity value in the 23-year post-fire forest and in the unburned forest, by taxon and growth level.
4. Discussion
4.1. Carbon Recovery 23 Years after Fire
Twenty-three years post-fire, the density of seedlings, poles, and large trees, but not of saplings, in the Bangkirai hills’s burned forest approached the condition of the nearby unburned forest. Previous studies in the rainforests of East Kalimantan, Indonesia, reported that fire events had significantly increased the mortality rate of small-diameter trees, resulting in the loss of seedlings, saplings, and poles after fire [24]. In general, the basal area of the 23-year post-fire forest, for each diameter class, was lower than that in the unburned forest. However, the dominance of the pioneer species Macaranga gigantea, at the tree level in the burned forest, is seen in the higher occurrence of trees in diameter class 20–30 cm, relative to the unburned forest. The species composition and structure of the burned forest indicates that it has not yet recovered fully, following the fire in 1998. This conclusion is supported by the observed lower-canopy cover density, higher forest-floor temperature, and lower humidity in the burned plots than in the unburned plots. The impacts of fire on soil pH in the burned plots, also, remain evident after 23 years, with more alkaline soil pH, due to alkaline ash deposits, than in the unburned plots [45].
Carbon storage in the burned tropical secondary forest is lower than in the unburned forest [19]. Aboveground biomass (AGB) from the sapling to the tree level of the 23-year post-fire forest, in our sites, was lower than in the unburned forest. However, it was higher than in forests < 12 years post fire [18,46], indicating carbon recovery. Meanwhile, the biomass of the understory and seedlings in the burned sites was similar to the unburned forest. In general, trees with DBH > 10 cm contribute most to the AGB biomass, with 89.4% in the 23-year post-fire forest and 92% in the unburned forest, while the understory and seedlings contributed less than 1% of AGB.
Twenty-three years post fire, a lot of deadwood remained in the forests, mainly as fallen CWD, making it the largest contributor to the DOM carbon pool (91% deadwood mass), compared to fine woody debris, which accounted only for 1–2% of deadwood mass, in both forest conditions. Carbon built into litter is a minor pool of carbon aboveground [47]. The impact of fire on the litter was not noticeable 23 years after the fire.
The soil bulk density and C-org in the 23-year post-fire forest and the unburned forest were not, statistically, significantly different within most depths sampled, except for the 5–10 cm depth. Soil depth is critical in determining the distribution of soil-carbon storage. Although soil carbon–organic content declined with depth, the total carbon storage capacity of the deeper soil layers was larger than that of the surface soil layers, due to increased soil bulk density with depth. Carbon stocks in the top 30 cm of soil at our sites were in the range of the soil-carbon stock of mineral soils in Indonesia, ranging from 42.21 Mg C ha−1 to 167.64 Mg C ha−1 [48]. The soil organic C in the uppermost layer (0–10 cm) is, mostly, determined by the intensity and duration of the fire [49]. Increases in soil C, following fires, can be detected in both the surface and deeper soil layers, due to inputs from partially burned plant components and carbonized particles [49,50]. In our sites, an increase in soil C at the 5–10 cm depth indicated carbon transportation to a deeper layer, 23 years after the fire.
About 23 years after the fire, carbon stocks in living vegetation are around 54% of the level of the unburned forest. However, the surviving vegetation plays a crucial role in forest recovery, enabling an increase in tree density and biomass [51]. An aboveground biomass MAI of ±6 Mg ha−1 yr−1 is obtained after 23 years of regenerated growth following a fire. After a fire, the increment rate decreases with recovery time [18,46]. In contrast, dead organic matter was higher in post-fire secondary forests, due to the carbon redistribution from live to dead pools.
Total carbon sequestered in the unburned forests is equivalent to 806 ± 88 MgCO2-e ha−1 of atmospheric carbon dioxide (uncertainty level of 22.6%). The regenerated 23-year post-fire forest resulted in carbon storage in live biomass of 291 ± 43 MgCO2-e ha−1, accounting for all carbon pools, 730 ± 68 MgCO2-e ha−1, or 90% of the unburned forest, illustrating the importance of accounting for all carbon pools in greenhouse gas inventories, especially in relation to forest fires.
4.2. Vegetation Recovery
The forest, 23 years after fire, was still dominated by the pioneer species Macaranga gigantea, at the tree level. Inequalities in species-dispersal capacity, between burned and unburned forests, may exacerbate differences in species composition [19]. The number of tree species in our unburned forests were similar to the number of species found in the unburned forests in East Kalimantan, which ranged between 160 species ha−1 and 276 species ha−1 [52]. The 23-year post-fire plots had a lower number of families, genera, and species than the unburned plots. Species that play a dominant role in the community will have a high IVI value [37]. The occurrence of a specific species within a community with a high IVI, also, shows the ability of the species to adapt to their habitat and high tolerance for the environment. Macaranga gigantea was the species that had the highest IVI value at the large tree and pole levels, in the 23-years post-fire forest. At our study sites, pioneer species were no longer dominant at the seedling level, compared to the first few years after the fire [53,54]. At the sapling level, Fordia splendidissima became the main species that dominated the 23-years post-fire forest (53.6%). Fordia splendidissima was, also, commonly found in the unburned forest, second after Syzygium sp. Fordia splendidissima became the dominant species in both unburned forests and burned forests shortly after the fire, as reported by [55]. The unburned and 23-year post-fire forests had similar species composition, at the seedling and understory levels. Although the unburned forest and the 23-year post-fire forest had different species with the highest IVI values (Stachyphrynium cylindricum in the unburned plot and Clidemia hirta in the 23-year post-fire plots), the same species were found in both forest conditions, such as Stachyphrynium cylindricum and Guioa sp., dominating > 30%, indicating species-richness recovery in the burned plots. However, species richness of the saplings and large trees had not yet recovered to the levels found in the unburned forests.
The species diversity, richness, and evenness, at all taxon levels, had recovered to the levels found in the unburned forest, except for richness in the saplings and large trees. Tukey-Kramer tests on the biodiversity metrics (diversity indices of Shannon and Simpson, the evenness index, and species richness), of the 23-year post-fire forest vs. the unburned forest, revealed statistically insignificant differences. Yet, the species richness index was significantly different in the 23-year post-fire than in the unburned forests, for both saplings and large trees. However, the value of biodiversity parameters, at all taxon levels, in the unburned forest was higher than in the 23-year post-fire forest. Basal area in the forest 23 years post-fire increased by 26-74%, compared to the basal area in the forest 5 years post-fire [17]. However, basal area in the forest 23 years post-fire was 73% in the unburned forest. This difference in the species composition and stand structure has implications for carbon storage [19,46,56], due to the regeneration and regrowth of fire-resistant stands.
Fires have altered existing environmental variables [57] that influence the density, and, thus, species diversity and richness [58]. Tree mortality by fire was inversely related to both tree diameter and bark thickness [24], suggesting that the diameter structure of a population may be as good a predictor of a species’s fire susceptibility as the bark features. Resprouting is an important functional plant feature that allows plants to survive after disturbance [59]. When meristematic tissues, specifically buds, are shielded from fire after a fire, resprouting occurs [60]. Following a fire, seed germination is a frequent post-fire recruitment method for recovery. Seed release, seed germination, and flowering were all enhanced by fire [61]. However, recovery of species composition to the pre-fire level is slow [19,62].
5. Conclusions
Twenty-three years after the 1998 fire, the recovering secondary forest is dominated by the pioneer species Macaranga gigantea and is, yet, to recover overstory canopy similar to the unburned reference forest. The live aboveground biomass in the burned forest remains at 50–60% of the unburned forest, attesting to a relatively slow recovery rate for a tropical environment. The main tree component in the fire-recovering forest is seen in the relatively high frequency of trees with DBH 20–30 cm. However, when considering the total ecosystem carbon that includes biomass (aboveground and root), dead organic matter, and soil organic carbon to a 30 cm soil depth, there was not much difference between the unburned reference forest (220 Mg C ha−1) and the adjacent burned forest (199 Mg C ha−1). Twenty-three years after the fire, total carbon stocks from all carbon pools had reached 90% of the unburned forest. This study identified the importance of accounting for the carbon redistributed from live to dead organic matter and, also, from aboveground to soil horizons in the burned forest. For the purpose of greenhouse gas (GHG) inventory, this study demonstrates the importance of including all carbon pools in carbon stock estimates of secondary forests, following disturbance events. Although parameters, such as light intensity at the forest floor and related temperature increases, indicate that, structurally, the burned forest is yet to fully recover after 23 years, the rate of live aboveground-biomass recovery, after the 1998 fire, is about 6 Mg ha−1 year−1, indicating that the live aboveground-biomass carbon will be recovered after about 46 ± 17 years. We acknowledge that our study represents one forest-area case study, on the effects of fire on the recovery of vegetation and carbon stocks in dryland forests of Indonesia, and that more observations across a broader range of disturbed forests are required, to describe the dynamics of forest-carbon recovery at a landscape level.
Supplementary Materials
The following supporting information can be downloaded at: https://www.mdpi.com/article/10.3390/su14126964/s1. Figure S1: Elevation Bangkirai hills forest (m); Figure S2: NOAA-AVHRR hotspots, acquired in March 1998, in East Kalimantan, Indonesia; Figure S3: climate of Bangkirai hills forest: (a) precipitation and (b) temperature; Figure S4: histogram of the time recovery estimate after fire, based on Monte Carlo simulation (n = 5000).
Author Contributions
Conceptualization, W.C.A., L.B.P., C.K. and H.K.; methodology, W.C.A., L.B.P., C.K. and H.K.; formal analysis, W.C.A.; data curation, W.C.A.; writing–original draft preparation, W.C.A.; writing–review and editing, W.C.A., L.B.P., C.K., H.K., C.J.W. and L.V.; visualization, W.C.A., C.J.W. and L.V.; supervision, L.B.P., C.K., H.K., C.J.W. and L.V. All authors have read and agreed to the published version of the manuscript.
Funding
This research was funded by the Forest Research and Development Center, the Ministry of Environment and Forestry, Republic of Indonesia, DIPA 2021.
Institutional Review Board Statement
Not applicable.
Informed Consent Statement
Not applicable.
Data Availability Statement
The dataset associated with the study is available upon request to the corresponding author.
Acknowledgments
We thank the Forest Research and Development Center, the Research Institute for Technology of Natural Resources Conservation (Indonesia Ministry of Environment and Forestry), and Bangkirai Hill Management—PT Inhutani I for the facilitation and support in field data collection.
Conflicts of Interest
The authors declare no conflict of interest. The funders had no role in the design of the study; in the collection, analyses, or interpretation of data; in the writing of the manuscript; or in the decision to publish the results.
References
- Houghton, R.A. Balancing the global carbon budget. Annu. Rev. Earth Planet. Sci. 2007, 35, 313–347. [Google Scholar] [CrossRef] [Green Version]
- Le Quéré, C.; Andrew, R.M.; Canadell, J.G.; Sitch, S.; Korsbakken, J.I.; Peters, G.P.; Manning, A.C.; Boden, T.A.; Tans, P.P.; Houghton, R.A.; et al. Global carbon budget 2016. ESSD 2016, 8, 605–649. [Google Scholar] [CrossRef] [Green Version]
- Bar-On, Y.M.; Phillips, R.; Milo, R. The biomass distribution on Earth. Proc. Natl. Acad. Sci. USA 2018, 115, 6506–6511. [Google Scholar] [CrossRef] [Green Version]
- Goodman, R.; Herold, M. Why maintaining tropical forests is essential and urgent for a stable climate. Center Global Dev. Work. Pap. 2014, 385. [Google Scholar] [CrossRef]
- Nunes, L.J.; Meireles, C.I.; Pinto Gomes, C.J.; Almeida Ribeiro, N. Forest contribution to climate change mitigation: Management oriented to carbon capture and storage. Climate 2020, 8, 21. [Google Scholar] [CrossRef] [Green Version]
- Keith, H.; Mackey, B.G.; Lindenmayer, D.B. Re-evaluation of forest biomass carbon stocks and lessons from the world’s most carbon-dense forests. Proc. Natl. Acad. Sci. USA 2009, 106, 11635–11640. [Google Scholar] [CrossRef] [Green Version]
- Fu, L.; Zhao, Y.; Xu, Z.; Wu, B. Spatial and temporal dynamics of forest aboveground carbon stocks in response to climate and environmental changes. J. Soils Sedim. 2015, 15, 249–259. [Google Scholar] [CrossRef]
- Van der Werf, G.R.; Randerson, J.T.; Giglio, L.; Collatz, G.J.; Mu, M.; Kasibhatla, P.S.; Morton, D.C.; DeFries, R.S.; Jin, Y.V.; van Leeuwen, T.T. Global fire emissions and the contribution of deforestation, savanna, forest, agricultural, and peat fires (1997–2009). Atmos. Chem. Phys. 2010, 10, 11707–11735. [Google Scholar] [CrossRef] [Green Version]
- Liu, J.; Bowman, K.W.; Schimel, D.; Parazoo, N.C.; Jiang, Z.; Lee, M.; Bloom, A.A.; Wunch, D.; Frankenberg, C.; Sun, Y.; et al. Response to Comment on “Contrasting carbon cycle responses of the tropical continents to the 2015–2016 El Niño”. Science 2018, 362, eaat1211. [Google Scholar] [CrossRef] [Green Version]
- Khan, M.F.; Hamid, A.H.; Ab Rahim, H.; Maulud, K.N.A.; Latif, M.T.; Nadzir, M.S.M.; Sahani, M.; Qin, K.; Kumar, P.; Varkkey, H.; et al. El Niño driven haze over the Southern Malaysian Peninsula and Borneo. Sci. Total Environ. 2020, 730, 139091. [Google Scholar] [CrossRef]
- Siegert, F.; Hoffmann, A.A. The 1998 forest fires in East Kalimantan (Indonesia): A quantitative evaluation using high resolution, multitemporal ERS-2 SAR images and NOAA-AVHRR hotspot data. Remote Sens. Environ. 2000, 72, 64–77. [Google Scholar] [CrossRef]
- Adinugroho, W.C.; Prasetyo, L.B.; Kusmana, C.; Krisnawati, H. Contribution of forest degradation in Indonesia’s GHG emissions: Profile and opportunity to improve its estimation accuracy. IOP Conf. Ser. Earth Environ. Sci. 2019, 399, 012025. [Google Scholar] [CrossRef]
- Adinugroho, W.C.; Krisnawati, H.; Imanuddin, R.; Ayat, A.; Wirastami, L.A.; Kusmana, C. Integrating issues of biodiversity and climate change to achieve sustainable forest management: A case of Mbeliling landscape, Flores. IOP Conf. Ser. Earth Environ. Sci. 2021, 914, 012012. [Google Scholar] [CrossRef]
- Food and Agriculture Organization (FAO); [United Nations Environmental Programme (UNEP). The State of the World’s Forests 2020. In Forests, Biodiversity and People; FAO-UNEP: Rome, Italy, 2020. [Google Scholar]
- Wright, J.S. The carbon sink in intact tropical forests. Glob. Change Biol. 2013, 19, 337–339. [Google Scholar] [CrossRef]
- Pugh, T.A.; Arneth, A.; Kautz, M.; Poulter, B.; Smith, B. Important role of forest disturbances in the global biomass turnover and carbon sinks. Nat. Geosci. 2019, 12, 730–735. [Google Scholar] [CrossRef]
- Simbolon, H.; Siregar, M.; Wakiyama, S.; Sukigara, N.; Abe, Y.; Shimizu, H. Impacts of forest fires on tree diversity in tropical rain forest of East Kalimantan, Indonesia. Phyton 2005, 45, 551–559. [Google Scholar]
- Hiratsuka, M.; Toma, T.; Diana, R.; Hadriyanto, D.; Morikawa, Y. Biomass recovery of naturally regenerated vegetation after the 1998 forest fire in East Kalimantan, Indonesia. JARQ 2006, 40, 277–282. [Google Scholar] [CrossRef] [Green Version]
- Slik, J.W.; Bernard, C.S.; Van Beek, M.; Breman, F.C.; Eichhorn, K.A. Tree diversity, composition, forest structure and aboveground biomass dynamics after single and repeated fire in a Bornean rain forest. Oecologia 2008, 158, 579–588. [Google Scholar] [CrossRef]
- Kashian, D.M.; Romme, W.H.; Tinker, D.B.; Turner, M.G.; Ryan, M.G. Carbon storage on landscapes with stand-replacing fires. Bioscience 2006, 56, 598–606. [Google Scholar] [CrossRef]
- Fischer, R. The long-term consequences of forest fires on the carbon fluxes of a tropical forest in Africa. Appl. Sci. 2021, 11, 4696. [Google Scholar] [CrossRef]
- Peltoniemi, M.; Palosuo, T.; Monni, S.; Mäkipää, R. Factors affecting the uncertainty of sinks and stocks of carbon in Finnish forests soils and vegetation. For. Ecol. Manag. 2006, 232, 75–85. [Google Scholar] [CrossRef]
- Martin, P.A.; Newton, A.C.; Bullock, J.M. Carbon pools recover more quickly than plant biodiversity in tropical secondary forests. Proc. R. Soc. B Biol. Sci. 2014, 281, 20140303. [Google Scholar] [CrossRef]
- Van Nieuwstadt, M.G.; Sheil, D. Drought, fire and tree survival in a Borneo rain forest, East Kalimantan, Indonesia. J. Ecol. 2005, 93, 191–201. [Google Scholar] [CrossRef]
- Darmawan, A. Application of Multi-Criteria Decision Analysis (MCDA) and Geographic Information System (GIS) to Estimate the Level of Forest Fire Risk in the Central Mahakam Area, West Kutai Regency East Kalimantan [Aplikasi Multi-Criteria Decision Analysis (MCDA) dan Sistem Informasi Geografi (SIG) untuk mengestimasi tingkat resiko kebakaran hutan di Kawasan Mahakam Tengah, Kabupaten Kutai Barat—Kalimantan Timur]. Seminar Nasional “Agroforestry sebagai Pemanfaatan Lahan berkelanjutan di Masa Depan”; INAFE: Bandarlampung, Indonesia, 2009. [Google Scholar]
- Simbolon, H.; Siregar, M.; Wakiyama, S.; Sukigara, N.; Abe, Y.; Shimizu, H. Impacts of dry season and forest fire 1997–1998 episodes on mixed dipterocarp forest at Bukit Bangkirai, East Kalimantan [Pengaruh Musim Kering dan Kebakaran Hutan Episode 1997–1998 Terhadap Hutan Dipterocarp Campuran di Bukit Bangkirai, Kalimantan Timur]. Ber. Biol. 2003, 6, 737–746. [Google Scholar]
- Fick, S.E.; Hijmans, R.J. WorldClim 2: New 1-km spatial resolution climate surfaces for global land areas. Int. J. Climatol. 2017, 37, 4302–4315. [Google Scholar] [CrossRef]
- Garsetiasih, R.; Heriyanto, N.M.; Adinugroho, W.C.; Gunawan, H.; Dharmawan, I.W.; Sawitri, R.; Yeny, I.; Mindawati, N. Connectivity of vegetation diversity, carbon stock, and peat depth in peatland ecosystems. Glob. J. Environ. Sci. Manag. 2022, 8, 369–388. [Google Scholar] [CrossRef]
- Volkova, L.; Krisnawati, H.; Adinugroho, W.C.; Imanuddin, R.; Qirom, M.A.; Santosa, P.B.; Halwany, W.; Weston, C.J. Identifying and addressing knowledge gaps for improving greenhouse gas emissions estimates from tropical peat forest fires. Sci. Total Environ. 2021, 763, 142933. [Google Scholar] [CrossRef]
- Van Wagner, C.E. The line intersect method in forest fuel sampling. For. Sci. 1968, 14, 20–26. [Google Scholar]
- Agus, F.; Hairiah, K.; Mulyani, A. Measuring Carbon Stock in Peat Soils: Practical Guidelines; World Agroforestry Centre: Bogor, Indonesia, 2010. [Google Scholar]
- Intergovernmental Panel on Climate Change (IPCC). Chapter 4: Forest Land. In 2006 IPCC Guidelines for National Greenhouse Gas Inventories (Agriculture, Forestry and Other Land Use); Aalde, H., Gonzalez, P., Gytarsky, M., Krug, T., Kurz, W.A., Ogle, S., Raison, J., Schoene, D., Ravindranath, N.H., Elhassan, N.G., et al., Eds.; Institute for Global Environmental Strategies (IGES) for the Intergovernmental Panel on Climate Change (IPCC): Hayama, Japan, 2006; Volume 4, p. 83. [Google Scholar]
- Manuri, S.; Brack, C.; Rusolono, T.; Noor’an, F.; Verchot, L.; Maulana, S.I.; Adinugroho, W.C.; Kurniawan, H.; Sukisno, D.W.; Kusuma, G.A.; et al. Effect of species grouping and site variables on aboveground biomass models for lowland tropical forests of the Indo-Malay region. Ann. For. Sci. 2017, 74, 23. [Google Scholar] [CrossRef] [Green Version]
- Intergovernmental Panel on Climate Change (IPCC). Chapter 4: Forest Land. In 2019 Refinement to the 2006 IPCC Guidelines for National Greenhouse Gas Inventories (Agriculture, Forestry and Other Land Use); Blain, D., Agus, F., Alfaro, M.A., Vreuls, H., Eds.; IPCC: Geneva, Switzerland, 2019; Volume 4, p. 68. [Google Scholar]
- Kauffman, J.B.; Arifanti, V.B.; Basuki, I.; Kurnianto, S.; Novita, N.; Murdiyarso, D.; Donato, D.C.; Warren, M.W. Protocols for the Measurement, Monitoring, and Reporting of Structure, Biomass, Carbon Stocks and Greenhouse Gas Emissions in Tropical Peat Swamp Forests; Center for International Forestry Research: Bogor, Indonesia, 2016. [Google Scholar]
- Wendt, J.W.; Hauser, S. An equivalent soil mass procedure for monitoring soil organic carbon in multiple soil layers. Eur. J. Soil Sci. 2013, 64, 58–65. [Google Scholar] [CrossRef]
- Mueller-Dombois, D.; Ellenberg, H. Vegetation Ecology: Objectives and Methods (Translation of Aims and Methods of Vegetation Ecology by K. Kartawinata & R. Abdulhadi); LIPI Press and Yayasan Pustaka Obor: Jakarta, Indonesia, 2016. [Google Scholar]
- Purvis, A.; Hector, A. Getting the measure of biodiversity. Nature 2000, 405, 12–19. [Google Scholar] [CrossRef]
- Oksanen, J.; Blanchet, F.G.; Friendly, M.; Kindt, R.; Legendre, P.; McGlinn, D.; Minchin, P.R.; O’Hara, R.B.; Simpson, G.L.; Solymos, P.; et al. Vegan: Community Ecology Package. R Package Version 2.5–7. 2020. Available online: https://cran.r-project.org/web/packages/vegan/index.html (accessed on 1 April 2022).
- R Core Team. R: A Language and Environment for Statistical Computing; R Foundation for Statistical Computing: Vienna, Austria, 2020. [Google Scholar]
- Kent, M. Vegetation Description and Data Analysis: A Practical Approach; John Wiley & Sons: New York, NY, USA, 2011. [Google Scholar]
- Goswami, M.; Bhattacharyya, P.; Mukherjee, I.; Tribedi, P. Functional Diversity: An Important Measure of Ecosystem Functioning. Adv. Microbiol. 2017, 7, 82–93. [Google Scholar] [CrossRef] [Green Version]
- Legendre, P.; Legendre, L. Numerical Ecology, 2nd ed.; Elsevier Science BV: Amsterdam, The Netherlands, 1998. [Google Scholar]
- Wickham, H.; Chang, W.; Henry, L.; Pedersen, T.L.; Takahashi, K.; Wilke, C.; Woo, K.; Yutani, H.; Dunnington, D. Ggplot2: Create Elegant Data Visualisations Using the Grammar of Graphics; R Package Version 3.1.3. 2021. Available online: https://cran.r-project.org/web/packages/ggplot2/index.html (accessed on 1 April 2022).
- Gimeno-García, E.; Andreu, V.; Rubio, J.L. Changes in organic matter, nitrogen, phosphorus and cations in soil as a result of fire and water erosion in a Mediterranean landscape. Eur. J. Soil Sci. 2000, 51, 201–210. [Google Scholar] [CrossRef] [Green Version]
- Hashimotio, T.; Kojima, K.; Tange, T.; Sasaki, S. Changes in carbon storage in fallow forests in the tropical lowlands of Borneo. For. Ecol. Manag. 2000, 126, 331–337. [Google Scholar] [CrossRef]
- Domke, G.M.; Perry, C.H.; Walters, B.F.; Woodall, C.W.; Russell, M.B.; Smith, J.E. Estimating litter carbon stocks on forest land in the United States. Sci. Total Environ. 2016, 557, 469–478. [Google Scholar] [CrossRef]
- Shofiyati, R.; Las, I.; Agus, F. Indonesian soil database and predicted stock of soil carbon. In Proceedings of the International Workshop on Evaluation and Sustainable Management of Soil Carbon Sequestration in Asian Countries, Bogor, Indonesia, 28–29 September 2010; pp. 28–29. [Google Scholar]
- Cui, X.; Gao, F.; Song, J.; Sang, Y.; Sun, J.; Di, X. Changes in soil total organic carbon after an experimental fire in a cold temperate coniferous forest: A sequenced monitoring approach. Geoderma 2014, 226, 260–269. [Google Scholar] [CrossRef]
- Certini, G.; Nocentini, C.; Knicker, H.; Arfaioli, P.; Rumpel, C. Wildfire effects on soil organic matter quantity and quality in two fire-prone Mediterranean pine forests. Geoderma 2011, 16, 148–155. [Google Scholar] [CrossRef]
- Guariguata, M.R.; Ostertag, R. Neotropical secondary forest succession: Changes in structural and functional characteristics. For. Ecol. Manag. 2001, 148, 185–206. [Google Scholar] [CrossRef]
- Matius, P.; Toma, T.; Sutisna, M. Tree species composition of a burned lowland dipterocarp forest in Bukit Soeharto, East Kalimantan. In Rainforest Ecosystems of East Kalimantan; Springer: Tokyo, Japan, 2000; pp. 99–106. [Google Scholar]
- Toma, T.; Matius, P.; Kiyono, Y.; Watanabe, R.; Okimori, Y. Dynamics of burned lowland dipterocarp forest stands in Bukit Soeharto, East Kalimantan. In Rainforest Ecosystems of East Kalimantan; Springer: Tokyo, Japan, 2000; pp. 107–119. [Google Scholar]
- Mori, T. Effects of droughts and forest fires on dipterocarp forest in East Kalimantan. In Rainforest ecosystems of East Kalimantan; Springer: Tokyo, Japan, 2000; pp. 29–45. [Google Scholar]
- Cleary, D.F.; Priadjati, A.; Suryokusumo, B.K.; Menken, S.B. Butterfly, seedling, sapling and tree diversity and composition in a fire-affected Bornean rainforest. Austral Ecol. 2006, 31, 46–57. [Google Scholar] [CrossRef]
- Van de Perre, F.; Willig, M.R.; Presley, S.J.; Bapeamoni Andemwana, F.; Beeckman, H.; Boeckx, P.; Cooleman, S.; de Haan, M.; De Kesel, A.; Dessein, S.; et al. Reconciling biodiversity and carbon stock conservation in an Afrotropical forest landscape. Sci. Adv. 2018, 4, eaar6603. [Google Scholar] [CrossRef] [Green Version]
- Khapugin, A.A.; Vargot, E.V.; Chugunov, G.G. Vegetation recovery in fire-damaged forests: A case study at the southern boundary of the taiga zone. For. Stud. 2016, 64, 39. [Google Scholar] [CrossRef] [Green Version]
- Mohebi, Z.; Mirzaei, H. Biodiversity and integration of ecological characteristics of species in spatial pattern analysis. Glob. J. Environ. Sci. Manag. 2021, 7, 473–484. [Google Scholar]
- Bond, W.J.; Midgley, J.J. Ecology of sprouting in woody plants: The persistence niche. Trends Ecol. Evol. 2001, 16, 45–51. [Google Scholar] [CrossRef]
- Clarke, P.J.; Lawes, M.J.; Midgley, J.J.; Lamont, B.B.; Ojeda, F.; Burrows, G.E.; Enright, N.J.; Knox, K.J.E. Resprouting as a key functional trait: How buds, protection and resources drive persistence after fire. New Phytol. 2013, 197, 19–35. [Google Scholar] [CrossRef] [Green Version]
- Nolan, R.H.; Collins, L.; Leigh, A.; Ooi, M.K.; Curran, T.J.; Fairman, T.A.; Resco de Dios, V.; Bradstock, R. Limits to post-fire vegetation recovery under climate change. Plant Cell Environ. 2021, 44, 3471–3489. [Google Scholar] [CrossRef] [PubMed]
- Chazdon, R.L. Tropical forest recovery: Legacies of human impact and natural disturbances. Perspect. Plant Ecol. Evol. Syst. 2003, 6, 51–71. [Google Scholar] [CrossRef] [Green Version]
Publisher’s Note: MDPI stays neutral with regard to jurisdictional claims in published maps and institutional affiliations. |
© 2022 by the authors. Licensee MDPI, Basel, Switzerland. This article is an open access article distributed under the terms and conditions of the Creative Commons Attribution (CC BY) license (https://creativecommons.org/licenses/by/4.0/).