Article

What Is the Link between Strategic Innovation and Organizational Sustainability? Historical Review and Bibliometric Analytics

1
Department of Management Information Systems, National Chengchi University, Taipei 116011, Taiwan
2
Department of International Business, National Chengchi University, Taipei 116011, Taiwan
*
Author to whom correspondence should be addressed.
Sustainability 2022, 14(11), 6937; https://doi.org/10.3390/su14116937
Submission received: 2 May 2022 / Revised: 28 May 2022 / Accepted: 31 May 2022 / Published: 6 June 2022

Abstract

:
The academic and practical are very acquainted with both strategic innovation (SI) and organizational sustainability (OS) at present, but a literature review revealed that there are few studies discussing the correlation between SI and OS in these two subjects. This study attempts to identify and classify these articles (SI and OS) in publications. Seven spotlights are noted in this paper in terms of the (1) published year, (2) citation report, (3) country/territory, (4) affiliation name, (5) document type, (6) Web of Science (WoS) categories, and (7) publication titles. A total of 125 (SI = 70 and OS = 55) articles were retrieved from the Social Sciences Citation Index (Web of Science). We applied a bibliometric analytics technique to depict a panorama among the core journals, document characteristics, and research trends over thirty years (1991–2021) by setting the article titled as “strategic innovation” or “organizational sustainability” in the SSCI electronic database. In this study, Bradford’s law was necessarily adapted to examine how many journal papers were frequently cited. These journals could be an exceptional reference for rising researchers to swiftly detect relevant information. The Kolmogorov–Smirnov (abbreviation: K–S) test was also conducted to survey whether the author’s productivity complied with Lotka’s law. The benchmarks were broadened to evaluate the capability and academic standing of different authors in a certain subject area. The results unveiled that comparing the expansionary scope of SI and OS research can fit well with industry, government, academia, and research for their various requirements, functions, and schemes. According to the above analysis, these findings simultaneously constitute an adequate preparation and represent a blueprint for those who need to refer to the collections to formulate an appropriate research platform in the near future.

1. Introduction

Bibliometrics is a research field that explores the characteristics of social science in a quantitative manner, and its research results are an important reference resource for social science researchers and practitioners. The research literature on social science has grown significantly and has accumulated a considerable amount of research results. From the relatively high journal impact factor of many well-known journals, it can be understood that bibliometrics has become an essential international research topic.
As stated by two well-known guest editors Park and Jeong in this special issue, we were aware that it is difficult to find current experiences that attempt to examine the two research fields of strategic innovation (SI) and organizational sustainability (OS) by connecting them. Due to the lack of relevant literature, it is impossible to grasp in which disciplines researchers should invest in the relative aspects of SI and OS, as well as the characteristics and trends of the overall research.
For the above reasons, we believe that it is necessary to explore the development of research in SI and OS aspects. In order to present the research characteristics and trends of SI and OS in bibliometrics, this study selected the SSCI electronic database (WoS) and exploited the relevant literature on SI and OS. Further, the bibliometric method was applied to analyze the characteristics. Seven spotlights are highlighted in this paper in terms of (1) published year, (2) citation report, (3) country/territory, (4) affiliation name, (5) document type, (6) Web of Science (WoS) categories, and (7) publication titles, and the trends in different periods are compared. The results then put forward relevant recommendations.
Bibliometrics can provide researchers with the characteristics of bibliographic data to analyze the characteristics and trends of research documents in various fields. Therefore, this study utilizes bibliometrics to analyze the characteristics and trends of SI and OS research documents. In this study, we conducted a compact literature review and induction in the introduction that would identify the current research areas and potential future research directions, thus, providing a roadmap for further research. The paper outlines the research purposes as the following statements:
(1)
To investigate the core journals, document characteristics, and research trends over thirty years (1991–2021) both in the SI and OS research domains.
(2)
To examine how many journal papers are frequently cited. These journals can be an exceptional reference for rising researchers to swiftly detect relevant information.
(3)
To explore the relationship between the number of authors and the number of publications

1.1. Strategic Innovation

Strategic innovation has become a very popular keyword during the past 30 years and multitudinous well-known scholars have provided extraordinary expositions on strategic innovation [1,2,3]. Strategic innovation means that organizations can innovate in their value chain, establish new operating models, alter the rules of competition in their environment, and increase their competitive advantage, so as to obtain a fresh benefit. Anderson and Markides alleged in an article that innovation in developing markets is less about finding new customers and more about addressing issues, such as product acceptability, affordability, usability, and awareness [4]. Markides proposed that an enterprise can strategically redefine its business and catch its major competitors off guard by breaking the rules and thinking of new ways to compete [5,6]. Talke, Salomo and Kock asserted that the orientation of strategic innovation, which is aimed at discovering and satisfying emerging demands with novel technological solutions, has repeatedly been shown to be conclusive for a firm’s innovativeness and performance [7]. Strategic innovation involves the creation of growth strategies, business models, new product categories, or services that change the competition and generate a significant new value for customers, consumers, and the corporation [8,9,10].
Strategic innovation is the imperative element of strategic management that is expected for acquiring a competitive advantage [11]. Strategic innovation should follow three significant steps: deliberation, programming and execution, to then find its new benefit. Numerous researchers have developed a series of theories, definitions, constructs, and procedures [7,12], all directed towards dealing with objectives in order to describe the framework of strategic innovation as a methodology. Previous studies have contributed to distinct strategic innovation operational objects, concepts, definitions, frameworks, paradigms, perspectives, propositions, determinants, and impacts, which have been described for investigating the question of what strategic innovation is [13,14,15,16,17,18]. Many highly cited articles express the importance of strategic innovation from remarkable perspectives. Galambos and Sturchio examined small biotech startups that forced large firms to develop new strategies for innovation in the pharmaceutical industry [19]. Pitt and Clarke proposed a knowledge perspective on the management of strategic innovation and explored the conceptual links between knowledge development and the management of strategic innovation [20]. They also argued that strategic innovation is the purposeful orchestration of organizational knowledge development and application. Kodama presented the aim of implementing strategic innovation, where companies deliberately integrated the above strategies based on event-based pacing practiced by the existing organizational bodies in a Japanese case study [21]. Furthermore, Charitou and Markides disputed that disruptive strategic innovation may not necessarily be superior to the traditional instruments of competing, claiming that rushing to embrace them can be detrimental for established companies when other responses, including ignoring the innovation, may make more sense [22].
Strategic innovation is not a one-shot tournament and continuous innovation in both operations and strategies is the long-term way for an organization to survive, that is, offense is absolutely the best defense. Otherwise, the innovation will be imitated by competitors and then it just become a flash in the pan under long-term observation [11].

1.2. Organizational Sustainability

Contrary to strategic innovation, organizational sustainability has become an emerging subject of concern in the last decade. Organizational sustainability is productive as the result of a congruent ideology of economic, societal, and ecological concerns that have an influence on human resources management [23]. Paulraj evaluated empirically the relationships between internal resources and capabilities, sustainable supply management, and organizational sustainability. Organizational growth refers to the natural expansion of size and development is the ability to improve by taking advantage of opportunities [24]. Carayannis, Sindakis and Walter provided insights on organizational design and governance, and the role that different stakeholders, predominantly customers, and partners play in the innovation process towards organizational sustainability [25], whereas Lopes et al. considered how organizational sustainability increasingly focuses on how to manage a new knowledge of ideas and practices that can expand a business [26].
A sustainability organization is (1) an organized group of people that intends to advance sustainability and/or (2) those actions of organizing something sustainably. Unlike in many business organizations, organizational sustainability is not limited to implementing sustainability strategies that provide an organization with economic and cultural benefits attained through environmental responsibility. For organizational sustainability, sustainability can also be an end in itself without further justifications. Florea, Cheung and Herndon integrated scholarship on organizational sustainability, human resource practices and values in delineating how four specific values—altruism, empathy, a positive norm of reciprocity, and private self-effacement—support effective human resource practices in organizations. They suggested that ethical and multicultural values are essential for planning and implementing effective management practices and organizational sustainability [27]. Moizer and Tracey constructed a causal-loop diagram that illustrates the relationships between resource allocation and a number of other variables thought to influence the sustainability of social enterprises [28].
In recent years, more abundant studies have attached significance to the comprehensive interdisciplinary nature of organizational sustainability, e.g., a conceptual framework in different cultural settings [29]; an exploration involving themes, functional areas, and the corresponding best practices to purpose a framework supporting the theoretical models [30]; the impacts of Lean Six Sigma over organizational sustainability [31]; the interplay between organizational sustainability, knowledge management, and open innovation [26]; a complex adaptive systems perspective on driving innovation capabilities [32]; a survey on the three dimensions of environmental, social, and economic/or government practices [33,34,35]; an empirical study by an integrated perspective on organizational trust, employee–organization relationships and innovative behavior [36]; and integrated quality and supply chain management business diagnostics for organizational sustainability improvement [37].
The Environment, Society, and Governance are closely related to the necessary costs related to Q (product quality), C (cost), D (transportation), and S (service) in the supply process of an original enterprise. The benefits are to make the most suitable solutions for altruistic purposes, mutual benefit, win–win outcomes and common sustainable development. Sustainability has many considerable sub-issues at the organizational gradation. For example, sustainability intends to translate the perfect harmony between the grace of heaven, earth, and humankind, namely, the process of maintaining an environmental consensus and balance between resource exhaustion, investment evaluation, technological elaboration, and institutional transformation when people meet human needs for future continuation. Sustainability can be an idea, a way of life, a method of improving, or an upgrade of an organizational system.

1.3. The Connection between Strategic Innovation and Organizational Sustainability

Strategic innovation can be a methodology or strategy deployment, but interdisciplinary consolidation, and multipurpose and multidimensional exploitations are emphasized by organizational sustainability. Nevertheless, the requirement for strategic innovation of an organization denotes that in the process of pursuing long-term survival and sustainable development, an organization needs to accomplish its ambitions and ensure a leading position [11]. Sustainability can also empower an organization to maintain its strengths and continue to gain advantages in already leading its competitive province and for future expansion. Moreover, it will achieve the ability to grow steadily over a long period of time. Partidario and Vergragt addressed a new way of influencing and stimulating technological innovations towards sustainability in a case study that gathered information about its production, environmental aspects, and technological innovations and applications [38]. Govindarajan and Trimble conducted an in-depth review of ten organizations, and they identified what the organizational DNA is for strategy innovation [39]. Through open innovation, companies can leverage knowledge management into an asset that promotes sustainable innovations that influence back on to organizational sustainability [26]. Yang examined the association between a team’s incivility climate and the team members’ perceived support for innovation, and they also discussed practical implications for organizational sustainability [40].
Strategic innovation refers to the process and result of continuous organizational expansion of an objective intent and an organization’s own cognition and behavior in order to meet its demands [41,42,43]. Specifically, strategic innovation is often the activity in an organization that follows the law of development of things for certain purposes and which changes the whole or some parts thereof so that they can be updated and developed. Carayannis, Sindakis and Walter explained how organizational sustainability would be affected, when innovation was performed in particular organizational designs and through the governance of manufacturers in developing countries [25]. Meanwhile, Yang concluded that there was a negative effect from a sentiment of team incivility against innovation for organizational sustainability [39]. Lopes et al. summarized in a case study: knowledge management and open innovation play a key role in effective organizational sustainability [26], while van de Wetering, Mikalef and Helms believed that information technology is a part of innovation capabilities that enhance organizational sustainability through information technology flexibility, partner collaboration, and environmental business factors [31]. In addition, Kilintzis et al. reported on innovation and its effects on the organizational sustainability of a population of small- and medium-sized enterprises with certain organizational characteristics [44].
As mentioned above in detail, the vast majority of the literature implicates innovation in being involved as a part of a strategy that built on the fundamental notion of organizational sustainability. Strategic innovation can be utilized by organizations through the definition and adjustment of their operational scope; the creation and accumulation of core resources, and the construction and strengthening of their corporate networks [45,46]. In addition, as many various categories of strategies are increasingly being applied, organizations are seeking more practical methods to make sense of what innovations they can postulate. This has led first to in-house management identifying better sustainability criteria. Moreover, when armed with the professionals to augment additional innovations, organizations are empowered to evaluate what sustainability innovations they are working towards. We believe that strategic innovation is not merely supportive of but also positively related to organizational sustainability [42,47].

2. Research Datasets and Methodology

2.1. Datasets

The Social Sciences Citation Index™ (SSCI) contains more than 3400 journals covering 58 social science disciplines, as well as a curated content from 3500 of the world’s top scientific and technical journals. It includes over 9.37 million records and 122 million cited references dating from 1900 to the present.
All journals selected for inclusion in the SSCI are fully indexed. For each article, researchers can retrieve all authors, their affiliations, abstracts, and keywords (if provided by the authors), including institutional and grant acknowledgments (if provided), and all cited references.
A true citation reference search allows researchers to find anything that has ever been cited in the SSCI’s 122 million citation reference links. The citation reference search feature allows researchers to track how any idea, innovation, or creative work has been identified, applied, improved, extended, or revised, and to discover anyone around the world who is citing their research. As per the above explanations, we selected the SSCI electronic database for data collection.

2.2. Methodology

Bibliometrics was proposed by Pritchard, and it is affirmed as “the application of mathematical and statistical methods to show the processing of textual information by calculating and analyzing different levels of textual information, and the development of a discipline, nature and trends” [3]. Bibliometrics, Informetrics and Scientometrics, abbreviated as “Three metrics”, are the basis of network information metrics. Broadus asserted the definitions of the term ”bibliometrics” as used in the literature which are examined and evaluated [48].
Citation analysis is an important research topic in bibliometrics. It is the examination of the frequency, patterns, and graphs of citations in documents. Tsai believes that citation analysis involves exploring and analyzing the relationship between source works and cited works, and understanding the relationship between works from the citation behavior of various forms of literature, for example, gender, the citation characteristics of each subject area, and the subject status of works and authors. In terms of application, it can be applied to understanding disciplines, information retrieval, library collection development, etc., [49,50,51].
Moed et al. applied bibliometric data to measure the performance of university research [52], while Moed, Debruin and van Leeuwen created new bibliometric tools and overviewed all articles published by authors from the Netherlands, describing the various types of information added to the database [53]. Nederhof claimed there were limitations of the SSCI database for monitoring research performance but that it was still advantageous [54]. Costas, van Leeuwen and Bordons emphasized the identification and description of top scientists from structural and bibliometric perspectives and proposed a classificatory approach in the support of research assessment at the individual level and for exploring the potential determinants of research success [55]. Diem and Wolter indicated that Google Scholar is inclusive, but that it impedes a meaningful interpretation of the data. Meanwhile, the Web of Science inclusion policy for journals is associated with certain shortcomings that place some researchers at an unjustified disadvantage [56].
To sum up, briefly, bibliometrics is an agreeable methodology, which can objectively evaluate both the authors’ literature productivity and perform a research trend analysis [52,53,54,55,56,57,58,59,60,61].

2.2.1. Bradford’s Law

Bradford’s law [62] is commonly used to examine the practical potentials of Bradford’s law in relation to core-journal identification [63]. It can be utilized to identify the most highly cited journals for a field or subject [64]. Bradford’s law is also known as Bradford’s law of scattering or the Bradford distribution as it delineates how the articles on a particular subject are scattered throughout a mass of periodicals. One formulation considers that if the journals in a field are sorted by a number of articles into three groups, each with about one-third of all the articles, then the number of journals in each group will be proportional to 1 : a : a 2 , a is the Bradford constant, a > 1 . There are a number of related formulations of the principle.
Taking a practical example, suppose that a researcher has five core journals for a primary subject. In a month there are 12 articles of interest in those journals. In order to find another dozen articles of interest, the researchers would have to go to an additional 10 journals. Therefore, that researcher’s Bradford multiplier b m is 2 (i.e., 10/5). For each new dozen articles, the researcher needs to look in b m times as many journals. After looking in 5, 10, 20, etc., journals, most researchers will quickly realize that there is little point in looking further.
Bradford describes the theory of the law in words and diagrams of the actual observed phenomena. From Bradford’s law, it is a fact that frequently cited articles are taken from a few core journals, showing diminishing returns. This law not only provides an important theoretical basis for the cost–benefit analysis of a journal’s subscription but it has also become an important distribution law in bibliometrics since then.
In this study, we will observe the distribution of literature to identify the relationship between the number of journals in the core area, related areas, and non-related areas.

2.2.2. Lotka’s Law

Lotka’s law concerns the frequency of publication by authors in a designated field. It notes that “the number (of authors) making n contributions are about 1 n 2 . of those making one, and the proportion of all contributors that make a single contribution, is approximately 60%” [28]. Lotka’s law is stated by the following formula where y . is the number of authors making x contributions, and the exponent n and the constant c are parameters to be estimated from a given set of author productivity data. It appears that authors who have contributed one article, account for 65% of all authors, and those who have published two articles approximately 15%, while those who have achieved three articles are roughly 6.5%, etc. Lotka’s law, when applied to a large scale of articles over a fairly long period of time, can be accurate in general, but not statistically precise. It is often used to estimate the frequency with which authors will appear in an online catalog.
Lotka’s law is generally adopted for understanding the productivity patterns of authors in a bibliography [65,66,67]. In this study, Lotka’s law was selected to conduct bibliometric analysis to illustrate the number of publications versus the accumulated authors between 1991 and 2021 by setting the article titled as “strategic innovation” or “organizational sustainability” in the SSCI database. We also inspected author productivity and extracted the results for research tendency in the near future. To verify the analysis, we attempted to implement the K–S test to evaluate whether the result matched Lotka’s law [68].

2.3. Research Framework

Conducting the bibliometric analytical techniques, we analyzed strategic innovation (SI) and organizational sustainability (OS) between 1991 and 2021 by setting articles titled as “strategic innovation” or “organizational sustainability” in the SSCI database. This study intended to identify and classify these articles (SI and OS) in publications that depict a panorama among the core journals, document characteristics, and research trends.
Seven spotlights are paid attention to in this paper in terms of (1) published year, (2) citation report, (3) country/territory, (4) affiliation name, (5) document type, (6) Web of Science (WoS) categories, and (7) publication title. The observations were made for different figure distribution statuses in order to explore the correlations between strategic innovation and organizational sustainability under the above criteria.
As for the verification of its analysis, we implemented the following steps to check whether the analysis followed either Bradford’s law or Lotka’s law.

2.3.1. Bradford’s Law

(1)
Data collection from the SSCI electronic database.
(2)
Organize a list of publications and citations.
(3)
Rank according to the number of references of journal articles from most occurring to least.
(4)
Divide numbers into several areas: (a) the area of the core journal is closely related to the subject; (b) the other areas with the same number of articles as the section of the core journal. The number of journals in the area of the core journal and the following areas will be in a ratio of 1 : a : a 2 .
(5)
According to the analysis of the actual data, separately rank the journals of SI and OS in order of the number of referenced articles in descending order which can be divided into several portions, each accounting for 1 3 of the total number of referenced articles. The area 1 is the core journals, recording a few journals with the highest frequency cited, assuming that the number of journals is n 1 ; the area 2 comprises related journals with the second-highest frequency of reference, assuming that the number of journals is n 2 ; the last part contains the lowest frequency of citation and is assumed to be n 3 . This distribution law is:
n 1 : n 2 : n 3 = 1 : a : a 2 ,   a   is   constant
(6)
Since the ratios of area 2 to area 1, and area 3 to area 2, is a range from 2 to 7, Bradford suggested that the ratio of the constant 5 could represent its data. Bradford described his law graphically; therefore, according to the above, the logarithm L o g   n . of the number of ranked journals was used to plot the relative cumulative number of citations of the journals R ( n ) . The diagram is initially an upward curve, and after a certain point, converts to a straight line.

2.3.2. Lotka’s Law

(7)
Data collection from the SSCI electronic database.
(8)
Organize a list of publications and citations.
(9)
Perform the calculation of the slope, namely, the value of n .
(10)
According to Lotka’s law, the generalized formula is x n y = c , where the value of n is 2 . The parameter n . of the applied field is calculated by the least square method using the following formula:
n = N X Y X Y N X 2 ( X ) 2
where n . is the number of pairs of data, X is the logarithm of the publications ( x ) and Y is the logarithm of the authors ( y ) .
(11)
The least square method is utilized to estimate the best value for the slope of a regression line which is the exponent n for Lotka’s law. The slope is usually calculated without data points representing the authors of high productivity. Since the values of the slope change with a different number of points for the same set of data, we have made several computations of n . The median or the mean values of n can also be identified as the best slope for the observed distribution and different values of n produce different values of the constant c .
(12)
Perform the calculation of the constant, namely, the value of c .
(13)
According to Lotka’s law, the generalized formula is x n y = c , where the value of c is 0.6079. The parameter c of the applied field is calculated using the following formula:
c = 1 1 p 1 1 x n + 1 ( n 1 ) p n 1 + 1 2 p n + n 24 ( p 1 ) n + 1 .
where p is 20, n is the value obtained in (9) performing the calculation of the value of n , and x is the number of publications.
(14)
Adopt the K–S test to evaluate whether the analysis matches Lotka’s law. Pao suggests the K–S test, is a goodness-of-fit statistical test to assert that the observed author productivity distribution is not significantly different from a theoretical distribution. The hypothesis concerns a comparison between the observed and expected frequencies. The experiment allows for the determination of the associated probability that the observed maximum deviation occurs within the limits of chance. The maximum deviation between the cumulative proportions of the observed and theoretical frequency is determined by the following formula [68]:
D = M a x | F o ( x ) S n ( x ) |
F o ( x ) = theorical   cumulative   frequency
S n ( x ) = observed   cumulative   frequency
(15)
The examination is exercised at the 0.01 level of significance. When the sample size is greater than 35, the critical value of significance is calculated by the following formula:
The   critical   value   at   the   0.01   level   of   significance   = 1.63 y
y = the   total   population   under   study
(16)
If the maximum deviation falls within the critical value, the null hypothesis that the data set conforms to Lotka’s law can be accepted at a certain level of significance, but if it exceeds the critical value, the null hypothesis must be rejected at a certain level of significance, and it must be concluded that the observed distribution is significantly different from the theoretical distribution [68,69].

3. Results

3.1. Panorama by Publication Year

A total of 125 (SI = 70, OS = 55) articles were retrieved from the Social Sciences Citation Index (Web of Science) and timed to coincide with every publication. Figure 1 indicates the article distributions for strategy innovation (SI) and organizational sustainability (OS) between the years 1991 and 2021. Three intervals were divided to extract the article distributions: (1) from 1991 to 2000, (2) from 2001 to 2010, and (3) from 2011 to 2021. It can be attentively observed that the status of the cumulative published literature every 10 years for the relevant publications for SI were separately SI (1) = 18 articles (25.71%); SI (2) = 20 articles (28.57%); SI (3) = 37 articles (52.86%), and those associated with OS were OS (1) = 0 articles (0%); OS (2) = 3 articles (5.45%); OS (3) = 52 articles (94.55%), respectively. It appears that the publication productivity per annum steadily increased in the SI research field, while the OS did not draw many researchers’ attention before the year 2010, followed by rapid growth in the last five years. Since the year 2017, as well as what can be inferred from the literature analysis, OS has become an essential subject. New research topics are being emphasized to stimulate research momentum that implies that the study of OS has the great potential to grow in the near future.

3.2. Panorama by Citation Report

Figure 2 illustrates the citation distributions for strategy innovation (SI) and organizational sustainability (OS) between 1991 and 2021. The citation distributions for SI were in a steady ascent since the year 2001, followed by dramatic growth, and then rapidly peaked in the year 2017 for OS. The result indicates that OS has become an important topic of concern in recent years. All the published articles on SI had been cited 1739 times and attained a figure of 1699 times after deducting the self-citations. The average number of citations per annum was 24.84, and the H-index was 19. The total published articles on OS were cited 1326 times and reached 1305 citations after removing the self-citations. The average number of citations per annum was 24.11, and the H-index was 18.

3.3. Panorama by Country/Territory

Table 1 lists in detail the most published country/territory between 1991 to 2021. In the research subject on SI, the USA published SI = 18 articles (25.71%) that occupied the number one spot, followed by England SI = 16 (22.86%), and Switzerland SI = 6 (8.57%). The same as for the SI subject, the USA contributed OS = 21 articles (38.18%) and remained as the number one ranking for the OS aspect, the Peoples Republic of China contributed OS = 6 articles (10.91%), and Turkey OS = 5 (9.09%), ranked as number two and number three in this research domain, respectively.

3.4. Panorama by Affiliation Name

Table 2 attempts to interpret which institutions had outstanding academic contributions on both the SI and OS aspects. The authors may have included contributions from different countries or regions in one article, therefore some double counting was present, but this did not affect the study.
In the SI-related research domain, the University of London (NP = 5, 7.14%), League of European Research Universities (LERU)(NP = 4, 5.71%), and London Business School (NP = 4, 5.71%), ranked as the tier one erudite institutions. These 3 academies had published a total of 9 articles (12.86%) that reached an entire 760 citations over the past 30 years, an average of 29.23 citations per year. On further observation, 9 organizations had published two or more articles, and a total of 19 articles (27.14%) reached an entire 917 citations in 3 decades, an average of 35.27 citations per year.
On the other hand, the University of Wisconsin-Madison (NP = 3, 5.45%), and the University of Wisconsin System (NP = 3, 5.45%) were both affiliations tied for first place in the OS research territory. After inspection, this was for the same three articles but they were labelled with two different institutional names. After deducting the double-counting, 14 academies had contributed 2 or more articles, and an overall of 16 articles (29.09%) reached an aggregate of 281 citations in 10 years, an average of 31.22 citations per year.

3.5. Panorama by Document Types

A diversity of document formats is represented in academic research. Articles, Review articles, and Early Access are three well-known document types both in the SI and OS research aspects.
Table 3 clearly indicates that the “Article” is the principal standard of academic publication. An article may have had two or more document types, but this did not interfere with the study. The majority of publications on SI was 46 (65.71%), and for OS it was 48 (87.27%).

3.6. Panorama by Web of Science (WoS) Categories

The Web of Science (WoS) has set a literature classification for researchers. Table 4 enumerates the fundamental information for future research tendencies both on SI and OS, allowing researchers a better understanding of the distributions of the primary subject categories in future studies. A publication may have had two or more Web of Science categories, but this did not influence the study.
The most published subject in the SI category was Management (NP = 47, 67.14%), followed by Business (NP = 31, 44.29%) and Economics (NP = 7, 10.00%). Likewise, Engineering Industrial (NP = 6, 8.57%) and Information Science Library Science (NP = 5, 7.14%) were two significate subjects in the SI aspect. In the OS research field, Green Sustainable Science Technology (NP = 27, 49.09%), Environmental Sciences (NP = 24, 43.64%), and Environmental Studies (NP = 19, 34.55%) were ranked as the tier one class of studies. Moreover, Management (NP = 16, 29.9%), Business (NP = 8, 14.55%), and Engineering Environmental (NP = 5, 9.09%) were the other three considerable subjects published.
The citation report of the designated category is also an important indicator for further progressional research reference. Table 4 discloses the detailed data of citations. In the SI classification, Management (TC = 1503), and Business (TC = 1304) ranked as the top two subjects in the citation report. The number of citations for Engineering Industrial (TC = 163) and Multidisciplinary Sciences (TC = 110) were not large but were also noteworthy research categories. Simultaneously, Management (TC = 612), Green Sustainable Science Technology (TC = 534), Environmental Sciences (TC = 484), Environmental Studies (TC = 312), and Business (TC = 239) were the top five categories of citations in the OS research subject. Different from the SI study field, there were several categories such as Engineering Environmental (TC = 186), Engineering Industrial (TC = 147), and Ethics (TC = 143) that also had a highly cited index.
From the above analysis, it can be seen that the citations related to SI were concentrated in a few areas, and the relative distribution of citations related to OS was average across 10 categories.

3.7. Panorama by Publication Title

Table 5 highlights those journals which had two or more academic publications by journal title classification. The Sloan Management Review (NP = 8, 11.43%), Journal of Production Innovation Management (NP = 4, 5.71%), and Journal of Strategic Information Systems (NP = 4, 5.71%) were ranked as the topmost three journals in the SI research domain. Meanwhile, Sustainability (NP = 17, 30.91%), and the Journal of Cleaner Production (NP = 5, 9.09%) were named as the top two prominent journals in the OS academic field.
In addition, the MIT Sloan Management Review (TC = 341), Sloan Management Review (TC = 312), Journal of Production Innovation Management (TC = 161), European Management Journal (TC = 156), and Technology Analysis Strategic Management (TC = 98) were the most common journals for citations in the SI academic field. Simultaneously, the study found that Sustainability (TC = 264), the Journal of Cleaner Production (TC = 186), and Systems Research and Behavioral Science (75) were ranked as the top three cited journals in the OS scholarly aspect.

4. Discussion

In this section, we will execute the designated procedures that are listed in Section 2.3.1 and Section 2.3.2 to identify whether the publications’ distribution followed Bradford’s law or whether the authors’ productivity followed Lotka’s law, both in the SI and OS research aspects.

4.1. The Test of Distribution of Publications by Bradford’s Law for Both SI and OS

4.1.1. Strategic Innovation (SI)

The number of distributed journals is related to the number of journals in each subject area. In the SI academic aspect, a total of 70 pieces of literature were distributed in 43 journals, and among these publications, 30 articles (NP1 = 1, NJ1 = 30, 69.77%) were published in one journal with the largest number of publications. According to Bradford’s law, the 43 journals in Table 6 were divided into 3 areas with a roughly equal number of publications. We found 3 journals in the first area; 10 journals in the second area; and 30 journals in the third area, and the ratio of the number of journals in each area was 3 : 10 : 30 , which is consistent with the Equation (1) 1 : a : a 2 relationship between the number of journals in each area stated by Bradford’s law. This result indicates that the distributions of the publication characteristics in the SI research domain does conform to the relationship of Bradford’s law [62].

4.1.2. Organizational Sustainability (OS)

We then examined the publication attributes of the OS research aspect. The entire 55 publications were allocated in 28 journals from 1991 to 2021. This was similar to the SI research aspect, and 21 articles (NP2 = 1, NJ2 = 21, 67.86%) were contributed to 1 journal. Applying Bradford’s law, the 28 journals in Table 6 were also separated into 3 areas. The footprint was 1 journal in the first area; 8 journals in the second area; and 19 journals in the third area, and the ratio of the number of journals in each area was 2 : 7 : 19 , which is inconsistent with the Equation (1) 1 : a : a 2 relationship between the number of journals in each area stated by Bradford’s law. This result reveals that the distributions of publication characteristics in the SI research domain did not conform to the relationship of Bradford’s law [62].
Figure 3 illustrates the distributions of publications versus journals for both SI and OS between 1991 and 2021.

4.2. The Test of the Distributions of Authors’ Productivity by Lotka’s Law for Both SI and OS

4.2.1. Strategic Innovation (SI)

Table 7 outlines the author quantity that was calculated by the equality method from 70 articles retrieved from the SSCI electronic database. In total, 142 authors for SI were included.
We then described the number of authors and the number of publications by one author for calculation of the exponent n with the topic of “strategic innovation” from the SSCI database. The results of the calculations in Table 8 can be brought into Equation (2) to calculate the value of n :
n = N X Y X Y N X 2 ( X ) 2 = 5 ( 0.23 ) ( 1.48 ) ( 2.91 ) 5 ( 0.81 ) ( 1.48 ) ( 1.48 ) = 3.208738226
Thus, the slope value of n = 3.208738226 .
The value of c is calculated by applying Equation (3), where P = 20 , x = 1 , 2 , 3 , 5 and n = 3.208738226 , then we can find c = 0.872266179 :
c = 1 1 p 1 1 x n + 1 ( n 1 ) p n 1 + 1 2 p n + n 24 ( p 1 ) n + 1 = 0.872266179
with n = 3.208738226 and c = 0.872266179 , the Lotka’s law Equation of SI is:
f ( x ) = c x n = 0.872266179 x 3.208738226
When the outcome is compared to Table 7, we can observe that those authors who only published one article was 87.01% ( 100 % 12.99 % = 87.01 % ), which almost matches the primitive c   value = 0.872266179 87.22 % . generated by Lotka’s law. The values of n and c can be calculated by the least-squares rule and then brought into further analysis for Lotka’s law compliance.
Pao expressed in his article that the absolute value of n should be between 1.2 and 3.8, as given by the generalized Lotka’s law [68,69]. The result denotes that n = 3.208738226 was between 1.2 and 3.8 and matched the reference data by observation.
We utilized Equation (4) to evaluate whether the analysis matched Lotka’s law. Referring to Table 9, we can find:
D = M a x | F o ( x ) S n ( x ) | = 0.071396
According to the K–S test, the critical value at the 0.01 level of significance is calculated by Equation (5):
The   critical   value   at   the   0.01   level   of   significance = 1.63 y = 1.63 142 = 0.136787
The maximum deviation found was 0.71396 which did not exceed the critical value of 0.136787 at the 0.01 level of significance. Therefore, a null hypothesis must be accepted, and it must be concluded that the dataset of SI did conform to Lotka’s law [68].

4.2.2. Organizational Sustainability (OS)

Table 10 details that the total records were 55 articles, with 158 authors who contributed publications related to the OS research domain.
Repeating the procedures that were performed in the previous Section 4.2.1, we then listed the number of authors and the number of publications by one author for calculation of the exponent n with the topic of “organizational sustainability” from the SSCI database. The results of the calculations in Table 11 can be brought into Equation (2) to calculate the value of n :
n = N X Y X Y N X 2 ( X ) 2 = 2 ( 0.32 ) ( 0.30 ) ( 3.24 ) 2 ( 0.09 ) ( 0.30 ) ( 0.30 ) = 1.802431029
Thus, the slope value of n = 1.802431029
The value of c is calculated by applying Equation (3), where P = 20 , x = 1 ,   2 and n = 1.802431029 , then we can find c = 0.670660005 :
c = 1 1 p 1 1 x n + 1 ( n 1 ) p n 1 + 1 2 p n + n 24 ( p 1 ) n + 1 = 0.670660005
With n = 1.802431029 and c = 0.670660005 , the Lotka’s law equation of OS is:
f ( x ) = c x n = 0.670660005 x 1.802431029
When the outcome is compared to Table 11, we can observe that those authors who only published one article was 92.41% ( 100 % 7.59 % = 92.41 % ), which does not match the primitive c   v a l u e = 0.670660005 6.07 % estimated by Lotka’s law. The values of n and c can be calculated by the least-squares rule and then brought into further analysis for Lotka’s law compliance.
Pao expressed that the absolute value of n should be between 1.2 and 3.8 as was given by the generalized Lotka’s law [68,69]. The outcome indicates n = 1.802431029 and was between 1.2 and 3.8, that matched the reference data by observation.
We utilized Equation (4) to evaluate whether the analysis matched Lotka’s law. Referring to Table 12. we then discover:
D = M a x | F o ( x ) S n ( x ) | = 0.253391
According to the K–S test, the critical value at the 0.01 level of significance is calculated by Equation (5):
The   critical   value   at   the   0.01   level   of   significance = 1.63 y = 1.63 158 = 0.129676
The maximum deviation found was at 0.253391 which did exceed the critical value of 0.129676 at the 0.01 level of significance. Thus, a null hypothesis must be rejected, and it must be concluded that the dataset of OS did not fit Lotka’s law [68].

4.3. Argumentation

(1)
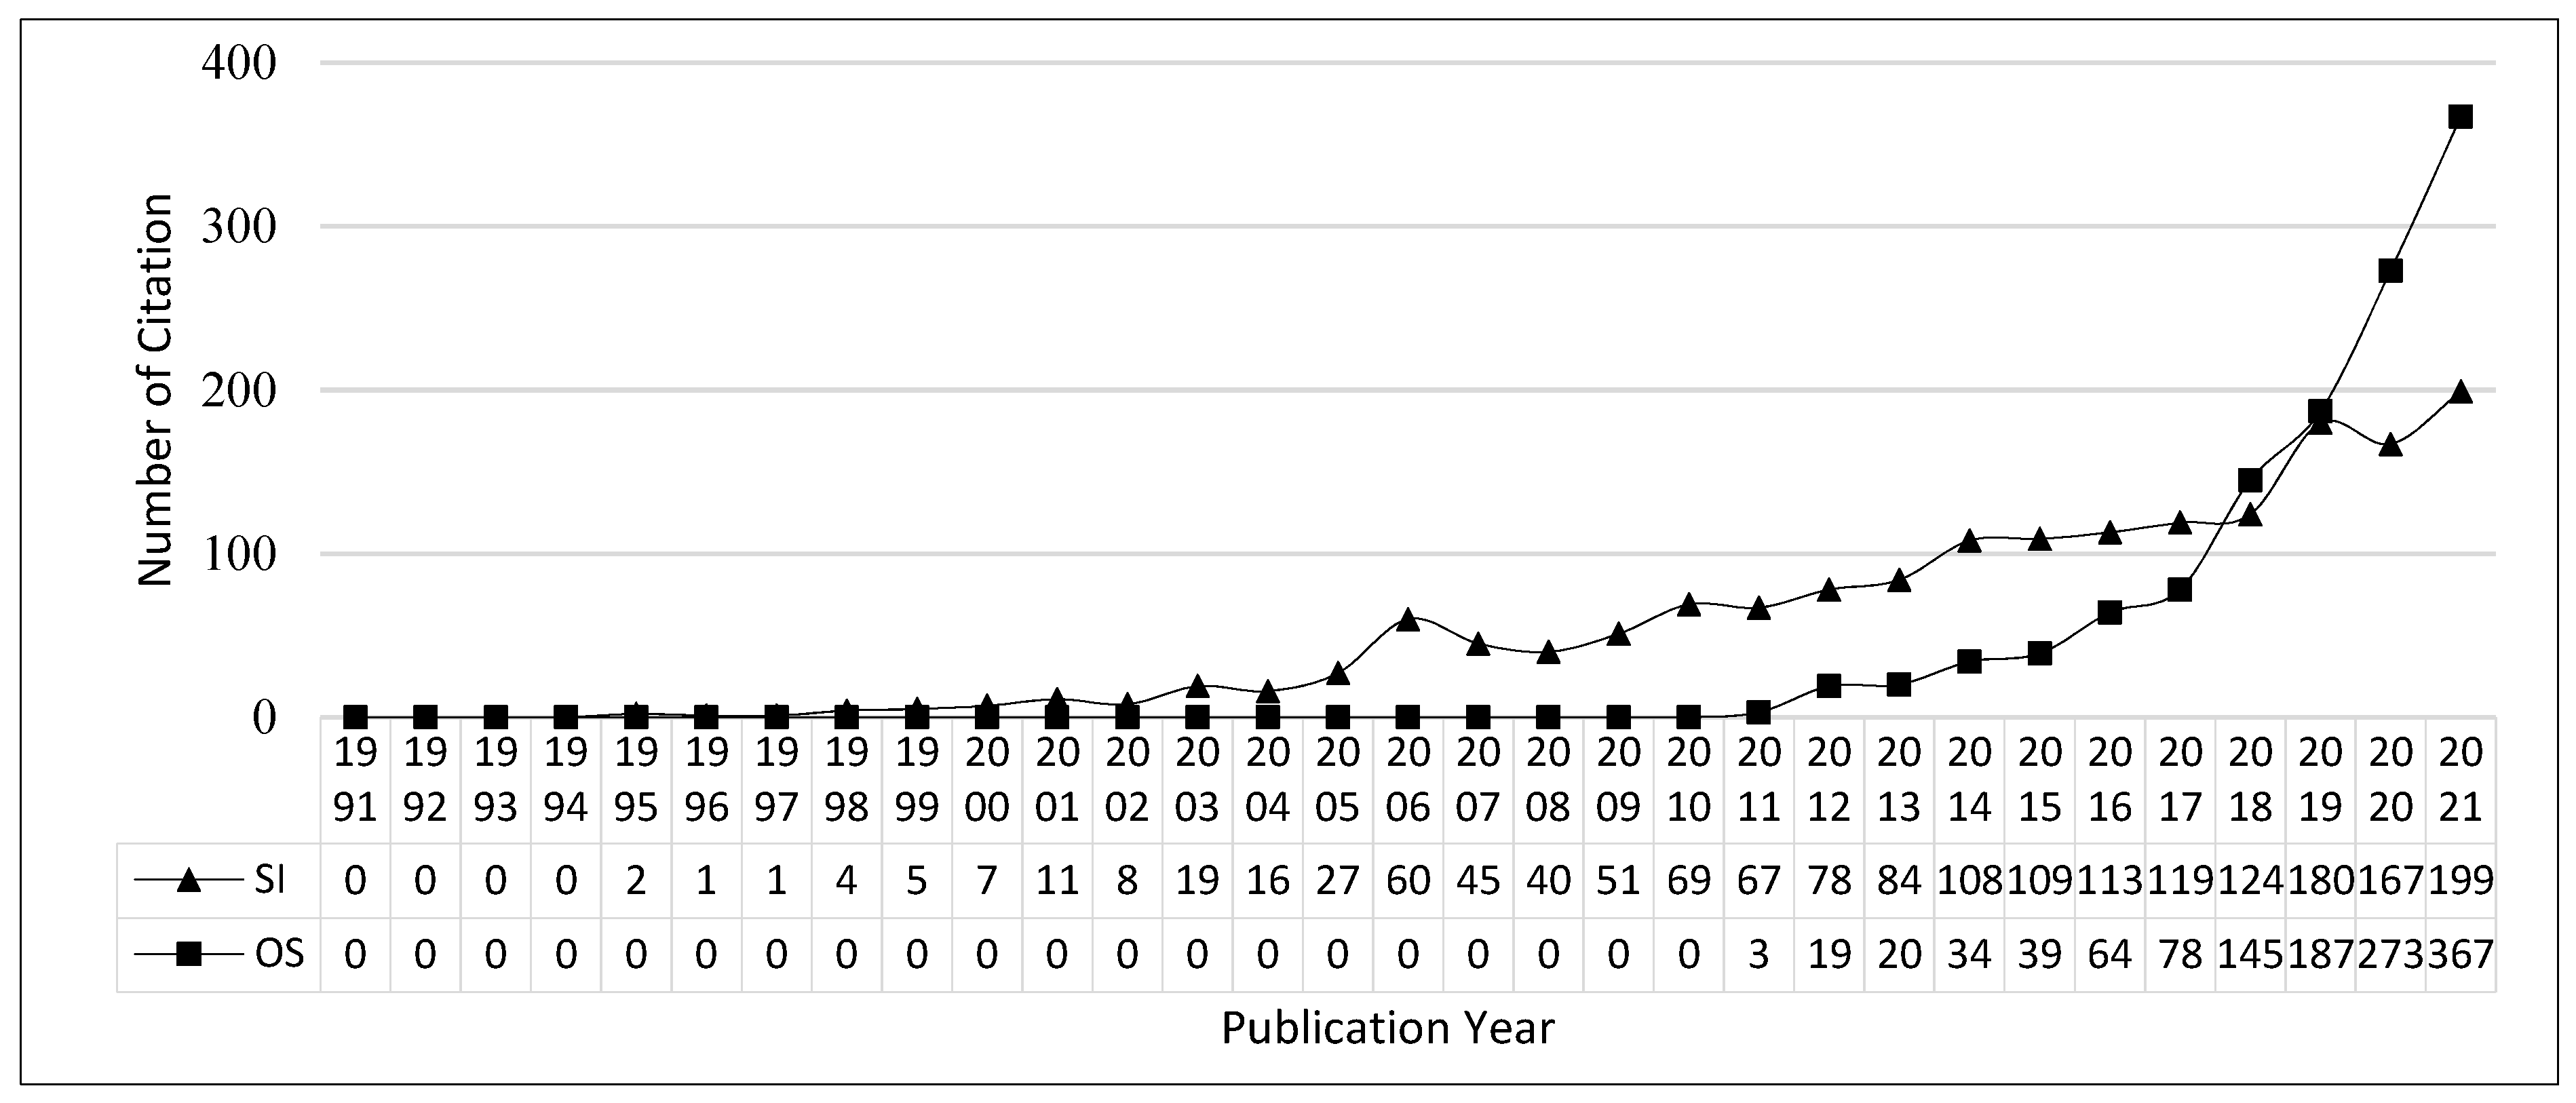
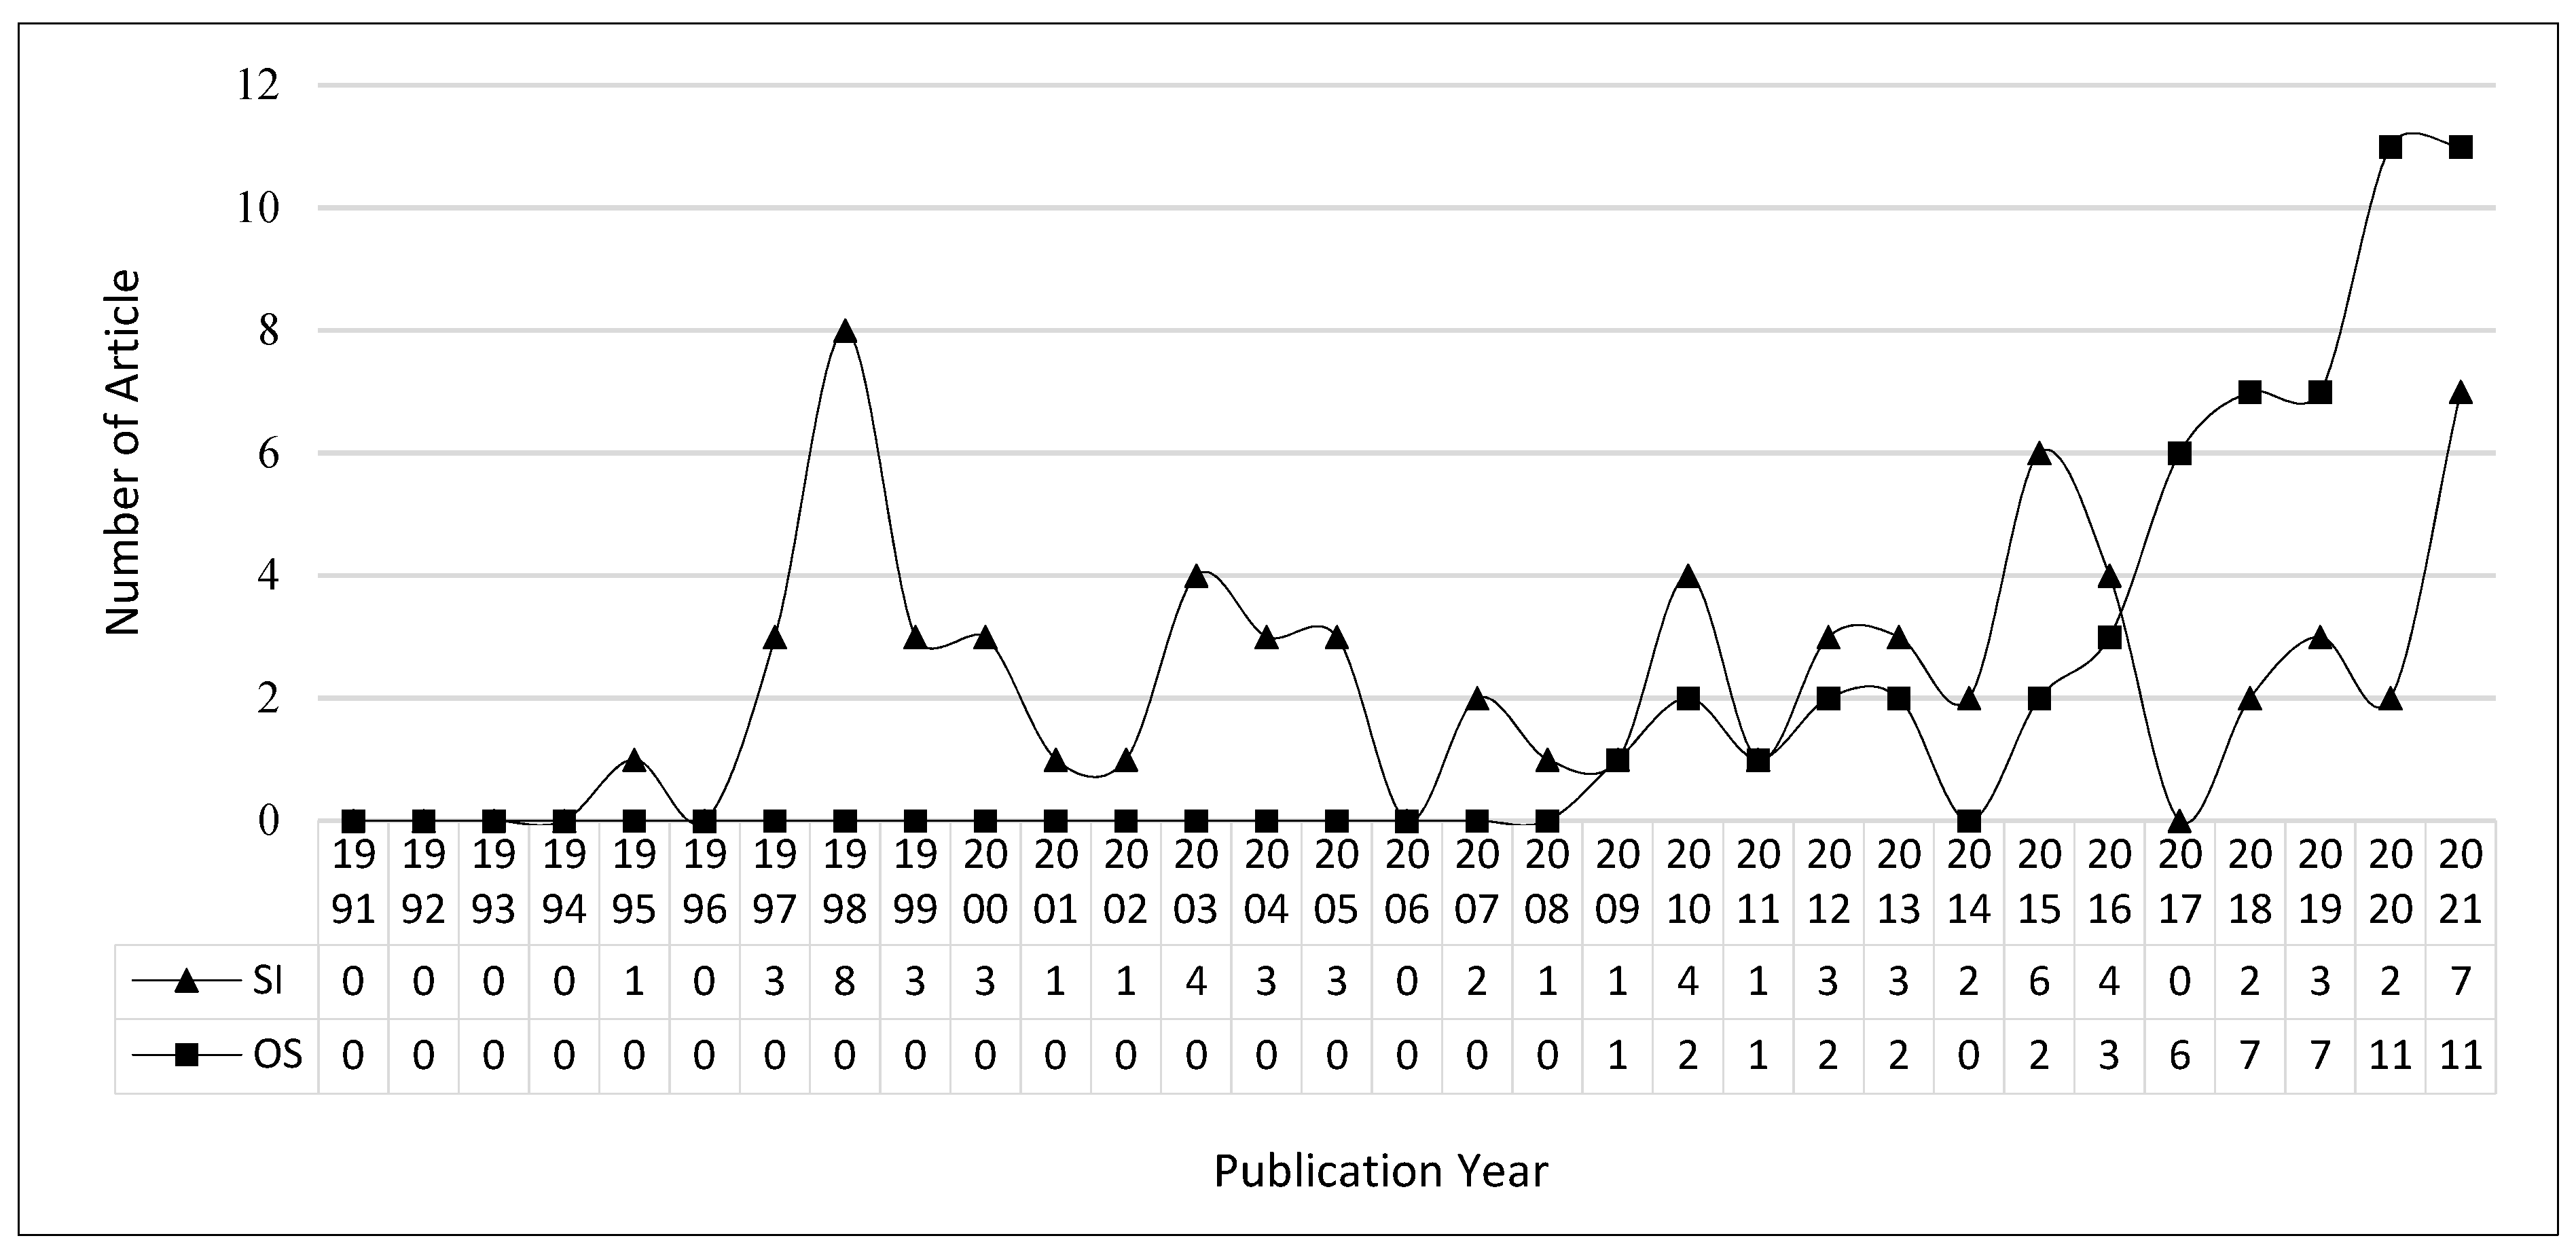
The publication productivity per annum steadily increased in the SI research field, but the OS did not draw many researchers’ attention before the year 2010, which was followed by a rapid growth in the last five years. Since the year 2017, as well as what can be inferred from the literature analysis, OS is becoming an essential subject. New research topics are being emphasized to stimulate research momentum that implies the study of OS has the great potential to grow in the near future. Meanwhile, the citation distributions for SI have been steadily ascending since the year 2001, followed by dramatic growth, and which rapidly peaked in the year 2017 on OS. The result indicates that OS is becoming an important topic of concern in the upcoming years. Reviewing the distributions of country/territory, the top 5 countries published a total of 50 papers that reached 71.43% of the overall publications in the SI field. China (5), Japan (3), and Korea (2) were three countries that contributed 10 articles (14.29%) from 1991 to 2021, which highlights that most countries still need to invest more effort in academic research related to strategic innovation. Unlike strategic innovation, the discussions of organizational sustainability are being actively participated in by many nations worldwide. The USA (21) is a leading country contributing to the OS research domain, followed by China (6) and Turkey (5). These top three ranked countries issued 32 articles (58.18%) in a total of 55 publications in the last decade.
(2)
In the most relevant disciplines in the SI subject category provided by Management and Business, the total citations reached 3563 occurrences. On the OS aspect, Green Sustainable Science Technology, Environmental Sciences, Environmental Studies, and Management were ranked as the top four categories, with 2887 citations representing continuous growth. The research findings can be extended to investigate the author productivity by analyzing variables such as chronological and academic age, the number and frequency of previous publications, access to research grants, job status, etc. In such a way, the characteristics of the high, medium, and low publishing activity of authors can be identified. Moreover, these findings will also help to judge the social science research trends and understand the scale of development of the research in SI and OS, by comparing increases in the article authors. From the above information, governments and enterprises may infer the collective tendencies and demands for scientific researchers in SI and OS to formulate the appropriate training strategies and policies in the future.
(3)
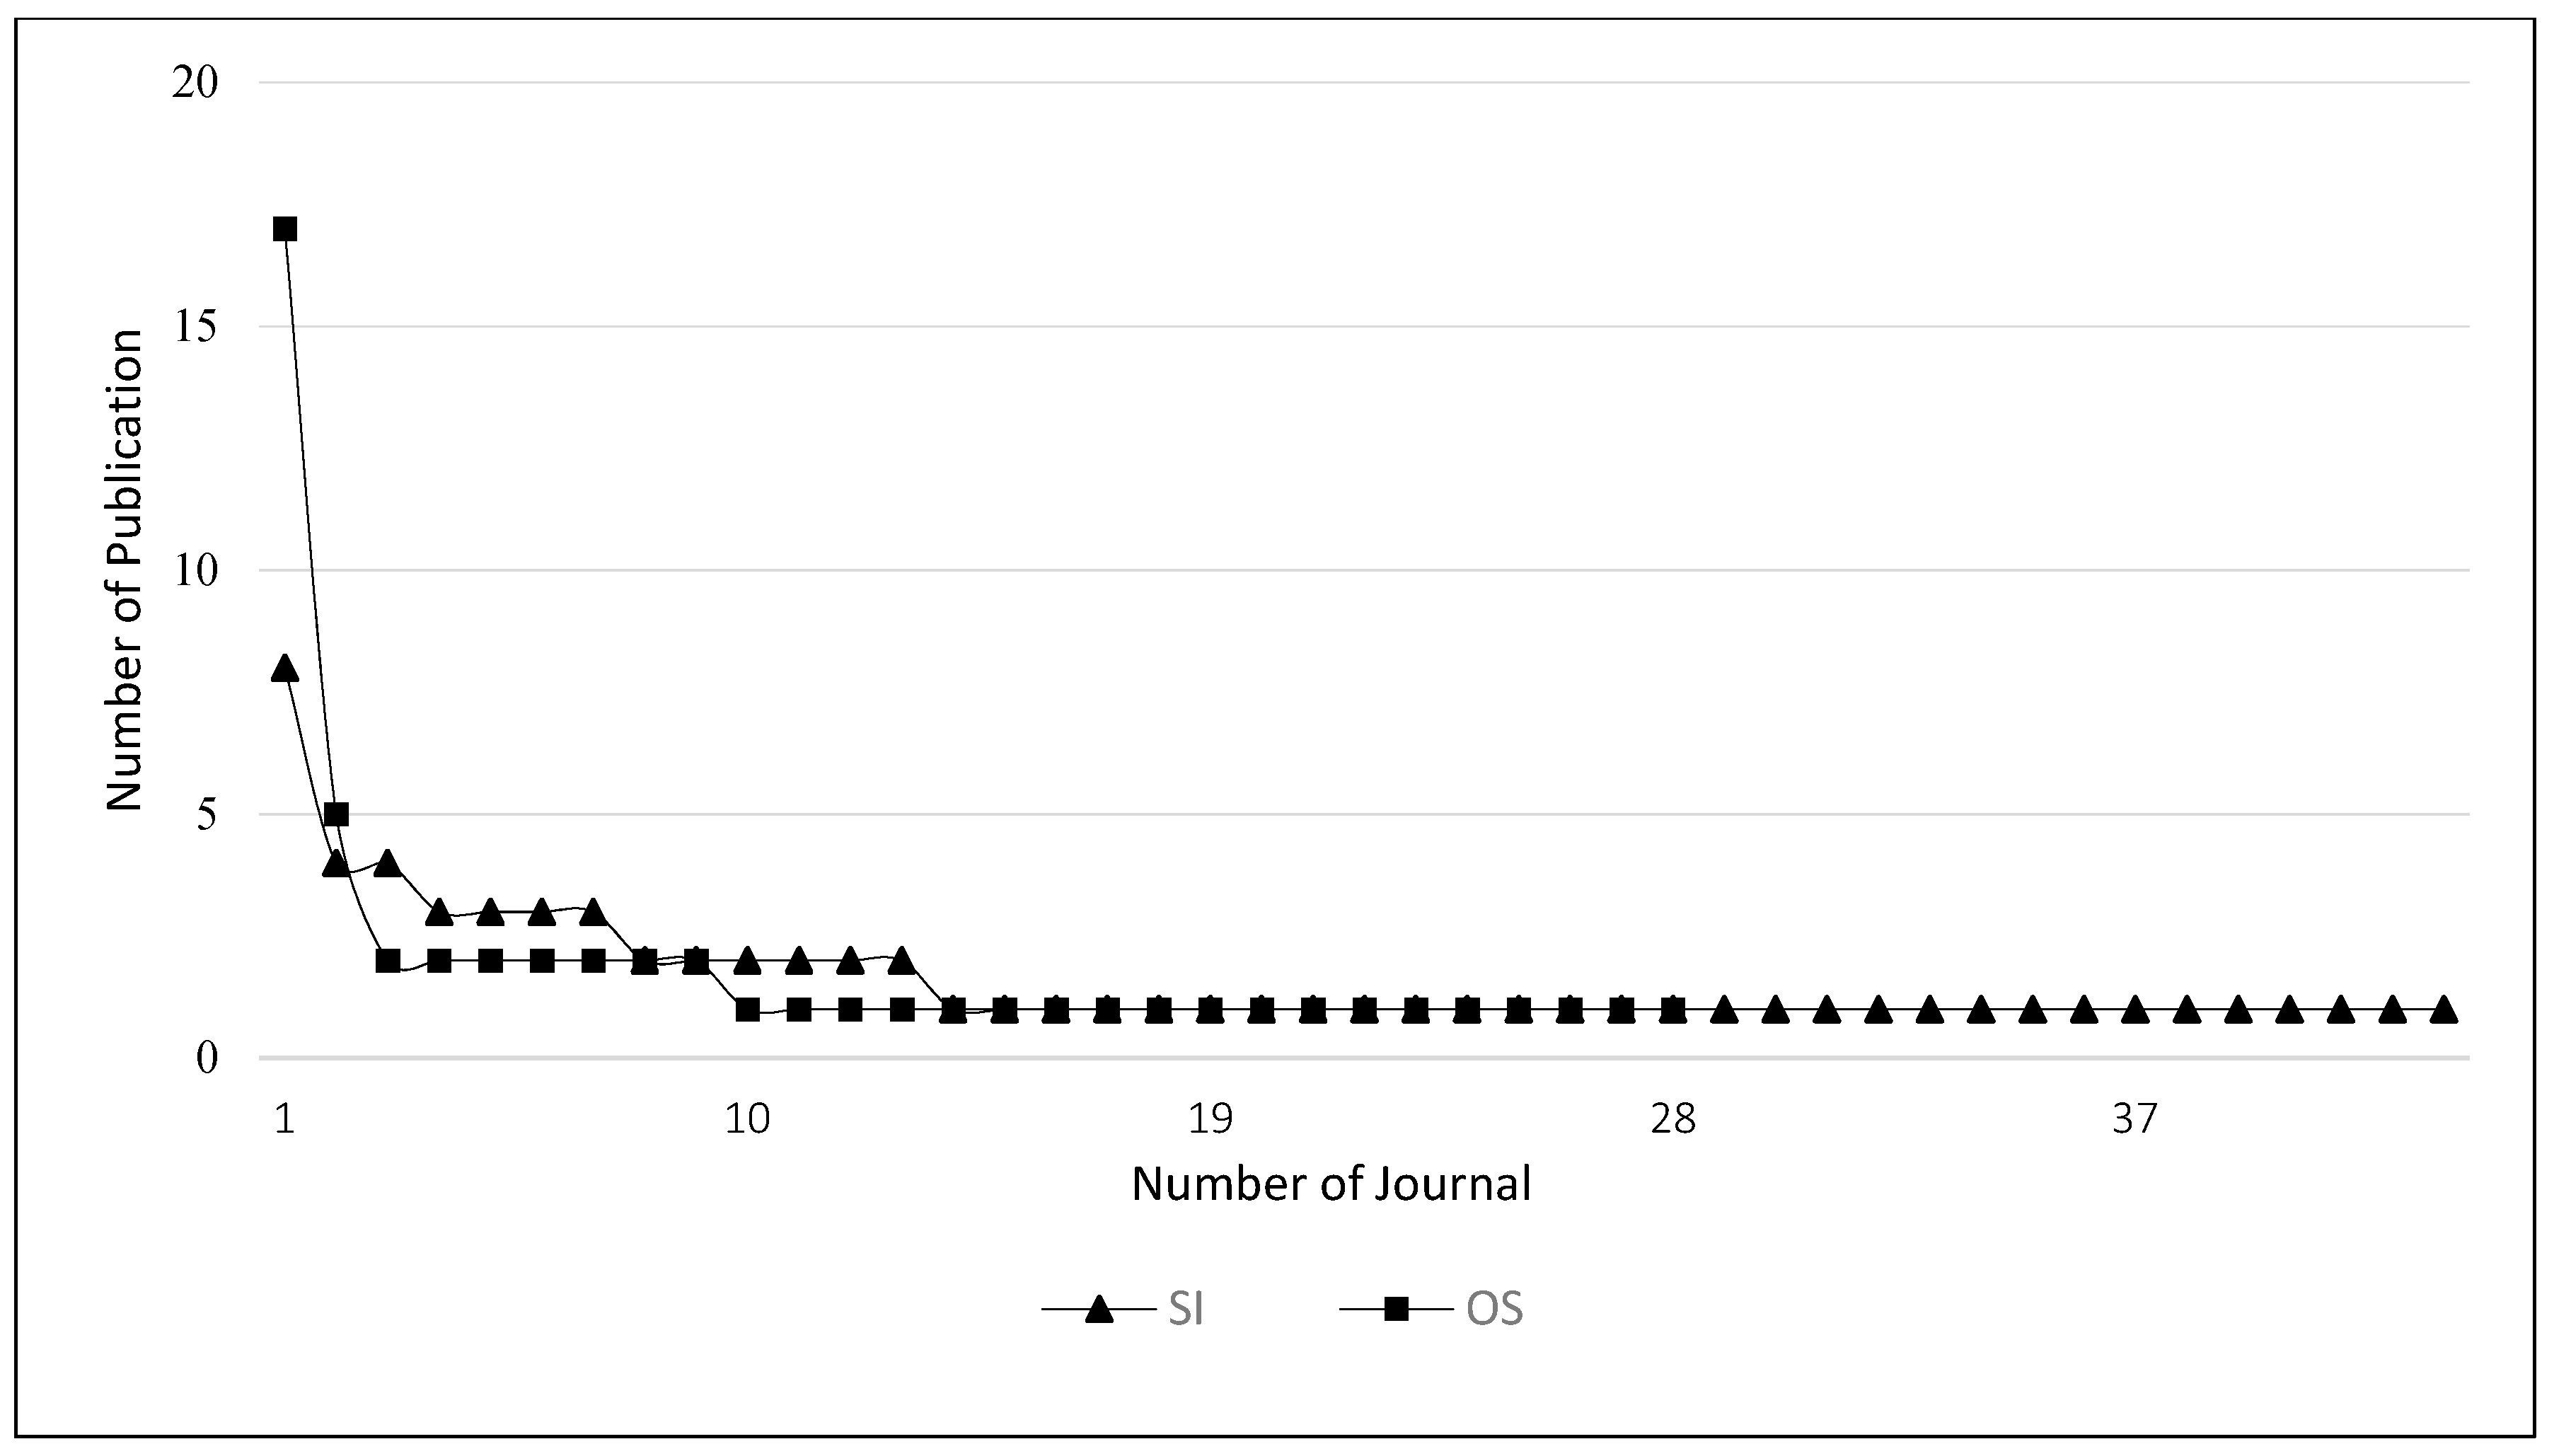
Exploring the distribution of SI by Bradford’s law, the ratio of the number of journals in each area was 3 : 10 : 30 in the SI research aspect, which is consistent with the Equation (1) 1 : a : a 2 relationship between the number of journals in each area stated by Bradford’s law, thus, the distributions of publication characteristics in the SI research domain did conform to the relationship of Bradford’s law. Additionally, utilizing Bradford’s law to examine the distribution of OS, the ratio of the number of journals in each area was 2 : 7 : 19 , which is inconsistent with the Equation (1)   1 : a : a 2 relationship between the number of journals in each area stated by Bradford’s law. This reveals that the distributions of publication characteristics in the OS research domain did not correspond to Bradford’s law. According to Lotka’s law, the value of the exponent n for SI was estimated at 3.208738226 , and the constant c was computed at 0.872266179 . Applying the K–S test revealed that the maximum deviation found was 0.71396 which did not exceed the critical value of 0.136787 at the 0.01 level of significance. Therefore, a null hypothesis must be accepted, and it must be concluded that the dataset of SI did conform to Lotka’s law. Furthermore, based on Lotka’s law, the value of the exponent n for OS was estimated at 1.802431029 and the constant c was computed at 0.670660005 . Applying the K–S test, the maximum deviation found was 0.253391 which did exceed the critical value of 0.129676 at the 0.01 level of significance. Thus, a null hypothesis must be rejected, and it must be concluded that the dataset of OS did not fit Lotka’s law. The reason why OS did not follow either Bradford’s law or Lotka’s law is that the number of authors who published only one article was too large; as a result, the difference between the observed value and the expected value was greater than the K–S test critical value. This effect reveals that the distributions of OS diverged from the slope of Lotka’s law.

5. Conclusions

Strategic innovation (SI) and organizational sustainability (OS) have become significant examination topics. Strategic innovation is definitely a topic that every organization must face and how to practice strategic innovation and how to connect to organizational sustainability in the process requires paying attention to several key aspects. The following provides various information that accelerates strategic innovation as a reference for the development of organizational sustainability:
First, strategic innovation usually takes a period of time to see results, and sometimes the process adjustment of re-engineering is necessarily required. Moreover, the human and material resources invested in it are very considerable and without the support of the board or C-level in an organization, it will be difficult to continue to ameliorate strategic innovation. If strategic innovation is to be established within a sustainable organization, there is definitely a process of organizational transformation involved. Intensive discussions and consensus-building are recommended, including identifying execution priorities, goals, implementation strategies, and the commitments that are each functional unit’s responsibility. These all require the resource input and commitment from the heads of functional departments. If it involves simply a group of part-time members, then this will not help the success of strategic innovation in achieving sustainable organizational transformation.
Second, do not over-commit and create unrealistic expectations. It will take a longer time for the results of strategic innovation to manifest and create value in organizational sustainability. Furthermore, failure to effectively communicate the idea of strategic innovation leads members of the organization to think that it is only the work of a task force and that they are not fully involved. In the process of implementing strategic innovation, it is imperative to choose a project leader with an organizational sustainability mindset, rather than appointing a leader for only business goals while ignoring the real needs of the organization. In particular, many new but impractical strategies that may be adopted can cause resistance from some members of the organization [70].
Third, strategic innovation and the sustainable development of an organization are complementary to each other and are also a long-term process. Strategic innovation also needs to evaluate the return on investment and can really create value for the sustainable growth of an organization. There is nothing best but better. Every organization has its own unique and specialized requirements. Do not trust stealthy innovative solutions, as they can fall into innovative confusion without knowing it. Strategic innovation should be dynamic, flexible, and extensible. With the evolution of time, such strategic innovation can only be achieved by making the necessary adjustments, which is one of the key factors to building a sustainable organization.
Despite differences in the characteristics of the disciplines, people from different subjects may have different research perspectives and research topics of concern. For bibliometrics, which has a strong interdisciplinary color, the discipline sources of researchers are closely related to its development. In fact, the main research interests of social science are in topics-related fields. It is suggested that more researchers in the social sciences should be encouraged to invest in bibliometrics research, so as to provide more in-depth explanations for the results of the social science analysis in the fields of SI and OS, and that the results are applied in the research and development of strategic innovation and organizational sustainability policy. The results unveil that by comparing the expansionary scope of SI and OS research, it can fit well with industry, government, academia, and research for their various requirements, functions, and schemes. According to the above analysis, these findings simultaneously constitute an adequate preparation and afford a blueprint for those who need to refer to the collections to formulate an appropriate research platform in the near future.

Author Contributions

Conceptualization, C.-Y.Y.; Data curation, C.-Y.Y.; Methodology, C.-Y.Y.; Project administration, H.-H.C. All authors have read and agreed to the published version of the manuscript.

Funding

This research received no external funding.

Data Availability Statement

Not applicable.

Conflicts of Interest

The authors declare no conflict of interest.

References

  1. Nanes, M.; Bachus, T. Walls and strategic innovation in violent conflict. J. Confl. Resolut. 2021, 65, 1131–1158. [Google Scholar] [CrossRef]
  2. Nawaz, W.; Koc, M. Exploring organizational sustainability: Themes, functional areas, and best practices. Sustainability 2019, 11, 4307. [Google Scholar] [CrossRef] [Green Version]
  3. Pritchard, A. Statistical bibliography or bibliometrics. J. Doc. 1969, 25, 348–349. [Google Scholar]
  4. Anderson, J.; Markides, C. Strategic innovation at the base of the pyramid. Sloan Manag. Rev. 2007, 49, 83–84. [Google Scholar]
  5. Markides, C. Strategic innovation. Sloan Manag. Rev. 1997, 38, 9–23. [Google Scholar]
  6. Markides, C. Strategic innovation in established companies. Sloan Manag. Rev. 1998, 39, 31–32. [Google Scholar]
  7. Talke, K.; Salomo, S.; Kock, A. Top management team diversity and strategic innovation orientation: The relationship and consequences for innovativeness and performance. J. Prod. Innov. Manag. 2011, 28, 819–832. [Google Scholar] [CrossRef]
  8. Diaz-Carrion, R.; Franco-Leal, N. Social and strategic innovation: Extending the varieties of capitalism to Asian countries. Int. Entrep. Manag. J. 2021. [Google Scholar] [CrossRef]
  9. Gebauer, H.; Worch, H.; Truffer, B. Absorptive capacity, learning processes and combinative capabilities as determinants of strategic innovation. Eur. Manag. J. 2012, 30, 57–73. [Google Scholar] [CrossRef]
  10. Li, J.Q.; Ren, H.; Zhang, C.C.; Li, Q.X.; Duan, K.F. Substantive innovation or strategic innovation? Research on multiplayer stochastic evolutionary game model and simulation. Complexity 2020, 2020, 9640412. [Google Scholar] [CrossRef]
  11. Yin, C.Y. Measuring organization impacts by integrating competitive intelligence into executive information system. J. Intell. Manuf. 2018, 29, 533–547. [Google Scholar] [CrossRef]
  12. Schlegelmilch, B.B.; Diamantopoulos, A.; Kreuz, P. Strategic innovation: The construct, its drivers and its strategic outcomes. J. Strateg. Mark. 2010, 11, 117–132. [Google Scholar] [CrossRef]
  13. Cassia, L.; de Massis, A.; Pizzurno, E. Strategic innovation and new product development in family firms: An empirically grounded theoretical framework. Int. J. Entrep. Behav. Res. 2015, 18, 198–199. [Google Scholar] [CrossRef] [Green Version]
  14. Grillitsch, M.; Hansen, T.; Coenen, L.; Miorner, J.; Moodysson, J. Innovation policy for system-wide transformation: The case of strategic innovation programmes (SIPs) in Sweden. Res. Policy 2019, 48, 1048–1061. [Google Scholar] [CrossRef]
  15. Simonse, L.W.L.; Hultink, E.J.; Buijs, J.A. Innovation roadmapping: Building concepts from practitioners’ insights. J. Prod. Innov. Manag. 2015, 32, 904–924. [Google Scholar] [CrossRef]
  16. Sundbo, J. Management of innovation in services. Serv. Ind. J. 1997, 17, 432–455. [Google Scholar] [CrossRef]
  17. Thakur, R.; Hale, D. Service innovation: A comparative study of U.S. and Indian service firms. J. Bus. Res. 2013, 66, 1108–1123. [Google Scholar] [CrossRef]
  18. Zeng, D.L.; Hu, J.B.; Ouyang, T.H. Managing innovation paradox in the sustainable innovation ecosystem: A case study of ambidextrous capability in a focal firm. Sustainability 2017, 9, 2091. [Google Scholar] [CrossRef] [Green Version]
  19. Galambos, L.; Sturchio, J.L. Pharmaceutical firms and the transition to biotechnology: A study in strategic innovation. Bus. Hist. Rev. 1998, 72, 250–278. [Google Scholar] [CrossRef]
  20. Pitt, M.; Clarke, K. Competing on competence: A knowledge perspective on the management of strategic innovation. Technol. Anal. Strateg. Manag. 1999, 11, 301–316. [Google Scholar] [CrossRef]
  21. Kodama, M. Strategic innovation in traditional big business: Case studies of two Japanese companies. Organ. Stud. 2003, 24, 235–268. [Google Scholar] [CrossRef]
  22. Charitou, C.D.; Markides, C.C. Responses to disruptive strategic innovation. MIT Sloan Manag. Rev. 2003, 44, 55–63. [Google Scholar]
  23. Kranz, J. Strategic innovation in IT outsourcing: Exploring the differential and interaction effects of contractual and relational governance mechanisms. J. Strateg. Inf. Syst. 2021, 30, 1–21. [Google Scholar] [CrossRef]
  24. Paulraj, A. Understanding the relationships between internal resources and capabilities, sustainable supply management and organizational sustainability. J. Supply Chain. Manag. 2011, 47, 19–37. [Google Scholar] [CrossRef]
  25. Carayannis, E.G.; Sindakis, S.; Walter, C. Business model innovation as lever of organizational sustainability. J. Technol. Transf. 2015, 40, 36. [Google Scholar] [CrossRef]
  26. Lopes, C.M.; Scavarda, A.; Hofmeister, L.F.; Thome, A.M.T.; Vaccaro, G.L.R. An analysis of the interplay between organizational sustainability, knowledge management, and open innovation. J. Clean. Prod. 2015, 142, 476–488. [Google Scholar] [CrossRef]
  27. Florea, L.; Cheung, Y.H.; Herndon, N.C. For all good reasons: Role of values in organizational sustainability. J. Bus. Ethics 2013, 114, 393–408. [Google Scholar] [CrossRef]
  28. Moizer, J.; Tracey, P. Strategy making in social enterprise: The role of resource allocation and its effects on organizational sustainability. Syst. Res. Behav. Sci. 2010, 27, 252–266. [Google Scholar] [CrossRef]
  29. Horak, S.; Arya, B.; Ismail, K.M. Organizational sustainability determinants in different cultural settings: A conceptual framework. Bus. Strat. Env. 2017, 27, 528–546. [Google Scholar] [CrossRef]
  30. Muff, K. Learning from positive impact organizations: A framework for strategic innovation. Sustainability 2021, 13, 8891. [Google Scholar] [CrossRef]
  31. De Freitas, J.G.; Costa, H.G.; Ferraz, F.T. Impacts of lean six sigma over organizational sustainability: A survey study. J. Clean. Prod. 2017, 156, 262–275. [Google Scholar] [CrossRef]
  32. Van de Wetering, R.; Mikalef, P.; Helms, R. Driving organizational sustainability-oriented innovation capabilities: A complex adaptive systems perspective. Curr. Opin. Environ. Sustain. 2017, 28, 71–79. [Google Scholar] [CrossRef]
  33. Batista, A.A.D.; de Francisco, A.C. Organizational sustainability practices: A study of the firms listed by the corporate sustainability index. Sustainability 2018, 10, 226. [Google Scholar] [CrossRef] [Green Version]
  34. Braccini, A.M.; Margherita, E.G. Exploring organizational sustainability of Industry 4.0 under the triple bottom line: The case of a manufacturing company. Sustainability 2019, 11, 36. [Google Scholar] [CrossRef] [Green Version]
  35. Lueg, K.; Krastev, B.; Lueg, R. Bidirectional effects between organizational sustainability disclosure and risk. J. Clean. Prod. 2019, 229, 268–277. [Google Scholar] [CrossRef]
  36. Yu, M.C.; Mai, Q.; Tsai, S.B.; Dai, Y. An empirical study on the organizational trust, employee-organization relationship and innovative behavior from the integrated perspective of social exchange and organizational sustainability. Sustainability 2018, 10, 864. [Google Scholar] [CrossRef] [Green Version]
  37. Bastas, A.; Liyanage, K. Integrated quality and supply chain management business diagnostics for organizational sustainability improvement. Sustain. Prod. Consum. 2019, 17, 11–30. [Google Scholar] [CrossRef]
  38. Partidario, P.J.; Vergragt, P.J. Planning of strategic innovation aimed at environmental sustainability: Actor-networks, scenario acceptance and backcasting analysis within a polymeric coating chain. Futures 2002, 34, 841–861. [Google Scholar] [CrossRef]
  39. Govindarajan, V.; Trimble, C. Organizational DNA for strategic innovation. Calif. Manag. Rev. 2005, 47, 47–48. [Google Scholar] [CrossRef]
  40. Yang, J.W. Thriving organizational sustainability through innovation: Incivility climate and teamwork. Sustainability 2016, 8, 860. [Google Scholar] [CrossRef] [Green Version]
  41. Shelomentsev, A.G.; Goncharova, K.S.; Stepnov, I.M.; Kovalchuk, J.A.; Lan, D.H.; Golov, R.S. Strategic innovation as a factor of adaptation of national economies to the development of global value chains. Sustainability 2021, 13, 9765. [Google Scholar] [CrossRef]
  42. Thomas, T.E.; Lamm, E. Legitimacy and organizational sustainability. J. Bus. Ethics 2012, 110, 191–203. [Google Scholar] [CrossRef]
  43. Yang, L.; Hou, G.S. Study on the strategic innovation and industrial development effect of marine industry. J. Coast. Res. 2019, 94, 581–584. [Google Scholar] [CrossRef]
  44. Kilintzis, P.; Samara, E.; Carayannis, E.G.; Bakouros, Y. Business model innovation in Greece: Its effect on organizational sustainability. J. Knowl. Econ. 2020, 11, 949–967. [Google Scholar] [CrossRef]
  45. Wilczek, B.; Stanoevska-Slabeva, K.; Kernbach, K.; Meckel, M. Un-locking strategic lock-ins of local media: An investigation of local media’s preferences towards public support for strategic innovation. Digit. J. 2021, 9, 276–299. [Google Scholar] [CrossRef]
  46. Zhao, D.Q.; Zhong, H.Q.; Wu, Y.L.; Zhou, Q.F. A study of the impact of internet-based instruction integrated innovation education on university student entrepreneurial team collaboration and strategic innovation. Front. Psychol. 2020, 11, 1–9. [Google Scholar] [CrossRef]
  47. Zhou, Y.Y.; Shu, C.L.; Jiang, W.; Gao, S.X. Green management, firm innovations, and environmental turbulence. Bus. Strategy Environ. 2019, 28, 567–581. [Google Scholar] [CrossRef]
  48. Broadus, R.N. Toward a definition of bibliometrics. Scientometrics 1987, 12, 373–379. [Google Scholar] [CrossRef]
  49. Tsai, M.Y. Literature growth, journal characteristics, and author productivity in subject indexing, 1977–2000. J. Am. Soc. Inf. Sci. Technol. 2004, 55, 64–73. [Google Scholar] [CrossRef]
  50. Tsai, M.Y. Bibliometric analysis of literature on randomized controlled trials. J. Med. Libr. Assoc. 2005, 93, 450–458. [Google Scholar]
  51. Tsai, M.Y. A bibliometric analysis of hydrogen energy literature, 1965–2006. Scientometrics 2008, 75, 421–438. [Google Scholar] [CrossRef]
  52. Moed, H.F.; Burger, W.J.M.; Frankfort, J.G.; van Raan, A.F.J. The use of bibliometric data for the measurement of university-research performance. Res. Policy 1985, 14, 131–149. [Google Scholar] [CrossRef]
  53. Moed, H.F.; Debruin, R.E.; van Leeuwen, T.N. New bibliometric tools for the assessment of national research performance—Database description, overview of indicators and first applications. Scientometrics 1995, 33, 381–422. [Google Scholar] [CrossRef]
  54. Nederhof, A.J. Bibliometric monitoring of research performance in the social sciences and the humanities: A review. Scientometrics 2006, 66, 81–100. [Google Scholar] [CrossRef]
  55. Costas, R.; van Leeuwen, T.N.; Bordons, M. A bibliometric classificatory approach for the study and assessment of research performance at the individual level: The effects of age on productivity and impact. J. Am. Soc. Inf. Sci. Technol. 2010, 61, 1564–1581. [Google Scholar] [CrossRef] [Green Version]
  56. Diem, A.; Wolter, S.C. The use of bibliometrics to measure research performance in education sciences. Res. High. Educ. 2013, 54, 86–114. [Google Scholar] [CrossRef] [Green Version]
  57. Cardoso, L.; Silva, R.; de Almeida, G.G.F.; Santos, L.L. A bibliometric model to analyze country research performance: SciVal Topic prominence approach in tourism, leisure and hospitality. Sustainability 2021, 12, 9897. [Google Scholar] [CrossRef]
  58. Koenig, M.E.D. Bibliometric indicators versus expert opinion in assessing research performance. J. Am. Soc. Inf. Sci. 1983, 34, 136–145. [Google Scholar] [CrossRef]
  59. Luukkonen, T. Bibliometrics and evaluation of research performance. Ann. Med. 1990, 22, 145–150. [Google Scholar] [CrossRef]
  60. Salisu, S.A.; Salami, M.O. A bibliometric analysis of Nigeria’s research performance, 1901–2016. Afr. J. Libr. Arch. Inf. Sci. 2020, 30, 23–36. [Google Scholar]
  61. Zou, Y.W. A bibliometric study on the R&D funding and academic research performance in Shenzhen. Sci. Public Policy 2022, scab092. [Google Scholar] [CrossRef]
  62. Bradford, S.C. Sources of information on specific subjects. J. Inf. Sci. 1985, 10, 176–180, reprinted in Engineering 1934, 137, 85–86. [Google Scholar]
  63. Nicolaisen, J.; Hjorland, B. Practical potentials of Bradford’s law: A critical examination of the received view. J. Doc. 2007, 63, 359–377. [Google Scholar] [CrossRef] [Green Version]
  64. Venable, G.T.; Shepherd, B.A.; Loftis, C.M.; McClatchy, S.G.; Roberts, M.L.; Fillinger, M.E.; Tansey, J.B.; Klimo, P. Bradford’s law: Identification of the core journals for neurosurgery and its subspecialties. J. Neurosurg. 2016, 124, 569–579. [Google Scholar] [CrossRef] [PubMed] [Green Version]
  65. Gupta, B.M.; Karisiddippa, C.R. Collaboration and author productivity: A study with a new variable in Lotka’s law. Scientometrics 1999, 44, 129–134. [Google Scholar] [CrossRef]
  66. Kawamura, M.; Thomas, C.D.L.; Kawaguchi, Y.; Sasahara, H. Lotka’s law and the pattern of scientific productivity in the dental science literature. Med. Inform. Internet Med. 1999, 24, 309–315. [Google Scholar] [CrossRef]
  67. Rowlands, I. Emerald authorship data, Lotka’s law and research productivity. Aslib Proc. 2005, 57, 5–10. [Google Scholar] [CrossRef]
  68. Lotka, A.J. The frequency distribution of scientific productivity. J. Wash. Acad. Sci. 1926, 16, 317–324. [Google Scholar]
  69. Pao, M.L. Lotka’s law: A testing procedure. Inf. Processing Manag. 1985, 21, 305–320. [Google Scholar] [CrossRef]
  70. Peng, C.; Jiang, H.; Zhang, T.Y. Does the national risk of overseas investment affect the strategic innovation behavior of enterprises? Evidence from China. Manag. Decis. Econ. 2021, 43, 1548–1565. [Google Scholar] [CrossRef]
Figure 1. The panorama of publication on both SI and OS (source: SSCI electronic database).
Sustainability 14 06937 g001
Figure 2. The panorama of citation on both SI and OS (source: SSCI electronic database).
Sustainability 14 06937 g002
Figure 3. The distributions of publications versus journals for both SI and OS. (source: SSCI electronic database).
Sustainability 14 06937 g003
Table 1. The example of the top 10 country/territory for both SI and OS (source: SSCI electronic database).
RankedStrategic Innovation (SI)RankedOrganizational Sustainability (OS)
Country/
Territory
NP% of 70 (%)Country/
Territory
NP% of 55 (%)
1USA1825.71%1USA2138.18%
2England1622.86%2Peoples R. China610.91%
3Switzerland68.57%3Turkey59.09%
4Netherlands57.14%4Brazil47.27%
4Peoples R. China57.14%4India47.27%
6Germany45.71%4Pakistan47.27%
7Italy34.29%7England35.45%
7Japan34.29%7South Africa35.45%
7Spain34.29%9Finland23.64%
10Australia22.86%10Greece23.64%
10Belgium22.86%10Italy23.64%
10Denmark22.86%10Saudi Arabia23.64%
10France22.86%10South Korea23.64%
10South Korea22.86%10Sweden23.64%
NP: Number of Publications.
Table 2. The example of the top 5 institution names for both SI and OS (source: SSCI electronic database).
RankedStrategic Innovation (SI)RankedOrganizational Sustainability (OS)
Institution NameNP% of 70 (%)CountryInstitution NameNP% of 55 (%)Country
1University of London57.14%UK1University of Wisconsin Madison35.45%USA
2League of European Research Universities (LERU)45.71%Belgium1University Of Wisconsin System35.45%USA
2London Business School45.71%UK3Altinbas
University
23.64%Turkey
4Dartmouth
College
34.29%USA3Comsats
University
Islamabad (CUI)
23.64%Pakistan
5Aston University22.86%UK3George Washington University23.64%USA
5McKinsey & Company22.86%USA3Malaviya
National
Institute of Technology Jaipur (MNIT)
23.64%India
5University of North Carolina22.86%USA3National
Institute of Technology NIT System
23.64%India
5University of Texas Austin22.86%USA3Universidade Federal Fluminense23.64%Brazil
5University of Texas System22.86%USA3University of Johannesburg23.64%South Africa
Others4462.85% 3University of Michigan23.64%USA
3University of Michigan System23.64%USA
3University of Missouri
System
23.64%USA
3Victoria
University Wellington
23.64%New
Zealand
3Yasar
University
23.64%Turkey
Others2545.45%
NP: Number of Publications.
Table 3. The example of document types for both SI and OS (source: SSCI electronic database).
ItemsStrategic Innovation (SI)ItemsOrganizational Sustainability (OS)
Document TypeNP% of 70 (%)Document TypeNP% of 55 (%)
1Articles4665.71%1Articles4887.27%
2Editorial Materials811.43%2Review Articles47.27%
3Book Reviews710.00%3Early Access23.64%
4Letters68.57%4Meeting Abstract23.64%
5Proceedings Papers57.14%5Corrections11.82%
6Review Articles34.29%6Proceedings Papers11.82%
7Early Access22.86%
NP: Number of Publications.
Table 4. The example of Web of Science categories for both SI and OS (source: SSCI electronic database).
RankedStrategic Innovation (SI)RankedOrganizational Sustainability (OS)
Web of Science
Categories
NP% of 70 (%)TCWeb of Science CategoriesNP% of 55 (%)TC
1Management4767.14%15031Green Sustainable Science
Technology
2749.09%534
2Business3144.29%13042Environmental Sciences2443.64%484
3Economics710.00%783Environmental Studies1934.55%312
4Engineering
Industrial
68.57%1634Management1629.09%612
5Information
Science Library Science
57.14%755Business814.55%239
6Business Finance45.71%216Engineering
Environmental
59.09%186
6Computer
Science
Information
Systems
45.71%487Engineering
Industrial
47.27%147
6Multidisciplinary Sciences45.71%1108Economics35.45%27
9Engineering Multidisciplinary34.29%68Social Sciences Interdisciplinary35.45%76
9Environmental Sciences34.29%210Development Studies23.64%6
9Operations
Research
Management
Science
34.29%610Ethics23.64%143
12Environmental Studies22.86%010Health Care
Sciences Services
23.64%1
12Green
Sustainable
Science
Technology
22.86%010Psychology
Applied
23.64%49
12International
Relations
22.86%910Public
Administration
23.64%25
12Political Science22.86%710Regional
Urban Planning
23.64%6
12Regional Urban Planning22.86%31 Others814.55%40
Others1521.43%200
NP: Number of Publications; TC: Number of Total Citations.
Table 5. The example of publication title for both SI and OS (source: SSCI electronic database).
RankedStrategic Innovation (SI)RankedOrganizational Sustainability (OS)
Publication TitleNP% of
70 (%)
TCPublication TitleNP% of
55 (%)
TC
1Sloan Management Review811.43%3121Sustainability1730.91%264
2Journal of Production Innovation
Management
45.71%1612Journal of Cleaner Production59.09%186
2Journal of Strategic Information Systems45.71%483International Journal of Lean Six Sigma23.64%30
4Academy of
Management Executive
34.29%33Journal of Business Ethics23.64%1
4International
Journal of Technology Management
34.29%63Operations
Management Research
23.64%1
4MIT Sloan
Management Review
34.29%3413Organizational
Dynamics
23.64%49
4Technology Analysis Strategic
Management
34.29%983Public Management Review23.64%25
8European
Management Journal
22.86%1563Sustainable
Development
23.64%6
8Journal of Monetary Economics22.86%193Systems Research and Behavioral Science23.64%75
8Journal of
Organizational Change Management
22.86%48 Others1934.55%554
8R D Management22.86%37
8Research Technology Management22.86%2
8Sustainability22.86%0
Others3042.86%512
NP: Number of Publications; TC: Number of Total Citations.
Table 6. The example of publications distribution for both SI and OS (source: SSCI electronic database).
Strategic Innovation (SI)Organizational Sustainability (OS)
NP1NJ1Accumulated
NJ1
Accumulated
NJ1 (%)
Accumulated
NP1
Accumulated
NP1 (%)
NP2NJ2Accumulated
NJ2
Accumulated
NJ2 (%)
Accumulated
NP2
Accumulated
NP2 (%)
8112.33%811.43%17113.57%1730.91%
4236.98%1622.86%5127.14%2240.00%
34716.28%2840.00%27932.14%3665.45%
261330.23%4057.14%11928100%55100%
13043100%70100%
NP1, NP2: Number of Publications; NJ1, NJ2: Number of Journals.
Table 7. The example of author productivity for SI.
The Authors’ Productivity for SI ( T R = 70 )
ItemsNPAuthor(s)NP x
Author(s)
Accumulated Record(s)Accumulated Record (%)Accumulated Author(s)Accumulated Author(s) (%)
151553.25%10.70%
231385.19%21.41%
326122012.99%85.63%
41134134154100%142100%
TR = Total Records; NP: Number of Publications.
Table 8. The example of exponent n of SI.
The Estimation of the Exponent n of SI ( T R = 70 )
x (NP)y (Author) X = l o g ( x ) Y = l o g ( y ) X Y X X
51 0.70 0.00 0.00 0.49
31 0.48 0.00 0.00 0.23
26 0.30 0.78 0.23 0.09
1134 0.00 2.13 0.00 0.00
Total142 1.48 2.91 0.23 0.81
TR = Total Records; x: Number of Publications; y: Author; X = logarithm of x; Y = logarithm of y.
Table 9. The example of K–S test for SI.
Strategic Innovation (SI) ( T R = 70 )
x (NP)Author(s)Observation
by Author(s)
Accumulated Value
S n ( x )
Expectation
by Author(s)
Accumulated Value
F o ( x )
D m a x
11340.943662 0.943662 0.8722660.8722660.071396
260.042254 0.985915 0.0943460.966612 0.019304
310.007042 0.992958 0.0256860.992298 0.000660
510.007042 1.000000 0.0049870.997285 0.002715
TR = Total Records; x: Number of Publications; Sn(x) = Cumulative frequency by obervation; Fo(x) = Cumulative frequency by expections; Dmax = Maximum deviation.
Table 10. The example of author productivity for OS.
The Authors’ Productivity for OS ( T R = 55 )
ItemsNPAuthor(s)NP x Author(s)Accumulated
Record(s)
Accumulated
Record (%)
Accumulated
Author(s)
Accumulated
Author(s)(%)
1212242414.12%127.59%
21146146170100%158100%
TR = Total Records; NP: Number of Publications.
Table 11. The example of exponent n of OS.
The Estimation of the Exponent n of OS ( T R = 55 )
x (NP) y (Author) X = l o g ( x ) Y = l o g ( y ) X Y X X
212 0.30 1.08 0.32 0.09
1146 0.00 2.16 0.00 0.00
Total158 0.30 3.24 0.32 0.09
TR = Total Records; x: Number of Publications; y: Author; X = logarithm of x; Y = logarithm of y.
Table 12. The example of K–S test for OS.
Organizational Sustainability (OS) ( T R = 55 )
x (NP)Author(s)Observation
by Author(s)
Accumulated Value
S n ( x )
Expectation
by Author(s)
Accumulated Value
F o ( x )
D m a x
11460.924051 0.924051 0.6706600.6706600.253391
2120.075949 1.000000 0.1922720.862932 0.137068
TR = Total Records; x: Number of Publications; Sn(x) = Cumulative frequency by obervation; Fo(x) = Cumulative frequency by expections; Dmax = Maximum deviation.
Publisher’s Note: MDPI stays neutral with regard to jurisdictional claims in published maps and institutional affiliations.

