Article

Quantifying Food Waste in the Hospitality Sector and Exploring Its Underlying Reasons—A Case Study of Lahore, Pakistan

1
Food and Markets, World Wide Fund for Nature (WWF), Lahore 54600, Pakistan
2
Department of Plant Pathology, College of Agriculture, Guizhou University, Guiyang 550025, China
3
Kauser Abdulla School of Life Sciences, Forman Christian College (A Chartered University), Lahore 54600, Pakistan
4
Sustainability Research Institute, School of Earth and Environment, University of Leeds, Leeds LS2 9JT, UK
5
Department of Environment and Geography, University of York, Wentworth Way, York YO10 5DD, UK
6
Department of Biology, College of Science, King Khalid University, Abha 61413, Saudi Arabia
7
Botany and Microbiology Department, Faculty of Science, Assiut University, Assiut 71516, Egypt
8
Department of Plant Protection, Faculty of Agricultural Sciences, Ghazi University, Dera Ghazi Khan 32200, Pakistan
*
Authors to whom correspondence should be addressed.
Sustainability 2022, 14(11), 6914; https://doi.org/10.3390/su14116914
Submission received: 14 March 2022 / Revised: 5 May 2022 / Accepted: 5 May 2022 / Published: 6 June 2022
(This article belongs to the Collection Agricultural Economics and Sustainable Food Consumption)

Abstract

:
Given that about 40% of the total food produced globally is lost or wasted, there is an urgent need to understand what, where, why and how much food waste is generated. In this study, we collected the much-needed primary empirical data from the restaurants, hotels and caterers of Lahore, Pakistan through surveys and live tracking/diaries. Specifically, two key performance indicators, waste per customer (g) and percentage waste per day (%), were measured. Waste per customer was found to be 79.9 g (survey) and 73.4 g (live tracking) for restaurants, 138.4 g for hotels and 140.0 g for caterers. Similarly, the percentage of waste per day (%) was found to be 15% (survey) and 17% (live tracking) for restaurants. Results revealed that customer plate leftovers were reported to be the primary source of food waste, followed by inaccurate customer forecasting. Given the food waste levels identified in this study, the development and adoption of a national goal and target aimed at food waste reduction could usefully guide the efforts of all stakeholders. To achieve this, we need to build the capacity of all the relevant stakeholders on food loss and waste measurements and ensure national food waste reporting.

1. Introduction

A new report by the World Wide Fund for Nature (WWF) has revealed that 2.5 billion tonnes or 40% of all food grown globally are lost or wasted [1]—approximately 1.2 billion tonnes more than previously estimated by FAO in 2011 [2,3,4]. This not only wastes huge amounts of natural and man-made resources employed in producing this food but also represents a lost opportunity for food security and the economy [5,6,7]. It is morally and ethically wrong to waste food fit for human consumption when 850 million people were still hungry and one out of three were malnourished in 2018 [3,8,9,10].
Food lost in the supply chain between the farmer and the market is called food loss; whereas discarding or alternative (non-food) use of food that is otherwise safe and nutritious for human consumption is known as food waste [11]. Issues related to food waste have started to gain public and political attention in recent years. In 2015, world leaders made reducing food waste one of the targets of the United Nations Sustainable Development Goals (SDGs) for 2030. The aim of the SDG target 12.3 is: “By 2030, halve per capita global food waste at the retail and consumer level and reduce food losses along production and supply chains, including post-harvest losses”. To move forward towards achieving this target, it is imperative to understand where, why and how much food (edible and inedible) is wasted [3]. Creating food waste quantification baselines is an important step in gaining insight into the magnitude and hotspots of food waste and tracking progress towards this target. Similarly, knowledge about the underlying reasons for food waste is also vital for developing effective measures and strategies that can be evaluated over time.
The number of studies on food waste-related topics has increased in recent years. National and intergovernmental organizations such as the Waste and Resources Action Programme (WRAP) in the United Kingdom and Fusions [12,13] in Europe have been working on various aspects of the challenge. However, the majority of the research is skewed towards industrialized or developed countries, leaving the situation of food waste in developing countries poorly understood [14]. For instance, there are only four research studies [15,16,17,18] that explore the issue of food waste in Pakistan. Although FAO [11] reports that per capita food waste is higher in developed countries compared to developing countries, where issues of food losses are more prevalent, the authors of [19] claim that the use of outdated data may have overestimated food loss and underestimated food waste in developing countries. The latest report by [1] has also weakened this claim by showing that high- and middle-income countries of Europe, North America and industrialized Asia are responsible for 58% of the global harvest loss [1]. Hence, it is important to address this gap and explore the issue of food waste in developing countries.
Food waste can be generated at various stages of the food supply chain, such as retail, household level and hospitality level. In this study, we focus on collecting much-needed empirical evidence on food waste from the hospitality sector (restaurants, hotels, and catering) of Pakistan. The United Nations Environmental Programme’s latest Food Waste Index Report [20] has revealed that 931 million tonnes of food are wasted from retail, food services and households. The hospitality sector contributes to nearly 12% of the total FLW, with the rise in out-of-home dining trend, higher incomes and growth in tourism all projected to further increase this contribution [21,22,23,24]. Despite this, the hospitality sector has not received enough academic attention and suffers from data deficiencies [3,19,21].
Pakistan has a population of 207.77 million in 2017 according to the latest Pakistan Economic Survey, of which 36% suffer from food insecurity [25]. Quantifying food waste in the hospitality sector of Lahore, Pakistan is significant in several ways. We cannot assess our food waste reduction strategies when we do not know how much waste we generate [26]. The hospitality sector offers great potential for food waste reduction. Media reports from Pakistan and findings from a handful of studies [15,16,17,18] have hinted at the situation of food waste. Nevertheless, empirical data on the amount of food that goes to waste in Pakistan is largely absent (at both government and academic levels). Only the authors of [15] have estimated the absolute food waste amount in restaurants. However, absolute food waste amount does not allow for comparison between different restaurants as well as other sectors without having data on the number of customers or the number of items procured. Similarly, it is not a good reflection of the resource use efficiency of a food serving unit.
The two key performance indicators, waste per customer and percentage waste, that we are calculating in this study are much more efficient at identifying hotspots that have the maximum potential for food waste reduction. This is the first study that is calculating these indicators in Pakistan. By using standardized methods and frameworks, we are providing much-need baselines that are first-hand empirical data and that could be (and are currently being) used by relevant experts/policymakers in carrying out national-level food waste reporting. These indicators are recommended in the literature and have been used previously in other regions and sectors, thus allowing for a much more accurate and reliable comparison between regions, sectors and time periods. Waste per customer calculated initially in the hospitality sector is considered one of the most important factors in reducing waste [26,27]. The ability to accurately make such comparisons is essential because it allows us to evaluate and compare measures aimed at reducing food waste as well as monitor progress towards achieving the SDG target of 50% reduction in food waste by 2050 [3,19].
Secondly, the food waste quantities that we are calculating in this study could be used to estimate greenhouse gases (GHGs) emitting from this waste in Pakistan when combined with data on the water, energy, ash and protein content of the products [28]. GHG emissions from the decomposition of food waste are generally considered “emissions in vain”, as they are a useful resource for recycling [29]. Instead, most of the wasted food ends up in landfills or dumping sites where it decomposes and generates leachate that percolates into the ground and contaminates our soil and groundwater [30,31]. Almost 22% of the total municipal solid waste is food waste [29]. Thus, data on food waste could also shed light on these related environmental issues in Pakistan and thus contribute to climate change mitigation, solid waste management and global warming.
Lastly, the fieldwork we will conduct in this study will help us identify methodological and behavioural challenges that we might face when collecting data, as this is still a new topic in Pakistan.
This leads us to our aims of this study, which are: (i) to quantify the amount of food waste in the restaurant, hotel and catering segments of the hospitality sector of Pakistan by calculating waste per customer and percentage waste indicators; and (ii) to investigate other important aspects related to food waste including sources, processes, prevention and redistribution of food waste. Lahore was chosen for this study, as it is the second most populated city in Pakistan with a population of over 11 million, and it is experiencing rapid development as well as migration from rural areas.

2. Materials and Methods

This is an exploratory study in which data from the hospitality sector was collected through surveys and diaries. The need for a consistent and standardized methodology has been increasingly highlighted in the literature on food waste to improve data quality and transparency and allow for comparison among countries, stages and commodities [19]. An important step in achieving this is to clearly define the scope and theoretical and physical boundaries of a study [32,33].

2.1. Scope and System Boundary

The hospitality sector is commonly divided into commercial and non-commercial sub-sectors based on their activities [34]. In this study, we surveyed restaurants, hotels and wedding caterers that operate their businesses on a commercial basis. In defining food waste, we follow FAO, which defines food waste as the decrease in the quantity and quality of food and its subsequent removal from the food supply chain at the retail and consumption level [11,21]. This distinction in the food waste definition is also implicit in SDG Target 12.3 which allows for better monitoring and evaluation of the target. We considered both edible and inedible food as waste generated in various kitchen processes. We did not distinguish between each kitchen process such as preparation waste, serving waste, plate leftovers, etc. This is due to the lack of access to the kitchen area, as businesses were hesitant, fearing that their operating practices might be revealed to either their competitors or governmental regulatory bodies. However, we attempted to gain insight into this important aspect through our questionnaire survey in Supplementary Materials.
We followed the definition in [13] and defined the following destinations as food waste: bio-energy production, incineration, composting, and disposal to sewers and landfills. We did not consider food that is donated or redistributed, as waste as it is still part of the supply chain. Hence, both edible and inedible foods that enter the restaurants, hotels and caterers in Lahore city and end up in these destinations are regarded as food waste in this study. Several direct and indirect observational and measurement techniques are used to quantify food waste. Direct measurement and observational techniques such as direct weighing and waste composition analysis quantify food waste most accurately but include observer bias. Moreover, they are difficult to implement in Pakistan, as direct access to the kitchen and food waste is not possible in most cases [15]. We found questionnaire surveys to be a more suitable method and therefore conducted in-person structured surveys of restaurants, hotels and wedding caterers to obtain approximate daily food waste values and gather information regarding food waste sources, processes, causes, prevention and management. Data collection through questionnaire surveys and diaries was carried out over four months, from November 2020 to February 2021. After an initial pilot survey, the main survey was conducted in each of our selected sectors. In-person questionnaire surveys for each sector were conducted within two weeks, at the time when lockdowns due to the COVID-19 pandemic were not in place. Data collection was paused one week before and one week after the new year to avoid seasonal variations.

2.2. Sampling Strategy

Restaurants vary in their food handling and processing practices, business model, clientele and target market, which results in heterogeneity in the stage and quantity of food waste generated by each restaurant [15]. We tried to contain this heterogeneity by splitting our sample restaurants into three broad categories: high-end, medium-end and low-end. We followed the methodology implemented by [15] and used the average price for a full course meal that included an appetizer, a main course and dessert as an indicator of heterogeneity to segregate restaurants. Restaurants with an average meal cost of 700 PKR and less were categorized as low-end restaurants; those between 700 to 1200 PKR as medium-end restaurants and those above 1200 PKR as high-end restaurants (refer to [15] for the complete methodology). We randomly selected 75 restaurants from Lahore that offered dine-in services, 25 from each category. Our final restaurant sample size after receiving completed surveys was 48, with a response rate of 64% (13 high-end, 17 medium-end and 18 low-end). We randomly surveyed 20 hotels that were 3-star or above that served multiple meals to their occupants. We chose this criterion because most of the small hotels and guest houses do not have a live kitchen and usually have food delivered for their occupants; thus, their food waste was negligible. About 11 out of 20 hotels responded to our survey questionnaire with a response rate of 55%.
There is not much heterogeneity in the wedding catering sector of Lahore due to the one-dish policy introduced by the Punjab government, which places a limit on the number of dishes a facility can serve at an event. We divided our population into geographical clusters and from there randomly selected four clusters which became our primary sampling units. From each cluster, we then randomly selected five participants for a total number of 20 respondents. We tried to reduce variance by using a small cluster size and keeping the units in each cluster constant [35]. We received complete responses from 15 wedding caterers, giving a 75% response rate. Hence, our total sample size for the hospitality sector for the survey questionnaire is 115, out of which 74 were completed, with a response rate of 65%.
A standardized questionnaire that mostly contained closed questions was developed and adapted from [15,36,37]. The questionnaire was divided into five sections, with Section 1 gathering basic information such as average daily customer turnover, type of restaurant/hotel, work experience of the respondent and weight and frequency of procurement of raw materials. Section 2 considered the type, amount, sources, processes and seasonality of food waste in greater depth. The remaining three sections explored food waste preventive strategies such as segregation and tracking, and food waste redistribution and recovery, with a particular focus on donation, and recycling. Verbal informed consent was obtained from each participant before the start of each survey. They were given the right to withdraw at any point during the survey. Each participant was debriefed about the aim of the survey and their anonymity and confidentiality were assured.
Along with the questionnaire, we also conducted diary-based food waste live-tracking to record real-time food waste generated in restaurants and hotels for seven consecutive days. This allowed us to record data that is otherwise not accessible and to combine it with the approximate food waste values from surveys to obtain cumulative food waste values. During our surveys of restaurants and hotels, we asked every manager if they would be interested in participating in a one-week food waste live-tracking exercise. Only nine units, including eight restaurants and one hotel, agreed to do it.
We devised a live-tracking diary form that included a brief overview of the study and an instruction manual for the staff in which we clearly stated the method for weighing (in kg) using a weighing machine and recording food waste values, and defined the type and stages of food that we regarded as waste. We also collected information on daily customer turnover and the amount (kg) of food procured, needed to calculate key performance indicators. An in-person briefing was given to each restaurant and hotel manager who participated in the live tracking, and a diary form was handed over to each manager. Complete diary forms were either collected physically after one week or received electronically. We collected this data from eight restaurants and one hotel for a total of 62 quantification days. An attempt was made to conduct live tracking in all restaurants and hotels at the same time. It was not achieved due to logistical and practical reasons. Nevertheless, live tracking in all the units was performed in January 2021.

2.3. Key Performance Indicators (KPIs): Waste per Customer and Percentage of Waste

Here, we describe the calculation of two key performance indicators identified from the literature that can be tracked over time [3,38]: “waste per customer” and “percentage waste”. Waste per customer is a useful indicator, as it signifies how much waste each customer generates on average. Although waste per portion is a more commonly measured indicator, data on the number of customers were more readily available as compared to the number of portions served. Moreover, the heterogeneity in the sector and considerable variation in the portion sizes meant that waste per customer is a more useful indicator. Nevertheless, a comparison between waste per customer and waste per portion values can still be drawn to a reasonable extent.

2.3.1. Calculating “Waste per Customer”

Data regarding the number of customers and amount of food waste (kg) were used to calculate “waste per customer” KPI for each hospitality sector, using Equation (1) below, where i represents daily measurement and n is the total number of sample units in case of surveys, and the total number of quantification days in case of live tracking.
W a s t e   p e r   c u s t o m e r   p e r   s e g m e n t = i = 1 n ( A m o u n t   o f   w a s t e   r e c o r d e d ) i i = 1 n ( N u m b e r   o f   c u s t o m e r s ) i  
Generally, when handling datasets underlying these calculations, we encountered many missing values which might have given inconsistent results if not managed properly. For instance, possibly not every respondent would provide information about their daily customer turnover or the amount of waste, or the number of food items procured. Therefore, applying the above formula without locating and handling such missing data might skew the results. As a result, we only included the amount of daily waste and the number of customers in the calculation when both were present for the same sample unit. Along with this, we also calculated average waste per customer by calculating descriptive statistics, using the same underlying datasets: the amount of waste recorded and the number of customers. We calculated it for live tracking data according to Equations (2) and (3), and for survey data using Equation (4). Equation (2) calculates the average waste per customer individually for each restaurant that participated in the live tracking. In Equation (3), these values are added together and divided by the total number of restaurants to obtain the final average waste per customer value.
A v e r a g e   w a s t e   p e r   c u s t o m e r ( I ) = 1 n i = 1 n ( D a i l y   w a s t e   a m o u n t   i D a i l y   n u m b e r   o f   c u s t o m e r s   i )
where n is the total number of live tracking days.
A v e r a g e   w a s t e   p e r   c u s t o m e r ( I I ) = 1 n j = 1 m A v e r a g e   w a s t e   p e r   c u s t o m e r   j  
where n is the total number of restaurants, and m is the average waste per customer of restaurant j .
A v e r a g e   w a s t e   p e r   c u s t o m e r   ( S u r v e y s ) = 1 n i = 1 m ( D a i l y   w a s t e   a m o u n t   i D a i l y   n u m b e r   o f   c u s t o m e r s   i )
where n is the total number of restaurants, and m is one particular restaurant.

2.3.2. Calculating “Percentage Waste”

Percentage waste indicates food waste in proportion to total served food mass and is a good marker of efficiency. It was calculated based on the criterion similar to “waste per customer” by including only those datasets for which both “Amount of waste” and “amount of food items procured” were given. Applying this criterion is important in calculating this indicator, as a large proportion of kitchens did not disclose or quantify the number of food items procured. This indicator was calculated using Equation (5), where i represents the daily amount, and n is the total number of sample units in the case of surveys and the total number of quantification days in the case of live tracking.
P e r c e n t a g e   W a s t e   ( % ) = i = 1 n ( A m o u n t   o f   w a s t e   r e c o r d e d )   i i = 1 n ( M a s s   o f   i t e m s   p r o c u r e d ) i × 100
We also calculated descriptive statistics for percentage waste (%) according to Equations (6) and (7) for live tracking data and using Equation (8) for survey data. Lastly, we calculated these indicators at a 95% confidence interval to reflect the uncertainties associated with the indicators.
A v e r a g e   p e r c e n t a g e   w a s t e   l i v e   t r a c k i n g ( I ) = 1 n i = 1 n ( D a i l y   w a s t e   a m o u n t   i M a s s   o f   i t e m s   p r o c u r e d   i )
where n is the total number of live-tracking days.
A v e r a g e   p e r c e n t a g e   w a s t e   l i v e   t r a c k i n g   ( I I ) = 1 n j = 1 m A v e r a g e   p e r c e n t a g e   w a s t e   j
where n is the total number of restaurants, and m is the average percentage of waste per restaurant j .
A v e r a g e   p e r c e n t a g e   w a s t e   ( S u r v e y s ) = 1 n i = 1 m ( D a i l y   w a s t e   a m o u n t   i M a s s   o f   i t e m s   p r o c u r e d   i )
where n is the total number of restaurants, and m is one particular restaurant.

3. Results

Our results displayed waste per customer per day (g) and the percentage of waste per day (%) from restaurants, hotels and caterers. They also brought to light food waste management practices carried out by the businesses, including sources, processes, redistribution and recovery.

3.1. Key Performance Indicators

Many managers were concerned about confidentiality and were reluctant to report the amount of food waste on their sites or other relevant information related to food waste. Thirty-two out of forty-eight sampled restaurants disclosed the amount of food waste on their premises during the surveys. Similarly, among the 12 hotels and 15 caterers that completed our survey, 10 hotels and 11 caterers provided information on the amount of food waste. Regarding live-tracking diary forms, we only included data from five units for a total of 35 out of 62 days. The remaining restaurants, hotels and caterers either refused to provide that information or reported zero/negligible waste. Any facility that prepares and serves food is bound to generate at least some food waste during the process. Hence, zero/negligible food waste figures seemed improbable and were not included in our analysis.
Waste per customer was found to be lowest for restaurants (79.89 g from surveys, 73.4 g from live tracking), followed by hotels (138.35 g) and caterers (140 g) (Table 1). Figure 1, which shows the scatter plot of average waste per customer per day vs. the number of customers per day, demonstrates that waste per portion values for restaurants calculated from the diary data are more clustered together and fall within a narrower range compared to values calculated from the survey data for restaurants. Our value for restaurants was found to be lower than 153, 192 and 200 g of waste per portion reported by [3,4,39], but more closely in line with 98–128 and 21–118 g of waste per portion recorded by [23,40]. One possible explanation could be that [23] conducted this study in Lhasa, Western China (also a developing country), compared to the other two studies i.e., [3,34] which reported data from developed countries.
Conversely, waste per customer (138.35 g) from hotels is close to 141 g of waste per portion assessed by [3]. This similarity in values could be because all the hotels surveyed in our study were high-end and luxurious and followed international standard operating procedures with regard to cooking, handling and discarding food, which could mean that they might be less affected by local practices. The authors of [18] reported waste per person in the catering sector of Pakistan to be 195 g among rural families and 165 g among urban families, slightly higher than our value of 140 g.
We encountered a lot of missing or incomplete data on items procured on our questionnaire and diary forms that restricted our sample size for analysis. For instance, only seven restaurants from surveys and three restaurants for a total of twenty-one days from live-tracking provided complete data on items procured; thus, the rest were disqualified due to lack of or incomplete data. For restaurants, the percentage of waste was found to be 15% when calculated from survey data and 17% when calculated from live-tracking data (Table 2). Several studies such as [3,39,41,42,43,44] have reported percentage waste that ranged from 11% to 45% for different foodservice sectors. For instance, Refs. [3,45] reported an average of 20%, whereas [3,39,46] calculated around 7–28%, 18–22% and 20–26% of waste within the hospitality sector, respectively. This shows that our findings also fall within this range and are more towards the mid-low range.
From the scatter plot in Figure 2, we observed three different clusters formed for the live tracking data, each representing one kitchen. This indicates that the percentage waste in each restaurant does not vary much over one week. However, there is huge variation among the restaurants, ranging from 7% up to 43%. This could be due to the specific type of cuisines offered by each restaurant, as each cuisine requires different sets of ingredients and parts of a food product and has a unique recipe.

3.2. Sources/Processes of Food Waste

All three segments of the hospitality sector reported food leftover by customers as the primary source of food waste. Overproduction and food spoilage were the second and third major sources/processes of food waste in hotels and restaurants, whereas lack of storage facilities and food waste during preparation and serving were reported as the least important sources of food waste (Figure 3).
All three categories of the restaurant (low, middle and high end) reported food leftover by customers as the primary source of food waste. A higher proportion of low-end restaurants also reported overproduction as the second major source of food waste. Similarly, although 100% of the caterers stated plate leftover as the primary source of food waste and some previous studies such as [47] have also identified plate leftover as a major proportion of food waste, caterers in our study overproduced food. However, extra dishes of leftover food were usually handed over to the clients. Hence, they did not consider that food was wasted.
Our results from the questionnaire also revealed that 92% and 80% of all respondents from the hospitality sector procured vegetables and chicken daily, respectively. This indicates that the replenishment cycle for most facilities is short, reducing the error for inaccurate forecasting. However, some high-end restaurants and hotels stock chicken and meat for up to three days in case there is a disruption in the supply. Many restaurants had a policy of not using certain food items such as bread, salad vegetables, dairy products, etc. the next day; thus, some food was still wasted. When talking to the managers, we found that some restaurants and hotels followed strict standard operating procedures regarding the size, shape, color and texture of vegetables and chicken/meat, and they simply discarded those that did not meet their criteria [48]. We also discovered that high-end restaurants that serve expensive, exquisite dishes use only the best parts of the chicken, meat, or vegetables to maintain quality and hence generate a lot of waste. This shows that although the micro-level reasons for food waste were similar among the sector, the actual cause of food waste still varied among different units, depending on their business model, customer needs and standard operating procedures, and hence they require tailored solutions [49].

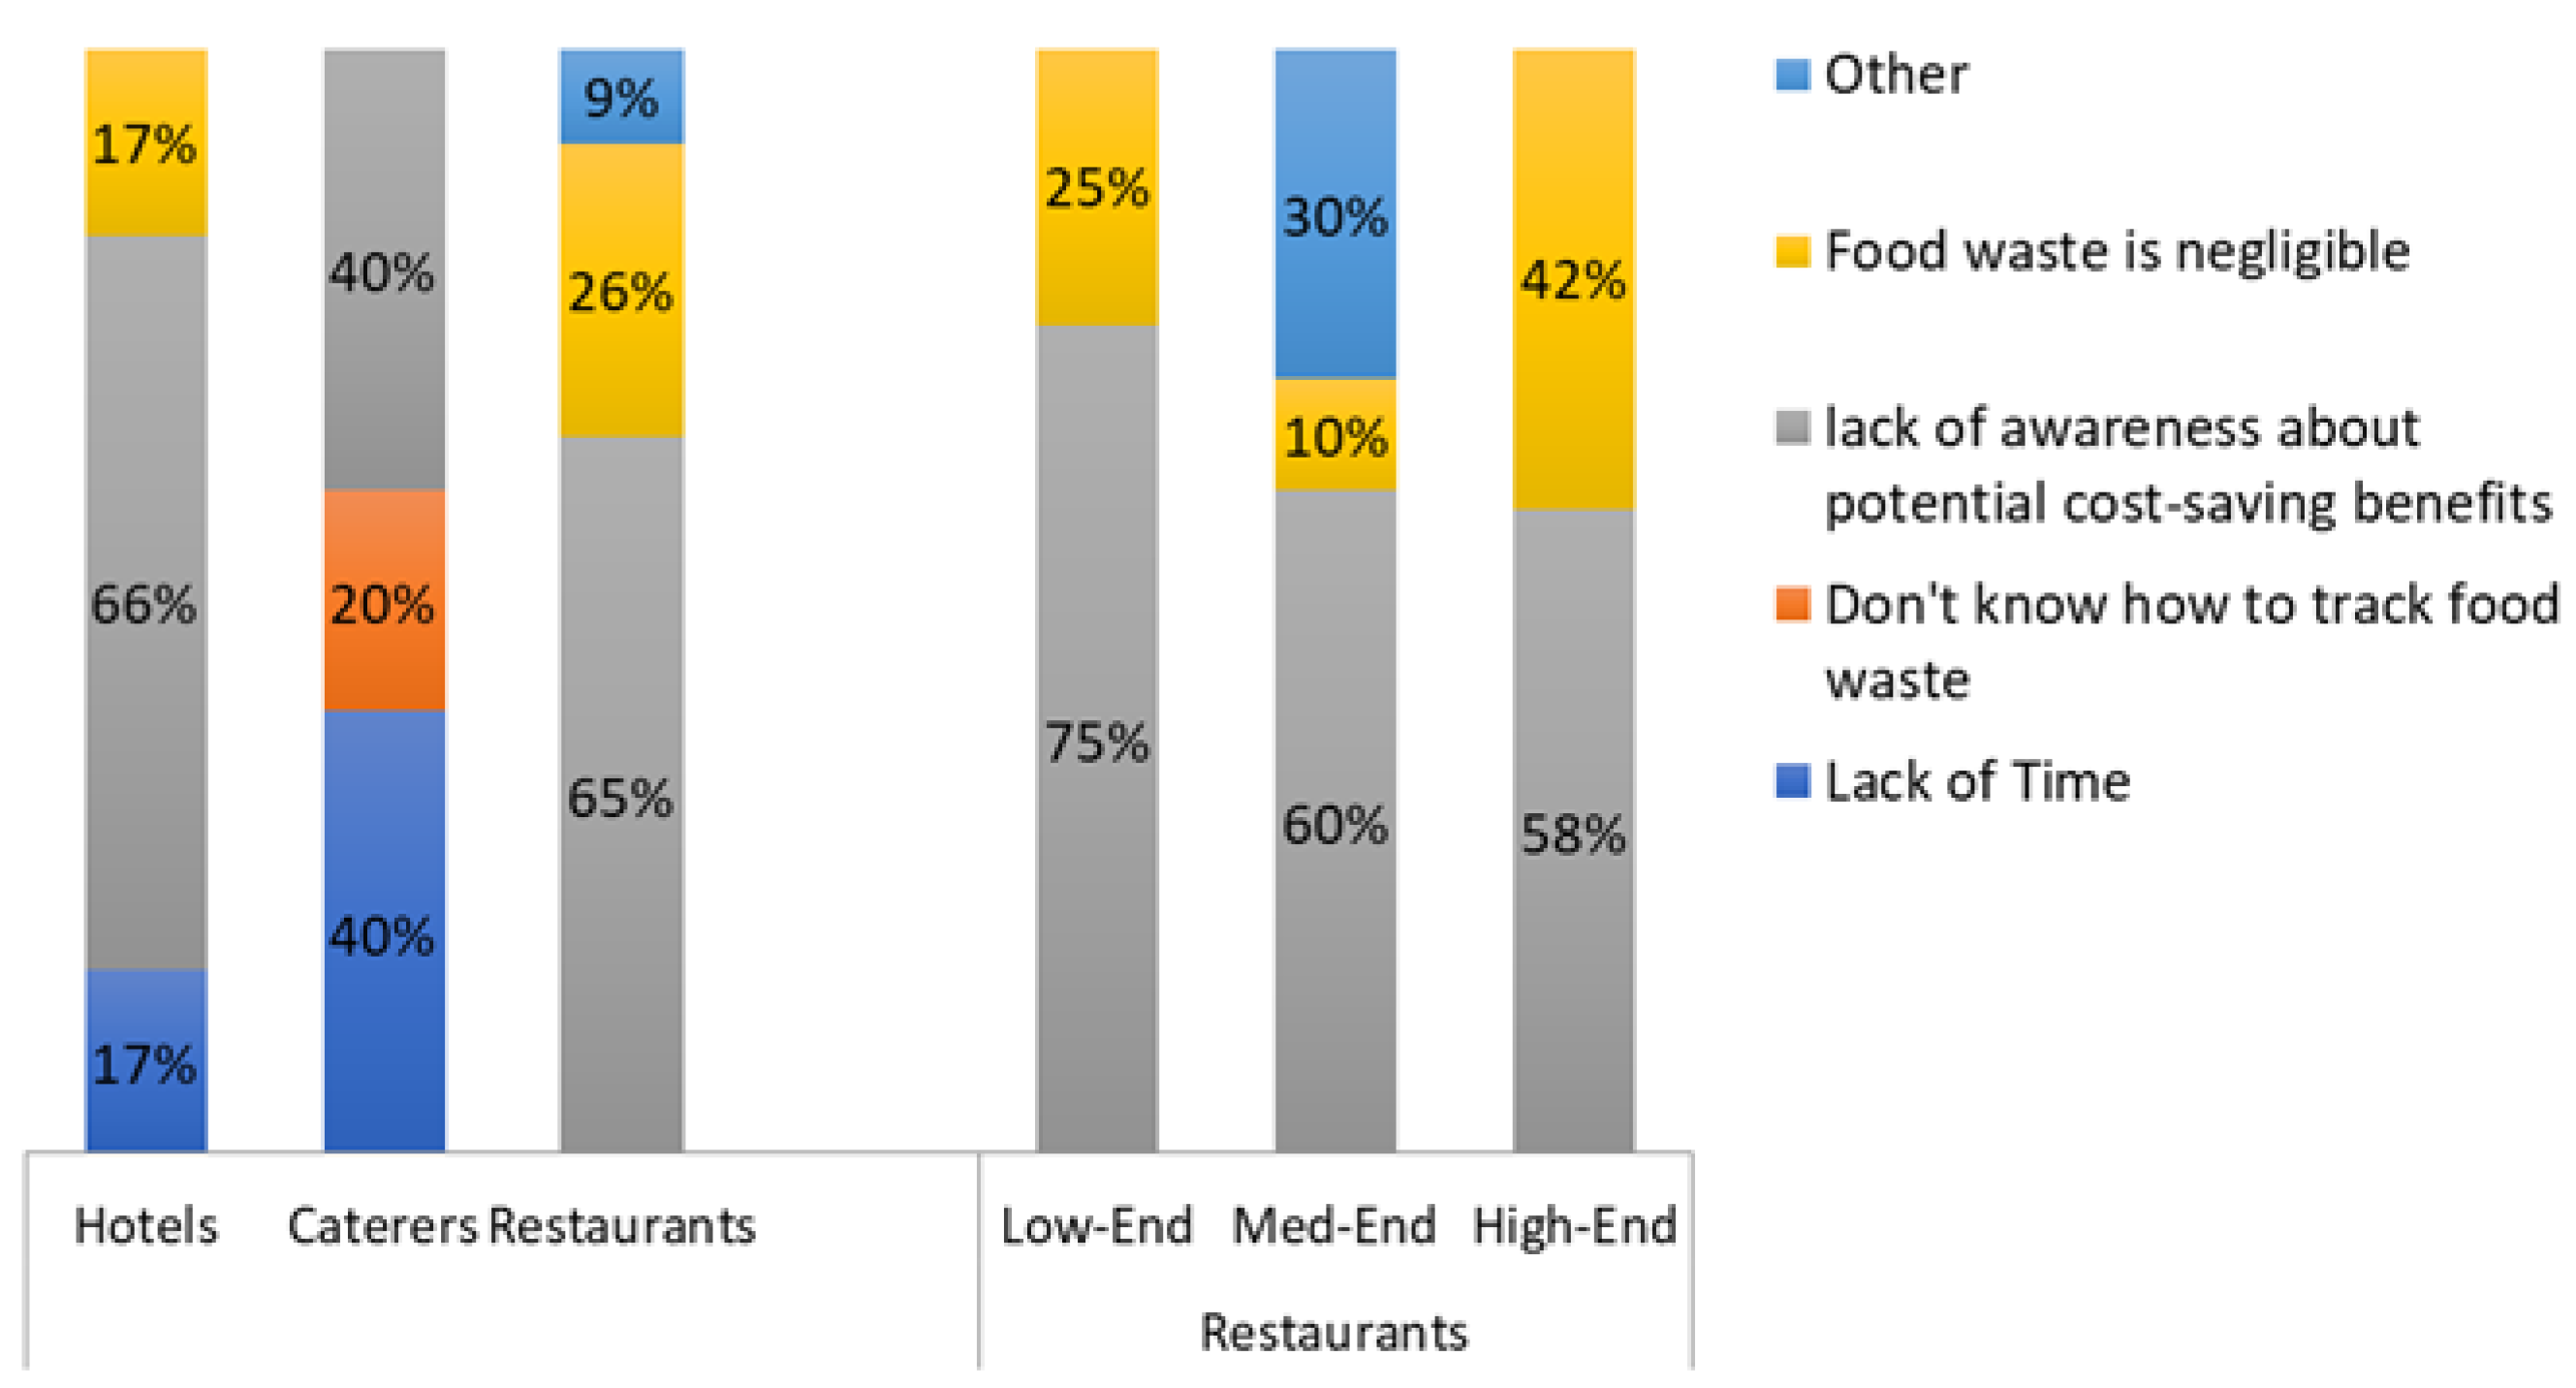
3.3. Food Waste Segregation and Tracking

Regarding food waste segregation, we found that the majority of the hotels, restaurants and caterers performed food waste segregation: 91.7% hotels, 68.8% restaurants and 78.6% caterers (Figure 4).
Most restaurants used standard bins to keep food waste separate from other types of waste. Only four out of eleven hotels, six out of forty-eight restaurants and one out of fourteen caterers tracked their food waste. Most of these units tracked food waste through visual analysis and manual weighing, without the use of any app or software. Our results are consistent with the results of [15], which reported similar behaviour. When asked about the reasons for not tracking food waste, lack of awareness about the potential cost-saving benefits was reported by most of the hotels, restaurants and caterers as the most important reason, followed by lack of time and negligible food waste. This trend was consistent among high-end, medium-end and low-end restaurants as well.
Our results reveal that the hospitality sector needs to be educated on the potential economic, environmental and social benefits of tracking food waste. Tracking food waste is the first step toward establishing food waste reduction strategies in the hospitality sector. Given that most of them already segregate food waste and most of them have stated lack of awareness as the reason for not tracking food waste, raising awareness and technical training might increase the adoption of food tracking practices in the hospitality sector and consequently reduce food waste.

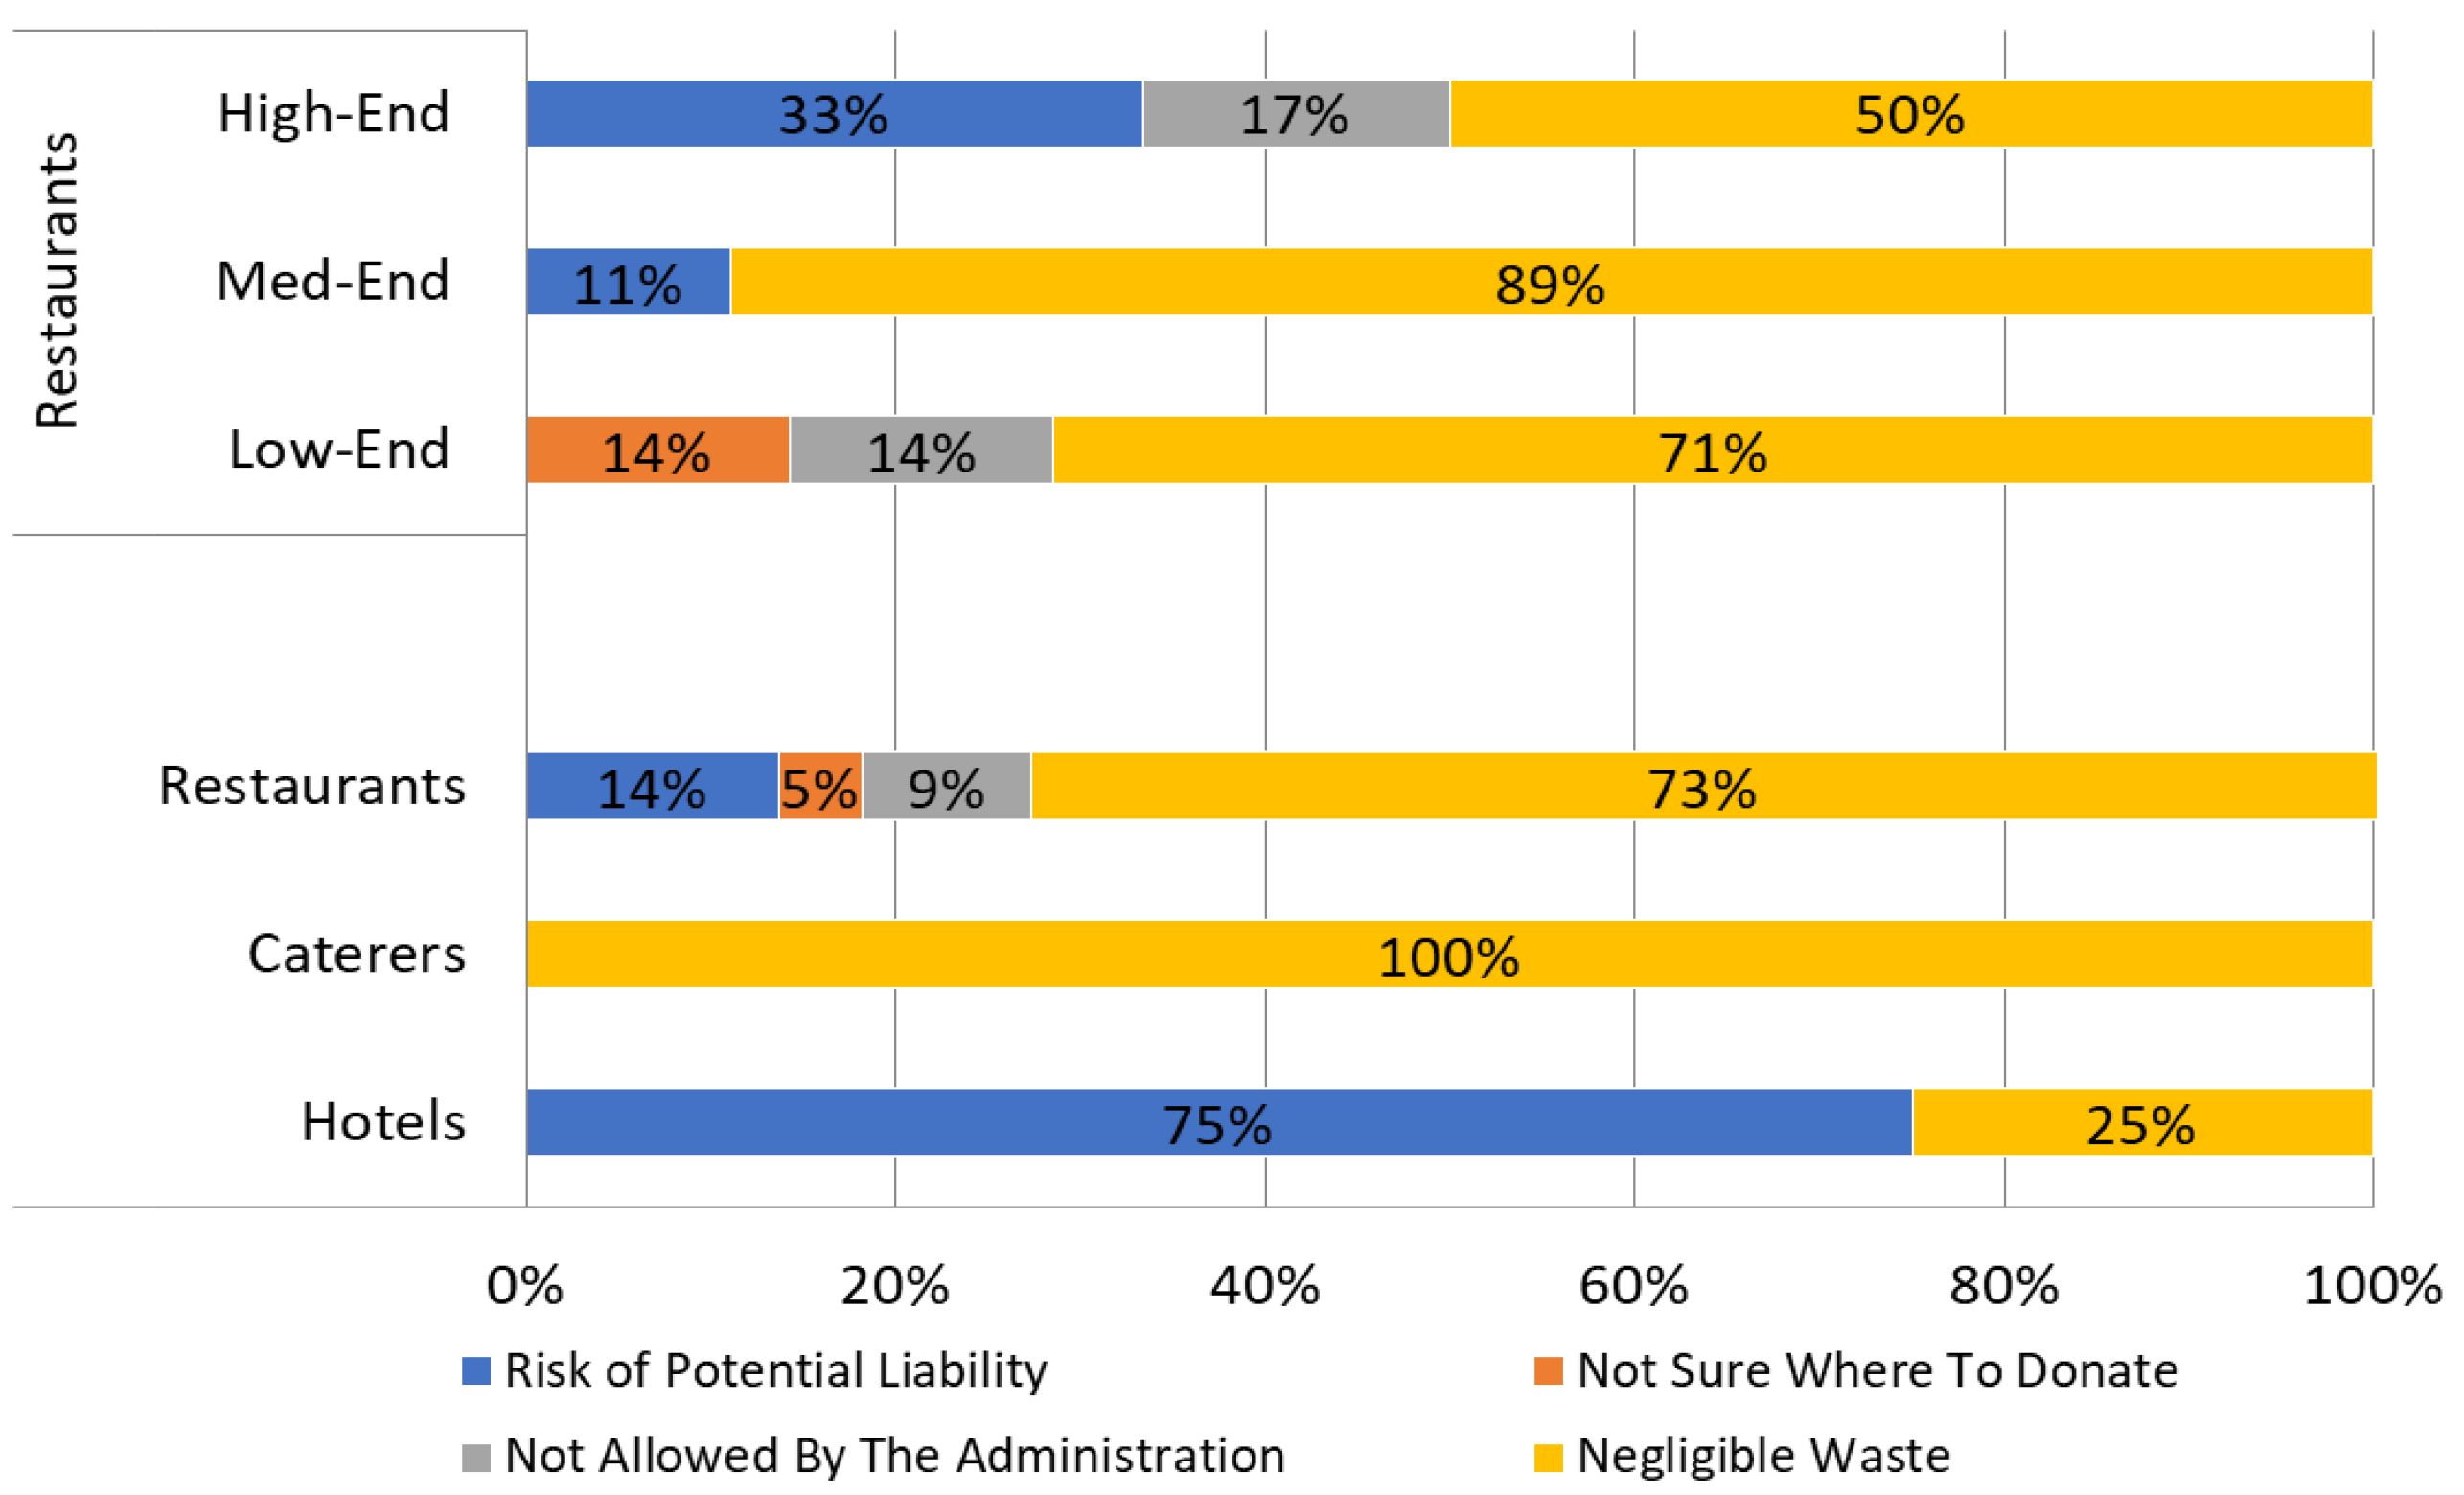
3.4. Food Waste Redistribution and Recovery

Following food waste prevention and minimization, food waste redistribution and recovery are considered to be effective food waste solutions [21,34]. We explored attitudes towards the adoption and application of these strategies in the hospitality sector, as shown in Figure 5. Only eleven out of seventy-four respondents reported donating and recycling food waste. This included nine restaurants and one hotel and caterer each that donated food, and six restaurants and five caterers that recycled food waste. Of those who did not perform food donation, the majority (71.9%) reported negligible waste as the most important reason for not doing so, followed by risk of potential liability (18.8%), restrictions placed by the administration, and not knowing where to donate. The majority of the restaurants were nevertheless engaged in the informal donation of their surplus, unused food to their cleaning and serving staff, and street beggars. This was more convenient for most restaurants than formally donating to food banks, as it saved logistical and other costs, and most of the people were easily available. This indicates that although formal donation infrastructure is largely absent, informal food donation currently practiced still contributes toward food waste reduction.
Almost all restaurants reported offering doggie bags/takeaway boxes to customers to pack leftover food that they can eat later or give to someone else. This is a common practice in the restaurant sector that is aimed at preventing edible food from being wasted [50]. Many restaurant and hotel chefs also used proper methods for chopping and trimming vegetables and meats to minimize waste and ensure maximum [21,51,52].
The catering sector reported preparing 10–15% extra food at every event, as there is a stigma attached to food running out at an event and it is considered a source of embarrassment for the hosts as well for the catering company. Unserved leftover food at the end of an event is handed over to the clients in most cases.
After food donation, food waste recycling is the next possible food waste solution. However, only a few facilities were engaged in food recycling and they either used it as animal feed or for composting. One restaurant that sold sandwiches and as a result generated a lot of bread crust waste sent this waste to poultry farms to be used as animal feed. Similarly, another restaurant said that they spread out wasted food on the roof as bird feed. When asked about the reasons for not recycling food waste, the majority of the hotels and caterers expressed a lack of interest as the most important reason (Figure 6). Most of the restaurants, however, reported a lack of awareness and knowledge as the primary constraint to food waste recycling. This shows that increasing awareness and knowledge about the benefits of recycling and providing training to restaurant staff can potentially encourage more restaurants to recycle food waste instead of sending it to a landfill.

4. Discussion

Food systems contribute to more than one-third of the total greenhouse gas emissions, estimated at 34%, a UN-backed study [53] revealed. If food waste were a country, it would be the third-largest emitter of greenhouse gas emissions after the United States and China, equivalent to 8% of the world’s total CO2 emissions [7]. Food waste reduction is a useful pathway to minimize the environmental, economic and social footprint of food production, and improve food security and resource-use efficiency [54].
Most managers that we surveyed reported customer plate leftovers as the primary source of food waste. The actual cause of plate leftovers varied depending on the restaurant type, their meal price and the type of food they served. Many other studies such as [34,45,46,55] have also identified plate leftovers to be an important category for food waste reduction. Silvennoinen et al., [4] and Pirani & Arafat [39] reported that more than half of all food waste (i.e., more than 10%) was due to customer plate leftovers, in both à la carte and buffet settings. However, it is common for food facilities to blame customers even though the proportion of plate leftover waste varies between 23% and 35% of the total food waste [14,34,56,57,58,59].
Our survey highlighted that food waste tracking and formal donation are carried out by a few facilities. Most facilities were already engaged in food waste segregation; hence, encouraging them to track food waste would be relatively easier. This is what we did with some of these facilities that tracked their food waste for one week.
In most developed countries, food donations have been institutionalized into formalized donation systems through partnerships between food banks and food facilities [60]. Food donation processes could also be formalized in Pakistan by setting up donation networks for feeding people, reducing transportation and storage costs through distribution network optimization and addressing liability concerns. However, this might disrupt the informal donation system more commonly practiced at present in Pakistan and raise constraints in the form of hygiene, food safety and liability standards, which could potentially increase food waste due to its perishable nature. Additionally, many studies in the literature have questioned the efficacy of these food redistribution and food recycling solutions in improving the overall sustainability of food systems [61,62]. It is argued that these solutions result in the individualization of responsibility that depoliticizes food loss and waste issues and takes focus away from overconsumption and institutional thinking, subsequently undermining our ability to react effectively to these issues [63,64,65].
Apart from donation and recycling, most of the food waste still goes to the local landfill site, which is the cheapest and most convenient option for most businesses and people. The present landfill site in Lakhodair, Lahore became operational in 2016 and had the initial capability of managing 2000–2500 tonnes of waste daily for the next ten years. However, excess dumping that reached up to 6000 tonnes per day alongside inefficient management has already caused this landfill site to reach its maximum horizontal dumping capacity. Despite that, this amount is only 60–70% of the total solid waste that is generated in the city [66]. Moreover, it was initially planned as a sanitary landfill site, but only two out of six plots could meet the international waste disposal site standards (Lahore Waste Management Company, personal communication, 2021). Food loss and waste contribute to this, as it makes up around 30% of the total waste [67].
Reducing food waste from entering landfills has several environmental, health and social benefits that can address multiple SDGs including SDG 2, SDG 3.9, SDG 6.3, SDG 11.6, SDG 12.3 and SDG 13.3. For instance, reducing the amount of food waste in the landfill would reduce the amount of leachate formation and its subsequent impact on the groundwater and soil (SDG 6.3, SDG 11.6) [6]. This would reduce the number of illnesses that result from water and soil contamination (SDG 3.9). The amount of GHG emissions that result from the anaerobic decomposition of organic waste would also decrease, hence contributing to climate change mitigation (SDG 13.3).
This study took the first step in quantifying food waste in the hospitality sector of Pakistan using waste per customer/day (g) and percentage waste (%) indicators and has explored the sources, causes, prevention and management strategies currently practiced. This has allowed us to identify huge gaps in the present food waste management and overall waste management system of Pakistan. The next step for the country would be to create clear policies and goals as well as develop standardized FLW measurement and data analysis tools to better understand its magnitude and impact and to upscale these values to the provincial and country levels [3,68]. Many international organizations (WRI, WRAP, FUSIONS) have developed standard tools and procedures for measuring and tracking food waste from which Pakistani authorities can adapt and benefit. US Trade considers waste management in Pakistan as the best prospect industry for investment [66]. Hence, there are many opportunities to improve food waste management and overall solid waste management in the country. Our study has set up baselines for future studies. Future studies must monitor and track food waste using standard methods to maintain sufficient precision such that progress towards these goals and targets can be tracked over time and food waste can be reduced. This would involve training staff in the hospitality sector on tracking food waste as well as facilitating the adoption of such practices.

Limitations and Uncertainties

This study only focused on some segments of the hospitality sector and missed many other important hospitality sectors such as canteens, prisons, hospitals, etc. Future studies can explore the situation of food waste in these segments as well. The systematic error might have occurred due to the use of surveys that rely on the respondents recalling the amount of food waste. We tried to minimize this error by complementing surveys with a diary-based live tracking method that let us record food waste in “real time” (for detailed information on these two methods, see [32,33]). We did not randomly select restaurants for live tracking, only those who volunteered. As a result, only those restaurants that were more interested in food waste likely agreed to participate, making the results from the live tracking biased. Therefore, we do not claim that these results are representative of entire segments. We tried to ensure data quality and consistency collected both through surveys and diaries by clearly defining the processes, scope and method of quantification to the respondents. However, there might be slight variation in the way food waste was quantified and reported by each kitchen.
When we started our work on food waste quantification in an under-researched part of the world, it quickly became clear that food waste was not a top priority for many businesses, meaning almost all of them do not track or measure it. Hence, we tried to follow standardized methodologies and techniques while also displaying some flexibility. Increasing the sample size for the live tracking and collecting information on the total amount of items procured was particularly challenging. Despite approaching almost 115 foodservice units for food waste live-tracking, only around twenty agreed to participate. Out of those, the majority of them withdrew later on, which left us with only nine units in total that provided us with the data. Of these nine units, most had missing or unrealistic data, leaving us with small sample size. This reason for such an unreceptive response might be the lack of awareness or interest on the part of both foodservice providers and customers. Future studies might build on this response and create better strategies to improve the response rate.

5. Conclusions

The moral, environmental and economic burden of the food that is lost or wasted throughout the food supply chain is too high to be left unaddressed, more so for a country such as Pakistan, where a significant portion of its 220 million people still suffers from food insecurity. In this study, we quantified food waste in the hospitality sector (restaurant, hotel and caterer) of Lahore, Pakistan by measuring waste per customer and percentage waste indicators, and determined the sources, causes and management of food waste. On average, 15% and 17% of the total food was wasted in the restaurants, as measured through surveys and live-tracking, respectively. Similarly, waste per customer was found to be lowest for restaurants (79.9 g from surveys and 73.4 g from live tracking), followed by 138.4 g for hotels and 140 g for caterers. Plate leftover was found to be the primary source of food waste, followed by overproduction and food spoilage. Most restaurants, hotels and caterers segregated food waste using a separate waste bin. However, only a minority of them tracked their food waste, mainly through visual analysis and manual weighing. Most of the restaurants were found to be engaged in informal food donation as it was more convenient.
This study has generated new and much-needed empirical evidence on the scale and patterns of food waste in the hospitality sector of Pakistan. Our findings have opened up many promising avenues for future research on food waste in Pakistan as well as globally. The next step is to further increase the empirical evidence on food waste and to upscale these quantities to regional or national levels. An important step in doing this would be to employ approaches, methods and tools from a variety of fields and disciplines. Future research could also work on creating innovative and feasible solutions to reduce the amount of food waste as well as to prevent food waste from reaching landfills.

Supplementary Materials

The following supporting information can be downloaded at: https://www.mdpi.com/article/10.3390/su14116914/s1, File S1: Survey-Quantification of Food Waste from the Hospitality Sector of Lahore; Table S1: Restaurant Survey Data; Table S2: Hotel Survey Data; Table S3: Catering Survey Data; Table S4: Live Tracking Data.

Author Contributions

Conceptualization, N.A., A.D. and A.I.; Methodology, N.A., A.D., N.I., A.B., M.H., S.A., M.A.B. and Y.L.; Funding acquisition, Y.L., M.H. and S.A.; Data Collection, N.A., N.I. and A.D.; Formal Analysis, N.A. and N.I.; Writing—original draft, N.A.; Writing—review and editing, N.A., L.C.S., E.P., N.R. and Z.A.A. Supervision, A.D.; Project Administrator, A.I. All authors have read and agreed to the published version of the manuscript.

Funding

This study was funded by the National Natural Science Foundation of China (32060679), Science and Technology Foundation of Guizhou Province (Guizhou Science Base-ZK (2022)-General 071); the Guizhou University Cultivation Project (Guida peiyu (2019)52). This study was funded by World Wide Fund for Nature (WWF)-International under project number 10004200. The authors extend their appreciation to the Deanship of Scientific Research, King Khalid University, for funding this work through the research groups program under grant number R.G.P. 1/240/41.

Institutional Review Board Statement

Not applicable. The current study did not require ethical approval, as no experiment was performed on humans or animals.

Informed Consent Statement

Informed consent was obtained from all participants involved in the study.

Data Availability Statement

Not applicable here.

Conflicts of Interest

The authors declare no conflict of interest.

References

  1. WWF-UK. Driven To Waste: The Global Impact of Food Loss and Waste on Farms. Available online: https://wwf.panda.org/discover/our_focus/food_practice/food_loss_and_waste/driven_to_waste_global_food_loss_on_farms/ (accessed on 30 November 2021).
  2. Gustavsson, J.; Cederberg, C.; Sonesson, U. Global Food Losses and Food Waste; FAO: Rome, Italy, 2011. [Google Scholar]
  3. Malefors, C.; Callewaert, P.; Hansson, P.-A.; Hartikainen, H.; Pietiläinen, O.; Strid, I.; Strotmann, C.; Eriksson, M. Towards a Baseline for Food-Waste Quantification in the Hospitality Sector—Quantities and Data Processing Criteria. Sustainability 2019, 11, 3541. [Google Scholar] [CrossRef] [Green Version]
  4. Silvennoinen, K.; Heikkilä, L.; Katajajuuri, J.-M.; Reinikainen, A. Food waste volume and origin: Case studies in the Finnish food service sector. Waste Manag. 2015, 46, 140–145. [Google Scholar] [CrossRef] [PubMed]
  5. Dou, Z.; Wang, Y.; Ying, H.; Darko, S.; Chen, T.; Tian, X.; Zheng, H.; Li, Y.; Fan, S.; Cui, Z. Reducing Food’s Resource and Climate Footprints Via Food Waste Upcycling; Research Square: Durham, NC, USA, 2022. [Google Scholar]
  6. Baig, M.B.; Al-Zahrani, K.H.; Schneider, F.; Straquadine, G.S.; Mourad, M. Food waste posing a serious threat to sustainability in the Kingdom of Saudi Arabia—A systematic review. Saudi J. Biol. Sci. 2019, 26, 1743–1752. [Google Scholar] [CrossRef] [PubMed]
  7. FAO. Food Wastage Footprint & Climate Change Global Food Loss and Waste; FAO: Rome, Italy, 2021. [Google Scholar]
  8. Afzal, N.; Afionis, S.; Stringer, L.; Favretto, N.; Sakai, M.; Sakai, P. Benefits and Trade-Offs of Smallholder Sweet Potato Cultivation as a Pathway toward Achieving the Sustainable Development Goals. Sustainability 2021, 13, 552. [Google Scholar] [CrossRef]
  9. FAO. Methodological Proposal for Monitoring SDG Target 12.3.1 Sub-Indicator 12.3.1.A; FAO: Rome, Italy, 2019. [Google Scholar]
  10. Linh, N.K. Food waste management in the hospitality industry Case study: Clarion Hotel Helsinki. Bachelor’s Thesis, University of Applied Sciences, Helsinki, Finland, 2018. [Google Scholar]
  11. FAO. Global Food Losses and Food Waste—Extent, Causes and Prevention; FAO: Rome, Italy, 2011. [Google Scholar]
  12. FUSIONS. Drivers of Current Food Waste Generation, Threats of Future Increase and Opportunities for Reduction; FUSIONS: Bologna, Italy, 2014. [Google Scholar]
  13. Vittuari, M.; Azzurro, P.; Gaiani, S.; Gheoldus, M.; Burgos, S.; Aramyan, L.; Valeeva, N.; Rogers, D.; Östergren, K.; Timmermans, T.; et al. Recommendations and Guidelines for a Common European Food Waste Policy Framework; FUSIONS: Bologna, Italy, 2016. [Google Scholar] [CrossRef] [Green Version]
  14. Papargyropoulou, E.; Steinberger, J.K.; Wright, N.; Lozano, R.; Padfield, R.; Ujang, Z. Patterns and Causes of Food Waste in the Hospitality and Food Service Sector: Food Waste Prevention Insights from Malaysia. Sustainability 2019, 11, 6016. [Google Scholar] [CrossRef] [Green Version]
  15. Aamir, M.; Ahmad, R.; Javaid, Q.; Hasan, S.M. Waste Not, Want Not: A Case Study on Food Waste in Restaurants of Lahore, Pakistan. J. Food Prod. Mark. 2018, 24, 591–610. [Google Scholar] [CrossRef]
  16. Tostivint, C.; De Veron, S.; Jan, O.; Lanctuit, H.; Hutton, Z.V.; Loubière, M. Measuring food waste in a dairy supply chain in Pakistan. J. Clean. Prod. 2017, 145, 221–231. [Google Scholar] [CrossRef]
  17. Khalid, S.; Naseer, A.; Shahid, M.; Shah, G.M.; Ullah, M.I.; Waqar, A.; Abbas, T.; Imran, M.; Rehman, F. Assessment of nutritional loss with food waste and factors governing this waste at household level in Pakistan. J. Clean. Prod. 2018, 206, 1015–1024. [Google Scholar] [CrossRef]
  18. Akram, W.; Javed, I. Food wastage and implications for food safety with special reference to marriage ceremonies. Int. J. Agric. Ext. 2021, 9, 201–2015. [Google Scholar] [CrossRef]
  19. Xue, L.; Gang, L. Introduction to global food losses and food waste. In Saving Food; Academic Press: Cambridge, MA, USA, 2019; pp. 1–31. [Google Scholar]
  20. United Nations Environment Programme. Food Waste Index Report 2021; United Nations: Nairobi, Kenya, 2021. [Google Scholar]
  21. Dhir, A.; Talwar, S.; Kaur, P.; Malibari, A. Food waste in hospitality and food services: A systematic literature review and framework development approach. J. Clean. Prod. 2020, 270, 122861. [Google Scholar] [CrossRef]
  22. Lorenz, B.A.; Hartmann, M.; Hirsch, S.; Kanz, O.; Langen, N. Determinants of Plate Leftovers in One German Catering Company. Sustainability 2017, 9, 807. [Google Scholar] [CrossRef] [Green Version]
  23. Wang, L.; Xue, L.; Li, Y.; Liu, X.; Cheng, S.; Liu, G. Horeca food waste and its ecological footprint in Lhasa, Tibet, China. Resour. Conserv. Recycl. 2018, 136, 1–8. [Google Scholar] [CrossRef]
  24. Tostivint, C.; Östergren, K.; Quested, T.; Soethoudt, J.M.; Stenmarck, A.; Svanes, E.; O’Connor, C. Food Waste Quanti-Fication Manual to Monitor Food Waste Amounts and Progression; BIO by Deloitte: Paris, France, 2016. [Google Scholar]
  25. UNICEF Pakistan. National Nutrition Survey 2018—Key Findings Report; UNICEF: Lahore, Pakistan, 2018. [Google Scholar]
  26. Imteaz, A. Follow up on food waste quantification in Swedish public catering. Master’s Thesis, Swedish University of Agricultural Sciences, Uppsala, Sweden, 2022. [Google Scholar]
  27. Spring, C.A.; Biddulph, R. Capturing Waste or Capturing Innovation? Comparing Self-Organising Potentials of Surplus Food Redistribution Initiatives to Prevent Food Waste. Sustainability 2020, 12, 4252. [Google Scholar] [CrossRef]
  28. Eriksson, M.; Strid, I.; Hansson, P.A. Carbon footprint of food waste management options in the waste hierarchy–a Swedish case study. J. Clean. Prod. 2015, 93, 115–125. [Google Scholar] [CrossRef]
  29. Synani, K.; Abeliotis, K.; Terzis, E.; Manios, T.; Lasaridi, K. Life cycle Impacts of food waste: The case study of Hotels in Heraklion Crete. In Proceedings of the 8th International Conference on Sustainable Solid Waste Management, Thessaloniki, Greece, 23–25 June 2021. [Google Scholar]
  30. Garnida, Y.; Rudiansyah, M.; Yasin, G.; Mahmudiono, T.; Kadhim, A.J.; Sharma, S.; Hussein, H.A.; Shichiyakh, R.A.; Abdelbasset, W.K.; Iswanto, A.H. Investigation of parameters in restaurant food waste for use as poultry rations. Food Sci. Technol. 2022, 42, e118621. [Google Scholar] [CrossRef]
  31. Al-Arifi, S.N.; Al-Agha, R.M.; El-Nahhal, Z.Y. Environmental impact of landfill on groundwater, south east of Riyadh, Saudi Arabia. J. Nat. Sci. Res. 2013, 3, 222–242. [Google Scholar]
  32. World Resource Institute. Food Loss and Waste Accounting and Reporting Standard; World Resource Institute: Washington, DC, USA, 2016. [Google Scholar]
  33. World Resources Institute. Guidance on FLW Quantification Methods; World Resource Institute: Washington, DC, USA, 2016. [Google Scholar]
  34. Betz, A.; Buchli, J.; Göbel, C.; Müller, C. Food waste in the Swiss food service industry—Magnitude and potential for reduction. Waste Manag. 2015, 35, 218–226. [Google Scholar] [CrossRef]
  35. Barreiro, P.L.; Albandoz, J.P. Population and sample. Sampling techniques; Management Mathematics for European Schools; University of Seville: Seville, Spain, 2001; Volume 1, pp. 1–18. [Google Scholar]
  36. Quested, T.; Parry, A. New Estimates for Household Food and Drink Waste in the UK; Waste and Resources Action Programme (WRAP): Banbury, UK, 2011. [Google Scholar]
  37. Food Waste Reduction Alliance (FWRA). Analysis of U.S. Food Waste Among Food Manufacturers, Retailers, and Restaurants; Food Waste Reduction Alliance: Arlington, VA, USA, 2016. [Google Scholar]
  38. Papargyropoulou, E.; Wright, N.; Lozano, R.; Steinberger, J.; Padfield, R.; Ujang, Z. Conceptual framework for the study of food waste generation and prevention in the hospitality sector. Waste Manag. 2016, 49, 326–336. [Google Scholar] [CrossRef]
  39. Pirani, S.I.; Arafat, H. Reduction of food waste generation in the hospitality industry. J. Clean. Prod. 2016, 132, 129–145. [Google Scholar] [CrossRef]
  40. Pinto, R.S.; Melo, F.F.S.; Campos, S.S.; Cordovil, C.M.-D. A simple awareness campaign to promote food waste reduction in a University canteen. Waste Manag. 2018, 76, 28–38. [Google Scholar] [CrossRef]
  41. Falasconi, L.; Vittuari, M.; Politano, A.; Segrè, A. Food Waste in School Catering: An Italian Case Study. Sustainability 2015, 7, 14745–14760. [Google Scholar] [CrossRef] [Green Version]
  42. Monteiro, D.M.S.; Brockbank, C.; Heron, G. Food Waste in Event Catering: A Case Study in Higher Education. J. Food Prod. Mark. 2020, 26, 262–278. [Google Scholar] [CrossRef]
  43. Ozcicek-Dolekoglu, C.; Var, I. Analysis of food waste in university dining halls: A case study from Turkey. Fresenius Environ. Bull. 2019, 28, 156–166. [Google Scholar]
  44. Shanks, C.B.; Banna, J.; Serrano, E.L. Food Waste in the National School Lunch Program 1978-2015: A Systematic Review. J. Acad. Nutr. Diet. 2017, 117, 1792–1807. [Google Scholar] [CrossRef] [Green Version]
  45. Engström, R.; Carlsson-Kanyama, A. Food losses in food service institutions Examples from Sweden. Food Policy 2004, 29, 203–213. [Google Scholar] [CrossRef]
  46. Katajajuuri, J.M.; Silvennoinen, K.; Hartikainen, H.; Heikkilä, L.; Reinikainen, A. Food waste in the Finnish food chain. J. Clean. Prod. 2014, 73, 322–329. [Google Scholar] [CrossRef]
  47. Ferreira, M.; Martins, M.L.; Rocha, A. Food waste as an index of foodservice quality. Br. Food J. 2013, 115, 1628–1637. [Google Scholar] [CrossRef]
  48. Diaz-Ruiz, R.; Costa-Font, M.; López-I-Gelats, F.; Gil, J.M. A Sum of Incidentals or a Structural Problem? The True Nature of Food Waste in the Metropolitan Region of Barcelona. Sustainability 2018, 10, 3730. [Google Scholar] [CrossRef] [Green Version]
  49. El Bilali, H.; Ben Hassen, T. Food Waste in the Countries of the Gulf Cooperation Council: A Systematic Review. Foods 2018, 9, 463. [Google Scholar] [CrossRef] [Green Version]
  50. Filimonau, V.; Fidan, H.; Alexieva, I.; Dragoev, S.; Marinova, D.D. Restaurant food waste and the determinants of its effective management in Bulgaria: An exploratory case study of restaurants in Plovdiv. Tour. Manag. Perspect. 2019, 32, 100577. [Google Scholar] [CrossRef]
  51. Bharucha, J.P. Tackling the challenges of reducing and managing food waste in Mumbai restaurants. Br. Food J. 2018, 120, 639–649. [Google Scholar] [CrossRef]
  52. Principato, L.; Pratesi, C.A.; Secondi, L. Towards Zero Waste: An Exploratory Study on Restaurant managers. Int. J. Hosp. Manag. 2018, 74, 130–137. [Google Scholar] [CrossRef]
  53. Crippa, M.; Solazzo, E.; Guizzardi, D.; Tubiello, F.N.; Leip, A. Food systems are responsible for a third of global anthro-pogenic GHG emissions. Nat. Food 2021, 2, 198–209. [Google Scholar] [CrossRef]
  54. Cattaneo, A.; Federighi, G.; Vaz, S. The environmental impact of reducing food loss and waste: A critical assessment. Food Policy 2021, 98, 101890. [Google Scholar] [CrossRef]
  55. Naikoo, M.N.; Kumar, S.; Iqbal, Z. Assessing the current food waste minimization practices adopted in Hotels. Ecol. Environ. Conserv. 2021, 27, 1399–1406. [Google Scholar]
  56. Berkowitz, S.; Marquart, L.; Mykerezi, E.; Degeneffe, D.; Reicks, M. Reduced-portion entrées in a worksite and restaurant setting: Impact on food consumption and waste. Public Health Nutr. 2016, 19, 3048–3054. [Google Scholar] [CrossRef] [Green Version]
  57. Eriksson, M.; Osowski, C.P.; Malefors, C.; Björkman, J.; Eriksson, E. Quantification of food waste in public catering services–A case study from a Swedish municipality. Waste Manag. 2017, 61, 415–422. [Google Scholar] [CrossRef]
  58. Evans, D. Blaming the consumer—once again: The social and material contexts of everyday food waste practices in some English households. Crit. Public Health 2011, 21, 429–440. [Google Scholar] [CrossRef]
  59. Shove, E. Beyond the ABC: Climate Change Policy and Theories of Social Change. Environ. Plan. A Econ. Space 2010, 42, 1273–1285. [Google Scholar] [CrossRef] [Green Version]
  60. Mourad, M. Recycling, recovering and preventing “food waste”: Competing solutions for food systems sustainability in the United States and France. J. Clean. Prod. 2016, 126, 461–477. [Google Scholar] [CrossRef] [Green Version]
  61. Midgley, J.L. The logics of surplus food redistribution. J. Environ. Plan. Manag. 2018, 57, 1872–1892. [Google Scholar] [CrossRef]
  62. Schneider, F. The evolution of food donation with respect to waste prevention. Waste Manag. 2013, 33, 755–763. [Google Scholar] [CrossRef] [PubMed]
  63. Maniates, M.F. Individualization: Plant a Tree, Buy a Bike, Save the World? Glob. Environ. Polit. 2001, 1, 31–52. [Google Scholar] [CrossRef]
  64. Warshawsky, D.N. The devolution of urban food waste governance: Case study of food rescue in Los Angeles. Cities 2015, 49, 26–34. [Google Scholar] [CrossRef]
  65. Collins, P.A.; Power, E.M.; Little, M.H. Municipal-level responses to household food insecurity in Canada: A call for critical, evaluative research. Can. J. Public Health 2014, 105, e138–e141. [Google Scholar] [CrossRef]
  66. International Trade Administration. Pakistan—Waste Management. International Trade Administration. 2021; Retrieved 15 September 2021. Available online: https://www.trade.gov/country-commercial-guides/pakistan-waste-management (accessed on 15 September 2021).
  67. Lahore Waste Management Company. Municipal Solid Waste Characteristics Study; Lahore Waste Management Company: Lahore, Pakistan, 2014. [Google Scholar]
  68. EPA. Call to Action by Stakeholders: United States Food Loss & Waste 2030 Reduction Goal. 2021. Available online: https://www.epa.gov/sustainable-management-food/call-action-stakeholders-united-states-food-loss-waste-2030-reduction (accessed on 15 September 2021).
Figure 1. Scatter plot of average waste (g) per customer per day vs. the number of customers per day.
Sustainability 14 06914 g001
Figure 2. Scatter plot of average percentage waste (%) vs. mass of procured items (kg).
Sustainability 14 06914 g002
Figure 3. Sources of food waste in the hospitality sector of Lahore, Pakistan.
Sustainability 14 06914 g003
Figure 4. Reasons for not tracking food waste.
Sustainability 14 06914 g004
Figure 5. Reasons for not donating food.
Sustainability 14 06914 g005
Figure 6. Recycling constraints faced by the hospitality sector.
Sustainability 14 06914 g006
Table 1. Waste per customer per day amount (g) for restaurants as calculated both through surveys and live tracking.
Waste Per Customer/Day (g)
SectorKitchen (n)Amount
of Waste (kg)
No. of Customer No. of
Days
Mean Waste per
Customer (g)
Waste per
Customer (g)
95% Confidence Interval—Lower95% Confidence Interval—Higher
Surveys
Restaurants32392.255730-687953.682.4
Hotels102852070-147.7138.4102.0193.3
Caterers11---140.914092.1189.7
Live Tracking
Restaurants4321.84384287473.468.679.4
Table 2. Waste per customer per day amount (g) for restaurants as calculated both through surveys and live tracking.
Waste Per Customer/Day (g)
SectorKitchen (n)Number of DaysItems Procured (kg)Amount of WasteMean Percentage (%)Percentage Waste (%)95% Confidence Interval—Lower95% Confidence Interval—Higher
Surveys
Restaurants7-811156.517.71514.021.5
Live Tracking
Restaurants321150325622.817.0416.828.7
Publisher’s Note: MDPI stays neutral with regard to jurisdictional claims in published maps and institutional affiliations.

