Article

Agricultural Insurance in the DOCG Area of Conegliano—Valdobbiadene: An Assessment of Policy Measures

by
Antonio De Pin
1,
Pier Paolo Miglietta
2,*,
Benedetta Coluccia
3 and
Fabian Capitanio
4
1
Department of Economics, Ca’ Foscari University of Venice, San Giobbe 873, Cannaregio, 30121 Venice, Italy
2
Department of Biological and Environmental Sciences and Technologies, University of Salento, Via per Monteroni, 73100 Lecce, Italy
3
Department of Veterinary and Medical Sciences, University of Bologna, Via Tolara di Sopra 50, 40064 Ozzano dell’Emilia, Italy
4
Department of Veterinary Medicine and Animal Production, University of Naples Federico II, Via Università 96, 80055 Portici, Italy
*
Author to whom correspondence should be addressed.
Sustainability 2022, 14(11), 6912; https://doi.org/10.3390/su14116912
Submission received: 31 January 2022 / Revised: 28 May 2022 / Accepted: 30 May 2022 / Published: 6 June 2022
(This article belongs to the Special Issue Assessing Crop Yield and Risk for Sustainability)

Abstract

:
Agricultural insurance stands prominant in the protection of crop products. In Italy, the increasing occurrence of extreme weather events has had an important impact on the crop insurance market’s dynamics by lowering insurance companies propensity to take on climate risks. In this context, the main aim of the study is to focus on an economic assessment of the demand for insurance in the Controlled and Guaranteed Designation of Origin (DOCG) area of Conegliano-Valdobbiadene, exploiting the economic effects of public contributions for the three main subjects involved in the market: winegrowers, public stakeholders, and insurance companies. The results showed that the more favorable conditions laid down in the Omnibus Regulation in favor of producers do not appear justified in the area investigated. As regards the goodness of public intervention, the overall positivity of the Indicator Efficiency Subsidies (IES) underlines the relative efficiency of the subsidized contribution. As for the insurance companies, the financial equilibrium appears precarious, closed between falling tariffs and increasing quotas in consideration of the feared climate change.

1. Introduction

It is widely accepted that the changes in temperature, rainfall patterns, sea water level and concentration of CO2 in the atmosphere have a significant impact on agricultural production, affecting both the quantity and quality of products [1].
In Europe, extreme climatic conditions have resulted, among other, in a progressive fall in wine production and a reduction in wheat protein content over the last years [2,3].
Therefore, adaptation measures can be considered necessary to sustain agricultural productivity, to reduce vulnerability, and to enhance the resilience of the agricultural systems to climate change. Risk management is currently considered one of the main policies aimed at fostering farmers’ revenue stabilization and counteracting price volatility and income instability [4,5,6]. With the phasing out of guarantees provided to European farmers by the CAP in terms of stabilizing the markets, the issue of risk management tools is gradually acquiring an ever more important role, which is reflected in a series of innovations that first appeared in the 2009 ‘Health Check’ and successively in the regulation for rural development policy 2014–2020 [7]. With the changes introduced by Regulation 1305/2013 regarding rural development for the period 2014–2020, a toolkit was foreesen which aimed at supporting risk management in agriculture. The mid-term review of the CAP with the Omnibus regulation (UE) 2017/2393 places attention on the risk management toolkit, increasing public support to assist with payment of up to 70% of the policy and reducing from 30 to 20% the threshold of damage for compensation for both crop insurance and the Sectoral Income Stabilization Tool.
In Italy, the increasing probability of natural disasters has had an important impact on the insurance market’s dynamics [8,9,10,11]. In particular, there is a lower propensity of insurance companies to take on climate risks in their policies, which require higher costs and have increasingly restrictive contractual conditions [12,13]. Despite public support, such conditions often make insurance coverage incompatible with the spending capacity of farms.
The debate on appropriate risk management in agriculture highlights varied research interests, including the need to investigate the real convenience of the adopting some tools. Indeed, according to Capitanio and De Pin (2018), a sizable portion of farmers producing high-quality products is uninsured. The ongoing reform of the CAP 2023–2027 is further reinforcing risk management measures, increasingly identified as potentially suitable for the resolution of long-standing income problems on farms [14].
From a theoretical point of view, the American literature is mainly focused on identifying the causes of agricultural insurance market imperfections [15,16]. However, European studies focus on the dynamics of countries where public intervention on insurance and mutuality is very present such as Italy, Spain, France and the Scandinavian area [13]. In Italy, because of a weaker public intervention than in other economies, many studies have focused on identifying the main factors of the agricultural insurance demand [17]. However, there is no evidence of studies that have investigated the conditions in which harvest insurance can be seen as profitable by stakeholders.
In light of this, the main aim of the study is to provide an economic assessment of the demand for insurance in the Controlled and Guaranteed Designation of Origin (DOCG) area of Conegliano-Valdobbiadene, exploiting the economic effects of public contributions for the three main subjects involved in the market: winegrowers, public stakeholders, and insurance companies. Specifically, attention was focused on the identification of the operational and legal conditions in which harvest insurance can be seen as profitable by stakeholders. The utilization of municipal data identifies operational and legal factors that allow for a wider variety of winegrowers to obtain grape insurance. The study’s findings can be used to advise on policy measures in the future.

2. Background

Within the European context, Italy is the main activator of resources for risk management, with a planned expenditure of 1.64 billion euro for the time period 2014–2020, over 60% of the total in Europe [18,19].
In Italy, the risk management legislation culminated with the legislative decree 102/2004, which gives cooperatives the opportunity to stipulate insurance contracts, as Defense Consortiums of producers. The Defense Consortia are legal entities under private law, consisting of agricultural entrepreneurs for the implementation of active and passive initiatives (insurance) of production (Legislative Decree no. 32/2018).
The role of Consortia is manifold, and is the basis of the whole agricultural insurance system in Italy. It contracts the best conditions with insurance companies, promoting new insurance products; advances companies’ insurance premiums for all members; offers an expert consultant in the damage settlement phase; guarantees the appropriate public aid [18]. In Italy there are 62 Defense Consortia, regulated by the yearly Agricultural Risk Management Plan, for which the Ministry for agricultural policies is responsible. The most important points contained in the Plan concern the types of subsidized policies, the insurable adversities, the guaranteed prices for the computing of premium, and the rates to which to refer to determine public aid. All these variables are involved in the quantification of the insurance premiums. Insurance coverage protects the lack of quantitative-qualitative yield. Three options are provided to compute qualitative damage (A-B-C), with specific compensation coefficients as a function of a percentage of the damage. Multiple combinations of policies are allowed, from those covering all adversities (A-Global Policy); catastrophic adversities and at least one of frequency (B); three adversities to be chosen from those of frequency and accessory (C); all catastrophic adversities (D); with two guarantees (E). The obligation is to insure the entire grape production of winegrowers within each municipality. Therefore, to give rise to compensation, the damage must be to at least 20% of the entire municipal production. The public contribution asks for specific requirements: the qualification of active agricultural entrepreneur; registration in the Chamber of Commerce; possession of a VAT number; the updating of the company files; the drafting of the Individual Insurance Plan (PAI) or, if not yet available, the preliminary Expression of interest.
With regard to DOCG and DOC grapes, the guarantee begins when the buds sprout, while the specific tables applicable for the settlement of quality damage may vary among insurance companies, also depending on the period guaranteed.
The offer of insurance companies is somewhat varied, characterized by a multiplicity of variables, and the pay-offs of the different policies must be carefully evaluated by the winegrowers in order to make an informed choice based on the expected returns. The main variables to consider when entering into the insurance contract are: price, minimum damage threshold, deductible, the indemnity limit, percentage excess, start date and end of coverage, and how the damage to quality is calculated.

3. Materials and Methods
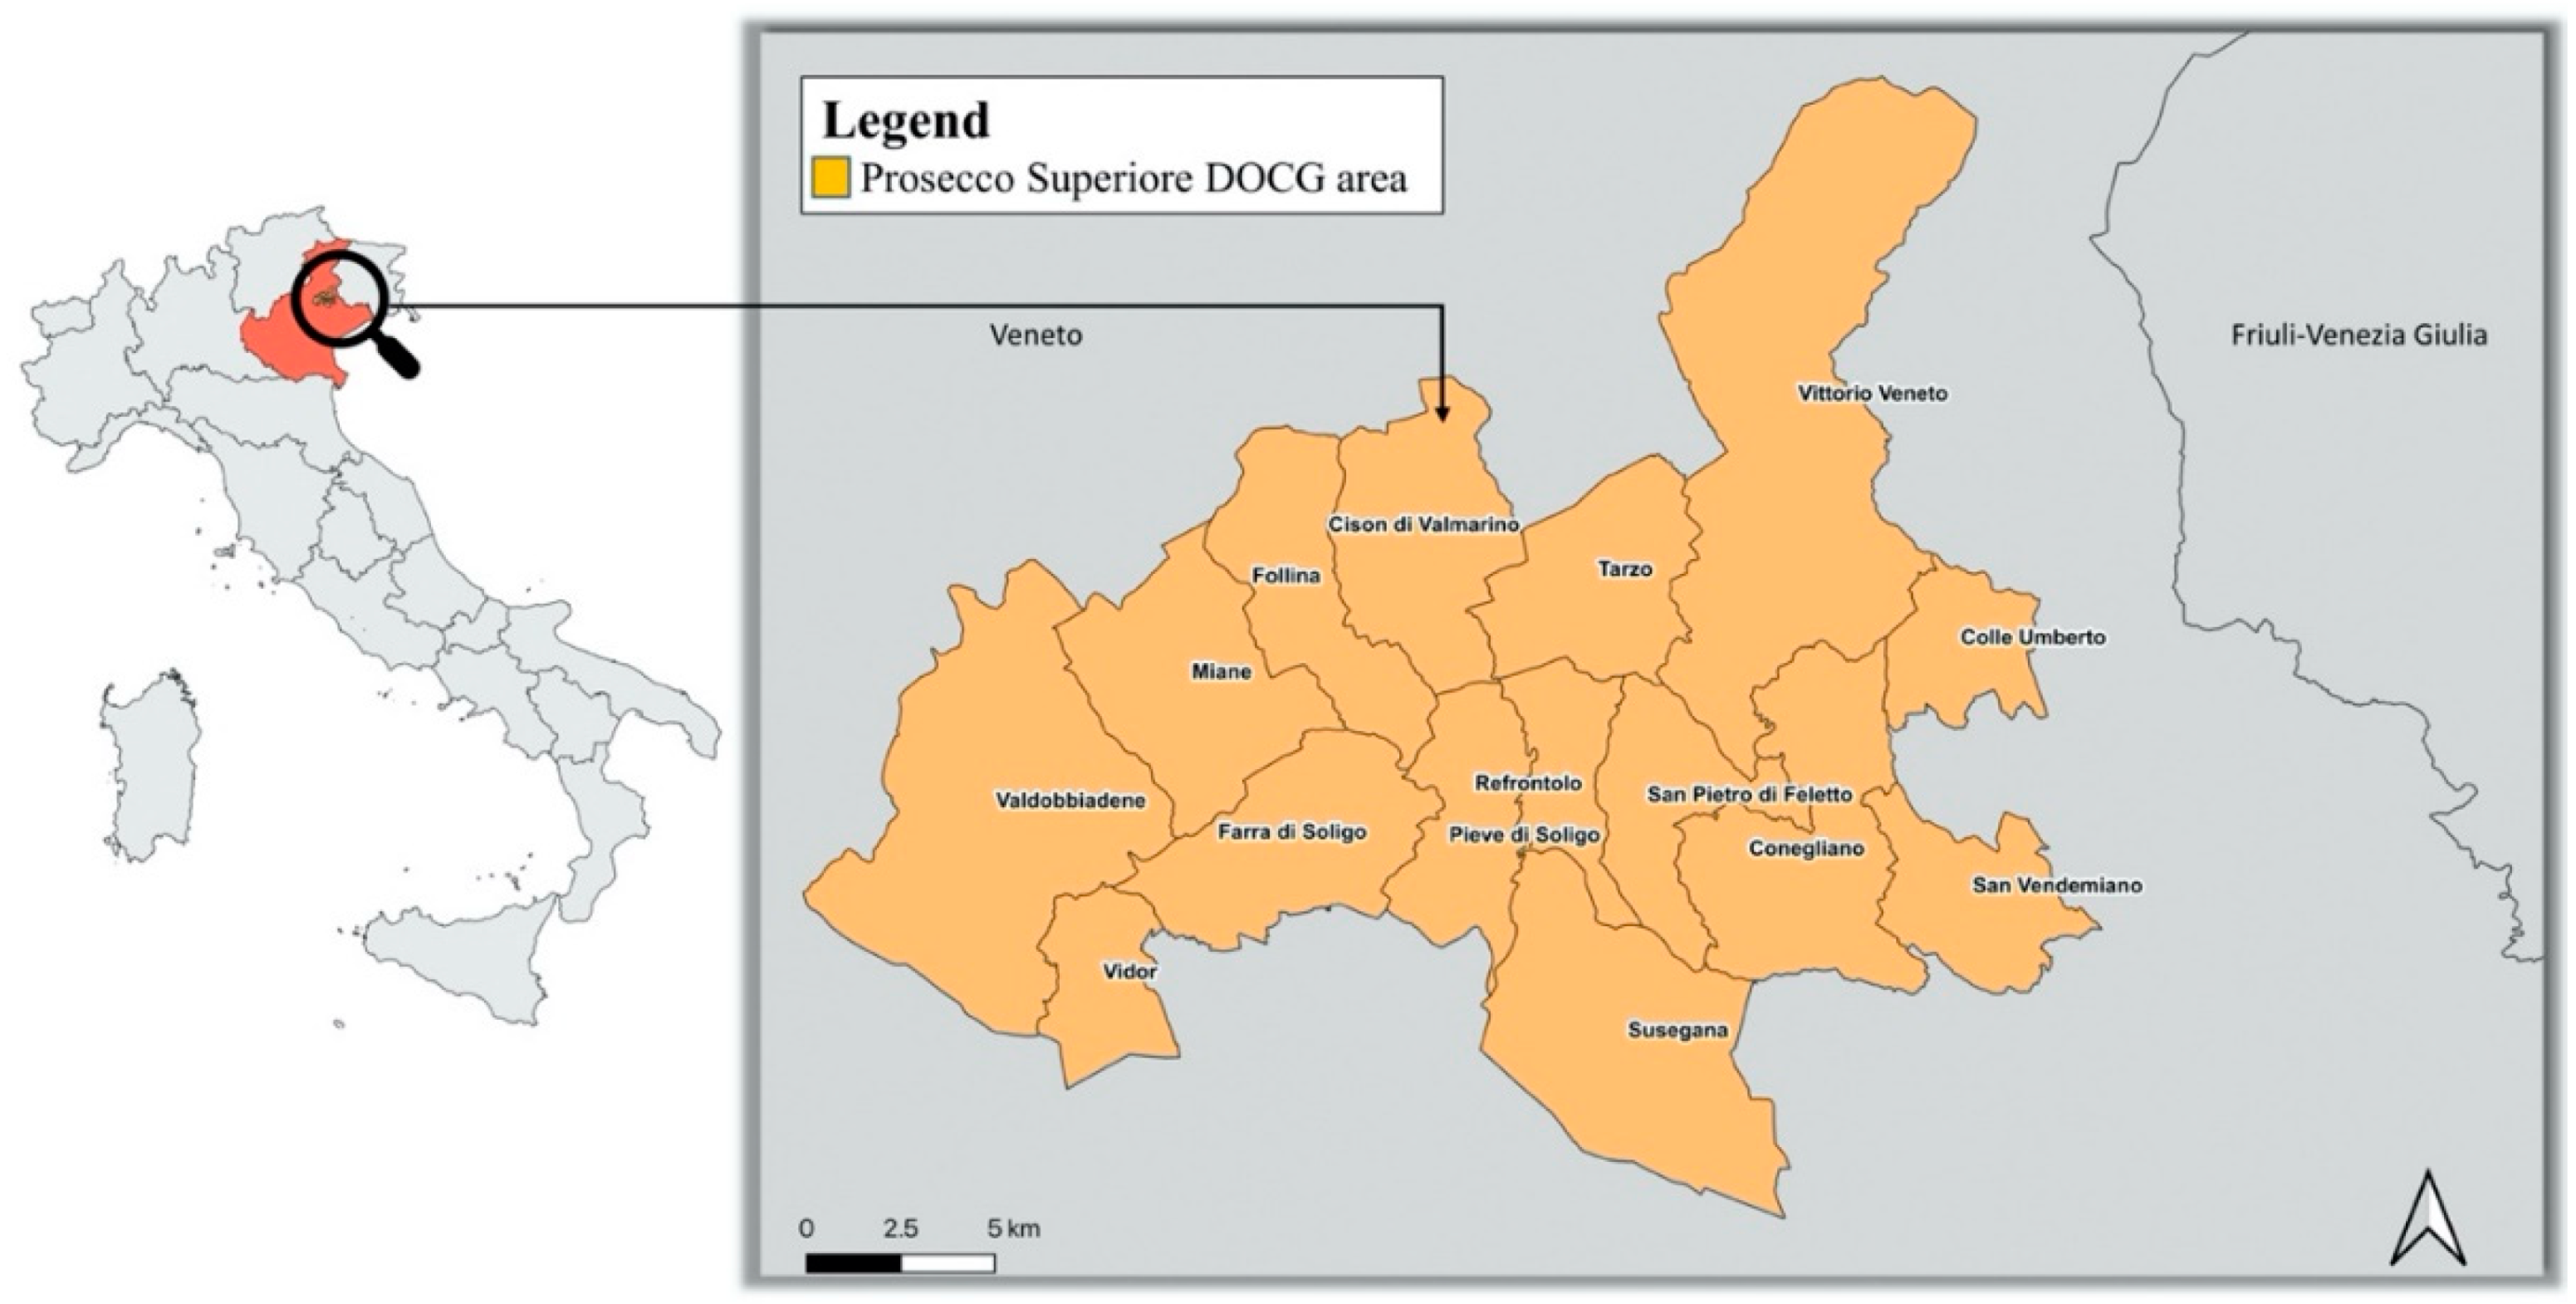
3.1. Area of Study

The analysis was carried out in the production area of the Controlled and Guaranteed Origin Denomination (DOCG) Conegliano-Valdobbiadene, in the province of Treviso, in North-Eastern Italy (Figure 1). In particular, the study selected microdata related to the fifteen municipalities included in the DOCG area, situated in the hilly country between Vittorio Veneto and Valdobbiadene.
The territory boasts a well-known winegrowing and wine producing tradition all over the world [18]. In 2017, there were 9648 hectares for vines and 4582 winegrowers, for a production amounting to 677,000 hectoliters of DOCG Prosecco Superiore, a sparkling wine obtained from the “Glera” cultivar. The total production is more than 90 million bottles, for a value of almost 500 million euro. Its success on the market is partlz linked to a significant growth in exports, a yearly growth of 10%, reaching 40 million bottles, with a value of nearly 190-million-euro. The most important markets are Germany, Switzerland, the United Kingdom and the USA. Moreover, the analyzed area is one of the most important wine tourism districts in Italy. In fact, in 2019, the World Heritage Committee included the “Prosecco Hills of Conegliano and Valdobbiadene” in the UNESCO World Heritage List. The Prosecco district obtained the DOCG with the Ministerial Decree of 17 July 2009. The sparkling wine is called “Prosecco Superiore”, 274 hectares are reserved exclusively for the production of the “Rive” denomination, while the top-of-the-range is “Superiore di Cartizze”.

3.2. Data Sourcing

In order to achieve the aim of this study, annual data covering the time period 2014–2017 were extracted from CondifesaTVB, which is a non-profit consortium of agricultural entrepreneurs operating in the DOCG area, dealing with the climate risk management by stipulating collective policies with the major insurance companies. The analysis was carried out during the period of validity of the reg. 1305/2013, in which wine insurance provided for a maximum public contribution of 65% of the premium and losses exceeding 30% of the farmer’s average yearly production. The extracted data were aggregated to the municipal level and variables such quantity insured, price, surface area, premium paid, insured value, insurance premium, compensations paid, and insured farmers were highlighted. The remainder of the extensive data on the vine economy in the region is the result of personal elaborations carried out through the statistic information collected from Prosecco Protection Consortium, Veneto Agency for Payments in Agriculture (AVEPA), and Italian Institute of Statistics (ISTAT).

3.3. Methodology

When analyzing the wine grape production process, the total loss value for a winegrower in a given time-period can be calculated as follows (Equation (1)):
t = 1 n V L t ( d t ) = t = 1 n [ V D t + P R t R t ( d t ) ]
where t represents the analyzed years, V L t is the total loss value; d t is the damage rate, V D t is the damage value, P R t is the policy premium and R t ( d t ) represents the value of the indemnification, as referred to year t.
From this, the indemnification function can be expressed as in Equation (2):
R ( d ) = { 0   i f   d q I V × d I V × d r = I V × ( d d r )   i f   d > q
where q is the threshold of damage qualification; I V is the insured value; d r is the deductible rate, with d r < t .
Moreover, in subsidized insurance the presence of exemption and minimum damage threshold, expressed as percentage of the insured value, have to be considered. The indemnity assumes positive values only if the damage is greater than the threshold. The presence of the minimum damage threshold affects the cost-effectiveness parameters, both for the winegrower and the insurance company.
A predictable damage function can be used for an ex-ante evaluation of subsidized insurance programs. In this case the total loss value can be expressed as follows (Equation (3)):
E [ V L ( d ) ] = E [ V D ] + E [ P R ] E [ R ( d ) ]
where E [ V L ( d ) ] is the expected loss value; E [ V D ] is the expected damage value; E [ P R ] is the expected policy premium value and E [ R ( d ) ] is the expected compensation value.
The expected benefit for the winegrower [ E ( B ) ] is equal to the received indemnities, minus the paid premium, apart from the public aid:
E ( B ) = E ( R ) E ( P R   A i ) = E ( R ) + E ( A i ) E ( P R ) = E ( R ) + E ( P R ) * ( a 1 )
where A i is the public aid to the premium, equivalent to P R * a , where a: aid rate.
The public aid ( A i ) is detracted from the tariff gross rate ( T ) to identify the winegrower’s expense, which represents the tariff net rate ( T n ) .
P R n = P R A i = I V * T n
where P R n is the net premium paid by the winegrower.
A i = P R P R n = P R I V * T n
The winegrower’s best option is the one which maximizes the expected benefit [ E ( B ) ] .
Assuming standard market conditions, with premiums based on actuarial rates, their expected value should correspond to that of the expected indemnities.
E ( P R ) = E ( R ) E ( B ) = E ( R ) E ( P R ) + E ( A i ) = E ( A i )
Under this hypothesis, the expected benefit will be equivalent to the premium aid ( A i ).
In the present analysis we do not consider the elements linked to the different risk aversion profiles in the different typologies of local agricultural businesses, which can clearly influence the willingness to pay for the insurance instrument [20].
At the same time, we do not include in the analysis all the information about the structural equipment and the cultural/income diversification of businesses in the considered area, which, like risk aversion, can considerably influence the willingness to buy an agricultural insurance policy.
Thus, only the link between the value of the requested premiums for policy subscription and climate risks is to be considered. This simplification is quite acceptable when considering the current pay-off of the insurance policies offered by the market until now. This pay-off is based on the damage to the produced quantity, caused by adverse meteorological evolution.
In the case that the public contribution overestimates the benefits offered to producers, the expected benefit decreases, as: E ( R ) E ( P R ) < 0 , thus E ( B ) < E ( A i ) .
This situation results in a decrease of the loss ratio indicator ( P / P R ), which will benefit insurance companies, whose aim is to maximize the contribution margin of the policies.
A loss ratio indicator which is lower than 1 means that part of the aid is transferred to the insurance companies ( P R R > 0 ). If P R R = A i ; then the whole aid is transferred to the insurance system, that is ( P R R ) / A i = 1 .
A further research query concerns the exploration of the reliability of the sectorial public intervention, which refers to the ability of the measures to translate into specific benefits for producers. This concept, referred-to as the efficiency of the public action, does not rely on the maximization of the contributions to producers, as much as the attachment to the idea that the subsidized regime aims at spreading insurance. On the other hand, the elements referring to the public costs must be included in the evaluation. The requirement of their minimization implies that it should not become an undue advantage.
An original and simplified indicator of efficiency of subsidies is proposed for the evaluation of this aspect.
The index is ( I E S = ( R A i ) / A i ) . This has positive values in the presence of indemnities greater than aids, whereas, without reimbursements, its value is −1.
The indicator of efficiency, varying each year, can be suited for a limited area, or an individual section. However, it could be more stable in a multi-section analysis, or a multi-year one, as proposed in this research.
Positive index values indicate the ability of the public subsidy to exert the desired effects of the improved agrarian policy measures. On the contrary, negative values, especially when verified in a suitable period, lead us to consider a possible inefficiency of the agricultural expenditure, unable to result in real advantages for the farmer. This has a greater momentum in the insurance field, where the effects of the public action are influenced by the uncertainty of joint events.

4. Results

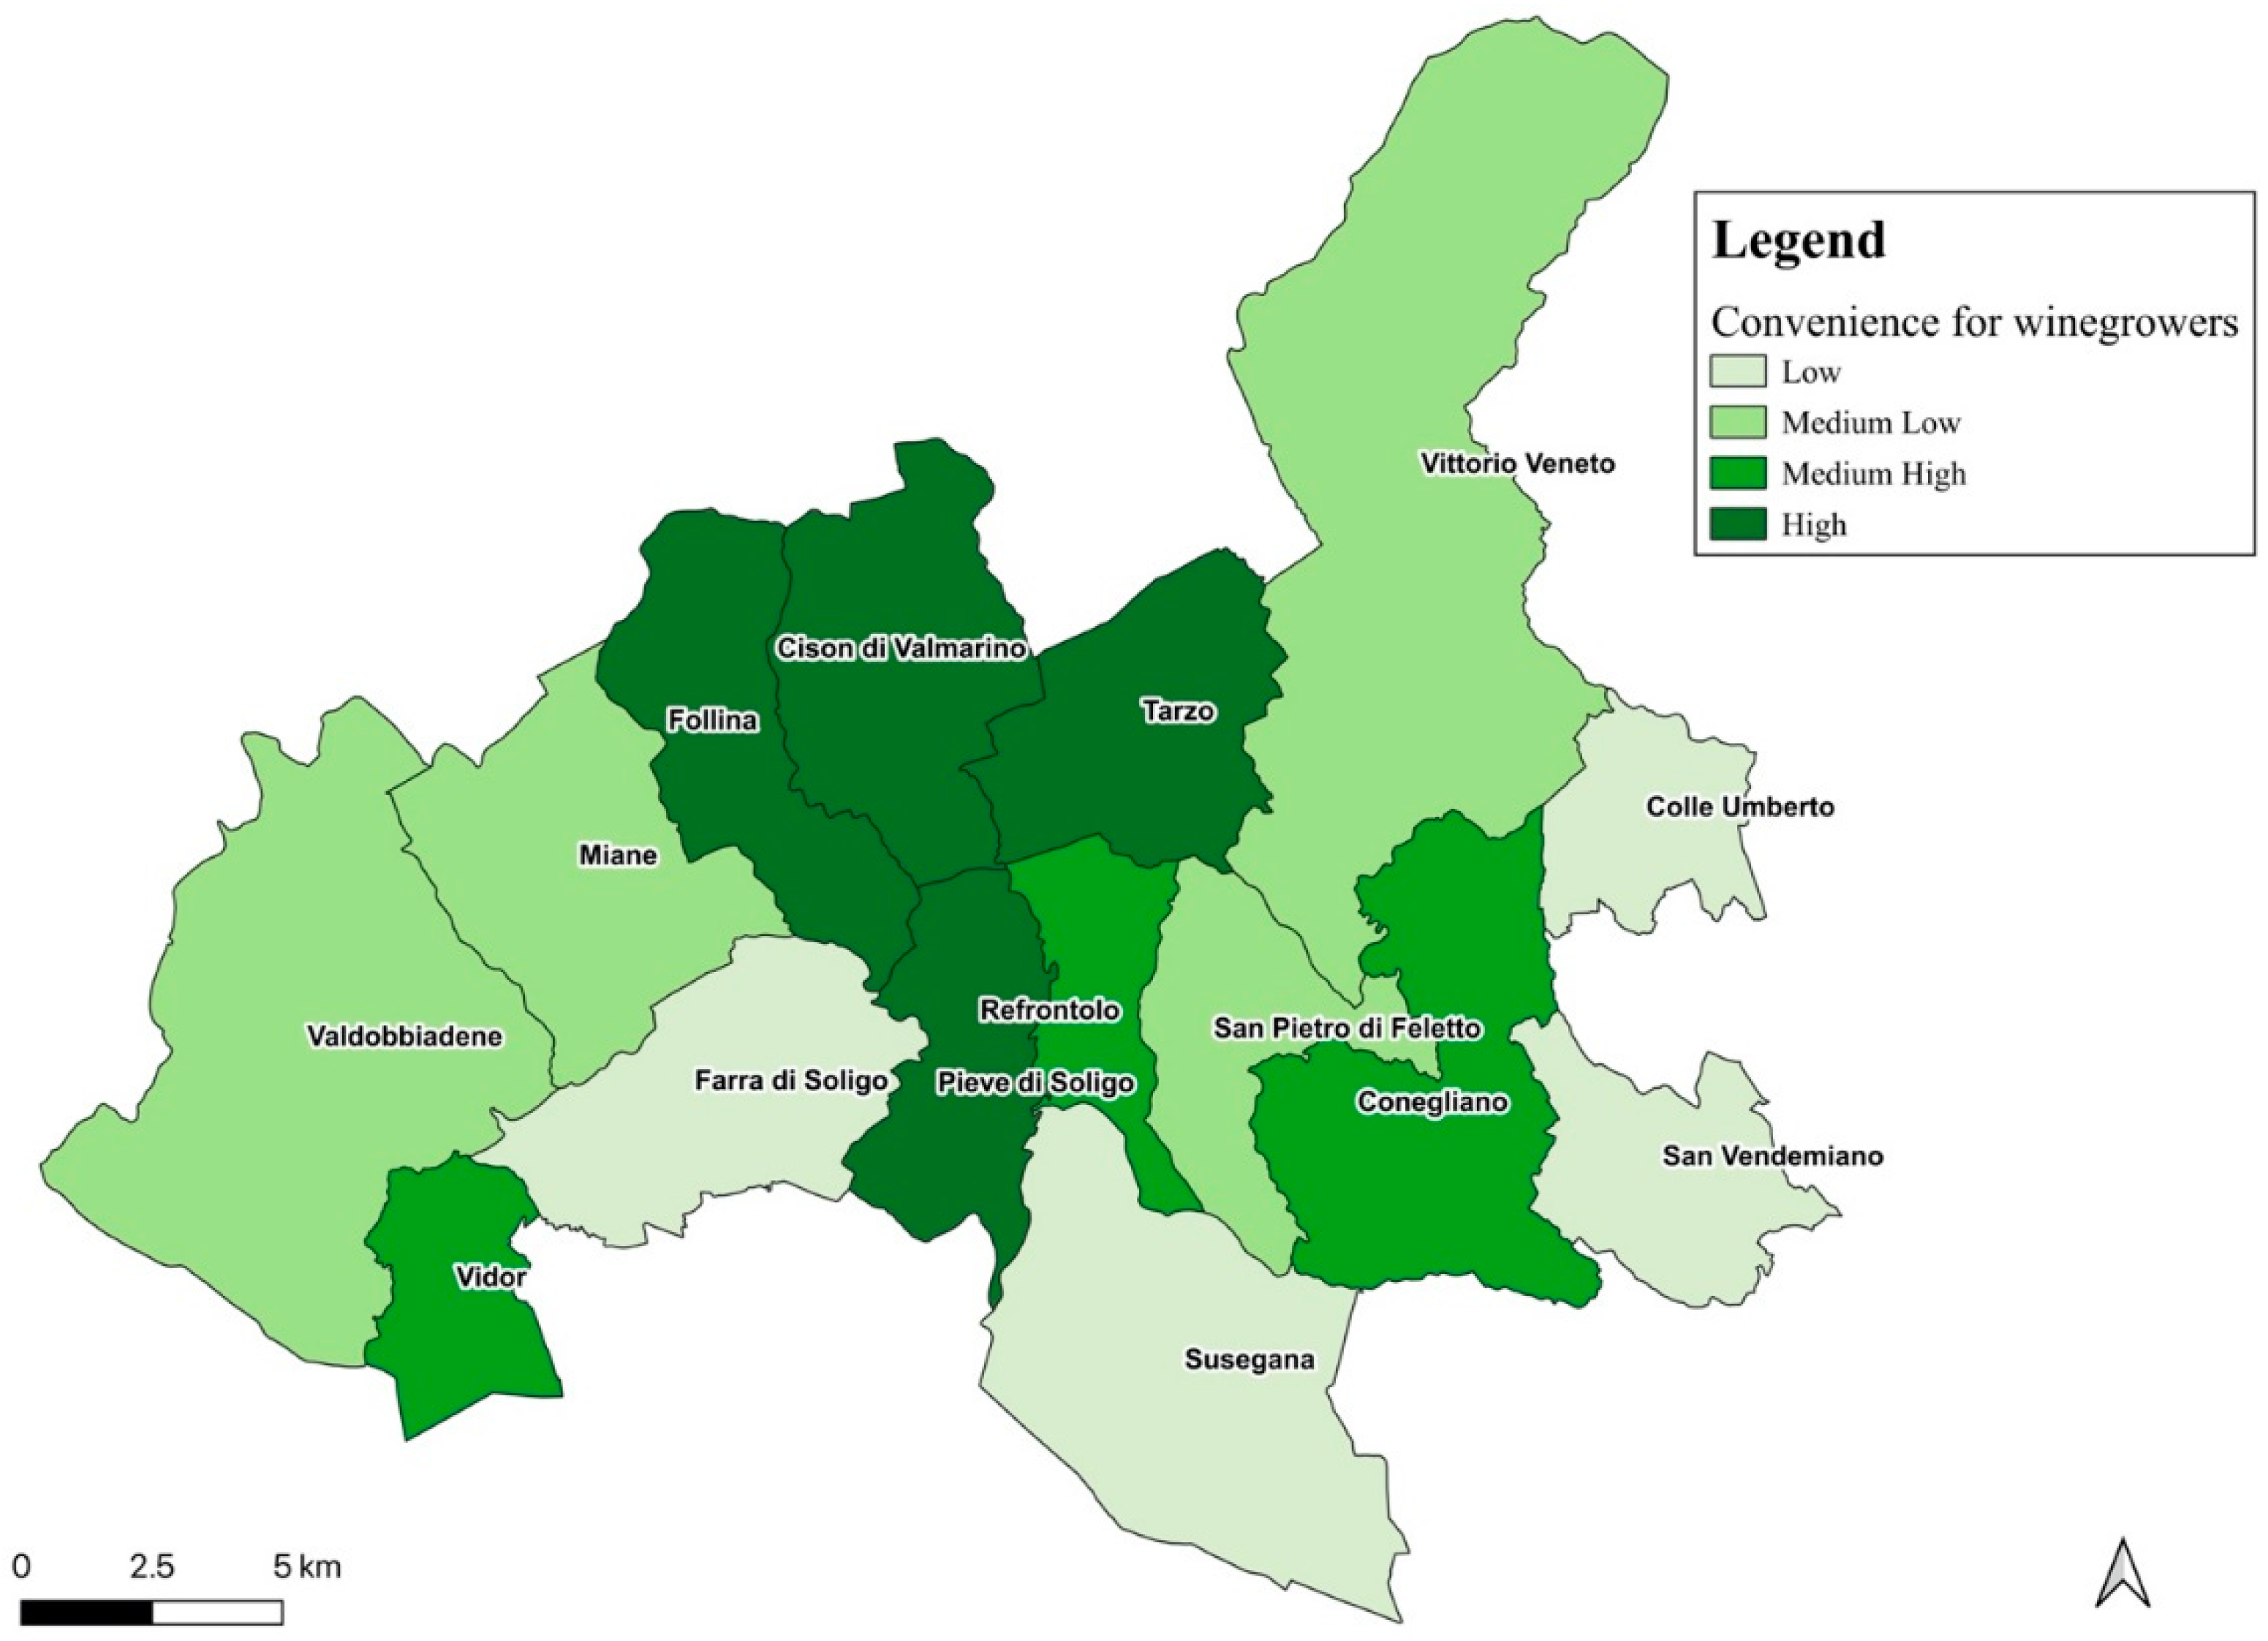
4.1. The Convenience for Winegrowers

The analysis allows for the assessment of the winegrowers’ cost-effectiveness deriving from the specific regulatory measures. The latter aim at incentivizing the winegrowers to adhere to current insurance programs, based on the climatic risks occurred, considering the actual policy pay-offs. The winegrowers’ benefit is equal to the allowances received, less the premium paid, net of the subsidy [21]. For this purpose, the public contribution is deducted from the insurance premium paid, obtaining the real cost paid by the winegrowers (Table 1).
The empirical evidence, even considering the limits due to the short period of time analyzed, highlights a high cost-effectiveness for the winegrowers operating within the DOCG area.
The aggregated results for the period 2014–2017, show compensations for about 17 million euro, while total costs of about 9 million euros, leading to a positive balance of about 8 million euro. In terms of overall profit, a rate of 91.5% is observed, while the compensation/cost ratios amount to 1.91 and 2.72, considering, respectively, the total costs and the costs referred to the premium paid by the winegrowers. These results show that indemnities represent more than incurred costs and demonstrate that it is very convenient for winegrowers to take out subsidized insurance. Against an average annual cost of 2,257,000 euro, compensation reaches 4,322,000 euro, for a positive result of 2,065,000 euro. Naturally, the temporal trend appears differentiated. However, 2015 alone shows a negative difference between revenues and costs, equal to 1,588,000 euro, and 2016 too, although showing a smaller amount of compensation, highlights a positive balance (63,000 euro). Moreover, the years 2014 and especially 2017, which were marked by negative adversities, show positive balances of 2,137,000 euro and 7,647,000 euro. Only in one case out of four (2015), is the profit rate negative (−78.7%), where the compensation/cost ratio is only 0.21, but reaches 3.66 in 2017 and 1.98 in 2014.
These elements, compared only to the premium paid by the winegrowers, further highlight the convenience of the insurance. In fact, compared to a total ratio of 2.72, it reaches 4.94 in 2017 and 2.87 in 2014. In perspective, these data confirm the convenience of taking out insurance cover, in which the contribution of cash flows must be considered.
The ratio between compensation and insured value reaches a total of 9.3%, but peaks at 18.2 in 2017 and 10.4 in 2014, highlighting how the use of insurance coverage cannot be considered the only risk management system by the winemakers. Within the period, all the variables considered increased, so total premiums grew by 8.3%, while the supplementary component rose by 7.7%. The share borne by the winemaker increased by 41.3%, so the average cost grew by 31.4%.
The evolution of the claims translates the profitability of the insurance action, with the indemnities raised by 143.4%, for a margin elevated to 257%. These figures can be interpreted from a financial point of view, highlighting the goodness of the investment in insurance. Therefore, the use of one euro by the winegrower translates into a total return of 2.72 euros, and in three out of four vintages into a refund higher than the combined unit. This unequivocally attests to the convenience for winegrowers to make use of the facilitated insurance instrument when the opportunity arises.
The analysis at the municipal level shows a profit rate greater than 200% for three municipalities (Cison di Valmarino, Pieve di Soligo, and Tarzo). For five municipalities it registers values over 100% and reaches 190.8% in Follina. Only two municipalities San Vendemiano and Susegana register a negative profit rate of, respectively, −10.4% and −14%. In absolute terms, Conegliano and Vittorio Veneto municipalities alone, account for 46% of the total profit; when also considering Pieve di Soligo and Refrontolo, it reaches 70%. The compensation/cost ratio reaches the highest values in Cison di Valmarino (3.91) and in Pieve di Soligo (3.72), while in Farra compensations are equal to costs and only in San Vendemiano and Susegana does the ratio assume values lower than 1.00 (Figure 2). No municipality registers values of the ratio lower than 1.0 when considering as a denominator the costs referred to the premium paid by the winegrowers.

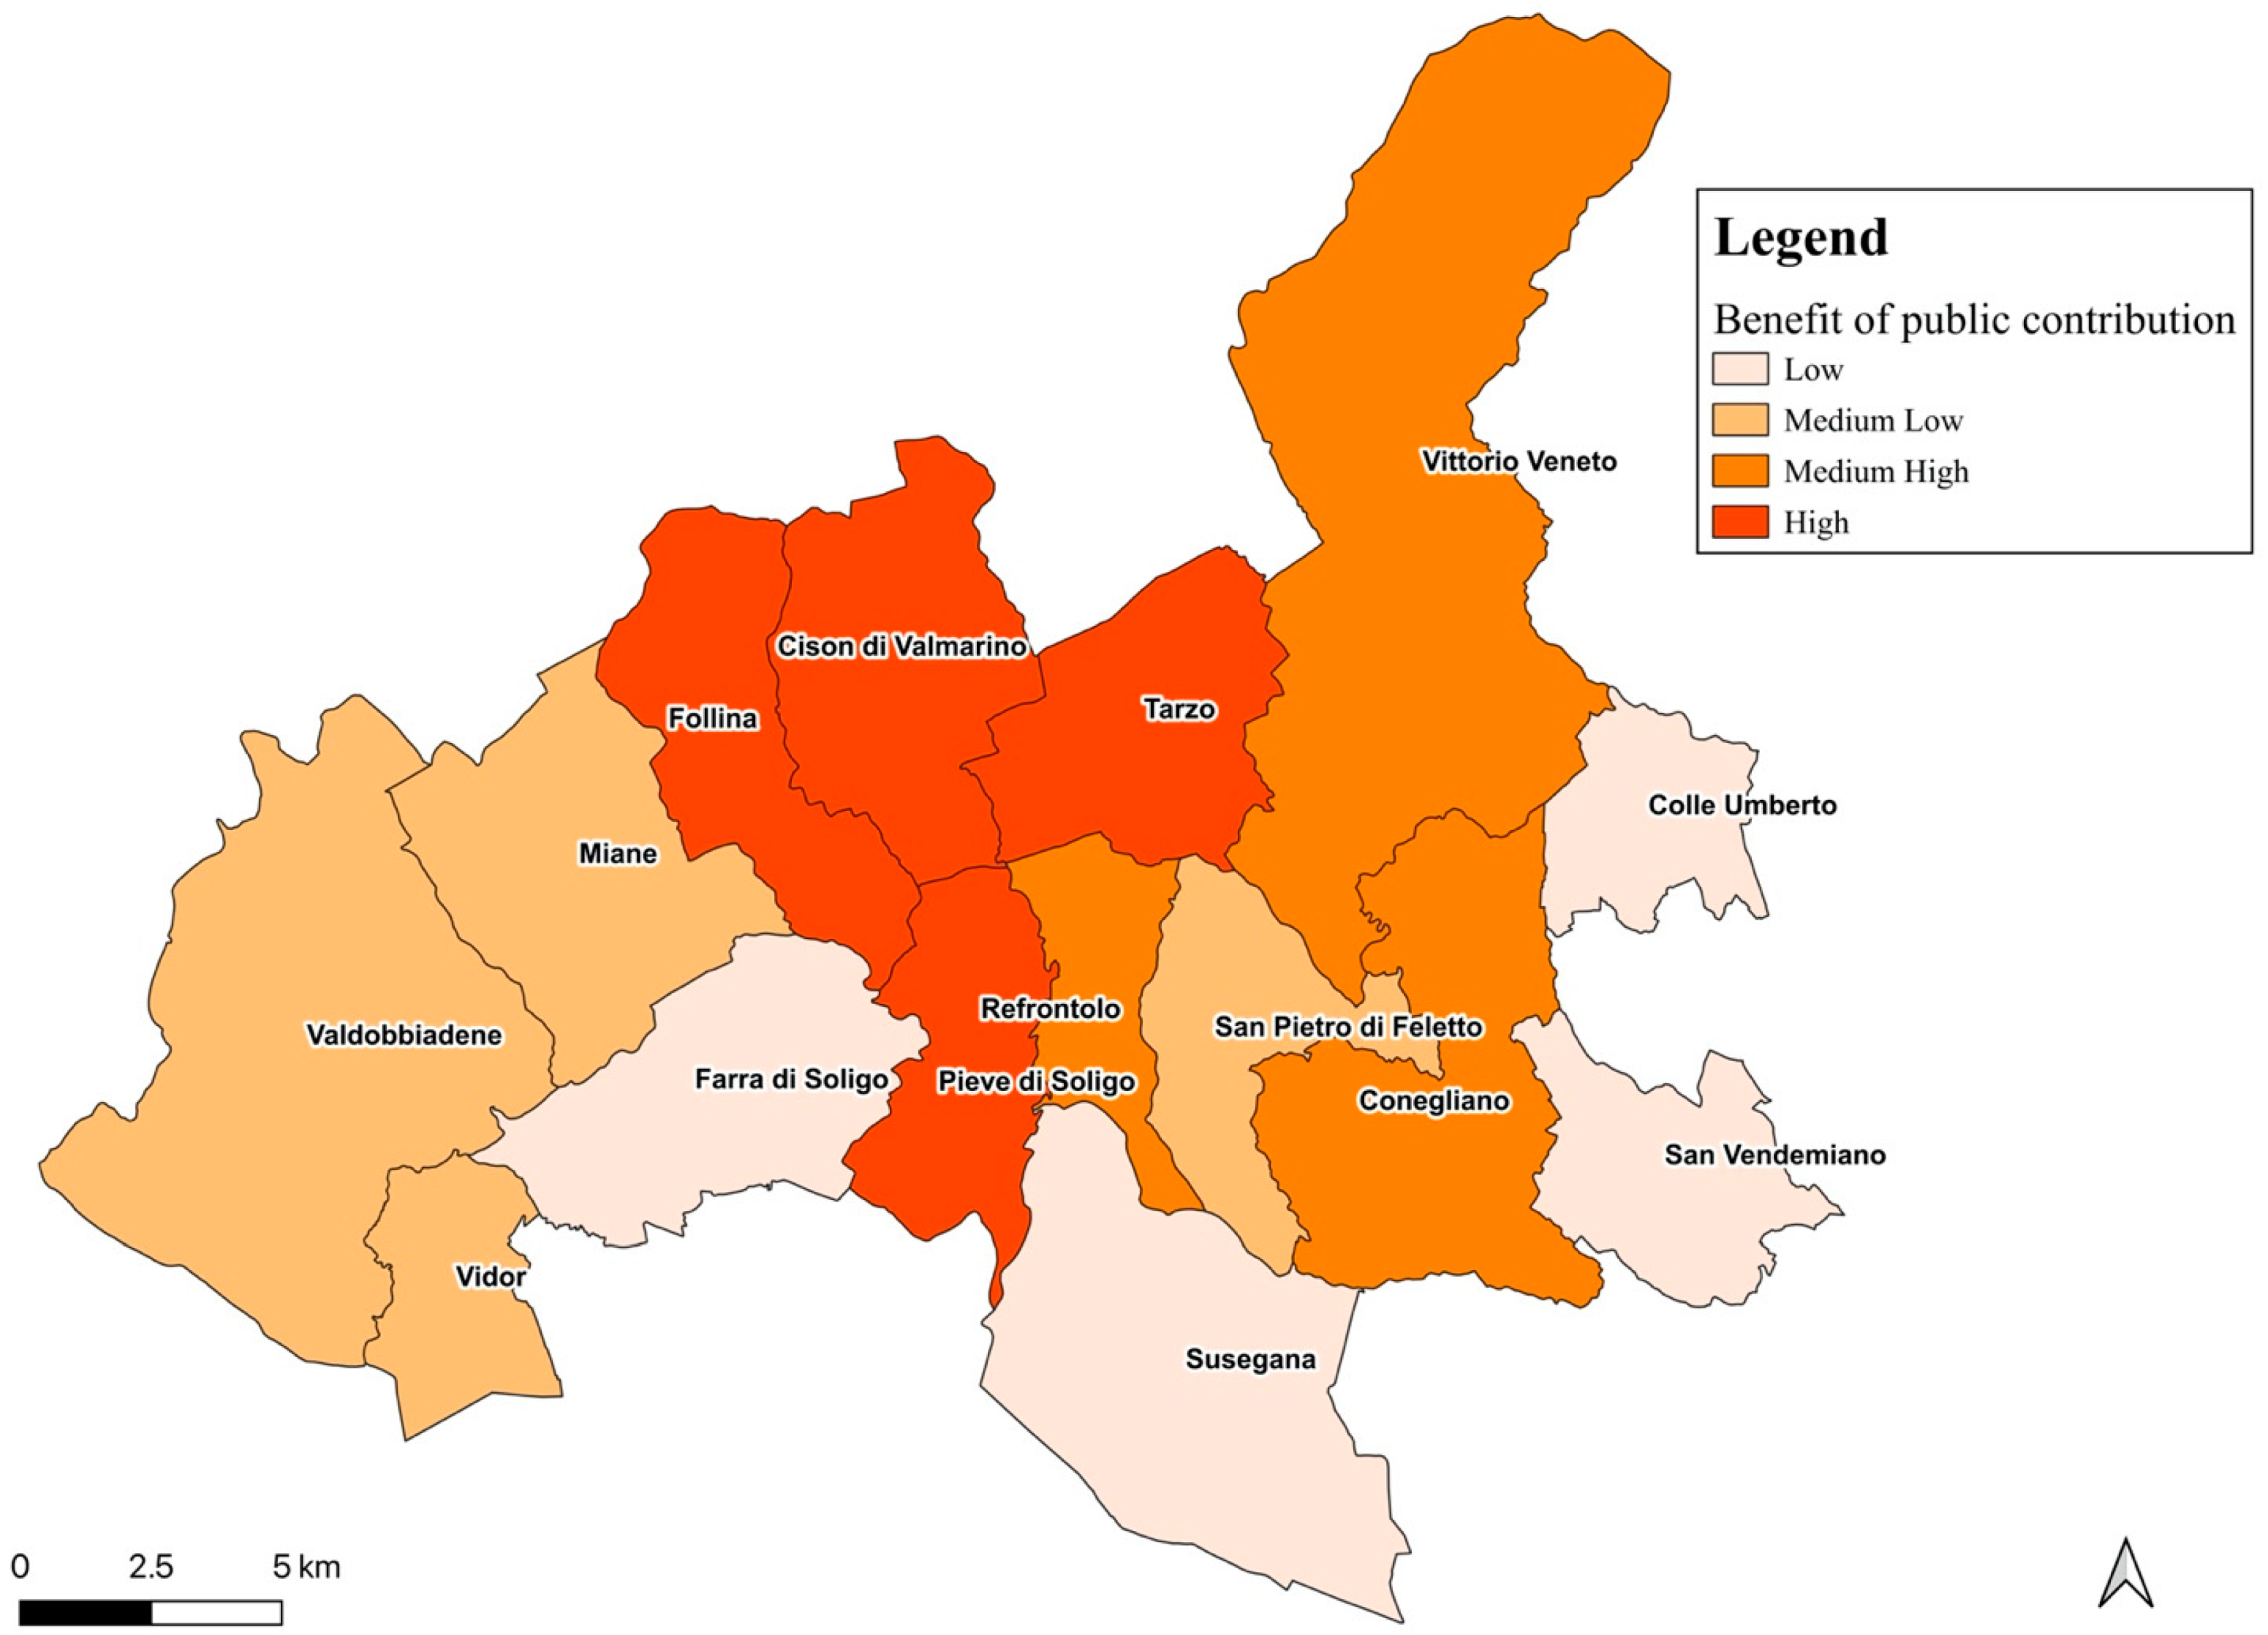
4.2. Public Costs and Benefits

The further objective of measuring the goodness of public intervention, understood as the capacity of the measures put in place to provide specific benefits to producers, considers, first and foremost, the efficiency of public action. This does not lie in maximizing transfers to producers, but in its ability to provide an incentive instrument at the lowest cost to the community. The underlying idea is that the subsidized scheme is designed to spread agricultural insurance as a fundamental effectiveness measure. The elements relating to the public cost are part of this assessment, the minimization of which means that there should be no undue surplus for the insurance companies. If public aid overestimates the benefits, part of the subsidy is transferred to them. In order to evaluate this phenomenon, the study makes use of the subsidy efficiency indicator [IES = (R − Ai)/Ai]. The aggregated data, for the period 2014–2017, show a number of contributions higher than 10 million euros, but compensation higher than 17, for a compensation/contribution ratio equal to 1.67, with a difference in value close to 7 million euro (Table 2).
This translates into a positive IES index, equal to 0.67, thus indicating, overall, relative efficiency of public spending. However, its temporal evolution underlines quite different situations; in fact, the overall figure is affected by what happened in 2017, year in which the IES value is equal to 3.17, while the difference between compensation and contribution is close to 8 million euro. In previous years, instead, the values of IES are negative, that is −0.83 in 2015 and−0.18 in 2016. In this period, moreover, there is a decrease in contributions equal to 9.7%, when compensation appears to be significantly higher (+143.4%).
To measure the effectiveness of the public contribution, the variation of the surfaces and of the insured values are taken into consideration. Overall, between 2014–2017 there was an increase of the insured surface (+4.8%), which is due to a larger attendance in 2016 (+4.2) and 2017 (+3%). The change in the insured value is more significant (+39.9%), mainly due to the increase in 2016 (+10.37%) and 2017 (+27.05%). Moreover, this figure hides the increase in grape prices. However, it is above all in the recent years that the positive effects of the measures are highlighted. Thus, in 2019, 3830.51 hectares were insured, equal to 45.3% of the total vine area, for an increase of 17.3% compared to 2014. The insured value is of 81,511,873 euro, almost double the 2014 value (+97.1%).
It is important to point out that, over time, public intervention is actually transferred into economic benefits for winegrowers. This reinforces the view that the feedback is very positive if read over a longer time frame. However, the facilitated coverage does not translate into more policies, and, in 2019 amounted to 1109 (−4.1% in 2014).
The increase shown in areas and values is encouraging; the grower perfectly perceives the economic and financial perspective of the policies. The Prosecco DOCG area proves to be characterized by good entrepreneurial liveliness and the adherence to these risk management tools is growing, with the evidence showing that they concretely bring direct economic benefits to the winemakers.
At the local level, the dynamics are more jagged; the ranking in terms of the IES indicator clearly divides the municipalities with particularly positive values from specific situations with negative data. Thus, Cison (2.73), Pieve di Soligo (2.26), and Tarzo (2.08) have values higher than two, due to relatively high compensation in relation to their contributions. On the contrary, if Miane shows an indifference of the index (0.09), Colle Umberto (−0.02), Farra di Soligo (−0.08), San Vendemiano (−0.13), and Susegana (−0.25) show negative values. Less affected by weather events, these municipalities, except Farra, belong to bordering areas (Figure 3).
In terms of effectiveness, the change in insured areas during the period was particularly marked in Pieve di Soligo (+41.5%), Follina (+73.18%) and Vittorio Veneto (+10.68%), while among the municipalities that took less advantage of the coverage, Farra di Soligo (+63.12%) stood out. Due to the change in insured values, the trend appears more uncertain, so it is Cison that shows a decrease, even though it is rather limited (−3.57%), but also Vidor (−41.93%), albeit in limited absolute value. On the contrary, significant increases distinguish Follina (+73.59%), Valdobbiadene (+70.87%) and San Vendemiano (+65.55%), although they are areas that were less affected by adverse events. These data allow us to observe how, overall, the adherence to the policies is correlated to the perception of risk; the response can only be more favorable where a greater incidence of adversity is expected.

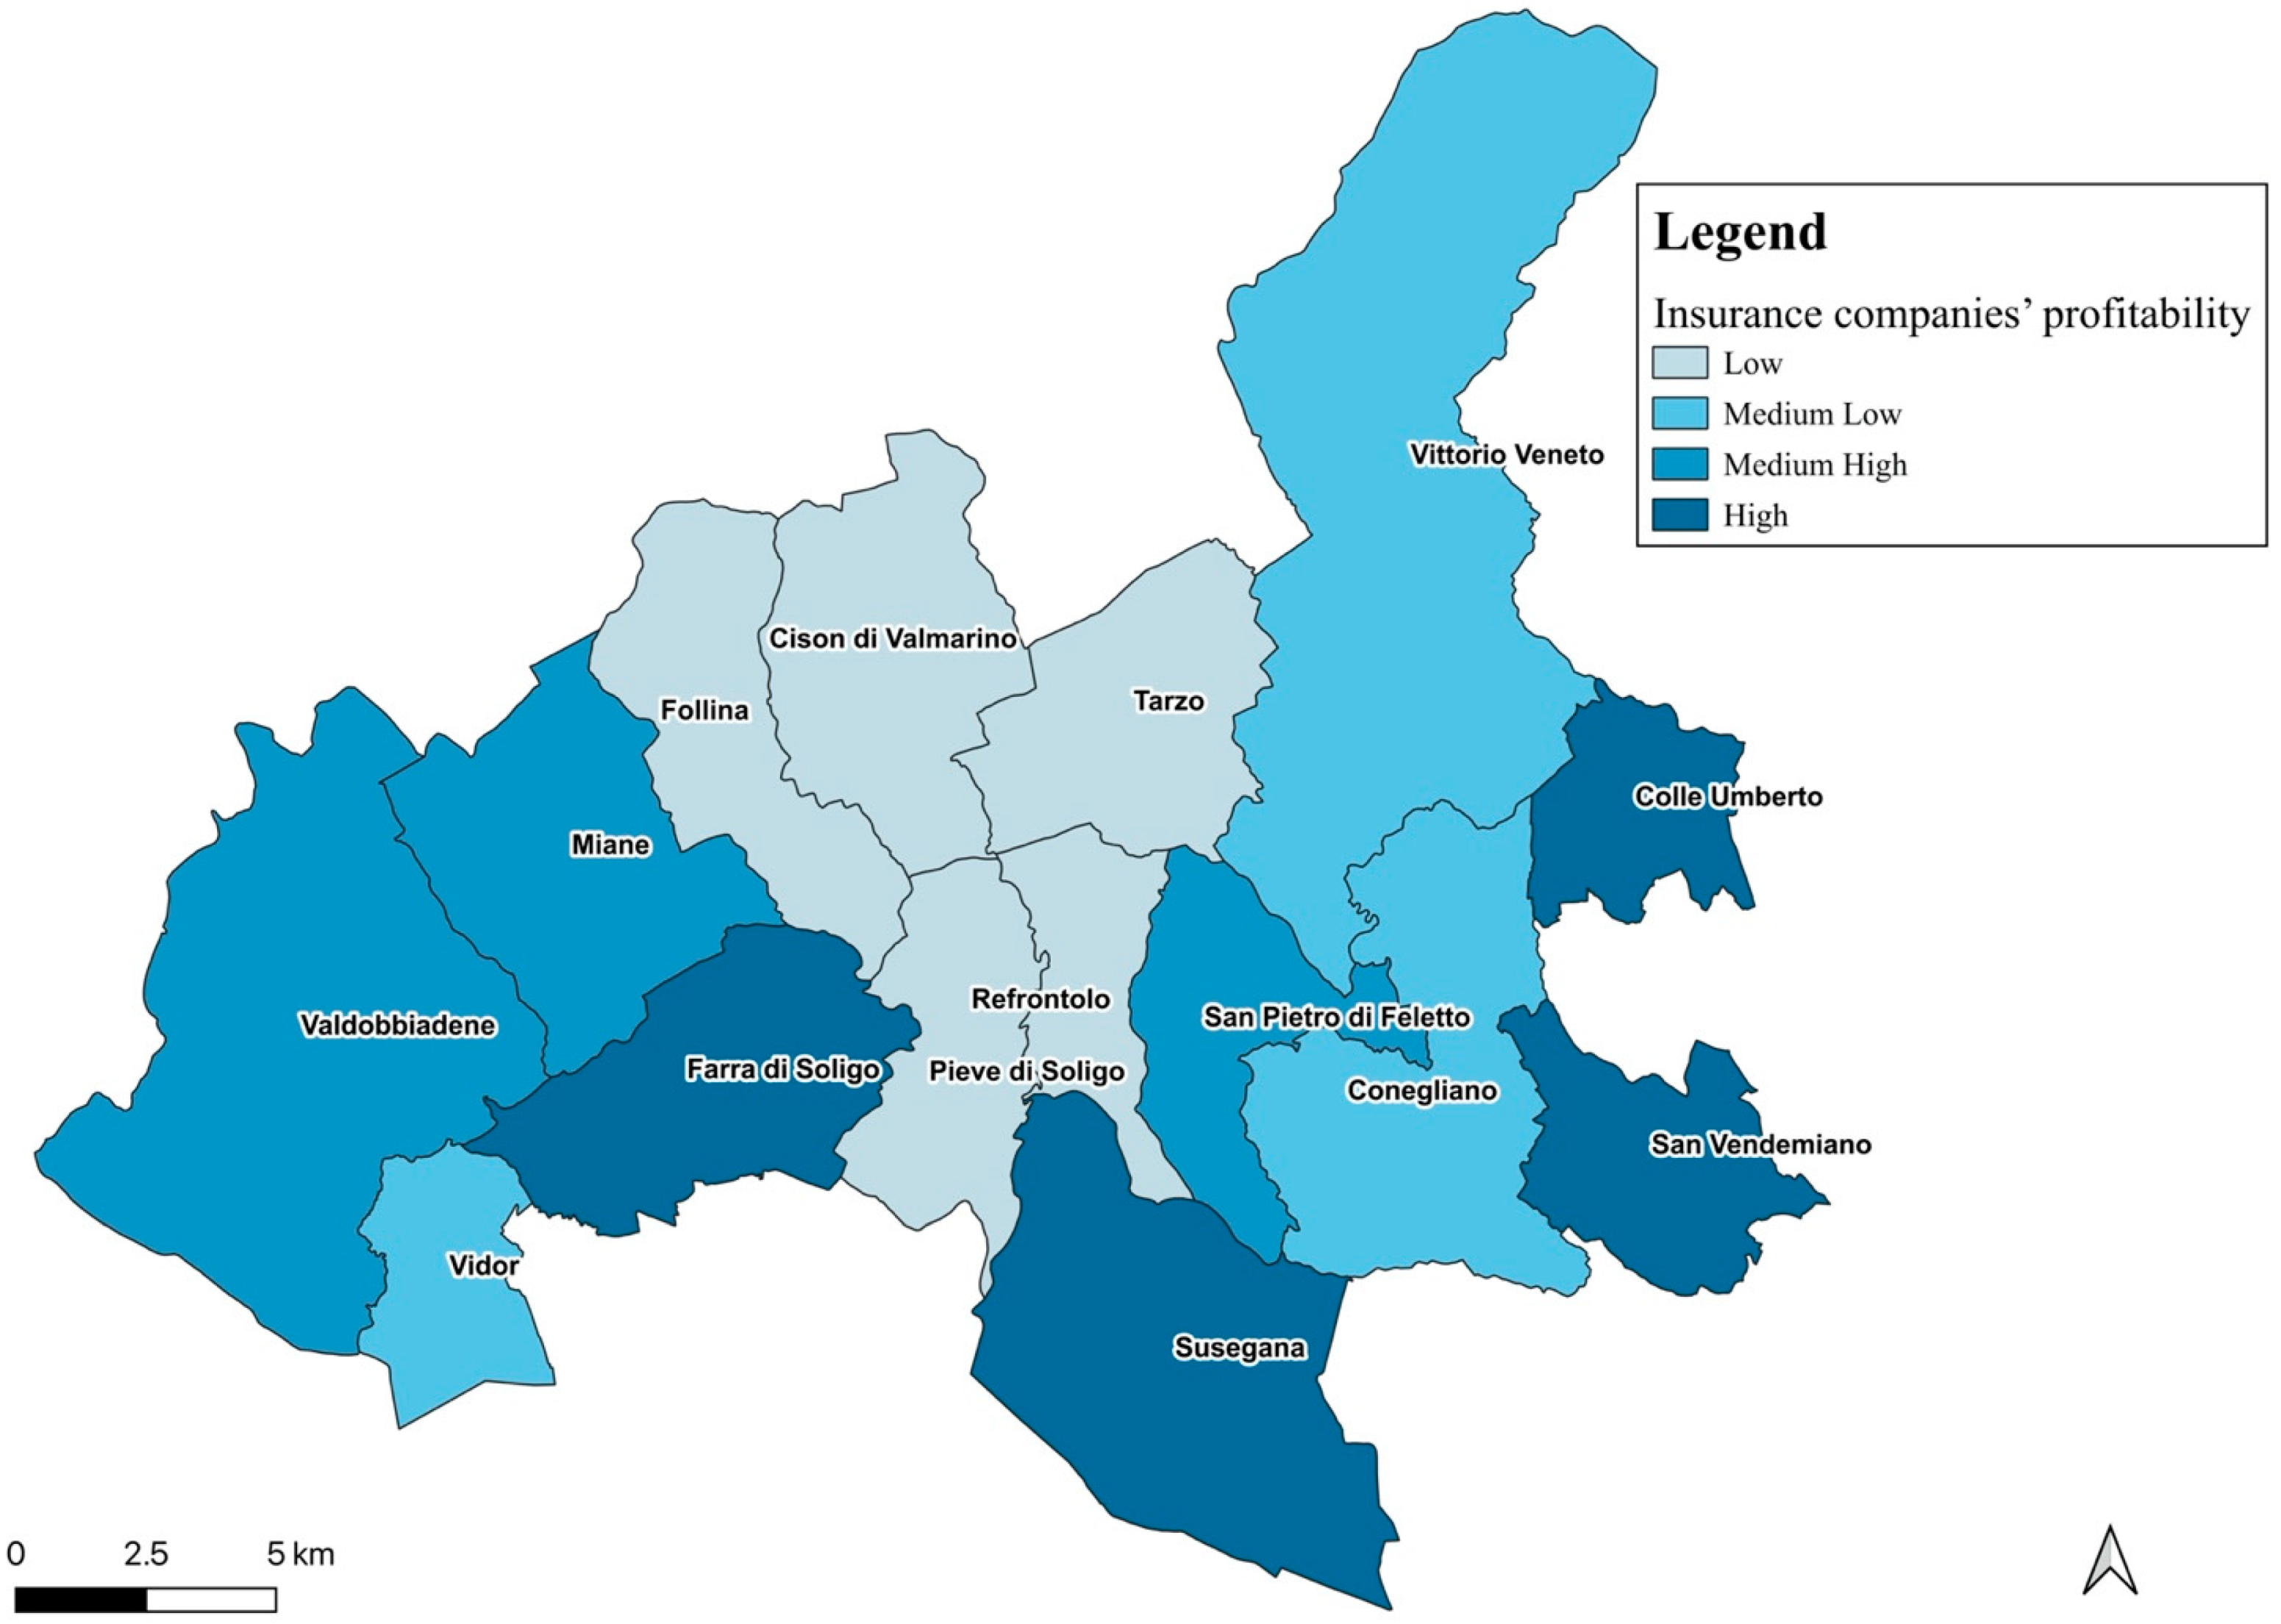
4.3. Insurance Companies’ Profitability

Insurance companies are an essential element for the proper functioning of the agricultural insurance system, making the realization of the same market possible. In overall terms, in the period under consideration, they show a brokerage profit of 9.13%, computed on premiums collected compared to compensation (Table 3).
In absolute terms, the gross margin is 1,578,127 euro, due to the loss ratio (R/PR) of 0.92; while the experience-rate (R/VA) is 9.29%. This appears slightly lower than the rates applied, on average 10.14%. This data hides the time evolution that presents a negative dynamic for the insurance companies. In fact, if in the early years, they could count on quite contained values of the loss ratio and experience-rate, in 2017 alone there is an imbalance between premiums collected and compensation of −5,267,906 euro, so as to bring the annual profit rate to −50.08%. All indicators show unfavorable trends for insurers, so the loss ratio increased by 124.8% and the experience rate by 74%, with claims payments at 18.18% of insured values. In contrast, rates were down (−22.6%), so that in 2017 the difference from the experience-rate was −9.11.
Overall, the financial equilibrium of the companies is not questioned; however, the variability of the results and the probabilistic increase in adverse events could undermine the assumptions on which it is based. In addition, if the costs of brokerage, appraisal, administration, reinsurance and systemic charges are taken into account, the net margin could be negative.
At a local level, the profit rate experienced clearly distinguishes two situations: in eight municipalities it appears positive and particularly high in Susegana (140.77%), San Vendemiano (119.35%), and Farra di Soligo (102.89%). It is small in Vittorio Veneto (0.68%), but clearly negative for seven other localities: −40.48% in Tarzo, −43.76% in Pieve di Soligo, −49.14% in Cison (Figure 4).
Where claims are concentrated, the balance sheet of insurance companies is largely negative. In these municipalities, the loss ratio is high, from 1.29 in Refrontolo to 1.97 in Cison, where it is the highest experience-rate (20.71%), but it is also high in Pieve di Soligo, at 20.05%.
The rates applied are largely positively correlated with the actual risk, so the highest values are recorded in Soligo (11.28) with a loss ratio of 1.78 and in Tarzo (11.17) with a value of 1.68. Valdobbiadene differs and, despite having a rate of 10.58, it also has a profit rate of 50.96%. The extreme local variability with which adverse events occur makes it difficult for the insurance companies to identify an adequate rate configuration, while the calibration with respect to the actual risk probabilities of the individual municipalities would result in a much more differentiated rate structure. As a result, insurance companies at a local level balance situations with opposing dynamics, so some municipalities end up cushioning risks that are, in part, not their own.
The insurance system presents a precarious balance, functional to the geographical polarization of claims and their temporal dynamics. There is effective participation of the insurance companies in the fate of the farms, the former intentionally sacrifice potential profits by lowering rates in order to encourage adherence to policies.

5. Conclusions

Considering the importance of agricultural insurance in the protection of quality products, the present study aims to identify the operational and regulatory conditions under which ensuring harvests can be perceived as convenient by winegrowers, public stakeholders and insurance companies.
The convenience for winegrowers to join the policies is clear. Against a total cost of just over 9 million euro, a compensation of 17 million euro is being paid. The payoff computed on the net premium paid shows a ratio of 2.72. In this sense, the more favorable conditions laid down in the Omnibus Regulation in favor of producers do not appear justified in the context under consideration. Other arguments regard the real reasons for not adhering to the policies, which could refer to cultural factors linked to entrepreneurial and information deficiencies in agricultural areas [8,22,23]. With regard to the goodness of the public intervention, the overall positivity of the IES indicator (0.67) underlines the relative efficiency of the subsidized contribution. As far as insurance companies are concerned, within the period, they showed a profit of 9.13%, but the trend over time is negative. The financial equilibrium seems precarious, closed between falling tariffs and increasing allowances in consideration of the feared climate change. These opposite trends may compromise the economic budget.
Research focused on the DOCG area can now be targeted on specific emerging issues, which refer, on the one hand, to a more in-depth understanding of the social-economic elements that identify the winegrowers, in relation to the different responses regarding the provided measures. On the other hand, there is the need to restrict attention to more specific aspects, suitable for identifying, for example, the ways in which the winegrowers choose the individual insurance combinations.
A more in-depth understanding of the determinants of choice, also linked to the socio-demographic characteristics of local farmers, can allow for the development of insurance policies more adherent to the most felt needs of the peculiar production of the area, among which the predominance of the small and very small rural properties, to which the Prosecco market largely owes its success.
From a general point of view, the challenge of understanding and managing the complexity of relations among farms, insurance companies and public authorities should keep in mind the opportunity to integrate new digital technologies to support research activities. Big and smart data play a fundamental role in the risk analytics of the agricultural system where their use is still limited. Decree 162, of 2015—of administrative risk management—provides for a specific information framework, which can meet the needs of knowledge and risk regulation in agriculture [24].
The present study, although referring to a limited geographical area, lays the basis for future studies on the development of innovative models for the assessment and management of agricultural risk at the local level to respond to the implicit request from all actors involved in the sector to identify a fair level of premium.

Author Contributions

Conceptualization, A.D.P.; methodology, A.D.P. and P.P.M.; validation, F.C., A.D.P. and P.P.M.; formal analysis, P.P.M. and B.C.; investigation, F.C. and P.P.M.; data curation, B.C. and A.D.P.; writing—original draft preparation, B.C. and A.D.P.; writing—review and editing, F.C. and P.P.M.; visualization, P.P.M. and B.C.; supervision, F.C.; project administration, A.D.P. All authors have read and agreed to the published version of the manuscript.

Funding

This research received no external funding.

Institutional Review Board Statement

Not applicable.

Informed Consent Statement

Not applicable.

Data Availability Statement

CondifesaTVB Consortium, Data relating to years 2014–2015–2016–2017, grape insurance.

Conflicts of Interest

The authors declare no conflict of interest.

References

  1. Kogo, B.K.; Kumar, L.; Koech, R. Climate change and variability in Kenya: A review of impacts on agriculture and food security. Environ. Dev. Sustain. 2021, 23, 23–43. [Google Scholar] [CrossRef]
  2. Morales-Castilla, I.; de Cortázar-Atauri, I.G.; Cook, B.I.; Lacombe, T.; Parker, A.; van Leeuwen, C.; Nicholas, K.A.; Wolkovich, E.M. Diversity buffers winegrowing regions from climate change losses. Proc. Natl. Acad. Sci. USA 2020, 117, 2864–2869. [Google Scholar] [CrossRef] [PubMed]
  3. Asseng, S.; Martre, P.; Maiorano, A.; Rötter, R.P.; O’Leary, G.J.; Fitzgerald, G.J.; Girousse, C.; Motzo, R.; Giunta, F.; Ali Babar, M.; et al. Climate change impact and adaptation for wheat protein. Glob. Chang. Biol. 2019, 25, 155–173. [Google Scholar] [CrossRef] [Green Version]
  4. De Castro, P.; Adinolfi, F.; Capitanio, F.; Di Falco, S. Building a new framework for Common Agricultural Policy: A responsibility towards the overall community. Eurochoices 2011, 10, 32–36. [Google Scholar] [CrossRef]
  5. De Castro, P.; Adinolfi, F.; Capitanio, F.; Di Falco, S.; Di Mambro, A. The Politics of Land and Food Scarcity; Taylor & Francis Group Ltd: Oxford, UK, 2012. [Google Scholar]
  6. Severini, S.; Biagini, L.; Finger, R. Modeling agricultural risk management policies—The implementation of the Income Stabilization Tool in Italy. J. Policy Model. 2019, 41, 140–155. [Google Scholar] [CrossRef]
  7. Meuwissen, M.; Mey, Y.; van Asseldonk, M. Prospects for agricultural insurance in Europe. Agric. Financ. Rev. 2018, 78, 174–182. [Google Scholar] [CrossRef]
  8. Santeramo, F. Imperfect information and participation in insurance markets: Evidence from Italy. Agric. Financ. Rev. 2018, 78, 183–194. [Google Scholar] [CrossRef] [Green Version]
  9. Enjolras, G.; Capitanio, F.; Adinolfi, F. The demand for crop insurance: Combined approaches for France and Italy. Agric. Econ. Rev. 2012, 13, 5–22. [Google Scholar] [CrossRef]
  10. Bozzola, M.; Massetti, E.; Mendelsohn, R.; Capitanio, F.A. Ricardian analysis of the impact of climate change on Italian agriculture. Eur. Rev. Agric. Econ. 2018, 45, 57–79. [Google Scholar] [CrossRef] [Green Version]
  11. Chavas, J.P.; Di Falco, S.; Adinolfi, F.; Capitanio, F. Weather Effects and their Long-Term Impact on the Distribution of Agricultural Yields: Evidence from Italy. Eur. Rev. Agric. Econ. 2019, 46, 29–51. [Google Scholar] [CrossRef]
  12. ISMEA. Proceedings International Conference on Risk Management in Agriculture in Italy 28 November 2019. 2020. Available online: http://www.ismea.it/flex/cm/pages/ServeBLOB.php/L/IT/IDPagina/11159 (accessed on 28 May 2022).
  13. Garrido, A.; Zilberman, D. Revisiting the demand for agricultural insurance: The case of Spain. Agric. Financ. Rev. 2008, 68, 43–66. [Google Scholar] [CrossRef] [Green Version]
  14. De Castro, P.; Miglietta, P.P.; Vecchio, Y. The Common Agricultural Policy 2021–2027: A new history for European agriculture. Ital. Rev. Agric. Econ. 2020, 75, 5–12. [Google Scholar] [CrossRef]
  15. Knight, T.O.; Coble, K.H. Survey of US multiple peril crop insurance literature since 1980. Appl. Econ. Perspect. Policy 1997, 19, 128–156. [Google Scholar] [CrossRef]
  16. Babcock, B.A. The impact of US biofuel policies on agricultural price levels and volatility. China Agric. Econ. Rev. 2012, 4, 407–426. [Google Scholar] [CrossRef]
  17. Cioffi, A.; Capitanio, F. Gestione del Rischio in Agricoltura ed Intervento Pubblico: Evoluzione, Sostenibilità e Prospettive del Sistema Italiano. Econ. Dirit. Agroaliment. 2011, 16, 395–410. [Google Scholar]
  18. Capitanio, F.; De Pin, A. Measures of Efficiency of Agricultural Insurance in Italy, Economic Evaluations. Risks 2018, 6, 126. [Google Scholar] [CrossRef] [Green Version]
  19. De Pin, A.; Capitanio, F. La gestione del rischio nella zona DOCG Conegliano-Valdobbiadene, valutazioni economiche. Ital. Rev. Agric. Econ. 2018, 73, 37–61. [Google Scholar] [CrossRef]
  20. Santeramo, F.C.; Adinolfi, F.; Capitanio, F.; Goodwin, B. Farmer Participation, Entry and Exit Decisions in the Italian Crop Insurance Program. J. Agric. Econ. 2016, 67, 639–657. [Google Scholar] [CrossRef]
  21. Fusco, G.; Miglietta, P.; Porrini, D. Post-Adversities Recovery and Profitability: The Case of Italian Farmers. Int. J. Environ. Res. Public Health 2019, 16, 3189. [Google Scholar] [CrossRef] [Green Version]
  22. Cafiero, C.; Capitanio, F.; Cioffi, A.; Coppola, A. Risk and crisis management in the reformed European agricultural policy. Can. J. Agric. Econ. Rev. Can. D’Agroecon. 2007, 55, 419–441. [Google Scholar] [CrossRef]
  23. Capitanio, F.; Bielza, M.D.C.; Cafiero, C.; Adinolfi, F. Does market competitiveness significantly affect public intervention in agricultural insurance: The case in Italy. Appl. Econ. 2011, 43, 4149–4159. [Google Scholar] [CrossRef]
  24. Vladisavljević, R.; Soleša, D.; Puvača, N. Internet of things (IoT) in a function of smart agriculture development. J. Agron. Technol. Eng. Manag. 2019, 2, 287–294. [Google Scholar]
Figure 1. Area of study.
Sustainability 14 06912 g001
Figure 2. Geographical distribution of compensation/cost ratio.
Sustainability 14 06912 g002
Figure 3. Geographical distribution of IES index.
Sustainability 14 06912 g003
Figure 4. Geographical distribution of profit rate.
Sustainability 14 06912 g004
Table 1. Cost-effectiveness of subsidized policy for winegrowers, total period 2014–2017.
Total PremiumSupplementary PolicyNet PremiumConsortium Contributions Tot. Winegrower CostsCompensationCompensation—Tot. Costs% πCompensation—Tot. Costs (%)Compensation/Tot.CostsCompensation/Net Premium Costs on Insured Value (%)
abca + b + cdd − (a + b + c) d/be
Cison di Valmarino430,84472,363134,7129558216,634847,115630,482291.07.63.916.2920.7
Pieve di Soligo815,355107,690265,09216,872389,6541,449,7311,060,077272.112.83.725.4720.1
Tarzo642,34782,135213,76713,995309,8971,079,248769,352248.39.33.485.0518.8
Follina238,05440,20475,3545952121,510353,334231,825190.82.82.914.6914.1
Refrontolo1,238,585148,506416,44529,196594,1461,594,9261,000,780168.412.12.683.8312.6
Vidor137,77111,44446,703334961,496141,69480,198130.41.02.303.0310.3
Conegliano3,447,418379,3131,169,70379,2471,628,2633,448,3471,820,083111.822.02.122.9510.5
Vittorio Veneto3,785,633367,1291,327,90082,8761,777,9053,760,2081,982,303111.524.02.112.8310.7
San Pietro di Feletto1,691,920196,159569,57040,695806,4241,352,863546,43967.86.61.682.388.0
Valdobbiadene1,018,673140,605337,75321,752500,111674,769174,65834.92.11.352.007.0
Miane185,90525,82858,549511689,494110,82921,33523.80.31.241.895.2
Colle Umberto1,547,572144,139542,31536,802723,256845,144121,88816.91.51.171.565.5
Farra di Soligo831,893133,158256,04519,951409,154410,0298750.20.01.001.604.9
San Vendemiano868,681144,086275,89921,757441,741396,016−45,725−10.4−0.60.901.444.6
Susegana1,987,023228,615668,12162,811959,548825,292−134,256−14.0−1.60.861.243.5
Total18,867,6742,221,3766,357,927449,9289,029,23117,289,5468,260,31691.51001.912.729.3
Table 2. Costs and benefits of public contribution, total period 2014–2017.
ContributionCompensationComp.-Contr.Comp/ContrIES%Δ Ha%Δ I.V.
Cison di Valmarino226,826847,115620,2903.732.735.88−3.57
Pieve di Soligo444,4761,449,7311,005,2563.262.2641.5027.15
Tarzo350,6871,079,248728,5613.082.088.7120.75
Follina124,286353,334229,0482.841.8473.1873.59
Refrontolo674,6081,594,926920,3182.361.362.5539.13
Conegliano1,900,9183,448,3471,547,4291.810.812.1739.18
Vittorio Veneto2,111,8193,760,2081,648,3891.780.7810.6850.43
Vidor80,008141,69461,6861.770.770.16−41.93
S. Pietro di Feletto934,7831,352,863418,0801.450.456.3232.06
Valdobbiadene547,076674,769127,6921.230.23−0.9370.87
Miane101,482110,82993471.090.090.1731.96
Colle Umberto865,398845,144−20,2540.98−0.02−0.0344.87
Farra di Soligo443,462410,029−33,4330.92−0.0863.1211.99
S. Vendemiano453,327396,016−57,3110.87−0.130.5665.55
Susegana1,099,006825,292−273,7140.75−0.25−2.8244.27
Total10,358,16117,289,5466,931,3851.670.674.7939.89
Table 3. Insurance companies, economic and financial indicators, total period 2014–2017.
Ins. ValuePremiumComp.C/Pr
(Loss Ratio)
% C/IV
(Exper. Rate)
% PR/IV
(Rates)
Pr-Comp
(Gross Margin)
% π
Susegana23,357,5591,987,023825,2920.423.538.511,161,731140.8
S. Vendemiano8,611,855868,681396,0160.464.6010.09472,665119.4
Farra di Soligo8,422,308831,893410,0290.494.879.88421,864102.9
Colle Umberto15,246,1001,547,572845,1440.555.5410.15702,42883.1
Miane2,150,092185,905110,8290.605.158.6575,07667.7
Valdobbiadene9,630,8561,018,673674,7690.667.0110.58343,90451.0
S. Pietro di Feletto16,966,5491,691,9201,352,8630.807.979.97339,05725.1
Vittorio Veneto35,057,5623,785,6333,760,2080.9910.7310.8025,4250.7
Conegliano32,953,4173,447,4183,448,3471.0010.4610.46−9290.0
Vidor1,376,806137,771141,6941.0310.2910.01−3923−2.8
Refrontolo12,675,7731,238,5851,594,9261.2912.589.77−356,341−22.3
Follina2,498,357238,054353,3341.4814.149.53−115,281−32.6
Tarzo5,748,109642,3471,079,2481.6818.7811.17−436,902−40.5
Pieve di Soligo7,229,217815,3551,449,7311.7820.0511.28−634,377−43.8
Cison di Valmarino4,089,627430,844847,1151.9720.7110.54−416,271−49.1
Total186,014,18518,867,67417,289,5460.929.2910.141,578,1279.1
Publisher’s Note: MDPI stays neutral with regard to jurisdictional claims in published maps and institutional affiliations.

