Article

Vulnerability Analysis of Coastal Zone Based on InVEST Model in Jiaozhou Bay, China

1
Key Laboratory of Urban Land Resources Monitoring and Simulation, Ministry of Natural Resources, Shenzhen 518034, China
2
College of Geodesy and Geomatics, Shandong University of Science and Technology, Qingdao 266590, China
3
Qingdao Surveying and Mapping Research Institute, Qingdao 266034, China
4
Planning and Natural Resources Surveying and Mapping Center of Shenzhen Municipality, Shenzhen 518038, China
*
Author to whom correspondence should be addressed.
Sustainability 2022, 14(11), 6913; https://doi.org/10.3390/su14116913
Submission received: 21 April 2022 / Revised: 27 May 2022 / Accepted: 30 May 2022 / Published: 6 June 2022

Abstract

:
The coastal zone plays an essential part in maintaining the balance of the ecosystem and promoting the development of human society and economy. It is significant to assess the extent to which the Jiaozhou Bay coastal zone withstands floods and coastal erosion during storms. The coastal exposure index (CEI) of the Jiaozhou Bay in 1984, 2000 and 2019 was obtained by the coastal vulnerability model based on data including coastline, bathymetry and coastal terrain elevation. The spatial distribution and aggregation characteristics of CEI in Jiaozhou Bay were analyzed through spatial autocorrelation analysis. The results show that the north coast of Jiaozhou Bay is highly vulnerable, that is, prone to coastal erosion, while the south and east are less vulnerable, meaning that they can basically withstand natural disasters such as storm surges and floods. The CEI shows significant spatial autocorrelation, with little spatial heterogeneity. The type of coastline, elevation, distance to continental shelf and socio-economic development are the main factors that cause the north–south vulnerability differences in the Jiaozhou Bay coast. The results can identify the districts along the Jiaozhou Bay that are at greater risk of marine disasters, and provide scientific theoretical support for the coastal protection and sustainable development of the Jiaozhou Bay.

1. Introduction

The coastal zone is a complex ecosystem. The global coastal zone is subjected to tremendous pressure under the influence of sea level rise and storm surges caused by human activities and climate change [1,2,3]. A sea level rise can cause coastal flooding and increase the storm surge hazard [4]. Coastal erosion weakens the elasticity of the coastal zone, so the vulnerability is gradually increasing [5]. Coastal vulnerability has been defined as “the degree of incapability to cope with the consequences of climate change and accelerated sea-level rise” [6,7]. This reflects the integrity and diversity of regional coastal ecosystem functions to a certain extent. However, the frequent natural disasters in coastal areas may lead to the increase of vulnerability and the decline of ecosystem function. In this context, many scholars and countries have reached a broad consensus on the issue of coastal protection [8].
Nowadays, many countries have their own unique views on the issue of coastal vulnerability. The US Coastal Zone Management Law mentions that people should pay more attention to some impacts, such as storm surges, floods, coastal erosion and other natural disasters that endanger the economy, life and property safety and the ecological environment around the coastal zone, when people focus on the development of the coastal zone [9]. In the coastal management regulation formulated by Australia in 2018, it advises the improvement of human and material resources for risk assessment and prediction in response to coastal erosion, floods and other disasters caused by sea level rise and climate problems, so as to meet the needs of sustainable development [10]. Qingdao, China, passed the management regulations about coastal zone protection in 2019, involving the coastal zone’s protection, amendment and planning. It not only emphasizes that human activities should be regulated, such as returning farmland to the sea, but also pays attention to the impact of natural disasters on the coastal zone [11]. Above all, coastal vulnerability assessment is vital to environmental protection and risk prediction.
In recent years, some problems have become increasingly severe, including coastal erosion, seawater intrusion and wetland degradation. Due to the persistence of global warming and the poor response of governments to the global climate crisis, disasters such as high temperature heat waves, floods and strong storms are easy to occur frequently in summer every year, causing serious losses to the coastal zone of Jiaozhou Bay and other coasts [12,13,14]. Therefore, more and more attention has been paid to research on coastal zone vulnerability. The comprehensive determinative index was put forward by the impact index of sea level rise, combining the analytic hierarchy process and variation coefficient method. The Coastal Vulnerability Index (CVI) [15], improved CVI model [16] and ICZM (Integrated Coastal Zone Management) model [17] were put forward. Various evaluation indexes, such as coastal exposure, sensitivity and adaptability, were used to establish vulnerability evaluation models, which can assess the risk of storm surge disasters and coastal zone vulnerability [18,19,20,21]. The evaluation indexes were analyzed by analytic hierarchy process and principal component analysis, and confirmed the coastal vulnerability and driving mechanism along the eastern coast of Bangladesh and Guangxi Karst-Beibu gulf coastal zone [22,23]. Yaprak, O and Yin Liting [24,25] utilized the InVEST (Integrated Valuation of Ecosystem Services and Tradeoffs) model to estimate the degree of coastal vulnerability of the Miaodao archipelago and the Hawaiian Islands, based on basic data such as coastline type, digital elevation model, bathymetry, continental shelf and climate driving force. It has been proved that the InVEST model can use a variety of data to reflect the vulnerability characteristics of the coast more comprehensively than other methods.
Jiaozhou Bay is a semi-enclosed bay located in the south of Qingdao City, Shandong Province, China (Figure 1). It is rich in natural resources, diverse in biological species and developed in fisheries. At the same time, Jiaozhou Bay is heavily affected by typhoons, cloudbursts and storm surges, causing frequent natural disasters due to its long coastline and wide sea area. The trestle, a landmark building in Qingdao, collapsed more than 50 m under the influence of a storm surge in May 2013 [26,27]. The economic loss was serious, and it also brought huge difficulties to repair. In August 2019, Typhoon Lichma made landfall in the coastal area of southern Shandong, and the waves destroyed the coastal guardrail of Jiaozhou Bay with a storm surge of 60–120 cm [28]. These brought stagnant water and sea sand to the scenic spots in Qianhai, which aggravated coastal erosion. Therefore, it is necessary to effectively evaluate the vulnerability of the coastal zone of Jiaozhou Bay. Liu Jian [29] constructed a vulnerability evaluation index system in Jiaozhou Bay using the PSR (Pressure-State-Response) conceptual model, which can effectively and quantitatively monitor the vulnerability of the coastal zone in Jiaozhou Bay under various pressures, including climate change, urbanization and reclamation. Li Ruibo [30] used sea level risk assessment factors, species diversity and other factors to conduct a hierarchical analysis for obtaining the vulnerability index of the Jiaozhou Bay Coastal Zone. The spatial vulnerability model was established to evaluate the ecological environment vulnerability of the coastal zone in Jiaozhou Bay. Pang Lihua [31] constructed an ecological fragility model by using the landscape ecology principles and selecting the number of patches, patch density and other indicators, which showed the temporal and spatial changes in the ecological fragility of the coastal zone in Jiaozhou Bay.
The InVEST model can express coastal vulnerability results more intuitively and comprehensively than other methods by using various data, such as PSR and ESA models. However, no scholars have used the InVEST model to study the vulnerability and spatial aggregation characteristics of the Jiaozhou Bay coast for multiple periods to provide suggestions on the protection of Jiaozhou Bay. Therefore, this paper uses the coastal vulnerability model in the InVEST model to assess the natural disaster resistance of Jiaozhou Bay. First, the coastal exposure index (CEI) in 1984, 2000 and 2019 are obtained through the model, and then the spatial distribution characteristics of the coastal vulnerability are obtained by spatial autocorrelation analysis. Finally, the natural and human factors that affect coastal vulnerability, as well as the reasons that affect the accuracy of the experimental results, are discussed. The research results can provide scientific reference for coastal zone management and protection of Jiaozhou Bay, and impart theoretical support for rational planning of coastal development along the Jiaozhou Bay.

2. Materials and Methods

2.1. Study Area

Jiaozhou Bay (Figure 1), located in the middle of the Yellow Sea and on the south coast of the Jiaodong Peninsula, is a semi-closed bay that goes deep inland between Qingdao downtown and Huangdao District in Qingdao, Shandong Province, China. The geographical location is between 120°03′~120°25′ E and 36°01′~36°15′ N, with an area of nearly 500 km2. The study area spans across six districts from west to east: Huangdao, Jiaozhou, Chengyang, Licang, Shinan and Shibei. Jiaozhou Bay and its vicinity are in the warm temperate monsoon climate zone of China, which is a transitional climate between subtropical and temperate zones. The annual average temperature is 12.2 °C, the average temperature is 25.5 °C in August and −1.2 °C in January and the average rainfall is 775.6 mm [32].
Jiaozhou Bay is a high-quality semi-enclosed bay with rich fishery, mineral and saline resources. With the acceleration of urbanization processes and the rapid development of coastal marine industries in Qingdao, Jiaozhou Bay has formed a diversified, complex ecological system with surrounding towns, rivers and ports. However, in recent decades, natural disasters such as storm surges, coastal erosion and floods, generated by global climate change and sea level rise, have frequently occurred in the Jiaozhou Bay area, which caused problems such as receding coastline and ecosystem degradation. Jiaozhou Bay and its adjacent sea areas are under unprecedented ecological pressure [33,34].

2.2. Data Source

Table 1 gives the data requirements of the model input, in which the coastline type data and coastal habitat data were obtained by artificial vectorization and supervised classification, and the others were downloaded from the website or provided by the InVEST model and other institutions.
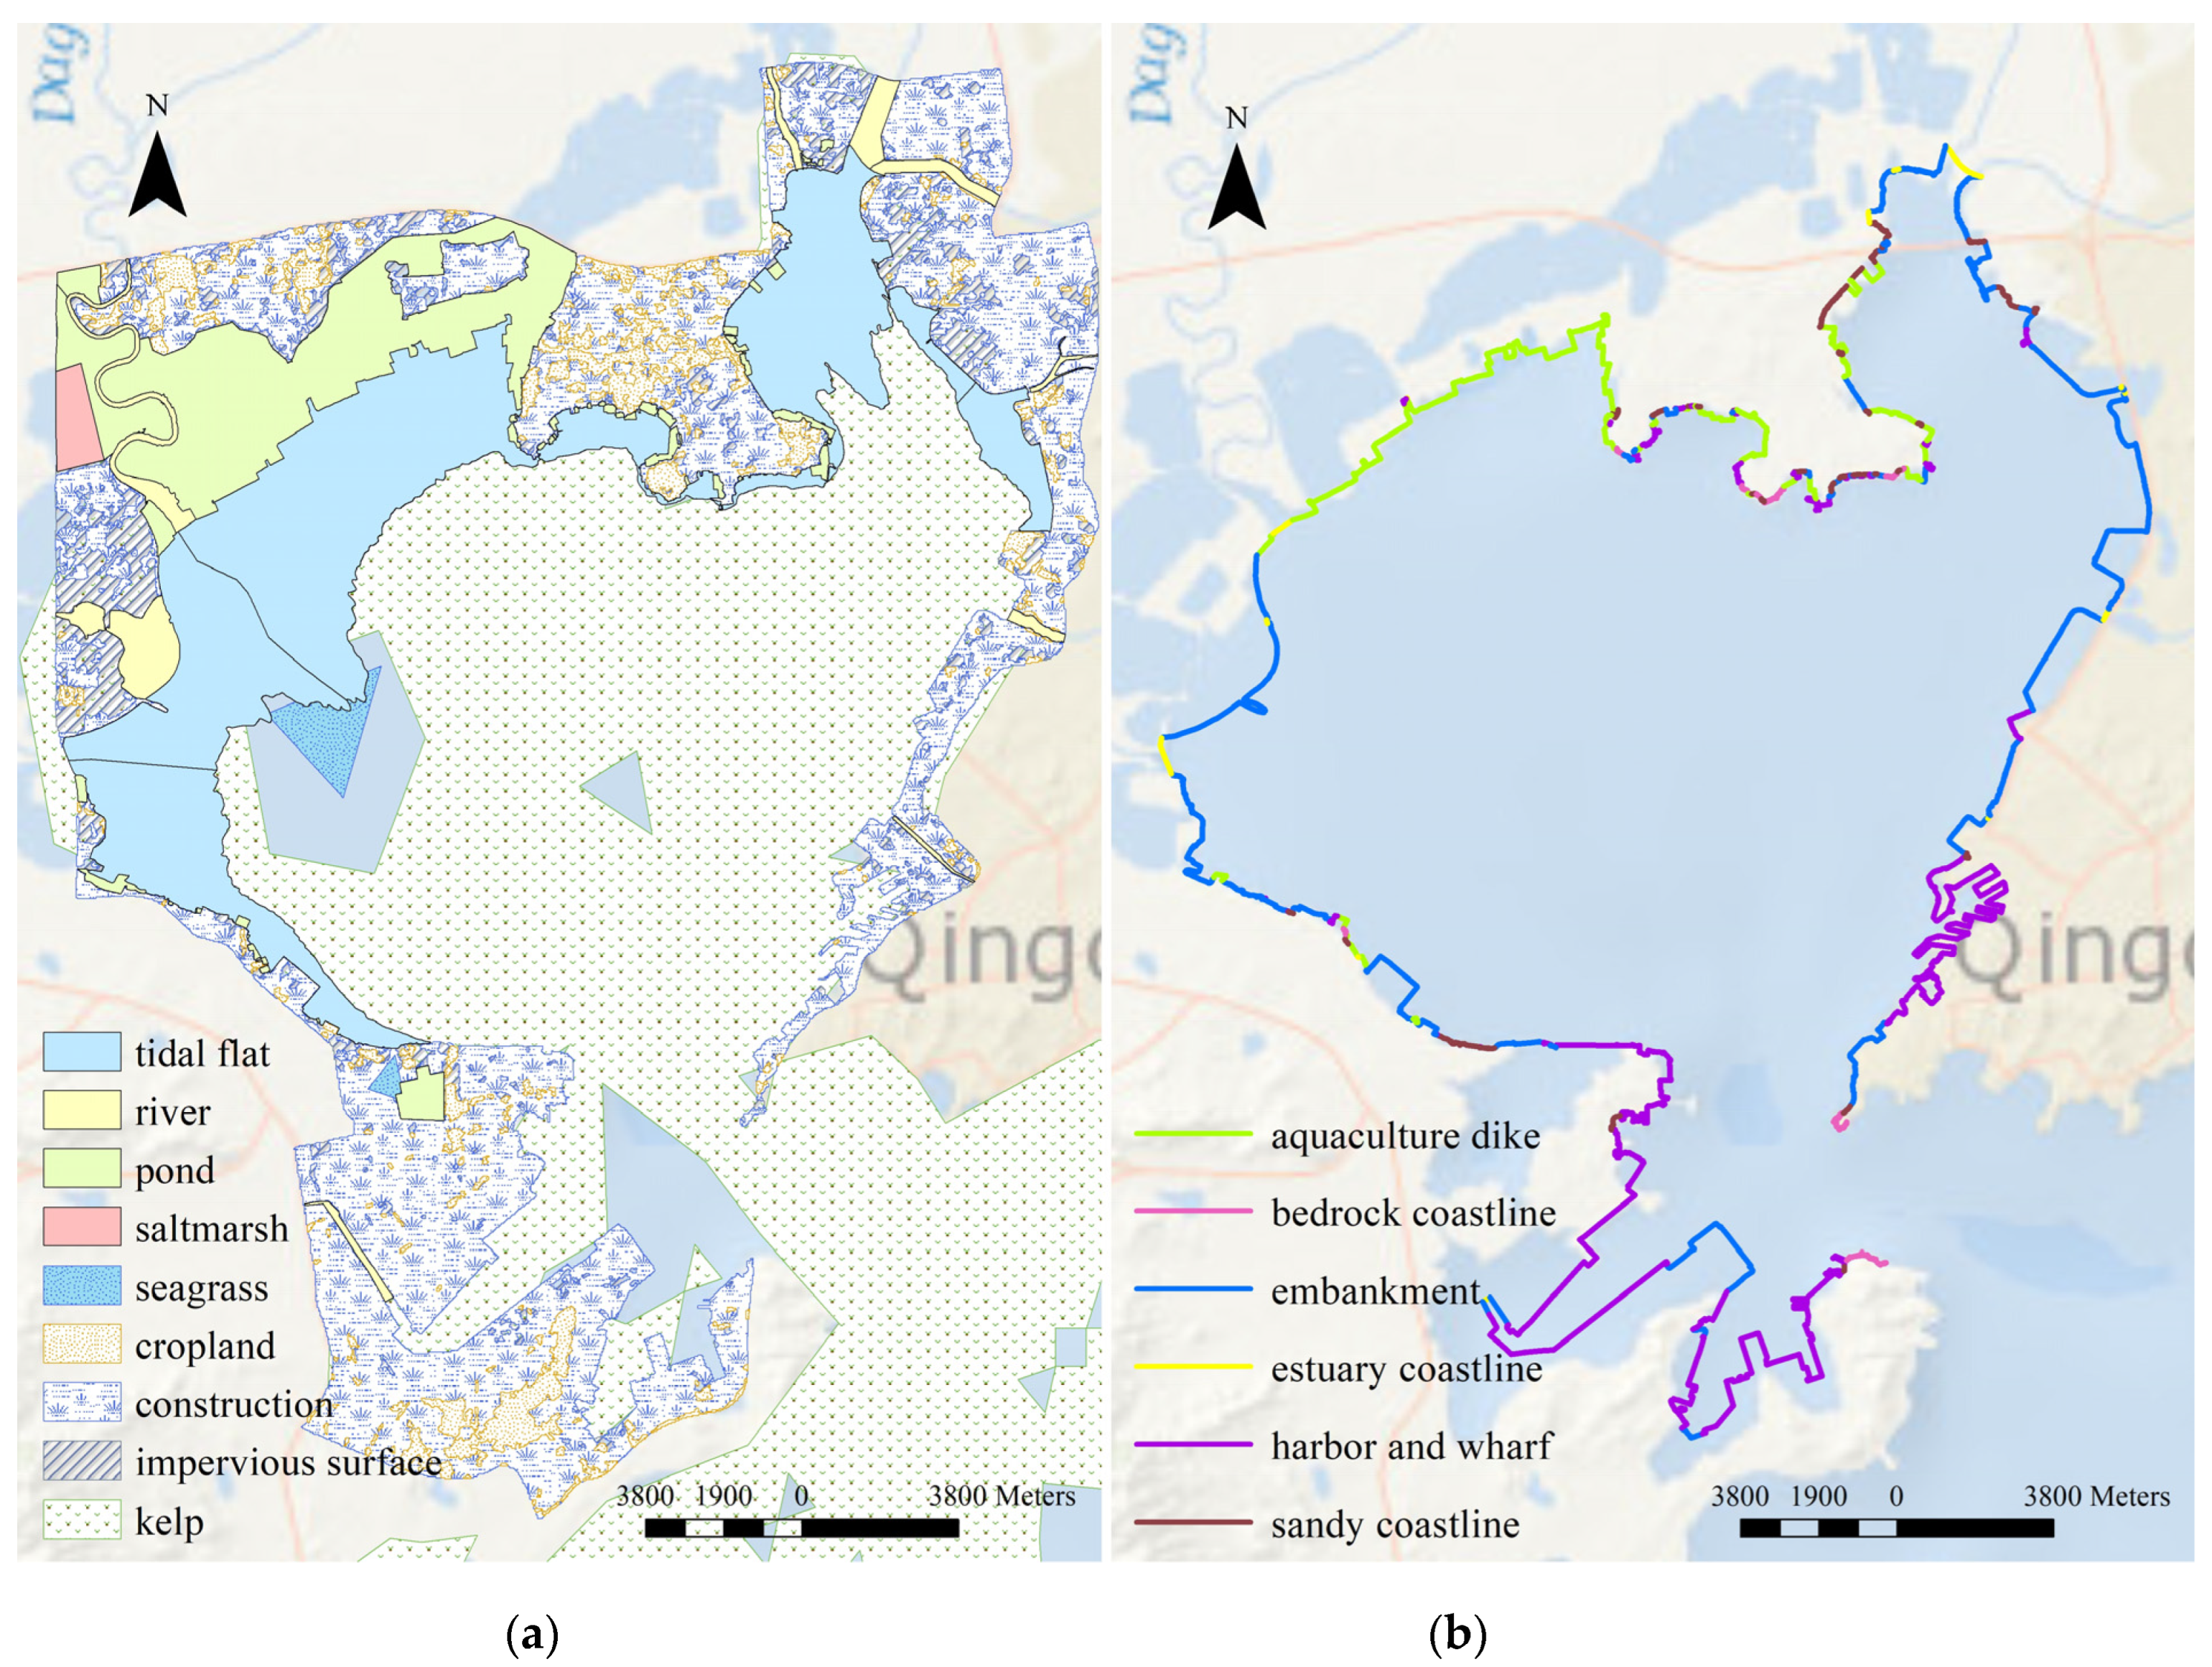
In this study, the Landsat image data were downloaded from the geospatial data cloud (http://www.gscloud.cn/, accessed on 27 May 2022). The Google map image data were downloaded from LocaSpace Viewer. The specific satellite remote sensing data obtained are shown in Table 2. According to the actual geographical conditions and the resolution of remote sensing images, the land use types and coastline data along the coast of the Jiaozhou Bay were extracted, as demonstrated in Figure 2. Through visual interpretation, the land use types are classified into seven types: tidal flat, river, pond, saltmarsh, cropland, construction and impervious surface. The wetlands include tidal flat, pond, saltmarsh and river, extracted by visual interpretation and field investigation using Landsat images from 1984 to 2019. The Google images with high spatial resolution were used as auxiliary data in the same year during the process. The non-wetland is considered the contrast land type for the wetland type, which is divided into three categories: construction land, cropland and impervious surface, and was extracted by supervised classification method in ENVI 5.3 using the Landsat images. The confusion matrix was used to evaluate the accuracy of the supervised classification results. The overall classification accuracy is above 90%, and the range of the Kappa coefficient is from 0.8 to 0.9. The resolution effect on the coastline’s extraction length is considered [35,36]. Before artificial vectorization, we resampled the 1.19 m Google Image in 2000 and 2019 to 15.4 m, making it the same spatial resolution as 1984. Then, the same spatial resolution images were used to vectorize the coastline. Through visual interpretation, the Jiaozhou Bay coastline is divided into six types: aquaculture dike, bedrock coastline, embankment, estuary coastline, harbor and wharf, and sandy coastline.
Table 1. Input data layers and their sources.
Input VariableDescriptionSource
BathymetryObtained from single-beam bathymetry. A depth value is measured every 50 m, and the bathymetry grid data with 30 m spatial resolution is acquired by interpolation.Qingdao Surveying and Mapping Research Institute
Climatic ForcingWAVEWATCH III model hindcast
reanalysis results from NOAA’s
National Weather Service are used.
Natural Capital
Project (2021) [37]
Digital Elevation
Model (DEM)
Downloaded DEM raster file from the website of National Aeronautics and Space Administration with the 12.5 m resolution.National Aeronautics and Space Administration (NASA) [38]
Continental Shelf
Contour
The original file is used.Natural Capital
Project (2021) [37]
Natural HabitatsCreated polygons in ArcMap 10.6 according to the land use and land cover situation and downloaded seagrass and kelp data from Ocean Data Viewer
(https://data.unep-wcmc.org/).
[39,40,41]
GeomorphologyCreated polylines in ArcMap 10.6 and classified by artificial visual interpretation with the attributes table including descriptions and ranks. Year of data: 1984, 2000, 2019.Artificial
vectorization [42]
LandmassModified file by creating a polygon from line shape file.[43]
Sea Level ChangeCreated point shape file with the attribute of sea level changes.National Marine Data and Information Service [44]
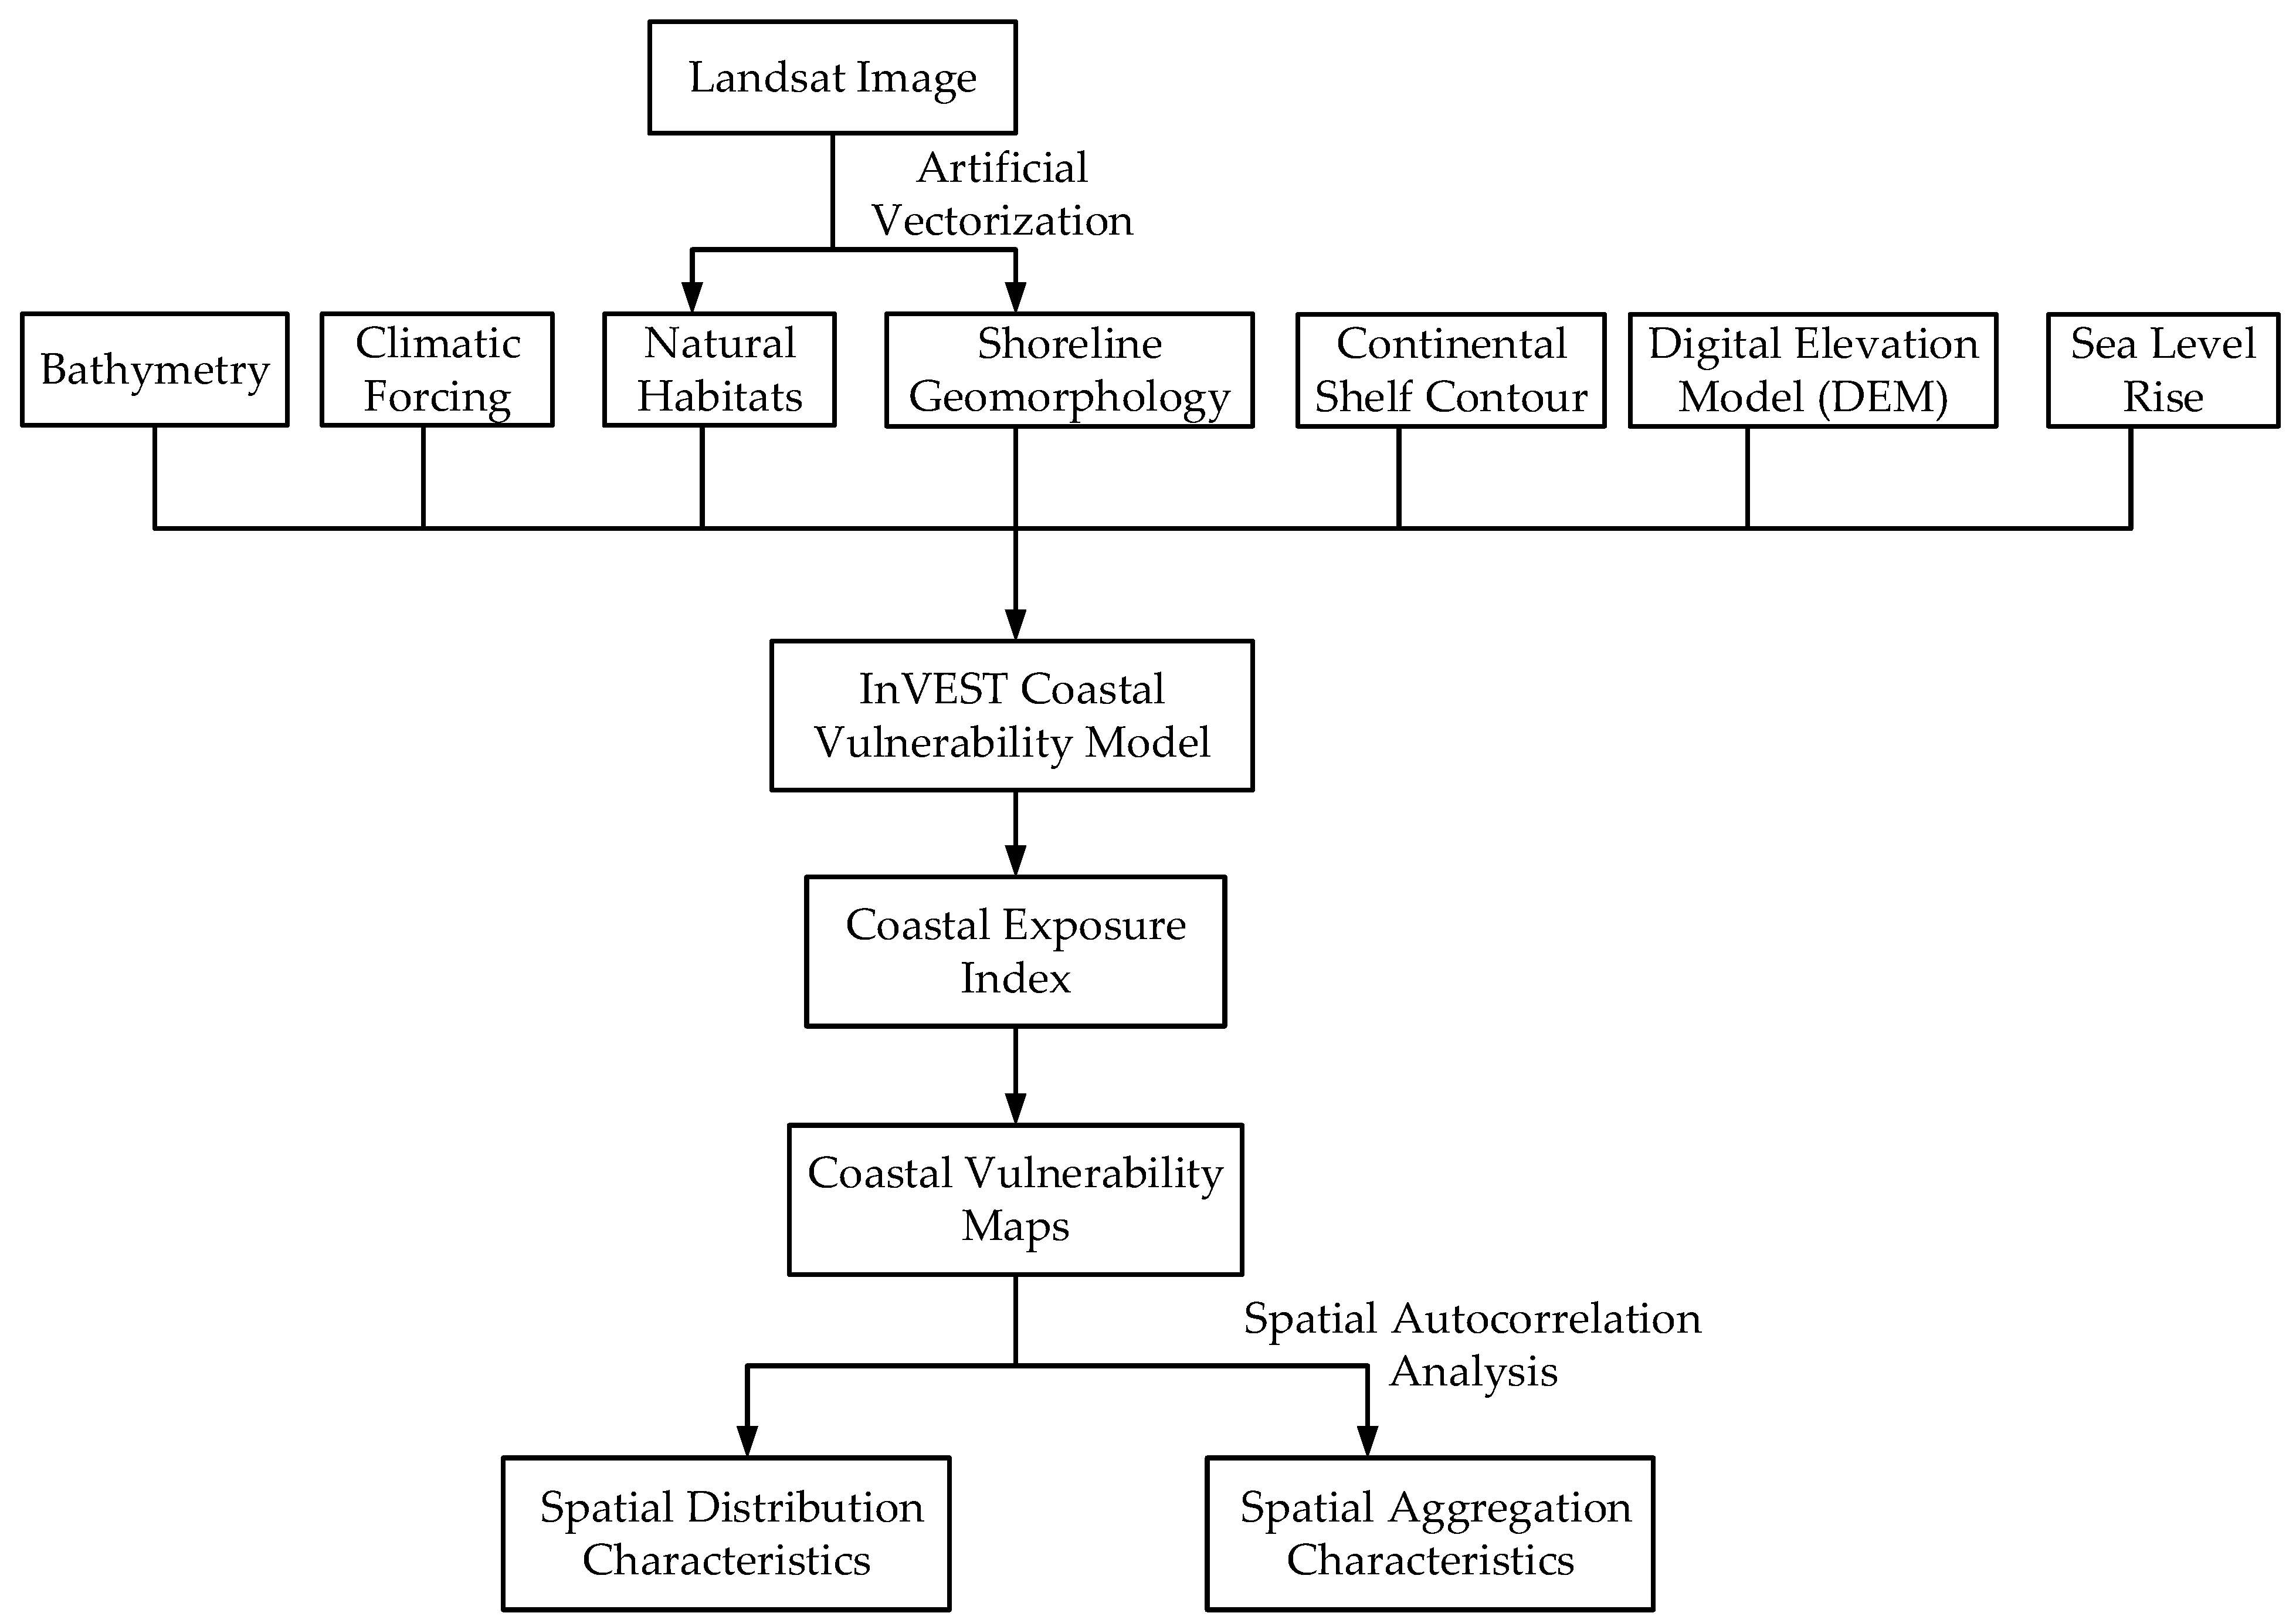
In addition, the distribution data of seagrass and kelp were downloaded in the Ocean Data Viewer (https://data.unep-wcmc.org/, accessed on 27 May 2022) of UNEP-WCMC to solve the inaccurate interpretation problem of underwater vegetation in remote sensing images. Then, the coastlines and habitats were ranked after extraction and classification. Table 3 is the .csv table required by the model, and Table 4 is the coastline vector data attribute table. The coastline and habitat types that are vulnerable to natural disasters, such as storm surges, are rated as rank 5. At the same time, those that are not vulnerable to waves and can provide certain protections to the coast are rated as rank 1. The flowchart of the study is shown in Figure 3.

2.3. Coastal Exposure Index (CEI)

The coastal vulnerability assessment conducted in this study was carried out in the coastal vulnerability model in InVEST 3.9.0. InVEST is a decision-support tool for mapping and valuing ecosystem services, generating spatially explicit models of ecosystem services based on underlying ecosystem characteristics [45]. The CEI represents the relative exposure level to erosion and inundation, which are caused by natural disasters such as storms and floods in different coastline sections in the study area. Coastal vulnerability is estimated based on the degree of CEI. A high degree of CEI indicates a strong vulnerability and the coastal zone is easy to be eroded by storm surges and waves. On the contrary, a low degree of CEI indicates a weak vulnerability and the coastal zone is less subjected to marine natural disasters. The coastal vulnerability model computes the CEI that evaluates the coastal vulnerability by combining up to seven biological and physical variables, such as habitat distribution, coastline type, coastal terrain elevation and sea level change at each shoreline point. Ranks vary from very low exposure (rank = 1) to very high exposure (rank = 5), based on a mixture of user-defined and model-defined criteria. The ranks of biological and physical variables are adopted from the ranking scheme suggested by the InVEST user guide [37], which is similar to the one proposed by Gornitz et al. (1991) [46] and Hammar-Klose and Thieler (2001) [47] (Table 5).
This study uses seven biological and physical variables for quantitative classification according to the situation of the study area. The coastline type, relief, natural habitats, wind exposure, wave exposure, surge data and sea level change are selected as input parameters of the model. These parameters used for calculation were graded and assigned from low to high for calculating the physical exposure index of each section of the coastline. The average geometric method was used to calculate the CEI of each shore point. The specific equation is as follows:
C E I = ( i = 1 n R i ) 1 n
where R is the rank of the variable and n is the number of variables. The CEI is the geometric mean of geomorphology, relief, habitats, wind exposure, wave exposure, surge data and sea level change.

2.4. Spatial Autocorrelation Analysis

Spatial autocorrelation is an important indicator that reflects the correlation between a certain geographic phenomenon or a certain attribute value on a regional unit and the same phenomenon or attribute value on adjacent regional units. It measures the degree of value aggregation in the spatial domain [48]. Spatial autocorrelation analysis can reveal deep geographic information and highlight the characteristics of spatial data distribution. It can be divided into global spatial autocorrelation and local spatial autocorrelation analysis (LISA) [49].
Global spatial autocorrelation is a method to test the relevance of observed values between features with spatial location and their adjacent spatial points. The Moran’s I is generally used to analyze the spatial correlation and spatial variability of the whole region, as described in Equation (2).
I = n i = 1 n j = 1 n w i j ( X i X ¯ ) ( X j X ¯ ) i = 1 n j = 1 n w i j i = 1 n ( X i X ¯ ) 2
where n is the number of space observation objects in the study area; X i and X j are the values of the i-th and j-th observation objects at the spatial position, respectively; X is the average observation value of all objects; w i j is the spatial weight matrix, representing the adjacency relationship between the i-th and j-th observation objects. If objects i and j are adjacent, w i j = 1 ; if they are not adjacent, w i j = 0 . The value range of Moran’s I is between 1 and −1. Specifically, I > 0 means spatial positive correlation, indicating that the research objects have agglomeration in space; the larger the value, the more obvious the spatial positive correlation. I < 0 means spatial negative correlation, indicating that the research object is discrete in space; the smaller the value, the greater the spatial difference. I = 0 means that the research objects are randomly distributed and irrelevant [50].
Global spatial autocorrelation reveals whether the research object is spatially correlated, while local spatial autocorrelation analysis (LISA) focuses on the correlation degree between a certain area in the research area and its adjacent areas. LISA can more accurately grasp the agglomeration and differentiation characteristics of local spatial elements. Equation (3) gives the calculation process of local Moran’s I, where the meaning of each variable is the same as Equation (3) [51].
I = j = 1 , j i n w i j ( X i X ¯ ) ( X j X ¯ ) i = 1 n ( X i X ¯ ) 2
The spatial autocorrelation analysis of the final output results of the coastal vulnerability model was conducted in the software GeoDa 1.18. First, the global autocorrelation analysis was performed to test whether Jiaozhou Bay had significant spatial aggregation in each period. Then, LISA was used to determine the degree of spatial heterogeneity of coastal vulnerability.

3. Results

The spatial distribution characteristics of coastal vulnerability in Jiaozhou Bay were obtained, based on the coastal exposure index (CEI) in 1984, 2000 and 2020. The spatial autocorrelation analysis was carried out by GEODA to analyze the aggregation characteristics of coastal vulnerability.

3.1. Spatial Distribution Characteristics of Coastal Vulnerability

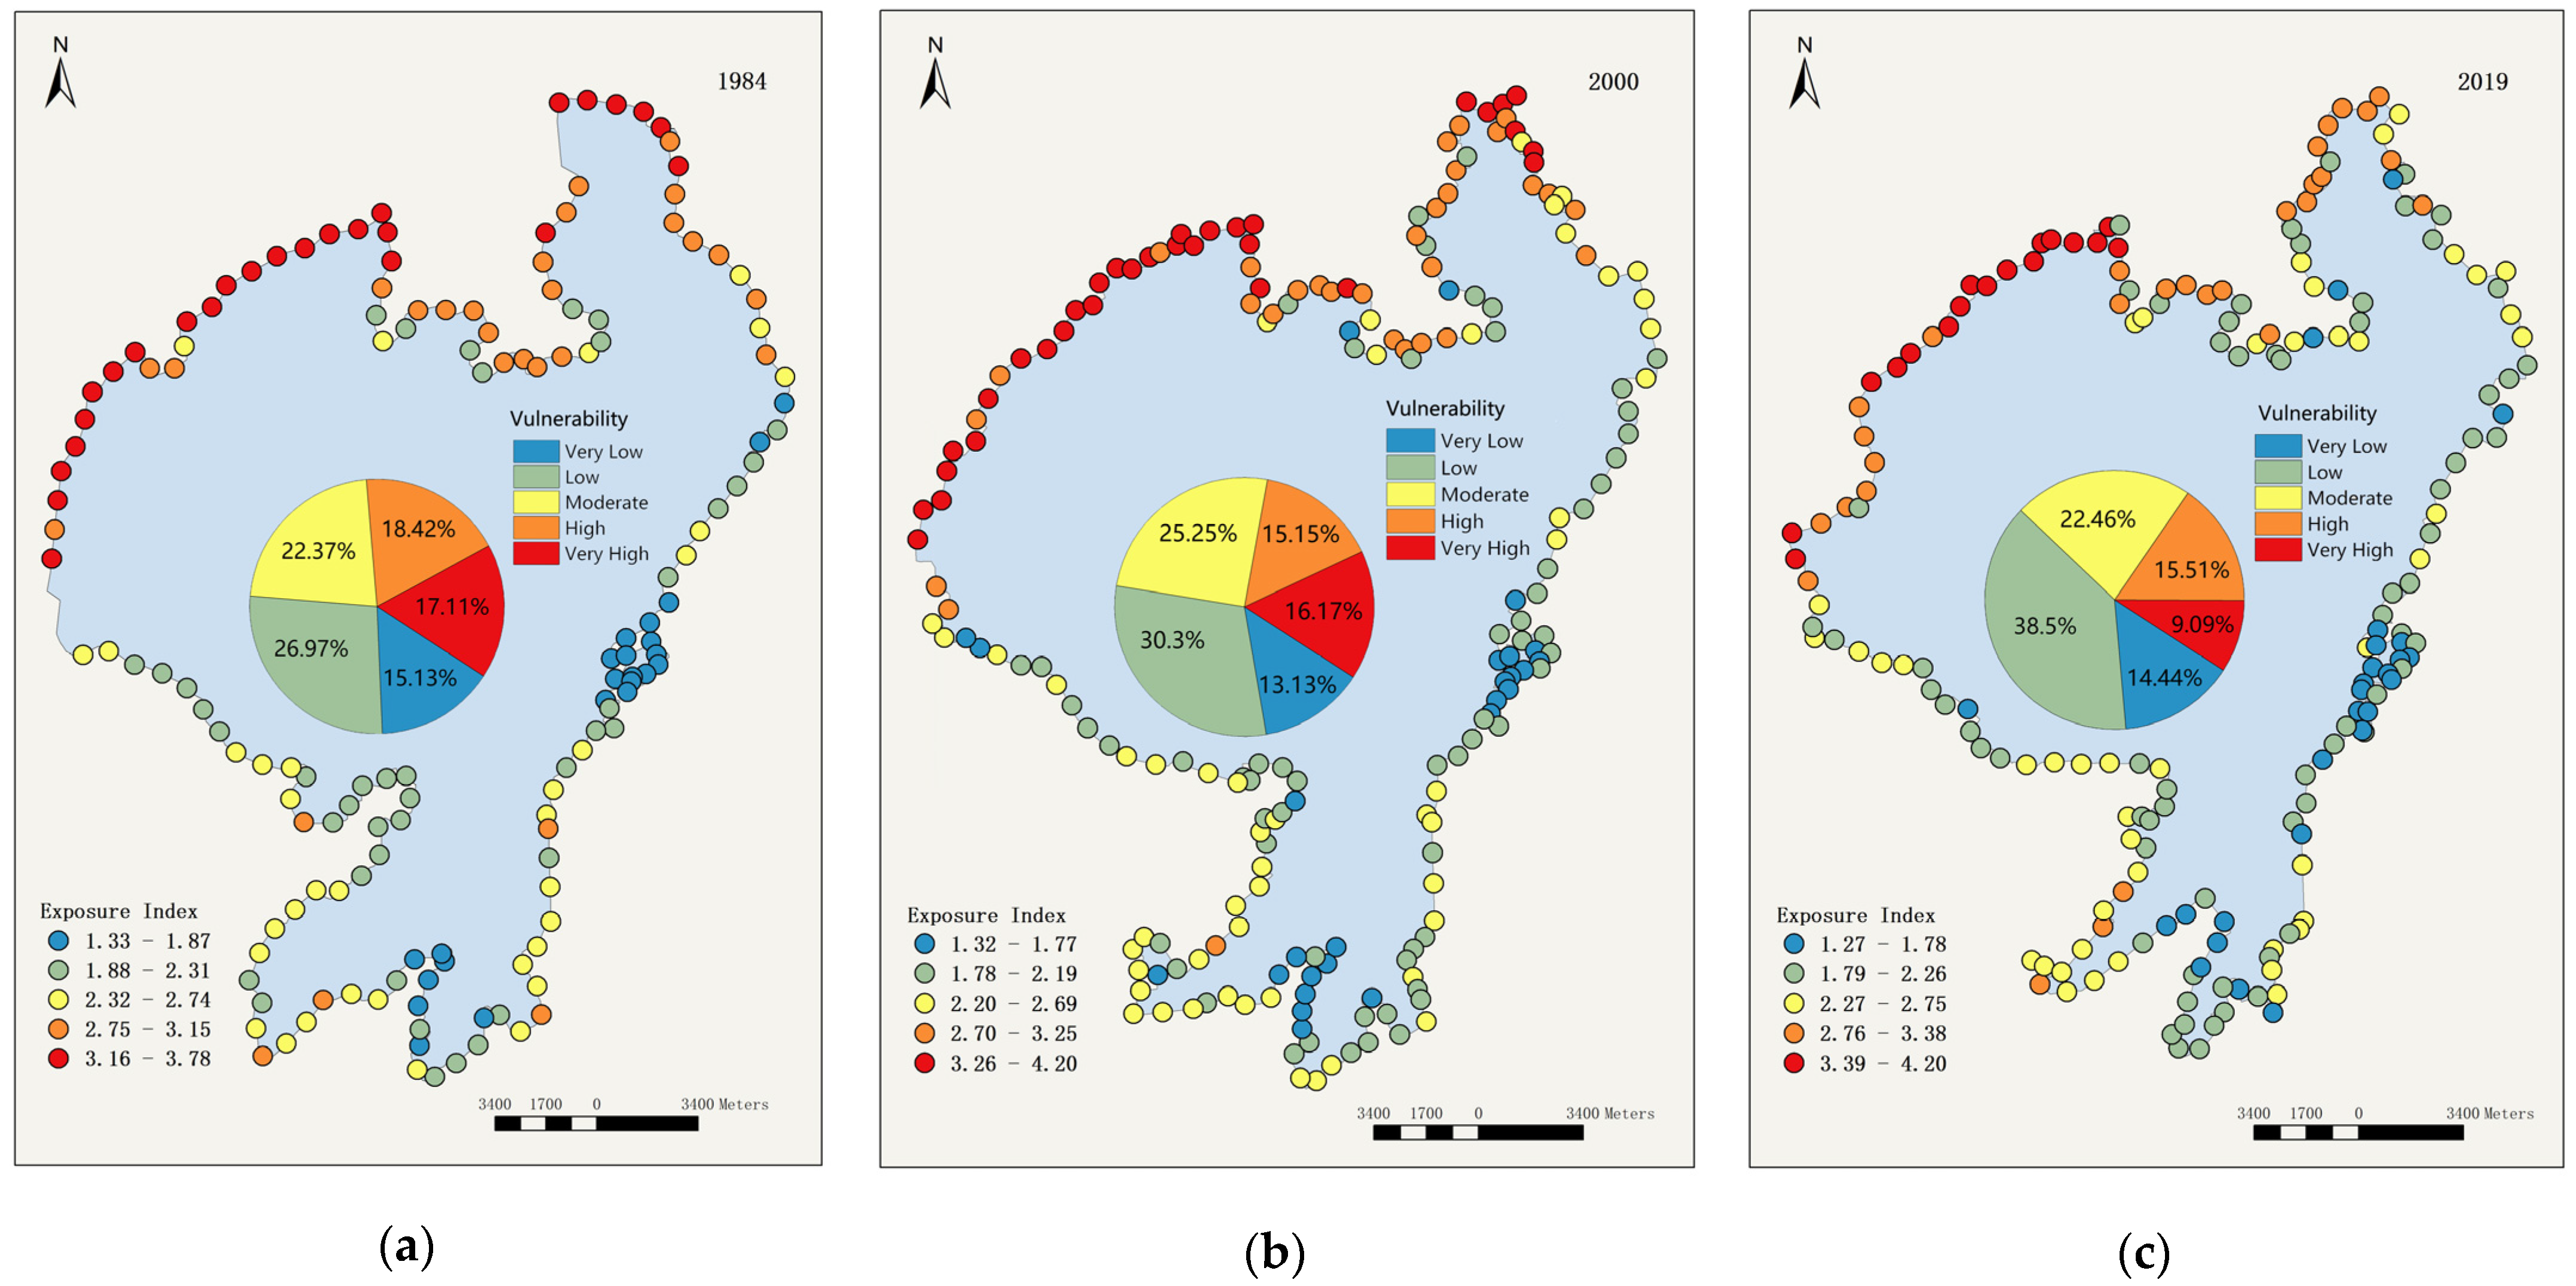
Based on the InVEST coastal vulnerability model, a quantitative assessment of the impact of storms and strong wave erosion was carried out on the coast of the Jiaozhou Bay in 1984, 2000 and 2019. At present, there is no unified standard for coastal vulnerability assessment. Therefore, the natural breakpoint method was used to classify the CEI of Jiaozhou Bay in 1984, 2000 and 2019 from low to high into five grades. The corresponding vulnerability degrees were classified into the following ranks: very low, low, moderate, high and very high.
From Figure 4a to Figure 4c, the distribution location of CEI in Jiaozhou Bay in 1984, 2000 and 2019 was roughly the same. The areas with high exposure were mainly distributed on the north shore of Jiaozhou Bay. In addition to the low exposure along Hongdao, the exposure in Chengyang District and Jiaozhou city was relatively high. The low exposure areas were distributed in the southern and eastern coastal areas of the Jiaozhou Bay, mainly distributed in some areas with relatively developed urbanization in Huangdao District and Shibei District. Shore points with a low exposure index accounted for the most, while those with a high exposure index decreased in the last three years. It was indicated that Jiaozhou Bay is not very fragile and less prone to be flooded by storms and floods. It can almost resist natural disasters such as storm surges.
In 1984, the average CEI of Jiaozhou Bay was 2.52. The proportion of shore points with a very high exposure index was 17.11%, mainly distributed in some estuaries north of Jiaozhou Bay and along the coast of aquaculture ponds. The shore points with a high exposure index were relatively scattered and distributed along the coast of Hongdao in the northern part and the coast of Huangdao in the southern part of Jiaozhou Bay. The shore points with moderate and low exposure index were located along the coast of Huangdao District. The shore points with a very low exposure index were distributed in the south and east of Jiaozhou Bay, mainly along the coast of Victoria Bay and Xuejiadao Bay in Huangdao District and Qingdao port in Shibei District.
In 2000, the average CEI of Jiaozhou Bay was 2.46. The proportion of shore points with a very a high exposure index was 16.67%. The distribution position was roughly the same as in 1984, but the number of shore points increased. The coastal points with a high exposure index tended to distribute northward gradually, and the shore point of Licang District in the northeast of Jiaozhou Bay changed from a high exposure index to a moderate exposure index.
In 2019, the average CEI of Jiaozhou Bay was 2.39. The proportion of shore points with a very high exposure index was 9.09%, which was much lower than that in 1984 and 2000. Its exposure index and vulnerability were reduced mainly due to the artificial transformation of the Yuejin River along the coast of Jiaozhou City. The estuaries of Yuejin River in the east, Yangmaogou River and Moshui River in the north have gathered shore points with a high exposure index. The distribution location of shore points with moderate, low and very low exposure index is not much different from that in 2000.

3.2. Spatial Aggregation Characteristics of Coastal Vulnerability

The global autocorrelation analysis and local autocorrelation analysis of CEI in 1984, 2000 and 2019 were carried out to explore the spatial aggregation characteristics of coastal vulnerability in Jiaozhou Bay.

3.2.1. Global Spatial Autocorrelation Analysis

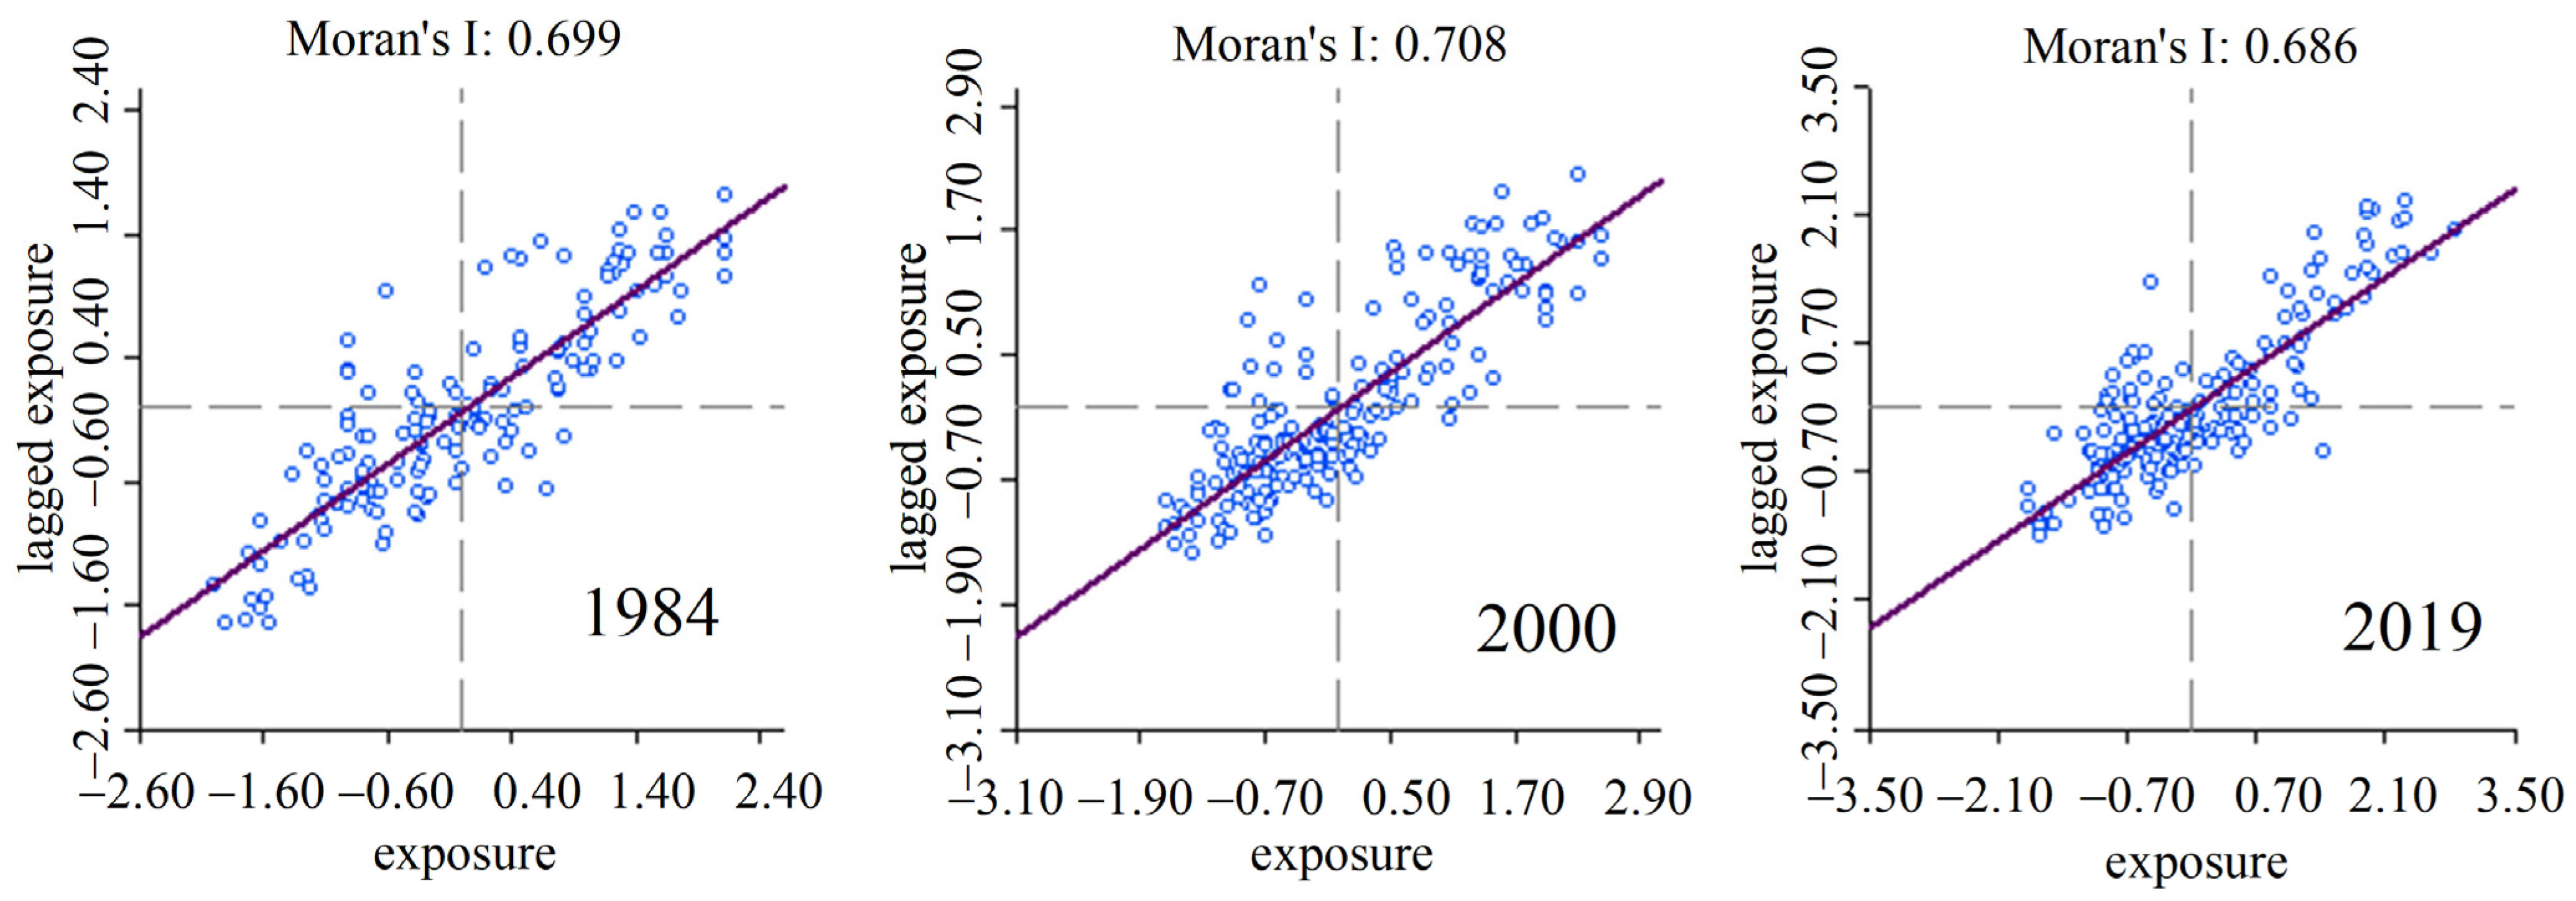
In this section, Queen spatial weight matrix was created and global spatial autocorrelation analysis of Jiaozhou Bay coastal vulnerability in 1984, 2000 and 2019 was performed using Geoda. Global Moran’s I for each year was calculated, and the significance of the index value was tested. The results are shown in Table 6 and Figure 5.
According to Table 6 and Figure 5, the Moran’s I of the Jiaozhou Bay coastal vulnerability in 1984, 2000 and 2019 are 0.699, 0.708 and 0.686, respectively. It is indicated that the CEI in 1984, 2000 and 2019 showed significant spatial autocorrelation since the Moran’s I are greater than 0 and close to 1. When interpreting the Moran index, it is necessary to have a p-value and a Z score to determine. The null hypothesis is established in advance, which means that “the statistical spatial elements are randomly distributed”. When p is very small, the observed spatial pattern is unlikely to arise from a random process (small probability event) and therefore can reject the null hypothesis, which means the degree of aggregation is not randomly distributed. The z-values of the three phases are greater than the critical value (2.580) and pass the significance test of α = 0.01 [52,53]. It can be said that 99% of CEI is spatial aggregation distribution, indicating a significant spatial positive correlation in the CEI of the Jiaozhou Bay during the study period. That is, areas with high coastal vulnerability have high coastal vulnerability in their surrounding areas. Conversely, areas with low coastal vulnerability have low coastal vulnerability in surrounding areas. These explain that the overall coastal vulnerability of each city in Jiaozhou Bay presents an obvious spatial clustering distribution.

3.2.2. Local Spatial Autocorrelation Analysis

Although the global autocorrelation analysis shows that the coastal vulnerability is agglomerated as a whole in Jiaozhou Bay, it does not explain the specific aggregation pattern of the vulnerability in each area and the differences and impacts between adjacent shore points. Therefore, it is necessary to carry out further local spatial autocorrelation analysis. The LISA map can show the spatial agglomeration characteristics of the CEI in Jiaozhou Bay. In this study, three LISA maps in 1984, 2000 and 2019 were calculated and each shore point is rendered from one color, where “Not Significant” means that its spatial autocorrelation is not obvious; “High-High” aggregation means that the exposure index of the neighboring shore points around the high exposure is also high; “Low-Low” aggregation means that the exposure index of the neighboring shore points around the low exposure is also low; “Low-High” aggregation means that the exposure index of neighboring shore points with low exposure is high, which indicates a negative correlation; and “High-Low” aggregation means that the exposure index of the neighboring points with high exposure is low. Figure 6 and Table 7 show the detailed distribution of each type of shore point.
According to Figure 6 and Table 7, the spatial association and dynamic changes of coastal vulnerability in Jiaozhou Bay are analyzed:
  • In 1984 and 2000, the “H-H” shore points were mainly distributed at the estuary of northern Jiaozhou Bay and along the coast of the aquaculture pond, accounting for about 19% of all shore points. The “H-H” type shores at the estuary decreased greatly in 2019, and only gathered along the aquaculture pond in Chengyang District. Combined with Figure 4, the shore points with a high exposure index increased and then decreased, and maintained a dynamic balance from 1984 to 2000. Since 2000, the shore points with a high exposure index reduced gradually with the acceleration of urbanization, river reconstruction and dam construction.
  • The shore points of the “L-L” account for about 20% of the total number, mainly concentrated on the southern and eastern coasts of the Jiaozhou Bay. From 1984 to 2000, the number of “L-L” type shore points along the southern and eastern coasts of Jiaozhou Bay increased, closely related to population increase and urban expansion. From 2000 to 2019, the “L-L” type of shore points in Huangshanzui in the eastern part of Huangdao District gradually decreased, and there was one “H-L” type of shore point in 2019. This may be due to the relatively gentle natural slope of Huangshanzui, which makes it vulnerable to storm surges and thus has a higher exposure index.
  • There was only one shore point showing the “L-H” type in 1984, located on the west side of Hongdao. “L-H” shore point increased to five in 2000, which was mainly located on the west and northeast sides of Hongdao and along the coast of Huangdao. From 2000 to 2019, the “L-H” type of shore points remained stable. The construction of aquaculture ponds with special structures can resist the erosion of tides and floods. The exposure index of some shore points is reduced, and the vulnerability is decreased.
Overall, the “Not Significant” shore points in Jiaozhou Bay exceed 50%, and the shore points of the “H-H” and “L-L” reach more than 34%. The shore points of the “L-H” and “H-L” are almost non-existent and account for less than 1%, which indicates that the spatial heterogeneity of the coastal vulnerability in Jiaozhou Bay is very small.

4. Discussion

This study used the GIS-based CEI method to evaluate the relative impact of biophysical variables such as geomorphology, relief (coastal elevation), natural habitats, SLR, wind–wave exposure and surge potential. Multiple indicators are used to evaluate the vulnerability of each coastline, and the temporal and spatial distribution and aggregation characteristics of coastal vulnerability are discussed. Through comparison, it can be found that this study uses more indicators, higher data accuracy and more comprehensive analysis than other studies to evaluate the coastal vulnerability of Jiaozhou Bay, which provides insight into the vulnerability of Jiaozhou Bay’s coastal areas.
There are some differences in the coastal vulnerability between the south and the north in Jiaozhou Bay. Therefore, the influencing factors causing the vulnerability difference between the north and the south are analyzed. At the same time, there are some errors in the experimental results. The error is analyzed for improvement in subsequent research.

4.1. Analysis of Influencing Factors on Coastal Vulnerability in Jiaozhou Bay

It can be found that the north of Jiaozhou Bay is an area where the coastal vulnerability is high and the high exposure index is relatively aggregated. At the same time, the south is an area where the vulnerability is low and the low exposure index is relatively aggregated by analyzing the spatial distribution and aggregation characteristics of coastal vulnerability in Jiaozhou Bay. The reasons for the formation of this north–south difference can be analyzed from two aspects: natural factors and social development.

4.1.1. Natural Factors

  • The type of habitat and coastline
Habitat and coastline are important parts of the coastal zone, and their influence on coastal exposure is very important [54]. If the coastline is composed of many rocks, low in exposure and high in relief, it can reduce the erosion of waves on the coast. However, the coastline composed of beaches, high in exposure and low in relief, has little effect on reducing the impact of wind and waves. All kinds of habitats, whether along the coastline or in the water, have more or less protective effects on the coast. For example, mangroves can effectively reduce the erosion of wind and waves. Although seagrass will float with wind and waves, it still has a certain protective effect.
There are large areas of sandy beaches in the northern part of Jiaozhou Bay, and large areas of aquaculture ponds are distributed along the coast of Chengyang District. Hence, the coastal exposure index in this area is relatively high. The southern part of Jiaozhou Bay is covered by construction land and embankments. There are many industrial lands along the coast, and the shape of the coastline tends to be straight. The government has issued more shoreline protective measures to safeguard the industrial lands. Therefore, the area is more prone to resist wind and wave erosion, and the exposure index is low [55].
2.
Elevation and distance to continental shelf
The land elevation and distance to continental shelf can act in tandem with the coastal vulnerability. Elevation is an important factor affecting the vulnerability of the coast. The lower the elevation, the more vulnerable to wind and wave erosion and the threat of flooding, which leads to higher vulnerability [56]. The north and northwest of Jiaozhou Bay are plains, the east is the Laoshan Mountain, and the south and southwest are the Xiaozhu Mountain. Therefore, the northern part of Jiaozhou Bay has a higher vulnerability, while the southern part has a lower vulnerability.
The continental shelf refers to the land that extends along the coast of the continent to the ocean and is covered by the sea. In general, the farther the coast is from the continental shelf with the slower slope of the coast, the greater the storm surge impact on the coast (Figure 7). The coast slope close to the continental shelf is steep, and the possibility of being submerged in storm surges is much smaller (Figure 8). The north and west of Jiaozhou Bay are far away from the continental shelf, so they are more affected by storm surges and tides and the exposure index is higher. The south and east are closer to the continental shelf, so the exposure index is lower [57].

4.1.2. Socio-Economic Factors

Taking the population distribution data of Jiaozhou Bay in 2019 as an example (Figure 9), the Shibei and the Shinan District have the largest population, followed by the east of Huangdao District. The above data are from the website of World Pop [58]. The dense population is indispensable for a developed economy and convenient transportation. The constructions of embankments, high buildings, railway stations and airports are built in dense population areas. The existence of such important infrastructure promotes investments and the development of coastal protection. The coastlines are better protected and the vulnerability is lower. The shore points with a low exposure index are gathered here, and the coast is low in vulnerability. The coastal economic development of Chengyang District relies on aquaculture, with low construction intensity and weak human activities. Coupled with the implementation of environmental protection policies, the coast has a high degree of naturalness and high vulnerability.

4.2. Error Analysis

The coastal vulnerability of Jiaozhou Bay will be affected by many factors under actual conditions. Some errors in the experimental process will directly or indirectly affect the accuracy of the experimental results.
This paper analyzes and discusses the original experimental data based on the experimental data and experimental process. It can be concluded that Jiaozhou Bay is affected by long-period waves or swells generated by long-distance storms. The wind and wave data from WAVEWATCH III are provided by the InVEST model [37]. Through error analysis, it can be seen that WAVEWATCH III has a good effect on global wave simulation and can fully meet the requirements of experimental accuracy, which is widely used in the InVEST coastal vulnerability model [24,59]. However, the same global wind and wave data set is used for the three experimental scenarios, but the differences of wind and wave patterns in three different periods are not considered. The impact of changes in wind and wave patterns on coastal vulnerability is ignored, which slightly impacts the accuracy of the results.
The coastal vulnerability model calculates the CEI by combining the levels of up to seven biological and physical variables at each coast point. The levels of biological and physical variables range from very low exposure (level = 1) to very high exposure (level = 5) based on user-defined and model-defined criteria [37]. Therefore, the model’s limitations are that the dynamic interaction of complex coastal processes in an area is oversimplified to the average of seven variables and exposure. There is no accurate simulation of coastal storm surges, floods and other disaster conditions. It cannot be used to quantify the exposure to erosion and inundation of a specific coastal location. The coastal vulnerability can only be qualitatively evaluated to some extent [60]. Therefore, although the model is scientific in evaluating coastal vulnerability, there are also certain limitations. The scientific community determines the vulnerability of a shore point in the study area based on the calculation results of CEI. The higher the CEI value, the higher the vulnerability of the coastal zone. The InVEST coastal vulnerability model is still widely used to assess coastal vulnerability, which can provide guidance for regional coastal zone protection and future development planning.

4.3. Suggestions on the Protection of Jiaozhou Bay Coastal Zone

Jiaozhou Bay is not only Qingdao’s “mother bay” but also an important support for Qingdao to play its local advantages fully and realize the economic take-off, which has made great contributions to Qingdao’s economic development. In recent years, due to human development activities, marine pollution, climate change and other factors, the coastal ecosystem of Jiaozhou Bay has been damaged or even degraded. The north of Jiaozhou Bay is an area with high coastal vulnerability and relatively concentrated high CEI. At the same time, the south is an area with low vulnerability and relatively concentrated low CEI. Different targeted protection measures are taken according to the different coastal vulnerability of different regions in Jiaozhou Bay.
For areas with high vulnerability in the northern coastal zone, we should improve the natural disaster forecasting function and optimize the coastline renovation and restoration technology. Highly vulnerable coastlines should be renovated and repaired. Then, projects such as beach restoration and maintenance, coastal wetland vegetation planting and restoration, and coastal ecological corridor construction should be arranged. There are many aquaculture areas in the north, and it is necessary to control the reclamation of tidal flats. In moderation, the shrimp ponds, fish ponds and salt fields that have lost their economic value should be returned to the sea. The natural coastlines, which have intact natural forms, ecological functions and significant resource value, should be strictly protected. The infrastructure to cope with natural disasters such as storm surges must be built. For areas with low vulnerability in the southern coastal zone, we should strengthen the protection of Jiaozhou Bay and enhance the ability to prevent natural disasters. The government should continue to increase pollution control and governance along the coast of Jiaozhou Bay, and protect the offshore waters and coastlines. The greatest efforts should be made to maintain the ecological balance and sustainable utilization of Jiaozhou Bay.
At the same time, the impact of sea level rise caused by climate change on the coastal environment in Jiaozhou Bay is quite serious. Therefore, we must take preventive measures. First of all, we should control greenhouse gas emissions and change the unreasonable energy structure in time, so as to control the growth of carbon dioxide discharged from fossil fuels into the atmosphere and slow down the rate of climate warming. Secondly, due to years of disrepair, the dampproof capacity of many existing dams has been greatly reduced, and can no longer adapt to the impact of the tide when the sea level rises. Therefore, the existing embankment must be reinforced, raised or reconstructed. Then, in coastal areas, in addition to protecting the existing forests, we should also widely plant trees, strengthen the construction of protective forests and increase the forest coverage, so as to delay the rise of the sea level and reduce the harm of natural disasters. Finally, the severely damaged areas should be repaired in time. Restoration projects should focus on natural habitat restoration and give priority to ecological protection. Nature-based solutions (NBS) are mainly used to build sustainable towns, repair ecosystems and mitigate climate change [61]. They have become a concept and method to use nature to face the sustainable development challenges. Using NBS, the government should formulate the coastal restoration strategy and coastal management strategy of imitating nature design, so as to solve the ecological and environmental problems faced by the coastal zone of Jiaozhou Bay. That can provide new ideas for improving the toughness and sustainability of the coastal zone.

5. Conclusions

This paper analyzes the distribution and aggregation characteristics of coastal vulnerability in Jiaozhou Bay in 1984, 2000 and 2019 from the two aspects, including CEI and spatial autocorrelation, based on the InVEST model. It discusses the factors affecting its coastal vulnerability and the limitations of this study. Combined with various data and analysis methods, the development trend and status quo of coastal vulnerability in Jiaozhou Bay is discussed more comprehensively and deeply, providing theoretical support for the in-depth understanding of coastal vulnerability and ecological protection in Jiaozhou Bay. The conclusions are as follows:
  • The CEI of Jiaozhou Bay in 1984, 2000 and 2019 are generally low, indicating that the coastal vulnerability of Jiaozhou Bay is small and less affected by natural disasters. The area with a high exposure index is mainly located in Chengyang District, north of Jiaozhou Bay. The area with a low exposure index is located in Huangdao and Shibei District in the south of Jiaozhou Bay. Urban construction promotes the improvement of important infrastructure, and promotes investments and the development of coastal protection. The coastlines are better protected and the vulnerability is lower. Overall, the coastal vulnerability of Jiaozhou Bay gradually decreased from 1984 to 2019 with the acceleration of urban construction.
  • The global autocorrelation analysis shows that the Moran’s I of coastal exposure extent in Jiaozhou Bay in 1984, 2000 and 2019 is greater than 0 and close to 1, which has an obvious spatial positive correlation. The Moran’s I decrease year by year, and the spatial distribution change of coastal vulnerability in Jiaozhou Bay is gradually stable. Through the local spatial autocorrelation analysis, it can be seen from the LISA aggregation map that there are many “Not Significant”, “H-H” and “L-L” types of shore points along the coast of Jiaozhou Bay. There is no obvious heterogeneity in the spatial distribution of the coastal vulnerability in Jiaozhou Bay.
  • There are differences in vulnerability between the north and south of Jiaozhou Bay. Coastline and habitat type, elevation and distance to continental shelf, and socio-economic factors are the main influencing factors. There are many aquaculture ponds in the north of Jiaozhou Bay. The terrain is flat and far from the continental shelf, so the vulnerability is high. In the south, many embankments are distributed in mountainous areas and are close to the continental shelf. The large population and rapid urban development have promoted infrastructure construction, such as embankments, high buildings, railway stations and airports. The investments and development of coastal protection are promoted, so the vulnerability is low.
  • This study is affected by some aspects, which have a slight impact on the experiment results. For example, the differences between wind–wave data sets in different periods are not considered and the InVEST coastal vulnerability model has certain limitations. In the future, we will further supplement and collect relevant data in order to conduct a more comprehensive assessment of the coastal vulnerability in Jiaozhou Bay.
  • This study puts forward specific suggestions for coastal zone protection and urban planning and construction in Jiaozhou Bay. It provides theoretical support for follow-up Jiaozhou Bay coastal zone management and sustainable development and has the directive function for future coastal research.

Author Contributions

Conceptualization, B.A. and Y.G.; methodology, software, validation, formal analysis, investigation, resources, data curation, B.A., Y.T., P.W., Y.G. and F.L.; writing—original draft preparation, Y.T., P.W. and Q.S.; writing—review and editing, B.A. and F.L. All authors have read and agreed to the published version of the manuscript.

Funding

This research was funded by the National Natural Science Foundation of China (Grant No. 62071279) and the Open Fund of Key Laboratory of Urban Land Resources Monitoring and Simulation, Ministry of Natural Resources (Grant No. KF-2019-04-070), the SDUST Research Fund: No. 2019TDJH103.

Institutional Review Board Statement

Not applicable.

Informed Consent Statement

Not applicable.

Data Availability Statement

Not applicable.

Conflicts of Interest

The authors declare no conflict of interest.

References

  1. Zhu, Z.T. Study on Assessment Modeling of Coastal Vulnerability to Erosion and Its Application. Doctoral Dissertation, East China Normal University, Shanghai, China, 2019. [Google Scholar]
  2. Bruno, M.F.; Motta Zanin, G.; Barbanente, A.; Damiani, L. Understanding the Cognitive Components of Coastal Risk Assessment. J. Mar. Sci. Eng. 2021, 9, 780. [Google Scholar] [CrossRef]
  3. Swaney, D.P.; Humborg, C.; Emeis, K.; Kannen, A.; Silvert, W.; Tett, P.; Pastres, R.; Solidoro, C.; Yamamuro, M.; Henocque, Y.; et al. Five critical questions of scale for the coastal zone. Estuar. Coast. Shelf Sci. 2012, 96, 9–21. [Google Scholar] [CrossRef] [Green Version]
  4. Lin, N.; Shullman, E. Dealing with hurricane surge flooding in a changing environment: Part I. Risk assessment considering storm climatology change, sea level rise, and coastal development. Stoch. Environ. Res. Risk Assess. 2017, 31, 2379–2400. [Google Scholar] [CrossRef] [Green Version]
  5. Zhao, W.D.; Zhang, Z.; Gu, D.M. Coastal Zone Change and Storm Surge Risk Assessment in Wenzhou. Trans. Oceanol. Limnol. 2020, 4, 53–60. [Google Scholar]
  6. IPCC CZMS. A Common Methodology for Assessing Vulnerability to Sea-Level Rise; Intergovernmental Panel on Climate Change Response Strategy Working Group, Transport, Public Works and Water Management: The Hague, The Netherlands, 1992. [Google Scholar]
  7. Klein, R.; Nicholls, R. Assessment of Coastal Vulnerability to Climate Change. Ambio 1999, 28, 182–187. [Google Scholar]
  8. Day, M. Design(ing) Strategies for a Sustainable and Resilient Coastal Beachfront Community. Master’s Thesis, University of Illinois at Urbana-Champaign, Champaign, IL, USA, 2011. [Google Scholar]
  9. Birch, T.; Reyes, E. Forty years of coastal zone management (1975–2014): Evolving theory, policy and practice as reflected in scientific research publications. Ocean Coast. Manag. 2018, 153, 1–11. [Google Scholar] [CrossRef]
  10. Harvey, N.; Clarke, B. 21st Century reform in Australian coastal policy and legislation. Mar. Policy 2019, 103, 27–32. [Google Scholar] [CrossRef]
  11. Li, X.; Ye, G.; Zheng, K.Y. Research on Space Control of Qingdao Coastal Zone from the Perspective of National land and Space Planning. Planners 2020, 36, 50–56. [Google Scholar]
  12. Yan, B.Y. Assessment of Socio-Economic Vulnerability of the Megacity of Shanghai to Sea-Level Rise and Associated Storm Surges. Doctoral Dissertation, East China Normal University, Shanghai, China, 2016. [Google Scholar]
  13. Forzieri, G.; Feyen, L.; Russo, S.; Vousdoukas, M.; Alfieri, L.; Outten, S.; Migliavacca, M.; Bianchi, A.; Rojas, R.; Cid, A. Multi-hazard assessment in Europe under climate change. Clim. Change 2016, 137, 105–119. [Google Scholar] [CrossRef] [Green Version]
  14. Cai, R.S.; Tan, H.J.; Guo, H.X. Responses and compound risks of the coastal China areas to global change. J. Appl. Oceanogr. 2019, 38, 514–527. [Google Scholar]
  15. Özyurt, G.; Ergin, A. Improving coastal vulnerability assessments to sea-level rise: A new indicator-based methodology for decision makers. J. Coast. Res. 2010, 26, 265–273. [Google Scholar] [CrossRef]
  16. Zhou, L. Remote Sensing Monitoring of Coastal Change in the Gulf of Thailand and the Coastal Zone Assessment of Vulnerability. Master’s Thesis, Graduate School of Inner Mongolia Normal University, Huhhot, China, 2018. [Google Scholar]
  17. Farhan, A.R.; Lim, S. Improving vulnerability assessment towards Integrated Coastal Zone Management (ICZM): A case study of small islands in Indonesia. J. Coast. Conserv. 2013, 17, 351–367. [Google Scholar] [CrossRef]
  18. Yuan, S.; Zhao, X.; Li, L.L. Combination evaluation and case analysis of vulnerability of storm surge in coastal provinces of China. Haiyang Xuebao 2016, 38, 16–24. [Google Scholar]
  19. Guo, Y.T. Remote Sensing Study on Landscape Ecological Pattern Changes in Shanghai Waters on the North Shore of Hangzhou Bay and Its Ecological Vulnerability Risk Assessment. Master’s Thesis, Shanghai Ocean University, Shanghai, China, 2020. [Google Scholar]
  20. Zhu, Z.T.; Cai, F.; Cao, C. Assessment of island coastal vulnerability based on cloud model—A case study of Xiamen Island. Mar. Sci. Bull. 2019, 38, 462–469. [Google Scholar]
  21. Liu, Y.; Lu, C.; Yang, X. Fine-Scale Coastal Storm Surge Disaster Vulnerability and Risk Assessment Model: A Case Study of Laizhou Bay, China. Remote Sens. 2020, 12, 1301. [Google Scholar] [CrossRef] [Green Version]
  22. Na, A.; Nh, A.; Aaha, B. Coastal erosion vulnerability assessment along the eastern coast of Bangladesh using geospatial techniques. Ocean Coast. Manag. 2021, 199, 105408. [Google Scholar]
  23. Zhang, Z.; Hu, B.Q.; Qiu, H.H. Spatio-temporal Differentiation and Driving Mechanism of Ecological Environment Vulnerability in Southwest Guangxi Karst-Beibu Gulf Coastal Zone. J. Geo-Inf. Sci. 2021, 23, 456–466. [Google Scholar]
  24. Yaprak, O.; Michelle, M.; Francis, O.P. Coastal exposure of the Hawaiian Islands using GIS-based index modeling. Ocean Coast. Manag. 2018, 163, 113–129. [Google Scholar]
  25. Yin, L.T.; Zheng, W.; Gao, M. Coastal vulnerability of Miaodao archipelago based on InVEST model. Mar. Environ. Sci. 2021, 40, 221–227. [Google Scholar]
  26. Yuan, B.J. Qingdao Pier’s History. Qingdao Pict. 2014, 6, 90–91. [Google Scholar]
  27. Sun, L.Y. Impact of Changes in the Intensity of Weather Systems on Fine Time Precipitation Forecast. Master’s Thesis, Ocean University of China, Qingdao, China, 2014. [Google Scholar]
  28. Guancha News. Available online: https://www.guancha.cn/politics/2019_08_10_512991.shtml?s=sywglbt (accessed on 13 May 2022).
  29. Liu, J. Analysis on environmental vulnerability of the coastal zone in Jiaozhou bay. Mar. Environ. Sci. 2016, 35, 750–755. [Google Scholar]
  30. Li, R.B.; Jiang, T.; Zhou, X.Y. Spatial Modeling and Analysis of Habitat Vulnerability in the Coastal Zone of Jiaozhou Bay. J. Shandong Univ. Sci. Technol. (Nat. Sci.) 2014, 33, 65–75, 93. [Google Scholar]
  31. Pang, L.H.; Kong, F.L.; Xi, M. Spatio-temporal changes of ecological vulnerability in the Jiaozhou Bay Coastal Zone. J. East China Norm. Univ. (Nat. Sci.) 2018, 3, 222–233. [Google Scholar]
  32. Wang, Z.C. Studies on Remote Sensing Image Optimal Object Construction Classification Algorithm Based on Jeffries-Matusita Distance and Its Application. Master’s Thesis, Yantai Insititute of Coastal Zone Research, Chinese Academy of Sciences, Yantai, China, 2021. [Google Scholar]
  33. Sun, L. Coastal Ecosystem Health Assessment and Prediction Research of Jiaozhou Bay. Doctoral Dissertation, Ocean University of China, Qingdao, China, 2008. [Google Scholar]
  34. Lin, R.L. The Research on Theory and Strategy of Qingdao Eco-Environment and Landscape Protection. Doctoral Dissertation, Beijing Forestry University, Beijing, China, 2016. [Google Scholar]
  35. Mandelbrot, B.B. The Fractal Geometry of Nature. Am. J. Phys. 1998, 51, 468. [Google Scholar] [CrossRef]
  36. Zhang, H.G.; Huang, W.G.; Li, D.L. The Effect of Spatial Scale of Shoreline Remote Sensing Information and Its Application. In Proceedings of the IEEE International Symposium on Geoscience and Remote Sensing, Denver, CO, USA, 31 July–4 August 2006; IEEE: New York, NY, USA, 2006. [Google Scholar]
  37. Sharp, R.; Douglass, J.; Wolny, S.; Arkema, K.; Bernhardt, J.; Bierbower, W.; Chaumont, N.; Denu, D.; Fisher, D.; Glowinski, K.; et al. VEST 3.9.1 User’s Guide; The Natural Capital Project, Stanford University, University of Minnesota, The Nature Conservancy, and World Wildlife Fund: Stanford, CA, USA, 2020. [Google Scholar]
  38. National Aeronautics and Space Administration. Available online: https://earthdata.nasa.gov/ (accessed on 13 April 2022).
  39. Wang, Z.C.; Gao, Z.Q. Analysis on spatiotemporal characteristics and causes of tidal flat wetland in Jiaozhou Bay from 1987 to 2017 based on land use change. Res. Soil Water Conserv. 2020, 27, 196–201. [Google Scholar]
  40. Jayathilake, D.R.M.; Costello, M.J. A modelled global distribution of the seagrass biome. Biol. Conserv. 2018, 226, 120–126. [Google Scholar] [CrossRef]
  41. Jayathilake, D.R.M.; Costello, M.J. A modelled global distribution of the kelp biome. Biol. Conserv. 2020, 252, 108815. [Google Scholar] [CrossRef]
  42. Zhang, X.; Wang, X.P.; Huang, A.Q.; Li, Y.S.; Zhang, S.; Bai, Y.; Malak, H.; Zhang, J.H. Extraction of complex coastline feature and its multi-year changes in Shandong Peninsula Based on remote sensing image. Trans. Oceanol. Limnol. 2021, 43, 171–181. [Google Scholar]
  43. Hou, X.Y.; Wu, T.; Hou, W.; Chen, Q.; Wang, Y.D.; Yu, L.J. Characteristics of coastline changes in mainland China since the early 1940s. Sci. China Earth Sci. 2016, 59, 1791–1802. [Google Scholar] [CrossRef]
  44. National Marine Data and Information Service. Available online: https://www.webmap.cn/store.do?method=store&storeId=960 (accessed on 13 April 2022).
  45. Chu, L.; Zhang, X.R.; Wang, T.W.; Li, Z.X.; Cai, C.F. Spatial-temporal evolution and prediction of urban landscape pattern and habitat quality based on CA-Markov and InVEST model. Chin. J. Appl. Ecol. 2018, 29, 4106–4118. [Google Scholar]
  46. Gornitz, V.; White, T.W.; Cushman, R.M. Vulnerability of the US to future sea level rise. In Proceedings of the Seventh Symposium on Coastal and Ocean Management, Long Beach, CA, USA, 8–12 July 1991. [Google Scholar]
  47. Hammar-Klose, E.S.; Thieler, E.R. Coastal Vulnerability to Sea-Level Rise: A Preliminary Database for the US Atlantic, Pacific, and Gulf of Mexico Coasts; Data Series No.68; U.S. Geological Survey, Coastal and Marine Geology Program: Woods Hole, MA, USA, 2001.
  48. Kim, M.Y.; Lee, S.W. Regression Tree Analysis for Stream Biological Indicators Considering Spatial Autocorrelation. Int. J. Environ. Res. Public Health 2021, 18, 5150. [Google Scholar] [CrossRef] [PubMed]
  49. Chen, Y. An analytical process of spatial autocorrelation functions based on Moran’s index. PLoS ONE 2021, 16, e0249589. [Google Scholar] [CrossRef] [PubMed]
  50. Li, Z.G.; Wang, M.Y.; Niu, J.Q.; Wang, H. Analysis of the Spatial Pattern Evolution of Cultivated Land in Municipalities Basedon Spatial Autocorrelation Analysis—Luoyang City as an Example. J. Xinyang Norm. Univ. (Nat. Sci. Ed.) 2021, 34, 415–421. [Google Scholar]
  51. Darand, M.; Dostkamyan, M.; Rehmanic, M.I.A. Spatial autocorrelation analysis of extreme precipitation in Iran. Russ. Meteorol. Hydrol. 2017, 42, 415–424. [Google Scholar] [CrossRef]
  52. Neyman, J.; Pearson, E.S. On the problem of the most efficient tests of statistical hypotheses. Philos. Trans Roy. Soc. A 1933, 231, 289–337. [Google Scholar]
  53. Pearson, E.S. “Student” as statistician. Biometrika 1939, 30, 210–250. [Google Scholar] [CrossRef]
  54. Wu, T.; Hou, X.Y. Review of research on coastline changes. Acta Ecol. Sin. 2016, 36, 1170–1182. [Google Scholar]
  55. Yang, L.; Li, J.L.; Huang, R.P. Study on development mechanism of artificial construction landform in Xiangshan harbor coastal zone. J. Ningbo Univ. (Nat. Sci. Eng. Ed.) 2018, 31, 115–120. [Google Scholar]
  56. Zhang, J.C.; Gao, P.; Dong, X.D. Ecological Vulnerability Assessment of Qingdao Coastal Zone Based on Landscape Pattern Analysis. J. Ecol. Rural Environ. 2021, 37, 1022–1030. [Google Scholar]
  57. Yu, Y.J. Integrated Coastal Area and River Basin Management in Jiaozhou Bay. Doctoral Dissertation, Ocean University of China, Qingdao, China, 2010. [Google Scholar]
  58. World Pop. Available online: https://www.worldpop.org/ (accessed on 11 October 2021).
  59. Wu, M.M.; Wang, Y.; Wan, L.Y. Numerical simulation experiments and analysis using WAVEWATCH III in the global ocean. Mar. Forecast. 2016, 33, 31–40. [Google Scholar]
  60. Wang, X.M.; Liu, X.C.; Long, Y.X. Spatial-Temporal Changes and Influencing Factors of Ecosystem Services in Shaoguan City Based on Improved InVEST. Res. Soil Water Conserv. 2020, 27, 381–388. [Google Scholar]
  61. Feng, Z.; Shao, T.Z.; Li, Y.Q.; Zhou, J. Innovative application of nature-based solution (NBS) in restoration project on the west coast of Haikou. Port Waterw. Eng. 2022, S1, 13–20, 30. [Google Scholar]
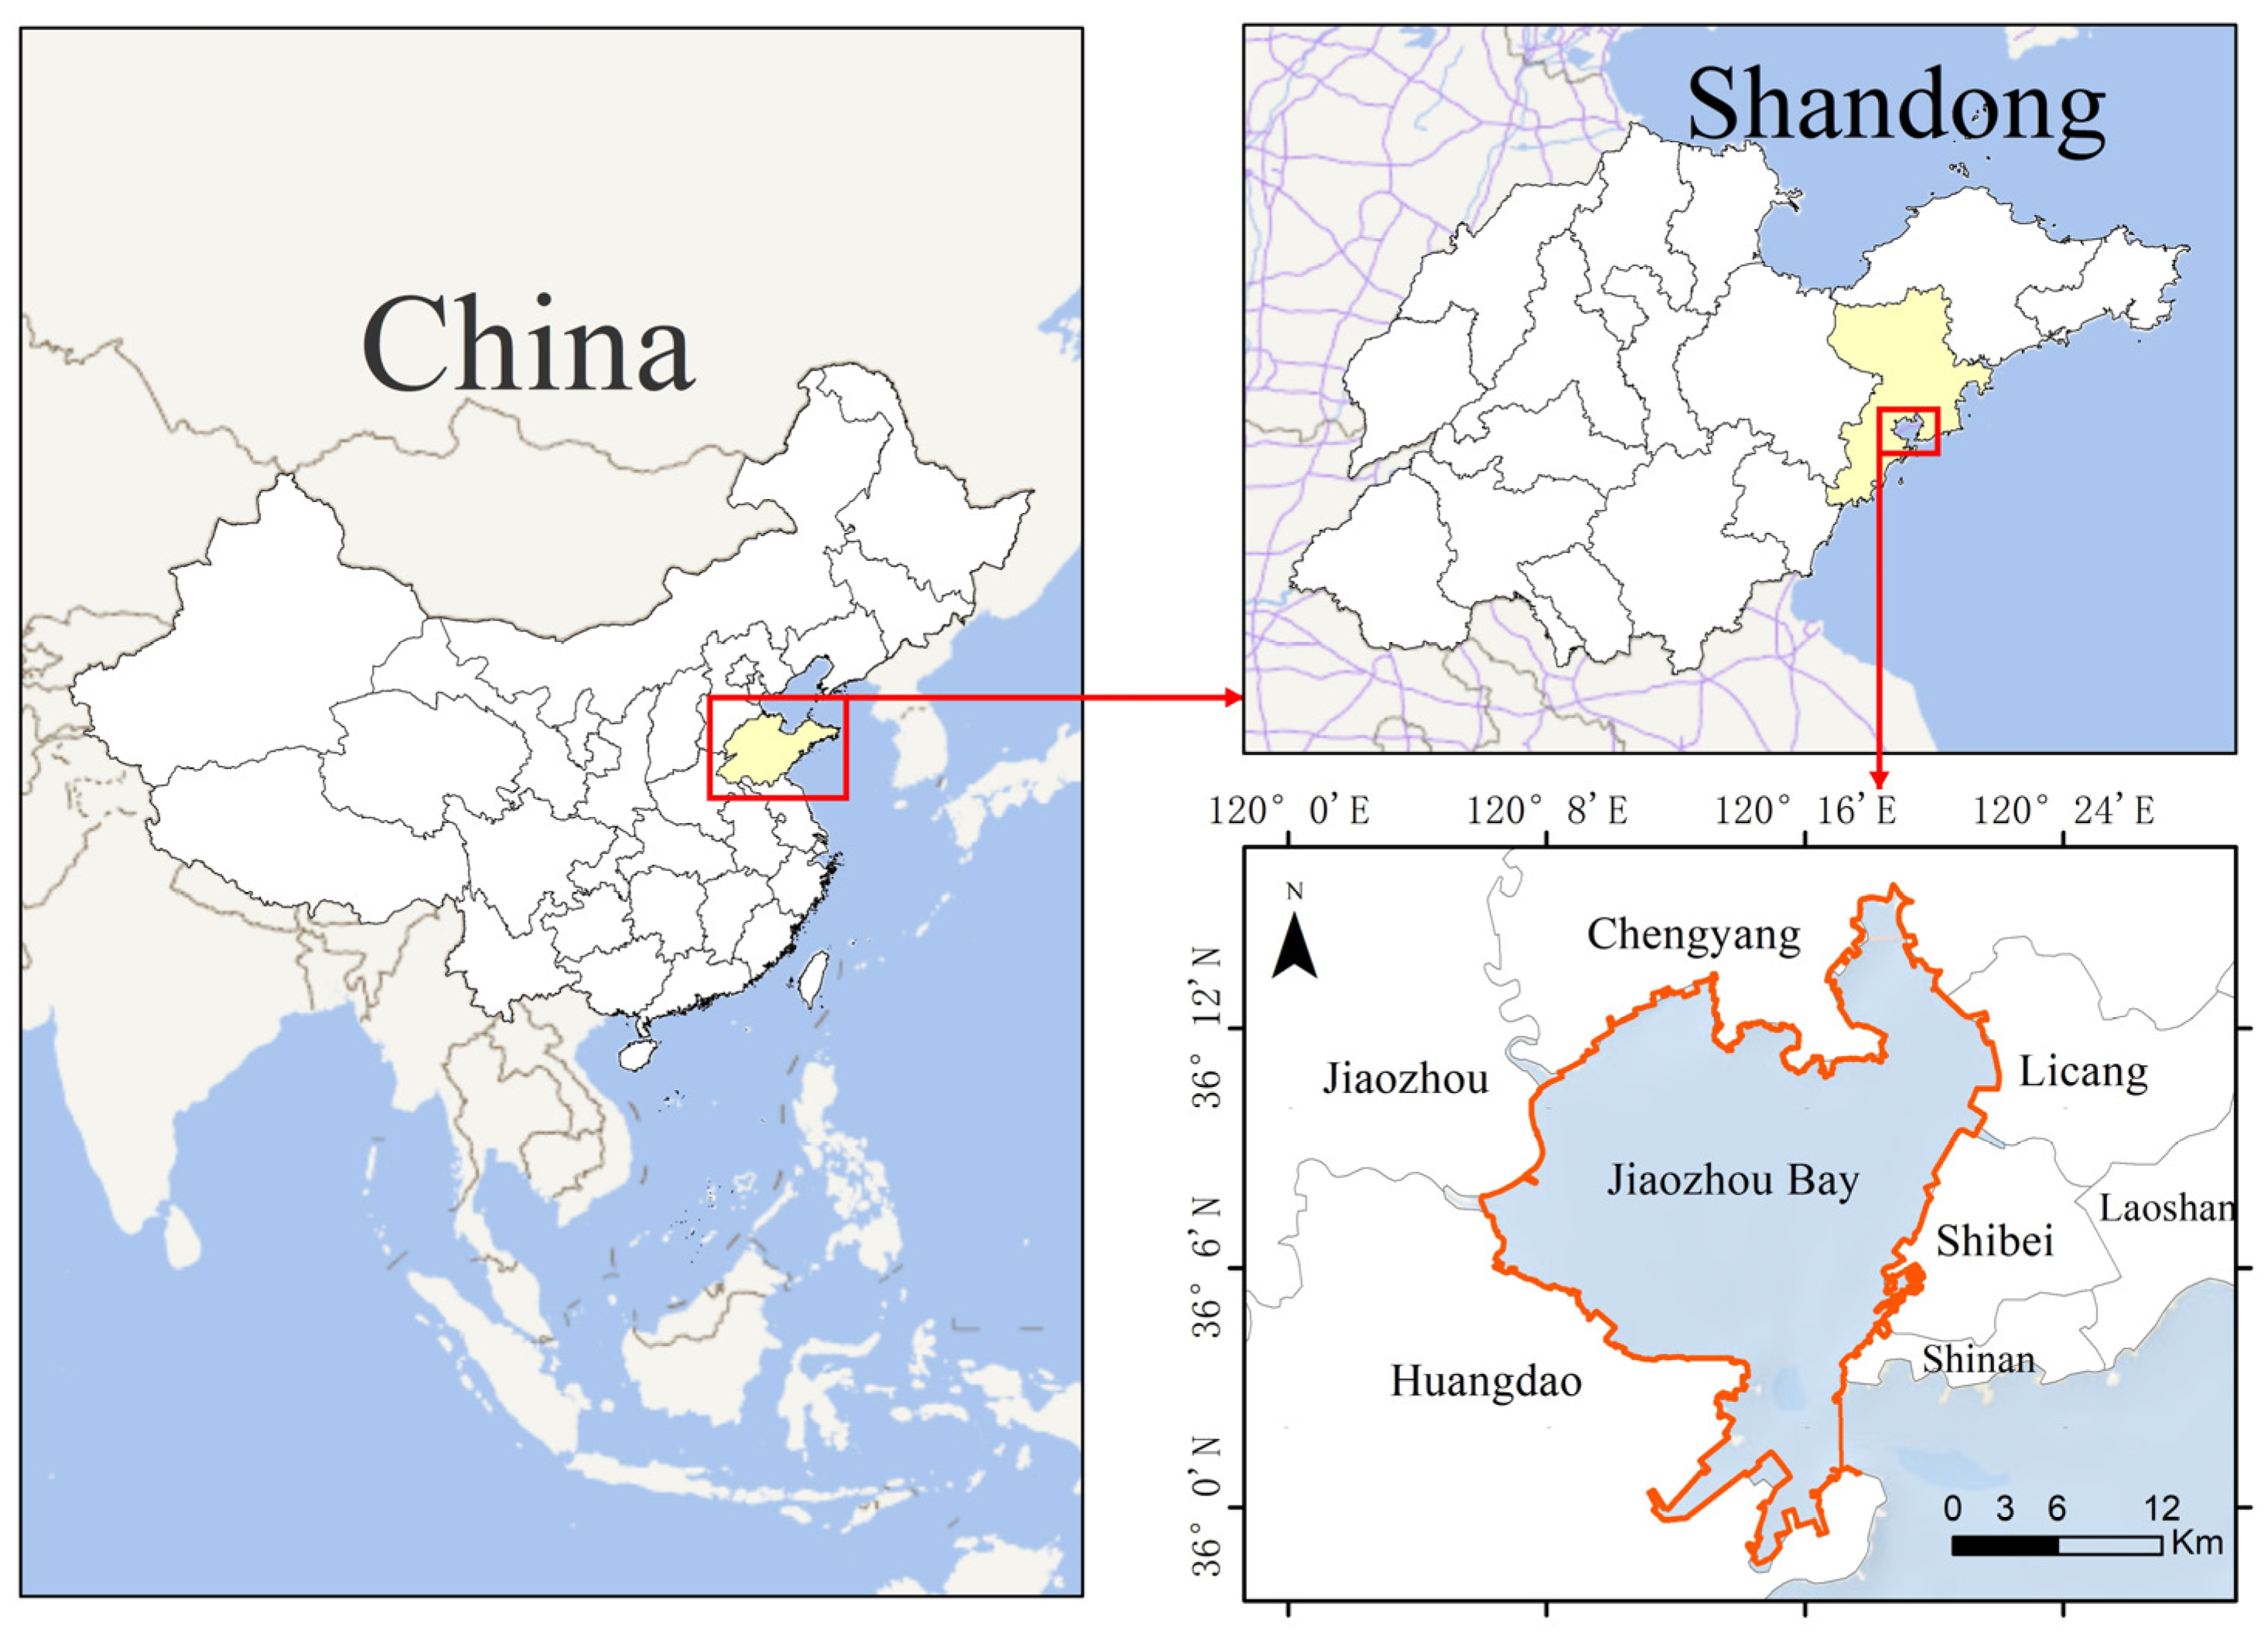
Figure 1. Jiaozhou Bay is a semi-enclosed bay located in the south of Qingdao City, Shandong Province, which is situated in the east of China.
Sustainability 14 06913 g001
Figure 2. The land use types and coastline distribution of Jiaozhou Bay in 2019 are classified by artificial visual interpretation, and the remote sensing images provide a reference for interpretation. (a) The land use types and natural habitats. (b) The coastline distribution.
Sustainability 14 06913 g002
Figure 3. The flow chart of this study.
Sustainability 14 06913 g003
Figure 4. Distribution map of CEI and vulnerability (ac) in 1984, 2000 and 2019.
Sustainability 14 06913 g004
Figure 5. The Moran’s I scatter diagram of coastal exposure in 1984, 2000 and 2019.
Sustainability 14 06913 g005
Figure 6. LISA agglomeration map of exposure index in Jiaozhou Bay in 1984, 2000 and 2019.
Sustainability 14 06913 g006
Figure 7. Shallow continental shelf. The coast is far from the continental shelf with a gentle slope and is greatly affected by storm surges.
Sustainability 14 06913 g007
Figure 8. Steep continental shelf. The coast is close to the continental shelf with a steep slope and is less affected by storm surges.
Sustainability 14 06913 g008
Figure 9. The number of population distribution map of Jiaozhou Bay in 2019.
Sustainability 14 06913 g009
Table 2. Detailed information of satellite remote sensing images.
ImageImaging TimeSpatial ResolutionCoordinate SystemNumber of Scenes
Landsat 4 MSS1984092860 mWGS_1984_UTM_Zone_51N1
Landsat 5 TM2000090830 mWGS_1984_UTM_Zone_51N1
Landsat8 OLI_TIRS2019020130 mWGS_1984_UTM_Zone_51N1
Google1984123115.4 mWGS_1984_Web_Mercator_Auxiliary_Sphere1
200012311.19 mWGS_1984_Web_Mercator_Auxiliary_Sphere6
201905101.19 mCGCS2000_3_Degree_GK_Zone_406
Table 3. Habitat table that is required by the coastal vulnerability model.
Habitat TypeRankProtection Distance (m)
tidal flat33000
kelp44000
seagrass45000
river22000
pond32000
construction11000
impervious surface1500
cropland2500
saltmarsh25000
Table 4. Shoreline geomorphology rankings included in the attribute table of coastline.
Shoreline Geomorphology ClassRank
aquaculture dike3
bedrock coastline1
embankment2
estuary coastline4
harbor and wharf3
sandy coastline5
Table 5. List of bio-geophysical variables and rankings used in the InVEST model.
Rank1 (Very Low)2 (Low)3 (Moderate)4 (High)5 (Very High)
Geomorphologyrocky;
high cliffs;
fjord;
fiard;
seawalls
medium cliff;
indented coast;
bulkheads;
small
seawalls
low cliff;
glacial drift;
alluvial plain;
revetments;
rip-rap walls
cobble beach;
estuary;
lagoon;
bluff
barrier beach;
sand beach;
mud flat;
delta
Relief81% to 100%61% to 80 %41% to 60 %21% to 40 %0% to 20 %
Natural Habitatscoral reef; mangrove;
coastal
forest;
high dune;
marsh
low duneseagrass;
kelp
no habitat
Sea Level Change0% to 20%21% to 40%41% to 60%61% to 80%81% to 100%
Wave
Exposure
0% to 20%21% to 40%41% to 60%61% to 80%81% to 100%
Surge
Potential
0% to 20%21% to 40%41% to 60%61% to 80%81% to 100%
Table 6. Global Moran’s I and test of coastal exposure level in Jiaozhou Bay.
YearMoran’s Iz-Valuep-ValueThreshold (α = 0.01)
19840.69914.09210.0012.580
20000.70816.16240.0012.580
20190.68615.22660.0012.580
Table 7. Local spatial autocorrelation type of exposure index in Jiaozhou Bay.
Type198420002019
NumberProportion
(%)
NumberProportion
(%)
NumberProportion
(%)
H-H2919.083919.703016.04
L-L3321.714020.203418.18
L-H10.6642.0210.53
H-L10.660010.53
Not Significant8857.8911558.0812164.71
Total152100198100187100
Publisher’s Note: MDPI stays neutral with regard to jurisdictional claims in published maps and institutional affiliations.