1. Introduction
The World Health Organization declared a pandemic on 12 March 2020, causing many people to move to remote work [
1]. This decision led to an improvement in the spread of coronavirus infection, but it contributed to an economic crisis that affected all sectors of the economy [
2,
3].
The novelty of this paper is that the coronavirus crisis has improved the economic performance of renewable energy companies. The importance of this paper is to analyze the impact of COVID-19 on the economic performance of companies included in TRBC Industry Name Renewable Fuels. There are many articles proving the necessity of switching to renewable energy, due to its benefits to the economies of the countries and improving the quality of life of the population. There is also a relationship between environmental pollution and the spread of COVID-19 [
4,
5,
6,
7].
A large body of work proves the negative impact of coronavirus infection on the economic performance of companies around the world, due to job losses and reduced demand for products [
8,
9]. In addition, the coronavirus pandemic contributed to the decline in demand for energy, which led to a decline in many firms’ performance in the industry. Restrictions during the first period of the pandemic led to a 15–23% decrease in energy consumption [
10]. During this difficult period for the economies of many countries, the energy industry was just as affected by the lockdown as other areas of production. However, the period of coronavirus infection proved to people the need to protect the environment, so there are predictions of increased demand for renewable energy sources [
2,
5,
6].
The pandemic has affected not only renewable energy companies, but also fossil energy companies. There has been a decrease in demand throughout the energy industry, but there is a significant difference between renewable and non-renewable energy sources.
However, few references address the impact of coronavirus on economies such as the need to switch to renewable energy sources to stabilize economic performance by reducing externalities costs [
11].
In the analysis of 10 companies producing renewable energy, the results showed an increase in capitalization of these companies by 150%, while there was a decrease in income by 2%. However, the capitalization of fossil fuel companies has increased, with an average growth rate of 35%. This situation in the fossil energy market, that company revenues fell by 32% while capitalization increased by 35%, proves that there is a bubble in the non-renewable energy market.
The hypothesized connection between the pandemic and people’s increased consciousness about environmental issues was proved in previous papers [
2,
3,
4]. The relationship between economic growth and the transition to renewable energy has been widely analyzed, showing the inefficiencies of coal and oil use and production. Many countries give preference to renewable energy sources due to their lower cost and positive effect on the environment [
12,
13,
14]. This fact contributes to increasing the attractiveness of investing in renewable energy sources. There has also been an increase in CO
2 tariffs, despite the decrease in emissions during the pandemic.
2. Literature Review
There are many articles [
15,
16,
17,
18] on the impact of coronavirus on various sectors of the fuel and energy complex. The purpose of this study is to justify and prove the increase in the capitalization of renewable energy companies around the world because of the coronavirus crisis.
COVID-19 is not only affecting social and political life, but a huge negative impact is being felt in the economic sector. Before the pandemic, the world economy seemed to be on its way to a good recovery [
19,
20,
21,
22,
23]. This trend is no longer the case, because as the coronavirus spreads around the world, it has undermined the world economy [
23]. Due to the quarantine, many companies have been forced to close temporarily, and there has been a reduction in aggregate demand and an increase in unemployment.
Many countries are embracing the technological innovations that are necessary for economic growth [
11,
19,
24,
25,
26,
27,
28,
29]. There is no doubt that the coronavirus outbreak has had a huge impact on clean energy and its spread. The most notable fact of deterioration in this area is that now, the focus for all countries is to control coronavirus infection, while before the pandemic, a great deal of money and effort was invested in the transition to renewable energy by many countries. The COVID-19 outbreak is also having a devastating impact on the global renewable energy supply chain. The first example is that LM wind Power and Siemens Gamesa in Spain have announced that they have decided to stop manufacturing blades for wind turbines. In addition, North Dakota is the leading U.S. state in wind energy production, but during the pandemic there were closures of wind farm facilities due to the economic crisis that undoubtedly affected this area [
9,
18].
In addition to needing economic assistance, the renewable energy industry is a boon for investment, as this employment sector grows and develops, it is essential for the recovery of economies from the coronavirus crisis. Renewable energy is projected to account for about 60% of total energy consumption in many countries by 2050. China may increase the share of renewable energy to 67% by 2050, and the European Union’s performance in this area will reach 70% [
16].
The companies included in TRBC Industry Name Renewable Fuels were taken for data analysis. A total of 38% of the companies are in the United States, so it is not unreasonable to say what the renewable energy industry is like in this country. For countries such as the U.S. and China, by 2020, investment incentives for renewable energy projects have been undertaken which implied the connection of wind and solar photovoltaic projects, which shows the trend of this type of energy sources [
30]. In addition, the U.S. can change renewable energy consumption to two-thirds of total energy consumption [
4]. In this case, Congress should promote investment in the future of clean energy, namely, the renewable energy industry, which indicates the importance of this sector to the economies of all countries, because renewable energy will help reduce pollution, thereby reducing the cost of preventing external effects.
Some countries have also taken some measures to support the renewable energy sector. In Poland, the Crisis Shield Bill was drafted, which involves giving the energy regulator the right to extend the deadline for renewable energy producers to start selling through an auction system. In addition, China’s high levels of air pollution have long been traced to the government’s adoption of a host of clean energy innovations. Many articles raise the topic of China’s wind energy progress [
31]. Additionally, in India, to achieve many policy goals by 2022, the level of renewable energy needs to increase [
30].
Another example is the recommendations of the roundtable of the State Duma Committee on Energy in Russia, which speak of increasing the investment attractiveness of renewable energy sources through a mechanism of state support for the use of these energy sources in the wholesale electricity market. The need for a legal solution to the implementation of renewable energy sources, which requires amendments to legislation, is traced. For example, the Russian legislation has included a provision on renewable energy sources in the main federal law, “On Electricity” [
32]. The industry began to take shape only seven years ago, and even today the analysis shows that renewable energy is a serious driver of socio-economic development of countries. In countries around the world, there is an excessive use of renewable energy facilities compared to conventional generation [
15,
16,
17].
Furthermore, it must be stressed that the European energy crisis proves all preconceptions about stable fossil fuels. The construction sector in the European Union accounts for 40% of the total energy consumption [
32]. In Europe, there is a tendency for the price level of energy resources to increase to high levels due to the energy crisis. Consequently, according to experts, the price level will increase by at least five times. All of the above proves that Europe needs to eliminate dependence on fossil fuels. According to analytical data from the International Energy Agency (IEA), there is a downward trend in investment and consumer spending on fossil energy due to the economic crisis caused by the coronavirus pandemic. Old oil refineries that run on fossil fuels are closing down. The withdrawal of investors from this area of energy has led to the transfer of capital to renewable energy companies [
33].
The unreliability of renewable energy is not justified, because if a combination of renewable energy sources is applied, there will always be a supply, which cannot be said of gas. In addition, there is a bias that renewables are comparatively more expensive, but the lowest unit cost of solar and wind is traceable. The use of cleaner energy sources reduces dependence on imported non-renewable energy sources, as the price of this commodity is volatile, which interferes with the balance of the country’s macroeconomic performance. Indeed, oil price volatility is believed to contribute to economic crises [
16].
One of the most important strategies for sustainable economic growth of the country is green growth, which also involves ensuring that companies switch to renewable energy sources, because the depletion of natural resources can provide an economic crisis or slow economic growth [
23,
34,
35]. However, many experts believe that there is an uncertain relationship between green growth and environmental sustainability [
16]. Economic growth and the use of clean energy sources are interrelated because externalities are reduced when renewable energy sources are used. In addition, according to Dr. Richard Schmalensee, it is necessary to maintain natural resources along with renewable energy sources, as the economic growth of a country depends on it.
The impact of pricing policies on the level of investment in renewable energy can also be seen. If the price remains fixed, it contributes to a high level of investment in solar energy and wind energy [
18]. Incentives for renewable energy deployment are most effective through feed-in tariffs [
36].
According to the Global Carbon Project during the pandemic, CO
2 emissions decreased by 7%. The increase in the cost of CO
2 quotas against the background of falling emissions is not only due to expectations of stricter regulation, but also to short-term factors. In fact, the increase in the price of quotas limits emissions, because it makes it unprofitable to use coal, even though it is a cheaper raw material. Therefore, higher prices for CO
2 emissions will make it more attractive to invest in companies that produce renewable energies, as their production is not subject to a CO
2 emission fee. As a result, the demand for coal in Europe has fallen by 15% this year, while the demand for renewables has increased [
33].
3. Methods
The study analyzed the economic performance of 45 companies from around the world, such as revenue, market cap, price close, and price change. For the analysis, data were taken from the Tomson Reuters system of the current and previous year to compare the profitability and capitalization of companies during the protracted coronavirus infection. All companies are included in TRBC Industry Name Renewable Fuels. For clarity, the 10 largest companies by capitalization in these industries were taken. A comparison of the two fields of energy production helps to understand the situation in the energy market during a pandemic.
To assess the relationship between indicators such as revenue change % (percentage difference between companies’ profitability in 2021 and 2020) and market cap change % (percentage difference between companies’ capitalization in 2021 and 2020), analysis of covariance was performed. The advantages of these methods include the simplicity of computational algorithms, clarity, interpretability of the results. However, there are also disadvantages, such as low prediction accuracy and lack of explanatory function. This part of the article helps to understand the course of action of our study. Not only the positive results of the study are given in the article, but also parts of the analysis help to describe the whole course of the study, its unsuccessful and successful results of the study. However, the article cites other methods that show the inverse relationship of two variables during the coronavirus period: the capitalization of renewable energy companies and their income.
The entire study is based on data taken from the Thomson Reuters system, which provides data on the capitalization and profitability of companies during the pandemic. Thus, the analysis performed contains real data, which shows the evidence of the work.
where the dependent variable
, describing the process we are trying to predict or understand; coefficients
, explanatory variables
used to model or predict the values of dependent variables;
-random error term/residuals;
-the inner product between vectors
xi and
β.
The coefficient of determination is estimated in the following ways:
The Pearson correlation coefficient, which is calculated according to the formula, is used to analyze the data:
In addition, a measure of the linear relationship between the two quantities mentioned above can be calculated using covariance, which in the analysis of the data showed that as market cup change % values increase, revenue change % values tend to decrease.
The calculation is based on the covariance formula:
Negative covariance shows that, on average when the value of increases, the value of decreases. In this case, the covariance is most relevant.
4. Results
The study took the economic performance of 45 companies with renewable energy as their core business to analyze the data. These companies are located around the world. The selection of companies was based on sufficient data to confirm the author’s hypothesis.
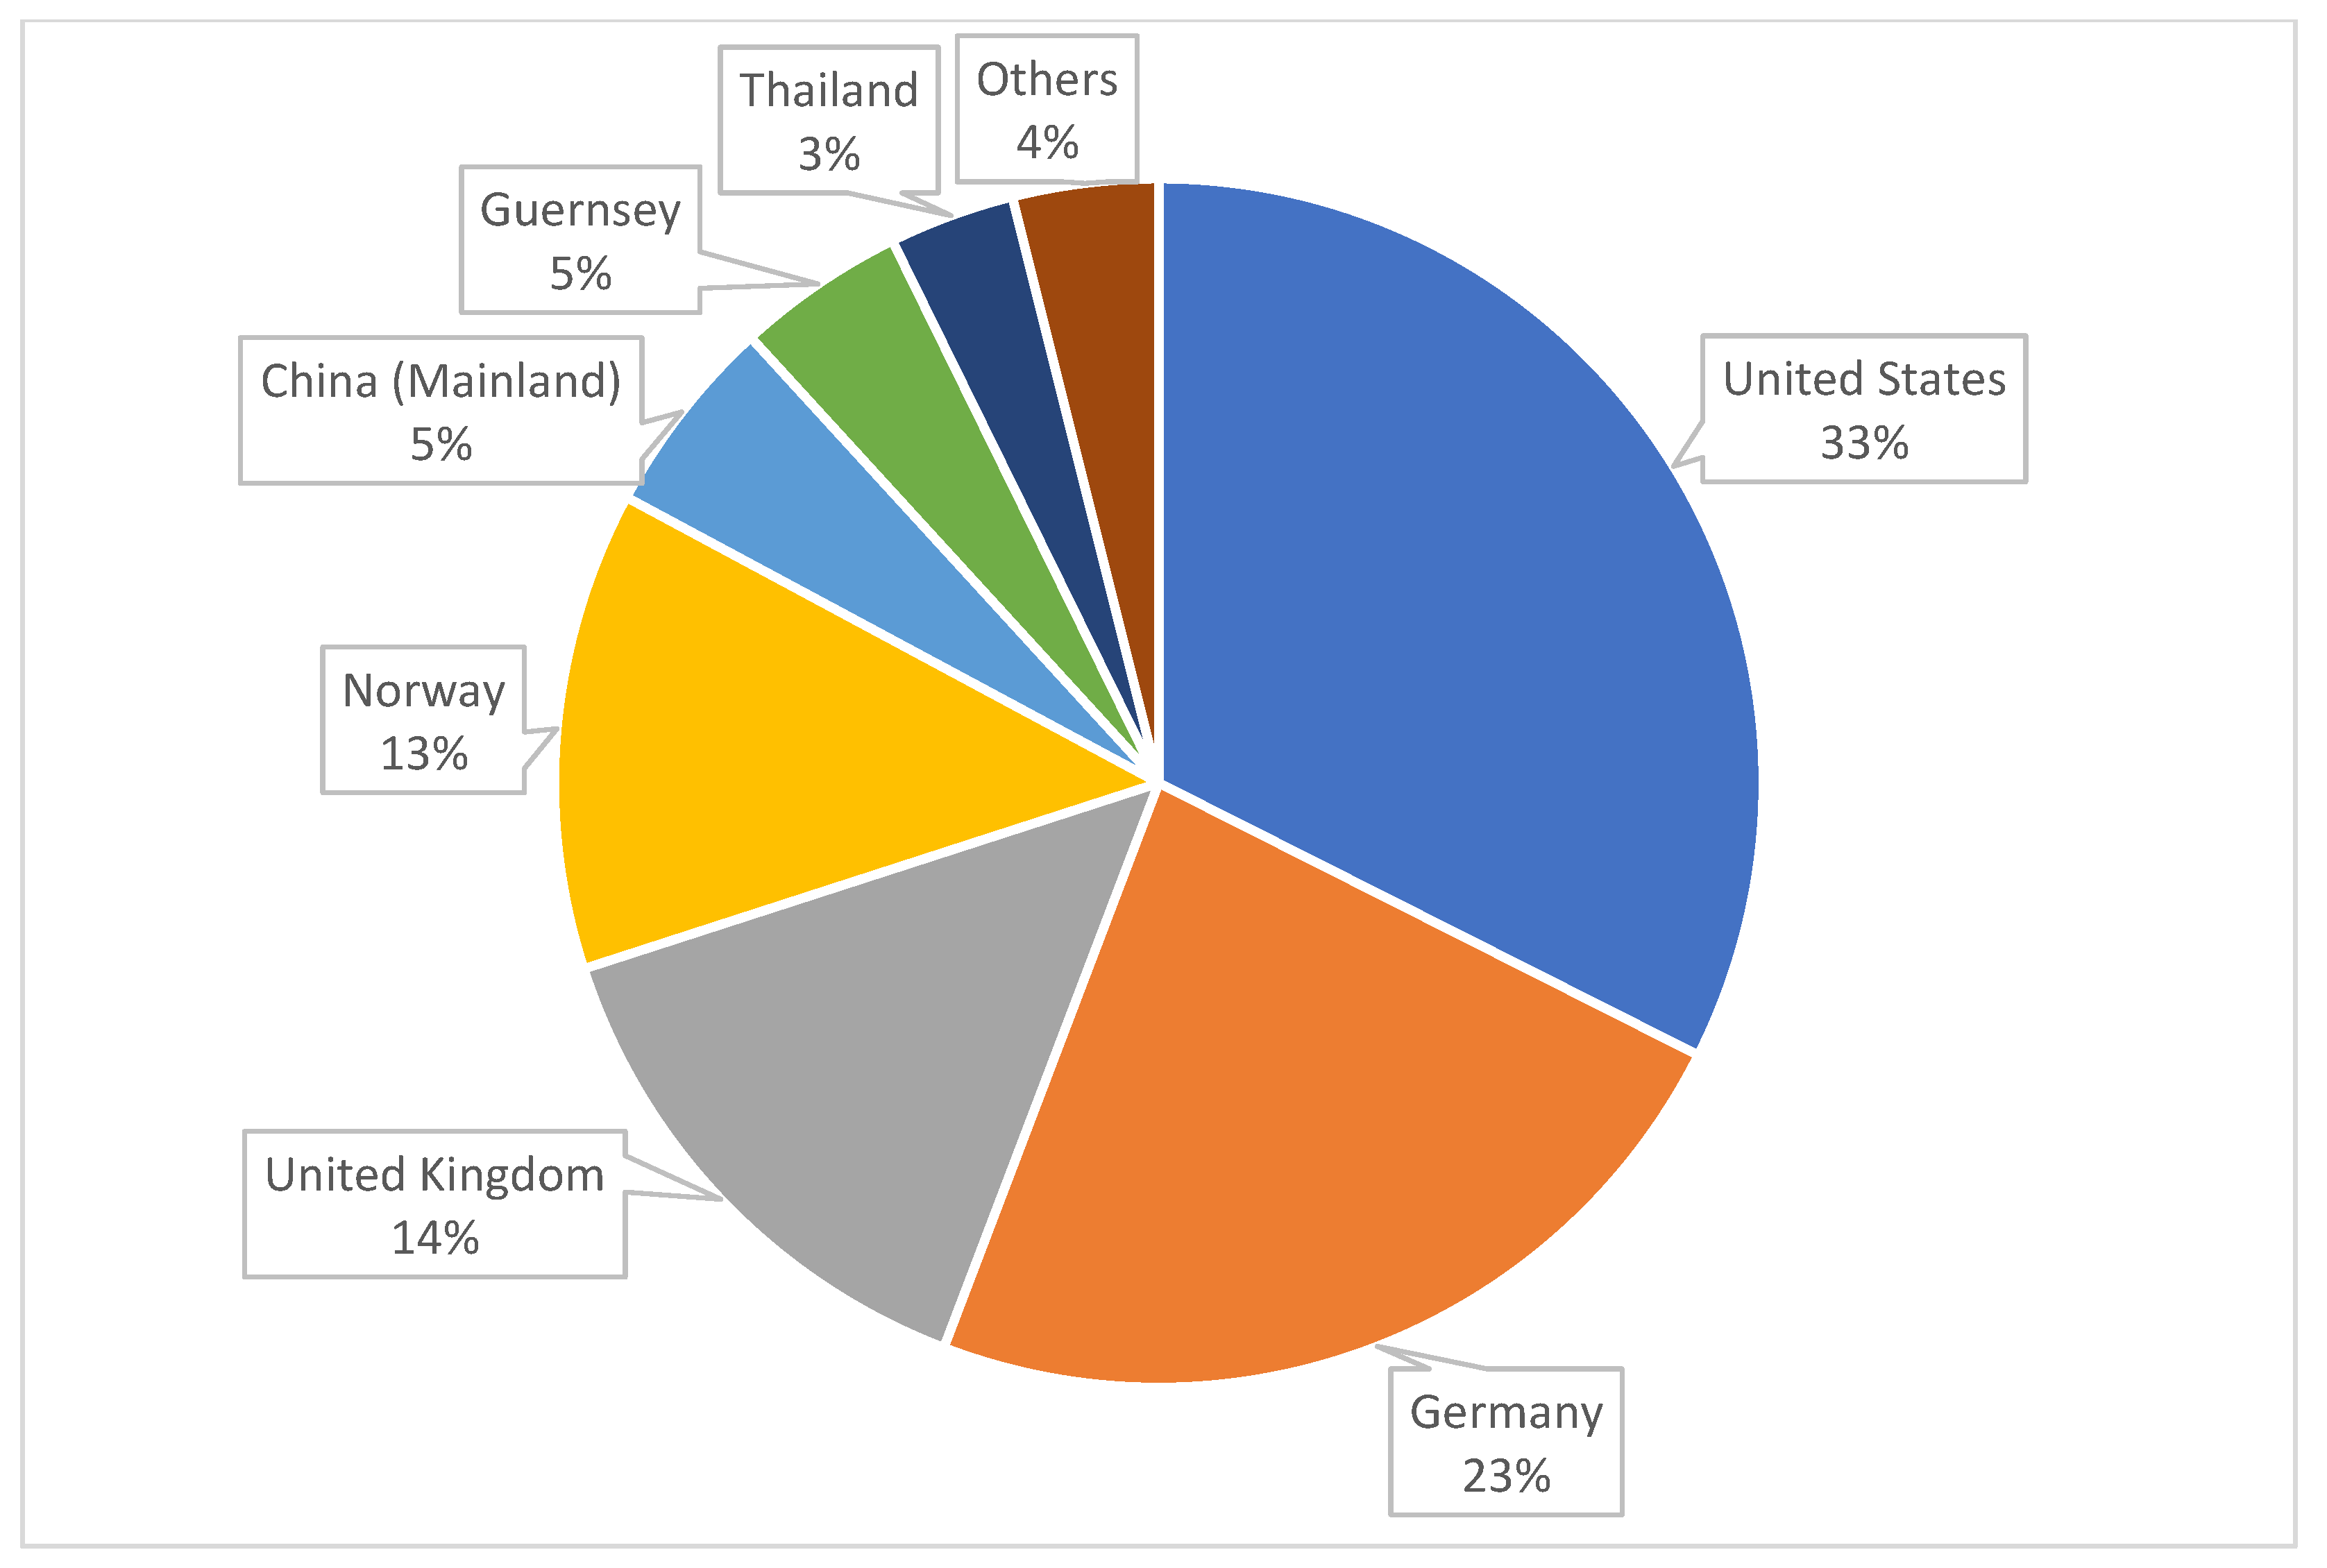
Figure 1 shows the proportion of locations around the world of some of the companies taken for analysis. The chart shows that the largest number of companies is concentrated in the United States, namely 33%.
Figure 2 illustrates the periods of the COVID-19 pandemic. Thanks to this illustration, we can trace the changes that undoubtedly affected the economies of all the countries of the world to a greater or lesser degree. The period of the coronavirus infection began in March 2020, and it was during this period that restrictions began to be applied, which contributed to the fall of the stock market, the formation of the economic crisis in general. The graph shows that there are two main stages of the pandemic: the beginning of the first lockdown and the beginning of the second, respectively. It is in these intervals that the most critical situation in the countries of the world is traced.
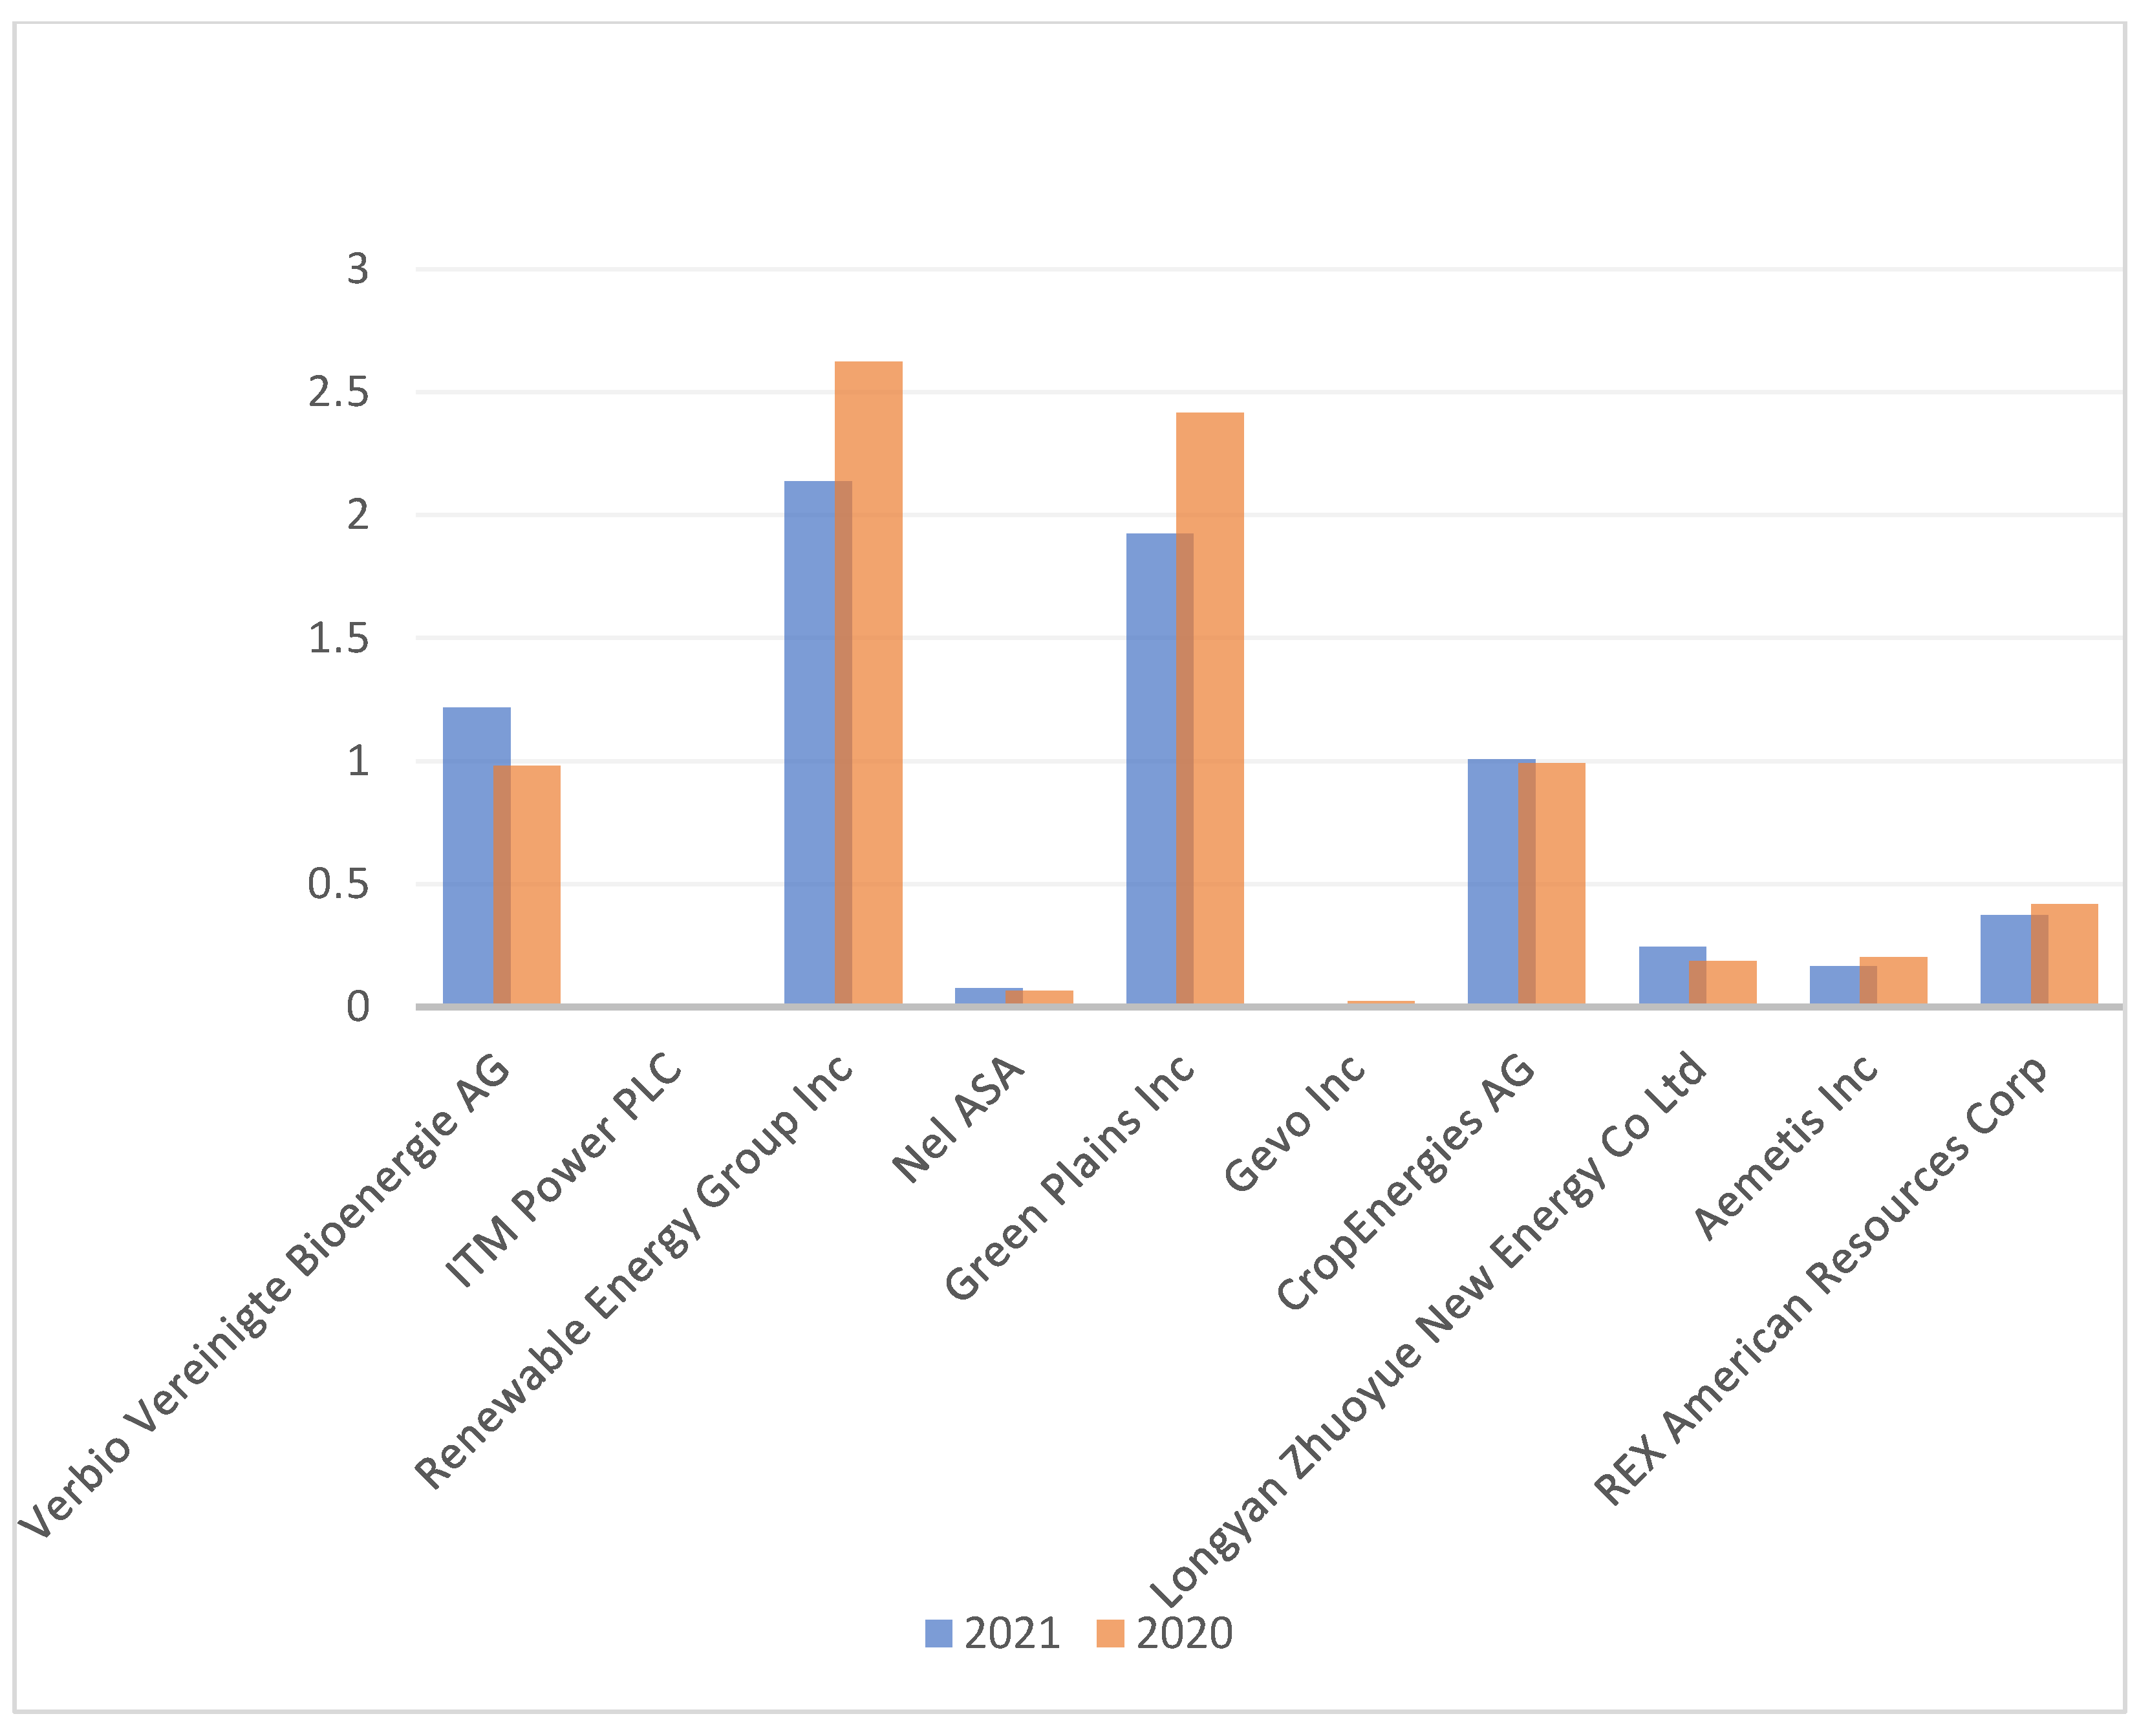
Figure 3 illustrates the change in companies’ revenue for 2020 and 2021. The chart shows an increase in profitability for four of the top 10 companies, but a full analysis of 45 companies shows a significant increase in their earnings. On average, the profitability of all 45 companies analyzed increased by 60%, but the methods section calculated a measure such as covariance, whose coefficient is negative, indicating that in this situation, when companies’ capitalization increases, their revenue decreases. This proves that during the pandemic, the crisis caught the renewable energy industry through a reduced workforce and a negative economic situation around the world, but the demand for this resource has increased, as many studies prove that renewable energy is economically more attractive.
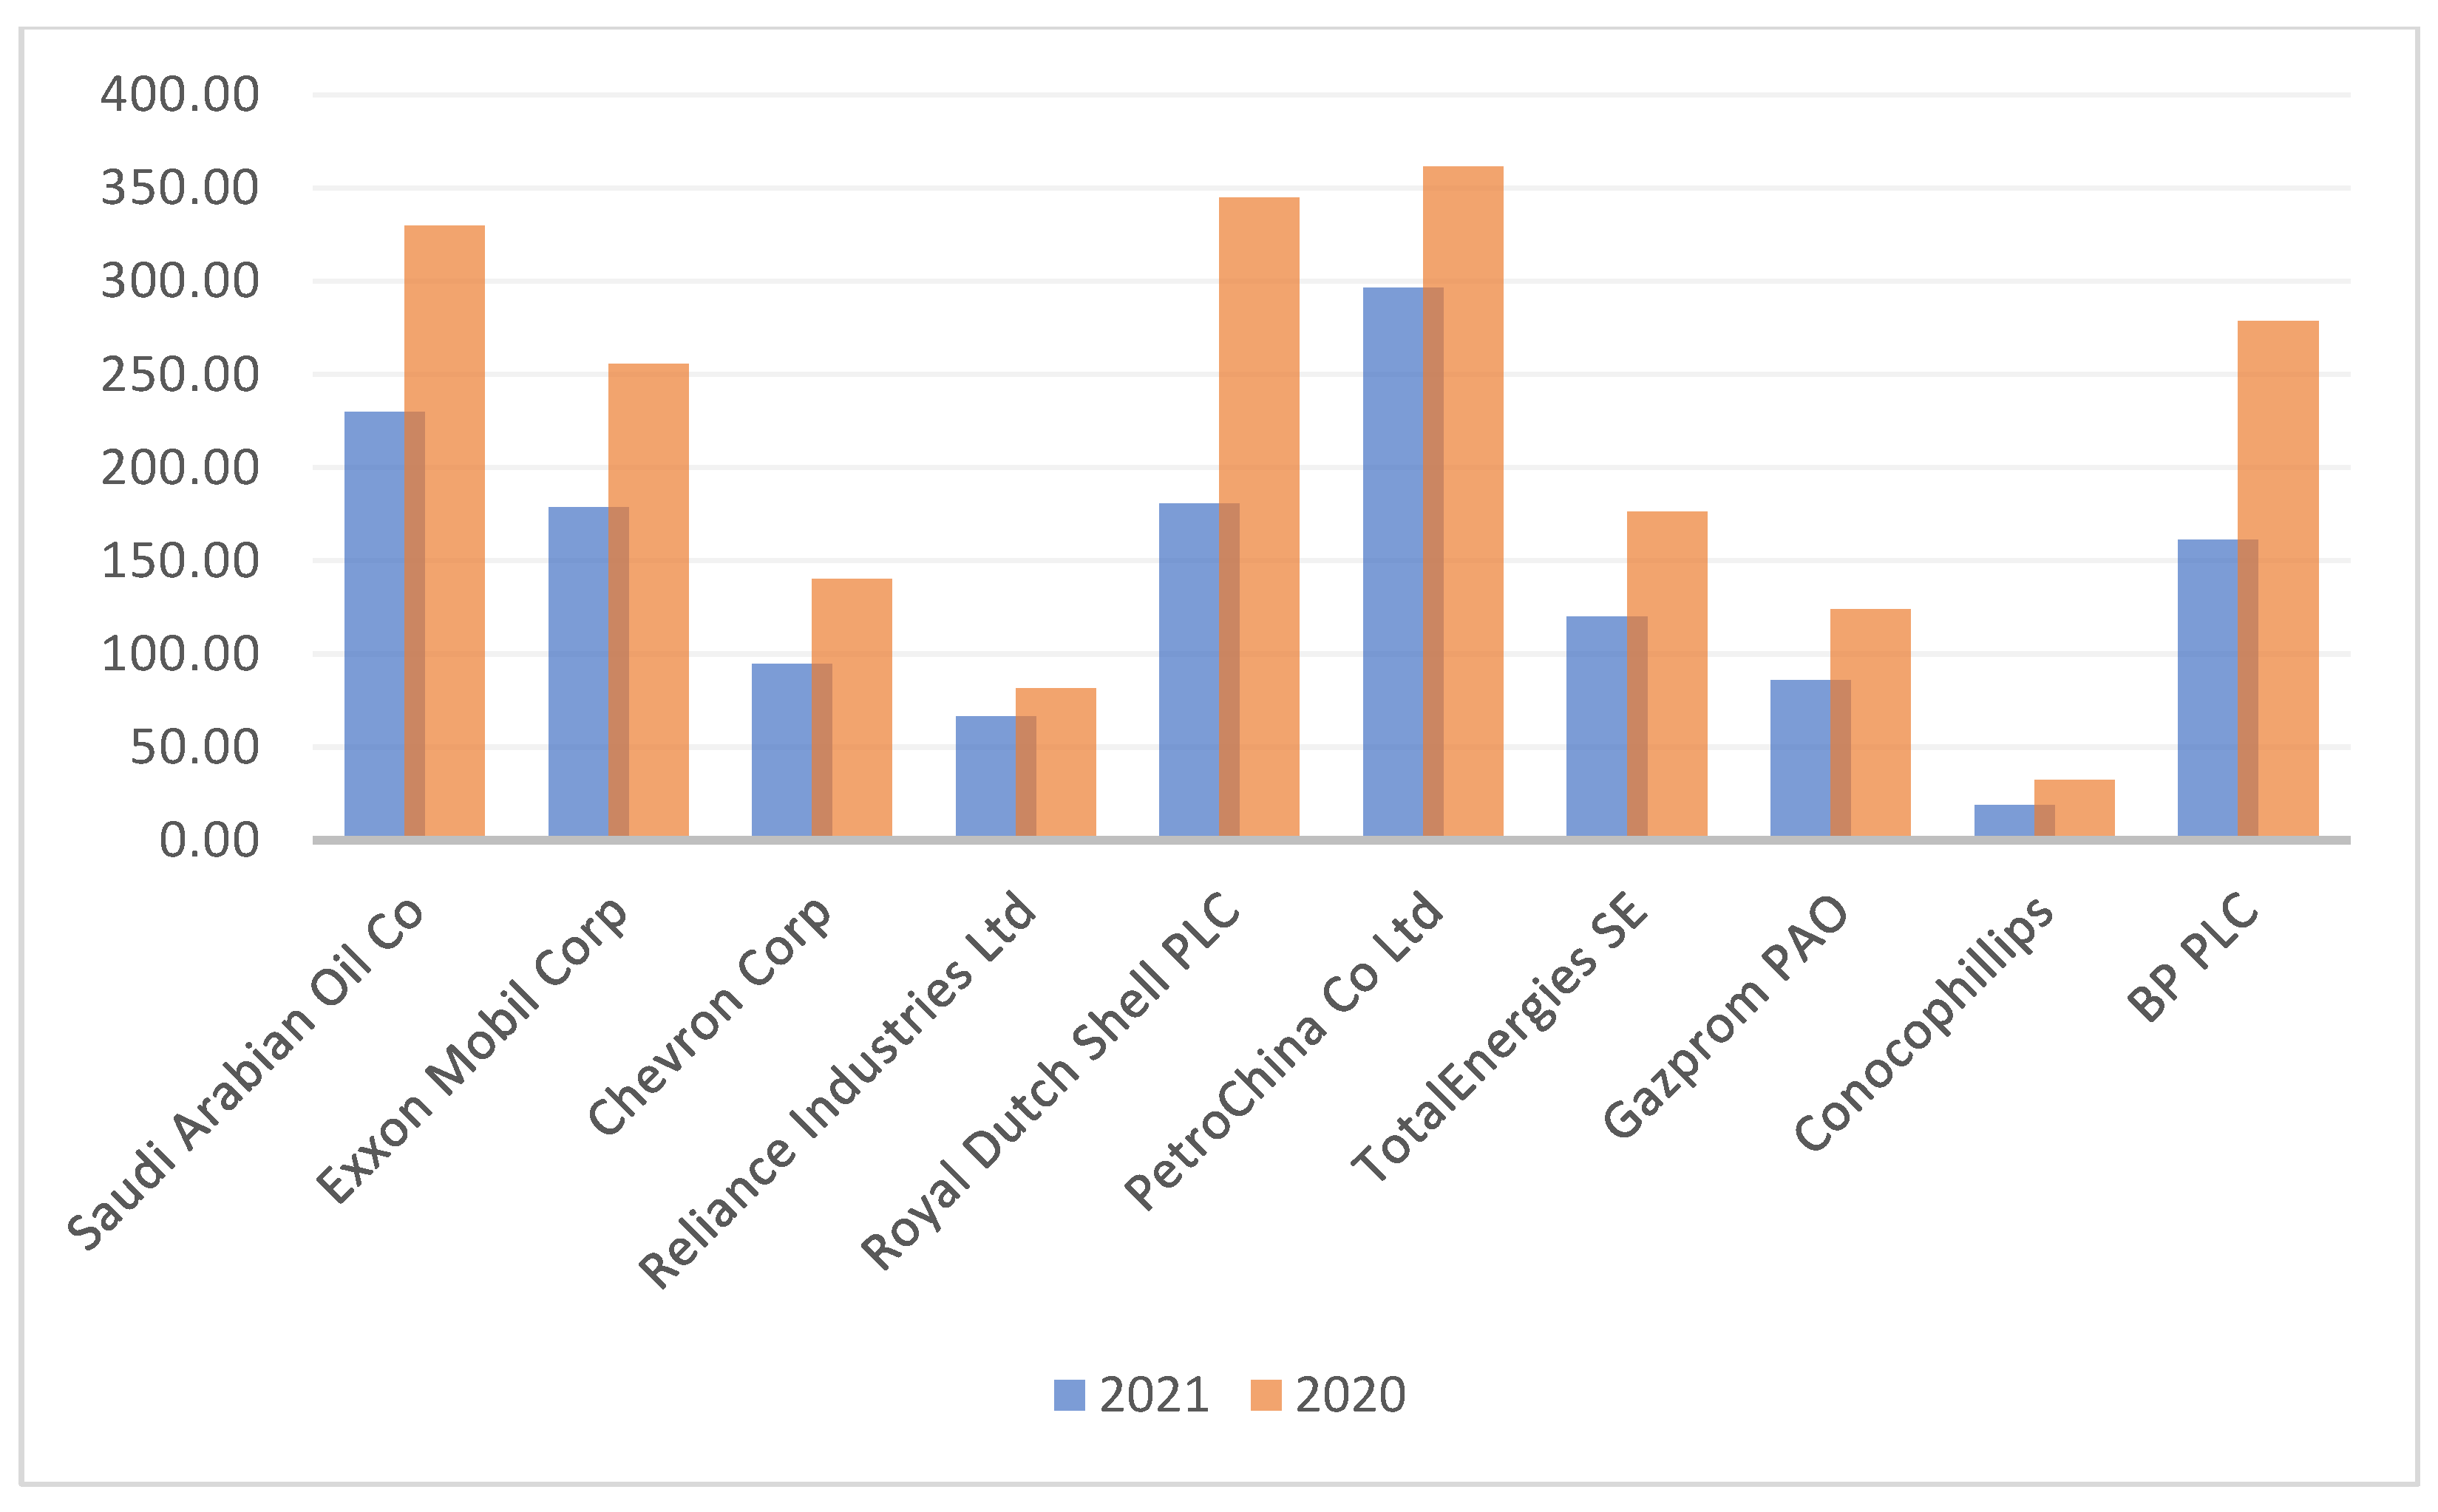
Figure 4 shows the change in the earnings of the 10 largest fossil energy companies by capitalization over the years 2020 and 2021. The chart shows the decline in earnings of the 10 largest companies by capitalization. An analysis of this data shows an average decline of 32% in their revenues.
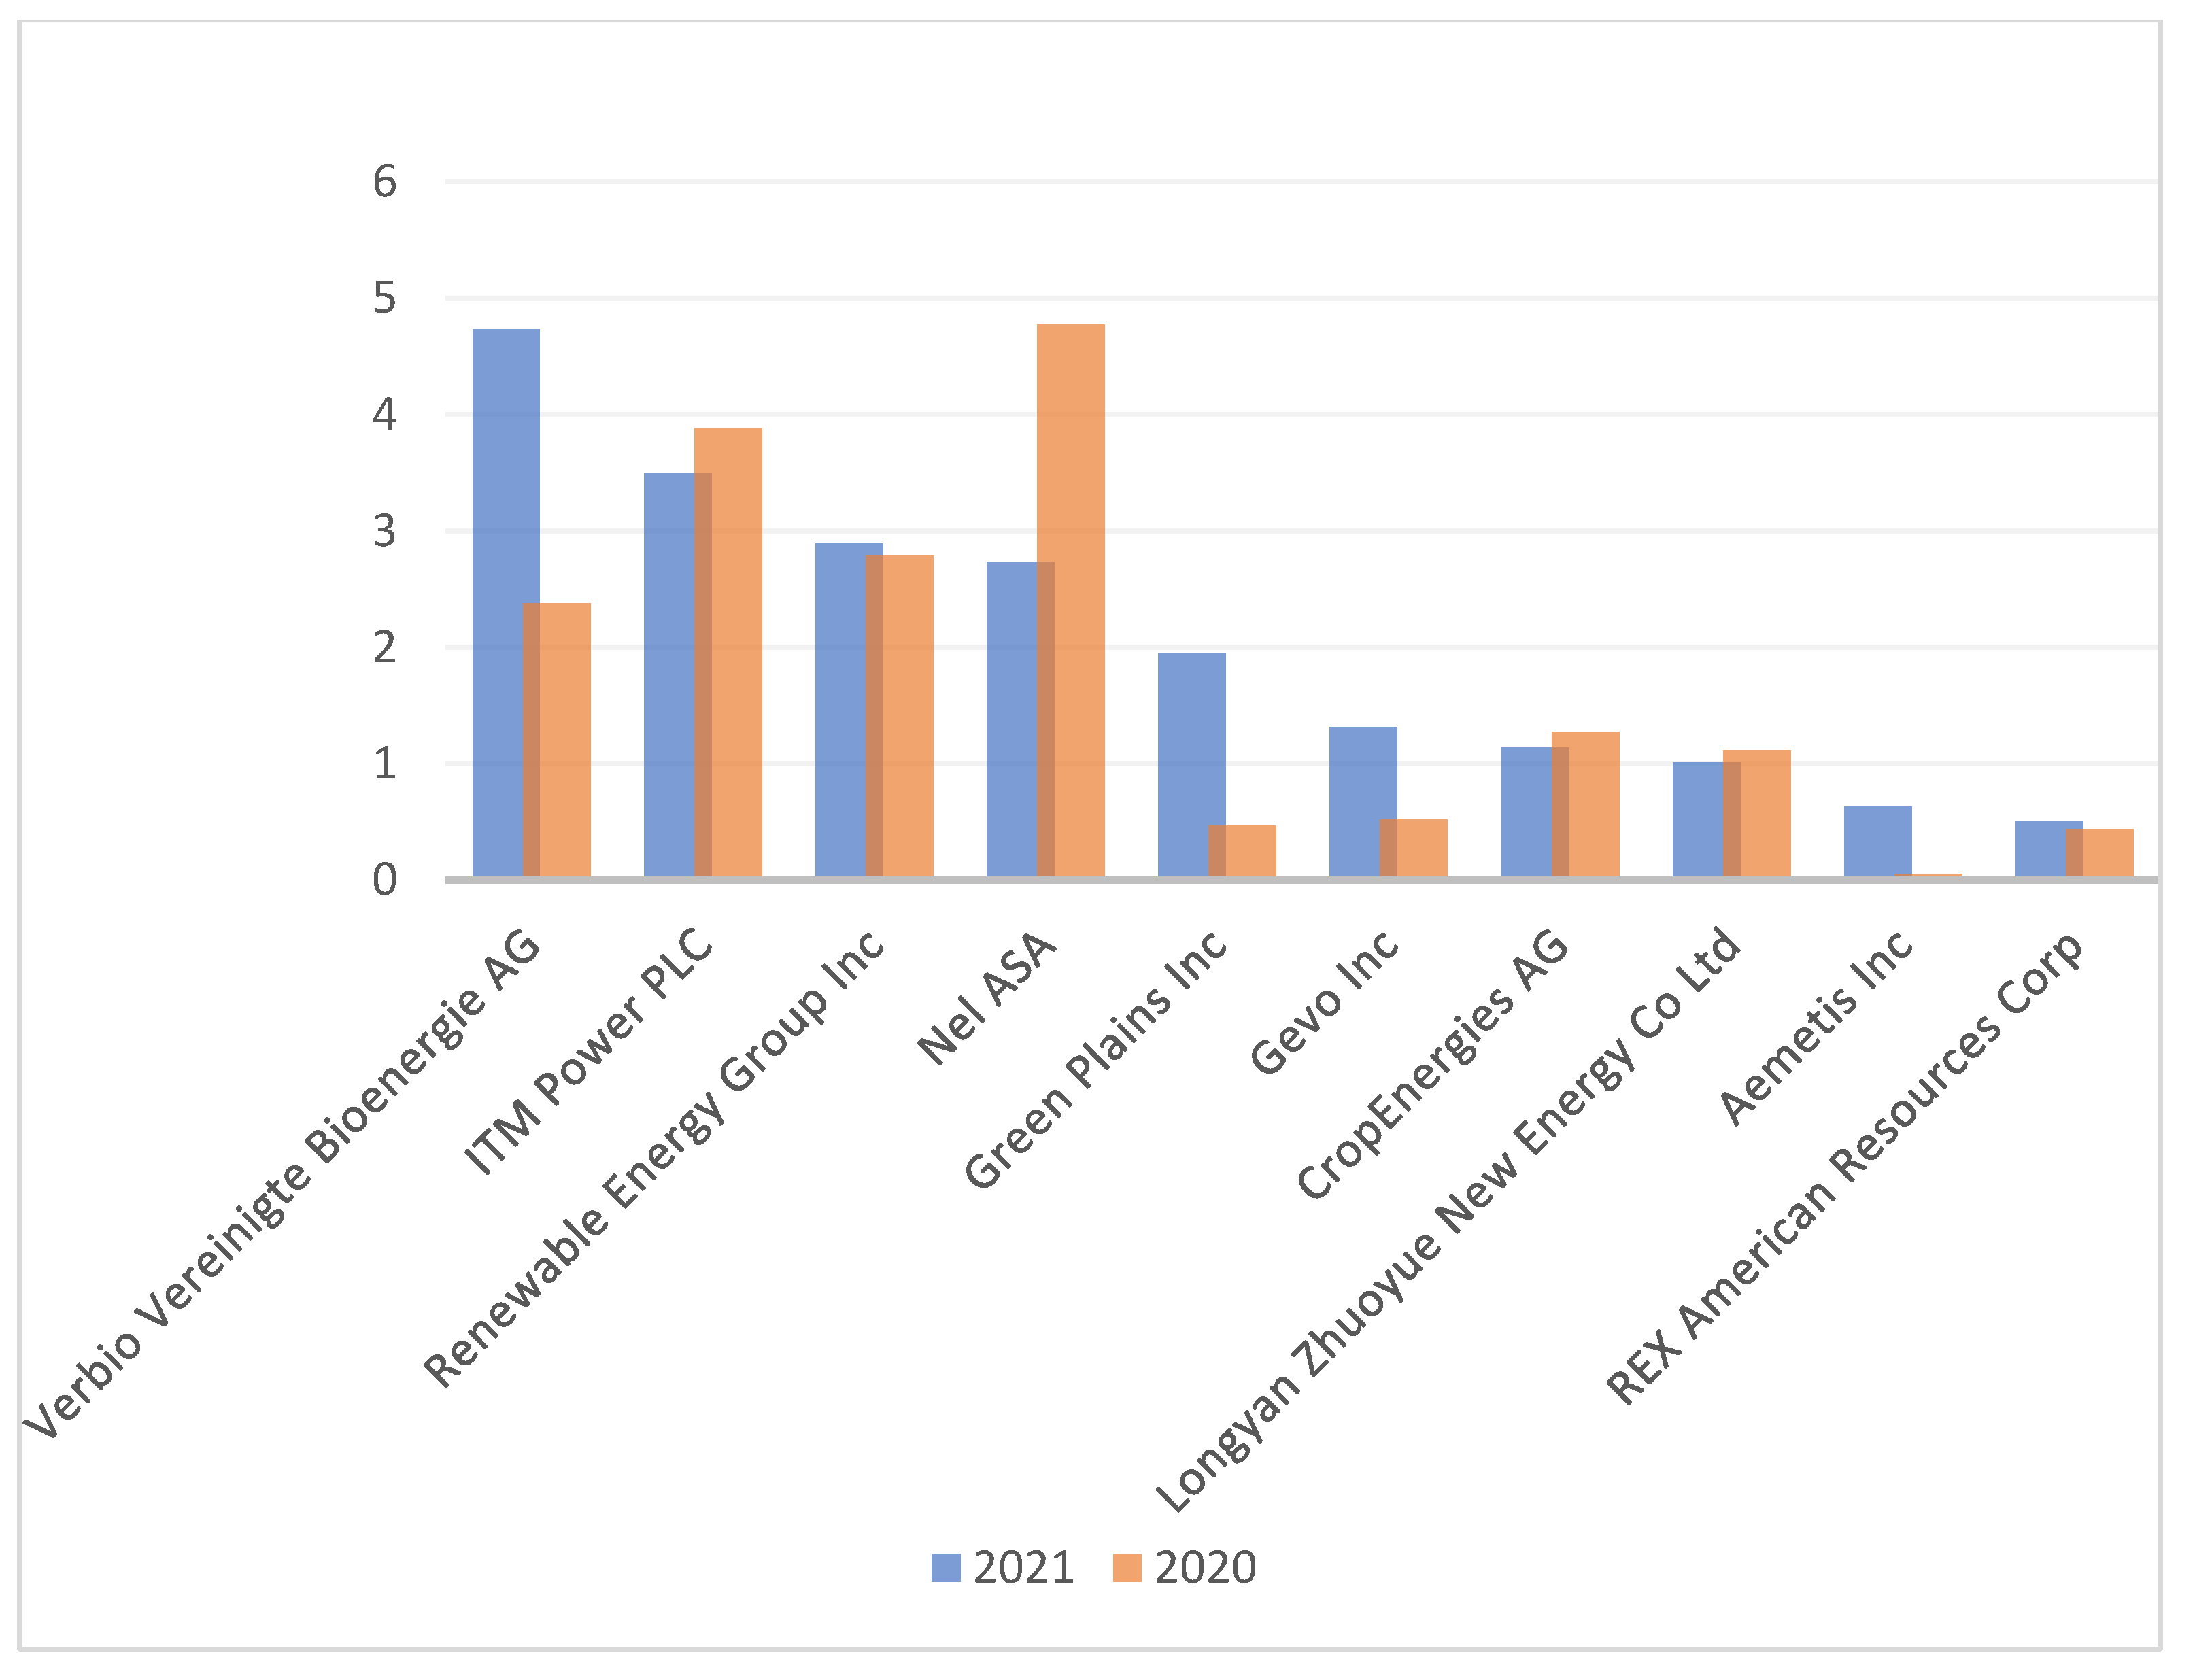
Figure 5 shows the company market cap ratio of the 10 largest renewable energy companies analyzed. The authors also analyzed 45 companies producing renewable energy sources. The calculations showed that, on average, the capitalization of all 45 companies increased by 86%, which is a good indicator for the renewable energy resources field.
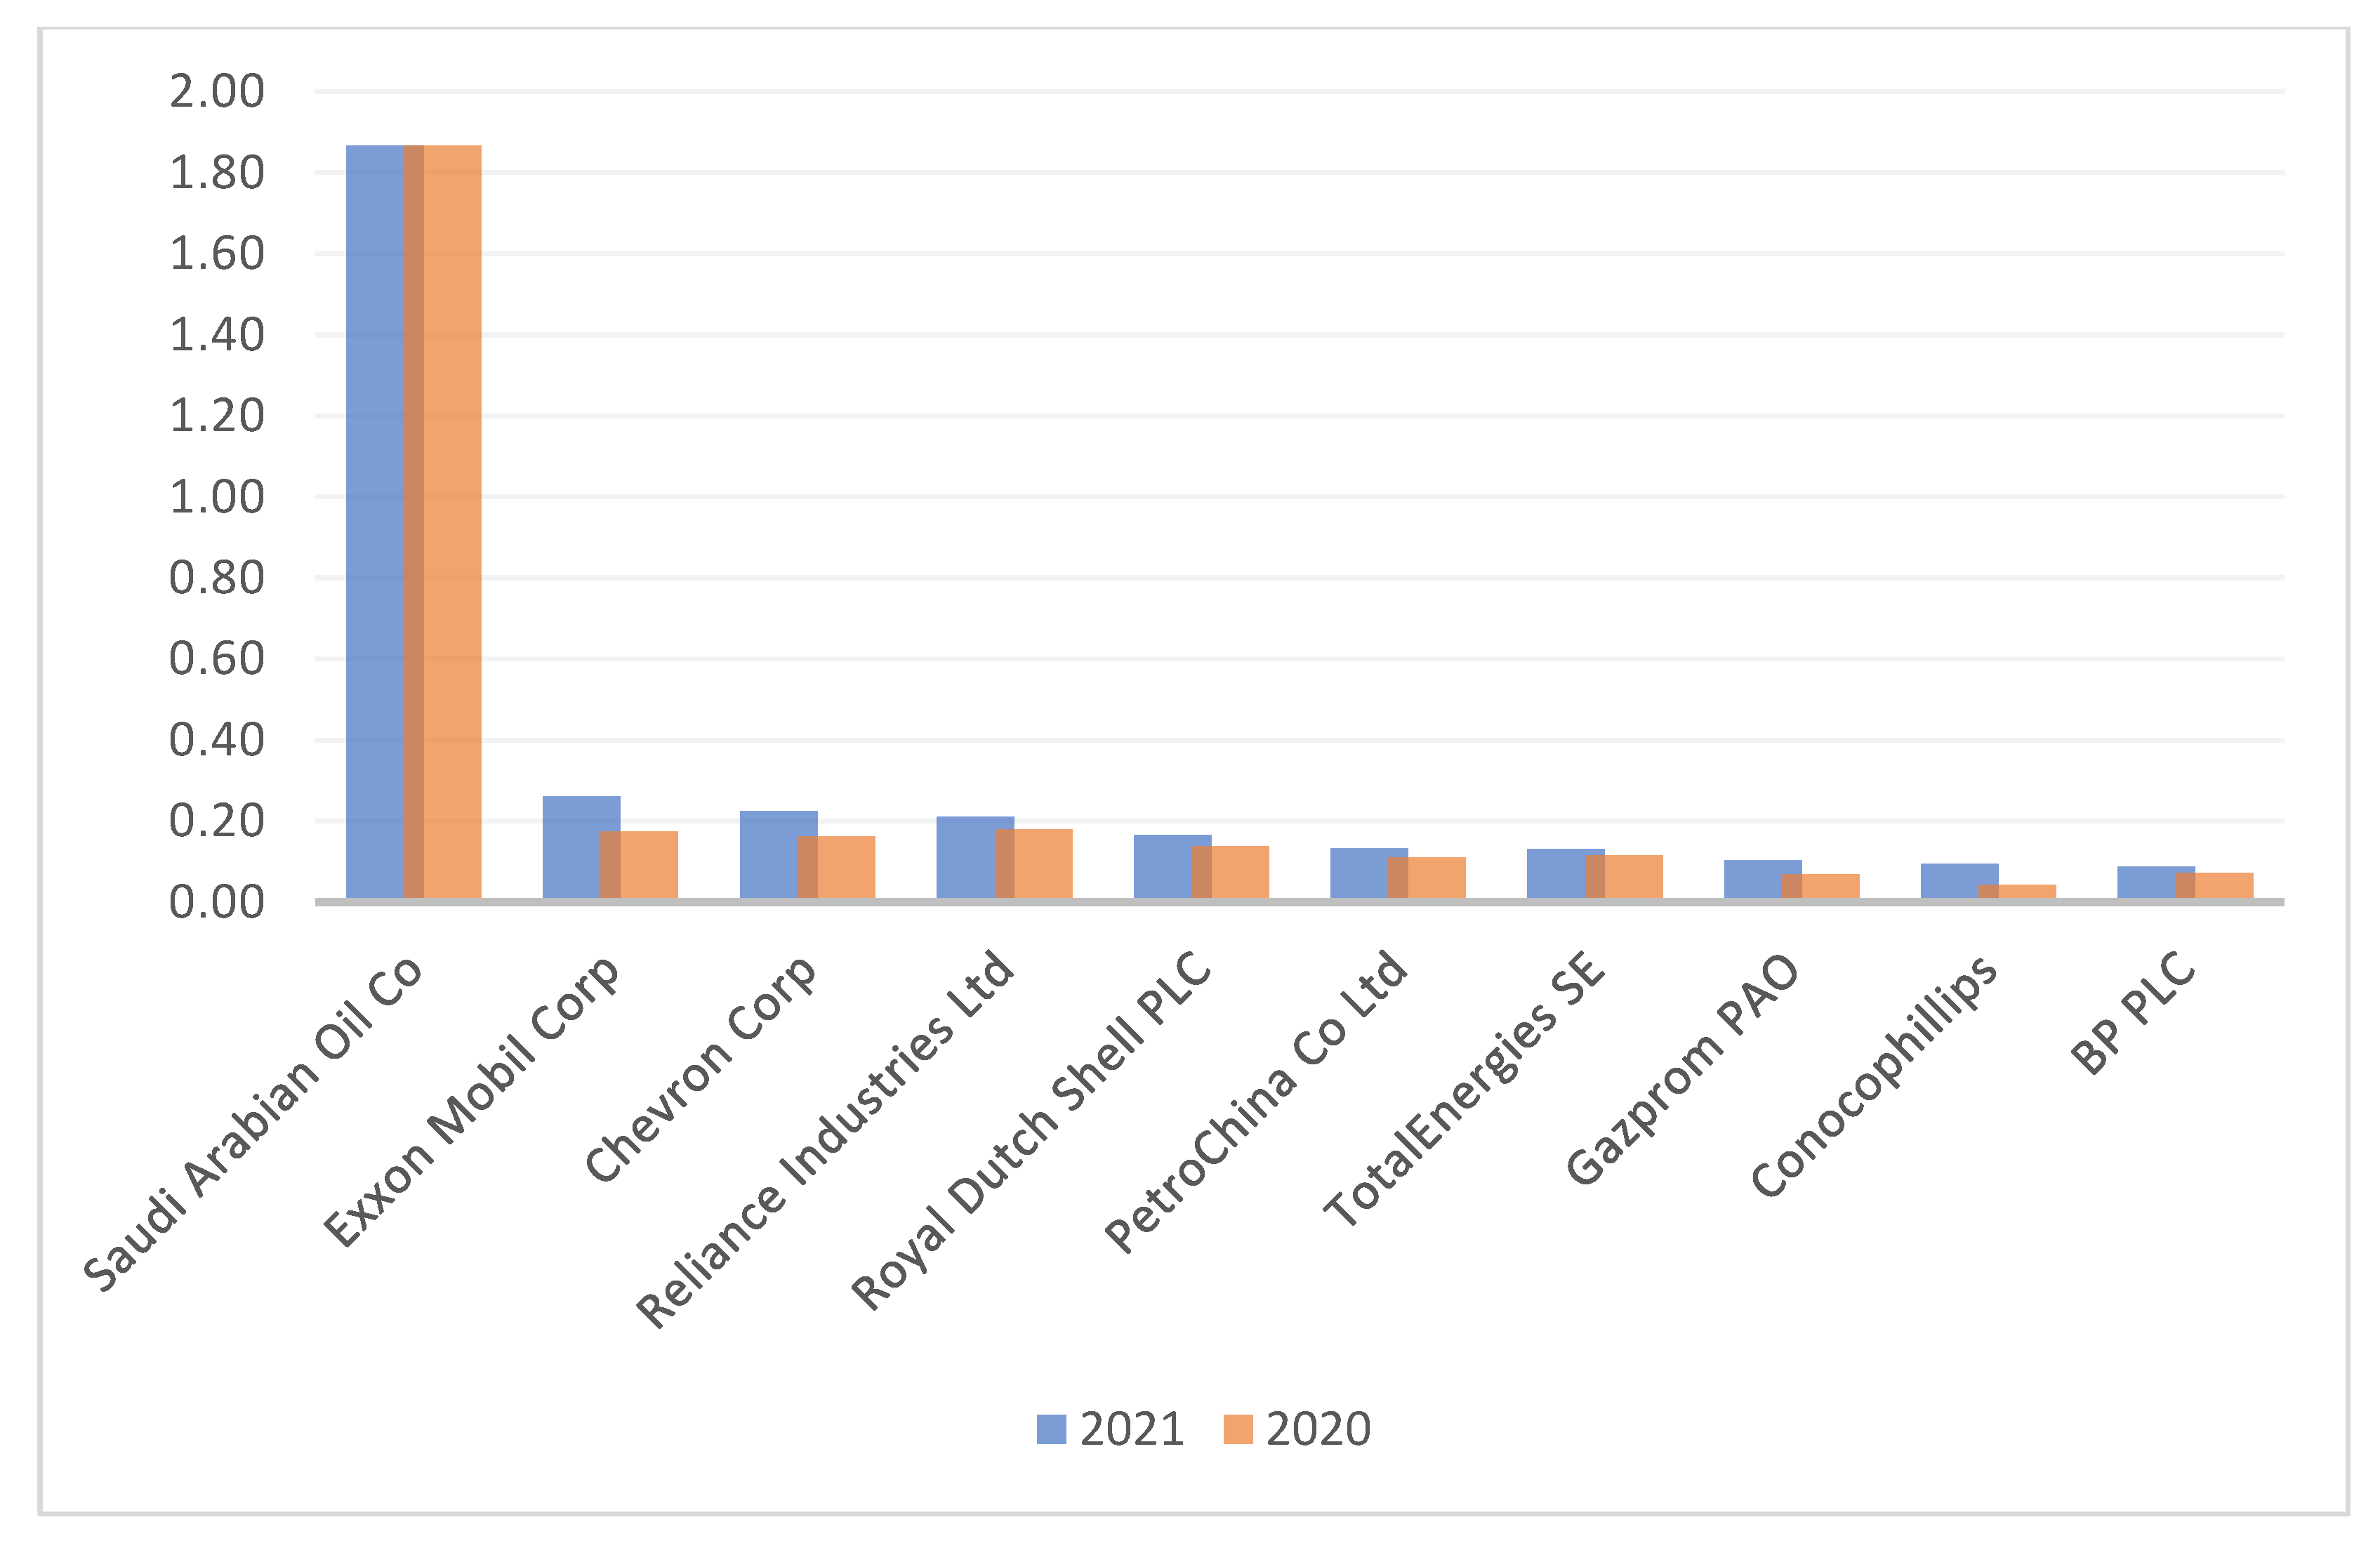
Figure 6 shows a comparison of the capitalization of the 10 largest companies by capitalization for 2020 and 2021. From the analysis of the data, we can see that the capitalization of the companies has increased, with an average growth rate of 35%. This situation in the fossil energy market, that company revenues fell by 32% while capitalization increased by 35%, proves that there is a bubble in the non-renewable energy market. The stock market grew spontaneously, through companies receiving material assistance from the government to support them during a pandemic. This fact contributed to a situation in which there was no real growth in company revenues, but rather a decline.
Based on the graphs presented above and the analysis made by the authors, we can draw some conclusions regarding the comparison of the two industries, namely, renewable and non-renewable energy sources. Through a study of the 10 largest companies according to their capitalization, the following results were obtained. In the analysis of 10 companies producing renewable energy, the results showed an increase in capitalization of these companies by 150%, while there was a decrease in income by 2%. This fact shows a favorable economic situation for companies in this industry during the pandemic. We can see an increase in the attractiveness of investing in this industry. In the sphere of fossil energy sources, we can see the reduction in income by 32% at the increase in capitalization by 35%. Such results indicate the instability of this market and the negative effects of COVID-19.
In addition, a correlation analysis was conducted for 10 fossil energy companies. The correlation coefficient is −0.33 and is negative, and belongs to the acceptable interval showing a strong inverse relationship between the capitalization and profitability variables of the analyzed companies. Consequently, this analysis shows a real increase in the capitalization of the companies while their profitability decreases. The resulting negative correlation coefficient means an inverse relationship between revenue change and market cup changes: growth of one variable leads to decline of the other. (
Table 1 and
Table 2) For the variables used in the correlation, the strength of the relationship is weak negative. Thus, the above analysis shows that there is an inverse correlation between companies’ profitability and capitalization during the period of coronavirus infection.
The disadvantage of the coefficient of determination is that it increases when new explanatory variables are added (
Table 1 and
Table 2). Correlation shows the statistical relationship between two or more random variables. In this model, the slope
is the number of units of y attributable to one unit of x. This value characterizes the average amount of change in variable y, in our case negative, on a given segment of the
x-axis. The shift
represents the average value of y when x is 0. The choice of an appropriate mathematical model depends on the distribution of values of x and y in the scatter diagram.
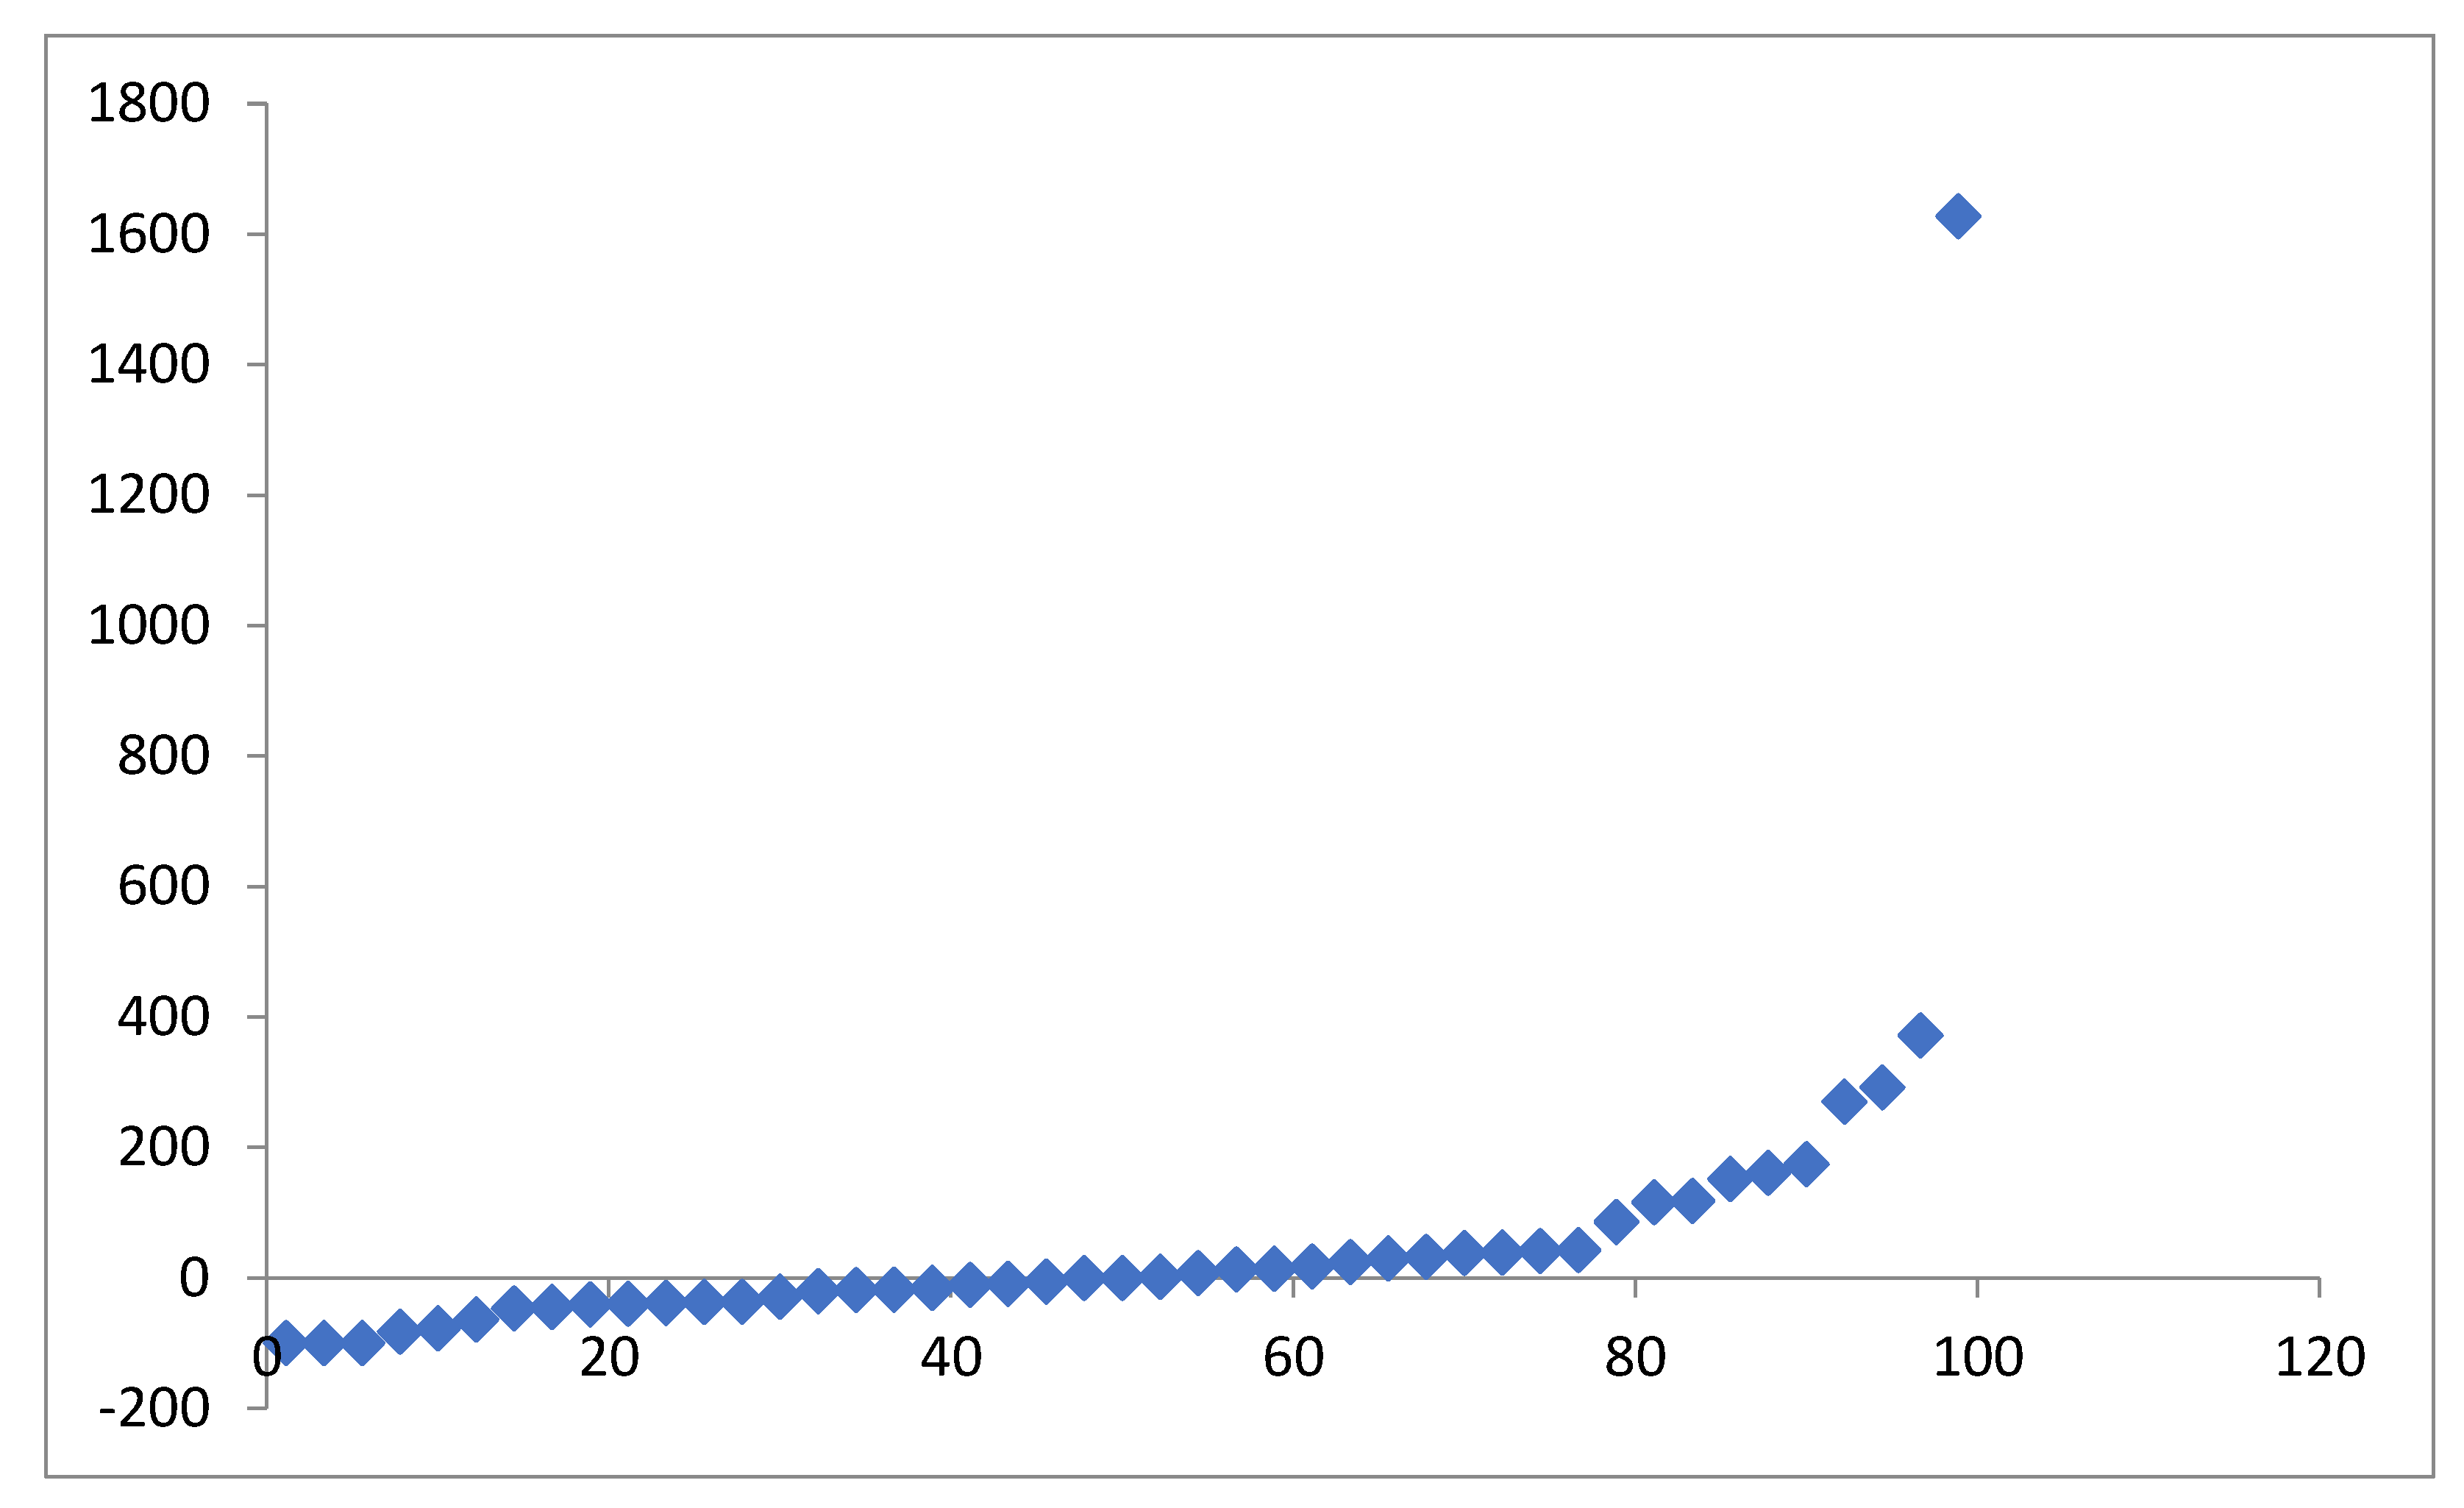
The resulting negative correlation coefficient means an inverse relationship between revenue change and market cup changes: growth of one variable leads to decline of the other (
Figure 7,
Table 1 and
Table 2). For the variables used in the correlation, the strength of the relationship is weak negative. Thus, the above analysis shows that there is an inverse correlation between companies’ profitability and capitalization during the period of coronavirus infection.
Additionally, when analyzing data from the top 10 fossil energy companies, the correlation coefficient showed the strongest inverse correlation of capitalization and profitability during the coronavirus period. Consequently, the renewable energy market does not exhibit the same level of economic volatility as fossil energy.
Figure 8 shows the annual production carbon dioxide emissions. The graph is based on territorial emissions, and it does not consider emissions related to traded goods. We can see from the chart that the CO
2 emissions fell during the coronavirus infection and pandemic, which caused many firms to close, and this has had an impact on air pollution. The time interval taken by the authors for the analysis allows us to clearly trace the situation of CO
2 emissions during the pandemic.
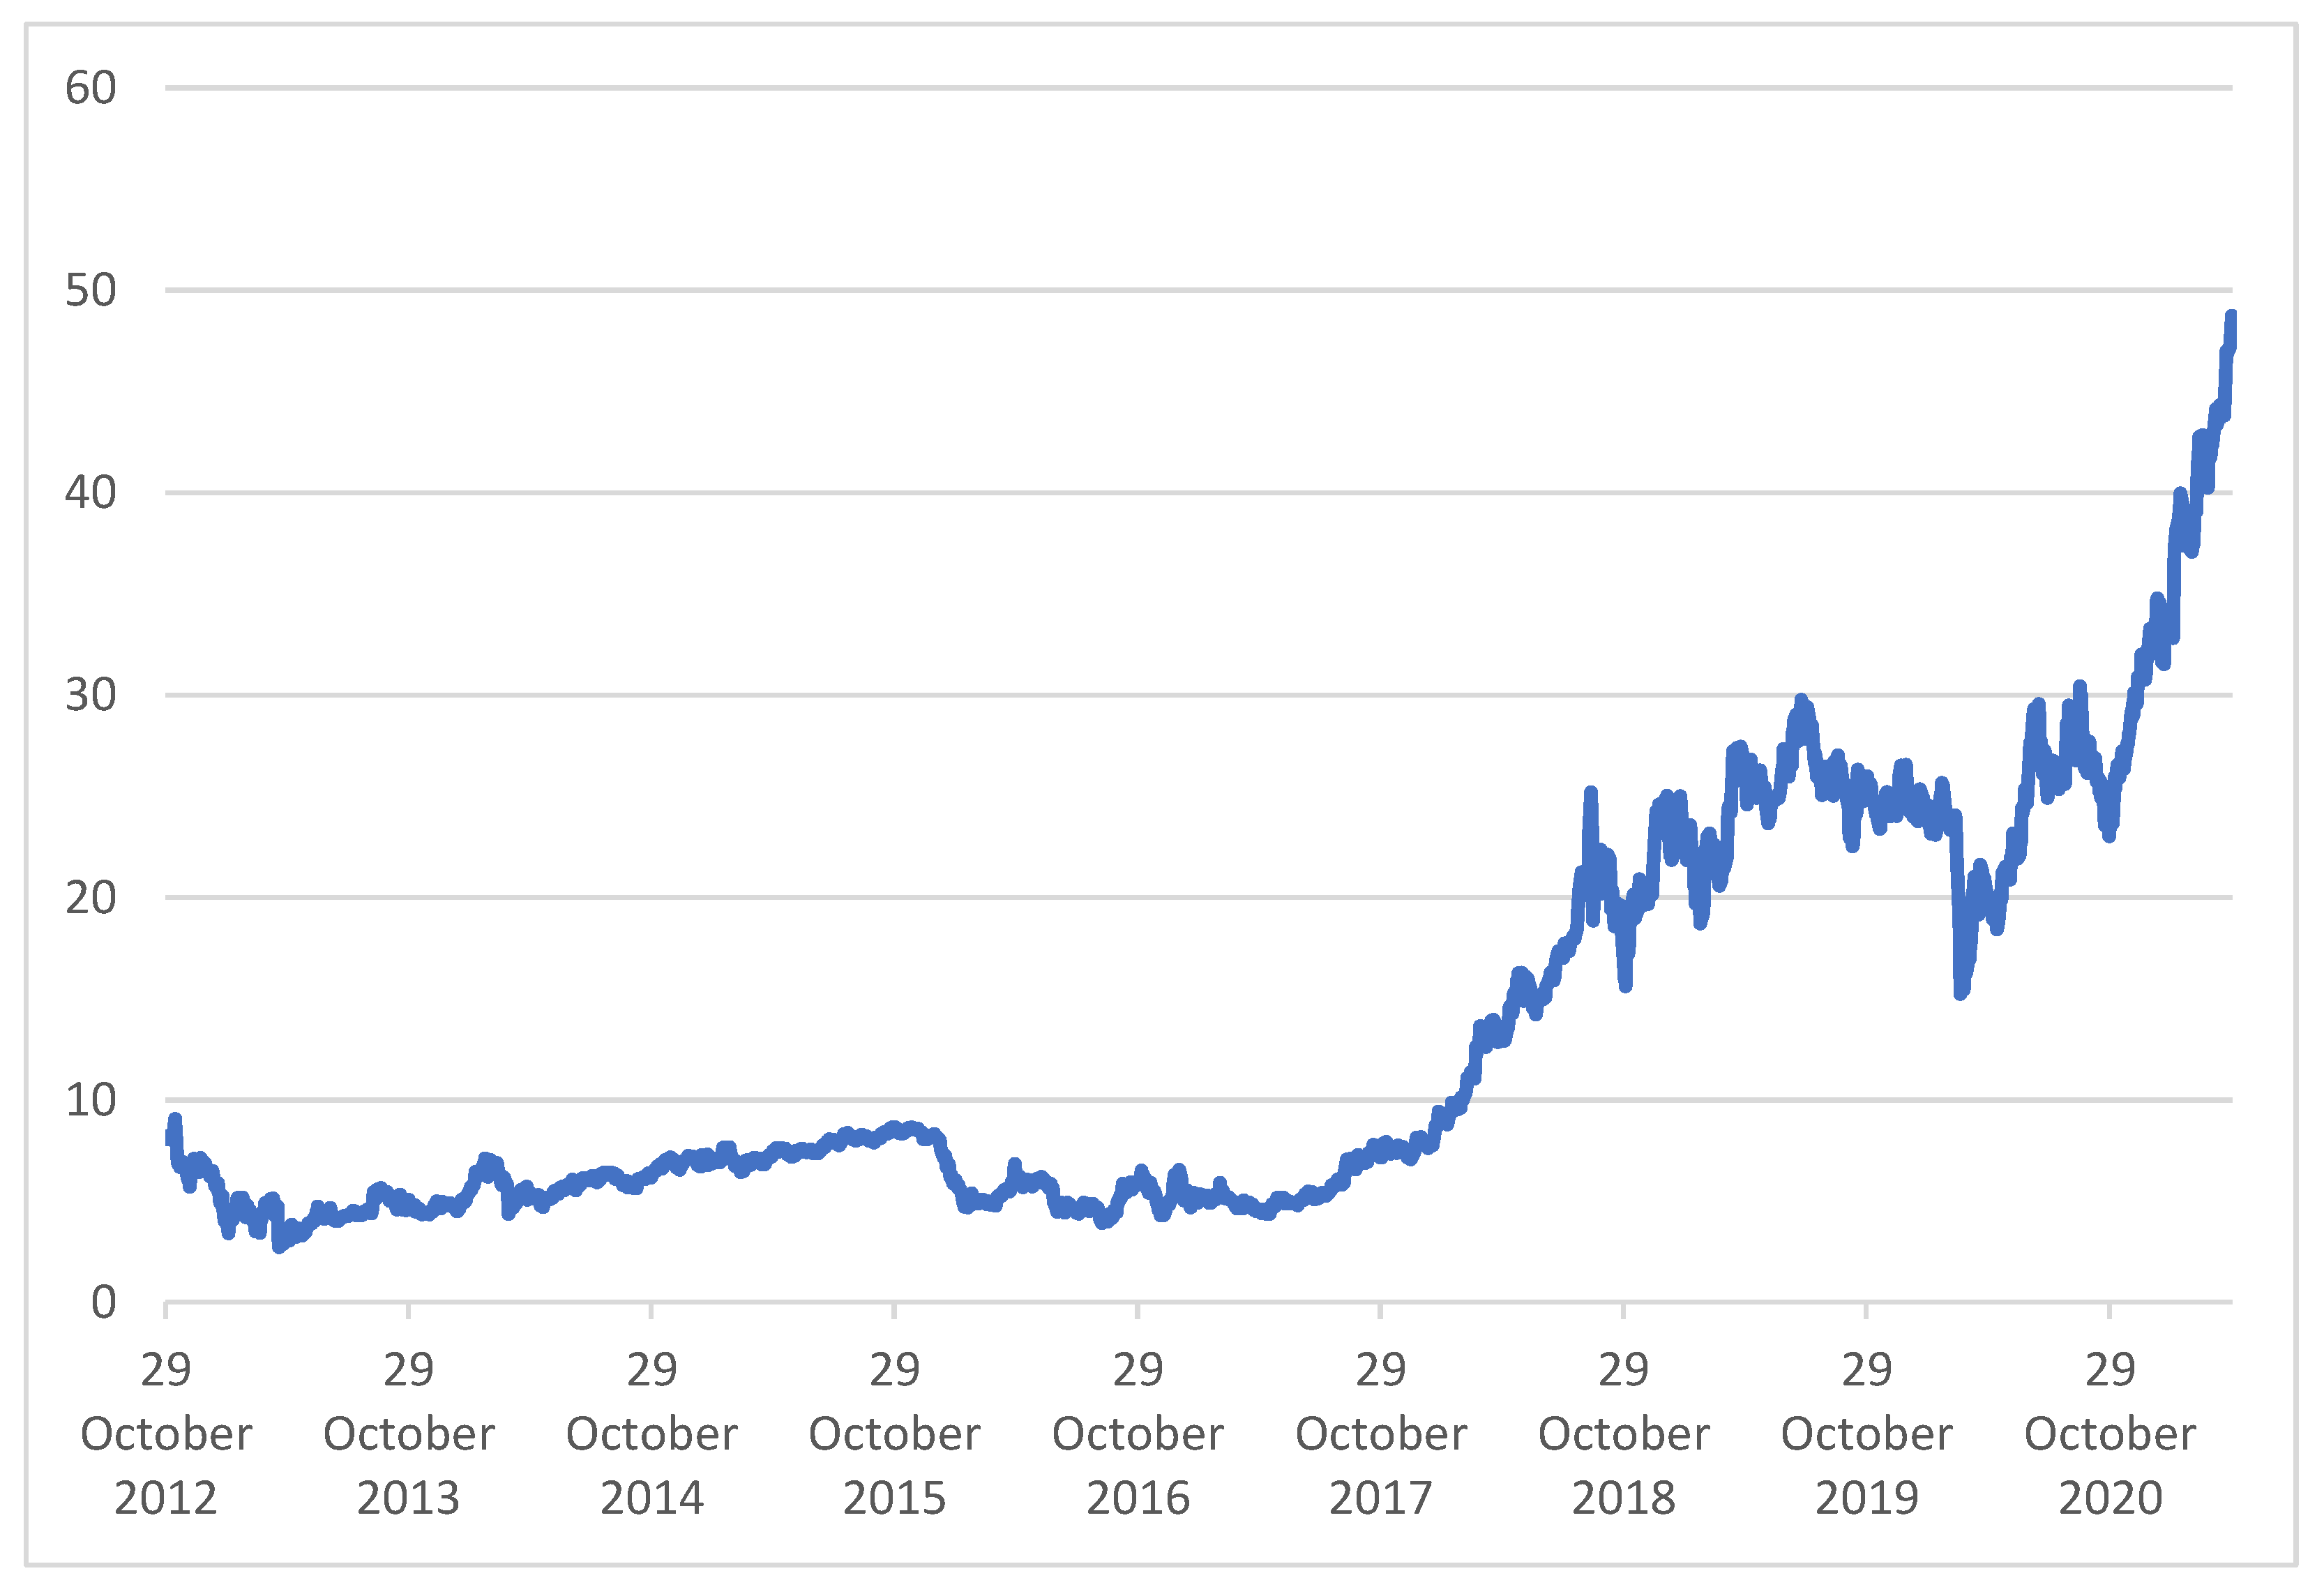
Figure 9 shows the third trading period price (TP3) of the EU ETS (Emission Trading System) for all periods 2020–2021. Emissions for 2020 are only provided by the third trading period. The graph shows a sharp increase in the price of CO
2 emission allowances. Consequently, the analytical data from the Thomson Reuters system proves that despite the reduction in CO
2 emissions during the pandemic, there was a high increase in the cost of allowances paid by companies whose activities lead to the emission of carbon dioxide into the atmosphere. This makes it less attractive to use CO
2-emitting energy sources in production.
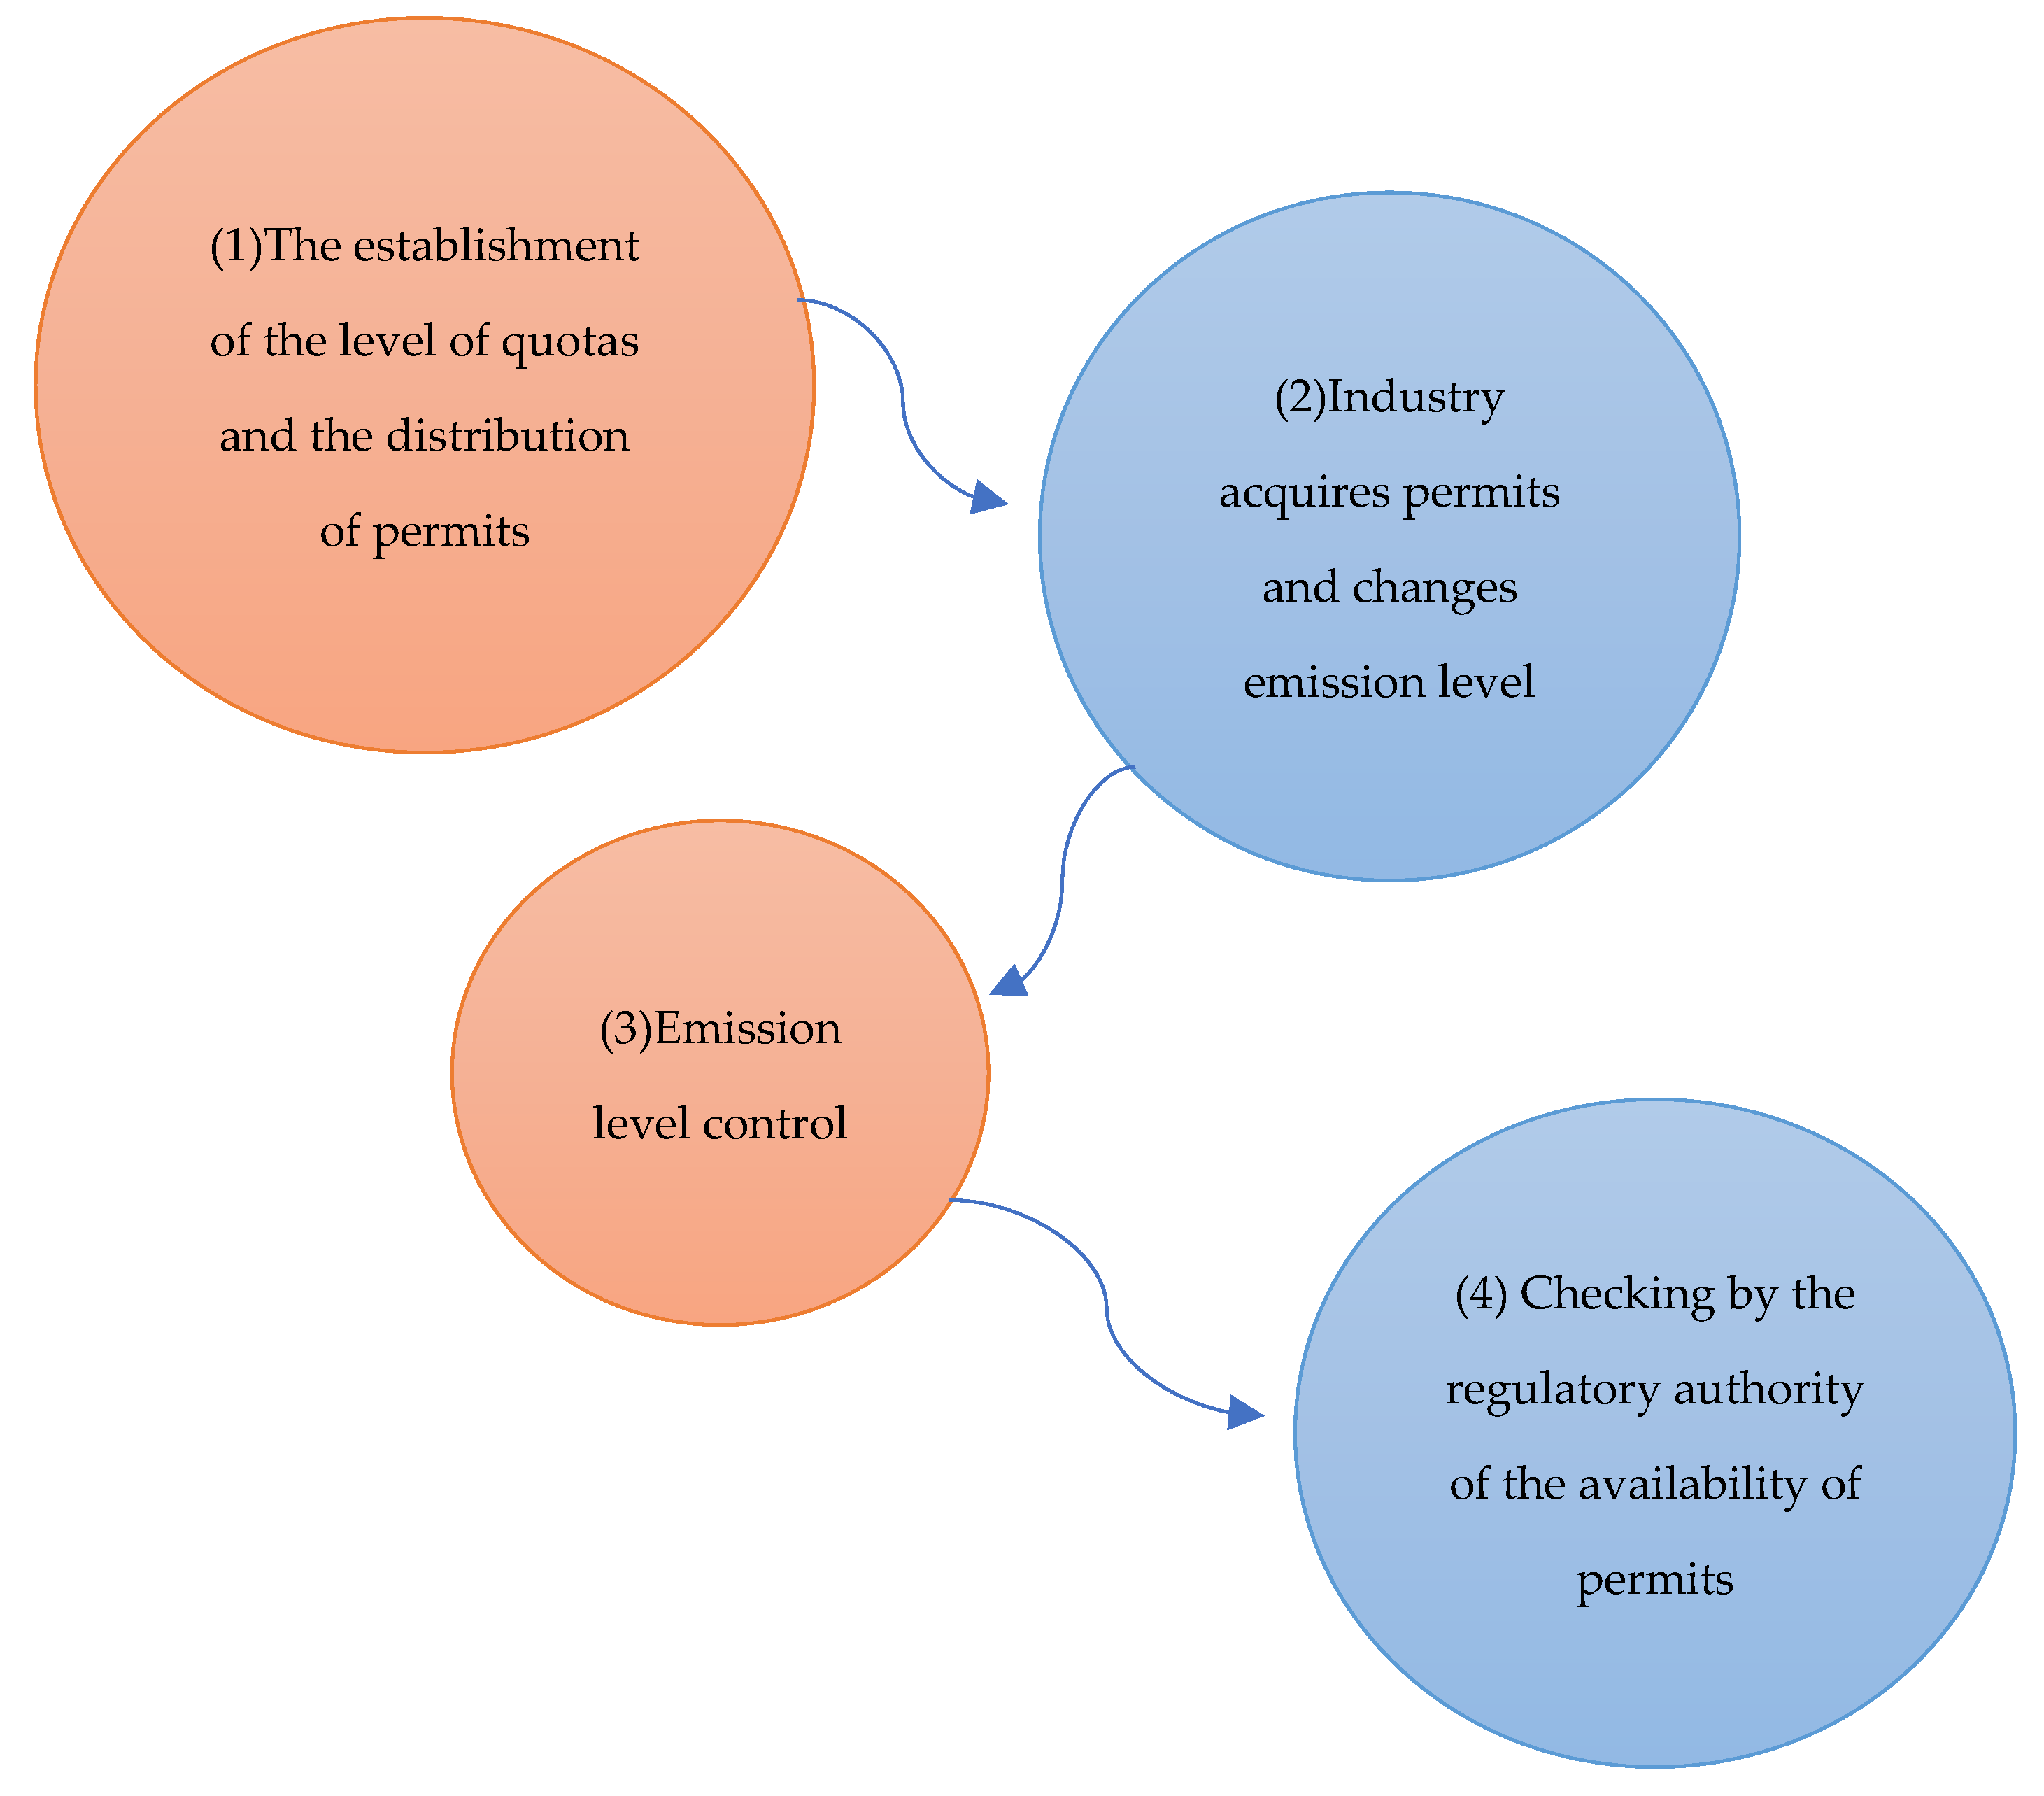
Figure 10 shows the basic emission trading scheme, which facilitates the regulatory authority’s control of the level of emissions of the enterprises. Indeed, a general allowable level is set for the sector. The regulator checks the allowable emission values against the actual situation of each unit in the sector.
5. Discussion
During the COVID-19 pandemic, many sectors of the economy underwent a crisis, through which the demand for the services and products of companies around the world decreased. The renewable energy industry is no exception.
However, the results of this study, which included the finding that the capitalization of companies included in TRBC Industry Name Renewable Fuels increased during the period of coronavirus infection, support the idea of many articles about the attractiveness of investing in renewable energy sources [
2,
32,
34,
37,
38,
39,
40,
41].
Many discussions rely on a small number of case studies and the key explanatory variable is difficult to measure across countries. Conventional energy sources have a negative impact on the environment, but renewable energy faces the problem of intermittency. Addressing the intermittent nature of renewable energy has been addressed in many articles that analyze ways to prevent it [
41]. The results of this paper confirm the novelty of this work: the coronavirus crisis has increased the economic capitalization of renewable energy companies.
Analysis using the economic performance of companies from around the world gave additional results that the capitalization of all companies analyzed increased by an average of 86%. This proves the assumptions that can be traced in many articles: economic growth and the use of cleaner energy sources are related [
2,
11,
33,
35]. Additionally, the shift to renewable energy is necessary to combat COVID-19, as polluted air promotes infection, which shows the economic attractiveness of clean energy sources and the increase in capitalization of companies producing this energy [
7].
According to the IEA, there has been a decline in investment in fossil energy sources [
29]. However, the authors’ analysis, which includes a study of the capitalization and profitability of the 10 largest fossil energy companies by capitalization, shows the opposite. The economic situation for these companies shows an increase in capitalization by the percentage of the decrease in their profitability. This fact follows from a multitude of reasons stemming from the aftermath of the pandemic. During the crisis, many countries supported this sector by investing money. The demand for these energy sources fell during the pandemic and so did the profitability of the companies. Despite the increased capitalization of fossil energy companies, there was no real growth in company revenues.
The coronavirus infection that has caused the economic crisis in many countries around the world has led to many conclusions about the need for cleaner production, using renewable energy sources. According to the IEA, there has been an outflow of investment from the fossil energy industry, through declining demand for oil [
33]. This article confirms the findings of other studies [
10,
12,
23,
36] that the demand for renewable energy has increased, leading to an increase in the share price of companies included in TRBC Industry Name Renewable Fuels. The analysis of companies producing non-renewable energy showed the instability of the economic situation in this sector, which significantly reduces the attractiveness of investing in this type of energy. In addition, there is an increase in the cost of CO
2 emission quotas.
Governments around the world are taking many measures to combat the coronavirus pandemic. In addition, their policies are focused on the transition to cleaner energy sources, despite the difficult economic situation in the world. Many articles confirm the correlation between the state of the environment and economic growth, and the authors’ study shows the promise of renewable energy investments, through a tendency to protect the environment.
6. Conclusions
According to the authors, the most urgent task during the COVID-19 pandemic is to assess the impact on renewable energy sources and the trend of their proliferation. In this article, through data analysis, the idea of increasing capitalizations of companies included in TRBC Industry Name Renewable Fuels was confirmed. Future studies look forward to a detailed analysis of the relationship between renewable and non-renewable energy consumption, as the relevance of the topic grows through a large-scale transition to cleaner energy sources.
The results of this study showed that there is an inverse relationship between the two economic indicators of firms included in TRBC Industry Name Renewable Fuels, namely, the percentage change in revenue and capitalization of companies for 2020 and 2021. Consequently, due to the economic crisis during the pandemic, the revenues of many companies around the world have fallen. However, renewable energy firms have felt an increase in investment as the need for their product to restore economic growth in many countries is evident.
The results of this analysis are more widely shown in the literature and make it clear that the COVID-19 pandemic has led to an economic crisis in countries around the world, but the new type of disease has contributed to a greater understanding of the need for a transition to renewable energy source.
Undoubtedly, this article has a high importance as it will help other researchers to use the analysis data to determine the relationship between coronavirus infection and the spread of renewable and non-renewable energy sources. In addition, this study has the prospect of further analysis as the global pandemic situation tends to change, whereby the economic performance of companies undergoes many changes. This paper contributed to the body of knowledge.
The article has limitations as there is a lack of data on many renewable energy companies and there is instability during this period of coronavirus infection.
