
Financial Stability in Companies with High ESG Scores: Evidence from North America Using the Ohlson O-Score

 , ,
, ,
Abstract
:1. Introduction
2. Literature Review
2.1. ESG Score: Concept and Components
2.2. ESG Effects on CFP
2.3. ESG Impact on a Company’s Probability of Bankruptcy
2.4. Article Hypotheses
3. Data and Methods
4. Results
5. Conclusions
Author Contributions
Funding
Institutional Review Board Statement
Informed Consent Statement
Data Availability Statement
Conflicts of Interest
References
- Cooper, E.; Uzun, H. Corporate social responsibility and bankruptcy. Stud. Econ. Financ. 2019, 36, 130–153. [Google Scholar] [CrossRef]
- Habermann, F.; Fischer, F.B. Corporate Social Performance and the Likelihood of Bankruptcy: Evidence from a Period of Economic Upswing. J. Bus. Ethics 2021, 1, 1–17. [Google Scholar] [CrossRef]
- Kamalirezaei, H.; Rostamy, A.A.A.; Saeedi, A.; Zaghard, M.K.V. Corporate social responsibility and bankruptcy probability: Exploring the role of market competition, intellectual capital, and equity cost. J. Corp. Account. Financ. 2020, 31, 53–63. [Google Scholar] [CrossRef]
- Aslan, A.; Poppe, L.; Posch, P. Are Sustainable Companies More Likely to Default? Evidence from the Dynamics between Credit and ESG Ratings. Sustainability 2021, 13, 8568. [Google Scholar] [CrossRef]
- Thomson Reuters Eikon. Thomson Reuters ESG Score. 2017, pp. 1–12. Available online: https://www.esade.edu/itemsweb/biblioteca/bbdd/inbbdd/archivos/Thomson_Reuters_ESG_Scores.pdf (accessed on 27 November 2021).
- Muñoz, R.M.; De Pablo, J.D.S.; Salinero, Y.; Peña, I. Risk measures and the risk-return paradox: An analysis in the context of the economic crisis. Rev. Bus. Manag. 2020, 22, 348–362. [Google Scholar] [CrossRef]
- Dorfleitner, G.; Halbritter, G.; Nguyen, M. Measuring the level and risk of corporate responsibility–An empirical comparison of different ESG rating approaches. J. Asset Manag. 2015, 16, 450–466. [Google Scholar] [CrossRef]
- Pedersen, L.H.; Fitzgibbons, S.; Pomorski, L. Responsible investing: The ESG-efficient frontier. J. Financ. Econ. 2020, 142, 572–597. [Google Scholar] [CrossRef]
- An, J.; Mikhaylov, A.; Jung, S.-U. A Linear Programming Approach for Robust Network Revenue Management in the Airline Industry. J. Air Transp. Manag. 2021, 91, 101979. [Google Scholar] [CrossRef]
- Mikhaylov, A. Development of Friedrich von Hayek’s theory of private money and economic implications for digital currencies. Terra Econ. 2021, 19, 53–62. [Google Scholar] [CrossRef]
- Daniali, S.M.; Barykin, S.E.; Kapustina, I.V.; Mohammadbeigi Khortabi, F.; Sergeev, S.M.; Kalinina, O.V.; Mikhaylov, A.; Veynberg, R.; Zasova, L.; Senjyu, T. Predicting Volatility Index According to Technical Index and Economic Indicators on the Basis of Deep Learning Algorithm. Sustainability 2021, 13, 14011. [Google Scholar] [CrossRef]
- Mutalimov, V.; Kovaleva, I.; Mikhaylov, A.; Stepanova, D. Assessing regional growth of small business in Russia. Entrep. Bus. Econ. Rev. 2021, 9, 119–133. [Google Scholar] [CrossRef]
- Saqib, A.; Chan, T.-H.; Mikhaylov, A.; Lean, H.H. Are the Responses of Sectoral Energy Imports Asymmetric to Exchange Rate Volatilities in Pakistan? Evidence From Recent Foreign Exchange Regime. Front. Energy Res. 2021, 9, 614463. [Google Scholar] [CrossRef]
- An, J.; Mikhaylov, A.; Richter, U.H. Trade War Effects: Evidence from Sectors of Energy and Resources in Africa. Heliyon 2020, 6, e05693. [Google Scholar] [CrossRef] [PubMed]
- An, J.; Mikhaylov, A. Russian energy projects in South Africa. J. Energy S. Afr. 2020, 31, 58–64. [Google Scholar] [CrossRef]
- Moiseev, N.; Mikhaylov, A.; Varyash, I.; Saqib, A. Investigating the relation of GDP per capita and corruption index. Entrep. Sustain. Issues 2020, 8, 780–794. [Google Scholar] [CrossRef]
- Varyash, I.; Mikhaylov, A.; Moiseev, N.; Aleshin, K. Triple bottom line and corporate social responsibility performance indicators for Russian companies. Entrep. Sustain. Issues 2020, 8, 313–331. [Google Scholar] [CrossRef]
- La Torre, M.; Mango, F.; Cafaro, A.; Leo, S. Does the ESG Index Affect Stock Return? Evidence from the Eurostoxx50. Sustainability 2020, 12, 6387. [Google Scholar] [CrossRef]
- Deng, X.; Cheng, X. Can ESG Indices Improve the Enterprises’ Stock Market Performance?—An Empirical Study from China. Sustainability 2019, 11, 4765. [Google Scholar] [CrossRef] [Green Version]
- Buallay, A. Is sustainability reporting (ESG) associated with performance? Evidence from the European banking sector. Manag. Environ. Qual. Int. J. 2019, 30, 98–115. [Google Scholar] [CrossRef]
- Garcia, A.S.; Mendes-Da-Silva, W.; Orsato, R.J. Corporate sustainability, capital markets, and ESG performance. In Individual Behaviors and Technologies for Financial Innovations; Springer: Berlin/Heidelberg, Germany, 2019; pp. 287–309. [Google Scholar]
- Kim, S.; Li, Z. Understanding the Impact of ESG Practices in Corporate Finance. Sustainability 2021, 13, 3746. [Google Scholar] [CrossRef]
- Drempetic, S.; Klein, C.; Zwergel, B. The Influence of Firm Size on the ESG Score: Corporate Sustainability Ratings under Review. J. Bus. Ethics 2020, 167, 333–360. [Google Scholar] [CrossRef]
- Gavana, G.; Gottardo, P.; Moisello, A.M. The effect of equity and bond issues on sustainability disclosure. Fam. Vs Non-Fam. Ital. Firms. Soc. Responsib. J. 2017, 13, 126–142. [Google Scholar]
- Starks, L.T. EFA Keynote Speech: “Corporate Governance and Corporate Social Responsibility: What Do Investors Care about? What Should Investors Care about?”. Financ. Rev. 2009, 44, 461–468. [Google Scholar] [CrossRef]
- Hong, H.; Kacperczyk, M. The price of sin: The effects of social norms on markets. J. Financ. Econ. 2009, 93, 15–36. [Google Scholar] [CrossRef]
- Paradis, G.; Schiehll, E. ESG Outcasts: Study of the ESG Performance of Sin Stocks. Sustainability 2021, 13, 9556. [Google Scholar] [CrossRef]
- Sharma, Z.; Song, L. Corporate social responsibility (CSR) practices by SIN firms: Evidence from CSR activity and disclosure. Asian Rev. Account. 2018, 26, 359–372. [Google Scholar] [CrossRef]
- Velte, P. Does ESG performance have an impact on financial performance? Evidence from Germany. J. Glob. Responsib. 2017, 8, 169–178. [Google Scholar] [CrossRef]
- Landi, G.; Sciarelli, M. Towards a more ethical market: The impact of ESG rating on corporate financial performance. Soc. Responsib. J. 2019, 15, 11–27. [Google Scholar] [CrossRef]
- Zhao, C.; Guo, Y.; Yuan, J.; Wu, M.; Li, D.; Zhou, Y.; Kang, J. ESG and Corporate Financial Performance: Empirical Evidence from China’s Listed Power Generation Companies. Sustainability 2018, 10, 2607. [Google Scholar] [CrossRef] [Green Version]
- Chelawat, H.; Trivedi, I.V. The business value of ESG performance: The Indian context. Asian J. Bus. Ethics 2016, 5, 195–210. [Google Scholar] [CrossRef]
- Nirino, N.; Santoro, G.; Miglietta, N.; Quaglia, R. Corporate controversies and company’s financial performance: Exploring the moderating role of ESG practices. Technol. Forecast. Soc. Chang. 2021, 162, 120341. [Google Scholar] [CrossRef]
- Huang, D.Z.X. Environmental, social and governance (ESG) activity and firm performance: A review and consolidation. Account. Financ. 2021, 61, 335–360. [Google Scholar] [CrossRef]
- Kim, J.; Chung, S.; Park, C. Corporate Social Responsibility and Financial Performance: The impact of the MSCI ESG Ratings on Korean Firms. J. Korea Acad. Coop. Soc. 2013, 14, 5586–5593. [Google Scholar]
- Yoon, B.; Lee, J.H.; Byun, R. Does ESG Performance Enhance Firm Value? Evidence from Korea. Sustainability 2018, 10, 3635. [Google Scholar] [CrossRef] [Green Version]
- DasGupta, R. Financial Performance Shortfall, ESG Controversies, and ESG Performance: Evidence from Firms around the World. Financ. Res. Lett. 2021, 1, 102487. [Google Scholar] [CrossRef]
- Bătae, O.M.; Dragomir, V.D.; Feleagă, L. The relationship between environmental, social, and financial performance in the banking sector: A European study. J. Clean. Prod. 2021, 290, 125791. [Google Scholar] [CrossRef]
- De Lucia, C.; Pazienza, P.; Bartlett, M. Does Good ESG Lead to Better Financial Performances by Firms? Machine Learning and Logistic Regression Models of Public Enterprises in Europe. Sustainability 2020, 12, 5317. [Google Scholar] [CrossRef]
- Lopez-de-Silanes, F.; McCahery, J.A.; Pudschedl, P.C. ESG performance and disclosure: A cross-country analysis. Singap. J. Leg. Stud. 2020, 1, 217–241. [Google Scholar]
- Shakil, M.H.; Mahmood, N.; Tasnia, M.; Munim, Z.H. Do environmental, social and governance performance affect the financial performance of banks? A cross-country study of emerging market banks. Manag. Environ. Qual. Int. J. 2019, 30, 1331–1344. [Google Scholar] [CrossRef]
- Ting, I.W.K.; Azizan, N.A.; Bhaskaran, R.K.; Sukumaran, S.K. Corporate Social Performance and Firm Performance: Comparative Study among Developed and Emerging Market Firms. Sustainability 2020, 12, 26. [Google Scholar] [CrossRef] [Green Version]
- Oprean-Stan, C.; Oncioiu, I.; Iuga, I.C.; Stan, S. Impact of sustainability reporting and inadequate management of ESG factors on corporate performance and sustainable growth. Sustainability 2020, 12, 8536. [Google Scholar] [CrossRef]
- Hwang, J.; Kim, H.; Jung, D. The Effect of ESG Activities on Financial Performance during the COVID-19 Pandemic—Evidence from Korea. Sustainability 2021, 13, 11362. [Google Scholar] [CrossRef]
- Broadstock, D.C.; Chan, K.; Cheng, L.T.; Wang, X. The role of ESG performance during times of financial crisis: Evidence from COVID-19 in China. Financ. Res. Lett. 2021, 38, 101716. [Google Scholar] [CrossRef]
- Hoang, T.H.V.; Segbotangni, E.A.; Lahiani, A. Does ESG disclosure transparency help mitigate the Covid-19 pandemic shock? An Empirical Analysis of Listed Firms in the UK. In Proceedings of the Conference of Innover pour une Finance Responsable et Durable, Paris, France, 26 November 2020; pp. 1–31. [Google Scholar]
- Rubbaniy, G.; Khalid, A.A.; Ali, S.; Naveed, M. Are ESG stocks safe-haven during COVID-19? Stud. Econ. Financ. 2021, 1, 1–24. [Google Scholar]
- Altman, E.I. Financial ratios, discriminant analysis and the prediction of corporate bankruptcy. J. Financ. 1968, 23, 589–609. [Google Scholar] [CrossRef]
- Dang, C.; Li, Z.; Yang, C. Measuring firm size in empirical corporate finance. J. Bank. Financ. 2018, 86, 159–176. [Google Scholar] [CrossRef]
- Moeller, S.B.; Schlingemann, F.P.; Stulz, R.M. Firm size and the gains from acquisitions. J. Financ. Econ. 2004, 73, 201–228. [Google Scholar] [CrossRef]
- Ohlson, J.A. Financial Ratios and the Probabilistic Prediction of Bankruptcy. J. Account. Res. 1980, 18, 109–131. [Google Scholar] [CrossRef] [Green Version]
- Volnyakova, O.A. Consideration of the economic question from a moral point of view in Russian philosophy at the turn of the XIX and XX centuries. Russ. Technol. J. 2016, 4, 101–107. [Google Scholar]
- Pishchik, V.; Alekseev, P. Cybercrime as a Key Operational Risk of the Payment and Settlement Infrastructure of the Global Financial System and Approaches to Its Regulation in the Eurasian Economic Union. Financ. J. 2021, 13, 54–66. [Google Scholar] [CrossRef]
- Lukashov, A. Some Directions of Increasing the Efficiency of Public Administration in the Context of Digitalization. Financ. J. 2021, 13, 67–75. [Google Scholar] [CrossRef]
- Mandych, I.A.; Bykova, A.V. Difficulties and prospects for the development of high-tech projects in the epoch of digital transformation of economy. Russ. Technol. J. 2021, 9, 88–95. [Google Scholar] [CrossRef]
- Kudelich, M. Problems of Innovative Science and Technology Center Financing From Budgetary Funds. Financ. J. 2021, 13, 76–87. [Google Scholar] [CrossRef]
- Sinenko, O.; Mitrofanov, T. Identification of Signs of “Business Fragmentation” in Russian Far Eastern Territories with Special Economic Status. Financ. J. 2021, 13, 88–103. [Google Scholar] [CrossRef]
- Artemiev, A. The Flow of Dividends to the Seller: Customs Valuation Methodology. Financ. J. 2021, 13, 104–115. [Google Scholar] [CrossRef]


| NAICS Sector Name | USA | Canada | Mexico | Σ |
|---|---|---|---|---|
| Agriculture, Forestry, etc. | 1 | - | - | 1 |
| Arts, Entertainment | 1 | 1 | - | 2 |
| Construction | 2 | 1 | - | 3 |
| Educational Services | 3 | 1 | - | 4 |
| Finance and Insurance | 16 | 4 | - | 20 |
| Food Services | 15 | - | - | 15 |
| Health Care and Social Assistance | 9 | 1 | - | 10 |
| Information | 45 | 11 | 2 | 58 |
| Manufacturing | 230 | 19 | 9 | 258 |
| Mining, etc. | 40 | 53 | 2 | 95 |
| Other services | 2 | - | - | 2 |
| Real Estate and Rental and Leasing | 9 | 8 | - | 17 |
| Retail Trade | 47 | 8 | 3 | 58 |
| Technical Services | 34 | 3 | - | 37 |
| Transportation… | 20 | 11 | 1 | 32 |
| Utilities | 36 | 8 | - | 44 |
| Waste Management | 12 | 1 | - | 13 |
| Wholesale Trade | 16 | 6 | - | 22 |
| Σ | 538 | 136 | 17 | 691 |
| Variable | obs. | Minimum | Maximum | Mean | Median | Standard Deviation |
|---|---|---|---|---|---|---|
| ln(TA/GNP) | 6910 | 13.29393976 | 22.6556077 | 18.07789037 | 17.98124699 | 1.328154194 |
| TL/TA | 6910 | −0.033303864 | 2.919128329 | 0.611619638 | 0.604737521 | 0.233677173 |
| WC/TA | 6910 | −0.774021209 | 0.805020479 | 0.123773152 | 0.095643073 | 0.15424449 |
| CL/CA | 6910 | 0.030190299 | 46.45866957 | 0.823361064 | 0.662895691 | 1.092067016 |
| NI/TA | 6910 | −0.728165251 | 0.562697256 | 0.065303471 | 0.059064293 | 0.068740066 |
| FFO/TL | 6910 | −6.820982273 | 7.303295528 | 0.148849097 | 0.108405466 | 0.372157634 |
| (Nit-Nit-1)/(|Nit|+|Nit-1|) | 6910 | −1 | 1 | 0.001743507 | 0.028076454 | 0.324416369 |
| Environmental Pillar | 6910 | 0 | 98.54580592 | 41.45778312 | 42.0610691 | 28.43794078 |
| Social Pillar | 6910 | 0.479104204 | 98.11888653 | 50.28304846 | 49.61462394 | 22.25740378 |
| Governance Pillar | 6910 | 0.29209622 | 99.41169418 | 54.97992929 | 56.88219677 | 21.99691158 |
| ESG Score | 6910 | 0.51184547 | 94.04072679 | 49.28488824 | 49.3048802 | 20.0581286 |
| O-score | 6910 | −22.31584649 | 8.089425216 | −5.584279513 | −5.447788448 | 1.759841012 |
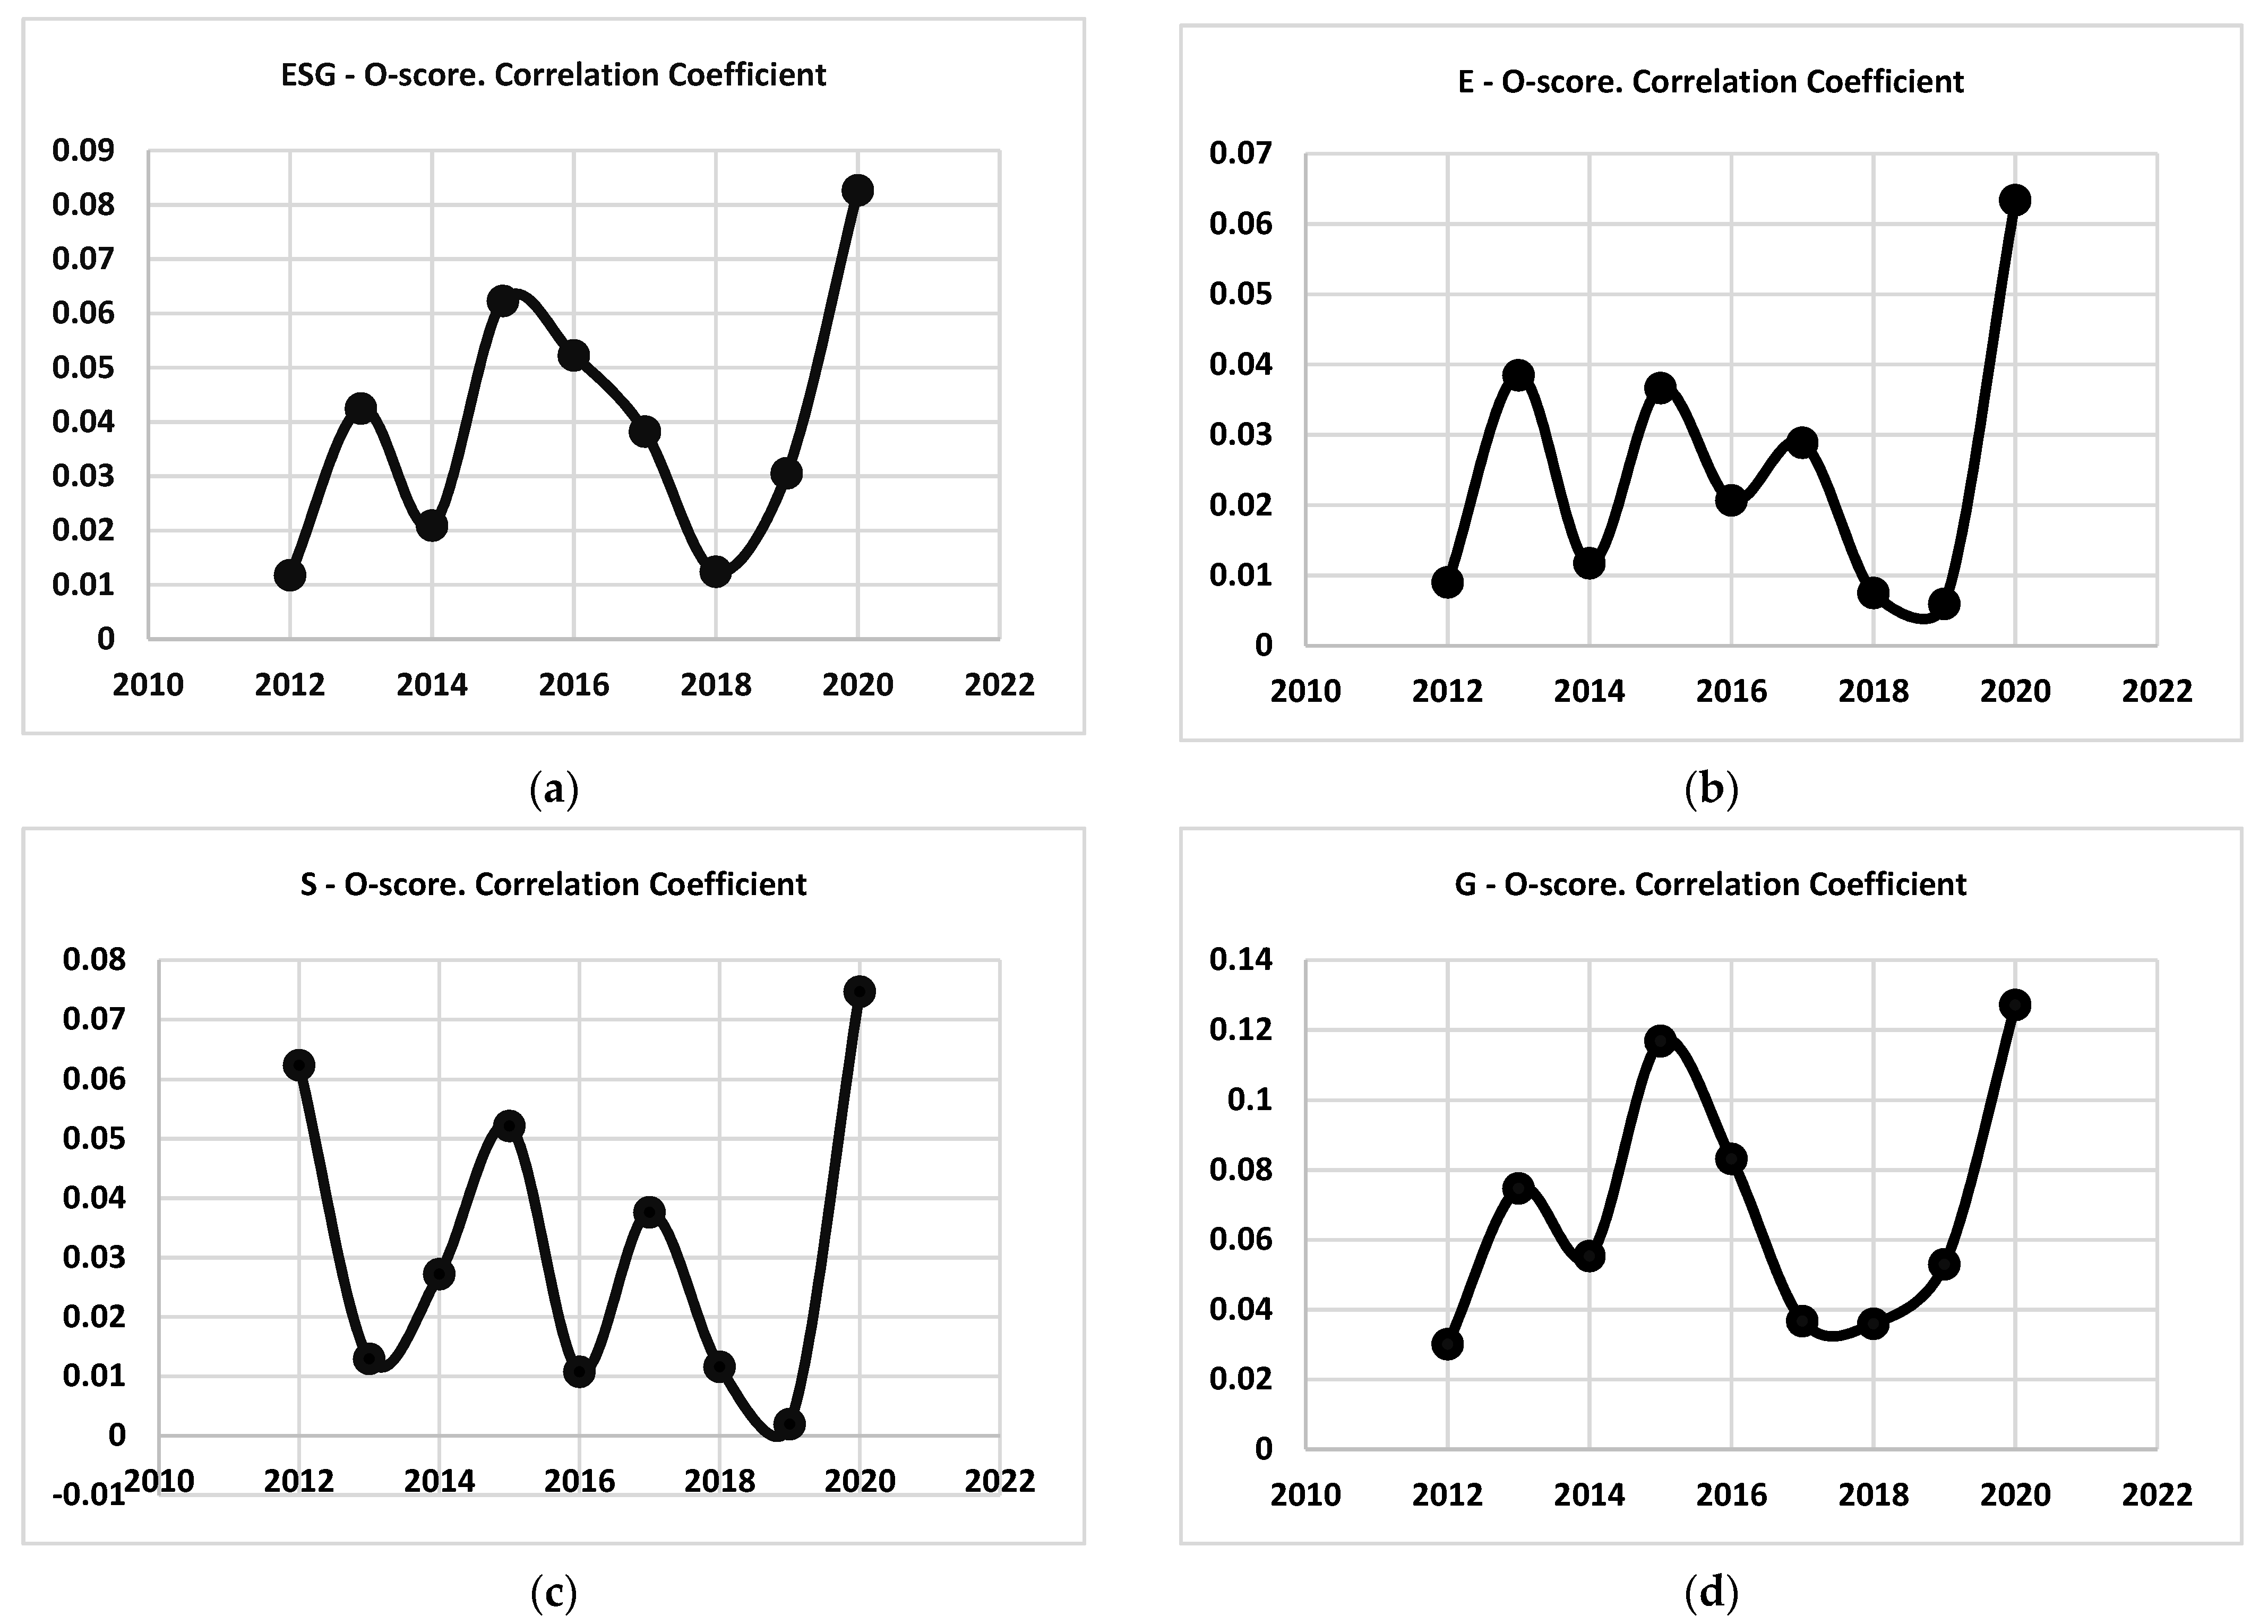
| Variable | 2012 | 2013 | 2014 | 2015 | 2016 | 2017 | 2018 | 2019 | 2020 |
|---|---|---|---|---|---|---|---|---|---|
| ESG | 0.011802 | −0.04249 | −0.02091 | −0.0623 | −0.05227 | −0.03825 | 0.012419 | −0.03054 | 0.042666 |
| E | 0.009035 | −0.03846 | −0.01174 | −0.03664 | −0.02069 | −0.02889 | −0.00752 | −0.00597 | −0.02338 |
| S | −0.03011 | −0.07476 | −0.05536 | −0.11685 | −0.08323 | −0.03676 | −0.03597 | −0.05299 | −0.037128 |
| G | 0.062394 | 0.01293 | 0.027202 | 0.052149 | 0.010769 | 0.037611 | 0.011613 | 0.00196 | 0.036748 |
| Regression Statistics | |
|---|---|
| Regression Coefficient | 0.215286807 |
| Adjusted R Square | 0.0449643 |
| Standard Error | 1.64307 × 10¹¹ |
| Observations | 691 |
| SS | MS | F | Significance F | |
|---|---|---|---|---|
| Regression | 9.04022 × 10²³ | 9.04022 × 10²³ | 33.48608051 | 1.08976 × 10⁻⁸ |
| Residual | 1.86009 × 1025 | 2.69969 × 10²² | ||
| Total | 1.95049 × 1025 |
Publisher’s Note: MDPI stays neutral with regard to jurisdictional claims in published maps and institutional affiliations. |
© 2022 by the authors. Licensee MDPI, Basel, Switzerland. This article is an open access article distributed under the terms and conditions of the Creative Commons Attribution (CC BY) license (https://creativecommons.org/licenses/by/4.0/).
Share and Cite
Lisin, A.; Kushnir, A.; Koryakov, A.G.; Fomenko, N.; Shchukina, T. Financial Stability in Companies with High ESG Scores: Evidence from North America Using the Ohlson O-Score. Sustainability 2022, 14, 479. https://doi.org/10.3390/su14010479
Lisin A, Kushnir A, Koryakov AG, Fomenko N, Shchukina T. Financial Stability in Companies with High ESG Scores: Evidence from North America Using the Ohlson O-Score. Sustainability. 2022; 14(1):479. https://doi.org/10.3390/su14010479
Chicago/Turabian StyleLisin, Anton, Andrei Kushnir, Alexey G. Koryakov, Natalia Fomenko, and Tatyana Shchukina. 2022. "Financial Stability in Companies with High ESG Scores: Evidence from North America Using the Ohlson O-Score" Sustainability 14, no. 1: 479. https://doi.org/10.3390/su14010479
APA StyleLisin, A., Kushnir, A., Koryakov, A. G., Fomenko, N., & Shchukina, T. (2022). Financial Stability in Companies with High ESG Scores: Evidence from North America Using the Ohlson O-Score. Sustainability, 14(1), 479. https://doi.org/10.3390/su14010479