1. Introduction
The European Union’s energy policy is characterized by an integrated approach to energy security, environmental and climate protection and meeting social needs. The main objective of EU sustainable energy policy is to reduce the use of fossil fuels in favor of energy from renewable sources [
1,
2,
3]. Many governments support large-scale investments in renewable energy through various financial mechanisms [
4], but, given the new geopolitical challenges, the green transition needs to be accelerated.
Solar energy is currently the cheapest source of electricity in history, with price/cost ranging from 0.7 EUR/W (for ground-mounted solar systems) to 1.2 EUR/W (for floating systems), according to a 2021 report by the International Energy Agency [
5]. Other important advantages are related to the wide availability of the energy source, zero cost of electricity consumption after the payback period and environmental friendliness of this energy source and zero impact on the Earth’s energy balance [
6]. The main problems related to this energy source are those related to the storage of solar energy, the relatively high cost of the installation, the high dependence of energy on seasonality and the energy panels, which require a very large area for installation [
7,
8].
Romania’s energy mix is well balanced compared to other member states from South Eastern Europe [
9], and it has reached its 2020 target for the share of renewable energy in gross final energy consumption ahead of schedule, exceeding the established indicative trajectory. The overall target was 24%, which Romania managed to reach in 2017. The indicative trajectory was set at 21.83% for 2017–2018, while the total shares of renewable energy consumption in gross final energy consumption were 24.45% (2017) and 23.87% (2018) [
10]. In the last ten years, Romania has installed more than 1300 MW in ground-mounted PhotoVoltaic (PV) plants [
11]. This experience in the field of PV systems can be complemented by real-scale laboratories, e.g., those existing in Romanian technical universities, related to different PV cells and panel technologies [
12] possibly integrated with other renewable energy sources (RES) [
13] and even analysis of operation under harsh conditions [
14].
According to the National Program for 2021–2030, Romania has an ambitious target of achieving 50% share of electricity consumption from renewable energy sources by 2030. The European Commission’s assessment of the plan confirms that this is a realistic target, given that “hydropower is expected to remain stable throughout the period 2020–2030, while wind generation will almost double and solar generation will almost quadruple in absolute output” [
15].
Moving beyond the topic of energy policy, [
16] clarifies the definition of marginalized community as a group of people who lack access to the city’s economic and formal infrastructure, highlighting the synonymy of marginalization with poverty. Lack of access to water and energy resources is mentioned among the main characteristics of marginalized areas.
To address the needs of marginalized communities, the European Commission has developed the concept of community-led local development (CLLD) to describe a bottom-up approach, with a partnership created to encourage cooperation between the public sector, private sector and civil society, with the main aim of developing and implementing an integrated development strategy. Building on the LEADER programme that was applied in rural areas during the 2007–2013 programming period [
17], the CLLD instrument is considered appropriate for urban areas with a population of less than 150,000 people. The available funds (ERDF and ESF financial support) can be integrated to support the local development strategy (LDS) [
18]. Next, [
19] provides an overview of the extent to which the CLLD instrument has been adopted across the EU and presents three country cases from Slovenia, Sweden and the Austrian state of Tyrol, together with maps of Local Action Groups (LAGs) in these countries, along with support for further diversification and strengthening of themes, paving the way for topics on climate change, climate change adaptation and mobility for the 2021–2027 programming period.
LAGs represent an important feature of the instrument, being set up in territorially compact areas within cross-sectoral, area-based CLLD partnerships [
20]. As part of the local development strategy prepared with an indication of the target area and target population, including a SWOT analysis and following the traditional steps of a local development strategy [
21], LAGs are responsible for implementing different types of local initiatives, from human capital to infrastructure projects, with the support of the local community and strictly according to the needs of the area under consideration.
The analysis of 324 rural LAGs prepared for the 2014–2020 EU programming period in Poland [
22] showed that despite the potential for implementing local renewable energy initiatives, there was limited interest in local development strategies for investments or educational activities in renewable energy. The topic of energy in marginalized areas in Europe (both rural and urban) was only partially included in the overall analysis of partnership objectives and activities [
23] and detailed overview of renewable energy actions included in local development strategies developed by LAGs has not been carried out in any of the EU countries [
24].
Furthermore, in assessing the acceptability of communities toward renewable energy projects by taking into account their socio-demographic composition, their rationality style in terms of goals, values or traditions, it was concluded that solar, biomass and hydro projects may have a higher level of acceptance than wind farm projects [
25].
In Romania, CLLD funding is available for two types of LAGs: (1) communities in marginalized urban areas (MUAs) with more than 20,000 inhabitants (37 urban LAGs were financed so far); (2) rural areas and cities with less than 20,000 inhabitants (239 rural LAGs and 14 Fisheries Local Action Groups (FLAGs)). For rural LAGs, the focus is usually on inter-jurisdictional cooperation, as well as cooperation with private sector representatives and NGOs, to address concrete local development challenges. For urban CLLDs, the focus is usually on marginalized communities in an urban area, concentrating on reducing the risk of poverty and exclusion, especially among the Roma community.
At the end of 2019, there were 9,548,041 users connected to electricity grids in Romania, with 55% of located in urban areas and the remaining 45% being located in rural areas [
26]. Although the service is largely provided in urban areas, a lack of access to electricity is one of the most important indicators for marginalization, indicating makeshift shelters, ruined buildings, illegally occupied buildings or newly built houses that are not yet connected to the grid. About 25% of all urban dwellings without access are located in marginalized areas, according to the last census figures provided in 2011 by the National Institute for Statistics.
MUAs are poorly equipped with urban utilities compared to the rest of the living areas: 30% of the households are not connected to the water supply network (compared to 6.3% at national level in urban areas), and 33% of the households are not connected to a sewerage system (compared to 6.9%). On average, 4.1% of households in marginalized urban areas do not have access to electricity, compared to 0.4% in non-marginalized urban areas, and in terms of coverage, less than 1% of the urban population lack access. Moreover, 24% of the houses are not in private ownership by the tenants, which is a proportion that is almost three-times higher than the national urban average, and the majority of the population owes payments to utilities [
27]. The overall picture is completed with the lack of available data on energy poverty [
28].
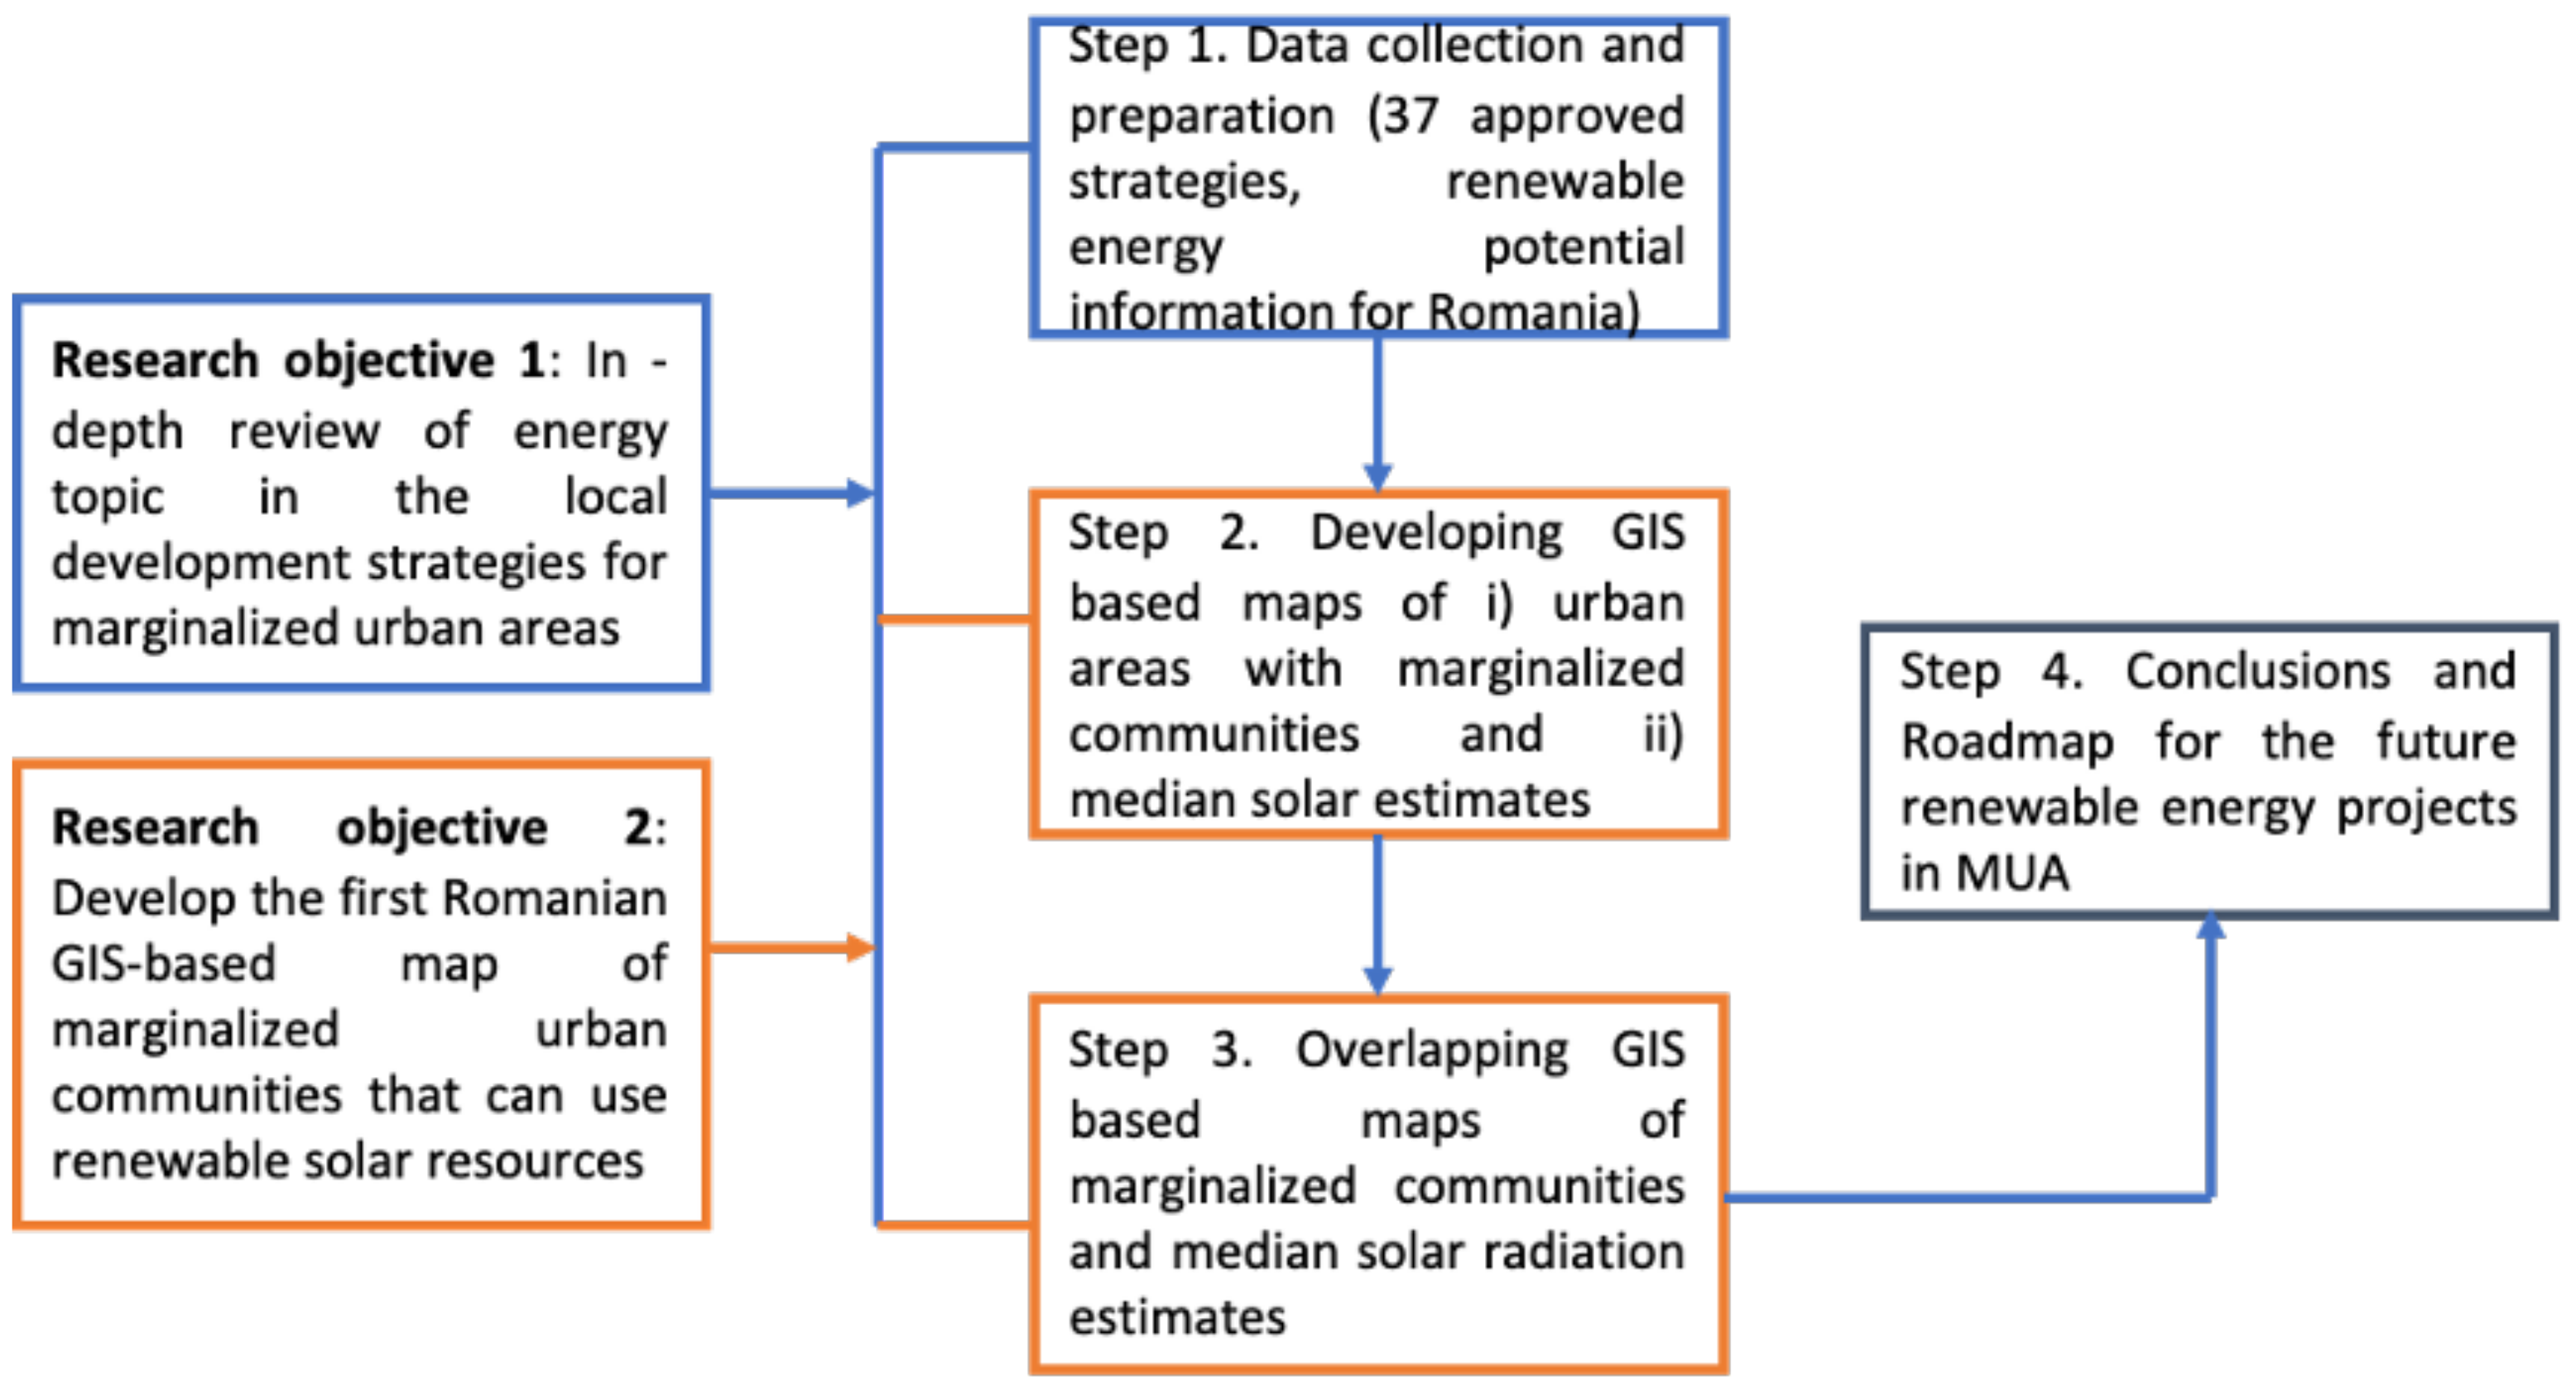
Analysing the demands and limitations of the current literature, we propose two research questions: (1) Are the European Union’s efforts to invest in renewable energy reflected in the objectives of marginalized communities in Romania? (2) Is solar energy adequate for the energy problems of Romanian MUAs? To answer these questions, we determined two research objectives (ROs) in
Figure 1.
RO1—In depth analysis of the energy topic in the 37 urban LDS approved under the CLLD mechanism in Romania to determine the energy problems of marginalized local communities and, based on these, the potential for developing renewable energy projects.
RO2—Development of the first Romanian Geographic Information System (GIS)-based map of urban areas with marginalized communities that can use solar resources. The map can be used for the preparation of solar energy projects in the framework of the future approved strategies for marginalized communities and is considered a useful tool for Management Authorities and Intermediate Bodies, Local Authorities and LAGs.
Thus, this paper is the first interdisciplinary study connecting (i) the in-depth research of existing local development strategies of marginalized urban communities in Romania, demonstrating the energy problems and the necessity of using renewable resources toward energy transition and (ii) map of median solar radiation estimates for each MUA using Photovoltaic Geographical Information System (PVGIS) solar radiation tools, demonstrating the potential for the future use of solar energy in MUAs.
For this paper, we explored the potential of solar energy as a viable resource for marginalized communities in cities of over 20,000 inhabitants in medium-density areas, where wind turbines are not fully adequate (being most common in rural regions).
Our paper is structured as follows. In
Section 2, we describe the methods and materials used to analyze LDS in marginalized urban areas in Romania.
Section 3 provides, on the one hand, the results of the research of 37 LDS in terms of energy supply status for the inhabitants of the marginalized communities in urban areas (MUAs), demonstrating the necessity for considering renewable energy sources. On the other hand,
Section 3 provides the first map elaborated in Romania showing the solar energy potential for the 37 local development strategies for MUAs situated in 36 urban areas. It also discusses our findings related to the possibility of including energy actions in present and future LDS. In
Section 4, conclusions are provided.
2. Materials and Methods
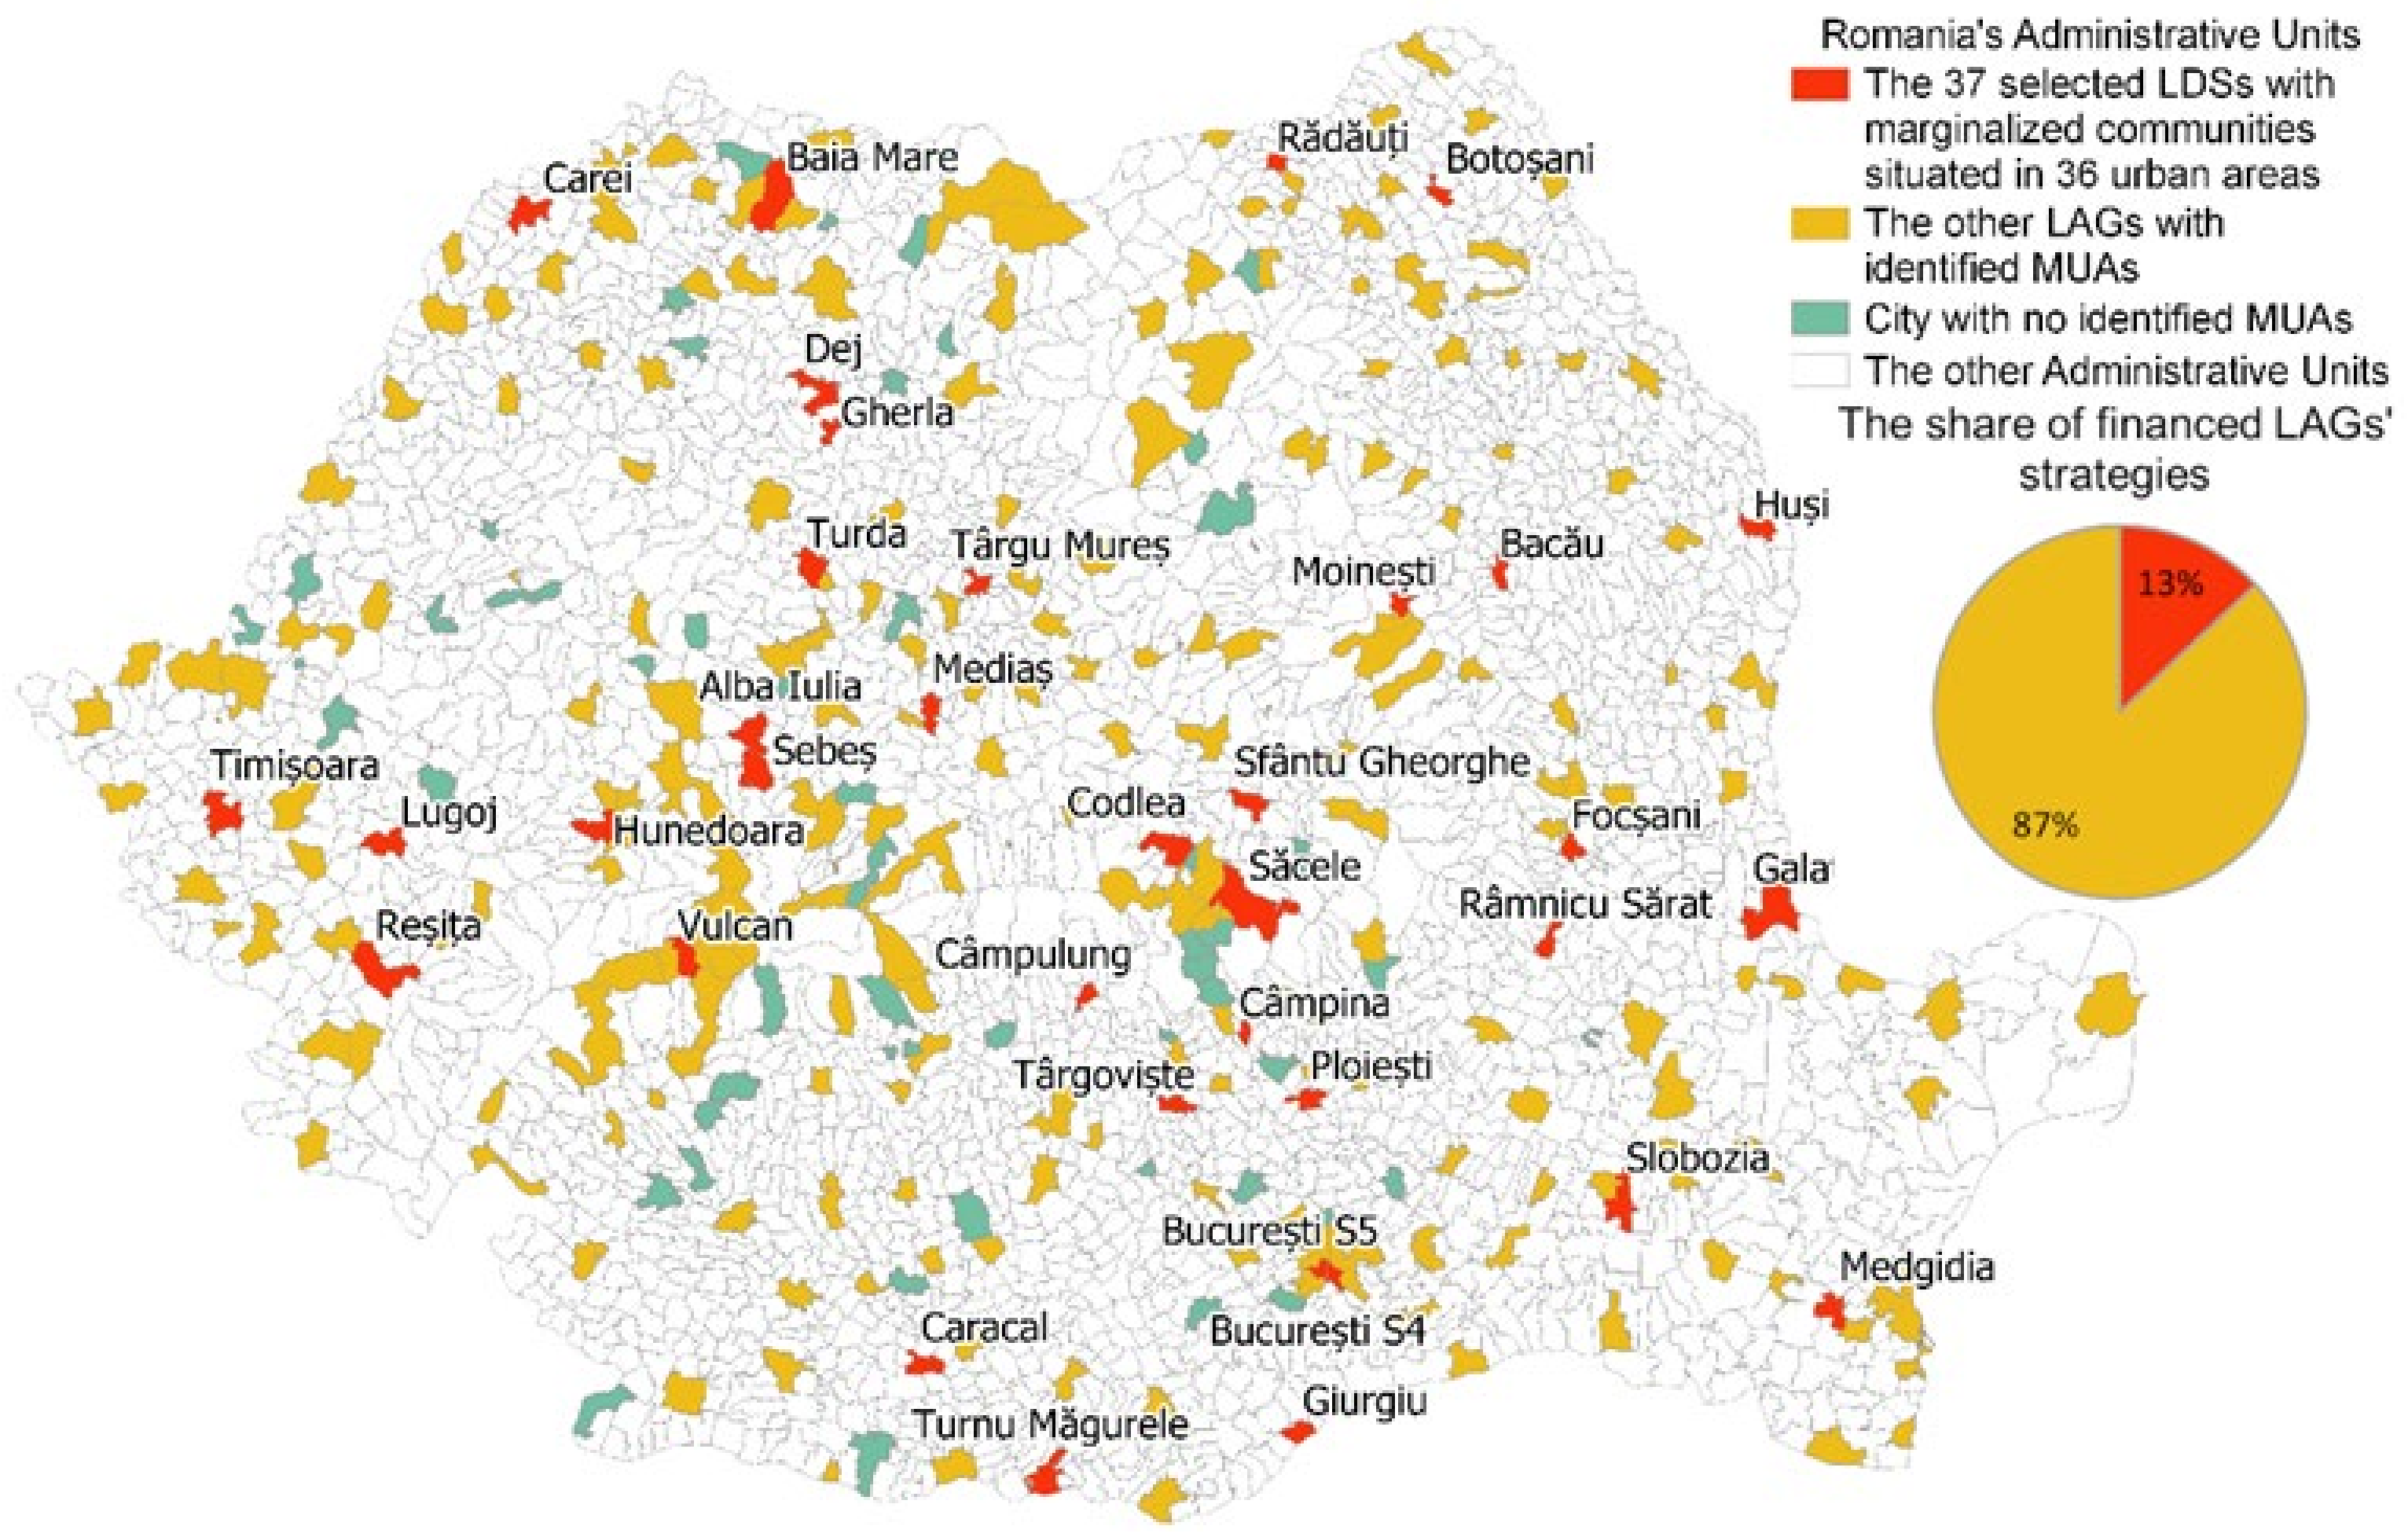
To achieve the research objective 1, first we downloaded the 37 approved local development strategies in 36 urban areas from the official LAG websites. The strategies were developed for implementation in the programming period 2014–2020 and are related to the period up to 2023. Most were prepared in 2015–2016 and are only slightly modified thereafter. Based on these strategies, LAGs received EU funds to support their own projects and activities that are selected in local grant competitions by the so-called LAG decision councils composed of representatives of public authorities, entrepreneurs, local NGOs and citizens. The LAGs are shown on the map in
Figure 2, a map which was elaborated by the authors following the public data provided by Management Authority of Operational Program Human Capital in Romania (AM POCU) [
29] and the Atlas of Urban Marginalized Areas in Romania [
27]. The geometries were obtained from the INSPIRE Geoportal of Romania [
30]. As an observation, there are 37 selected local development strategies in 36 urban areas, 2 of them situated in the same administrative territorial unit, that are not distinctively shown on any map; thus, their administrative limits only add up to 36.
Next, we analyzed these documents, searching for records of actions related to energy statuses on three levels: (1) in the analysis of needs, resources and problems of population in the LDS territory and SWOT analysis; (2) in LDS objectives; (3) in the LDS action plan. Based on these analyses,
Figure 2 presents the share of financed LDS for marginalized urban communities with energy access issues in Romania.
To achieve research objective 2, we produced all maps presented in the present paper with the support of a free and open-source Geographic Information System application—QGIS—which involves the use of open tools, datasets and platforms in performing the necessary analysis for our study.
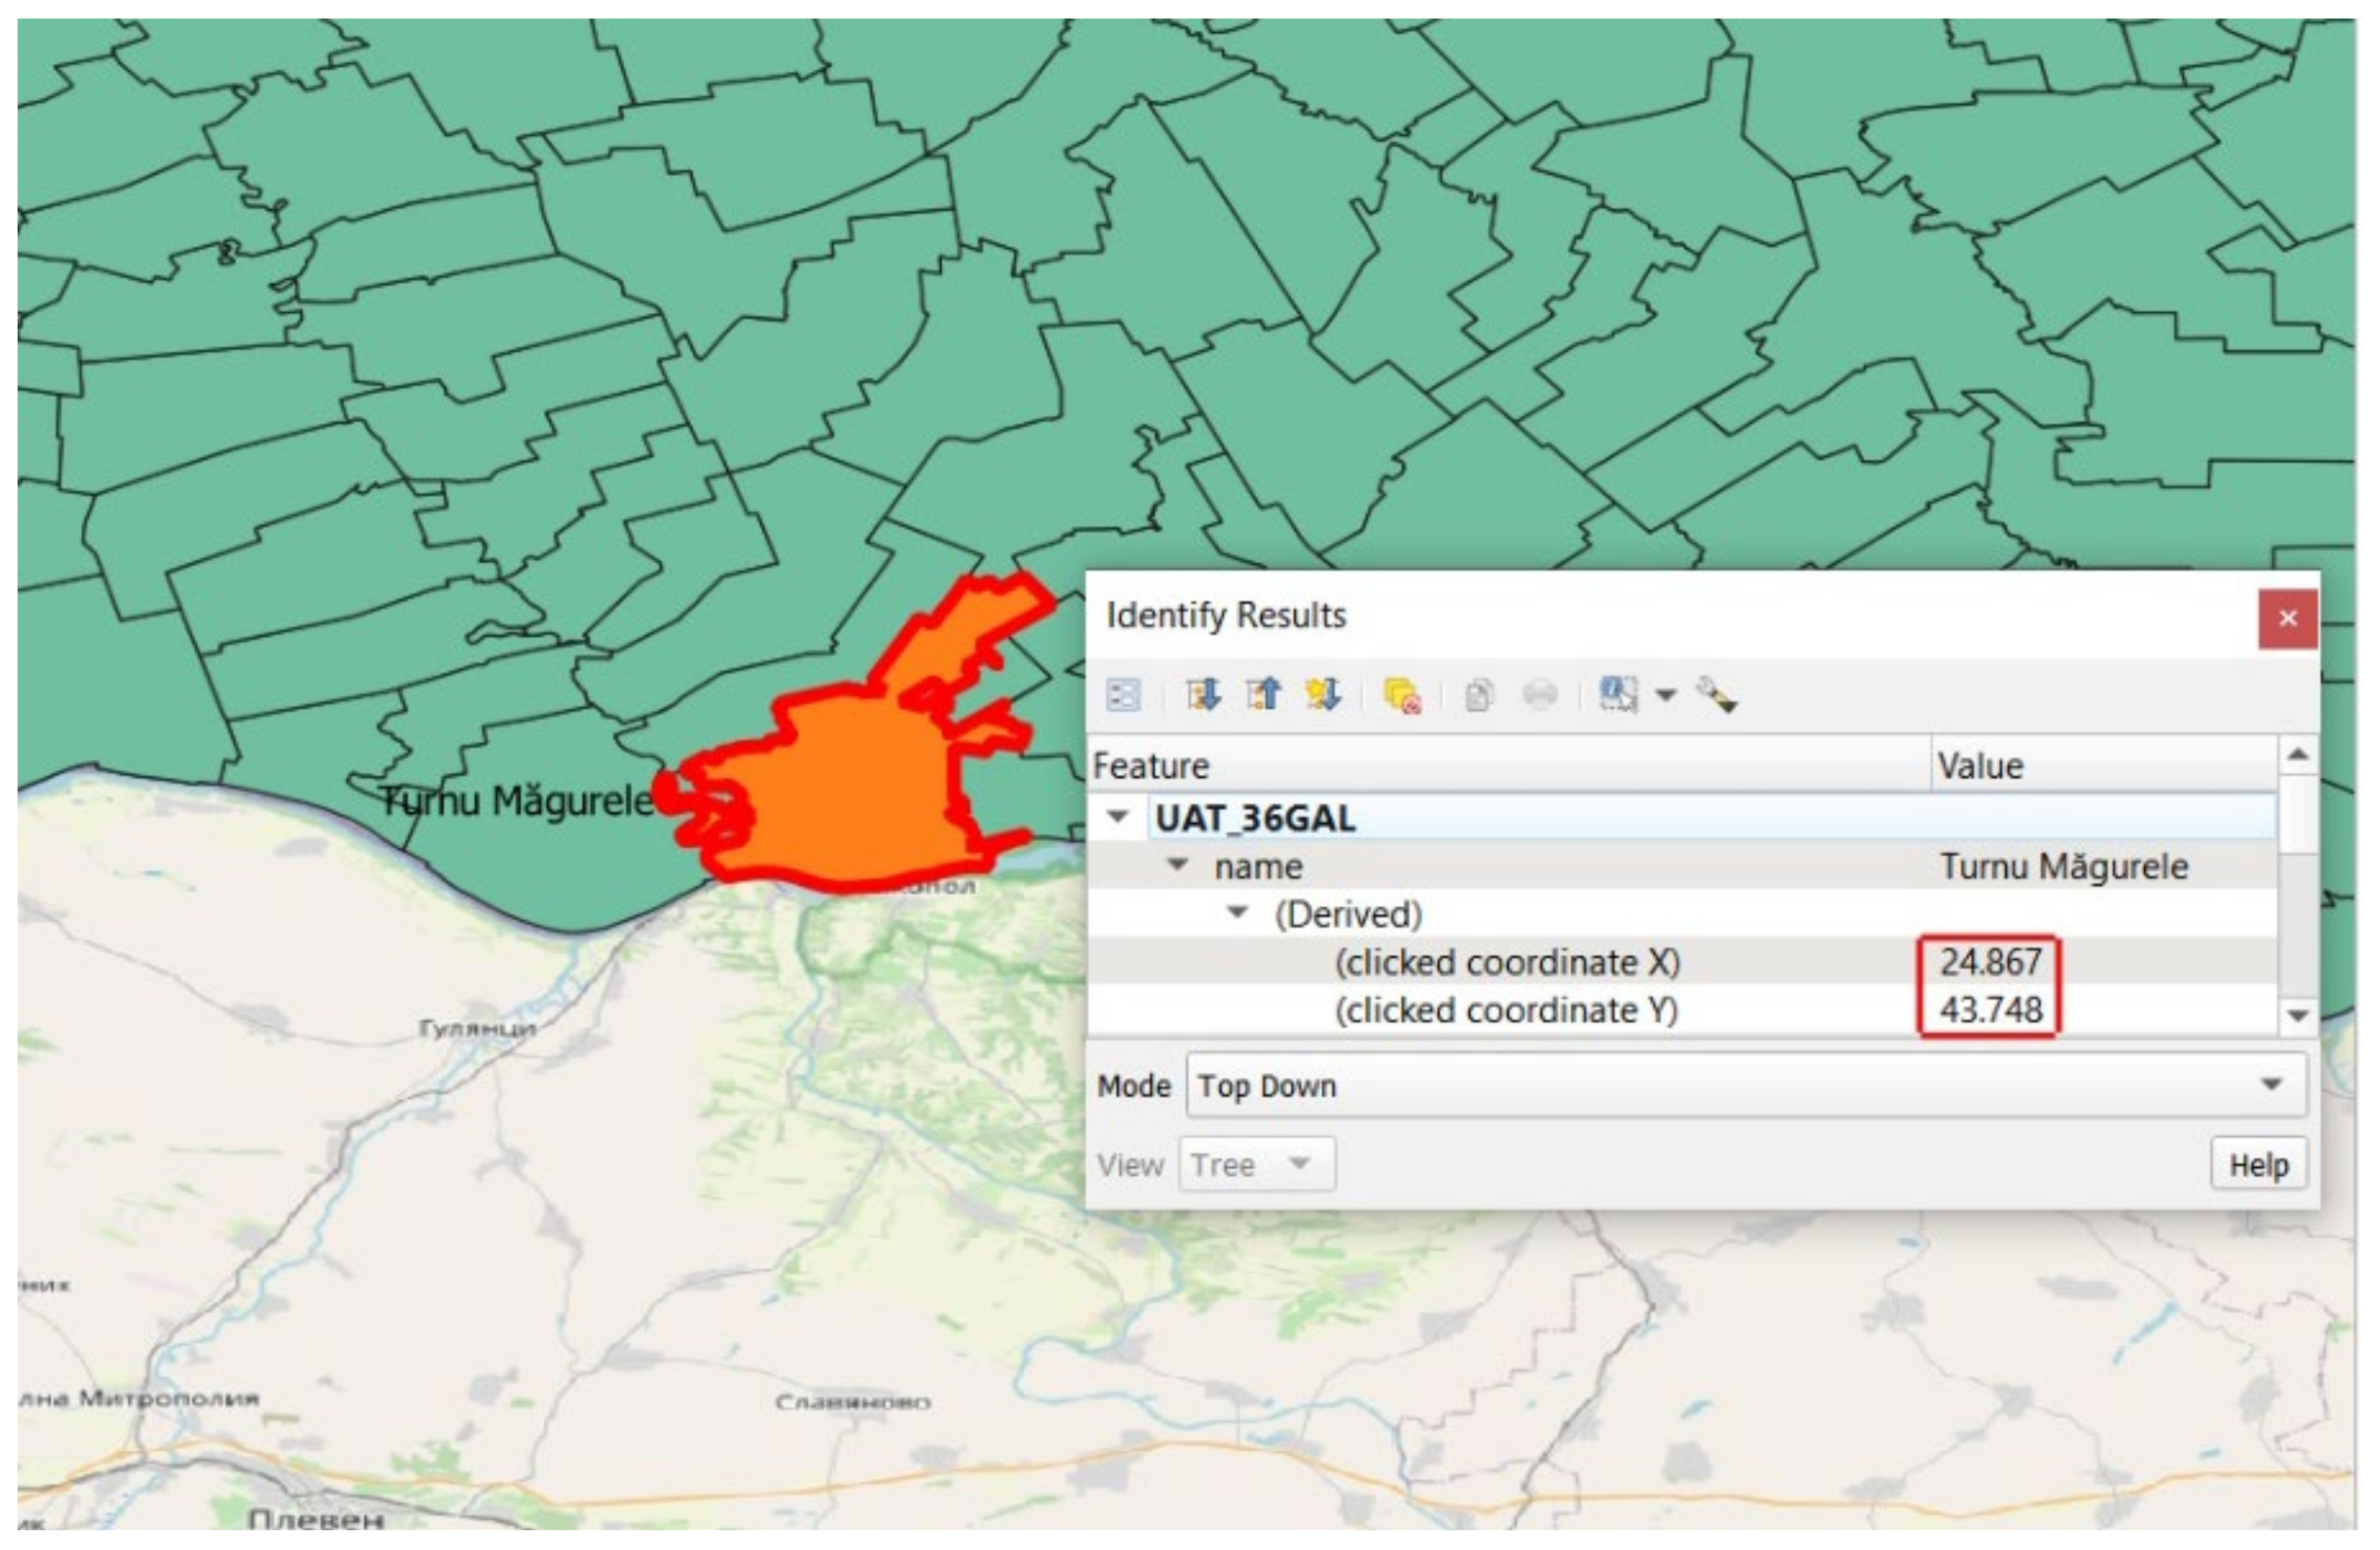
For each of the LAGs, we selected its polygonal outline, and we obtained a set of coordinates relative to its area in the QGIS Identify Window with mouse clicks, as shown in
Figure 3.
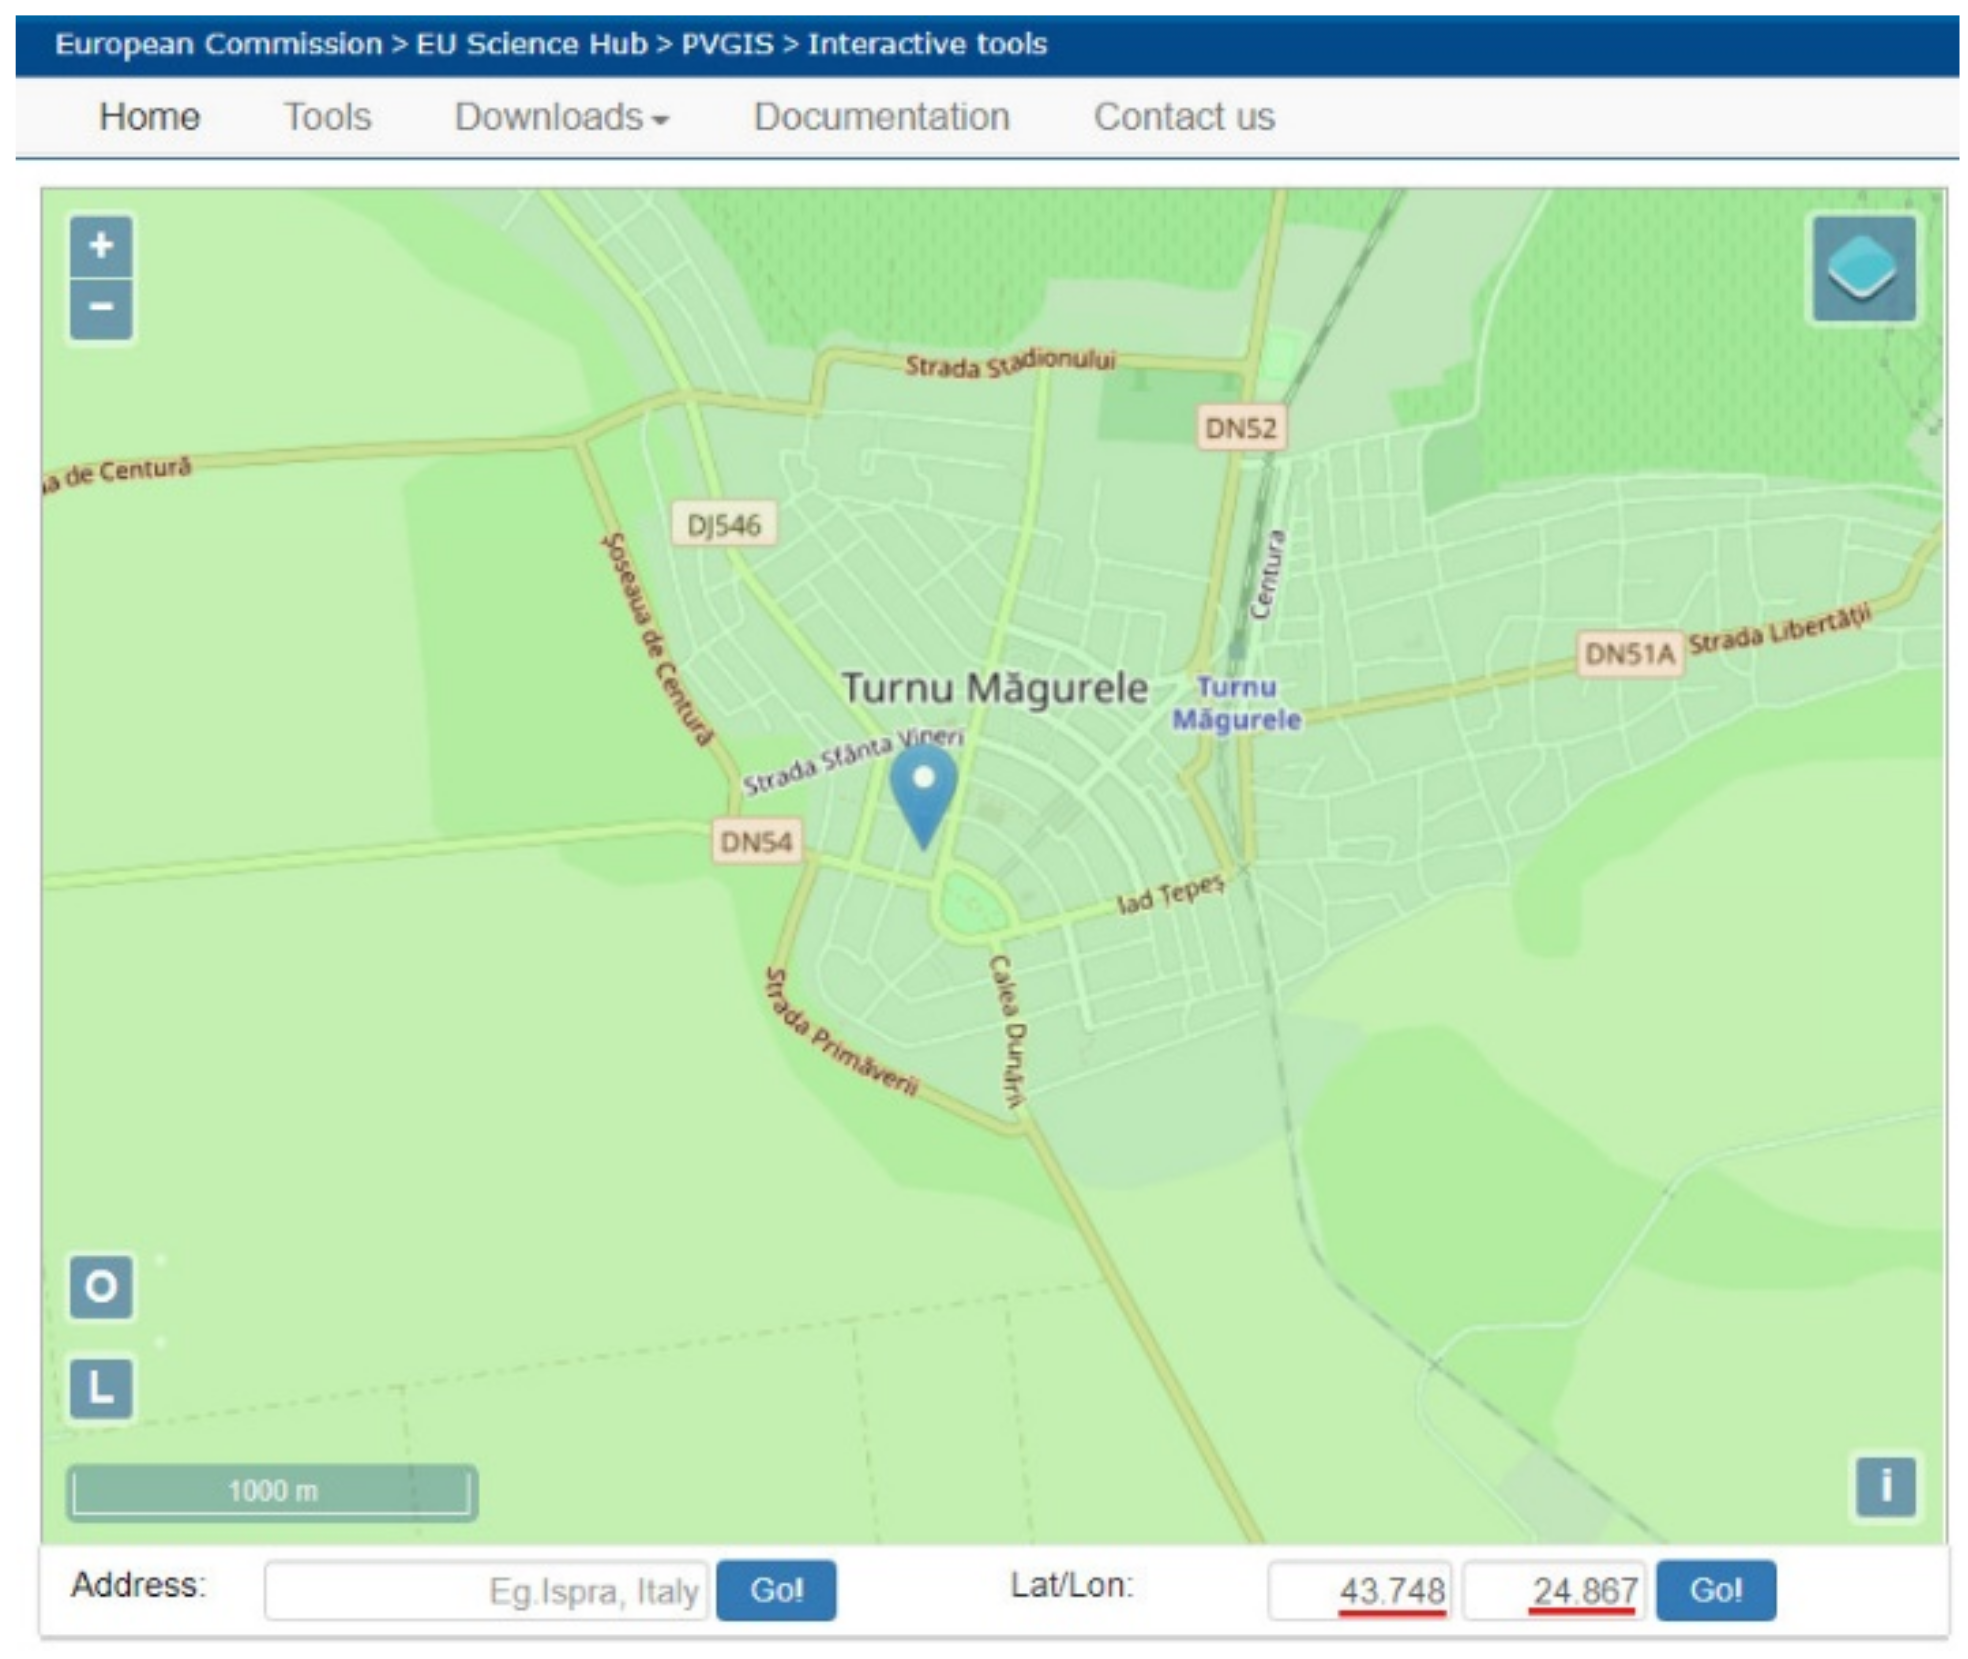
As we further present in
Figure 4, the acquired set of coordinates was introduced in the Photovoltaic Geographical Information System (PVGIS) online tool [
31] in the European Commission’s platform to calculate solar irradiation related to the PhotoVoltaic (PV) energy production system: a web application that is free and open to use, with no restrictions on the use of the results.
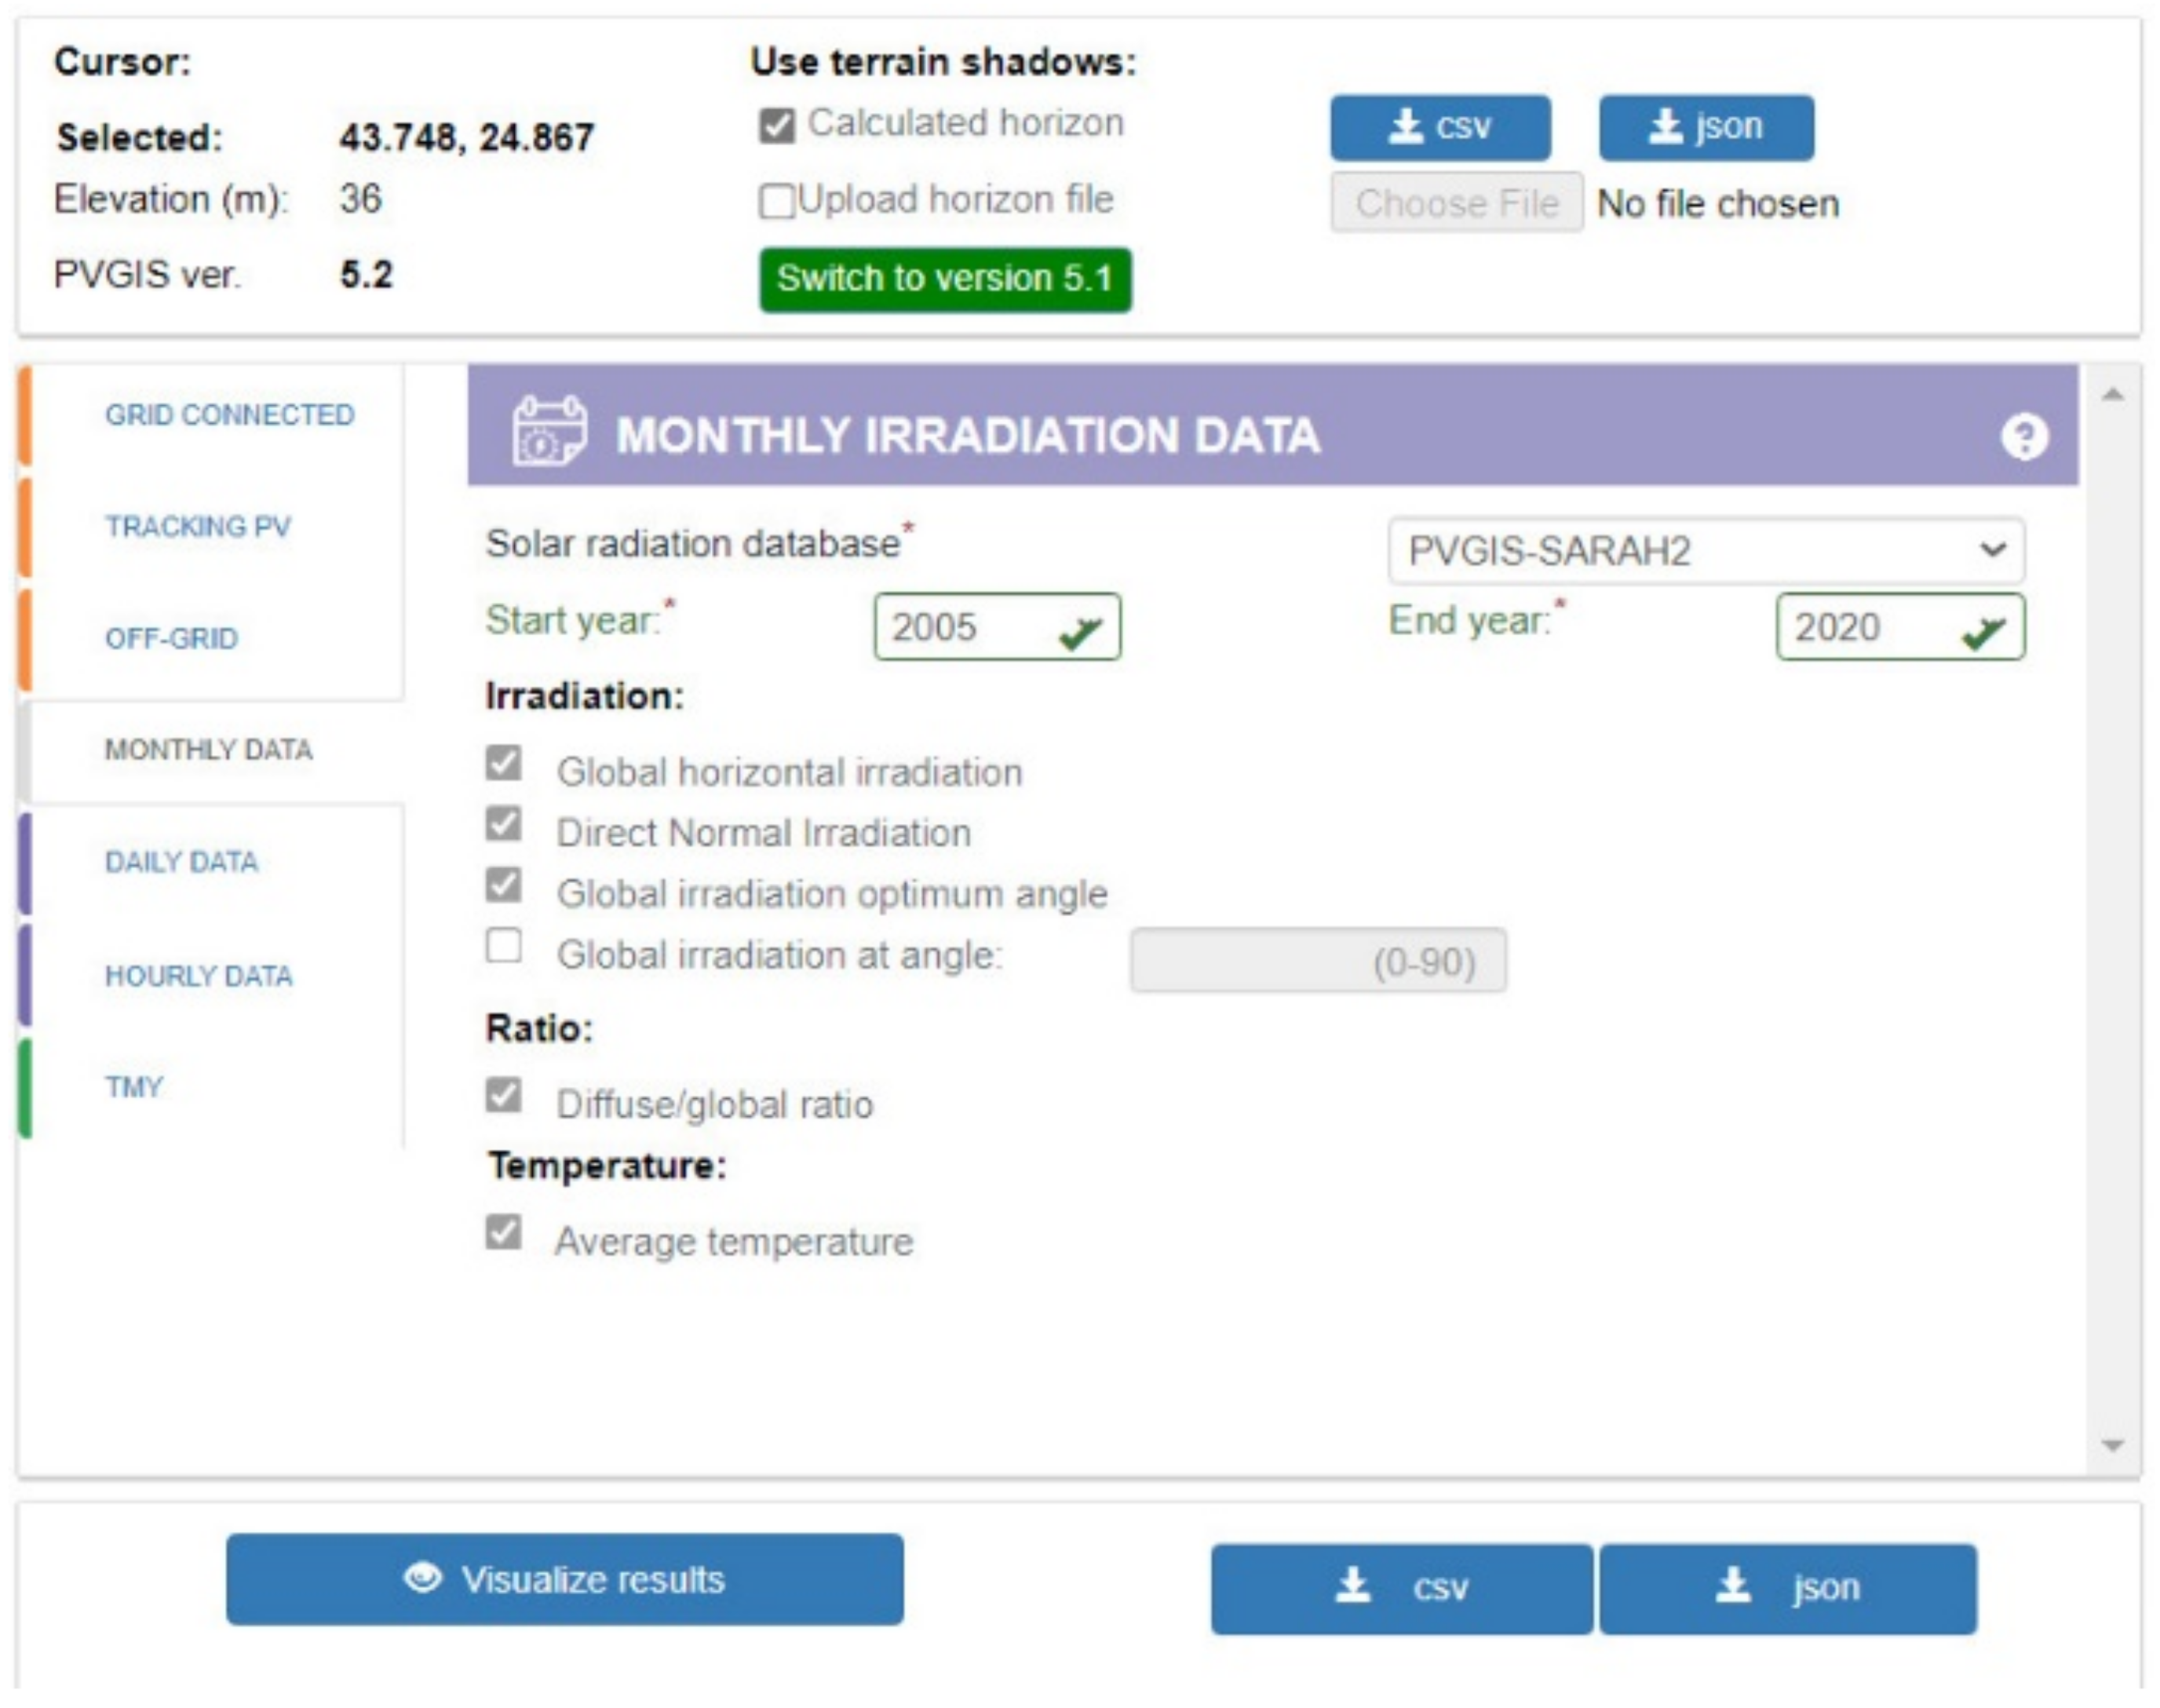
In the PVGIS interface, we selected the default option “Calculated horizon” as shown in
Figure 5 to use the PVGIS built-in horizon information.
The monthly average solar radiation data tab was used to obtain monthly average data for solar irradiation and temperature over a multiyear period. The option selected from the available solar radiation databases in the latest version—the PVGIS 5.2 (updated on March 2022)—was the European Union’s default 2022 solar radiation data record PVGIS-SARAH-2, provided through the EUMETSAT Climate Monitoring Satellite Application Facility (CM SAF) from the Deutscher Wetterdienst (German Meteorological Service) in Offenbach. This dataset covers the period 2005–2020 with hourly solar radiation values, which replaces SARAH-1, and now it covers Europe, Africa, most of Asia and parts of South America at a spatial resolution of about 5 km (the highest available for Europe). This step is also presented in
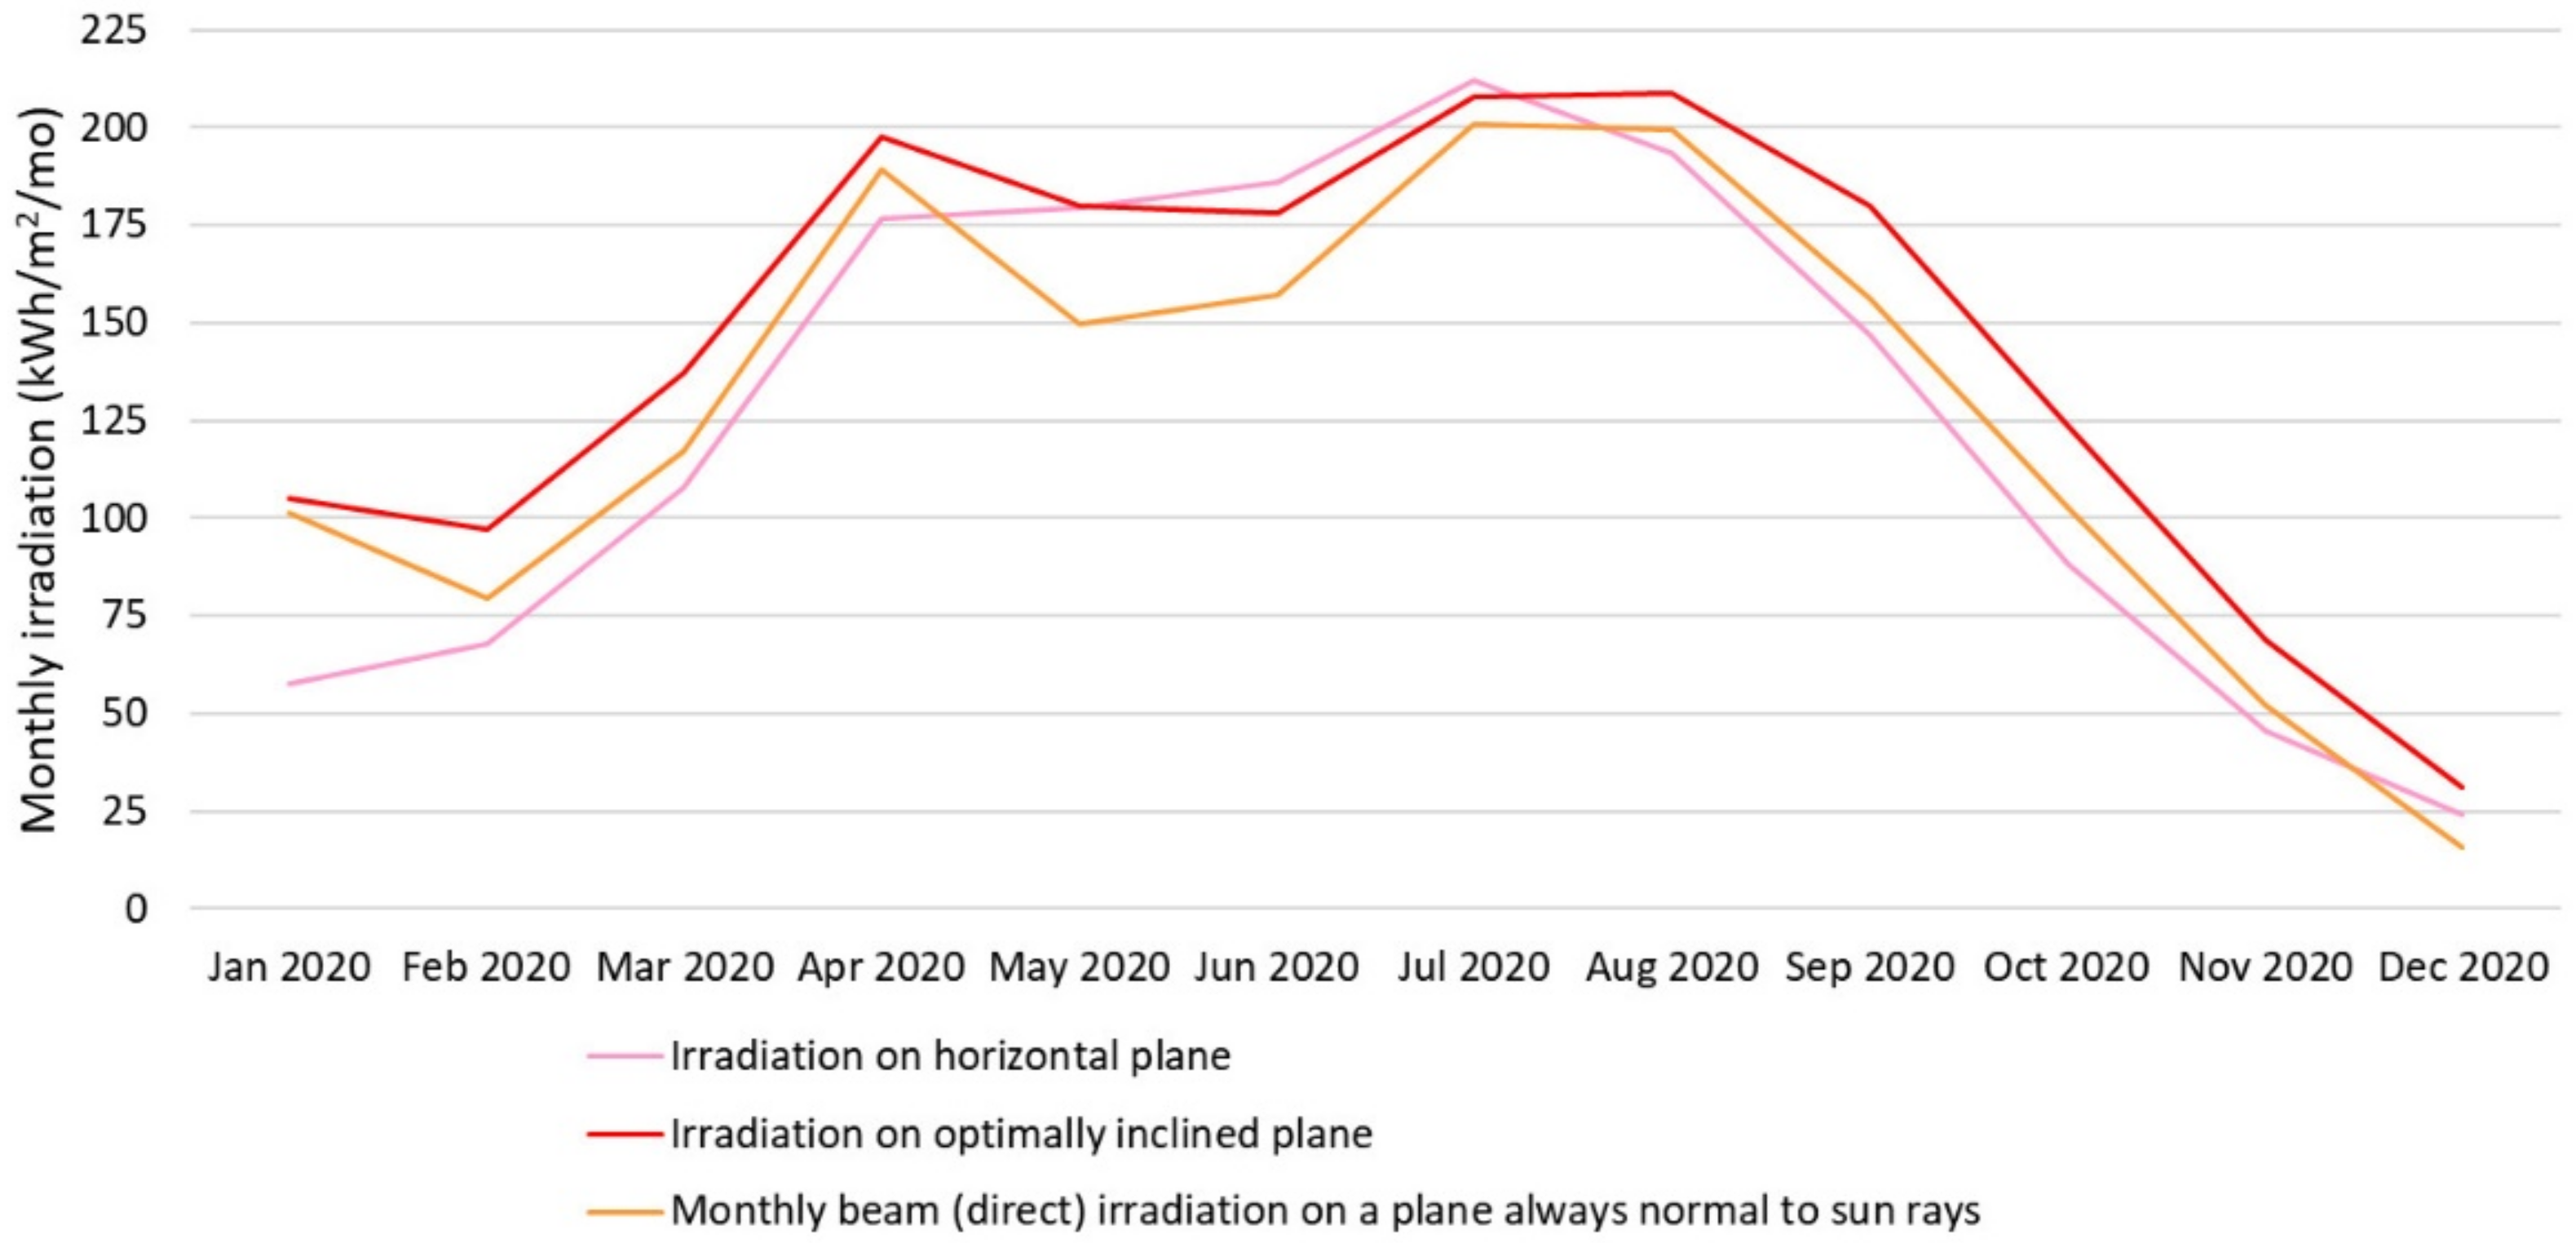
Figure 5 with the respective selections already mentioned before. The results calculated by the PVGIS model provide the amount of energy received monthly from solar irradiation on the square meter of the various inclined surfaces at the location determined geographically with coordinates, as in the example in
Figure 6 for the city of Turnu Măgurele.
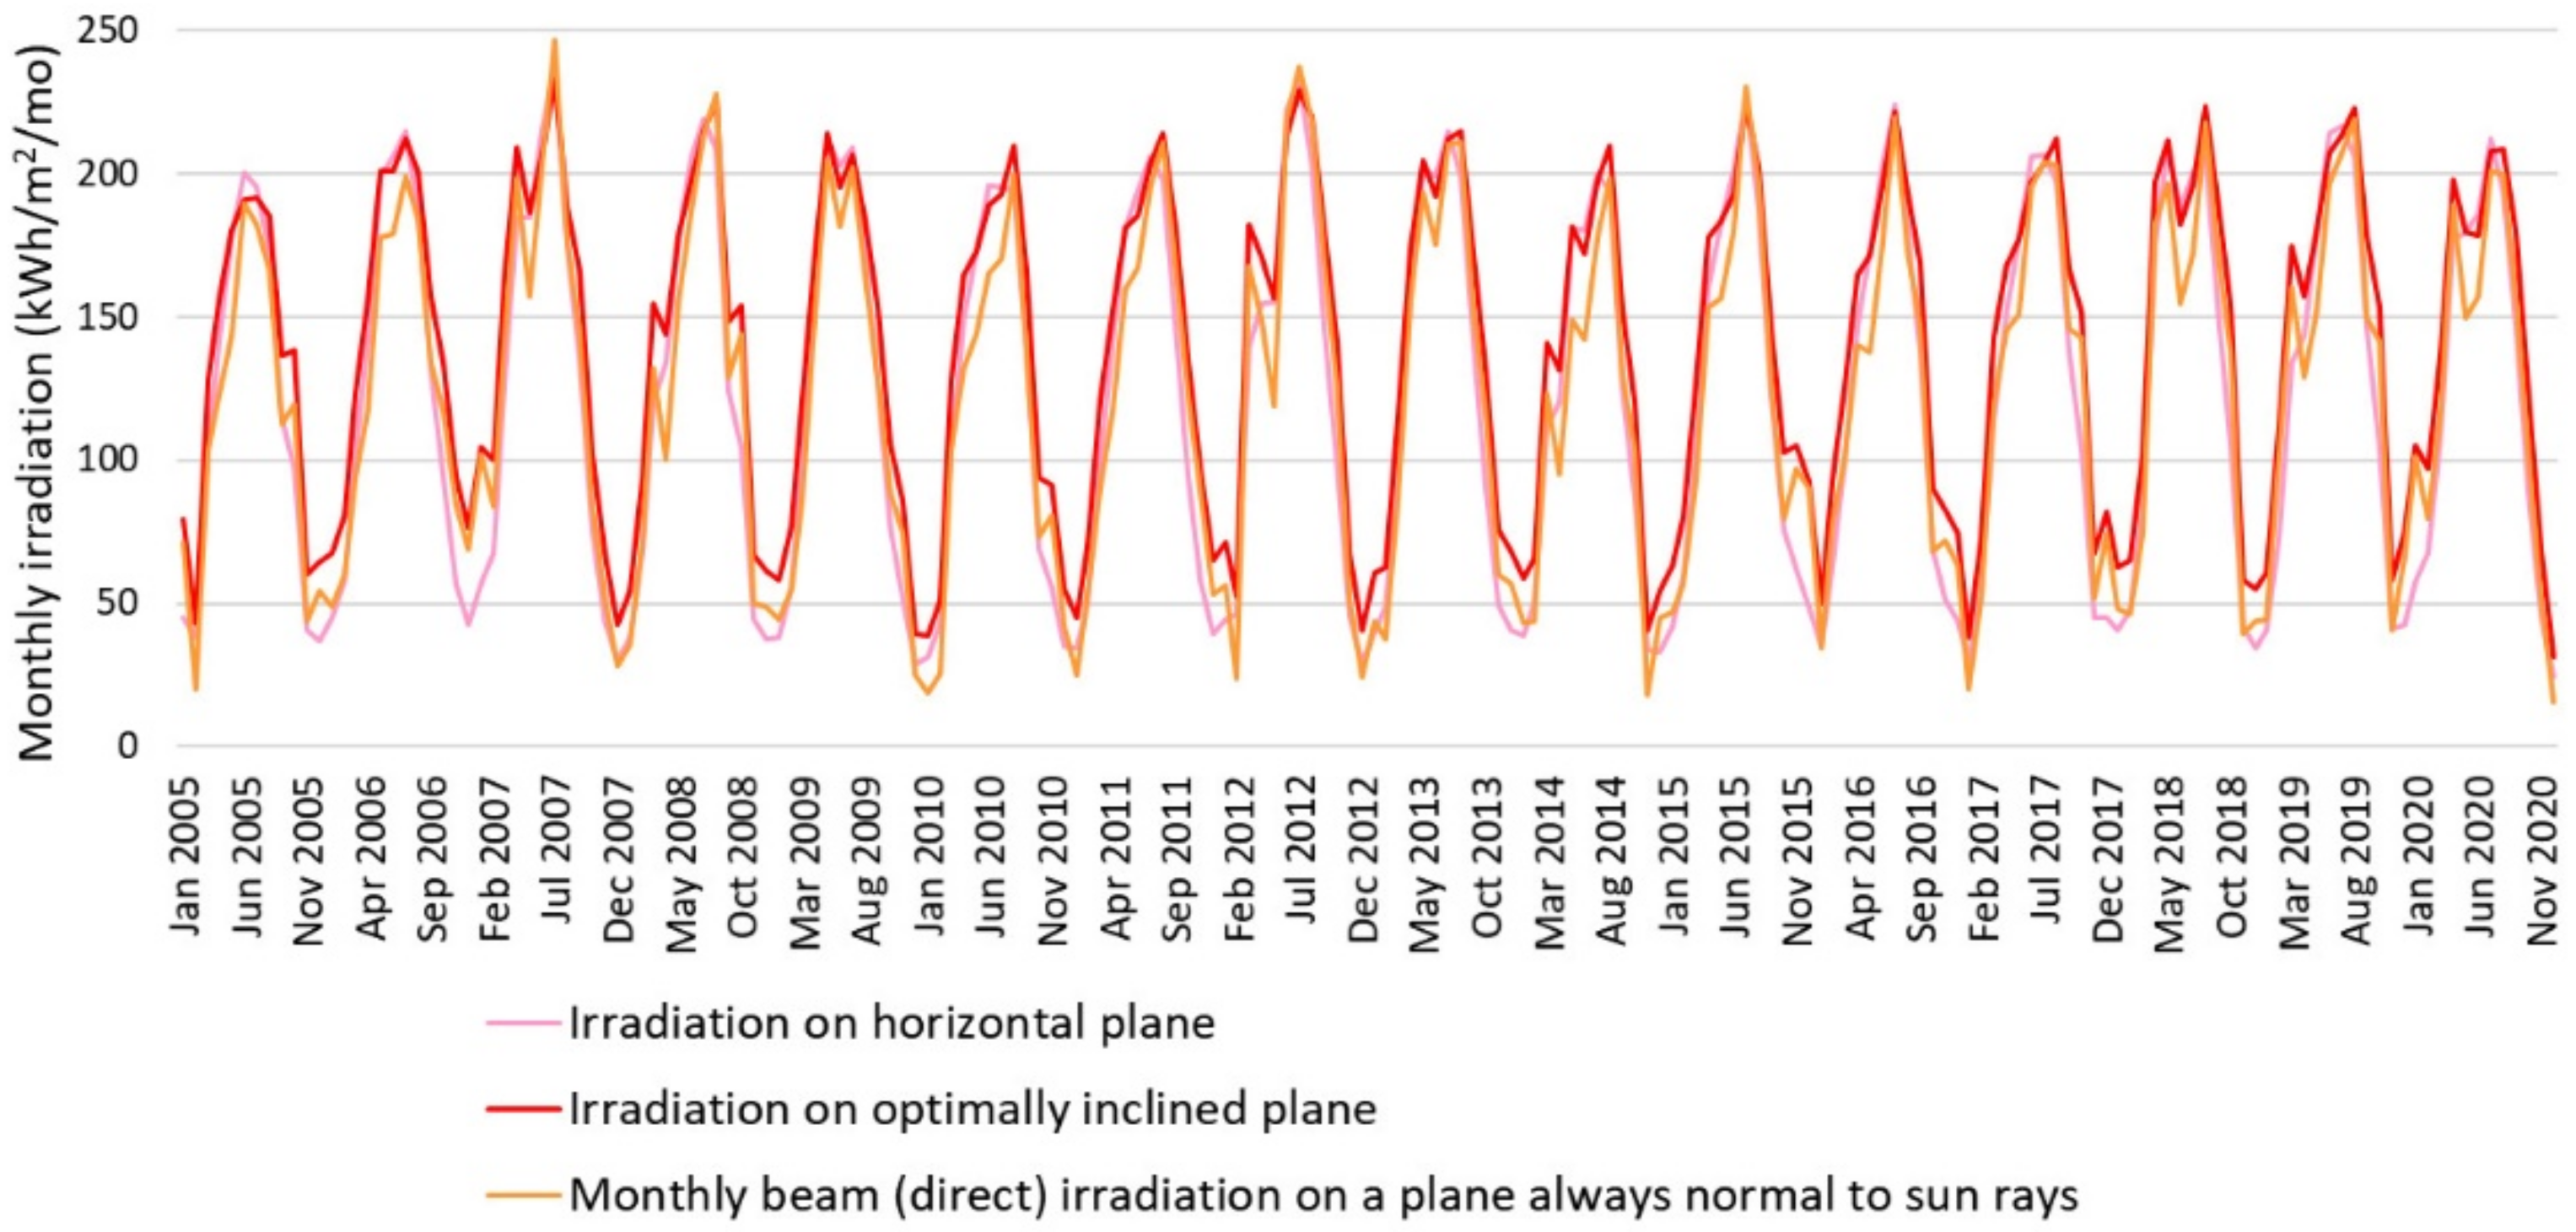
As we point out in
Figure 7, the amount of solar irradiation over a period of one-year changes according to the seasonal variation. Thus, the most relevant period during the year regarding the PV electricity generation is the summer, with the peak values slightly ranging over the summer months, varying from one LAG to another. In the meantime, the winter season marks the lowest values of solar irradiation. Although more values were selected, the value of “Global irradiation, optimal angle” was used further in order to classify the selected LAGs accordingly to this irradiation-related parameter as it produces the monthly sum of the solar radiation energy measured in kWh/m
2 that hits one square meter of a photovoltaic plane facing in the direction of the equator at the inclination angle that provides the highest annual irradiation for the respective position, as it can be observed in
Figure 7. In Romania, according to [
32] the demand for heating during winter months varies between 1500 and 12,500 kWh/year/household (125–1041 kWh/mo/household). According to study [
33], the summer consumption for cooling can reach between 5 and 100 W/h/household and lasts for an average of 4 month, which means a demand of electric power between 3.5 and 72 kWh/mo/household. This value is close to the Romanian average over 4 months for the electricity consumption (50 kWh/mo/household) provided by a Romanian electric power company [
34]. The cooling and heating consumption adds up to the everyday consumption for other necessities. For example, in months with roughly constant consumption (no heating nor cooling), electricity demand can vary around 9 kWh/day/household (270 kW/mo/household) [
33]. Taking into account these values of electricity demand, the PV installations will cover immediate consumption and will not be selling to the available grid.
3. Results and Discussion
From the analysis of the available LDSs, it was observed that the housing situation in MUAs is characterized by the following types of dwellings: shelters illegally built, improvised, built of cheap, improper materials (adobe, wood, plastic, cardboards with some kind of wooden structure or other improvised materials), old houses located on the outskirts of cities or in the central area, degraded social dwellings and blocks built in the 1960–1970s that are in poor condition and their improvement or renovation is cumbersome for the inhabitants who do not have the necessary resources. The municipal technical infrastructure is usually old and morally worn out or missing. In some areas where the MUAs are located, there are no utility networks, or the houses have been disconnected due to the non-payment of bills or due to the fact that the inhabitants did not have the necessary income to connect in the first place. In general, the houses are overcrowded, there are cases when there are no property deeds on them and the population is poor, with a low degree of education and with many children.
The energy supply status for the inhabitants of the MUAs located within the analyzed LDSs was established by analyzing the following indicators:
The percentage of households not connected to the gas supply network;
The percentage of population with heating problems;
The percentage of households not connected to the electricity grid;
The percentage of the population with rent or utility debts.
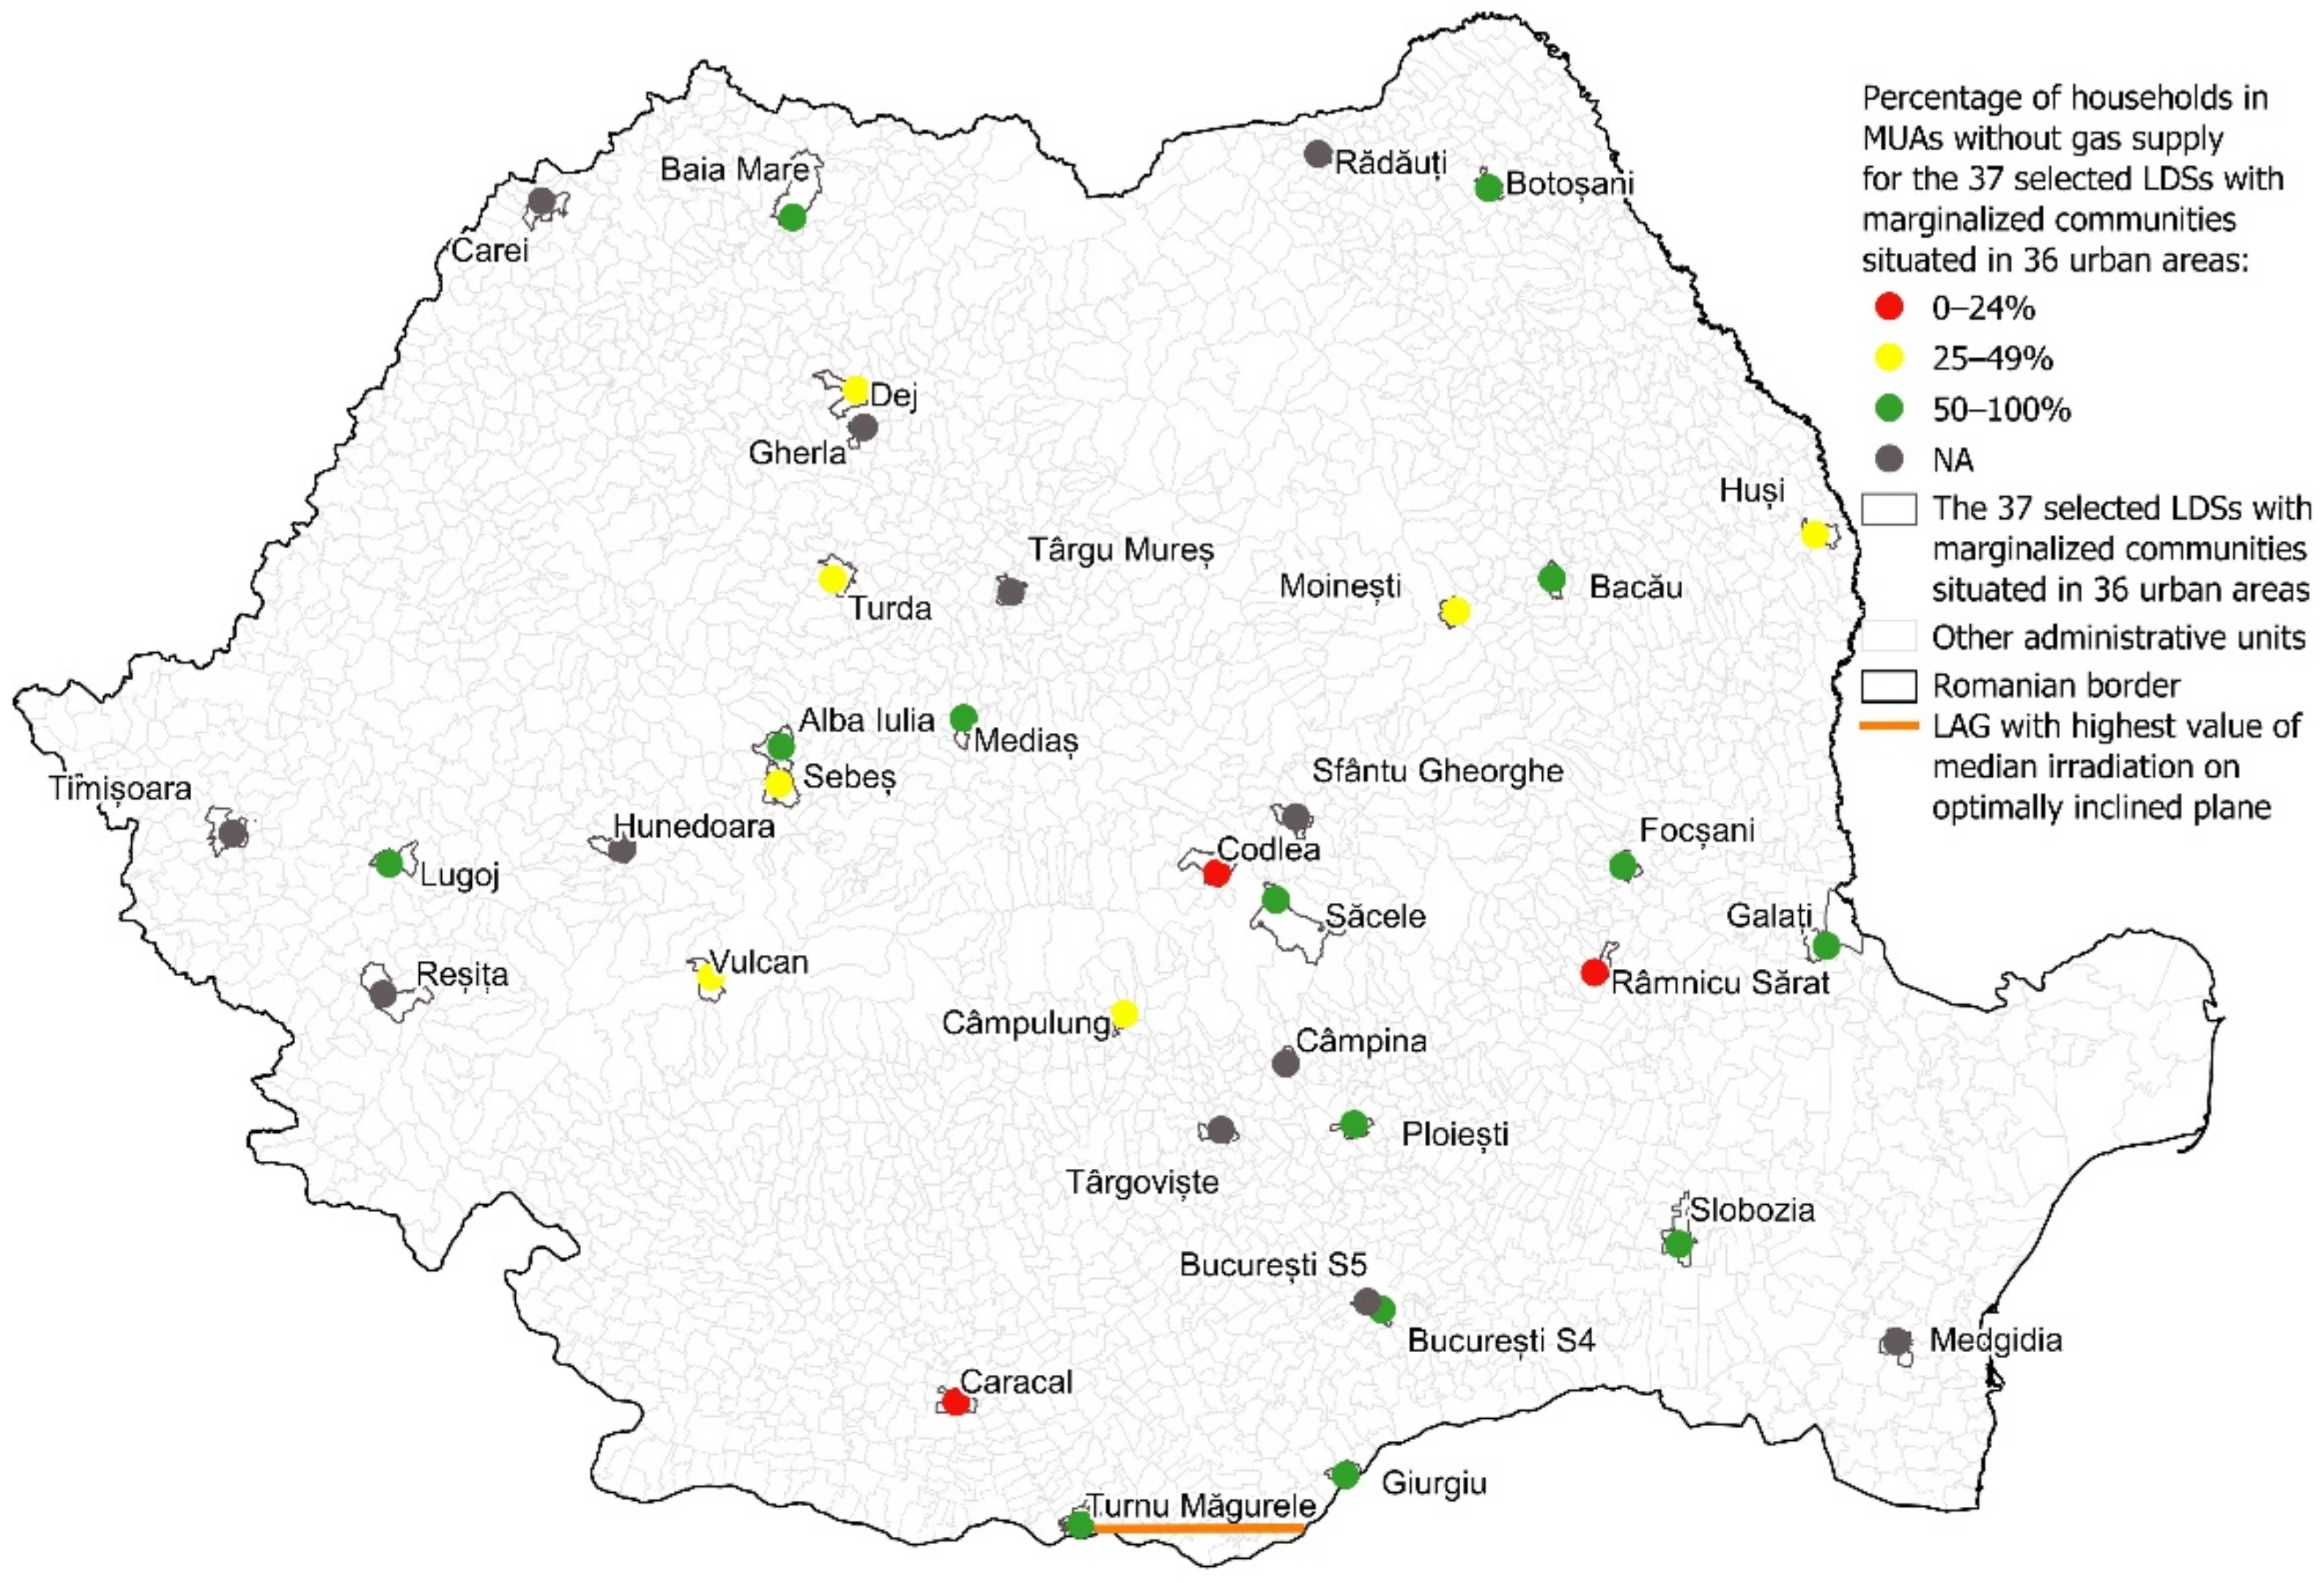
The situation of the households in the studied MUAs who are not connected to the gas supply network is presented in
Figure 8. According to study [
35] launched by the Oil and Gas Employers’ Federation together with the Center for the Study of Democracy, 25% of the urban population in Romania do not have access to gas supplies. The percentage of households without gas supply in the studied MUAs varies between 0 and 100%.
We classified the data in three categories: between 0 and 24%—low percentage; 25–49%—average percentage; between 50 and 100%—high percentage. In the first category, there are MUAs from 3LDSs; in the second category, there are MUAs from 7 LDSs and the predominant number of MUAs is identified in the third category (14 LDSs). We did not find available data for 13 LDSs.
In conclusion, the gas supply situation in MUAs is much more unfavorable than in the rest of the urban living areas; 87.5% of the LDSs for which data were found (21 LDSs) surpass the urban average in terms of a population without access to the gas supply network.
The analysis of LDSs revealed that households without gas supply access use gas cylinders, traditional or improvised stoves and a variety of fuels, with cooking often performed over an open flame, which is a safety risk. The lack of identity and property documents and poverty render it impossible for residents to legally connect to gas and electricity supply networks.
According to the Romanian Housing Assessment proposed in [
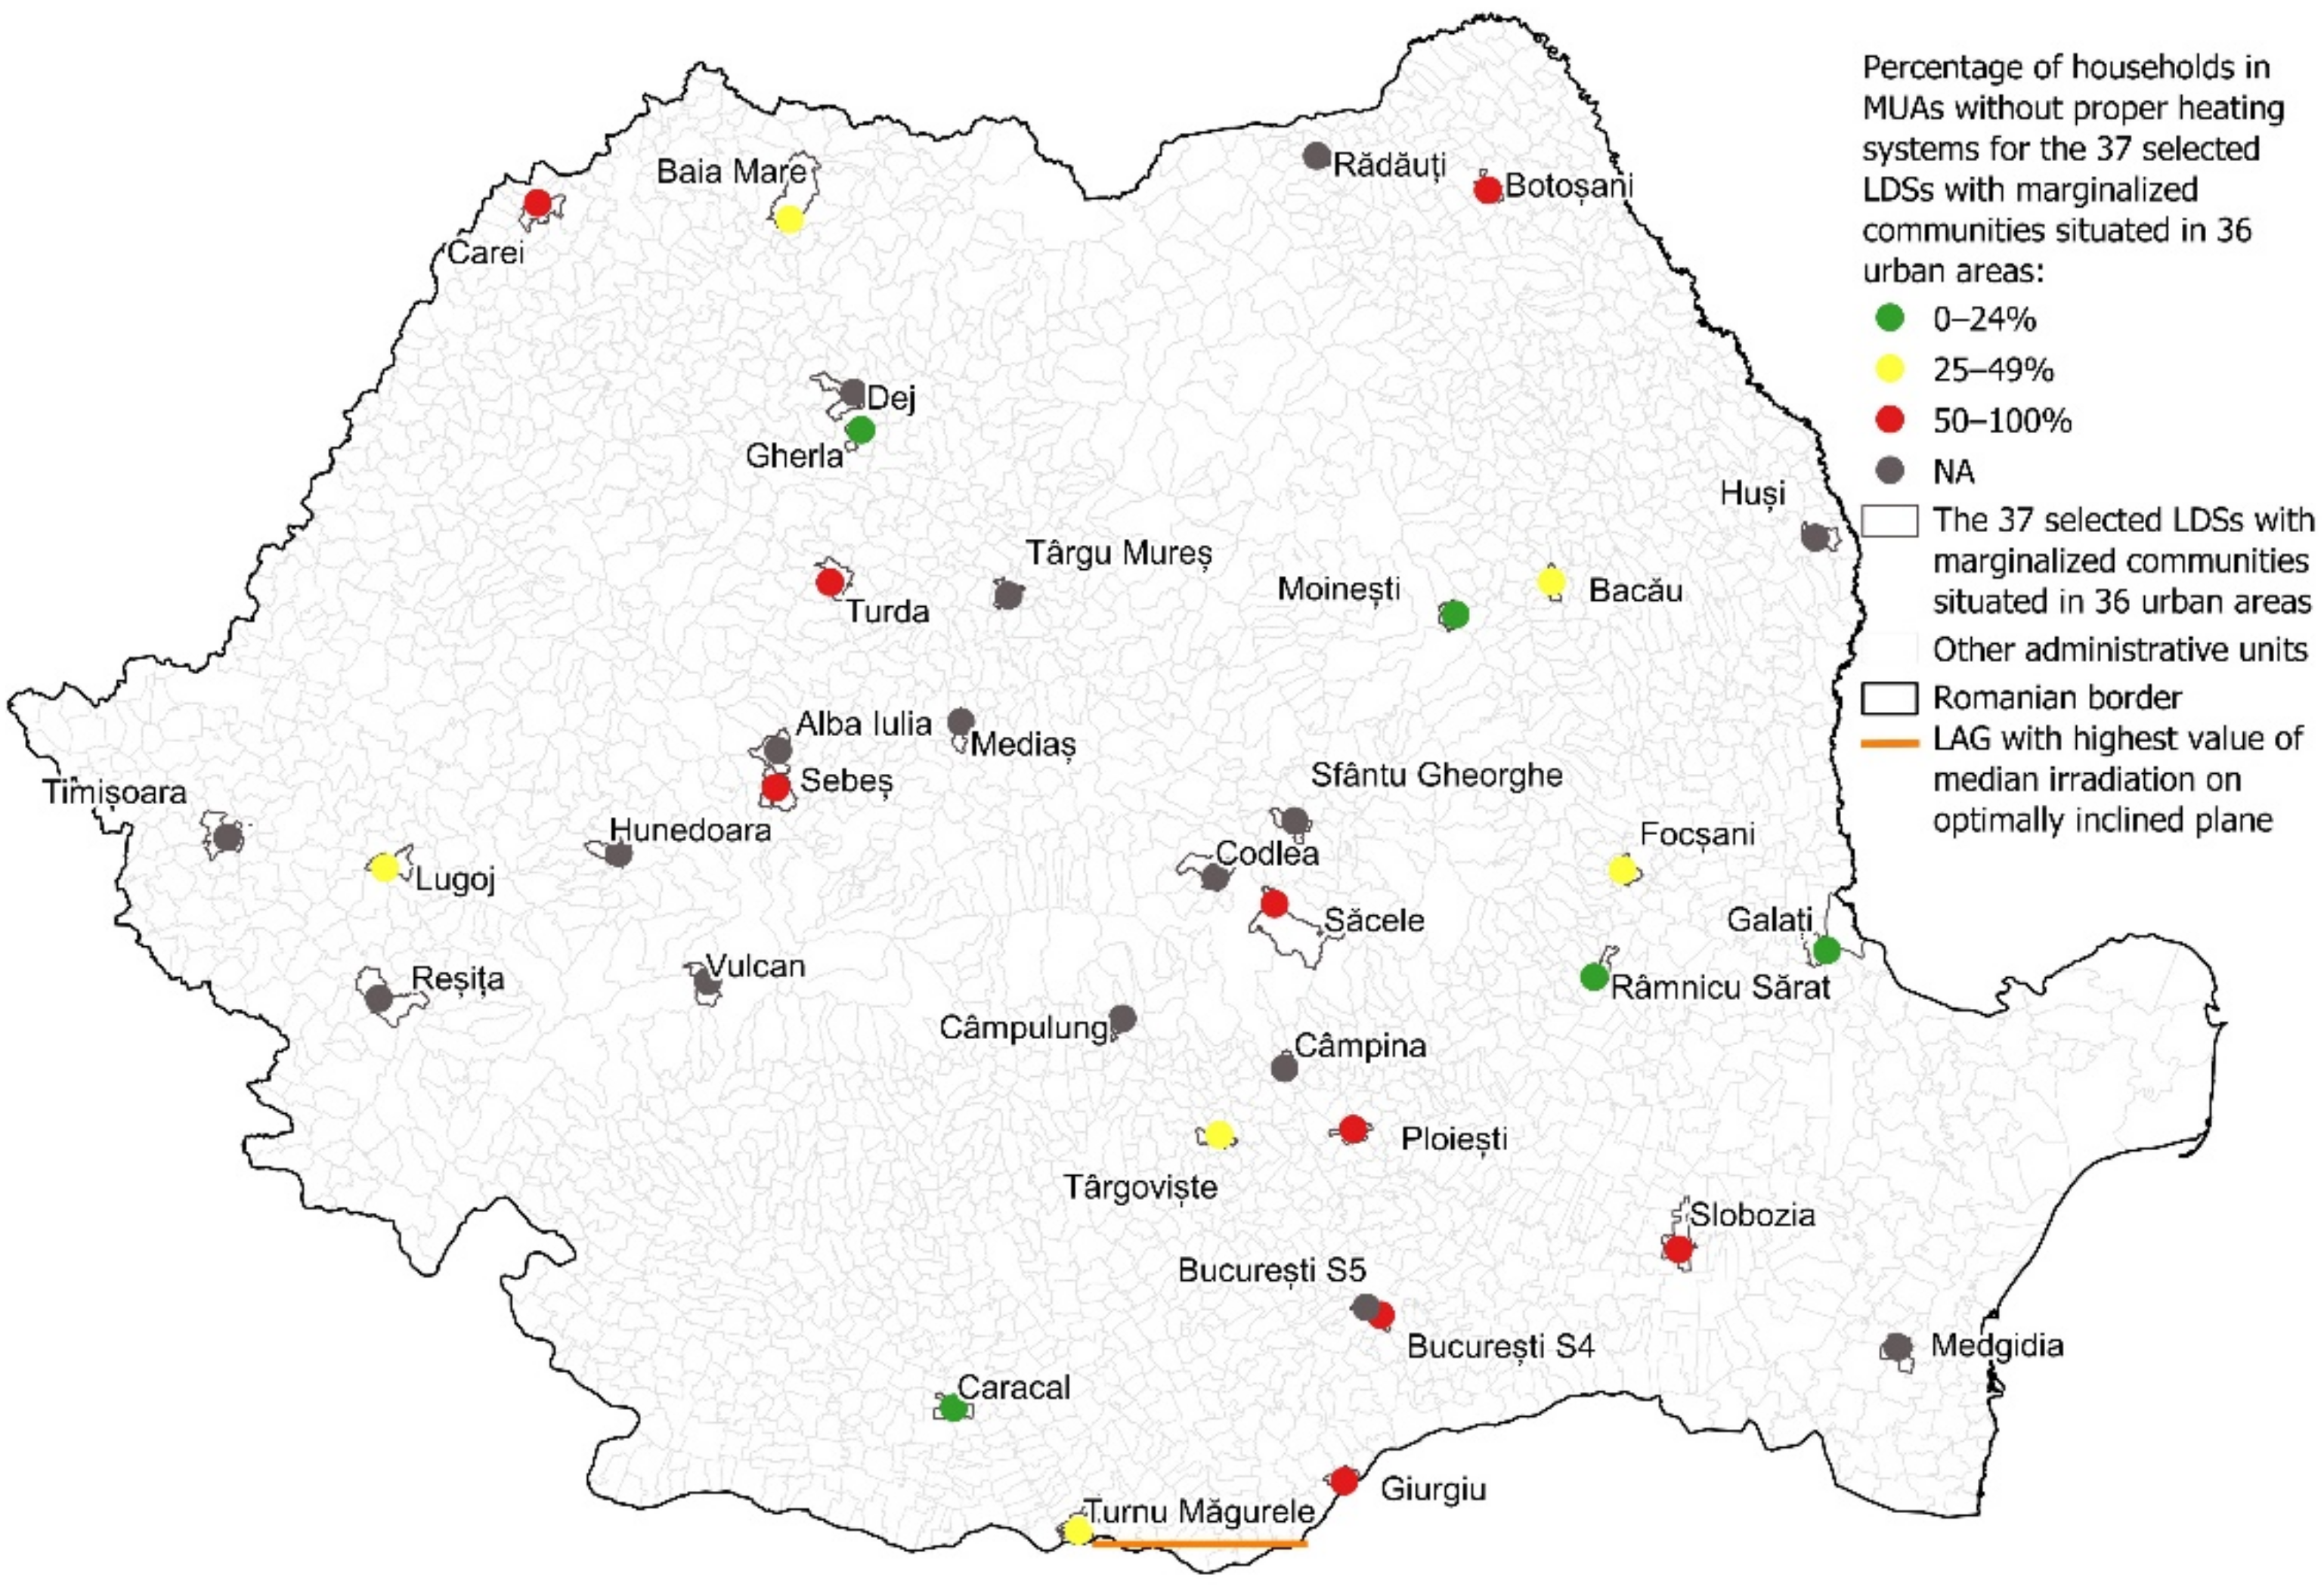
36], it is estimated that more than 25% of the poor population and more than 10% of the population above the poverty line will not to be able to heat their homes to an adequate level. Based on this finding, the analyzed data were divided into three categories: (0–24%)—low percentage; (25–49%)—average percentage; (50–100%)—high percentage. The first category contains MUAs from 5 of the LDSs, the second contains 6 LDSs, the last category contains 9 LDSs, while for the remaining 17 LDSs, data were not available. The situation is presented in
Figure 9. In conclusion, for the MUAs in 75% of the LDSs for which data could have been identified, the household winter heating system is inadequate and is above the national average.
Space heating is usually carried out with firewood, biomass (corncobs) and coal often in traditional or improvised stoves with low efficiency, which generate polluting emissions into the atmosphere with harmful effects on human health and the environment and it presents an increased risk of fires. Wood does not experience complete combustion and, thus, produces energy below its capacity and a higher amount of pollutants. The same wood type can have different energy capacities from one batch to another, depending also on storage conditions (in particular humidity influences wood yield). The dwellings are not energy efficient and have high fuel consumption for space heating, which the population of the MUAs cannot afford. To save energy, the houses are only partially heated; thus, necessary heat is not provided. The inability to maintain heat in homes can lead to unhealthy indoor environments, e.g., low indoor temperatures, dampness and mildew, all of them having a negative impact on the health of the residents.
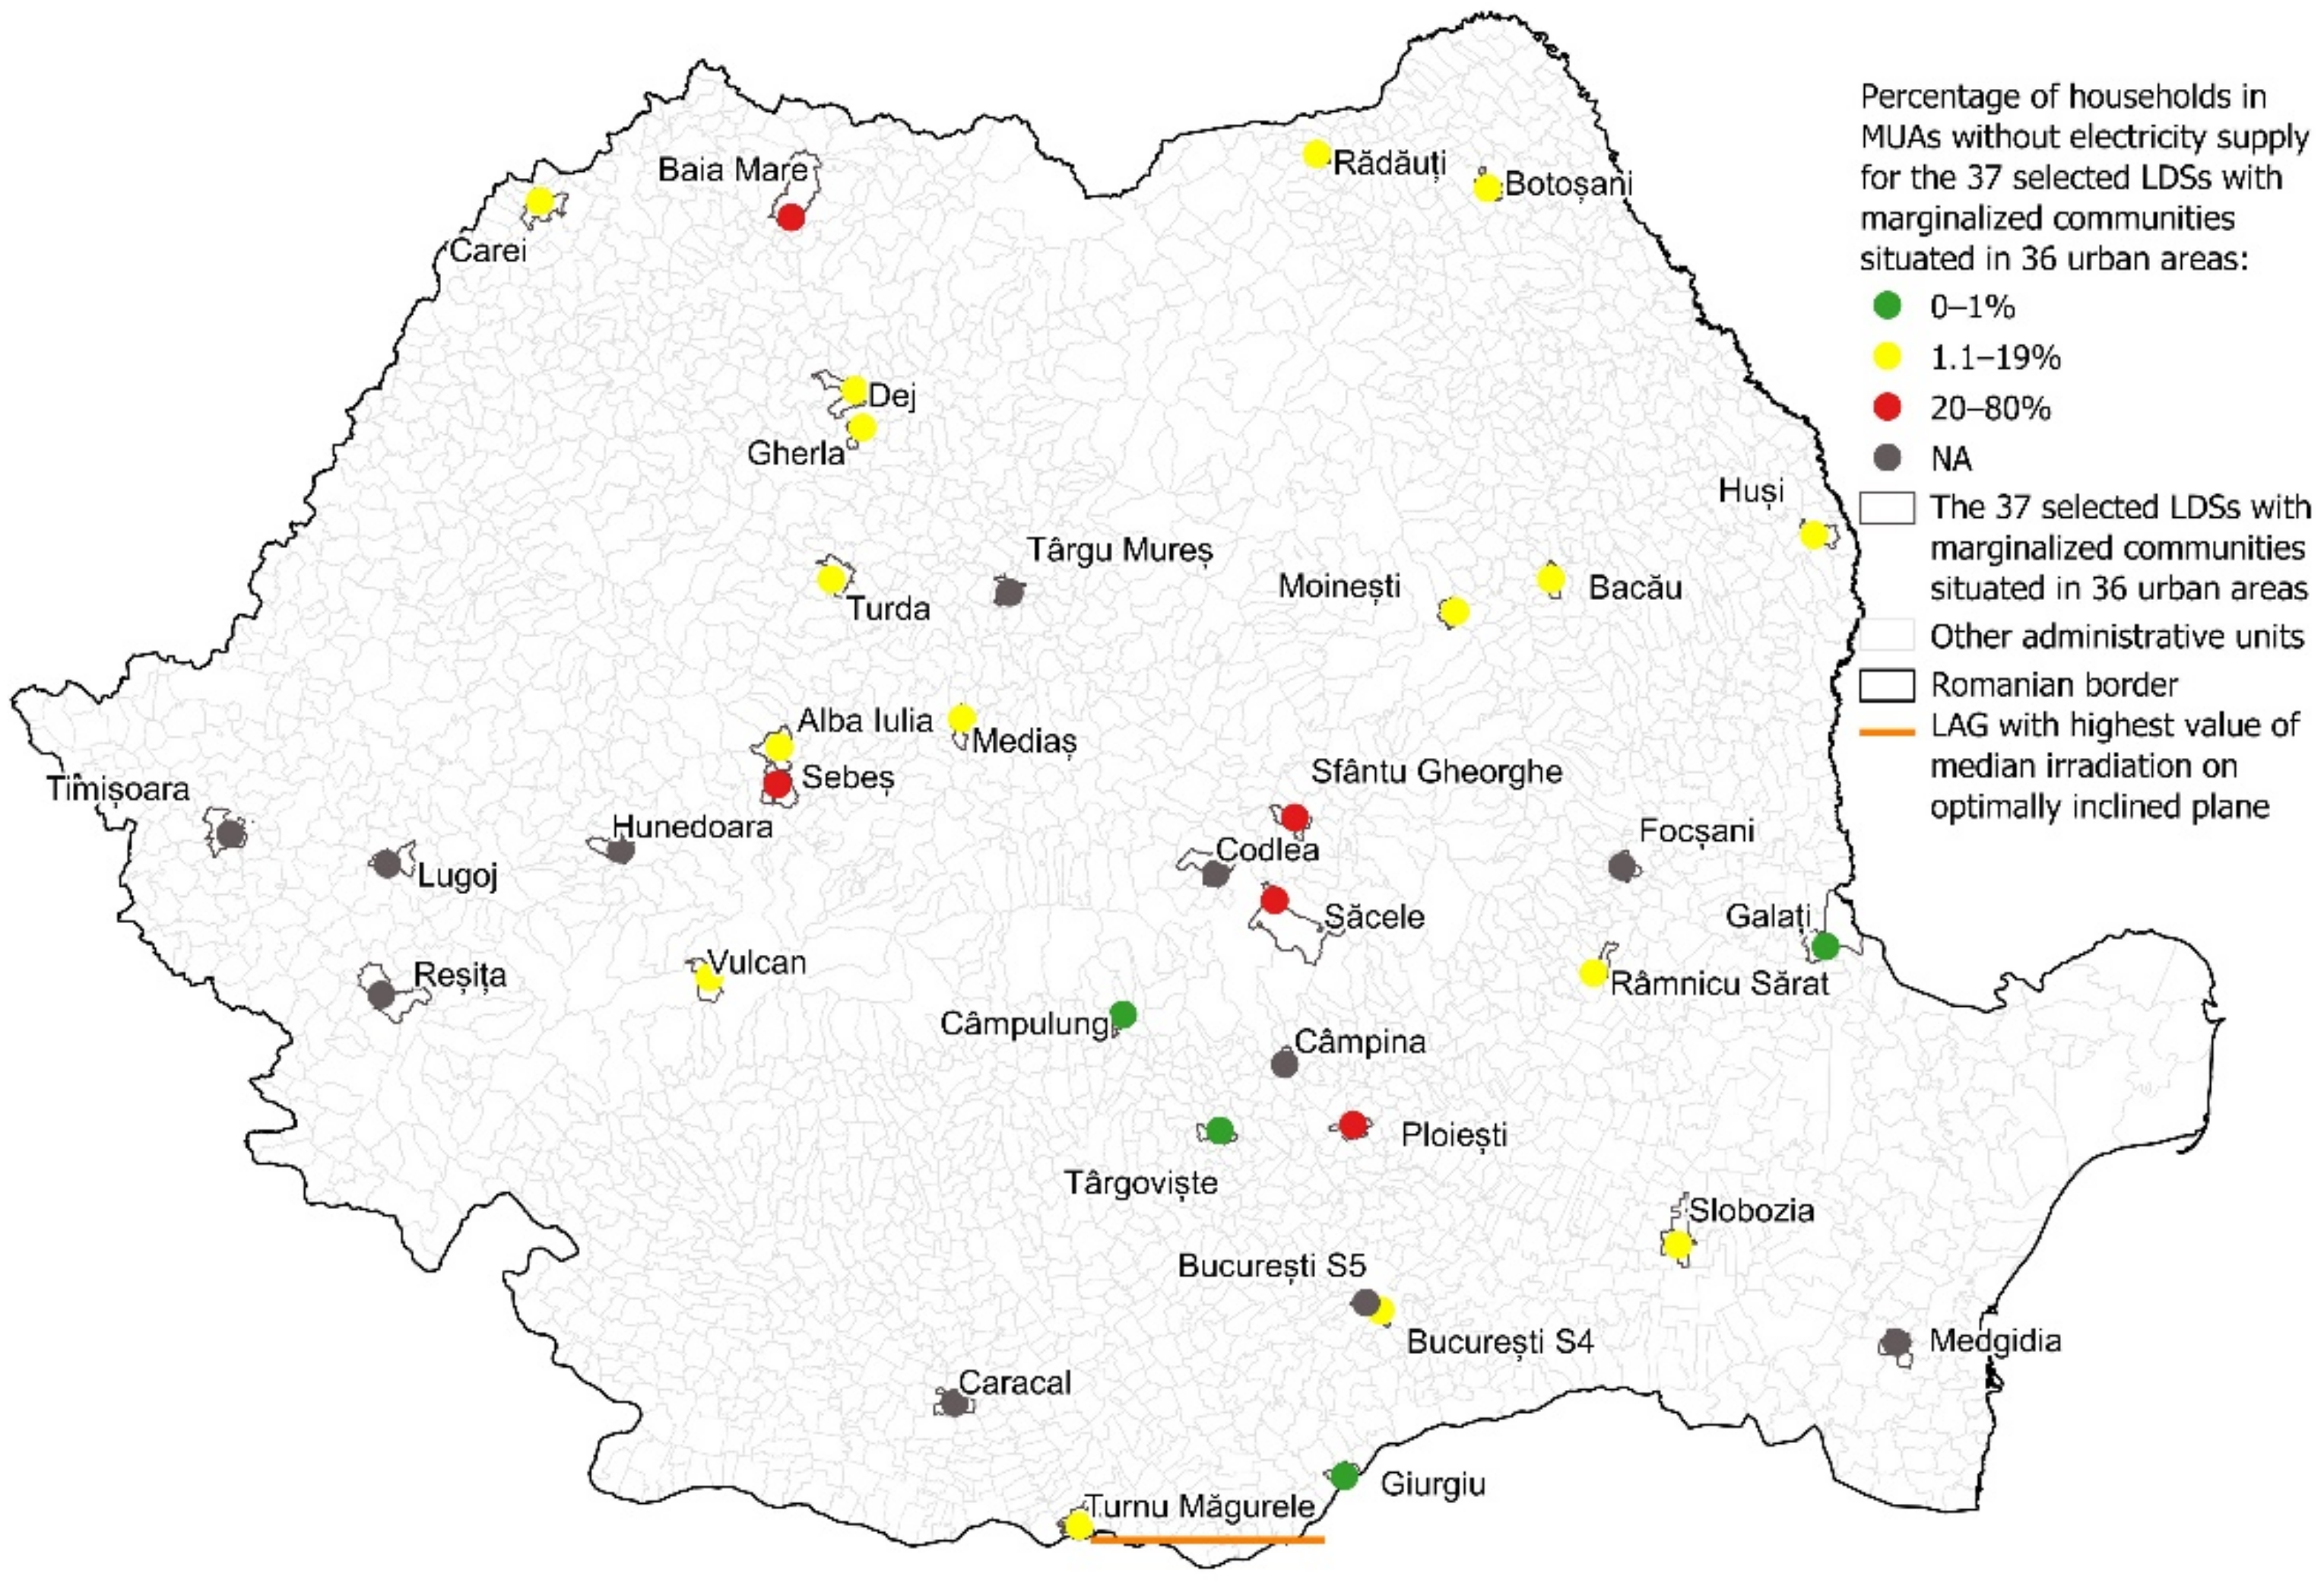
The situation of the dwellings from the studied MUAs that are not connected to the electricity grid is presented in
Figure 10. The percentage of the dwellings without electricity supply in the studied MUAs ranges between 0 and 80%. According to the Atlas of the Marginalized Areas, 4.1% of the households in urban areas do not have electricity. Based on this finding, three categories of percentages of households without electricity were considered: (0–1%)—low percentage; (1.1–19%)—average percentage; (20–80%)—high percentage. The first category contains MUAs from 4 LDSs, the second category contains MUAs from 16 LDSs and the last category includes MUAs from 5 LDSs. For 12 LDSs, no data were available. Eighty-four percent of the LDSs for which data were found exceed the national urban MUA average for lack of electricity supply (4.1%). The following problems regarding electricity supply were extracted from the studied strategies:
The existence of improvised power supply lines, which run from one yard to another and create an additional fire hazard in the Sacele area, and illegal electric connections of houses to the power supply network—Slobozia, Freidorf, Timisoara, Sfantu Gheorghe communities;
Lack of property documents and poverty make it impossible for residents to legally connect to the electricity supply network in the Câmpina community;
Undersized electricity supply network and numerous power cuts in the Lugoj community;
Disconnection of households from utilities due to late payments and frequent illegal reconnections in the Vulcan community;
Occasional disconnection of electricity to the entire block of flats, either because of historical debts, or because some occupants do not pay their utilities, or because of network overloads in Hunedoara, Lugoj and Vulcan communities.
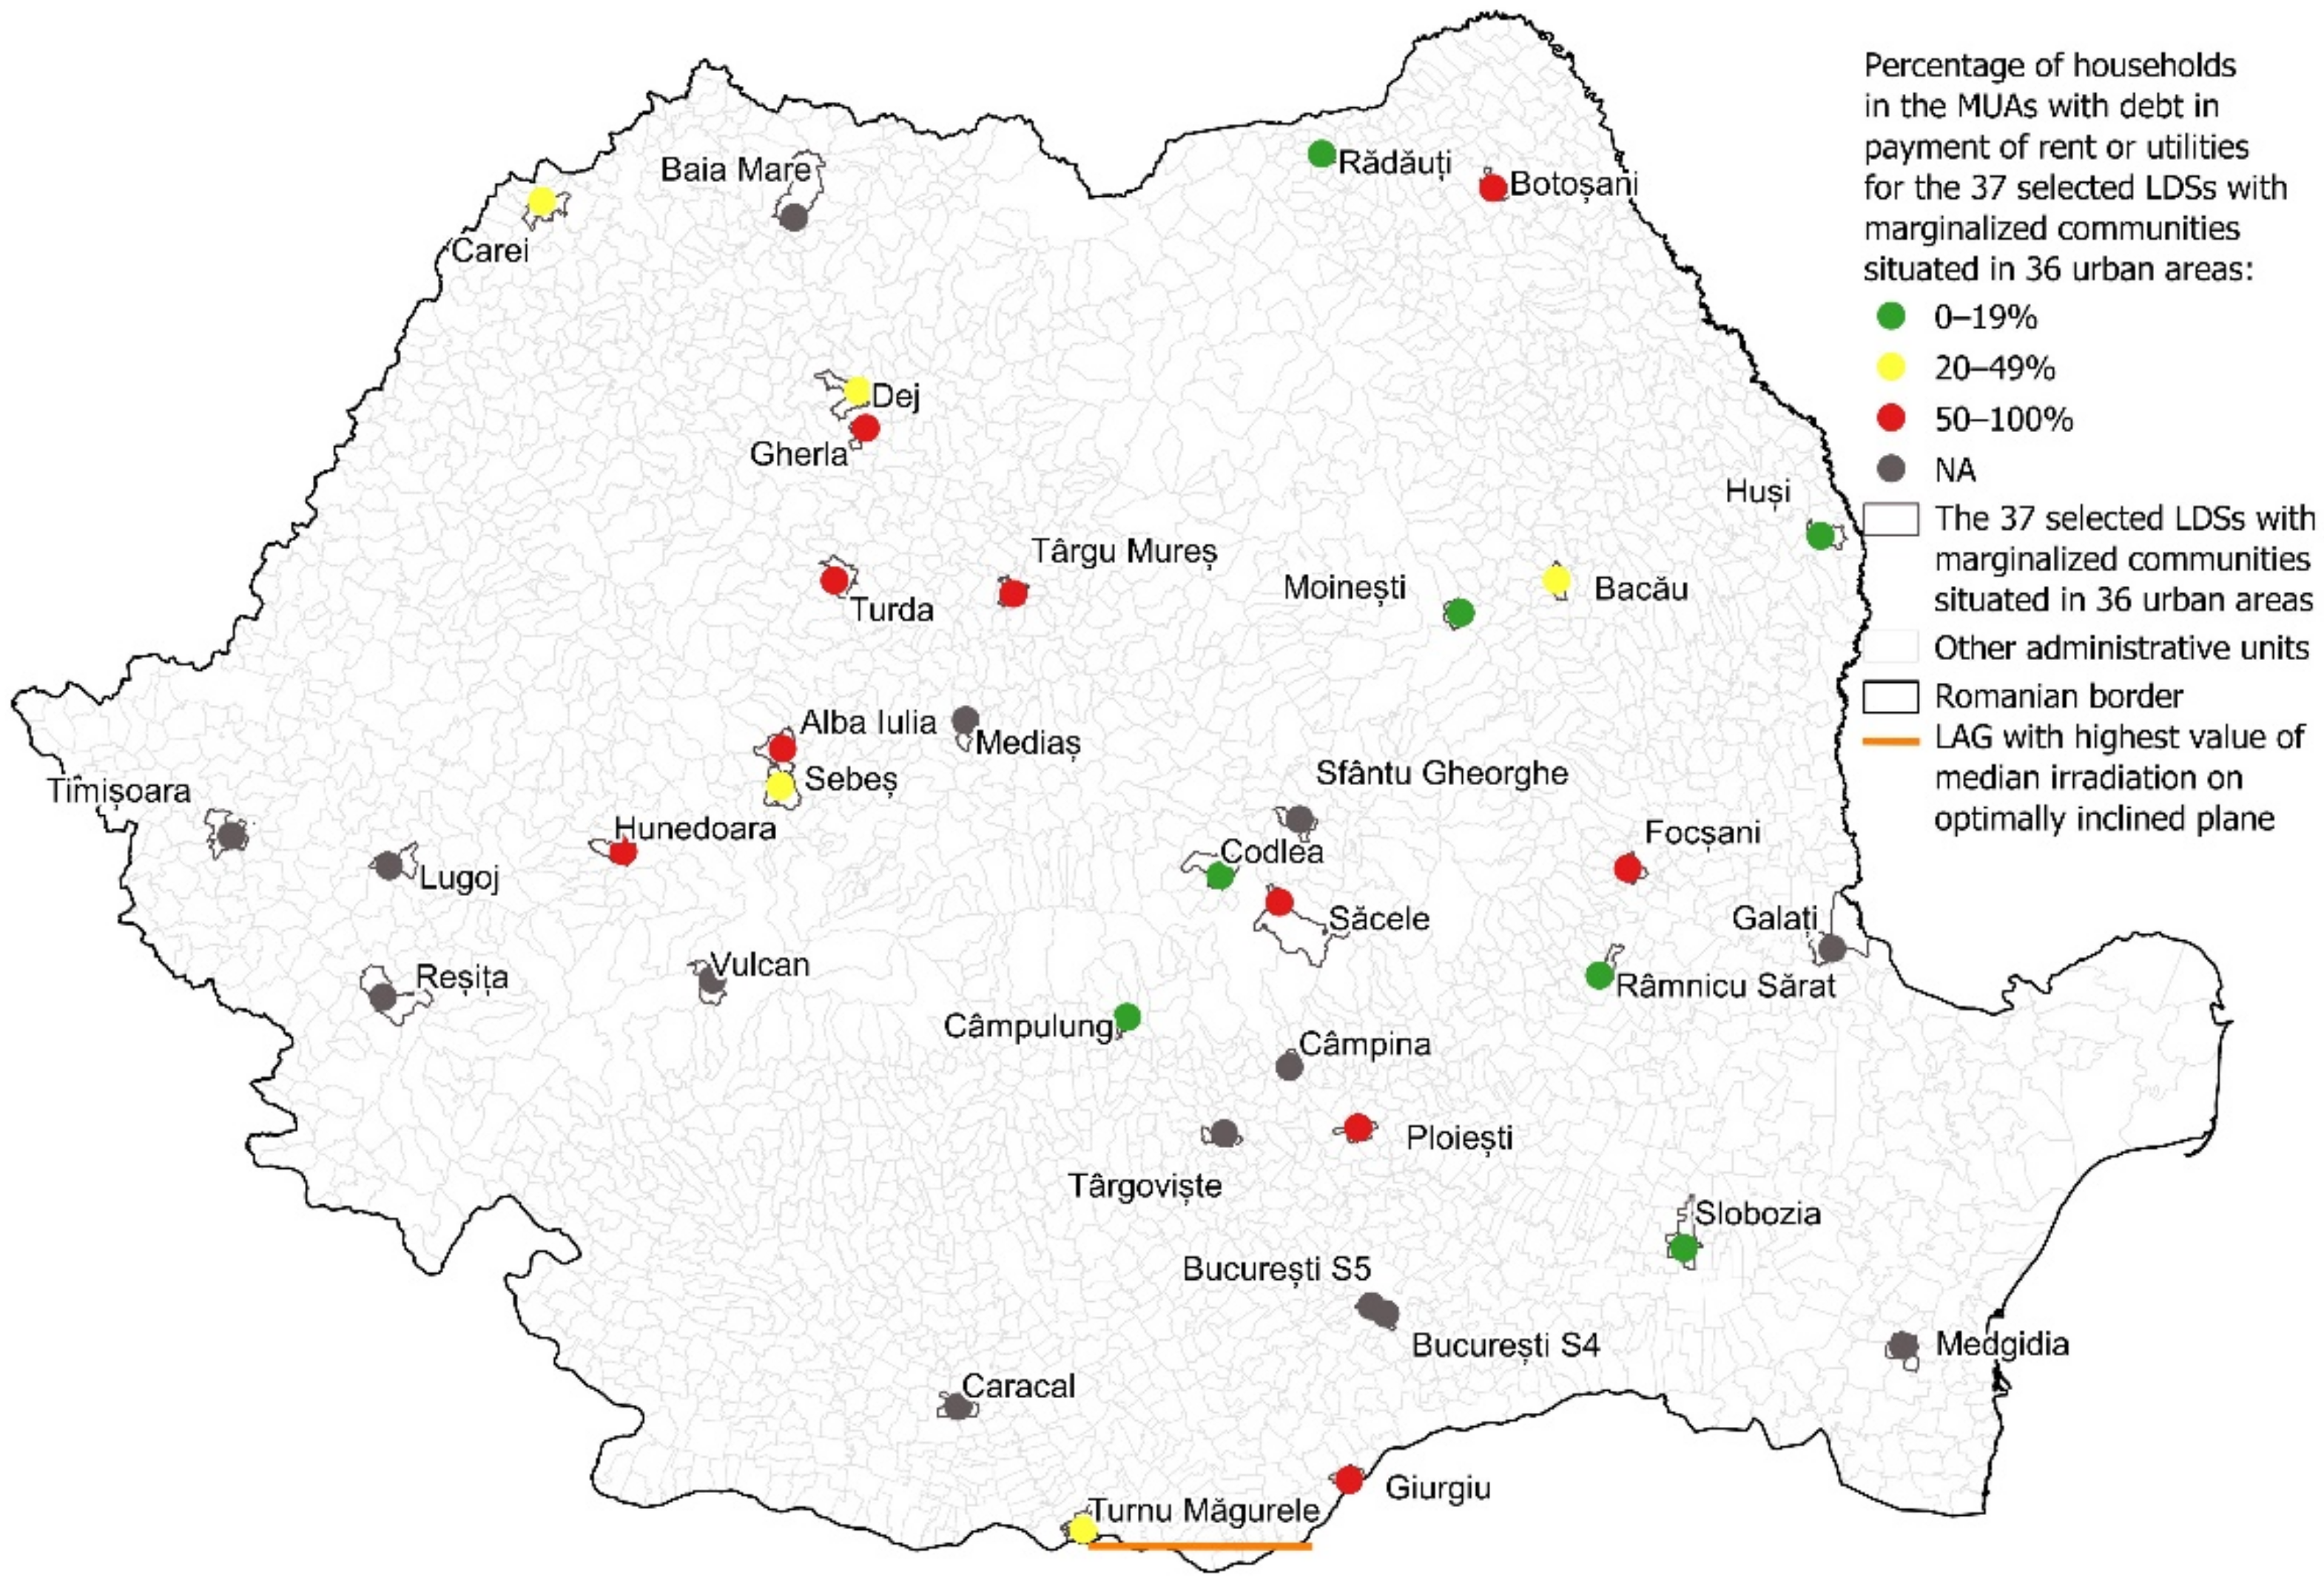
The debts in the payment of utilities are recorded in all marginalized urban areas for the households that are connected to the technical-municipal network, and many of them do not have access to water supply, sewerage, gas or energy supplies. In
Figure 11, the situation of the population with rent and utilities debts is presented. According to the World Bank Report on the National Housing Strategy [
36], more than 20% of the population have recorded delays in utility bills. The percentage of the population in MUAs with rent and utilities debts varies between 0 and 100%, and these data have been included in the following categories: (0–19%), (20–49%) and (50–100%). The first category includes the residents in the MUAs of 7 LDSs, the second includes 5 LDSs and the last category includes the residents in the MUAs of 10 LDSs. No data were available for 15 SDLs. Thus, in 68% of the LDSs analyzed, the population in MUAs has debts higher than the national average (20%).
Similarly to other countries [
18,
22,
37,
38], research has highlighted that energy is not a frequent topic in the local development strategies of marginalized urban communities.
The energy situation of the inhabitants of the MUAs located within the LDSs analyzed is a difficult one, which is reflected in all analyzed indicators.
From the analysis, we can conclude that the inhabitants of the MUAs are vulnerable customers [
39] facing energy poverty [
40], caused, among others, by the following factors: (1) high energy costs (wood predominates but also other fuels); (2) low household income (unemployment, low wages and high living costs); (3) energy-inefficient dwellings (inadequately insulated buildings, poorly sealed windows and doors without thermal insulation, inefficient heating systems, etc.); (4) lack of access to adequate energy sources.
An analysis of LDS prepared by local stakeholders (usually the most active local elites) with the participation of local communities shows that, at the time of their creation, in the years 2014–2015, issues of actions on renewable (especially solar) energy development and climate change mitigation actions [
41] were not considered significant for the authors of these documents. LAGs seem largely unaware of or uninterested in the entrepreneurial potential of small-scale initiatives such as cooperatives or renewable energy groups, even though access to energy is an issue in most communities (for heating and electricity), which relates to research question no 1.
Moving on, the parameter considered for the further development of sustainable energy generation in marginalized communities is global irradiation at the optimal angle and consists in the monthly sum of the solar radiation in kWh that hits 1 m
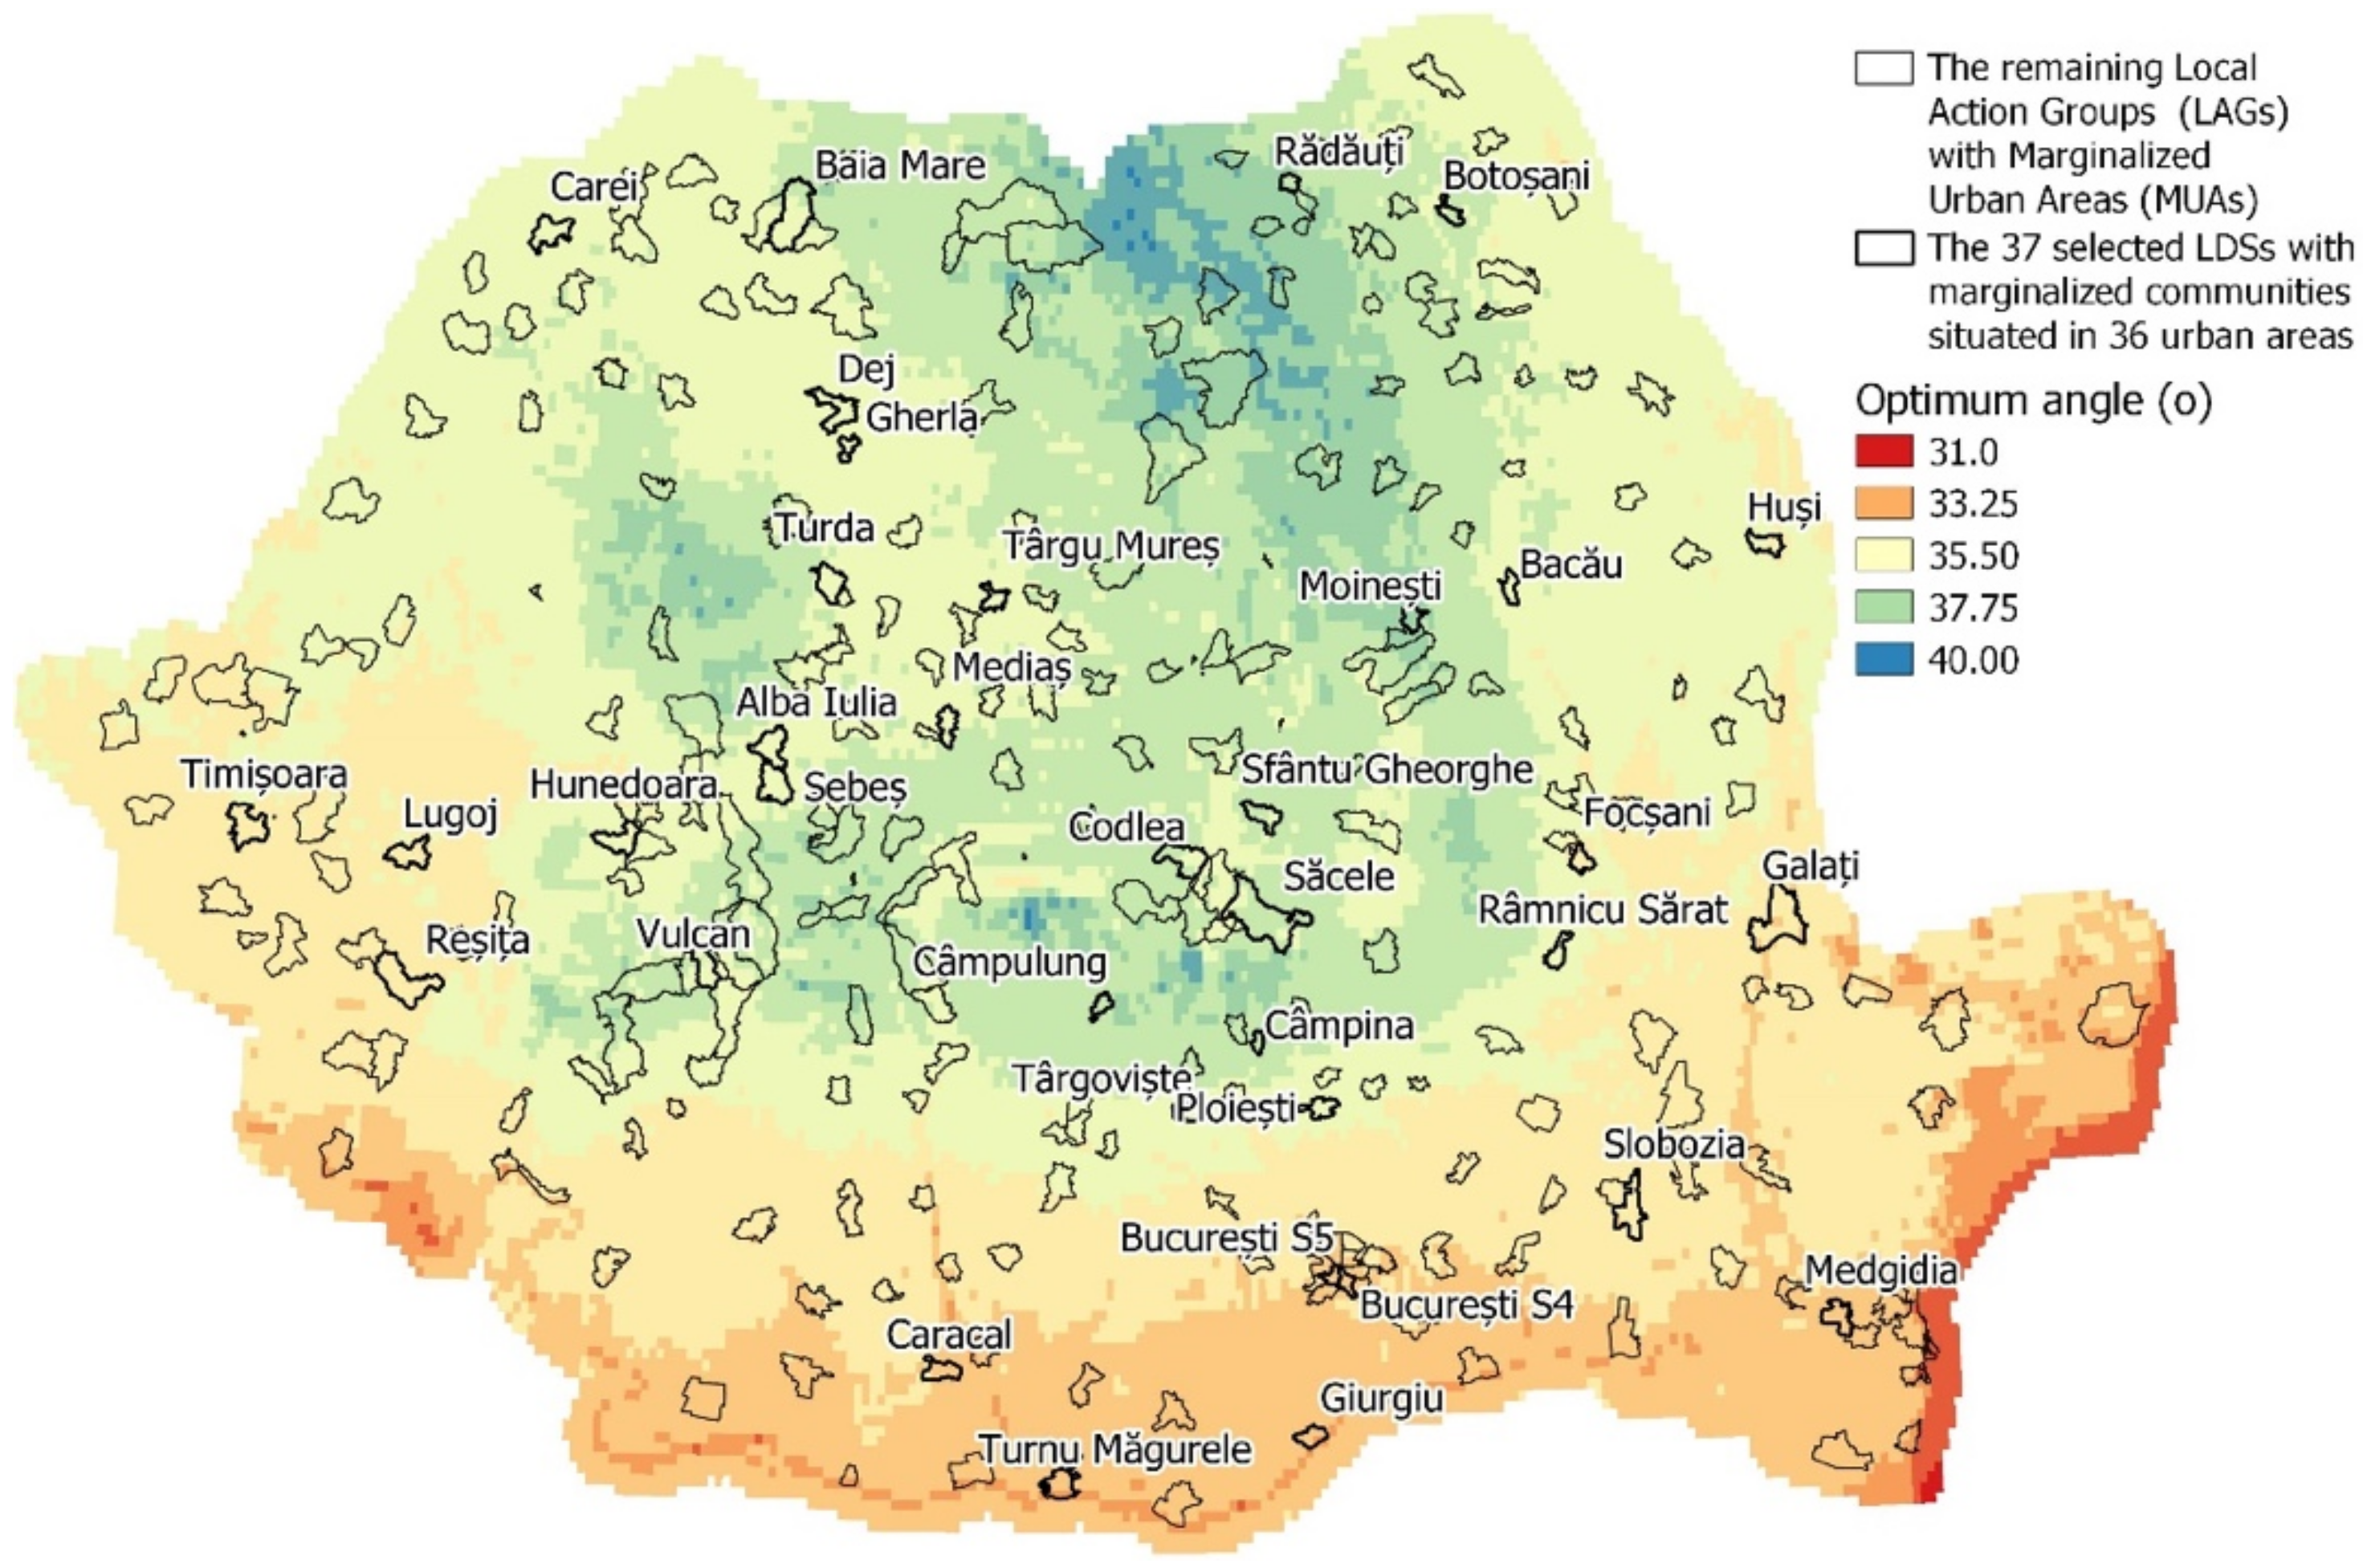
2 of a PV module plane, tilting toward the equator at the optimal angle in order to obtain the highest annual irradiation to maximize yearly PV production. The optimum tilt map for Romania’s urban areas with marginalized urban communities presented in
Figure 12 was obtained by overlapping the outlines of the Romanian LAGs administrative units with the OPTA optimal angle GIS data provided at a spatial resolution of about 4 km [
42], from the World Bank’s Global Solar Atlas 2.0. Global Solar Atlas 2.0 is a free, web-based application developed and operated by the company Solargis s.r.o. on behalf of the World Bank Group by utilizing Solargis data, with funding provided by the Energy Sector Management Assistance Program (ESMAP) [
43].
PV power depends on the solar irradiance and on the module’s temperature. The efficiency of PV modules decreases with increasing temperature. Generally, efficiency is nearly constant for irradiances somewhere between 400 W/m
2 and 1000 W/m
2, but at lower irradiance, the efficiency tends to decrease as well. Due to the Standard Test Conditions (STC) of the modules where irradiance is about 1000 W/m
2 but with fairly low temperatures (25 °C), the average module efficiency is a bit lower than the efficiency from STC measurements. According to the measurements performed at the European Solar Test Installation (ESTI) of the Joint Research Centre [
44], the obtained PV modules’ efficiency, considered as a percentage of the efficiency measured at STC for three PV technologies at constant temperature (T = 40 °C) and at irradiance levels lower than 400 W/m
2, drops from 95% to 45%.
The results obtained from the running of the PVGIS model on the PVGIS website were the monthly average solar irradiation data on a horizontal plane, optimally inclined plane, on a plane always normal to sun rays and monthly average data for temperature over the 2005–2015 decade. As the map of the optimal tilt of PV modules for Romania was obtained from the Global Solar Atlas platform [
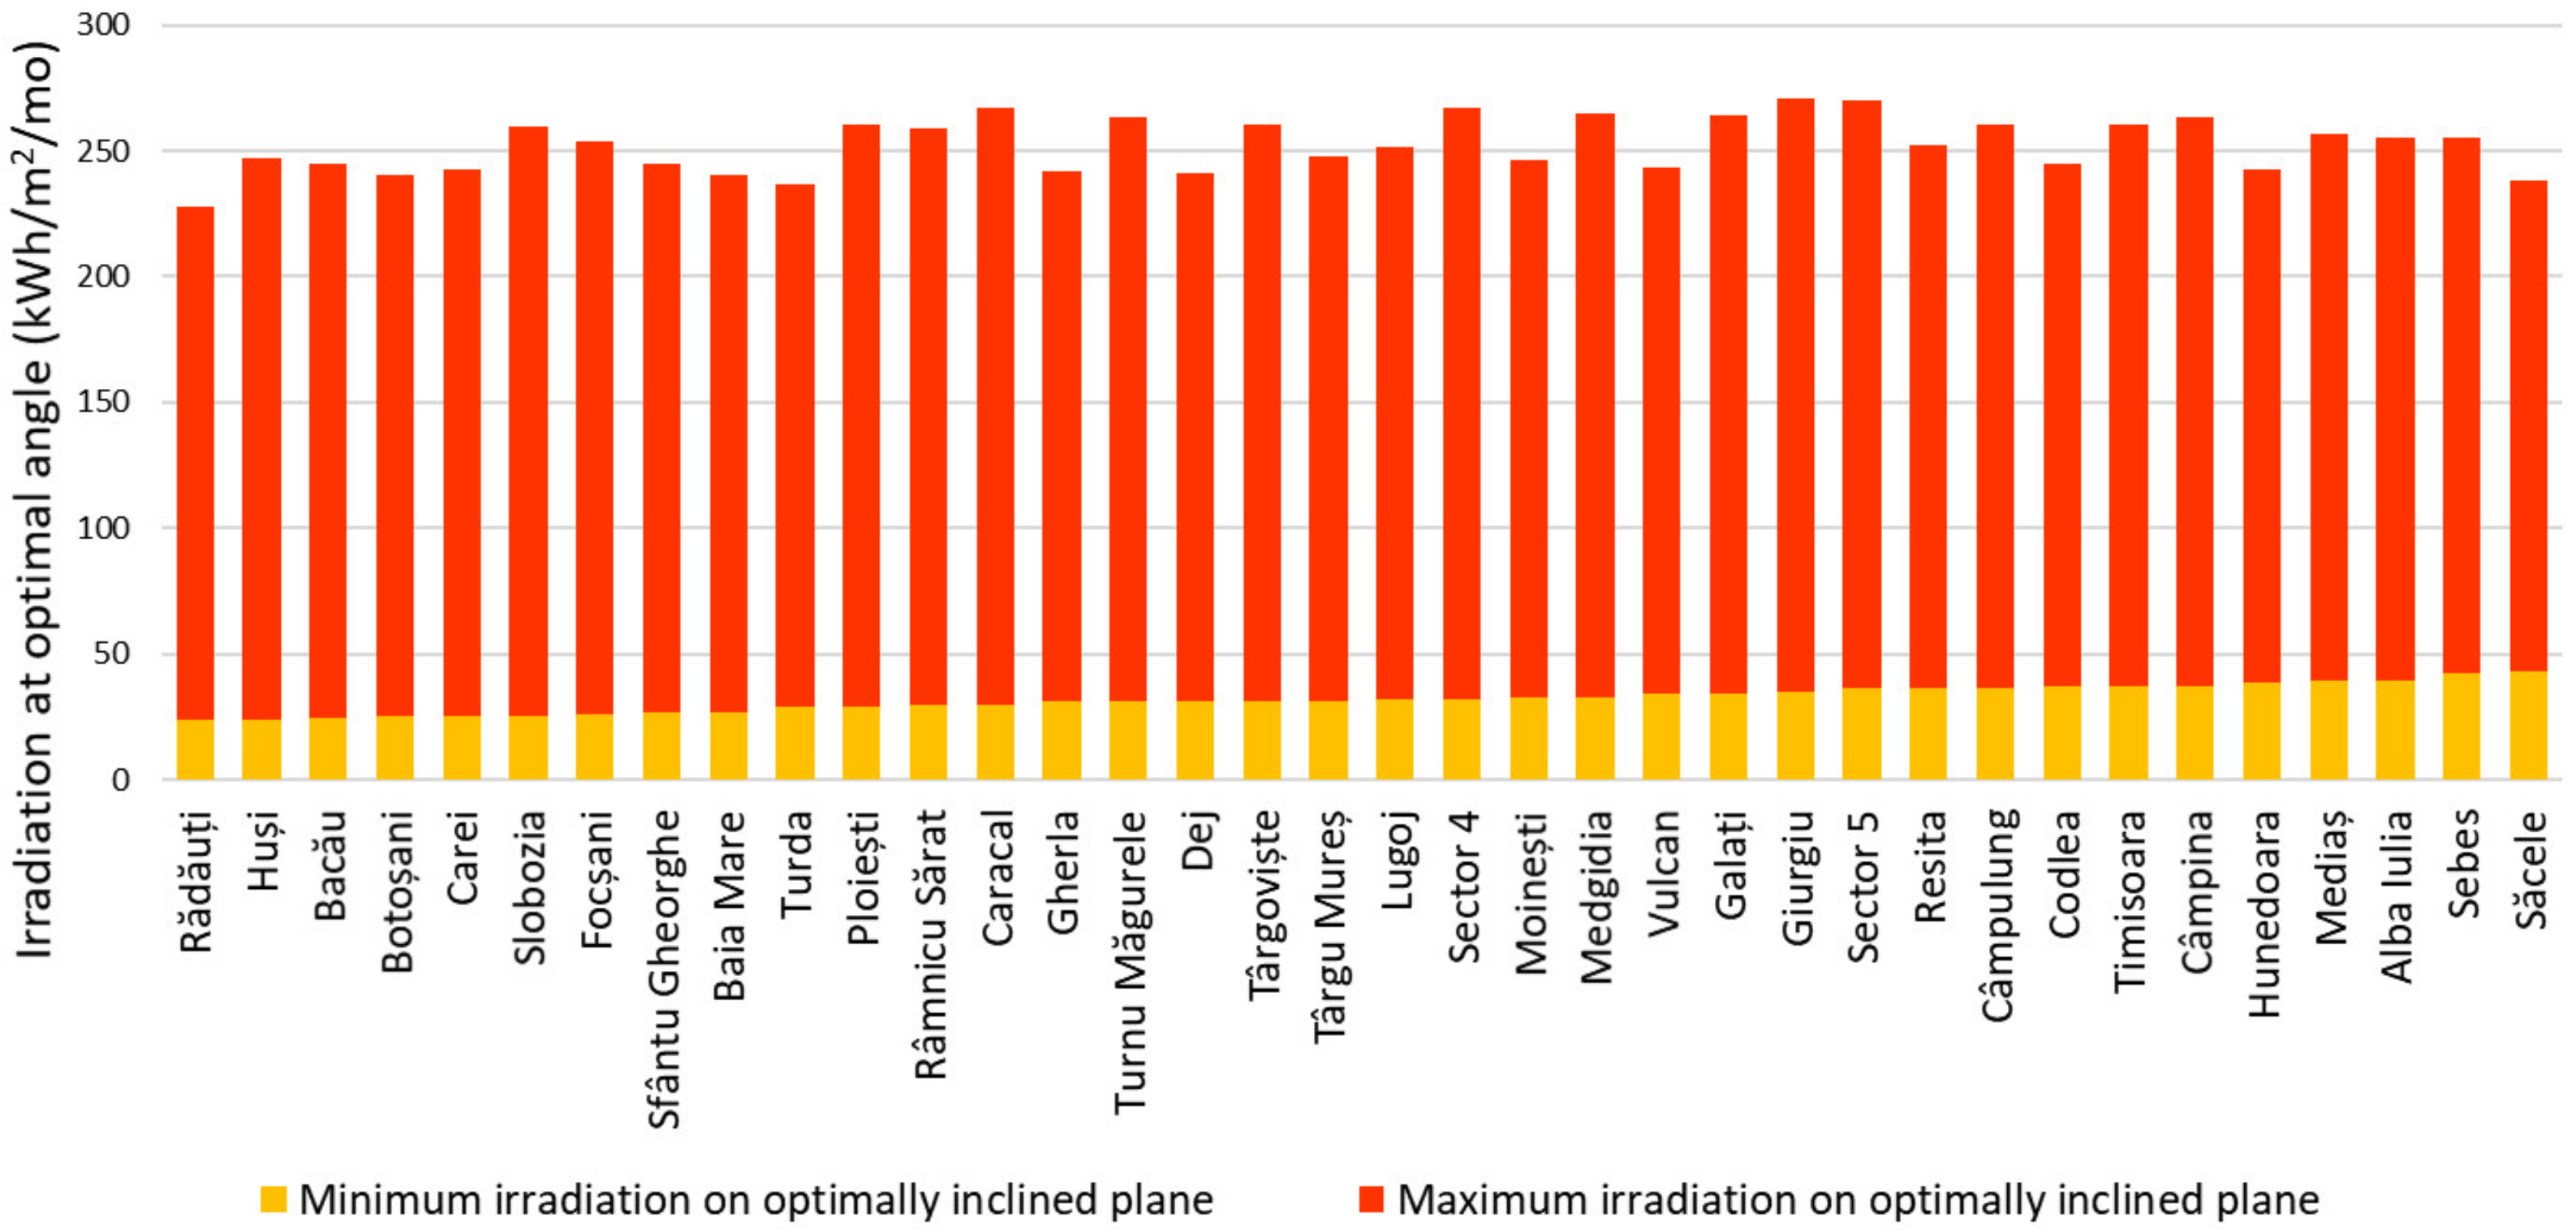
43], it can be used to link LAGs’ geographical position to the expected estimate of the solar irradiation on an optimally inclined plane in order to obtain more accurate technical specifications of the PV modules for correct mounting and more efficient energy production. The maximum values of irradiation on optimally inclined plane resulted for the 37 marginalized communities in the 36 urban areas’ Administrative Units range from 259 W/m
2 to 295 W/m
2 (
Figure 13), which, according to the analysis presented in the technical documentation for the European Commission’s PVGIS service [
44], provide a relative efficiency between 85% and 90% for three PV technologies: crystalline silicon (c-Si), CIGS and Cadmium Telluride (CdTe). The relative efficiency values show whether the average module efficiency is lower or greater than the efficiency measured at the factory [
44].
Performing the same type of analysis as stated above with the help of the PVGIS platform, the minimum irradiation on an optimally inclined plane that was obtained for the 37 local development strategies for MUAs situated into 36 urban areas in resulted in values from 25 to 45 kWh/m
2/mo (
Figure 13), which means that the minimum irradiance values are between 34.72 W/m
2 and 62.1 W/m
2, in which case the relative efficiency is lower than 55% according to the same method [
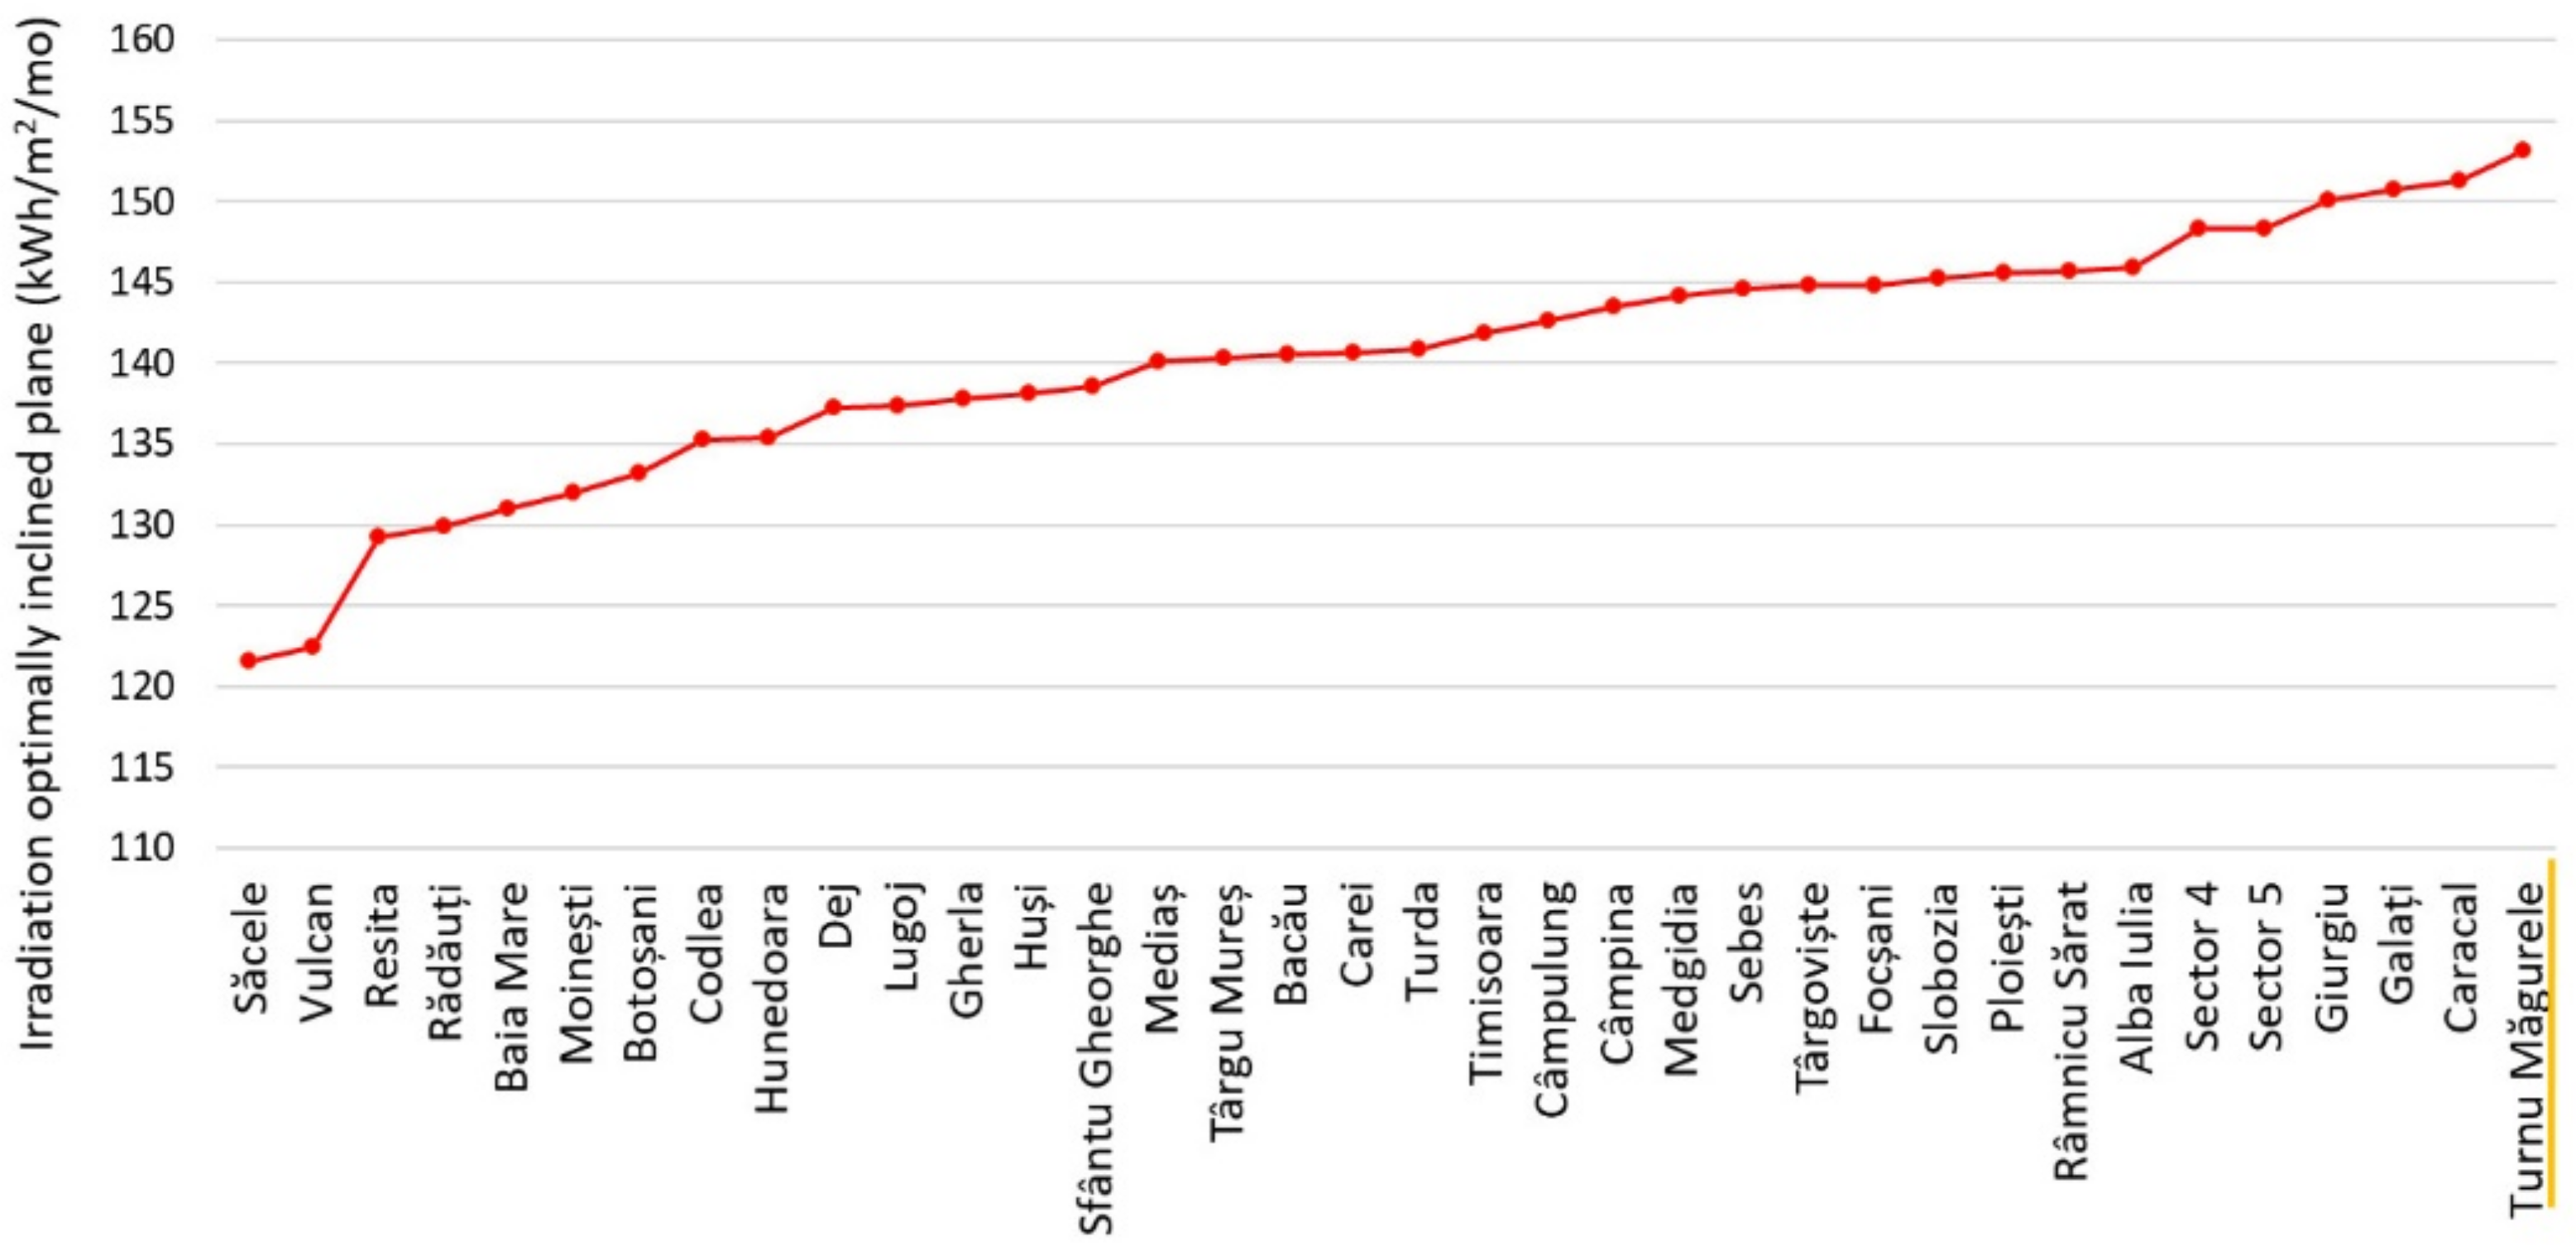
44]. The ranges of median values of irradiation on optimally inclined planes resulting from the PVGIS tool resulted in values from 161.4 W/m
2 to 189 W/m
2 (
Figure 14), in which case the relative efficiency is between 70% and 85% following the same method as before.
From another standpoint, regarding the measurements for the relative efficiency at constant irradiance (G = 800 W/m
2) but at different module temperatures [
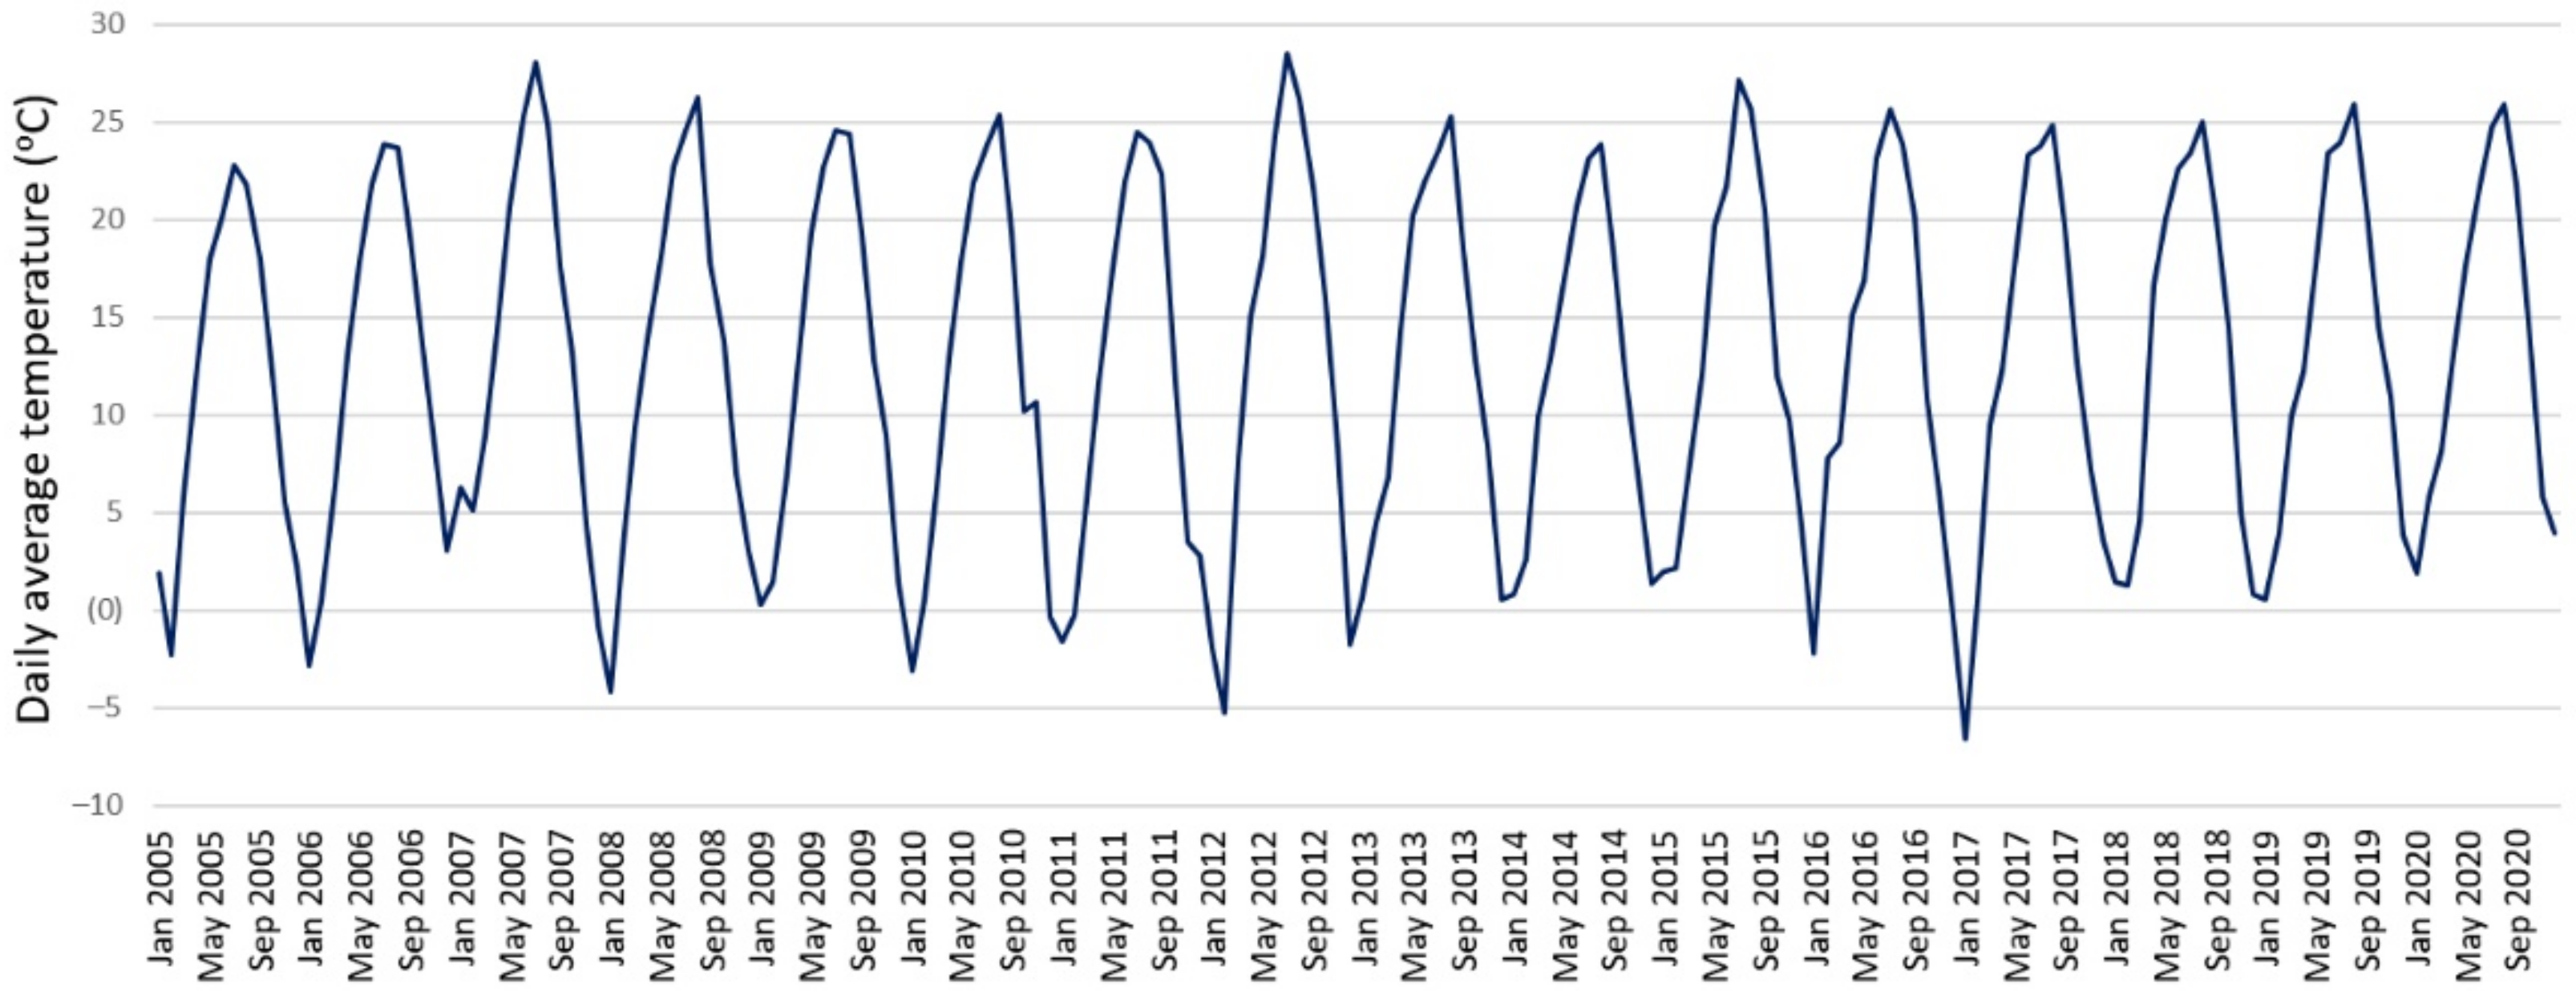
44], the measurements show that, at temperatures starting from 25 and those close to 40 °C, the relative efficiency becomes higher than 95%. Thus, in the case of the exemplified city of Turnu Măgurele, the daily average of temperature ranges is much lower than 40 °C and even lower than 25 °C (
Figure 15) and should be taken into account that, on daily a basis, the relative efficiency becomes lower than 95%. The standard test conditions started from 25 °C; thus, the situation of the relative efficiency for cooler days was not studied [
44].
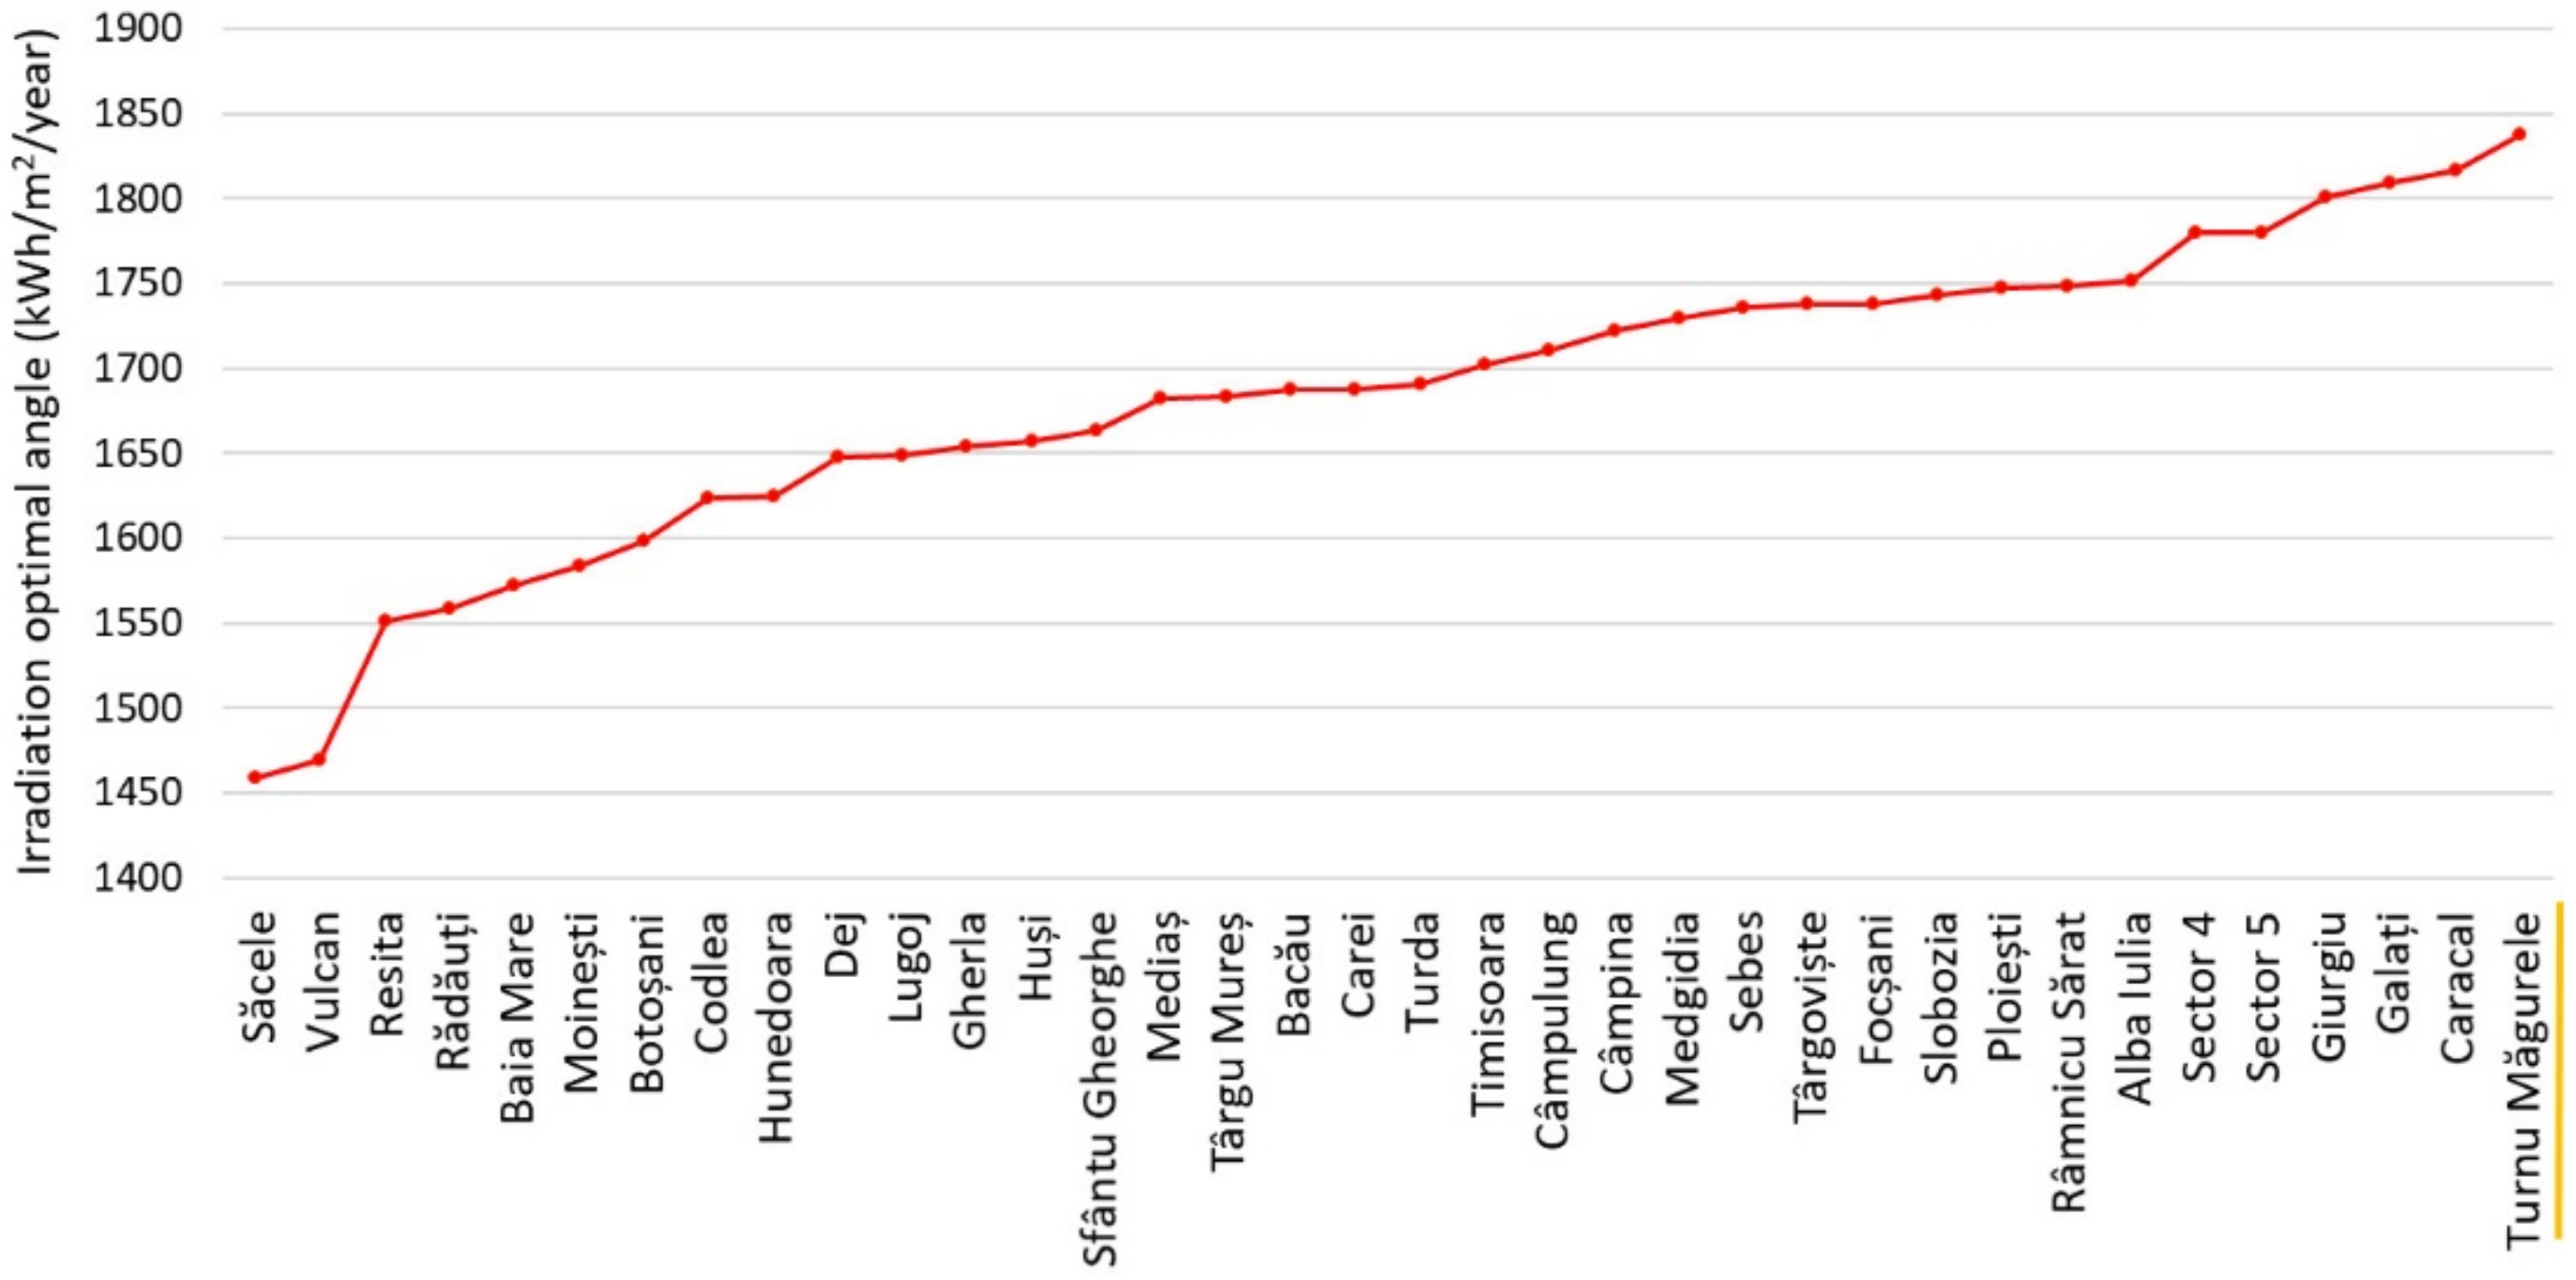
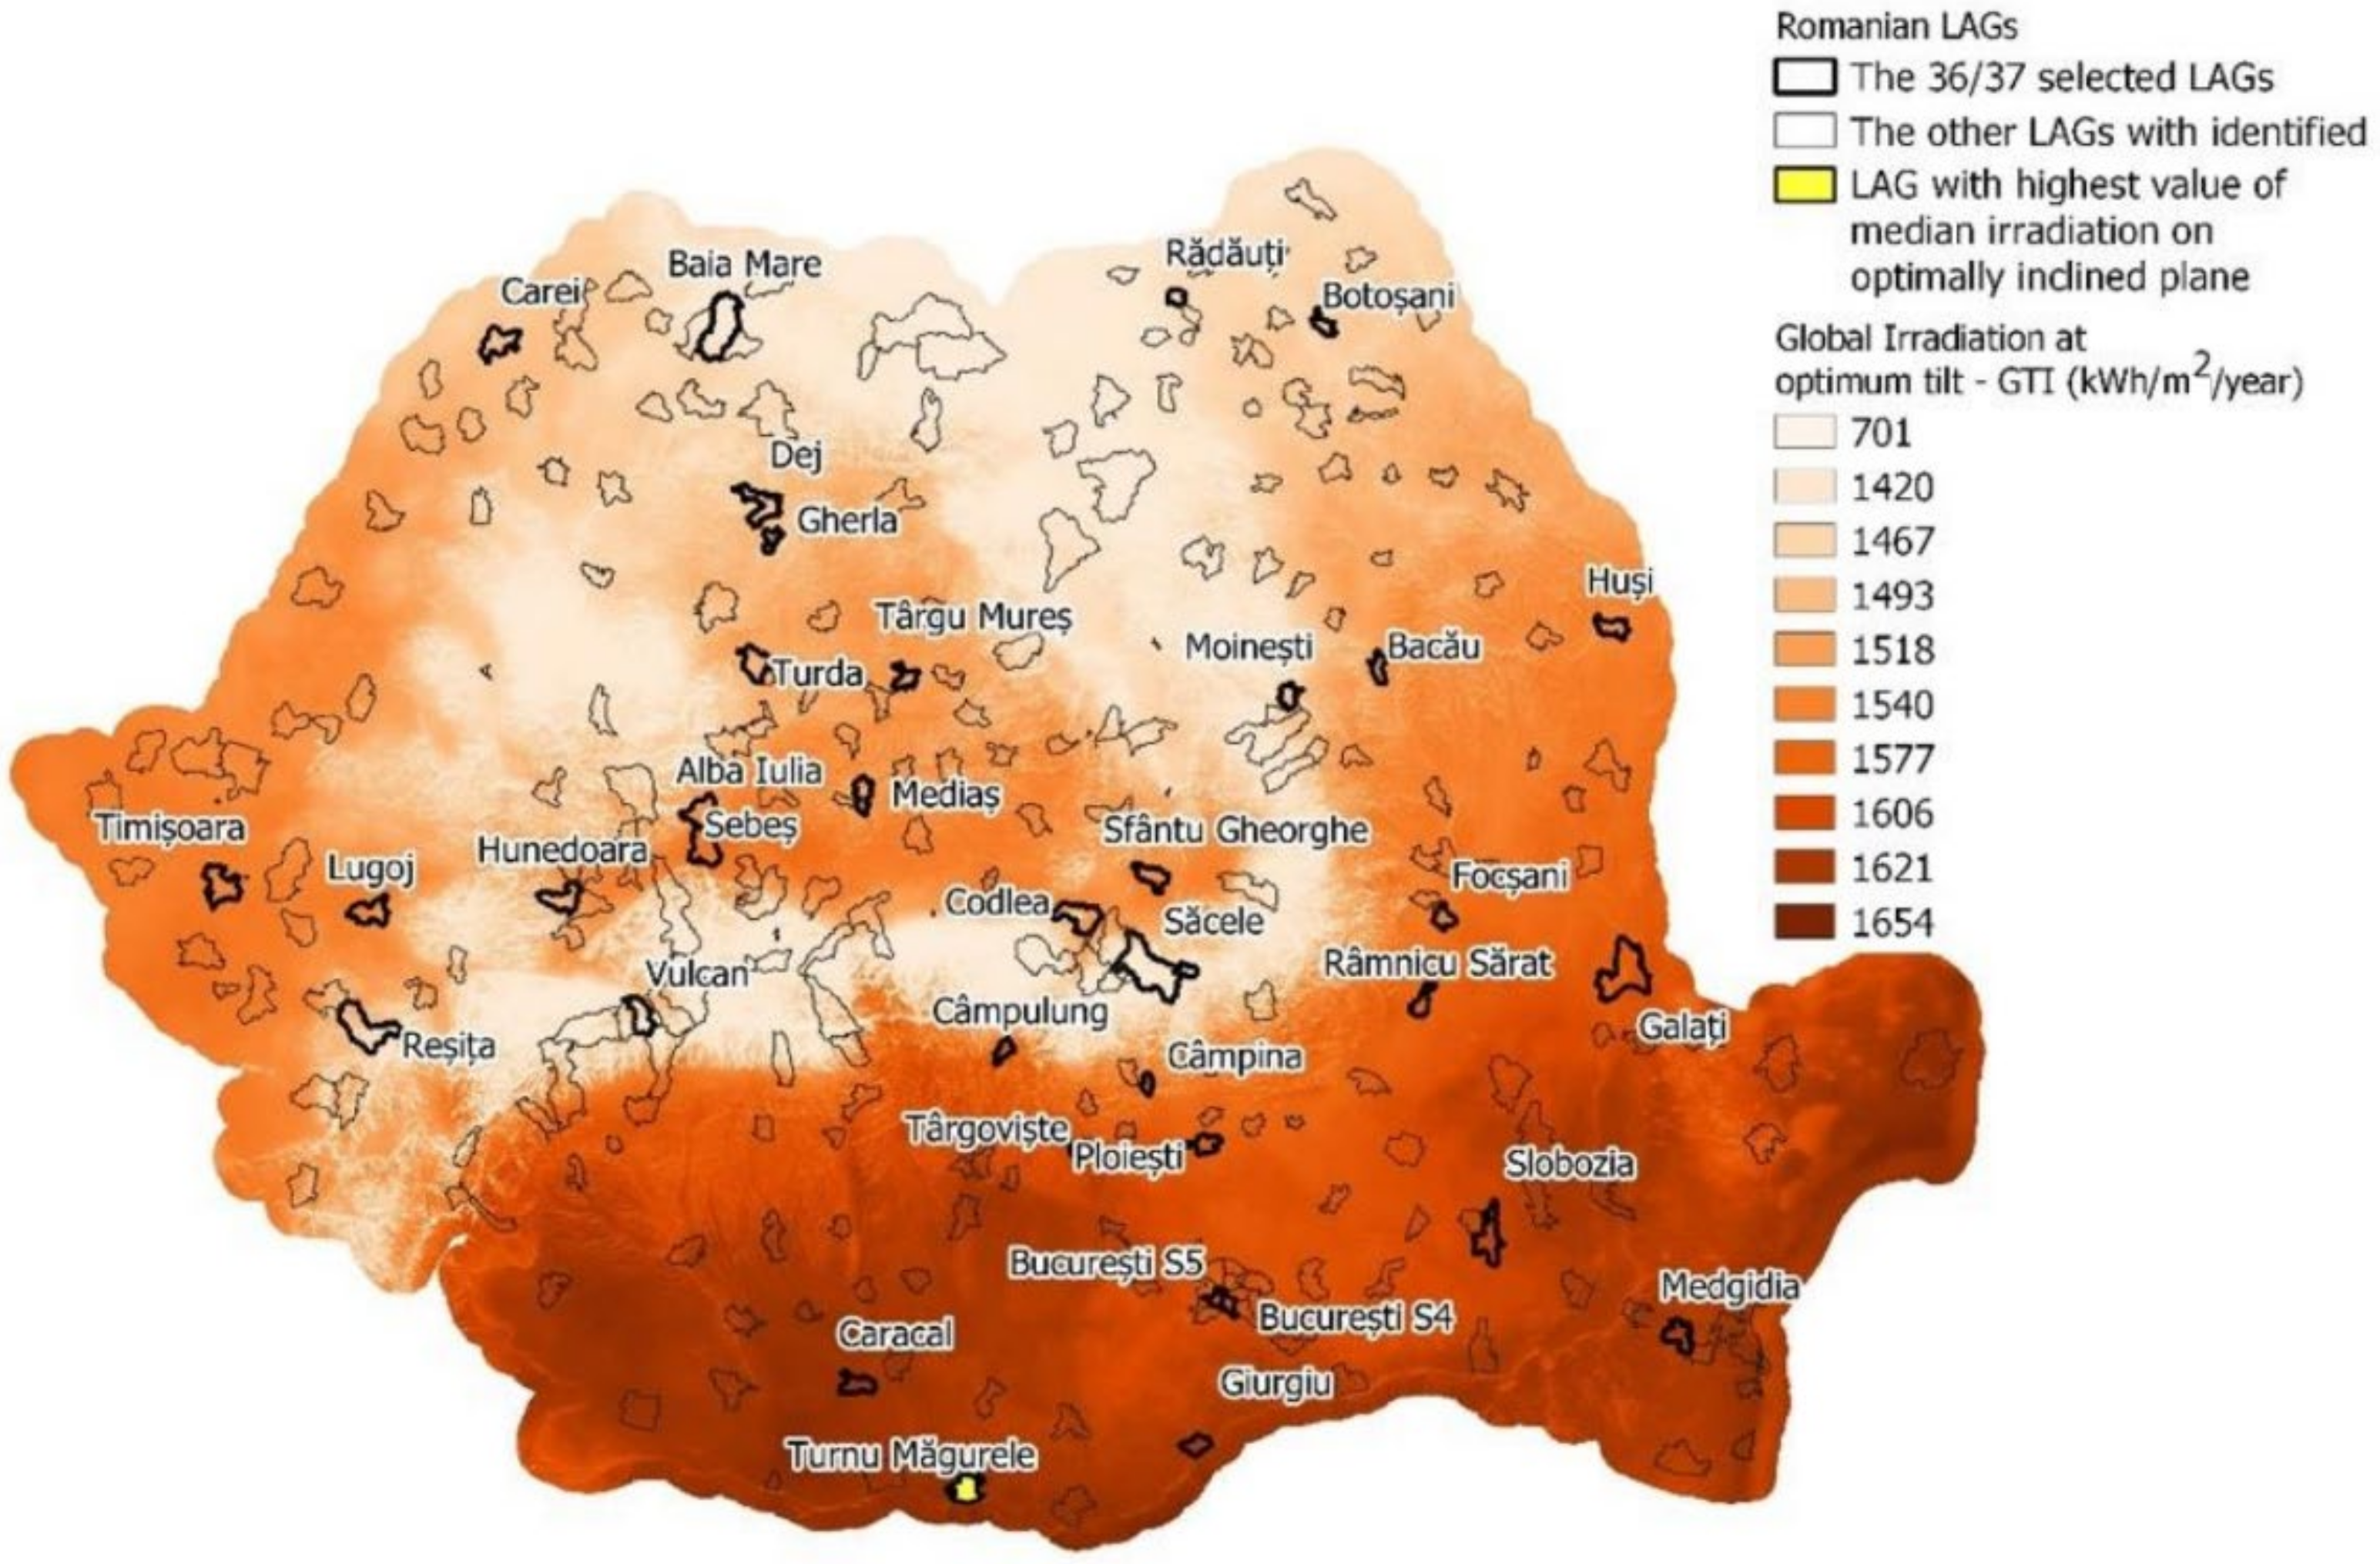
According to the results obtained from the PVGIS model, related to the yearly median values of irradiation for the best mounting angle of the PV modules that can be placed in the 36 urban areas with the identified MUAs selected in the 37 local development strategies, these values can be better understood when overlayed with the map of the global irradiation values at an optimal tilt of the PV modules for all LAGs (with MUAs) for both currently selected LAGs but also for the further involvement of more MUAs. There is a difference in the yearly values (
Figure 16 and
Figure 17) due to the periods covered by the available datasets; thus, both temporal and spatial resolutions generate differences, and PVGIS covers the 2005–2020 period on a 5 km pixel; as for the Global Solar Atlas database, which generated the map, the long-term average covers the 1994–2018 period of time with effects of the terrain considered at 250 m pixel as opposed to the 4 km pixel for the OPTA map [
42].
As observed in
Figure 16 and
Figure 17, the average values of yearly irradiation on optimal tilt of the PV modules are relatively close, ranging from about 1400 to 1650 kWh/m
2 in the case of PVGIS calculations for the 36 urban areas in which the MUAs selected in the 37 LDSs are situated compared to the same range of about 1400–1650 kWh/m
2 in the case of the Solar Atlas data-based map, with the exception of the mountain areas for which the 250 m spatial resolution offered by the Global Solar Atlas underlaying resources was too coarse to obtain accurate values in steep surfaces.
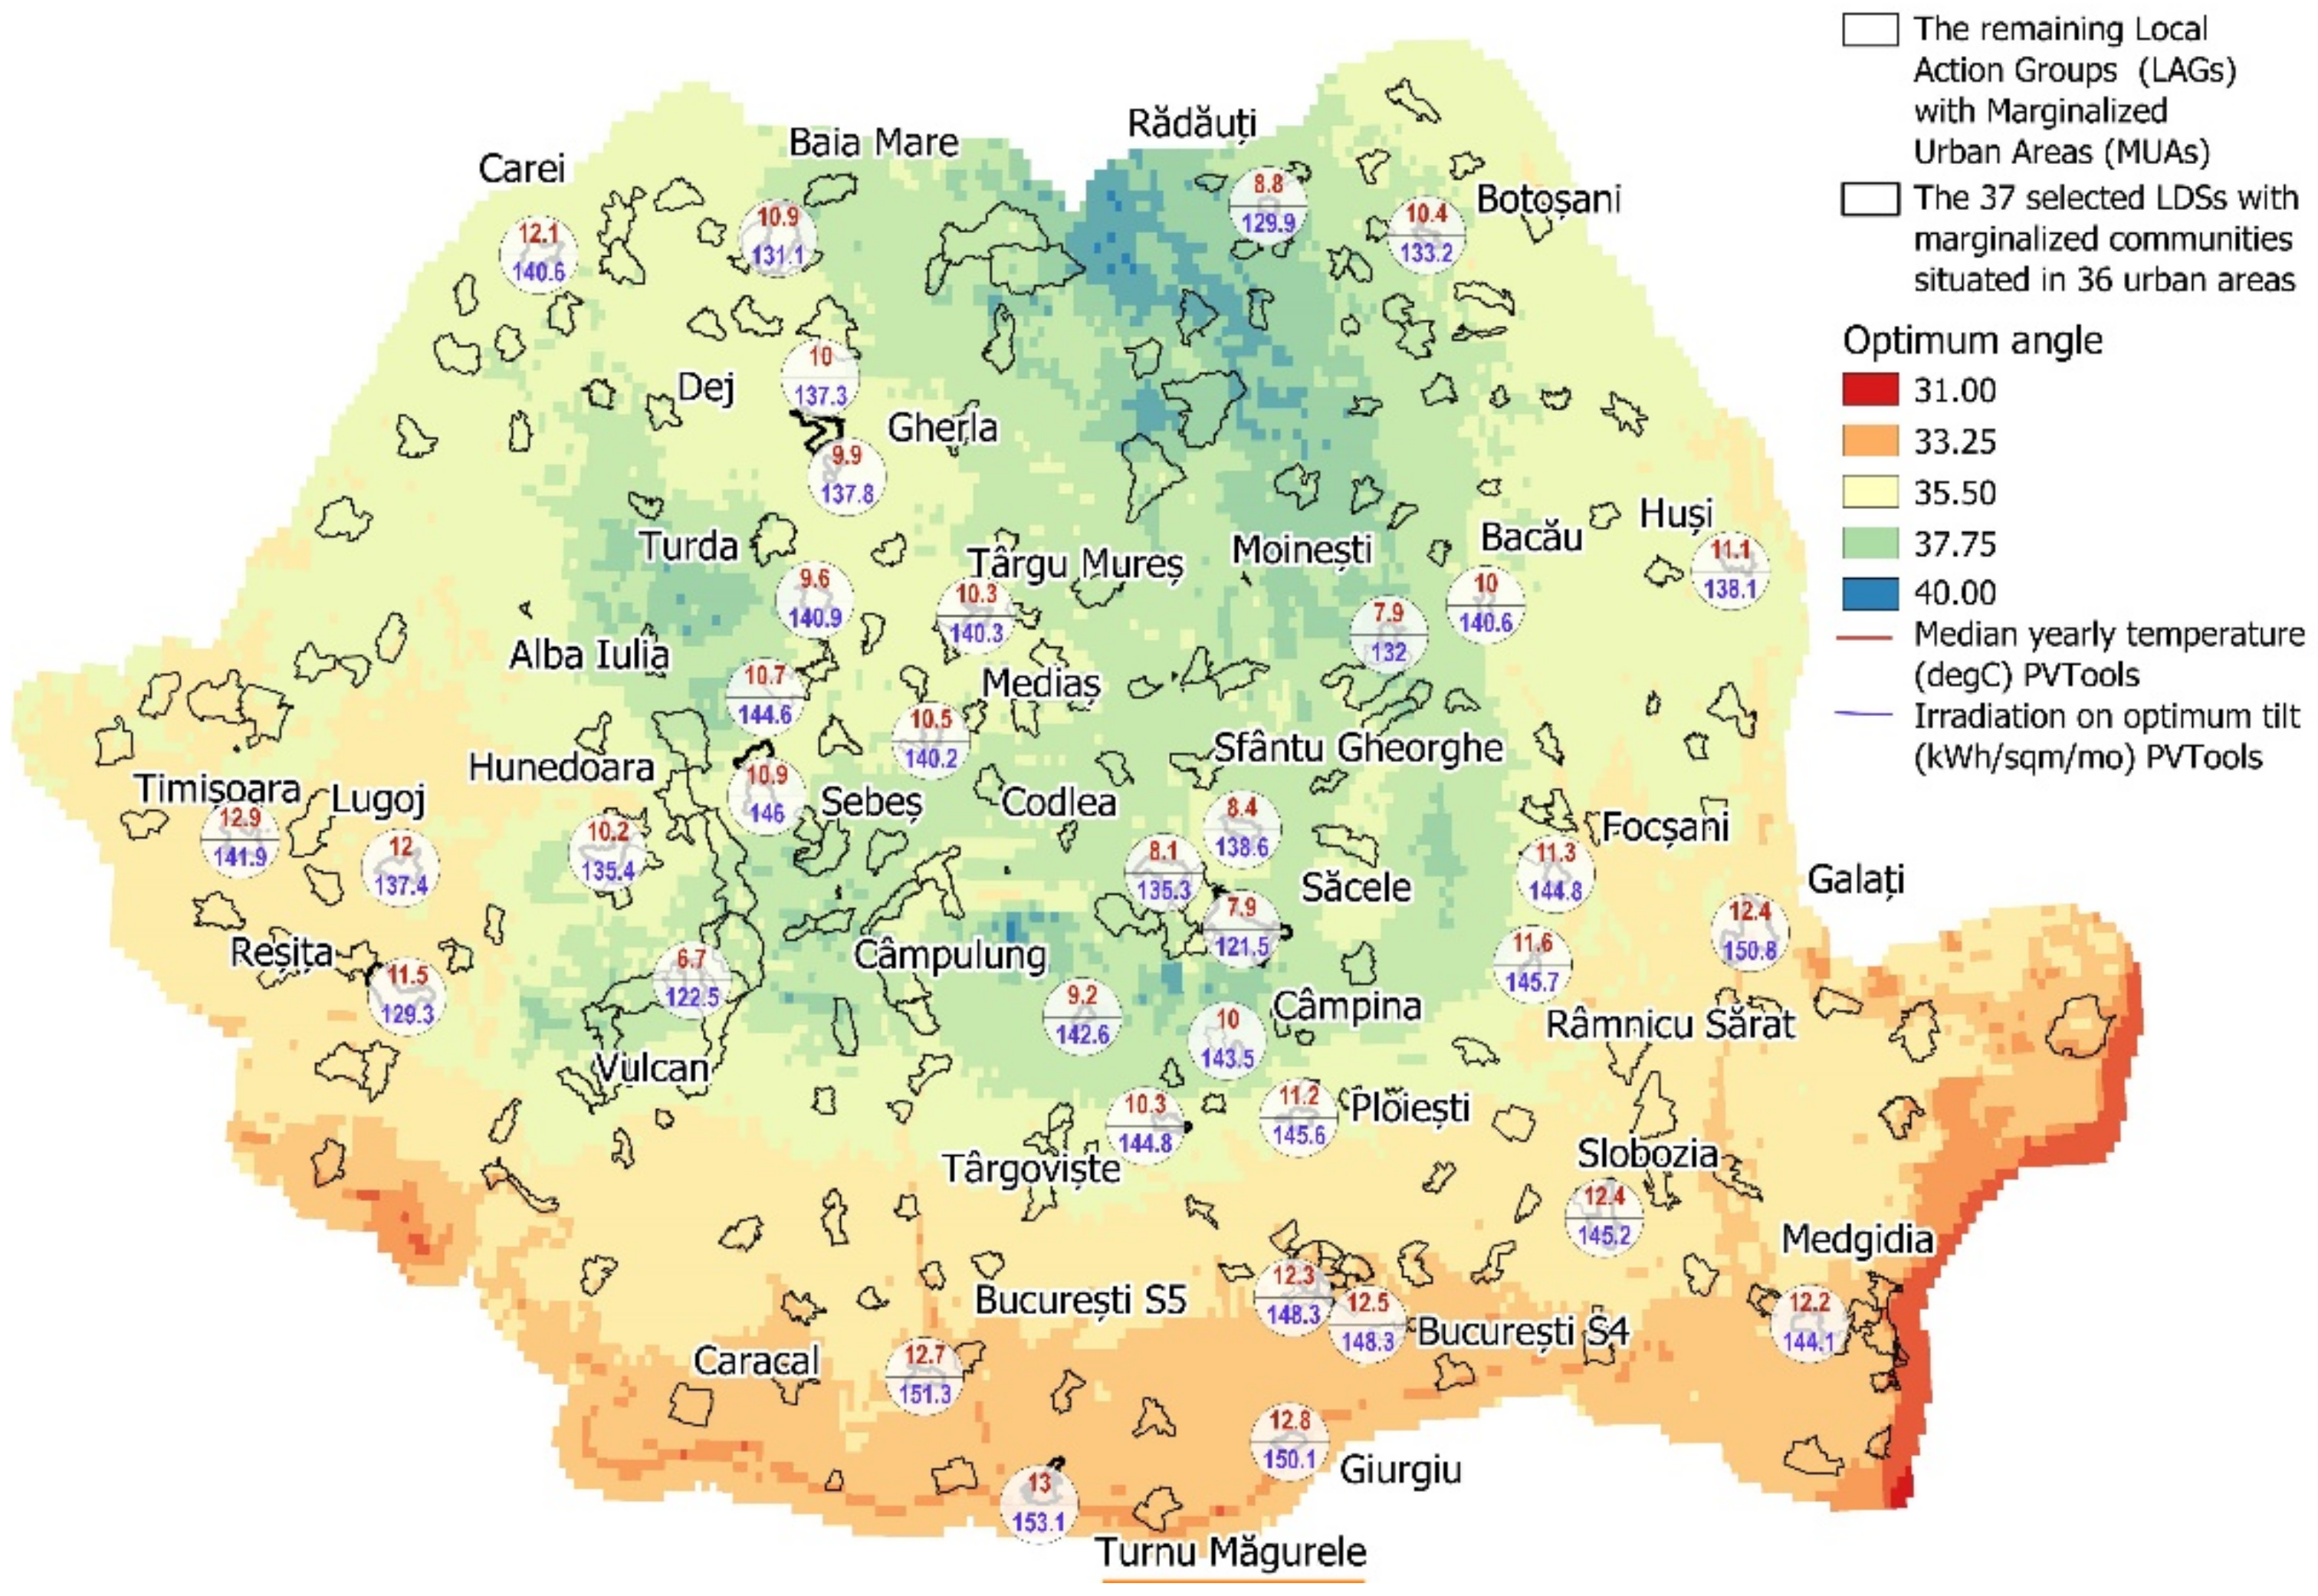
From the values resulting from the PVGIS model, we chose the annual median values of radiation at the optimal tilt of the PV modules and the annual median values of the 24-h average temperature for the 36 selected urban areas with MUA, as these are the key values for establishing more precise starting points for technical specifications for the correct installation and more efficient energy production of PV modules. These values were also overlaid on the map of the optimal angle for the energy output of the PV modules for a clearer picture of the key factors previously mentioned in the decision to place and install a particular PV technology (
Figure 18).
For a better follow-up of the problems determined in the MUAs and the possibility of using the solar energy, we centralized the analyzed data in
Table 1,
Table 2,
Table 3 and
Table 4, demonstrating the solar potential and responding to research question no 2. We grouped data according to the median irradiation on an optimally inclined plane into four categories, suitable, good, very good and excellent, demonstrating the potential of using solar energy. For MUAs that do not have adequate heating systems and electric power supply, the PVT panels of recently developed hybrid systems—both photovoltaic and thermal, allowing double production—of electric and thermal energies can be considered.
Global irradiation impinging on a tilted plane of PV modules (Global Tilted Irradiation, GTI) is calculated from Global Horizontal Irradiance (GHI), Direct Normal Irradiance (DNI), terrain albedo and instantaneous sun position and considers the energy losses occurring at each step of energy conversion [
42].
Relating to the losses due to terrain shading, in the Solar Atlas database, only the Shuttle Radar Topography Mission (SRTM) digital elevation model was considered and, subsequently, so was the computed horizon. The spatial resolution of the SRTM is about 30 m or 90 m for global coverage [
45]; thus, local shading from buildings, vegetation, poles, fences, etc., was not considered. For open space systems installed in flat areas, the uncertainty was lower than 0.1% and increased with terrain complexity as in the case of urban areas. In more localized, urban cases, more accurate computations should be performed to account for the shade casted by structures on the surface of the PV modules. Shadows can vary depending on the season when the sun azimuth and elevation reaches a specific direction, and the most undesirable obstructions of the modules are the ones that cast shadows during the entire year and the ones that cast shadows during midday when the sun’s elevation is at its peak, and the same applies to energy consumption. The small roof PV systems are the most sensitive as the “shading losses can easily reach up to 50%” [
42].
In relation to angular reflectivity, there are losses depending on the incidence angle between the direction of the sun’s radiation and the plane of the PV module at one moment [
46]. This angle depends on two factors: first—the geographical position of the PV system; second—the PV module’s tilt and orientation [
42]. Angular losses also depend on the module’s surface type and dirtiness, which should be analyzed in more detail for the specific module installed at the site. In Europe, the geographical variation of temperature and irradiation can cause a decrease in yearly PV performance between 3 and 13% from the performance under Standard Test Conditions [
47]. The energy produced depends also on the mounting of the modules; as an example, the crystalline silicon modules have higher losses when the modules are mounted on a tracker than when mounted at a fixed position [
42].
There are many other losses that count for the mounting system and electrical connections and parameters, which together with the energetical losses already mentioned could lead, according to the summary of Solargis simulation steps for Global Solar Atlas 2.0, to possible cumulative loss ranges varying from 7.1% to 90.5% with the mention of possible cases that these limits may be overmentioned. [
42]. Long-term performance losses should also be considered, as the performance degradation rate of PV modules is higher in the first year and can come close to 0.8%; in time, it stabilizes at a lower level, such as 0.5% or less in the next years [
42].
The location of PV panels has to be studied on a case-by-case basis as part of the feasibility studies required to implement the investment, depending on the type of existing dwellings (structurally stable or less stable, which may or may not support PV on the roof) and the existence of the land required for their location.
4. Conclusions
The population in the MUAs corresponding to the LDSs analyzed does not benefit from an adequate energy infrastructure. None of the 37 LDSs analyzed for the LAGs located in 36 urban areas contain energy-related targets, measures or projects that could lead to increasing the population’s access to the electricity or gas grid and ensuring adequate home heating.
These facts indicate a gap between the priorities of local communities to increase social participation in planning and implementing local actions, with a low level of interest in renewable energy and the pan-European targets set by EU policy makers responsible for development programs who have recommended that national, regional and local actions in Member States should be aligned with the targets set in the EU 2020 Strategy.
To facilitate the achievement of these targets, we proposed the use of solar energy as a valid solution for the energy problems of marginalized urban areas in Romania. Based on the Global Solar Atlas irradiance values at the optimal tilt of PV modules (GTI), we have produced the first GIS map in Romania of urban areas with marginalized communities that can use solar resources to botain the maximum amount of solar radiation that can be harvested. This map demonstrates that solar energy is adequate for the energy problems of Romanian MUAs.
The limitations of the research mainly relate to the data from LDSs approved in 2017–2018, as the situation has evolved in the meantime; thus, direct discussions with the LAGs are needed. In addition, the data from the analyzed strategies are not always sufficient or consistent; therefore, not all values for the indicators in the analyzed MUAs were identified and obtained. The LDSs analyzed have at least one MUA, and for those with more than one, the indicator value was calculated by averaging the values for each LDS according to the available data.
This paper is the first contribution to the existing literature on energy in marginalized urban communities in Romania, demonstrating that urgent attention is needed to address the complex issue of energy access for these areas and developing the first interactive solar radiation map in Romania. With the recently launched EU Solar Strategy [
48] and REPowerEU Communication [
49], the contributions of marginalized communities are becoming more important. The results of this paper are significant from a practical perspective and can be used by communities and local authorities in the development of future LDSs, as well as by relevant authorities responsible for the use of EU funds.
Future directions that should be pursued are as follows: (1) to implement awareness-raising and education programs in local communities on the solar energy solution (which is more suitable for marginalized urban areas with more than 20,000 inhabitants), the connection with low-carbon economy and climate change mitigation; (2) developing a roadmap for MAs, LAGs and local authorities to support solar project preparation for future operational programs.
Further research regarding the study of other forms of renewable energy for marginalized communities (e.g., wind energy and biomass) in rural areas and the steps toward the creation of energy communities in Romania need to be documented in a future paper.
