Hypothesis

Extending the Unified Theory of Acceptance and Use of Technology for COVID-19 Contact Tracing Application by Malaysian Users

by
Mahmood Alshami
1,
Rawad Abdulghafor
1,* and
Abdulaziz Aborujilah
2,*
1
Computational Intelligence Group Research, Computer Science Department, Faculty of Information and Communication Technology, International Islamic University Malaysia, Kuala Lumpur 53100, Malaysia
2
Cybersecurity & Technological Convergence, Malaysian Institute of Information Technology (MIIT), University Kuala Lumpur (UniKL), Kuala Lumpur 50250, Malaysia
*
Authors to whom correspondence should be addressed.
Sustainability 2022, 14(11), 6811; https://doi.org/10.3390/su14116811
Submission received: 27 January 2022 / Revised: 28 February 2022 / Accepted: 17 March 2022 / Published: 2 June 2022

Abstract

:
The Malaysian government has mobilized its strength to confront the current COVID-19 pandemic and has sought to develop and implement a digital contact tracking application, making it an integral part of the exit strategy from the lockdown. These applications record which users have been near one another. When a user is confirmed with COVID-19, app users who have recently been near this person are notified. The effectiveness of these applications is determined by the users’ willingness to install and use them. Therefore, this research aims at identifying the factors that would stimulate or slow down the adoption of a contact-tracing app. It proposes solutions to mitigate the impact of the factors affecting the user’s acceptance of COVID-19 Digital Contact Tracing Apps. A quantitative approach was followed in this research, where an electronic survey was spread in Malaysia, for the objective of data collection, considering the previous discussion of the results. Then, using PLS-SEM, the collected data were analyzed statistically. The findings of this study indicate that the unified theory of acceptance and use of technology (UTAUT) factors (Performance Expectancy, Effort Expectancy, Social Influence, Facilities Condition) were significant predictors of MySejahtera application adoption among citizens in Malaysia. On the other hand, the factors of app-related privacy concern were found to be insignificant for MySejahtera application adoption.

1. Introduction

On 25 January 2020, Malaysia recorded its first three cases of coronavirus disease (COVID-19) [1]. Cases have increased unexpectedly since the first detection of this epidemic. Government and health authorities have tried to mobilize all health and safety measures to alleviate the spread of the epidemic, including hand washing, wearing masks, social distancing, and lockdown [2]. Traditional measures in the field of public health may not be enough to avoid the spread of the virus in a population, in the long term, which requires more effective preventive measures [3].
As preparedness strategies were no longer adequate to control the disease, it has spread to several Malaysian states, and the government deliberately put in place a range of preventive initiatives to minimize the severity of the infection in the states [4]. While researchers have found no effective treatment, an agile response is needed to tackle the virus. The lack of a rapid response disaster management strategy to a tragedy, such as an outbreak, can become a prime reason for failure to mitigate the impact of a disaster on society. Further, governments and health authorities have attempted to mobilize emerging technology to counter this new challenge [5], including the use of tracker wristbands, mobile apps, thermal cameras, facial recognition, and drones [6].
Digital contact tracing apps were introduced as tools to help minimize the spread of the infection. Contact tracing is a time-tested technique that has been implemented extensively to tackle outbreaks of infectious diseases, such as measles, HIV, syphilis, and Ebola [7]. It includes finding infected people and warning them that they are at risk, through a careful method of retracing where and with whom an infected person is in the vicinity of [8].
In the case of the COVID-19 epidemic, digital contact tracing provides many advantages over conventional contact tracing [9]. First of all, it aims to automate a labor-intensive practice, in a circumstance where human communication tracers are scarce [10]. In addition, it can give more precision, where human memories are forgettable and fallible [11], particularly in the case of COVID-19, where the disease may be symptomless for up to two weeks [12]. Finally, the speed of infection of the COVID-19 virus requires quick contact tracing to be functional [13]. Digital contact tracing, by offering speed, scale, and precision, seeks to overcome these weaknesses.
There is a positive association between perceived vulnerabilities and privacy concerns, associated with the usage of DCT apps, because people are generally aware of the risks associated with the sharing of personal information [14].
Various studies have been undertaken regarding user data privacy, in relation to the adoption of DCT apps. If people are fully unaware of their privacy, the exposure of personal information can lead to major privacy issues in the electronic communication environment in the future [15].
This is supported by numerous research findings, demonstrating the favorable influence of privacy knowledge on privacy concerns about the use of health informatics as a service [14].
Alternatively, [5] discovered that a lack of understanding among users about their privacy protection hinders the adoption of appropriate DCT apps, which necessitates user education. As a result, this demonstrates that privacy concerns are somewhat related to user awareness in the adoption of such a system. This demonstrates that the privacy issue is typically related with the user’s awareness in the adoption of such a technology [4].
In Malaysia, and many other affected countries, many challenges face policymakers, regarding the extent to which the population agrees to adopt and share personal information on tracking apps that exacerbate the situation [16]. Citizens have a set of apprehensions about adopting such applications, especially in the shadow of the COVID-19 pandemic [17], as the sharing of personal information of patients and their families by the authorities or third parties increases the risks of stigmatization, discrimination, and blame form the public [18]. There is an augmented risk that the public can begin to openly blame patients with COVID-19 for initiating infection clusters. In fact, in some cases, these infected people had to react publicly to these accusations to defend themselves [19]. Accordingly, these challenges were not limited to the concerns of disseminating personal information only, but also developing these applications locally, in record time, and making them suitable for users is part of these obstacles.
The chief industry regulator at the Malaysian Communications and Multimedia Commission (MCMC) confirmed that the improvement of the app in Malaysia was still lagging behind, due to a lack of understanding of the public sector requirements [20]. This is likely to result in a lower acceptance rate for locally improved applications in Malaysia [21]. Investigate digital contact tracing apps’ usage intention currently remains limited [22]. Therefore, it is important to analyze the variables that would stimulate or slow down the adoption of a contact-tracing app and reduce the concerns of users of these applications, to incorporate it effectively into lockdown exit strategies, considering the current problems.
This research intends to extend the UTAUT model to understand users’ acceptance of COVID-19 Digital Contact Tracing Apps in Malaysia. This study aims to answer the following questions:
  • What are the factors that could influence the Adoption of MySejahtera?
  • Does age moderate the relationships between Performance Expectancy, Effort Expectancy, Social Influence, Facilities Condition, App-Related Privacy Concerns, and Adoption of the MySejahtera application?
  • How can an empirical evaluation of the proposed model be conducted, based on the Unified Theory of Acceptance and Use of Technology model?
This study is structured into the following sections. Firstly, the literature review and theoretical background are presented. Secondly, the conceptual framework and hypotheses development are laid out. Then, the research methodology, data analysis and results are presented. Finally, the discussion and conclusion are provided.

2. Literature Review and Theoretical Background

Contact tracing apps provide many services, including the ability for researchers to collect data needed to conduct detailed studies on the epidemic [23]. Moreover, researchers share epidemiological data for future preparation for the modeling study [24].

2.1. Importance of Contact Tracing for COVID-19

Since the outbreak of the COVID-19 epidemic, at the end of 2019, the whole world has been striving to take all measures to mitigate harm to societies [25]. Governments are looking for ways to identify the techniques for contact tracing to easily recognize and separate infected individuals [26]. Manual contact tracing is relatively slow, and this affects the speed of response, and not only that, but it requires resources to find people infected with the virus [27], access their data, and check whether this data is accurate or not [28], then request the contacts of those infected individuals [6], then contacts of them and contacts to track the flow of the epidemic [29]. Governments soon tended to take advantage of the development of technology in smartphones to avoid the disadvantages of manual contact tracing [9]. They sought to develop digital contact tracing applications and introduce them as an essential measure to confront the spread of the disease and exit the lockdown [30].
Digital contact tracing applications contribute to limiting the spread of the virus in the early stage, by notifying the infected of isolation and taking all measures to prevent the spread of infection [31]. Further, the importance of these applications lies in tracking contacts of patients who have symptoms and providing advice to these persons, regarding self-isolation [32], making the examination [33], and helping them to overcome the quarantine period, by supporting them with appropriate advice and information [34].
Digital contact tracking applications are characterized by speed and accuracy [35], as they have helped improve the speed of response [36]. This made it the most appropriate procedure for many countries to confront the spread of the disease [37]. However, many governments faced several challenges when placing the apps in the public domain [38]. The success of these apps depends on how accepting people are of using them [39]. Privacy concerns were not the only obstacle that limit the use of this application, because other phone apps are more dangerous to privacy, yet we see a great demand for their use [18]. In such circumstances, the privacy concerns of individuals are reduced, and they are more open to providing personal data [22]. Although these concerns are low, they are considered part of the challenges in addition to other challenges that would slow down the population’s acceptance of using the application [32,40].

2.2. Public Interest Impact in Accepting Contact Tracing Apps

Since the start of the COVID-19 pandemic, Malaysia has suffered like the rest of the world from the epidemic [41]. The Malaysian government tried to respond to the epidemic in various ways [24]. It mobilized its maximum capacity to absorb this epidemic [28]. Nevertheless, it was necessary to spread awareness among the community and define what “public interest” meant, to reduce this risk [42]. This term can be defined as “general tranquility, rights and welfare of the public that is to be known, protected, and promoted” [43]. Events take the character of “public interest” when they affect people’s lives and affect the public or a group of community members [44], when a set of issues of public interest are brought up, or when the impact of these issues on specific groups in society becomes “such as marginalized groups” [45].
Given the spread of the pandemic among members of society and its impact on the general population, in all parts of the country, we can say that it can be considered a matter of public interest [6]. Governments have a very heavy burden to convince citizens to adopt digital contact tracing apps to mitigate the spread of the virus [16]. The disclosure of personal information for digital contact tracking applications and the disclosure of personal information for other smartphone applications must be separated, based on considering the public interest during this pandemic [46]. There are a set of principles that preserve the basic rights of individuals and ensure that the confidentiality and privacy of their information are maintained [47]. The benefits gained by the users of the application, revealing their personal information, must be greater than the potential harm that may expose the infected and their contacts to danger, so that governments can justify this action as ethical [48]. These benefits should be felt by the public and reflected in society at large to help them confront and overcome the COVID-19 virus [49]. These applications should aim to protect the safety of the public from the epidemic [50].

3. Conceptual Framework and Hypotheses Development

UTAUT has become a popular technology acceptance model for evaluating new technology adoption and use [51]. This is the model formulated by Venkatesh and others in “User acceptance of information technology: Toward a unified view” [52]. It consists of four constructs that are expected to have an impact on the desire to use a particular technology [53]. The basic structures of this theory are (1) Performance Expectancy, (2) Effort Expectancy, (3) Social Influence, and (4) facilitating conditions [54]. The first three are direct predictors of user intent and behavior, while the fourth is a predictor of user behavior [55]. The effect of the four key constructs on usage purpose and behavior is thought to be moderated by gender, age, experience, and voluntariness of use [21].

3.1. Performance Expectancy

Performance Expectancy is the degree to which a person feels that using the apps will assist him or her in improving job performance [56]. It also enables him to measure the extent to which these users aspire to the benefits that they expect to obtain from using this technology [44]. Performance Expectancy is the building block that determines the ultimate reliability and usability of modern information systems and applications [12]. The expectation of performance is noticeably known through indicators, such as perceived benefit, job suitability, internal and external motivation, comparative advantage, and expectations of outcomes from modern technology [57]. In brief, we expect that respondents who have positive odds and high expectations of the performance of COVID-19 applications, in contributing to the discovery of positive cases, as well as regarding the contribution of these applications to preventing the spread of the virus and responding to it, will be more inclined to install applications.
Hypothesis 1a (H1a).
Performance Expectancy had a significant and positive influence on MySejahtera adoption.
Hypothesis 1b (H1b).
Age moderates the relationship between Performance Expectancy and MySejahtera.

3.2. Effort Expectancy

Effort Expectancy is one of the components of the Unified Theory of Acceptance and Usage of Technology (UTAUT) paradigm, which has attracted the interest of numerous academics in a variety of fields [21]. Effort Expectancy is a measure of how easy COVID-19 applications will be for a person to use [55]. It implies that users expect the usage of COVID-19 apps to be free of mental and physical effort. [58]. The effort forecast is built on the principle that there are relationships between the effort put in at work, the results achieved as a result of that effort, and the benefits gained as a result of that effort [28]. We believe that if people expect the app to be easier to use, they will be more likely to do so, and the app’s downloadability will increase.
Hypothesis 2a (H2a).
Effort Expectancy had a significant and positive influence on MySejahtera adoption.
Hypothesis 2b (H2b).
Age moderates the relationship between Effort Expectancy and MySejahtera adoption.

3.3. Facilitating Conditions

Facilitating conditions are characterized as an individual’s belief in the existence of organizational and technological infrastructure to support the app’s use [48]. Additionally, this involves respondents’ perceptions of the availability of private resources and support, when utilizing the COVID-19 application [18]. Facilitating conditions are factors in an environment that allow the use of COVID-19 applications in smartphones by individuals [59]. Facilitating conditions are clearly defined by indicators, such as perceived behavioral control and compatibility [53]. The efficient implementation of COVID-19 apps, to help stop the spread of the pandemic, is dependent on the availability of organizational resources (both human and material) and the necessary technical infrastructure [33]. This means that the degree to which individuals believe that the organizational resources and technical infrastructure are in place to support the effective use of COVID-19 applications, to reduce the spread of the epidemic, can determine whether or not they will actually use COVID-19 apps to combat the epidemic via mobile phone.
Hypothesis 3a (H3a).
Facilitating Conditions had a significant and positive influence on MySejahtera adoption.
Hypothesis 3b (H3b).
Age moderates the relationship between Facilitating Conditions and MySejahtera adoption.

3.4. Social Influence

Social Influence refers to the degree to which people believe that important individuals expect that they should be using modern technology [55]. It has been observed that Social Influence is one of the essential basics in the early stages of individuals’ experience with advanced technology [60]. While it does not play a fundamental role over time, it is ultimately unnecessary once the technology continues to be used [52]. This is because the person’s experience gives more to the individual’s continued use of technology [33]. Therefore, through our research of new apps, we expect that if individuals believe that other VIPs will use the app and support it or recommend its use, they will see it necessary and will intend to download and use the COVID-19 apps.
Hypothesis 4a (H4a).
Social Influence had a significant and positive influence on MySejahtera adoption.
Hypothesis 4b (H4b).
Age moderates the relationship between Social Influence and MySejahtera adoption.

3.5. Privacy Concerns

At the time of this research, there was little research available to date, regarding the adoption and acceptance of contact tracing applications by individuals, especially using existing technology adoption and acceptance theories [12]. However, studies suggest that privacy plays a major role in the acceptance of contact tracing apps [35]. This privacy issue appears to be particularly important in the context of government involvement, as privacy concerns grow as government involvement increases [14]. Most contact tracing apps are widely supported by the government, so individual privacy concerns must be taken into consideration and privacy should be investigated as a possible impact on intent to use COVID-19 apps [33].
As part of a large-scale, cross-country survey, researchers have reached some findings, showing that acceptance of contact tracing apps is determined by privacy and cyber security concerns, along with trust in the providers that provide these apps [60,61,62]. According to previous studies, it was determined that privacy concerns, related to health informatics, negatively affect the use of technology related to patients’ health [63]. S. Sharma and colleagues (2020) suggested credibility and transparency as a way to cover privacy concerns, while implementing UTAUT on the adoption of COVID-19 apps.
In the context of applying digital contact tracking apps for COVID-19, we expect privacy concerns to negatively affect the intent to accept the application, especially since some privacy organizations have indicated that there are some abuses by governments, and support providers for these applications and raised concerns about data protection issues, related to the implementation of digital contact tracking applications.
Hypothesis 5a (H5a).
App-Related Privacy Concerns did not influence MySejahtera adoption.
Hypothesis 5b (H5b).
Age did not moderate the relationship between App-Related Privacy Concerns and MySejahtera adoption.
Recently, UTAUT2 has added the main structure with new constructs (i.e., hedonic motivation, price value, and habit). However, this study sheds light on the original UTAUT model because we saw that the combinations added to the new model UTAUT2 are less applicable in the context of conducting experimental tests for the adoption of COVID-19 applications and their acceptance by the Malaysian community. Therefore, in this study, we have added the privacy concerns that are relevant to the specific context of the COVID-19 pandemic. Therefore, one of the functions of these UTAUT formulas could be knowing the acceptability of people to use COVID-19 apps, to limit the spread of the epidemic. To test this experimentally, and to know the results, the study was prepared to examine the effect of performance expectation, expected average effort, facilitation of conditions, social influence, and privacy concerns, on using the COVID-19 application to contribute to mitigating the spread of infection, and the extent of people’s acceptance of using these applications.

4. Research Methodology

4.1. Population

In this study, the population comprises all respondents who own a smartphone in Malaysia. This sample was initially selected as respondents to this study to measure the acceptance of these individuals for using the MySejahtera app.

4.2. Sample Size

Data were acquired utilizing a self-administered survey and a random sampling method in this study. The sampling strategy was chosen due to the study’s nature and the type of data and information it requires, as well as after reviewing the previous studies (which the researcher can see) that have to do with the subject of the study that used random sampling and proved its effectiveness in those studies [64,65], which suggest a minimum of at least five respondents for each estimated parameter (estimation of approximately 28 parameters, the study requires a minimum sample size of 140 respondents).

4.3. Variables Measurement

The survey assesses three concepts (five independent variables and one dependent variable). To ensure content validity, all of the variables that comprised the constructs were derived from previous studies. Table 1 shows the variables from prior research in each construct, as well as their adjusted forms for the current study. The table also includes the reliability of each construct. The UTAUT factors are independent variables including five dimensions (Performance Expectancy, effort performance, Social Influence, facilitating conditions, App-Related Privacy Concerns) and were measured by twenty (28) items adapted from [51,53,60]. The intention toward MySejahtera app adoption is a dependent variable, measured by eight (6) items adapted from [33,51,60]. Table 1 shows the sources and contents of questionnaire questions.

5. Data Analysis and Results

The survey was carried out between 18 May and 25 July 2021 (approximately 10 weeks). Because we cannot guarantee a 100% response rate, a total of 223 questionnaires were delivered to MySejahtera Application users. Out of the 223 surveys, 150 questionnaires were returned, representing a 67 percent response rate, and 8 cases were outliers; consequently, a total of 150 acceptable questionnaires were used, with a 67 percent response rate. The sample size of n = 150 was considered sufficient for this study. The study sample size (n = 150) met the 5:1 ratio specified by (Hair et al., 1998; Kline 2005). According to Hair et al. (1998), the minimal ratio of observations to parameters (n:q) should be 15 to 1, implying that 15 participants are required per indicator/variable. Other scholars believe that greater levels are preferable (Kline, 2005). Because the current study has six variables and 29 items, the sample size should be at least 145 (29 × 5) = 145 persons. Table 2 summarizes the data collection and response rate.

5.1. Demographic Characteristics of the Respondents

The participants in this study were Malaysians who used the MySejahtera application. Table 3 shows statistical information on the demographic features of the respondents, such as gender, age, education level, use of the MySejahtera application, and MySejahtera usage time, as a result of the frequency descriptive analysis.

5.2. Variance of Extracted Factors

The factor analysis for all variables indicated six factors with an eigenvalue greater than 1. They are (F1) Adoption of MySejahtera of six items (ADOP1, ADOP2, ADOP3, ADOP4, ADOP5, ADOP6), (F2) Social Influence, including four items (SI1, SI2, SI3, SI4), (F3) App-related privacy concern, consisting of five items (APP1, APP2, APP3, APP4), (F4) Facilities Condition, containing five items (FC1, FC2, FC3, FC4, FC5), (F5) Performance Expectancy, including four items (PE1, PE2, PE3, PE4), (F6) Effort Expectancy, including four items (EE1, EE2, EE3, EE4). In this study, based on the proposed research model and literature review, six factors were extracted. The cumulative variance explained was 0.80.5%. Table 4 show summaries of the explained variance of extracted factors.
To better segregate the items that corresponded with particular criteria, EFA was conducted, using SPSS software and varimax rotation. Varimax rotation benefited in the understanding of emerging factors, and the researcher discovered that it might be used to successfully minimize the number of variables on each component with high loadings. The researcher wanted to determine starting loading patterns before beginning the confirmatory factor analysis (CFA) approach. After EFA, 2 of the 29 items of the questionnaire, used to determine the relationship of this study, were eliminated, leaving 27 items in the questionnaire. The information in the constructions after EFA is summarized in the table below. The elements excluded from EFA are listed in Table 5.

5.3. Factor Loading Results

This study’s instrument is composed of six elements (exogenous and endogenous variables), each of which has multiple items. Table 6 displays a component with several strong loadings and all variables, loading significantly on their component for independent and dependent variable constructs. The item loadings were all more than the proposed cut-off value of 0.50, indicating convergent validity, and varied between (ADOP5 (0.575) and SI (0.862)). The factor loading for all items is shown in Table 6.

5.4. Assessment of Measurement Model/Outer Model

The measurement model investigated the relationships between the variables observed and the constructs. The components were assessed using items that represented the factors observed. The measurement model study yielded loading estimates, which supplied the scholar with an indicator of the measurement’s strength. During the measurement model assessment phase, the relationships between indicators and their respective constructs were investigated by analyzing construct validity, which included convergent validity and discriminant validity.

5.5. Examining Individual Item Reliability

By assessing the outer loading of each construct item, the measurement model was evaluated (Hair et al., 2014; Hair et al., 2012). Items were maintained as a rule of thumb, according to Hair et al. (2014), when they had to load more than 0.60. In the current investigation, two items were removed from the list of 29 due to poor loading. According to Hair et al. (2014), the only reason to remove the indication with outer loadings in the range of 0.40–0.70 off the scale is if CR or AVE exceed the proposed threshold value. Convergent Validity is confirmed in Smart-PLS when items load highly, according to Hair, Risher, Sarstedt, and Ringle (2018) (greater than 0.70 or 0.60 in exploratory research). Because the factor loading was less than 0.60 in this example, certain items were dropped from the measurement model. PE5 and EE5 are among these products, and Figure 1 show the measurement model/outer loading. Table 7 shows the items loading, Cronbach’s alpha, composite reliability (CR), and AVE.
The AVE values for each set of constructs are more than the squared correlations, indicating discriminant validity. Furthermore, the square root of the AVE was bigger than the absolute value of the correlation square of a given construct with any other factor (AVE > correlation square). The square root of the AVE, for all constructs with correlations bigger than the correlations between the construct and other constructs in the model, is shown in Table 8. Furthermore, the results suggest that the correlation between the independent variables was less than 0.85. (Hair et al., 2018). Multicollinearity was not a concern among the constructs, according to the findings (Sekaran, 2003). The square root of the extracted average variances was bigger than the correlation across latent components, as shown in Table 8, implying appropriate discriminant validity. The correlation matrix results show that the discriminant validity is confirmed, as shown in the table below.

5.5.1. Structural Model Significance Assessment

To assess the study hypotheses, the structural model uses the PLS technique to estimate the path coefficients, t-statistics, standard errors, and R2 The route coefficients indicated the strength and direction of the relationships, while the t-statistics and standard errors indicated the magnitude of the effect. The R2 value indicated the amount of variance explained. The suggested model’s explanatory power was determined by the variances that were linked with the dependent variables. To generate t-statistics and standard errors, this study used a bootstrap resampling method.

5.5.2. Coefficient of Determination: R2 Value

The R2 value shows the amount of variance in dependent variables that may be explained by independent variables. As a result, a larger R2 value improves the predictive potential of the structural model. It is crucial to ensure that the R2 values are high enough for the model to have some explanatory power [64]. Falk and Miller (1992) recommended that R2 values be equal to or greater than 0.10, for the explained variance of a given endogenous concept to be regarded as sufficient. Cohen (1988b) defines R2 as large when it is greater than 0.26, with acceptable power above 0.02, but Chin (1998) defines R2 as substantial when it is greater than 0.65, with acceptable power above 0.19. Hair and colleagues (2017), on the other hand, recommended that R2 be larger than 0.75 to be considered significant, with acceptable power greater than 0.25. Table 9 displays the R2 findings for the structural model, which show that all of the R2 values are high enough for the model to achieve an acceptable level of explanatory power. Table 8 and Figure 2 show that the model fits the data well in this study, as demonstrated by the squared multiple correlation (R2) values for the dependent variables: MySejahtera adoption (R2 = 0.547). As a result, the five latent variables (Performance Expectancy, Effort Expectancy, Social Influence, facility condition, and MySejahtera application) account for 54.7 percent of the variation in MySejahtera adoption (ADOP) among Malaysians who use the app.

5.5.3. Assessment of Effect Size (f²)

Using the effect size (f²) analysis, which is a supplement to R² analysis, it is desirable to dictate the impact sizes of particular latent variables’ influence on the dependent variables (Chin, 2010). The effect size (f²) can be calculated using Cohen’s (1988) formula, which is as follows: Effect   size   ( f ² ) = R included 2 R excluded 2 1 R included 2 . When the predictor exogenous latent variable is utilized in the structural model, the R² included is the R-square computed on the endogenous latent variable. When the predictor exogenous latent variable is not employed in the structural model, the R² omitted is the R-square computed on the endogenous latent variable. Cohen (1988) defines a minor impact size as 0.02, a medium effect size as 0.15, and big effect size as more than 0.35.
Facilities Condition showed a medium effect size of the predictive variable on MySejahtera adoption, with a 0.173 effect size (more than 0.15). Furthermore, with impact sizes of 0.043, 0.031, and 0.023, respectively, Performance Expectancy, Effort Expectancy, and Social Influence had the smallest effect sizes of the predicted variables for MySejahtera adoption (more than 0.02). App-Related Privacy Concerns, on the other hand, had a non-effect size of 0.003 on MySejahtera adoption. The effect sizes of the exogenous latent variables on the endogenous latent variable are presented in Table 10.

5.5.4. Relevance (Q2)

In this study, blindfolding was used to determine the predictive usefulness of the research model. The blindfolding approach is applied only to endogenous latent variables with a reflecting measurement model operationalization. A cross-validation redundancy metric (Q2) was used to assess the study model’s predictive value (Hair et al., 2013). The Q2 criteria are used to determine how effectively a model predicts data from a previously excluded case (Hair et al., 2014). A research model with predictive relevance has a Q2 statistic larger than zero. The cross-validation redundancy measure Q2, for one dependent latent variable adoption of MySejahtera, was above zero, at 0.503, as shown in the table below. The model was predictively relevant in this scenario (Henseler et al., 2009). The construct cross-validated redundancy is shown in Table 11.

5.5.5. Collinearity Test (Variance Inflation Factors-VIF)

Collinearity in multiple regression models has traditionally been known to be a predictor–predictor relation. In this traditional sense, two or more predictors are said to be collinear when they measure the same underlying concept or a component of that concept. This term is only used to describe vertical, or traditional, collinearity (Kock and Lynn, 2012). There are two types of VIF in Table 12: outer and inner VIF. The outer VIF shows the degree of collinearity between items inside a construct, whereas the inner VIF shows the degree of collinearity between constructs (latent variables) in the model (Hair et al., 2014).
O’Connell and Bowerman (1990) and Hair et al. (2013) state that if the VIF value is larger than 10 or 5, there is cause for concern.
The outer and inner VIFs indicate the severity of collinearity among constructs (latent variables) in the model. In this study, the maximum variance inflation factor (VIF) for items and constructs is 4.948 (SI3) and 2.661, respectively (FC). Overall, the VIF values for items and variables indicate that multicollinearity is not a concern in our study, contrary to what a more restrictive VIF criterion could imply.

5.5.6. Cross Loading of Observed Variables

The cross-loading of all observed variables was greater than the inter-correlations of the construct of all other observed variables in the model, as shown in Table 13. As a result, these findings validated the cross-loading assessment requirements and offered appropriate support for the measurement model’s discriminant validity. As a result, the suggested conceptual model was supposed to be acceptable, with confirmation of adequate reliability, convergent validity, and discriminant validity and the verification of the research model. The cross-loading for items is shown in Table 13.

5.5.7. The Standardized Root Mean Square Residual (SRMR)

The SRMR is an index of the average of standardized residuals between the observed and the hypothesized covariance matrices (Chen, 2007). The SRMR is a measure of estimated model fit. When SRMR ≤ 0.08, then the study model has a good fit (Hu and Bentler, 1998), with a lower SRMR being a better fit. Table 14 shows that this study model’s SRMR was 0.073, which revealed that this study model had a good fit, whereas the Chi-square for the saturated and estimated model was equal to 754.487.

5.5.8. Goodness of Fit (GoF) of the Model

Tenenhaus et al. proposed a single measure of goodness of fit (i.e., the GoF index) for PLS Structural Equation Modeling (2005). The geometric mean of the average communality and average R2 for the endogenous constructs can be defined as a global fit measure (GoF) for PLS path modeling. The fundamental purpose of the goodness-of-fit measure is to explain the variation found by both the measurement and structure models (Chin, 2010). The GoF can be calculated using the formula below.
Gof = ( R 2 ¯ × A V E ) ¯
In this study, the GoF value of the model was 0.599, which had been obtained as follows:
Gof = ( 0.547 × 0.657 ) = 0.359 = 0.599
When this study’s GoF value was compared to the threshold values from the study of Wetzels et al. (2009) (0.10 represents small, 0.25 represents medium, and 0.36 represents big), it was determined that the model’s GoF was significant (more than 0.36), meaning that the global PLS model validity was appropriate.

5.5.9. Importance–Performance Map Analysis (IPMA)

When the research focus is on the investigation of a given construct’s major sources of explanation (Ringle and Sarstedt, 2016), such as SME success, the PLS-SEM method is extremely useful. Managers and decision makers can use IPMA to prioritize their actions (Hair et al., 2013). For example, if the endogenous target variable is SME success, IPMA calculates the total impacts of the structural model (importance) with the average values of the latent variable scores (performance), to identify the key regions for e-banking adoption. The findings can reveal important determinants (those with a large overall influence), but they also reveal factors with poor performance (low average latent variable scores) (Ringle and Sarstedt, 2016).
Table 15 shows the IPMA results for one of the study’s key goal constructs, SME success. According to Table 15 and Figure 3, on the adoption of the MySejahtera variable, Facilities Condition has the highest importance (0.359) and Effort Expectancy has the highest performance (53.851). Table 15 and Figure 3 demonstrate that App-Related Privacy Concerns are the least important variable, at −0.036, and Performance Expectancy has the lowest performance on MySejahtera adoption with 48.871.

5.6. Hypotheses Testing Results

The t-statistics and p-value of Performance Expectancy in predicting MySejahtera adoption were (t = 2.218; p = 0.028), according to Table 16 and Figure 3. In other words, performance expectations have a beneficial impact on MySejahtera adoption. As a result, hypothesis (H1) was supported. Furthermore, the path coefficient was 0.178, indicating that there was a positive relationship. It means that for every one standard deviation increase in Performance Expectancy, MySejahtera adoption increases by 0.595 standard deviations.
Hypothesis 1 (H1).
Performance Expectancyhad a significant and positive influence on MyS−jahtera adoption.
Table 16 shows that Effort Expectancy had a statistically significant and favorable influence on MySejahtera adoption (t = 2.214; p = 0.0280 > 0.05). As a result, hypothesis (H2) was supported. Furthermore, the regression weight was 0.168, showing that there was a positive association. It means that for every standard deviation increase in Effort Expectancy, MySejahtera adoption increases by 0.168 standard deviations.
Hypothesis 2 (H2).
Effort Expectancyhad a significant and positive influence on MySejahtera adoption.
According to Table 16 and Figure 3, the t-statistics and p-value of Social Influence in predicting MySejahtera adoption were (t = 2.222; p = 0.027). In other words, Social Influence has a good impact on MySejahtera adoption. As a result, hypothesis (H3) was supported. Furthermore, the path coefficient was 0.126, indicating that there was a positive link. That is, when social impact increases by one standard deviation, MySejahtera adoption increases by 0.126 standard deviations.
Hypothesis 3 (H3).
Social Influencehad a significant and positive influence on MySejahtera adoption.
Hypothesis 4 (H4).
Facilities Conditionshad a significant and positive influence on MySejahtera adoption.
According to Table 16 and Figure 3, the t-statistics and p-value of Facilities Condition in predicting MySejahtera adoption were (t = 5.741; p = 0.000). In other words, the condition of the facilities has a beneficial influence on MySejahtera adoption. As a result, hypothesis (H3) was supported. Furthermore, the path coefficient was 0.457, indicating that there was a positive link. It means that for every one standard deviation increase in Facilities Condition, MySejahtera adoption increases by 0.457 standard deviations.
Hypothesis 5 (H5).
App-related privacy concerns did not influence on MySejahtera adoption.
According to Table 16 and Figure 3, the t- and p-value of App-Related Privacy Concerns in predicting MySejahtera adoption were (0.788) and (0.432 > 0.05), respectively. This means that App-related privacy concerns had little impact on MySejahtera uptake. As a result, H5 was not supported.

Hypotheses Moderating Effect

The results of sub-hypotheses testing for moderating influence (age) between PE, EE, SI, FC, APP, and ADOP are shown in Table 16 and Figure 3. The results suggest that AGE*PE MySejahtera adoption was a significant interaction outcome, with a path coefficient and t-value of (β = 0.141; t = 1.771 > 1.64; p < 0.05). In this instance, the age-dependent positive association between Performance Expectancy and MySejahtera adoption will be stronger. As a result, hypothesis (H6) was supported.
Hypothesis 6 (H6).
Age moderates the relationship betweenPerformance Expectancyand MySejahtera adoption.
Hypothesis 7 (H7).
Agemoderates the relationship between Effort Expectancy and MySejahtera adoption.
The results of hypothesis testing for the moderating effect of Effort Expectancy between AGE*EE and ADOP are shown in Table 17 and Figure 4. According to the findings, age moderates the association between Effort Expectancy and MySejahtera adoption. Because the path coefficient and t-value were (β = 0.146; t = 1.776; p < 0.05), the positive association between Effort Expectancy and MySejahtera adoption will be stronger as one gets older.
Hypothesis 8 (H8).
Age moderates the relationship betweenSocial Influenceand MySejahtera adoption.
The results of sub-hypotheses testing for a moderating impact (age) between Social Influence and MySejahtera adoption are shown in Table 17 and Figure 4. The results suggest that AGE*SI Sustainability 14 06811 i001 MySejahtera adoption was a significant interaction result, with a path coefficient and t-value of (β = −0.142; t = 2.008 > 1.64; p < 0.05). In this situation, the age effect on the negative association between social impact and MySejahtera adoption will be smaller. As a result, hypothesis (H8) was supported.
Hypothesis 9 (H9).
Age moderates the relationship betweenFacilities Conditionand MySejahtera adoption.
The results of sub-hypotheses testing for a moderating influence (age) between FC and ADOP are shown in Table 17 and Figure 4. The results suggest that (AGE*FC Sustainability 14 06811 i002 MySejahtera adoption) was a significant interaction result, with a path coefficient and t-value of (β = −0.202; t = 2.023 > 1.64; p < 0.05). In this situation, the negative association between Facilities Condition and MySejahtera adoption will be less pronounced as one gets older. As a result, hypothesis (H9) was supported.
Hypothesis 10 (H10).
Age did not moderate the relationship betweenApp-Related Privacy Concerns andMycobacteria adoption.
The results showed that there was no significant interaction between (AGE*APP MySejahtera adoption). (β = −0.006; t = 0.082; p < 0.05) are the path coefficient and t-value. Age did not attenuate the association between App-Related Privacy Concerns and MySejahtera adoption in this situation. As a result, hypothesis (H10) was not supported. The results of sub-hypotheses testing for the moderating influence of (age) between PE, EE, SI, FC, APP, and ADOP are shown in Table 17 and Figure 4, Figure 5 presents Moderating Effect between Hypotheses Bootstrapping.

6. Summary of the Findings

Having presented all the findings, including the main and moderating hypotheses in the previous section, Table 18 shows a summary of the results related to all hypotheses tested.

7. Discussion

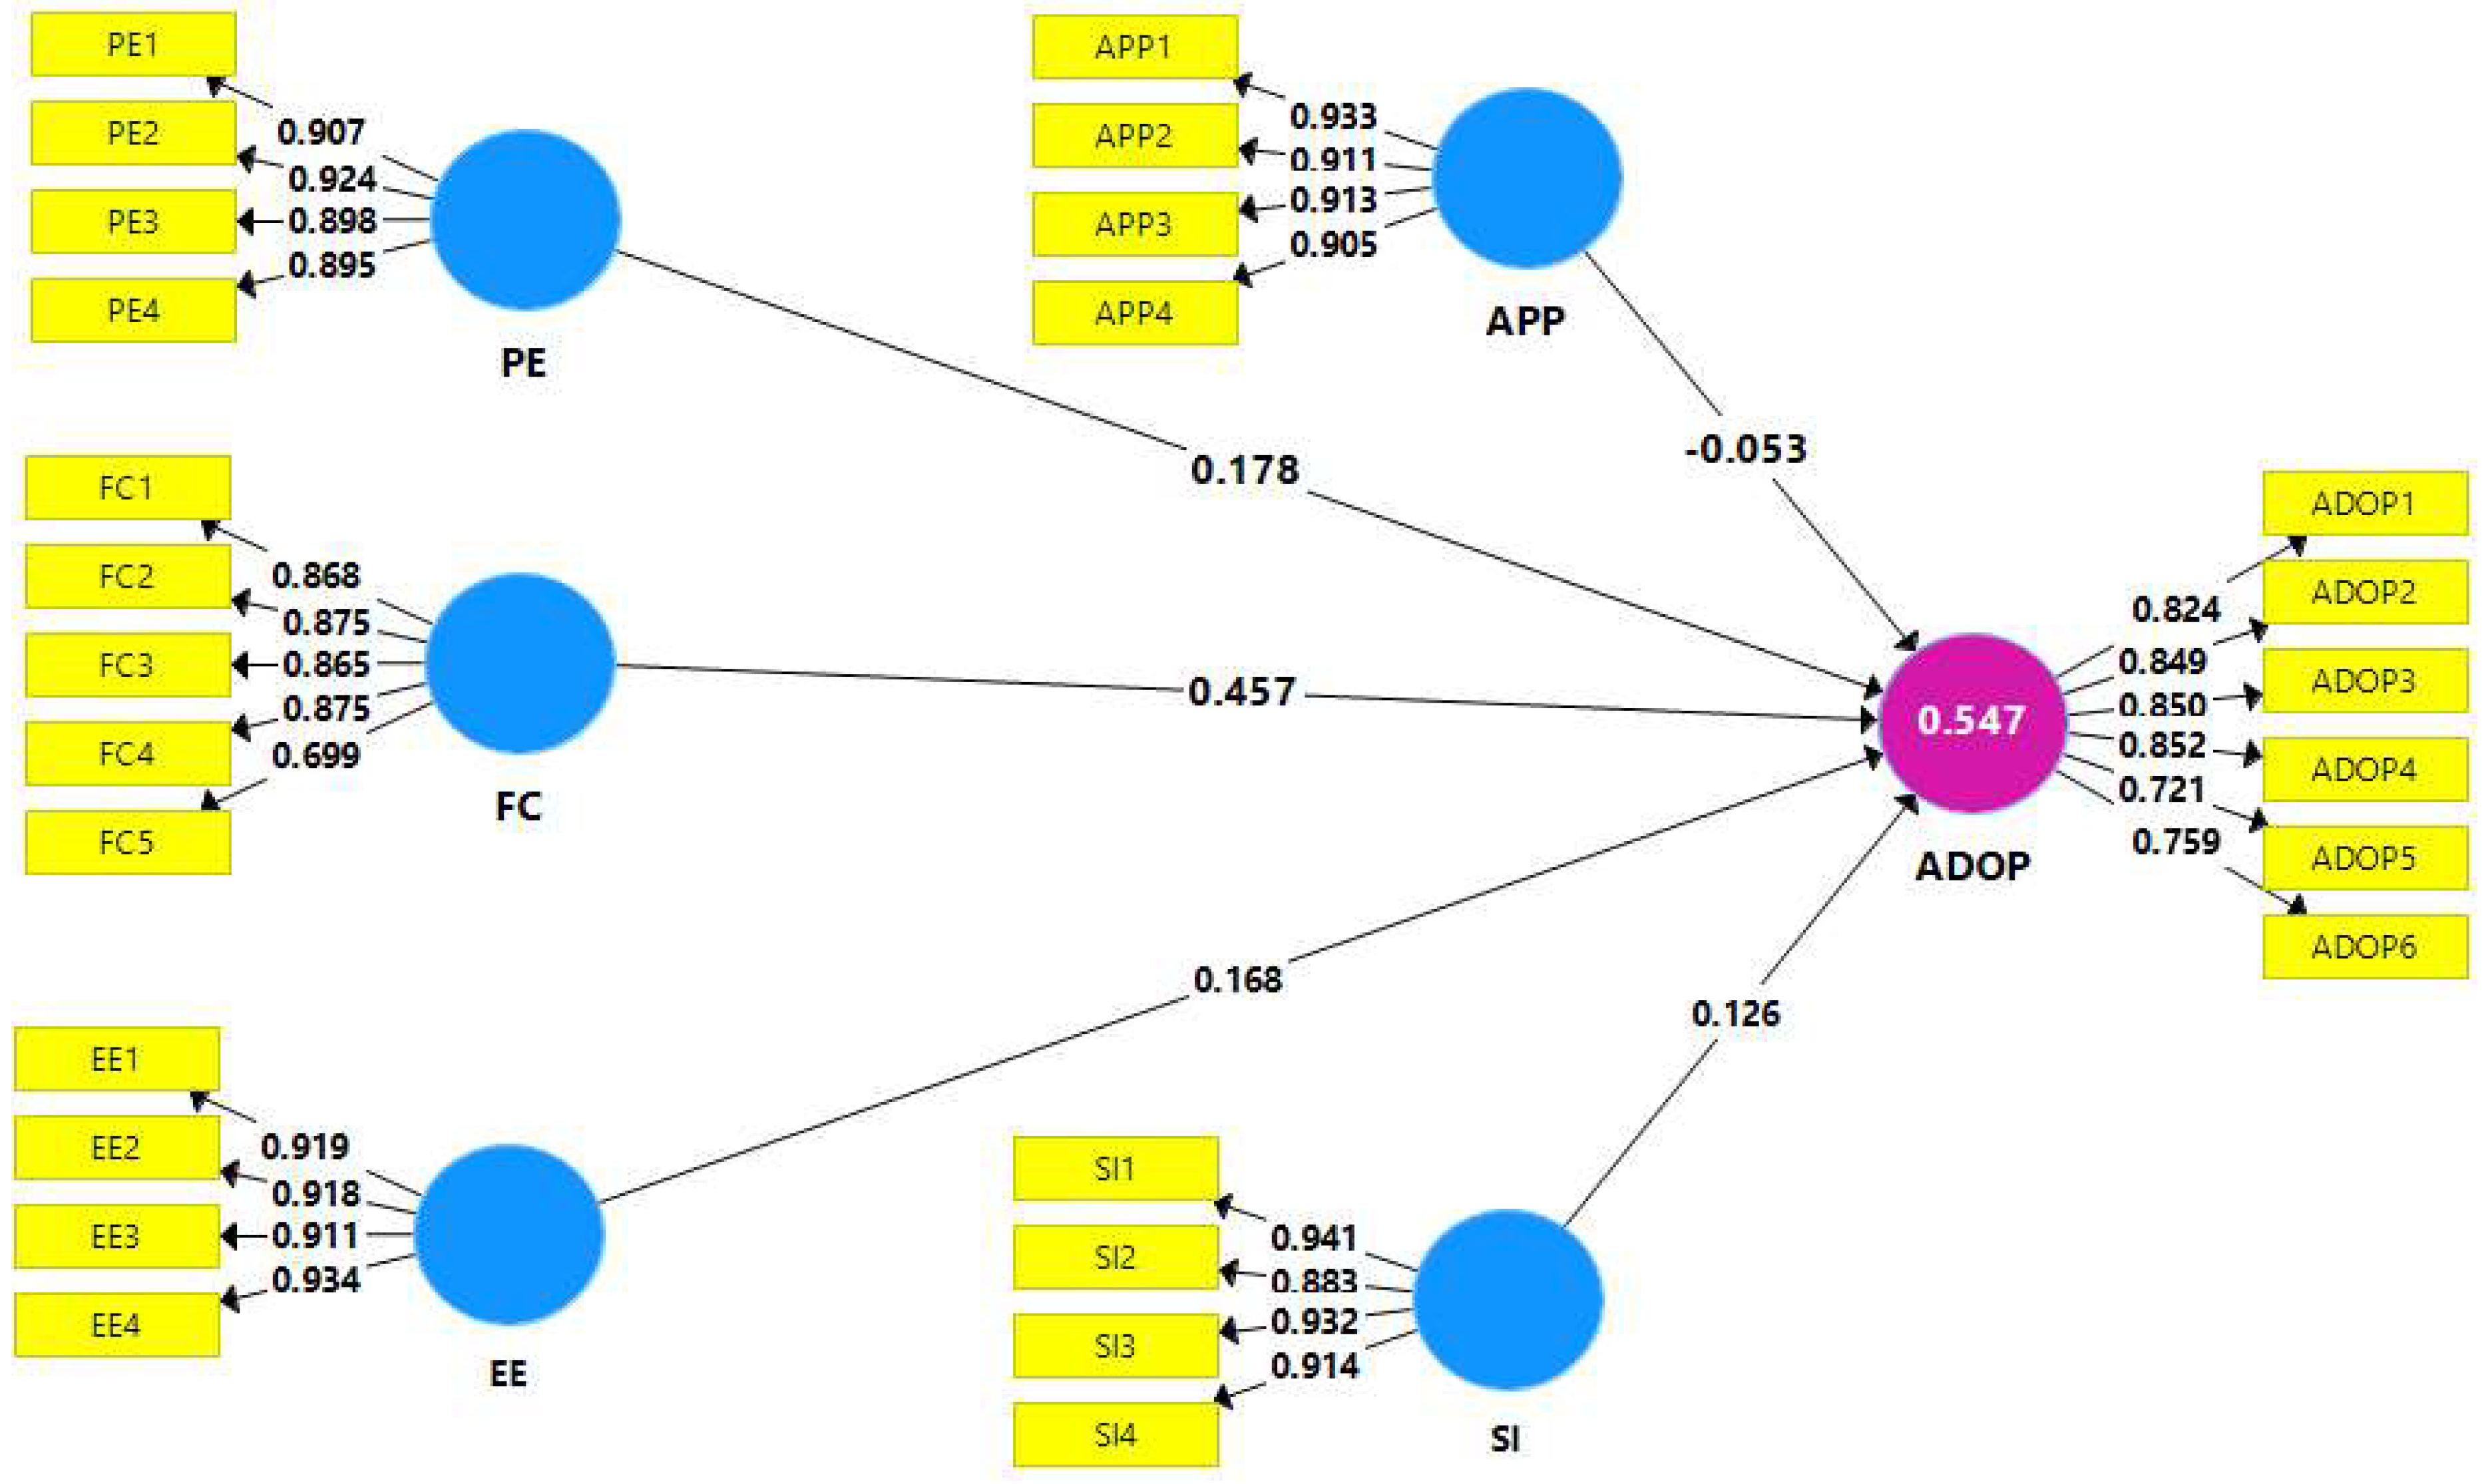
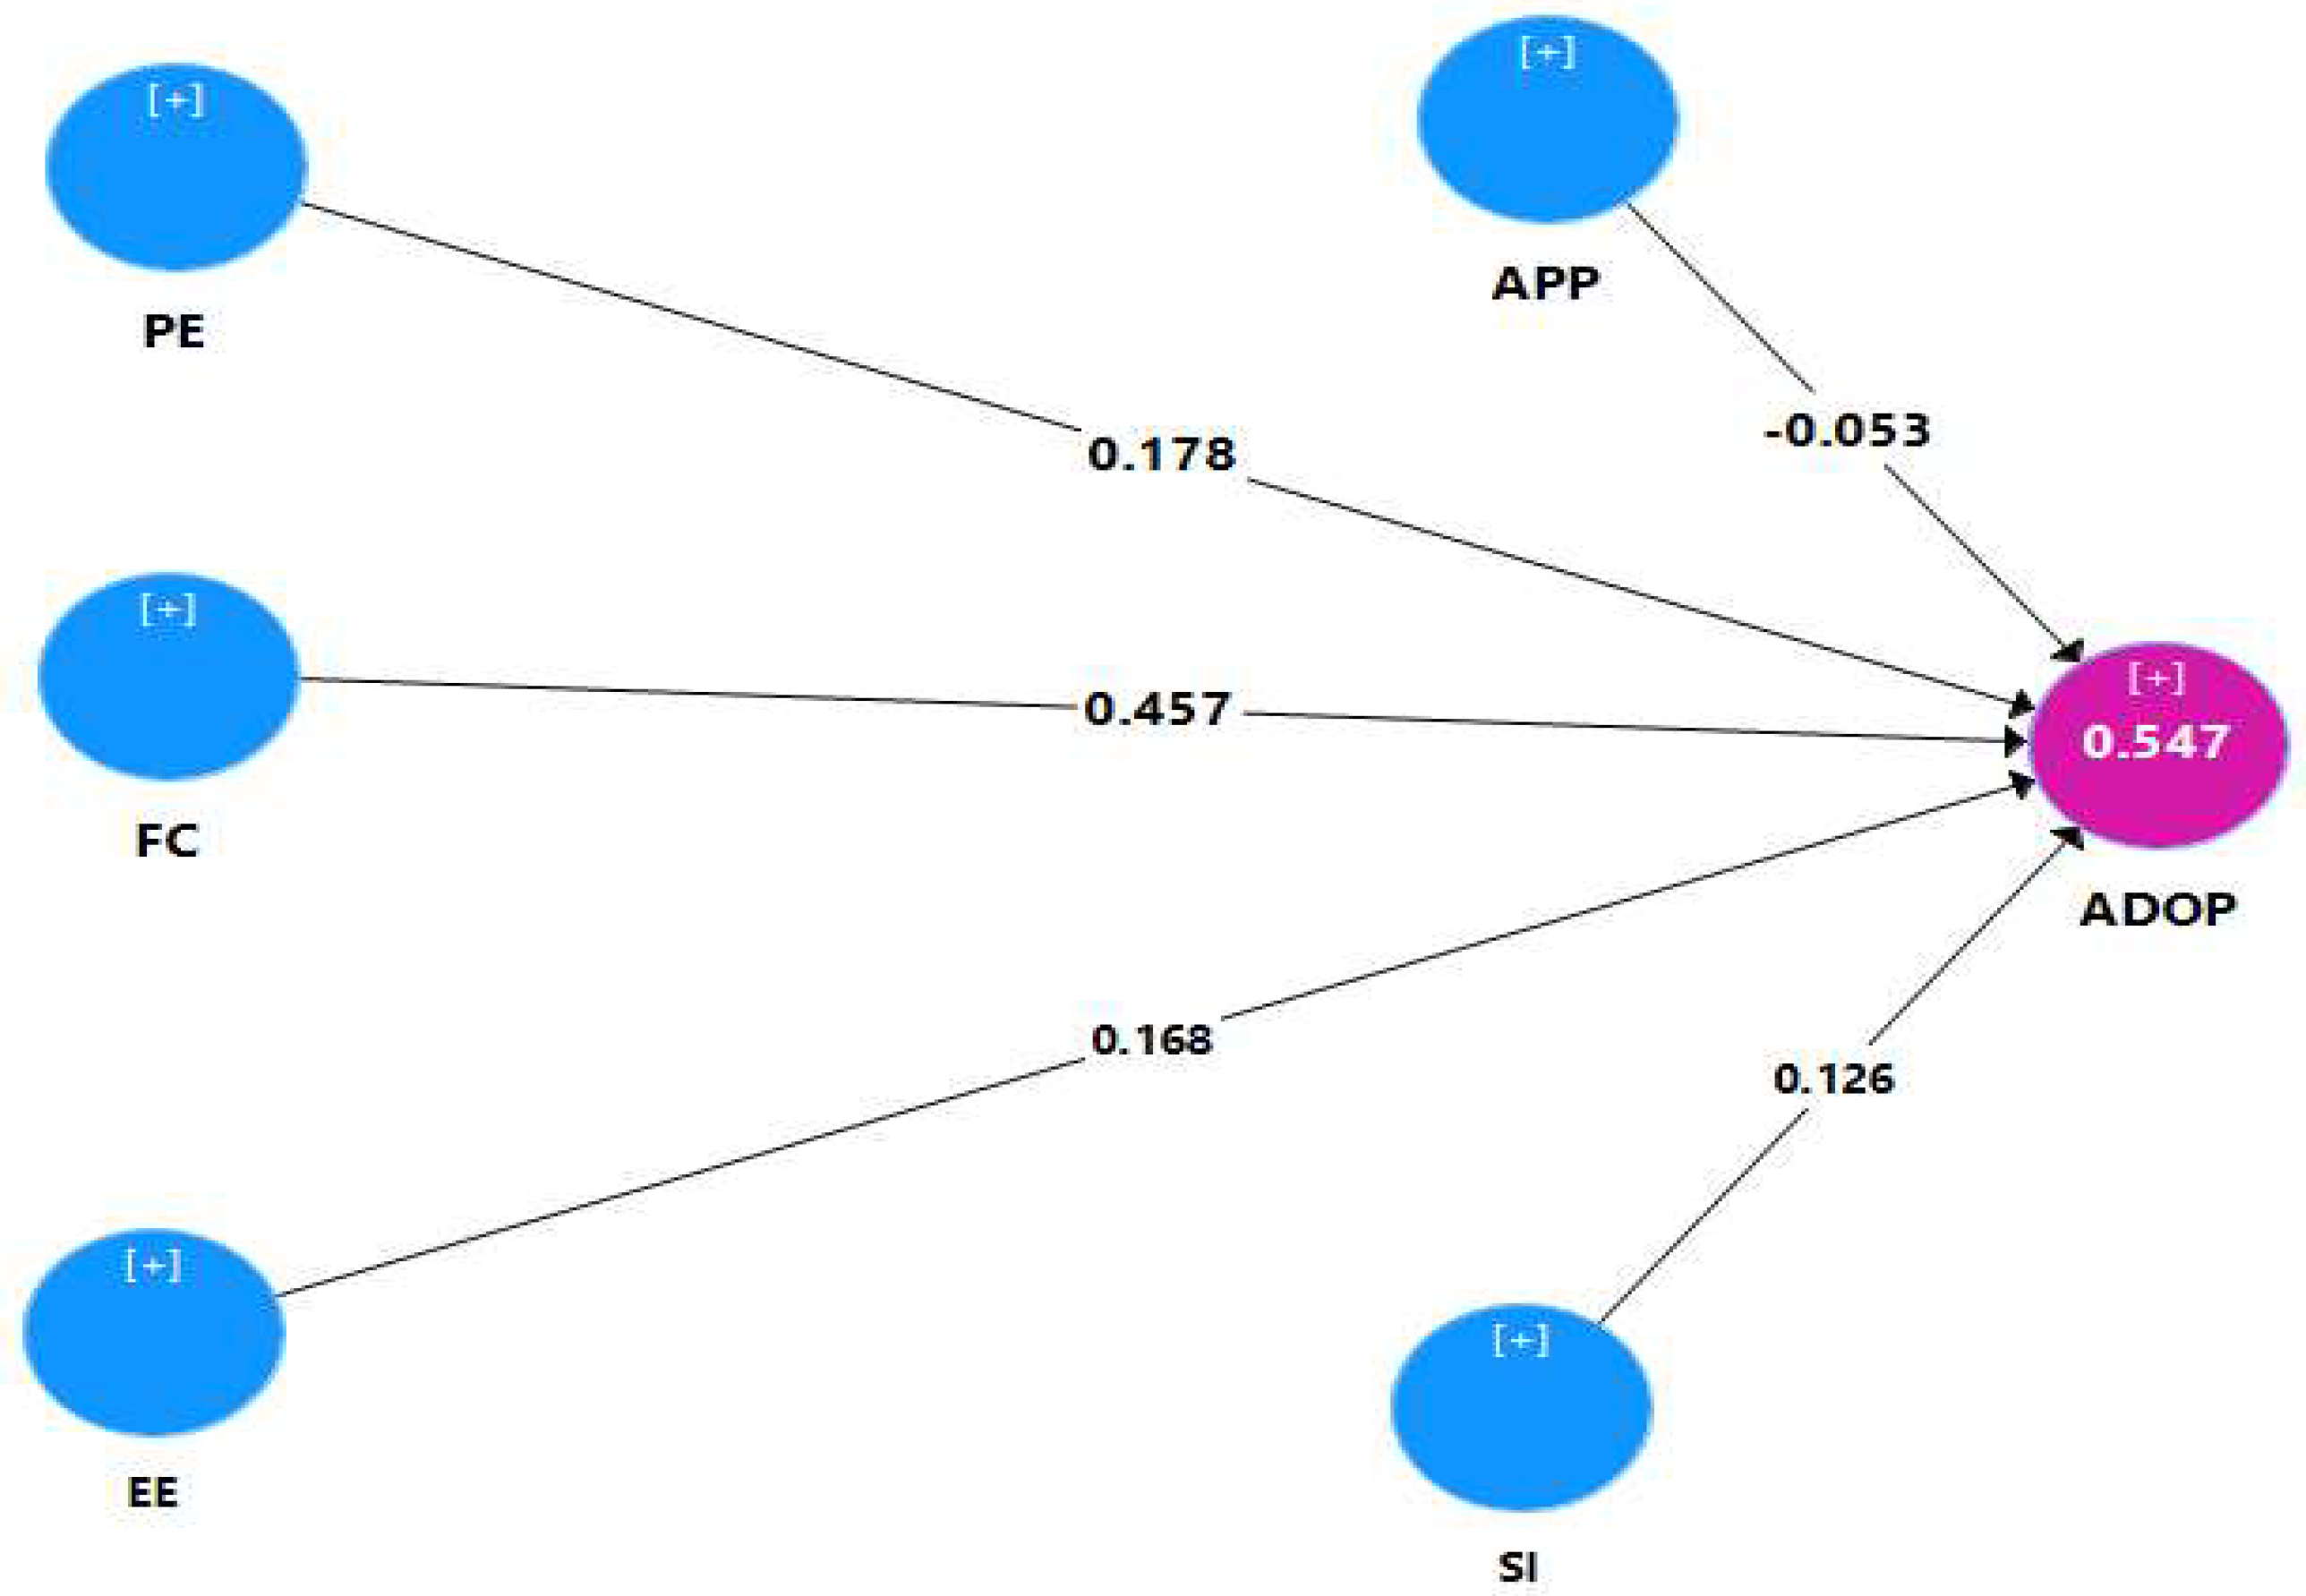
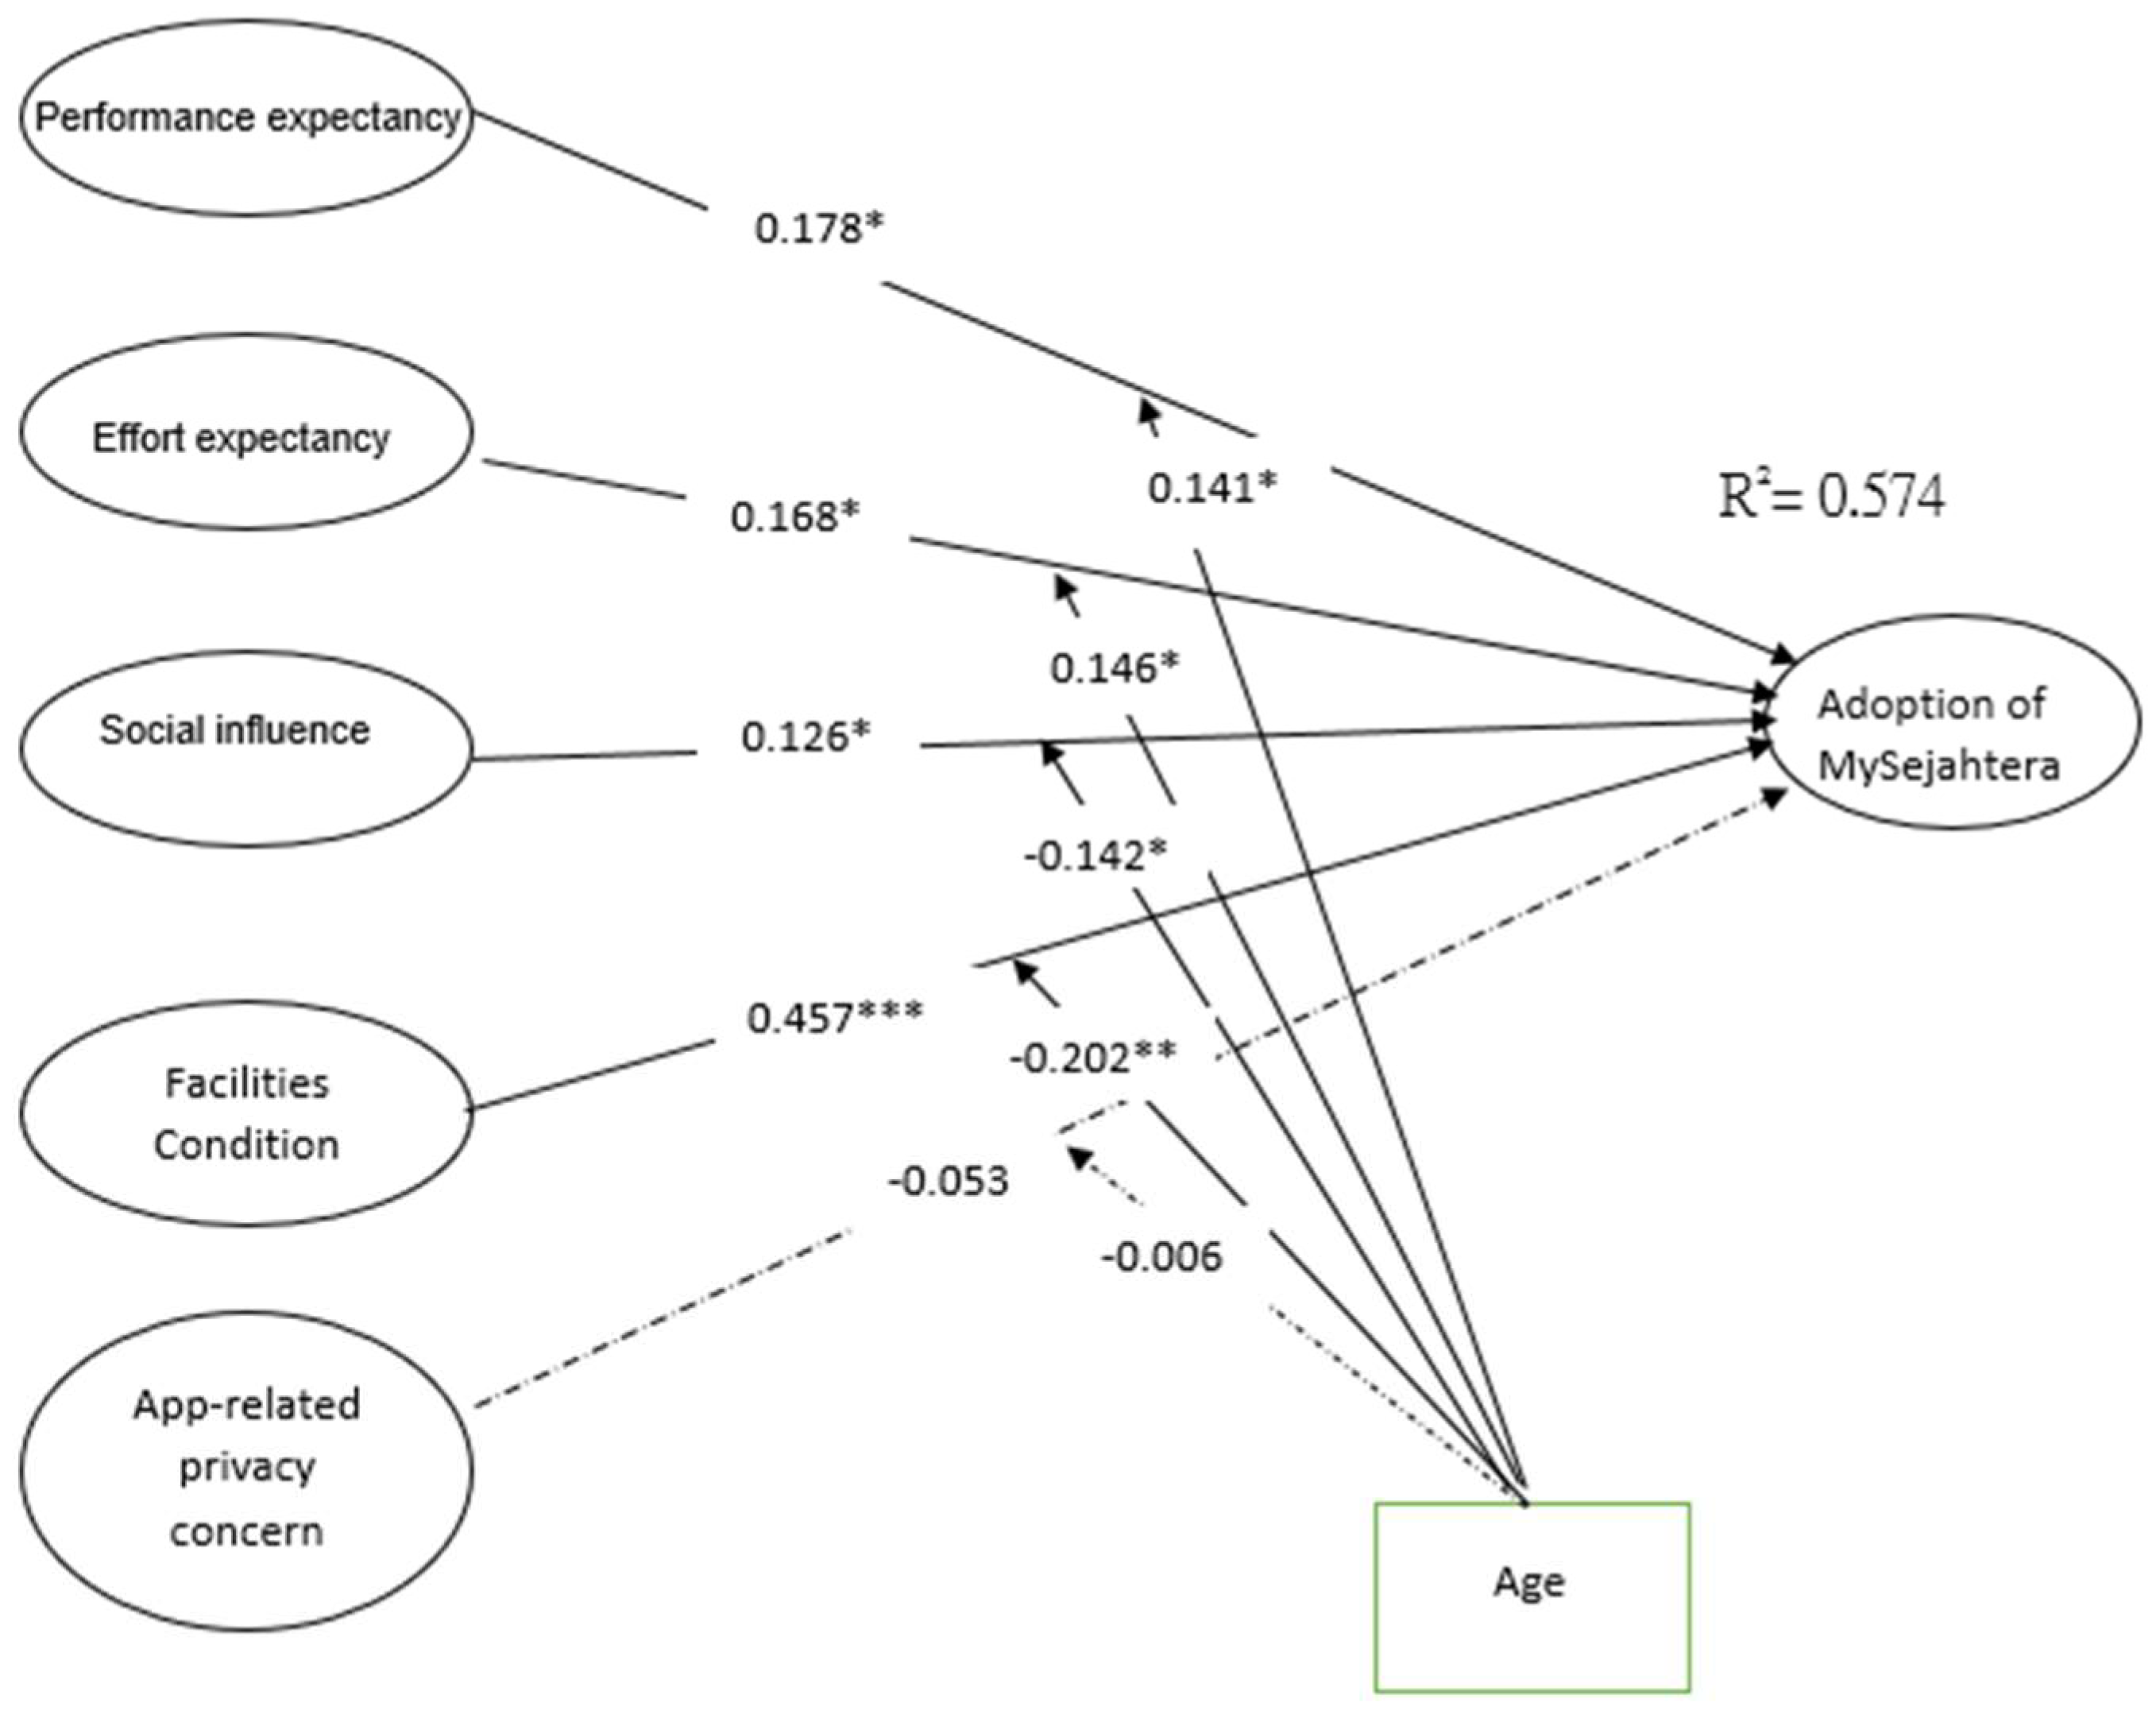
The results of this study show four main hypotheses were significant; these hypotheses, Performance Expectancy, Effort Expectancy, Social Influence, Facilities Condition, had a significant and positive effect on the adoption of MySejahtera application in Malaysia, as shown in Figure 6 and Table 18. In Chapter four, the path coefficient and p-value of UTAUT factors (PE, EE, SI, FC, APP), in predicting the adoption of the MySejahtera application were (β = 0.178, p = 0.0028), (β = 0.168, p = 0.028), (β = 0.126, p = 0.027) and (β = 0.457, p = 0.000) and (β = −0.053, 
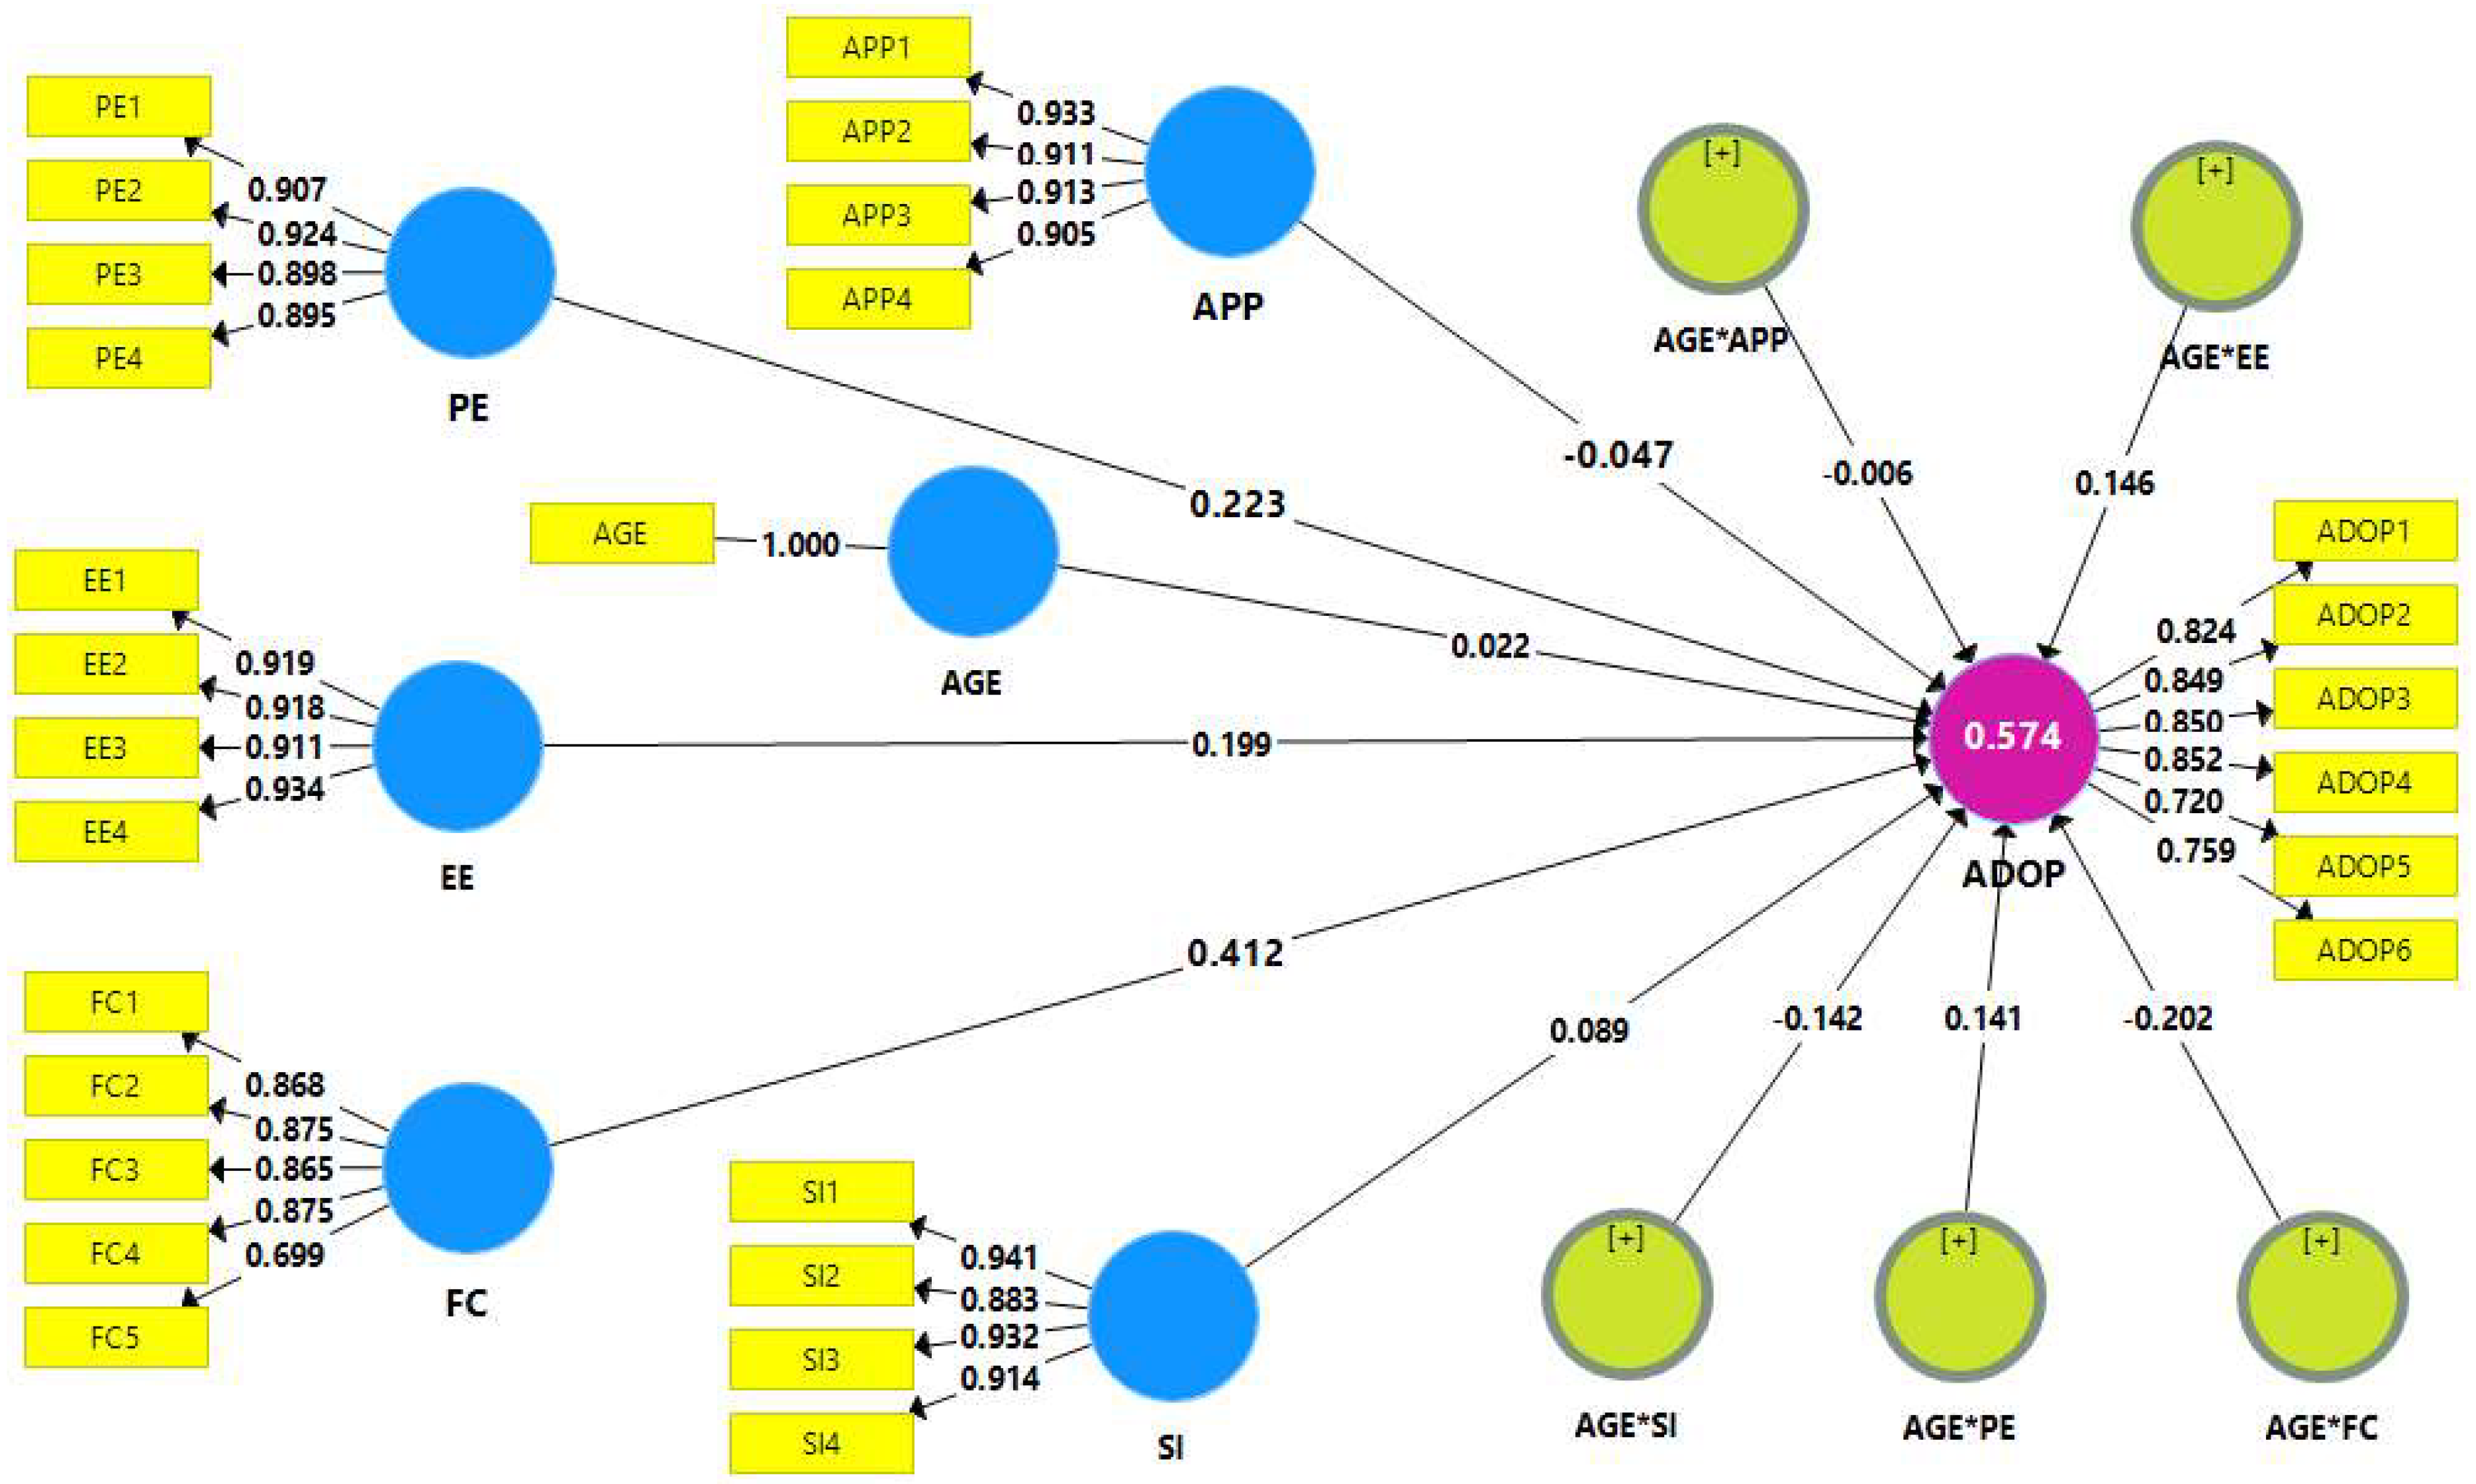
p = 0.432), respectively. In addition, the results indicate age was a moderating and positive influence between Performance Expectancy, Effort Expectancy, and MySejahtera application adoption, but age was a moderating and negative influence on Facilities Condition, Social Influence, and MySejahtera application adoption among people who adopted MySejahtera in Malaysia.
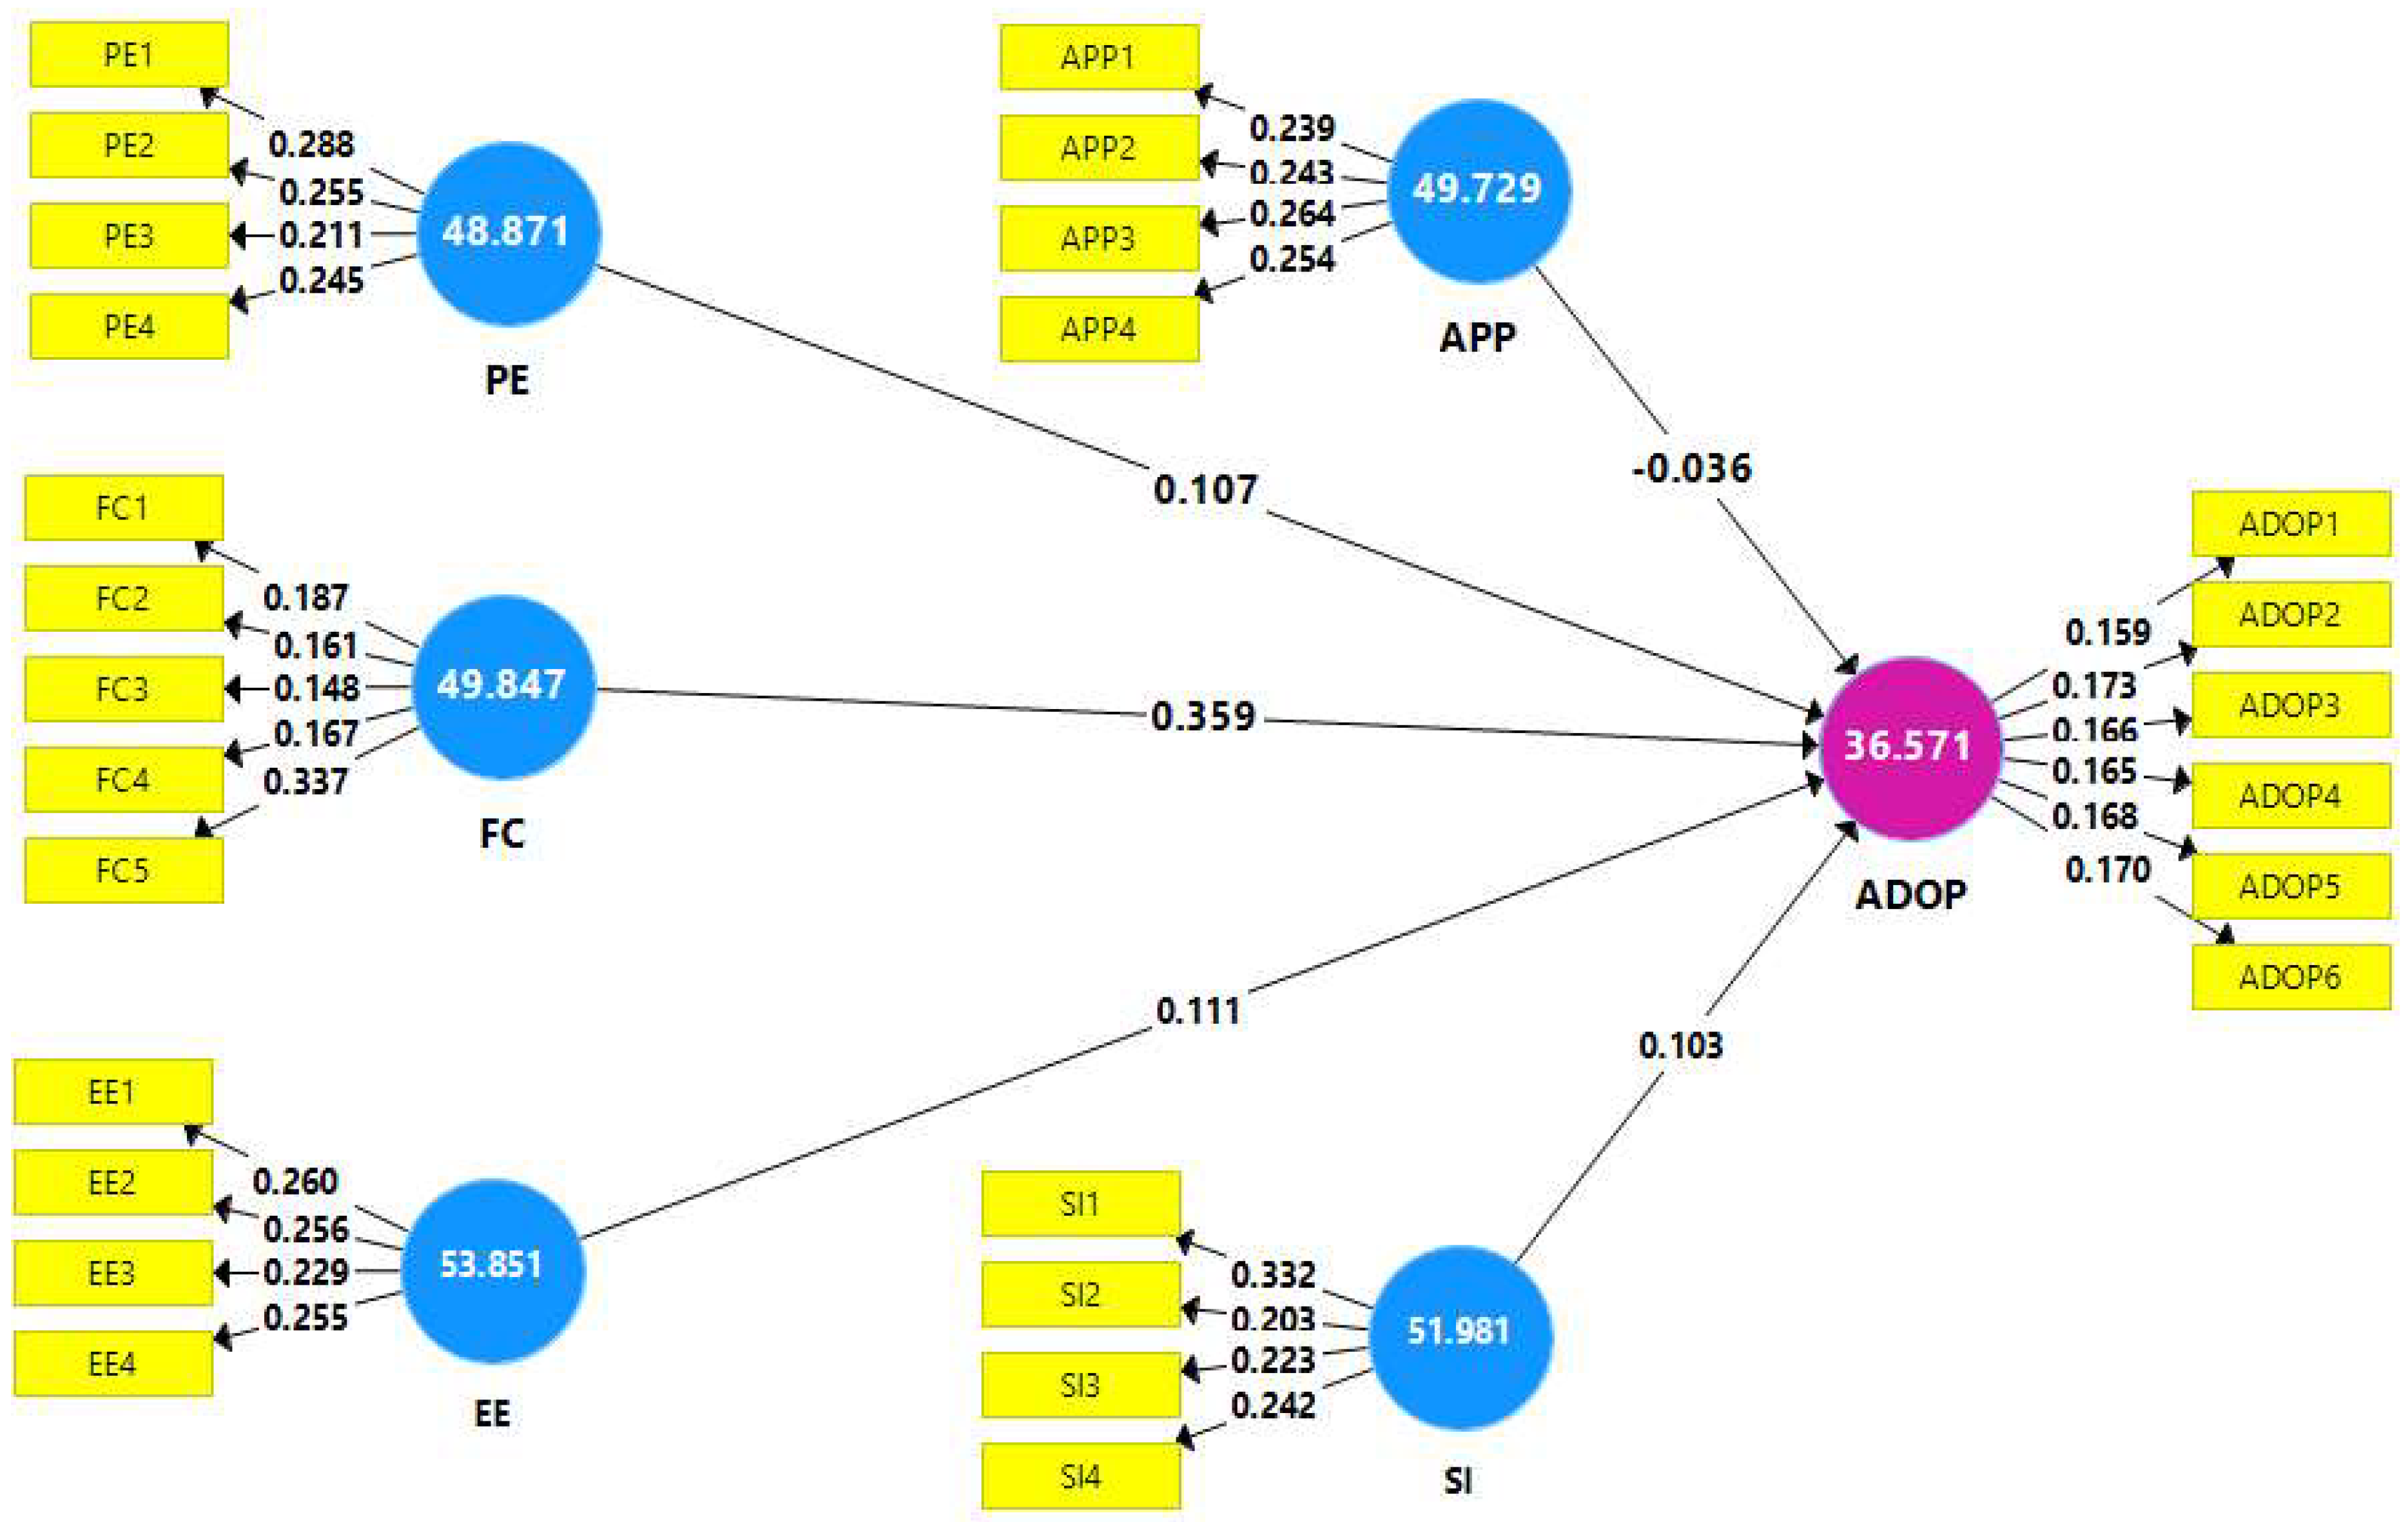
Furthermore, the t- and p-value of Performance Expectancy, Effort Expectancy, Social Influence and Facilities Condition were (β = 0.141, p = 0.038), (β = 0.146, p = 0.036), (β = −0.142, p = 0.022) and (β = −0.202, p = 0.021), respectively. On the other hand, App-related privacy concern did not have a significant influence on MySejahtera adoption and age also did not moderate the relationship between App-related privacy concern and MySejahtera application adoption in Malaysia (β = −0.006, p = 0.467).
The present study shows that UTAUT constructs consist of four factors: Performance Expectancy (H1), Effort Expectancy (H2), Social Influence (H3), Facilities Condition (H5), App-related privacy concern (H5). Three path coefficients were found to be significant and related to adopting the MySejahtera application, and these are H1, H1, H3, and H4, while one factor was found to be not significant, H5. The findings found that UTAUT factors had a significant and positive effect on MySejahtera application adoption among people in Malaysia. Therefore, H1 is supported, as shown in Table 18, in Chapter four. Several past studies have reported findings, including a significant and positive relationship between UTAUT factors and the adoption of new technology (Wang and Shih, 2009; Wang and Shih, 2009; Venkatesh et al., 2003). This study has contributed to the understanding of the relationship between the core UTAUT factors and MySejahtera application adoption among people in Malaysia. There is a strong correlation between PE, EE, SI, FC, and MySejahtera application adoption.

7.1. Performance Expectancy That Could Influence MySejahtera Application Adoption (H1)

Empirical evidence generated from the present study indicates that the relationship between Performance Expectancy and MySejahtera application adoption, among people who adopted the MySejahtera application in Malaysia, was significantly and positively impacted. Therefore, hypothesis H1 is acceptable, as shown in Table 18 and Figure 6, in Chapter four (β = 0.178, t = 2.18; p = 0.028 < 0.05). Several past studies have reported findings, including a significant and positive relationship between Performance Expectancy and COVID-19 applications adoption (Garousi et al., 2020; Sharma, et al., 2020). The more useful the MySejahtera application is perceived to be, the greater the attitude to adopt it. In light of such a finding, the benefits of MySejahtera adoption should be a factor to consider and emphasize when developing applications and implementing the technology, such as COVID-19 applications.
This result shows that people’s attitude seems to be a key predictor of the MySejahtera application’s adoption because they view MySejahtera adoption is a good and pleasant idea.
This result could imply that people in Malaysia who expect to gain benefits from the adopting of MySejahtera are more likely to have the intention to use MySejahtera, which provides benefits to them in technology adoption. Osatuyi (2013) found Performance Expectancy can play a significant role in affecting individuals’ MySejahtera adoption, when users expect higher levels of performance gains in terms of the MySejahtera application.

7.2. Effort Expectancy That Could Influence on MySejahtera Application Adoption (H2)

A significant positive relationship was found between Effort Expectancy and MySejahtera application adoption among people in Malaysia. Thus, H2 is accepted (β = 0.168, t = 2.214, p = 0.028). The result is consistent with the findings reported in previous studies (Abdullah et al., 2020; Chowdhury et al., 2020). In the current study, Effort Expectancy, one of the four direct determinants in the UTAUT model, is related to how individuals believe new technology will help them perform their job better. The results show that people in Malaysia agreed on the idea that Effort Expectancy will lift behavioral intention of MySejahtera application adoption.

7.3. Social That Influence Could Influence on MySejahtera Application Adoption (H3)

The results of this study indicate that Social Influence influenced MySejahtera application adoption Therefore, hypothesis H3 was supported (β = 0.126, t = 2.222; p = 0.027 < 0.05). This result was consistent with previous research, which suggested that Social Influence plays a significant role in innovation adoption decisions (Walrave et al., 2020; Kukuk, 2020; Wang et al., 2020). Therefore, through our research of new apps, we expect that if individuals believe that other VIPs will use the app and support it or recommend its use, they will see it necessary and will intend to download and use the COVID-19 app. In fact, the effect of Social Influence is very strong, especially in East Asian cultures contexts, such as Malaysia.

7.4. Facilities Conditions That Could Influence on MySejahtera Application Adoption (H4)

Empirical evidence generated from the present study indicates that the relationship between Facilities Condition and MySejahtera application adoption, among people in Malaysia, was significantly and positively impacted. Therefore, hypothesis H4 is accepted, as shown in Table 18 and Figure 6 (β = 0.457, t = 5.741; p = 0.000). The results of this study show that within the UTAUT factors, Facilities Condition had a strongly significant and positive influence on MySejahtera application adoption among people in Malaysia. These results are consistent with what was revealed by some previous studies (Martin et al., 2020; Kukuk, 2020; Walrave et al., 2020). Facilitating conditions are factors in an environment that allows the use of COVID-19 applications on smartphones by individuals. The people in Malaysia believe the effective use of COVID-19 applications to contribute to curbing the spread of the epidemic depends on the availability of the organizational resources (materials and humans), and the appropriate technical infrastructure required to achieve optimum performance. This means that the degree to which individuals believe that the organizational resources and technical infrastructure are in place to support the effective use of COVID-19 applications, to reduce the spread of the epidemic, can determine whether or not they will actually use COVID-19 apps via mobile phone.

7.5. App-Related Privacy Concerns Did Not Influence MySejahtera Application Adoption (H5)

The relationship between App-Related Privacy Concerns and MySejahtera application adoption in Malaysia was insignificant. Therefore, hypothesis H2b was not supported (β = −0.053, t = 0.788; p = 0.432). According to previous studies (Mat et al., 2020; Walrave et al., 2020b), it was determined that privacy concerns, related to health informatics, negatively affect the use of technology related to patients’ health. In the context of applying digital contact tracking apps for COVID-19, we expected privacy concerns to negatively affect the intent to accept the application, especially since some privacy organizations have indicated that there are some abuses by governments and support providers for these applications, and raised concerns about data protection issues related to the implementation of digital contact tracking applications. At the time of this research, there was little research available, regarding the adoption and acceptance of contact tracing applications by individuals, especially using existing technology adoption and acceptance theories. However, studies suggest that privacy plays a major role in the acceptance of contact tracing apps [35]. The findings of the research show App-Related Privacy Concern was considered an unimportant factor that influences MySejahtera application adoption in Malaysia. However, the result may be explained from the cultural viewpoint of people who adopt the MySejahtera application in Malaysia. The probable reason for this finding could be that the people who adopt the MySejahtera application may feel that privacy concerns are not relevant to the specific context of the COVID-19 pandemic. Although hypothesized to have a significant effect on MySejahtera application adoption, the findings of this study are in line with some previous evidence that found App-Related Privacy Concerns to be not significantly, and in fact, negatively related, to MySejahtera application adoption by an individual in Malaysia. As noted from the findings, the citizens in Malaysia were not confident in the information of the MySejahtera application and their confidence in technology was weak, particularly the truth of information via MySejahtera.
Most contact tracing apps are widely supported by the government, so individual privacy concerns must be taken into consideration and privacy should be investigated as a possible impact on intent to use COVID-19 apps [33]. Finally, respondents consider these factors as essential elements to adopting MySejahtera application in Malaysia: Performance Expectancy, Effort Expectancy, Social Influence, and Facilities Conditions factors. This is in contrast to other factors, such as App-Related Privacy Concerns, which may not be considered as important for the time being.

7.6. Moderating Effects of Users’ Age

As an objective, the moderating role of demographic variables, such as the age of respondents, was assessed using the interaction method by Smart-PLS 0.3. The results suggest that age was a significant interaction effect, based on the structural invariance model. The findings showed that age was a moderating effect between Performance Expectancy, Effort Expectancy, Social Influence, Facilities Condition, and MySejahtera adoption, but it was not moderating between App-Related Privacy Concerns and MySejahtera application adoption. The results indicate that age moderates the relationship between Performance Expectancy, Effort Expectancy, and MySejahtera adoption. This is because the path coefficient and t-value for PE and EE were (β = 0.141; t = 1.771; p ˂ 0.05) and (β = 0.146; t = 1.776; p ˂ 0.05), respectively. Therefore, the positive relationship between Performance Expectancy, Effort Expectancy, and MySejahtera application adoption will be higher with age. On the other hand, the negative relationship between Social Influence, Facilities Condition, and MySejahtera application adoption will be lower with age. The path coefficient and t-value for SI and FC were (β = −0.142; t = 2.008; p ˂ 0.05) and (β = −0.202; t = 2.023; p ˂ 0.05), respectively. This means the results show that Social Influence and Facilities Condition for MySejahtera Application adoption is lower in younger adults. Older adults are more concerned with Social Influence and Facilities Conditions that influenced on MySejahtera Application adoption among citizens in Malaysia. This is because young generations are more aware and familiar with the latest mobile phones and the functions of mobile phones to use the MySejahtera application. They are considered a technologically savvy group. This indicates that Performance Expectancy and Effort Expectancy with MySejahtera Application adoption are higher with older age, while younger adults are more concerned with Performance Expectancy and Effort Expectancy, influenced by MySejahtera Application adoption, indicating that Performance Expectancy and Effort Expectancy are the most important factors for them. Finally, age did not moderate the relationship between App-Related Privacy Concerns and MySejahtera Application adoption among citizens in Malaysia.

7.7. UTAUT Applicability Validation

The UTAUT framework was found to be a good fit for explaining MySejahtera application adoption among Malaysians in this study. As demonstrated in Table 18, in Chapter Four, the internal consistency (Cronbach’s alpha and Composite Reliability) of each of the components exceeds 0.7, indicating that they are satisfactory (Hair et al., 2006). The SRMR of this study model was 0.073, as shown in Table 14, indicating that it was a satisfactory fit (Chen, 2007). Table 12 reveals that H1, H2, H3, H4, H6, H7, H8, and H9 had a substantial impact on the adoption of the MySejahtera application.
The items’ convergent validity is determined by the magnitude of the standardized factor loading exceeding 0.50, indicating that the items, per factor, have sufficient convergent validity (Fornell and Larcker, 1981) (see Table 7). Table 7 in Chapter Five shows that the average variance extracted (AVE) in each construct is greater than 0.50. We compared the square root of the average variance recovered with the correlations among the components to assess the factors’ discriminant validity (Fornell and Larcker 1981). The correlations between the components (off-diagonal elements) and the square root of the average variance retrieved are shown in Table 8 (diagonal elements).
The square root of the average variance recovered in each example is greater than the correlations of the relevant components with the other factors in the model. As a result, each factor achieves discriminant validity. Furthermore, the UTAUT model’s squared multiple correlations (R2) explain 54.7 percent of the variance in MySejahtera adoption, indicating that it is a good fit. Moreover, the results suggest that the Facilities Condition had a medium-sized effect of the predictive variable on MySejahtera adoption, with a value of 0.173. Furthermore, the predictive variables of Performance Expectancy, Effort Expectancy, and Social Influence exhibited small-sized effects on MySejahtera adoption, with 0.043, 0.031, and 0.023, respectively.
Age was also found to be a moderator between Performance Expectations, Effort Expectations, Social Influence, Facilities Condition, and MySejahtera adoption, but not between MySejahtera Application and MySejahtera adoption. The findings show that the UTAUT model is a good fit, as seen in Table 7, Table 8, Table 9, Table 10, Table 11, Table 12, Table 13, Table 14 and Table 15. As a result of these findings, the UTAUT framework may be utilized to describe the elements that influence the adoption of the MySejahtera Application. Performance Expectancy, Effort Expectancy, Social Influence, and Facility Condition are more significant predictors of MySejahtera Application adoption, according to the UTAUT model. Age was also found to be a moderator between Performance Expectancy, Effort Expectancy, Social Influence, Facility Condition, and MySejahtera application adoption, but not between App-Related Privacy Concerns and MySejahtera application adoption.

7.8. Research Implications

This research will contribute to the study and identification of the factors that would stimulate or slow down the adoption of a contact-tracing app. To be specific, a model that describes the adoption of Digital Contact Tracing Apps in Malaysia. Furthermore, this research proposes solutions to mitigate the impact of the factors affecting the users’ acceptance of COVID-19 Digital Contact Tracing Apps. These solutions will reflect the public benefit behind using this application to confront COVID-19 and recover from this crisis faster. Studying MySejahtera Application adoption for COVID-19 in developing countries, such as Malaysia, does not only serve the development of technology in Malaysia, but can contribute to the body of knowledge in the area of application acceptance for COVID-19 Digital Contact Tracing Apps. This research will be of significance in several areas and provide new knowledge, theoretical and practical. Therefore, the findings of the study have several valuable implications for academics, practices, and policy making.

7.9. Implications for Academic Research

The study’s findings have several implications for academic research. First, the extended UTAUT model of motivation is applicable to developing countries, with different degrees of explanatory power. Moreover, the results reveal the need for testing other variables that may provide more in explaining MySejahtera Application adoption for the COVID-19 pandemic, among individuals and organizations in developing countries in general and Malaysia in particular. Second, the model of UTAUT can be employed to explain other online behavior, such as e-government, e-health application, e-sign, and other electronic applications. Third, the current study indicates that the proposed model of UTAUT can be valid. The study also indicates that the aggregated model of technology acceptance theories (UTAUT) is moveable and can be used to examine the adoption of the MySejahtera Application in diverse cultures, such as Malaysia. The fourth contribution is met by the establishment and testing of the full structural model. This model can be used in its current form to test other social network applications, or modified to fit the MySejahtera application for the COVID-19 pandemic. According to the literature, there is very little research that uses the UTAUT framework model to discuss the adoption of the MySejahtera Application for the COVID-19 pandemic, from the viewpoint of people in the Asia region in general and in Malaysia in particular. Therefore, this research used the UTAUT model to account for the adoption to use the MySejahtera application. Thus, the model generated from this research may be a useful tool for academics to understand these factors in the future. Finally, the research applied a Smart-PLS technique that permits a concurrent assessment of all the factors in the conceptual framework. The current research used two types of group analysis, using the PLS-SEM technique: measurement and structure models, using the variance structure analysis to examine the impact of the research model, in the context of Malaysia. The application of PLS-SEM can be considered a methodological contribution because it promoted a better quality of research.

7.10. Implications for Practices

This is the first study to look at the UTAUT elements and App-Related Privacy Concerns that influence people’s adoption of the MySejahtera application for the COVID-19 pandemic in Malaysia. As a result, the findings of this study have various important implications for Malaysians, both young and elderly. To begin with, this study demonstrates that people’s attitudes have an impact on how they accept the MySejahtera application. As a result, people should focus on UTAUT aspects to improve the number of MySejahtera app users. Second, this study makes a significant contribution by statistically confirming the elements that influence people’s adoption of the MySejahtera application.
Thus, those with higher Performance Expectations, Effort Expectations, Social Influence, and Facility Conditions are more likely to use the MySejahtera application. On the other hand, App-Related Privacy Concerns highlighted that, as long as individuals believe that MySejahtera application adoption is not joyful, fun, or confident, their behavioral intention to use the MySejahtera application system will not be influenced. Individuals’ privacy worries will be reduced as a result of the findings of this study. Based on the findings of this study, it is possible to conclude that people’s performance will improve if motivators for the MySejahtera application are determined in terms of Performance Expectancy, Effort Expectancy, and Social Influence Facilities Condition.
The findings of this study will aid existing persons and those in charge of training, in adopting a pedagogical approach for strategically integrating MySejahtera application adoption in learning. The COVID-19 pandemic technologies used in the MySejahtera application can assist people in being successful and healthy in their lives. People who have a high level of self-efficacy may find it easier to adopt new technology.
This study assists all Malaysians and government institutions, in the sense that people will be more willing and able to learn new technology. The study’s findings will help to improve the quality of the MySejahtera application system among Malaysians. The suggestions could serve as a baseline for enhancing the usability of the MySejahtera COVID-19 pandemic application in Malaysia. In a time when the world is facing a global epidemic, the resultant model provides full knowledge of privacy problems. Finally, digital technologies have the potential to play a significant role in tackling current pandemic difficulties and slowing the virus’s spread.
However, the efficiency and accuracy of these systems are determined by the application architecture and user participation. If systems used mechanisms to assure user security and privacy, user engagement may be improved.

7.11. Policy Contribution

To deploy the MySejahtera application, policy makers must develop a priority factor list that includes Performance Expectations, Effort Expectations, Social Influence, Facility Conditions, and App-Related Privacy Concerns. As a result, the Malaysian government is in charge of developing IT infrastructure, as well as expanding IT education in high schools and universities. Furthermore, the government should help individuals overcome barriers to using the MySejahtera application by guaranteeing stronger internet infrastructure and encouraging non-users to use it.
Furthermore, the report recommends that the government raise awareness by educating children, adults, senior citizens, and women about the inventive potential of new technologies, such as the MySejahtera app. Finally, the paper recommends that policy makers focus on maximizing UTAUT elements that have been empirically demonstrated to influence and contribute to improving citizens’ intentions to adopt the MySejahtera application.

7.12. Limitations of the Study

There are various flaws in this study that can be addressed in future research. To obtain a more comprehensive understanding of the users’ acceptance of MySejahtera application adoption, this study discussed a few factors of MySejahtera application adoption and ignored other factors, such as perceived risk, perceived trust, perceived ease of use, or other moderating variables, such as gender, education, and experience. Second, this study was limited to Malaysian citizens. As a result, the findings of this study do not reflect the behavior of other institutions, secondary schools, or countries, in need of additional investigation. Third, the persons that were surveyed were all Malaysians.
The survey is insufficiently broad in terms of population coverage. As a result, generalizing the study’s findings should be done with caution. Fourth, a mixed-methods study should be conducted, to look into additional citizen characteristics. Citizens’ interviews could also help to clarify the nature of these features and how they interact.

7.13. Recommendation and Research Future

The contribution is made possible by the instrument’s use, as well as the evaluation of the items and latent structures for assessing features of MySejahtera application utilization. New versions of UTAUT for earlier concepts, produced expressly for this study, are the specific construct app-related privacy issue. All constructs were tested and refined in the pilot study and the primary research instrument, resulting in statistically valid assessments of the latent variables. Researchers working on the MySejahtera application for the COVID-19 pandemic should find value in the predicted links that have been documented and use them to build definitions for their own studies.
We advocate following the design choices that should be followed for the construction of contact tracing apps, to ensure privacy, security, and secure development.
  • To maintain the privacy and security of user data, contact tracing systems must use well-established and cutting-edge encryption systems for data storage, enable customizable access control mechanisms, and employ secure communication methods for data transmission between users and data centers. To reduce the risk of misuse, developers should also consider the semantics of safe software development, strong authentication mechanisms, and possibly two-factor authentication.
  • The media can help stimulate app adoption by informing citizens about the app’s features, benefits, and use cases, which increases self-efficacy and perceived benefits.
  • The app’s privacy policy should be stated clearly and understandably. When the epidemic is over, the developer should implement tools that allow them to simply remove user data.
  • While substantial technology advances have been made to facilitate COVID-19 response, contact tracing apps still need to be improved to reach desired goals in a privacy-conscious manner.
  • The design should be straightforward and offer a user interface for interaction and personal tracking to promote usability.

8. Conclusions

Finally, in light of the earlier discussion of the findings, the study’s research objectives have been met. Using PLS-SEM, this study investigated the UTAUT variables of the MySejahtera COVID-19 pandemic application in Malaysia. According to the findings of this study, UTAUT characteristics (Performance Expectancy, Effort Expectancy, Social Influence, and Facility Condition) were important predictors of MySejahtera app adoption among Malaysian citizens. App-Related Privacy Concerns, on the other hand, were determined to be minimal in the adoption of the MySejahtera application. As previously stated, the purpose of this research is to determine whether the UTAUT framework, which was designed in developed countries, can be applied to non-Western cultures or developing countries.
Most technology acceptance theories, established and produced in developed countries, are culturally biased in the service of those developed countries’ social and cultural systems, according to popular belief. Malaysians can use the MySejahtera application technology to assist in slowing down the epidemic. These methods can be replicated by other Southeast Asian countries, particularly those with low resources that are currently suffering from the fatal outbreak’s more severe consequences. There are several benefits to utilizing the app, but there are also some drawbacks. However, we believe that the policy of test, track, trace, and support will be critical in containing the present pandemic and preventing a second coronavirus outbreak. Finally, the study includes information on the state of MySejahtera application technology among Malaysian citizens, as well as sources of reference for academics, practitioners, and policy makers interested in using MySejahtera to combat the COVID-19 pandemic in Malaysia.

Author Contributions

Conceptualization, A.A. and R.A.; methodology, R.A. and A.A.; software, M.A.; validation, M.A. and A.A.; formal analysis, R.A. and A.A.; investigation, M.A. and A.A.; resources, R.A. and A.A.; data curation, A.A.; writing—original draft preparation, M.A. and A.A.; writing—review and editing, R.A. and A.A.; visualization, A.A.; supervision, M.A. and R.A.; project administration, R.A. and A.A.; funding acquisition, A.A. All authors have read and agreed to the published version of the manuscript.

Funding

This research was funded by the Malaysia Ministry of Higher Education through the Fundamental Research Grant Scheme FRGS/1/2020/ICT03/UNIKL/02/1.

Institutional Review Board Statement

Not applicable.

Informed Consent Statement

Not applicable.

Data Availability Statement

Not applicable.

Acknowledgments

We would also like to show our gratitude to the (Abdulaleem Z. Al-Othmani, Cyber Technology Institute (CTI), De Montfort University Leicester, United Kingdom), (Mohammed Al-Sarem, 1-College of Computer Science and Engineering, Taibah Univer-sity, Medina 42353, Saudi Arabia; 2-Department of Computer Science, Saba’a Region University, Mareb, Yemen) for sharing their pearls of wisdom with us during the course of this research.

Conflicts of Interest

The authors declare no conflict of interest.

References

  1. Rahman, F. The Malaysian response to COVID-19: Building preparedness for ‘surge capacity’, testing efficiency and containment. Eur. Pharm. Rev. 2020. Available online: https://www.europeanpharmaceuticalreview.com/article/125084/the-malaysian-response-to-covid-19-building-preparedness-for-surge-capacity-testing-efficiency-and-containment/ (accessed on 26 January 2022).
  2. Mohd Radzi, S.F.; Hassan, M.S.; Mohd Radzi, M.A.H. How Do Southeast Asia Countries Respond and Mitigate to Novel Coronavirus Pandemic? A Lesson from Malaysia. Asia Pac. J. Public Health 2020, 32, 453–455. [Google Scholar] [CrossRef] [PubMed]
  3. Ferretti, L.; Wymant, C.; Kendall, M.; Zhao, L.; Nurtay, A.; Bonsall, D.G.; Fraser, C. Quantifying dynamics of SARS-CoV-2 transmission suggests that epidemic control and avoidance is feasible through instantaneous digital contact tracing. MedRxiv 2020. Available online: https://pubmed.ncbi.nlm.nih.gov/32234805/ (accessed on 26 January 2022).
  4. Azad, M.A.; Arshad, J.; Akmal, S.M.A.; Riaz, F.; Abdullah, S.; Imran, M.; Ahmad, F. A First Look at Privacy Analysis of COVID-19 Contact Tracing Mobile Applications. IEEE Internet Things J. 2020, 8, 15796–15806. [Google Scholar] [CrossRef]
  5. Ramakrishnan, A.M.; Ramakrishnan, A.N.; Lagan, S.; Torous, J. From Symptom Tracking to Contact Tracing: A Framework to Explore and Assess COVID-19 Apps. Futur. Internet 2020, 12, 153. [Google Scholar] [CrossRef]
  6. Gupta, R.; Bedi, M.; Goyal, P.; Wadhera, S.; Verma, V. Analysis of COVID-19 Tracking Tool in India: Case Study of Aarogya Setu Mobile Application. Digit. Gov. Res. Pract. 2020, 1, 1–8. [Google Scholar] [CrossRef]
  7. Patel, F.B.; Jain, N.; Menon, R.; Kodeboyina, S. Comparative Study of Privacy Preserving-Contact Tracing on Digital Platforms. In Proceedings of the 2020 International Conference on Computational Intelligence (ICCI), Iskandar Puteri, Malaysia, 8–9 October 2020; pp. 137–141. [Google Scholar]
  8. Abbas, R.; Michael, K. COVID-19 contact trace app deployments: Learnings from Australia and Singapore. IEEE Consum. Electron. Mag. 2020, 9, 65–70. [Google Scholar] [CrossRef]
  9. Lawrence, O.; Gostin, J.D.; Center, L. Digital Smartphone Tracking for COVID-19 Public Health and Civil Liberties in Tension. JAMA 2020, 323, 2371–2372. [Google Scholar]
  10. Jalabneh, R.; Zehra Syed, H.; Pillai, S.; Hoque Apu, E.; Hussein, M.R.; Kabir, R.; Arafat, S.M.; Azim Majumder, M. Use of mobile phone apps for contact tracing to control the COVID-19 pandemic: A literature review. Appl. Artif. Intell. COVID-19 2021, 389–404. Available online: https://papers.ssrn.com/sol3/papers.cfm?abstract_id=3641961 (accessed on 26 January 2022). [CrossRef]
  11. Iyengar, K.P.; Jain, R.; Samy, D.A.; Jain, V.K.; Vaishya, R.; Suraliwala, K. Exploring the role and mechanism of COVID-19 apps in fighting the current pandemic. Indian J. Med. Sci. 2021, 73, 36. [Google Scholar] [CrossRef]
  12. Sharma, S.; Singh, G.; Sharma, R.; Jones, P.; Kraus, S.; Dwivedi, Y.K. Digital health innovation: Exploring adoption of COVID-19 digital contact tracing apps. IEEE Trans. Eng. Manag. 2020, 1–17. Available online: https://www.researchgate.net/publication/344275168_Digital_Health_Innovation_Exploring_Adoption_of_COVID-19_Digital_Contact_Tracing_Apps (accessed on 26 January 2022). [CrossRef]
  13. Brough, A.R.; Martin, K.D. Consumer Privacy during (and after) the COVID-19 Pandemic. J. Public Policy Mark. 2020, 40, 108–110. [Google Scholar] [CrossRef]
  14. Sun, R.; Wang, W.; Xue, M.; Tyson, G.; Camtepe, S.; Ranasinghe, D. Vetting Security and Privacy of Global COVID-19 Contact Tracing Applications. arXiv 2020, arXiv:2006.10933. [Google Scholar]
  15. Pötzsch, S. Privacy awareness: A means to solve the privacy paradox? In Proceedings of the IFIP Summer School on the Future of Identity in the Information Society, Brno, Czech, 1–7 September 2008; Springer: Berlin/Heidelberg, Germany, 2008; pp. 226–236. [Google Scholar]
  16. Yusof, A.N.M.; Muuti, M.Z.; Ariffin, L.A.; Tan, M.K.M. Sharing Information on COVID-19: The ethical challenges in the Malaysian setting. Asian Bioeth. Rev. 2020, 12, 349–361. [Google Scholar] [CrossRef]
  17. Al-Worafi, Y.M.; Lee, K.S.; Goh, H.P. Mobile Health Apps on COVID-19 Launched in the Early Days of the Pandemic: Content Analysis and Review. JMIR Mhealth Uhealth 2020, 8, e19796. [Google Scholar]
  18. Walrave, M.; Waeterloos, C.; Ponnet, K. Adoption of a contact tracing app for containing COVID-19: A health belief model approach. JMIR Public Health Surveill. 2020, 6, e20572. [Google Scholar] [CrossRef]
  19. Sharma, T.; Bashir, M. Use of apps in the COVID-19 response and the loss of privacy protection. Nat. Med. 2020, 26, 1165–1167. [Google Scholar] [CrossRef]
  20. Fadzil, F. A Study on Factors Affecting the Behavioral Intention to Use Mobile Apps in Malaysia. Available SSRN 3090753. 2017. Available online: https://papers.ssrn.com/sol3/papers.cfm?abstract_id=3090753 (accessed on 26 January 2022).
  21. Thaneshan, L.; Yamin, F.M.; Othman, S.N. Adoption of Mobile Web among University Students in Malaysia: A Review. J. Technol. Oper. Manag. 2017, 12, 11–20. [Google Scholar]
  22. Sundarasen, S.; Chinna, K.; Kamaludin, K.; Nurunnabi, M.; Baloch, G.M.; Khoshaim, H.B.; Hossain, S.F.A.; Sukayt, A. Psychological impact of COVID-19 and lockdown among university students in Malaysia: Implications and policy recommendations. Int. J. Environ. Res. Public Health 2020, 17, 6206. [Google Scholar] [CrossRef]
  23. Pung, R.; Chiew, C.J.; Young, B.E.; Chin, S.; Chen, M.I.C.; Clapham, H.E.; Cook, A.R.; Maurer-Stroh, S.; Toh, M.P.H.S.; Poh, C. Investigation of three clusters of COVID-19 in Singapore: Implications for surveillance and response measures. Lancet 2020, 395, 1039–1046. [Google Scholar] [CrossRef]
  24. Aziz, N.A.; Othman, J.; Lugova, H.; Suleiman, A. Malaysia’s approach in handling COVID-19 onslaught: Report on the Movement Control Order (MCO) and targeted screening to reduce community infection rate and impact on public health and economy. J. Infect. Public Health 2020, 13, 1823–1829. [Google Scholar] [CrossRef] [PubMed]
  25. Azizan, M.; Ismail, H.H.; Qaiwer, S.N. Power and solidarity in positive Facebook postings amidst COVID-19 in Malaysia. J. Nusant. Stud. 2020, 5, 329–364. [Google Scholar] [CrossRef]
  26. Barrat, A.; Cattuto, C.; Kivelä, M.; Lehmann, S.; Saramäki, J. Effect of manual and digital contact tracing on COVID-19 outbreaks: A study on empirical contact data. J. R. Soc. Interface 2021, 18, 20201000. [Google Scholar] [CrossRef] [PubMed]
  27. Austin, L.M.; Chiao, V.; Coleman, B.; Lie, D.; Shaffer, M.; Slane, A.; Tanguay-Renaud, F. Test, Trace, and Isolate: COVID-19 and the Canadian Constitution. Osgoode Leg. Stud. Res. Pap. 2020. Available online: https://www.osgoode.yorku.ca/media_releases/test-trace-and-isolate-covid-19-and-the-canadian-constitution/ (accessed on 26 January 2022). [CrossRef]
  28. Dai, H.; Zhang, S.X.; Looi, K.H.; Su, R.; Li, J. Perception of health conditions and test availability as predictors of adults’ mental health during the COVID-19 pandemic: A survey study of adults in Malaysia. Int. J. Environ. Res. Public Health 2020, 17, 5498. [Google Scholar] [CrossRef]
  29. Foo, L.-P.; Chin, M.-Y.; Tan, K.-L.; Phuah, K.-T. The impact of COVID-19 on tourism industry in Malaysia. Curr. Issues Tour. 2020, 24, 2735–2739. [Google Scholar] [CrossRef]
  30. Abdullah, J.M.; Wan Ismail, W.F.N.; Mohamad, I.; Ab Razak, A.; Harun, A.; Musa, K.I.; Lee, Y.Y. A critical appraisal of COVID-19 in Malaysia and beyond. Malays. J. Med. Sci. 2020, 27, 1–9. [Google Scholar] [CrossRef]
  31. Elengoe, A. COVID-19 Outbreak in Malaysia. Osong Public Health Res. Perspect. 2020, 11, 93. [Google Scholar] [CrossRef]
  32. Wang, C.; Pan, R.; Wan, X.; Tan, Y.; Xu, L.; Ho, C.S.; Ho, R.C. Immediate psychological responses and associated factors during the initial stage of the 2019 coronavirus disease (COVID-19) epidemic among the general population in China. Int. J. Environ. Res. Public Health 2020, 17, 1729. [Google Scholar] [CrossRef] [Green Version]
  33. Kukuk, L. Analyzing Adoption of Contact Tracing Apps Using UTAUT. Master’s Thesis, University of Twente, Enschede, The Netherlands, 2020. [Google Scholar]
  34. Hinch, R.; Probert, W.; Nurtay, A.; Kendall, M.; Wymant, C.; Hall, M.; Fraser, C. Effective Configurations of a Digital Contact Tracing App: A Report to NHSX. April 2020. Available online: https://github.com/BDI-pathogens/covid-19_instant_tracing/blob/master/Report%20-%20Effective%20Configurations%20of%20a%20Digital%20Contact%20Tracing%20App.pdf (accessed on 26 January 2022).
  35. Azlan, A.A.; Hamzah, M.R.; Sern, T.J.; Ayub, S.H.; Mohamad, E. Public knowledge, attitudes and practices towards COVID-19: A cross-sectional study in Malaysia. PLoS ONE 2020, 15, e0233668. [Google Scholar] [CrossRef]
  36. Park, S.; Choi, G.J.; Ko, H. Information technology-based tracing strategy in response to COVID-19 in South Korea—Privacy controversies. JAMA 2020, 323, 2129–2130. [Google Scholar] [CrossRef] [PubMed] [Green Version]
  37. Khowaja, S.A.; Dev, K.; Khuwaja, P. Internet of Everything enabled solution for COVID-19, its new variants and future pandemics: Framework, Challenges, and Research Directions. arXiv 2021, arXiv:2101.02030. [Google Scholar]
  38. Awang, H.; Yaacob, E.L.; Syed Aluawi, S.N.; Mahmood, M.F.; Hamzah, F.H.; Wahab, A.; Rashid, N.A.; Razali, R.; Soo Ning, G.; Embong, K. A case-control study of determinants for COVID-19 infection based on contact tracing in Dungun district, Terengganu state of Malaysia. Infect. Dis. 2020, 53, 222–225. [Google Scholar] [CrossRef] [PubMed]
  39. Nadzir, M.S.M.; Ooi, M.C.G.; Alhasa, K.M.; Bakar, M.A.A.; Mohtar, A.A.A.; Nor, M.F.F.M.; Latif, M.T.; Abd Hamid, H.H.; Ali, S.H.M.; Ariff, N.M. The impact of movement control order (MCO) during pandemic COVID-19 on local air quality in an urban area of Klang valley, Malaysia. Aerosol Air Qual. Res. 2020, 20, 1237–1248. [Google Scholar] [CrossRef]
  40. Mokhtar, S.A.; Ali, S.H.S.; Al-Sharafi, A.; Aborujilah, A. Organizational factors in the adoption of cloud computing in E-Learning. In Proceedings of the 2014 3rd International Conference on Advanced Computer Science Applications and Technologies, Amman, Jordan, 29–30 December 2014. [Google Scholar]
  41. Hasanat, M.W.; Hoque, A.; Shikha, F.A.; Anwar, M.; Hamid, A.B.A.; Tat, H.H. The Impact of Coronavirus (COVID-19) on E-Business in Malaysia. Asian J. Multidiscip. Stud. 2020, 3, 85–90. [Google Scholar]
  42. Fargana, A.; Arifutzzaman, A. Spreading of the Novel Coronavirus (COVID-19): Mathematical Modeling in Malaysia Perspective. Eur. J. Med. Educ. Technol. 2020, 13, em2002. [Google Scholar]
  43. Garrett, B.L. The Public Interest in Corporate Settlements. SSRN Electron. J. 2017, 58, 1483. [Google Scholar] [CrossRef] [Green Version]
  44. Brodeur, J.; Abram, P.K.; Heimpel, G.E.; Messing, R.H. Trends in biological control: Public interest, international networking and research direction. BioControl 2018, 63, 11–26. [Google Scholar] [CrossRef]
  45. Powell, A. Hacking in the public interest: Authority, legitimacy, means, and ends. New Media Soc. 2016, 18, 600–616. [Google Scholar] [CrossRef] [Green Version]
  46. Sharma, S.; Singh, G.; Pratt, S.; Narayan, J. Exploring consumer behavior to purchase travel online in Fiji and Solomon Islands? An extension pf the Utaut framework. Int. J. Cult. Tour. Hosp. Res. 2020, 15. Available online: https://www.emerald.com/insight/content/doi/10.1108/IJCTHR-03-2020-0064/full/html (accessed on 26 January 2022).
  47. Bakar, A.Y.A.; Ramli, S. Psychosocial support for healthcare frontliners during COVID-19 pandemic in Malaysia. Asian J. Psychiatr. 2020, 54, 102272. [Google Scholar] [CrossRef] [PubMed]
  48. Ezzaouia, I.; Bulchand-Gidumal, J. A Model to Predict Users’ Intentions to Adopt Contact-Tracing Apps for Prevention from COVID-19. In Information and Communication Technologies in Tourism 2021; Springer: Berlin/Heidelberg, Germany, 2021; pp. 543–548. [Google Scholar]
  49. Ganasegeran, K.; Ch’ng, A.S.H.; Looi, I. COVID-19 in Malaysia: Crucial measures in critical times. J. Glob. Health 2020, 10, 020333. [Google Scholar] [CrossRef] [PubMed]
  50. Anglemyer, A.; Moore, T.H.M.; Parker, L.; Chambers, T.; Grady, A.; Chiu, K.; Parry, M.; Wilczynska, M.; Flemyng, E.; Bero, L. Digital contact tracing technologies in epidemics: A rapid review. Cochrane Database Syst. Rev. 2020, 8. Available online: https://pubmed.ncbi.nlm.nih.gov/33502000/ (accessed on 26 January 2022).
  51. Yuan, S.; Ma, W.; Kanthawala, S.; Peng, W. Keep using my health apps: Discover users’ perception of health and fitness apps with the UTAUT2 model. Telemed. e-Health 2015, 21, 735–741. [Google Scholar] [CrossRef] [PubMed]
  52. Wang, H.; Tao, D.; Yu, N.; Qu, X. Understanding consumer acceptance of healthcare wearable devices: An integrated model of UTAUT and TTF. Int. J. Med. Inform. 2020, 139, 104156. [Google Scholar] [CrossRef] [PubMed]
  53. Venkatesh, V.; Morris, M.G.; Davis, G.B.; Davis, F.D. User acceptance of information technology: Toward a unified view. MIS Q. 2003, 27, 425–478. [Google Scholar] [CrossRef] [Green Version]
  54. Seto, E.; Challa, P.; Ware, P. Adoption of COVID-19 Contact Tracing Apps: A Balance Between Privacy and Effectiveness. J. Med. Internet Res. 2021, 23, e25726. [Google Scholar] [CrossRef]
  55. Venkatesh, V.; Thong, J.Y.L.; Xu, X. Consumer acceptance and use of information technology: Extending the unified theory of acceptance and use of technology. MIS Q. 2012, 36, 157–178. [Google Scholar] [CrossRef] [Green Version]
  56. Riemer, K.; Ciriello, R.; Peter, S.; Schlagwein, D. Digital contact-tracing adoption in the COVID-19 pandemic: IT governance for collective action at the societal level. Eur. J. Inf. Syst. 2020, 29, 731–745. [Google Scholar] [CrossRef]
  57. Garousi, V.; Cutting, D.; Felderer, M. Mining user reviews of COVID contact-tracing apps: An exploratory analysis of nine European apps. arXiv 2020, arXiv:2012.13589. [Google Scholar] [CrossRef]
  58. Chowdhury, M.J.M.; Ferdous, M.S.; Biswas, K.; Chowdhury, N.; Muthukkumarasamy, V. COVID-19 Contact Tracing: Challenges and Future Directions. IEEE Access 2020, 8, 225703–225729. [Google Scholar] [CrossRef] [PubMed]
  59. Martin, T.; Karopoulos, G.; Hernández-Ramos, J.L.; Kambourakis, G.; Nai Fovino, I. Demystifying COVID-19 digital contact tracing: A survey on frameworks and mobile apps. Wirel. Commun. Mob. Comput. 2020, 2020, 8851429. [Google Scholar] [CrossRef]
  60. Walrave, M.; Waeterloos, C.; Ponnet, K. Ready or Not for Contact Tracing? Investigating the Adoption Intention of COVID-19 Contact-Tracing Technology Using an Extended Unified Theory of Acceptance and Use of Technology Model. Cyberpsychology Behav. Soc. Netw. 2020, 24, 377–383. [Google Scholar] [CrossRef] [PubMed]
  61. Shahzad, A.; Musa, S.; Aborujilah, A.; Irfan, M. Secure cryptography testbed implementation for scada protocols security. In Proceedings of the 2013 International Conference on Advanced Computer Science Applications and Technologies, Kuching, Malaysia, 23–24 December 2013; IEEE: Piscataway, NJ, USA, 2013; pp. 315–320. Available online: http://ieeexplore.ieee.org/document/6836598 (accessed on 26 January 2022).
  62. Musa, S.; Shahzad, A.; Aborujilah, A. Simulation base implementation for placement of security services in real time environment. In Proceedings of the 7th International Conference on Ubiquitous Information Management and Communication, Kota Kinabalu, Malaysia, 17–19 January 2013. [Google Scholar]
  63. Mat, N.F.C.; Edinur, H.A.; Razab, M.K.A.A.; Safuan, S. A single mass gathering resulted in massive transmission of COVID-19 infections in Malaysia with further international spread. J. Travel Med. 2020. Available online: https://www.ncbi.nlm.nih.gov/pmc/articles/PMC7188142/ (accessed on 26 January 2022).
  64. Pragst, F.; Rothe, M.; Spiegel, K.; Sporkert, F. Illegal and therapeutic drug concentrations in hair segments-a timetable of drug exposure? Forensic Sci. Rev. 1998, 10, 81–111. [Google Scholar]
  65. Kline, T. Psychological Testing: A Practical Approach to Design and Evaluation; Sage: Southend Oaks, CA, USA, 2005; ISBN 1412905443. Available online: https://methods.sagepub.com/book/psychological-testing (accessed on 26 January 2022).
Figure 1. Measurement Model/Outer loading.
Sustainability 14 06811 g001
Figure 2. Structural Model with Path coefficient (R2).
Sustainability 14 06811 g002
Figure 3. Importance–Performance Map Analysis (IPMA).
Sustainability 14 06811 g003
Figure 4. Structural Model with Hypotheses Results (Bootstrapping).
Sustainability 14 06811 g004
Figure 5. Sub-Hypotheses Testing for The Moderating Influence Of (Age) (Algorithm).
Sustainability 14 06811 g005
Figure 6. Hypotheses Results with Standardized Estimates. p * ˂ 0.05; p ** ˂ 0.01; p *** ˂ 0.001.
Sustainability 14 06811 g006
Table 1. The sources and contents of questionnaire questions (Variables Measurement).
Name of Constructs and SourceItems
Independent Variable: UTAUT Factors Affecting the Intention toward MySejahtera App Adoption
Performance Expectancy
[51,53,60]
  • Using the MySejahtera app will increase my understanding of the dangers of COVID-19 infection.
2.
I think the MySejahtera app would be useful for determining my risk of COVID-19 infection.
3.
The MySejahtera app can help to reduce the spread of COVID-19.
4.
I expect MySejahtera app will be my useful life
5.
Using MySejahtera app will enhance my effectiveness
Effort Performance
[51,53,60]
6.
It will be simple for me to learn how to use the MySejahtera app.
7.
Using this MySejahtera app would be simple for me.
8.
I’ll learn quickly how to use the MySejahtera app.
9.
I expect MySejahtera app to be easy to use
10.
I believe that my contact with the MySejahtera app will be straightforward and understandable.
Social Influence
[51,60]
11.
People who are important in my life will advise me to use the MySejahtera app.
12.
People who have influence over me will recommend that I use the MySejahtera app.
13.
People whose opinions I value will advise me to use the MySejahtera app.
14.
People that have an influence on my conduct believe that I should use the MySejahtera app.
Facilitating conditions [51,60]
15.
I understand how to use the MySejahtera app.
16.
I have the capabilities to use the MySejahtera app.
17.
The MySejahtera app will be compatible with other smartphone technologies I use.
18.
The MySejahtera app will operate even if I do not have internet access on my phone.
App-Related Privacy Concerns
[33,51,60]
19.
I’d be concerned about my personal privacy if I used the MySejahtera app.
20.
I may feel that my privacy is being compromised when I use the MySejahtera app
21.
Using the MySejahtera app would make me feel uncomfortable concerning the protection of my privacy
22.
I would be concerned about my privacy if I were to use the MySejahtera app
Dependent Variable: The Intention toward MySejahtera app adoption
Intention toward MySejahtera app adoption
[33,51,60]
  • I would be willing to use the MySejahtera app
2.
I plan to use the MySejahtera app
3.
The benefits of the using MySejahtera app are apparent in society.
4.
I opine using MySejahtera app will be a necessity shortly.
5.
I want to use the MySejahtera app in the future
6.
I will recommend others to use the MySejahtera app
Table 2. Summary of Data Collection and Response Rate.
ResponsesTotal
Distributed questionnaires223
Unreturned questionnaires73
Returned questionnaires150
Usable questionnaires150
Response rate67%
Table 3. Respondent Distribution by Demographic Characteristics (n = 150).
VariablesCategoryn%
GenderMale5536
Female9563
Ageless than 20 years4530
20–303724.7
31–403926
41–50117.3
More than 501812
Education levelHigh school138.7
Diploma1510
Bachelor5134
Master4731.3
PhD2214.7
Use of MySejahtera applicationDo not know this app21.3
Know but not using42.7
Use it14496
Using period of MySejahtera3 Months128
6 Months3322
9 Months10570
Table 4. Summaries of the explained variance of extracted factors.
Name of Component Initial EigenvaluesRotation Sum of Square Loading
CodeTotal% of VarianceCumulativeTotal% of VarianceCumulative
F1Adoption of MySejahteraADOP12.48846.25246.2524.71017.44317.443
F2Social InfluenceSI2.6189.69555.9473.57913.25430.697
F3App-related privacy concernAPP2.2608.37264.3193.49512.94643.643
F4Facilities ConditionFC1.8236.75371.0723.37712.50756.150
F5Performance ExpectancyPE1.4985.54776.6203.36212.45168.601
F6Effort ExpectancyEE1.0503.88980.5093.21511.90780.509
Table 5. Summarizes the items that were excluded from the exploratory factor analysis (EFA).
Variables The Original Number of ItemsNo. of Items DroppedFinal EFA Number of ItemsDescriptions of Items Dropped
Adoption of MySejahteraADOP6-6
Performance ExpectancyPE514PE5
Effort ExpectancyEE514EE5
Social InfluenceSI4-4-
Facilities ConditionFC5-6-
App-related privacy concernAPP4-4-
Total 29227
Table 6. Factor Loading for Items.
123456
ADOP40.806
ADOP10.795
ADOP20.794
ADOP30.762
ADOP60.613
ADOP50.575
SI1 0.862
SI4 0.859
SI3 0.849
SI2 0.825
APP2 0.851
APP1 0.837
APP4 0.821
APP3 0.798
FC2 0.842
FC4 0.815
FC3 0.809
FC1 0.721
FC5 0.758
PE2 0.842
PE3 0.824
PE4 0.824
PE1 0.787
EE2 0.826
EE1 0.798
EE3 0.775
EE4 0.754
Table 7. Items loading, Cronbach’s alpha, Composite Reliability (CR), and AVE.
Variables LoadingCronbach’s AlphaCRAVE
Adoption of MySejahteraADOP10.8240.8950.9200.657
ADOP20.849
ADOP30.850
ADOP40.852
ADOP50.721
ADOP60.759
Performance ExpectancyPE10.9070.9270.9480.821
PE20.924
PE30.898
PE40.895
Effort ExpectancyEE10.9190.9400.9570.847
EE20.918
EE30.911
EE40.934
Social InfluenceSI10.9410.9370.9550.842
SI20.883
SI30.932
SI40.914
Facilities ConditionFC10.8680.8970.9220.705
FC20.875
FC30.865
FC40.875
FC50.699
App-related privacy concernAPP10.9330.9360.9540.838
APP20.911
APP30.913
APP40.905
Table 8. Discriminant Validity (Fornell and Larcker, 1981) for Latent Variables.
AVEADOPAPPEEFCPESI
ADOP0.6570.811
APP0.8380.4560.916
EE0.8470.5810.5000.920
FC0.7050.6950.6350.6500.839
PE0.8210.5480.4560.4140.6050.906
SI0.8420.4600.4260.5410.4310.3820.918
Note: ADOP: Adoption of MySejahtera, PE: Performance Expectancy, EE: Effort Expectancy, SI: Social Influence, FC: Facilities Condition, APP: App-related privacy concern.
Table 9. Coefficient of determination result R².
Exogenous ConstructEndogenous ConstructHair et al., (2017)Cohen, (1988b)Chin (1998)
PE, EE, FC, SI, and APPADOP0.547ModeratesubstantialModerate
Note: ADOP: Adoption of MySejahtera, PE: Performance Expectancy, EE: Effort Expectancy, SI: Social Influence, FC: Facilities Condition, APP: App-related privacy concern.
Table 10. Effect Size of predictive Variables.
VariableEffect Size (fz)
Adoption of MySejahteraRating
Performance Expectancy0.043Small
Effort Expectancy0.031Small
Social Influence0.023Small
Facilities Condition0.173Medium
App-related privacy concern0.003Non
Table 11. Construct Cross-validated Redundancy.
VariablesSSOSSEQ² (= 1 − SSE/SSO)
Adoption of MySejahtera900.000447.4930.503
Performance Expectancy600.000216.0870.640
Effort Expectancy600.000195.0490.675
Social Influence750.000358.3410.522
Facilities Condition600.000198.5280.669
App-related privacy concern600.000202.8320.662
Table 12. Collinearity Test Collinearity Test (VIF).
VIF
ItemOuter VIF ItemOuter VIFInner VIF
ADOP12.661 FC13.6112.661
ADOP22.568FC24.481
ADOP32.805FC34.232
ADOP42.751FC44.248
ADOP51.886FC51.247
ADOP61.990PE13.3261.638
APP14.4831.782PE24.036
APP23.671PE33.418
APP33.455PE43.402
APP43.233SI14.3961.518
EE13.6592.039SI22.946
EE23.795SI34.948
EE33.643SI43.464
EE44.336
Table 13. Cross-loading for items.
ADOPAPPEEFCPESI
ADOP10.8240.3720.4500.5510.4220.389
ADOP20.8490.3210.4840.5470.4670.391
ADOP30.8500.3960.5440.5800.4420.473
ADOP40.8520.3450.4300.5720.4750.413
ADOP50.7210.3840.4220.5670.4120.272
ADOP60.7590.4030.4880.5630.4480.282
APP10.4160.9330.4480.6160.4420.411
APP20.3960.9110.4240.5440.3680.375
APP30.4450.9130.5130.5750.4410.389
APP40.4110.9050.4400.5880.4160.385
EE10.5460.4550.9190.5780.4070.496
EE20.5250.4280.9180.5260.3790.497
EE30.4890.4960.9110.6400.3410.447
EE40.5730.4650.9340.6500.3920.545
FC10.5130.5740.5650.8680.5670.327
FC20.4730.4820.5330.8750.4990.251
FC30.4460.5850.5150.8650.4850.312
FC40.4720.5780.5220.8750.4640.334
FC50.6930.4390.5300.6990.4750.467
PE10.5230.4520.4440.5650.9070.436
PE20.5380.3810.3380.5440.9240.288
PE30.4610.4200.3730.5660.8980.285
PE40.4560.4030.3420.5190.8950.374
SI10.4380.4420.4950.4230.4050.941
SI20.3770.3220.4680.3260.3460.883
SI30.4370.4490.5210.4110.3370.932
SI40.4310.3430.5000.4140.3130.914
Table 14. Model fit summary.
Saturated ModelEstimated Model
SRMR0.0730.073
d_ULS2.0052.005
d_G0.9560.956
Chi-Square754.487754.487
NFI0.8150.815
Table 15. IPMA Results.
VariablesAdoption of MySejahtera
ImportancePerformance
Performance Expectancy0.10748.871
Effort Expectancy0.11153.851
Social Influence0.10351.981
Facilities Condition0.35949.847
App-related privacy concern−0.03649.729
Note: Importance = total effects of the structural model, Performance = average values of latent variable scores (Hair Jr et al., 2013).
Table 16. Summary of Structural Model Assessment Hypotheses.
HRelationsOriginal Sample (O)Sample Mean (M)Standard Deviation (STDEV)T Statistics (|O/STDEV|)p ValuesResult
H1PE → ADOP0.1780.1730.0802.2180.028Supprted
H2EE → ADOP0.1680.1720.0762.2140.028Supprted
H3SI → ADOP0.1260.1210.0572.2220.027Supprted
H4FC → ADOP0.4570.4610.0805.7410.000Supprted
H5APP → ADOP−0.053−0.0480.0670.7880.432Not Supported
Table 17. Result of Sub-Hypotheses Testing for Moderating Effect (Age).
HRelationsOriginal Sample (O)Sample Mean (M)Standard Deviation (STDEV)T Statistics (|O/STDEV|)p Values
H6AGE*PE → ADOP0.1410.1300.0791.7710.038
H7AGE*EE → ADOP0.1460.1500.0821.7760.036
H8AGE*SI → ADOP−0.142−0.1420.0712.0080.022
H9AGE*FC → ADOP−0.202−0.1990.1002.0230.021
H10AGE*APP → ADOP−0.006−0.0060.0720.0820.467
Note: * shows the level of significance i.e., p Value < 0.05, t-value at 1% sig. level is 1.645 (Ramayah, et al. 2017; Hair et al., 2018).
Table 18. Summary of the Results.
VariablesMain-Hypotheses
with ADOP
Sub-Hypotheses
Moderating Effect
Hyp.ResultHyp.Result
Performance ExpectancyH1H6
Effort ExpectancyH2H7
Social InfluenceH3H8
Facilities ConditionH4H9
App-related privacy concernH5XH10X
Note: Total hypotheses = 10, Supported = 8, Not supported.
Publisher’s Note: MDPI stays neutral with regard to jurisdictional claims in published maps and institutional affiliations.

