Article

Changes of Bioclimatic Conditions in the Kłodzko Region (SW Poland)

1
Department of Environmental Protection and Development, Wroclaw University of Environmental and Life Science, UPWR, 50-375 Wrocław, Poland
2
Hydraulic Platform LCH, IIC, ENAC, EPFL, CH-1015 Lausanne, Switzerland
3
Institute for Infrastructure and Environment, School of Engineering, The University of Edinburgh, Edinburgh EH8 9YL, UK
4
Polish Geophysical Society, 50-363 Wrocław, Poland
*
Author to whom correspondence should be addressed.
Sustainability 2022, 14(11), 6770; https://doi.org/10.3390/su14116770
Submission received: 12 April 2022 / Revised: 19 May 2022 / Accepted: 30 May 2022 / Published: 1 June 2022
(This article belongs to the Special Issue Sustainable Cities and Regions – Statistical Approaches)

Abstract

:
Despite continuous technological development, lack of data or discontinuity in meteorological measurements is still an issue affecting many stations. This study was devoted to determining the bioclimatic conditions in the Kłodzko region (SW Poland), where meteorological measurements have been discontinuous since 2006. Four stations with continuous measurements were analyzed. These localities are situated at Kłodzko and its health resorts. Bioclimatic conditions were determined using the Universal Thermal Climate Index (UTCI). The study of variability in UTCI was performed in different circulation epochs. Additionally, a non-linear model for SW Poland was used to reconstruct the long-term trend of air temperature in the Kłodzko region. Verification of this model was performed on the basis of own air temperature measurements in the period from April 2017 to March 2022. Analysis of thermal conditions in circulation phases showed higher air temperatures and UTCI values in epoch W (1989–present) compared to epoch E (1966–1988) at all analyzed stations. The non-linear model of meteorological data showed its applicability for data reconstruction in the region with an accuracy of about 67%. Further modification of the model may serve to increase its applicability to other locations in Europe or North America.

1. Introduction

Bioclimatic analyses of health resorts districts are among the information included in the Polish health resort inventory. In addition, such analyses find application in determining the tourism potential of a region [1,2,3], the impact of environmental conditions on human health [4,5,6], and determining extreme conditions on regional mortality gain [7,8], military activities [9], or socioeconomic endeavors [10]. Bioclimatic conditions are determined by various indicators. In the process of continuous improvement to measure the meteorological impact on the human body, more than 200 biometeorological indicators have been invented, whose differences in structure and application can be found in the review article of de Freitas and Grigorieva [11]. Depending on the complexity, de Freitas and Grigorieva divided them into eight groups that characterize differences between bioclimatic indexes: (A) simulation device for integrated measurement such as globe thermometer temperature, Tg [12]; (B) basic single-parametric indices such as wet bulb temperature, Twb [13] or saturation deficit [14] which rely more on determining detailed meteorological conditions than on ascertaining the impact on the human body; (C) algebraic or statistical model based on statistical models such as the humidex [15], insulation predicted index or Icpl [16]; (D) proxy thermal strain index, e.g., cold strain index, CSI [17]; (E) proxy thermal stress index, e.g., comfort index, CI [18]; (F) energy balance strain index, e.g., physiological subjective temperature [19]; (G) energy balance stress index that takes into account the exchange of thermal energy between humans and weather conditions, such as the Universal Thermal Climate Index, UTCI [20] or physiological equivalent temperature, PET [21]; (H) special purpose index with narrow utility such as heat tolerance index [22] to analyze reactions of the human body only in extreme conditions.
A detailed analysis of bioclimatic conditions in 43 health resorts in Poland for the period 1970–1990 was carried out by Kozłowska-Szczęsna et al. [2]. The characterization of bioclimatic conditions was performed with a uniform method for all 43 health resorts. According to the administrative report from 2002, in Dolnośląskie voivodship (a bigger administrative area in which Kłodzko region is located), 11 health resort statuses were granted at that time, 5 of which were situated in the Kłodzko region. These were Długopole-Zdrój, Duszniki-Zdrój, Polanica-Zdrój, Lądek-Zdrój, and Kudowa-Zdrój [2]. Currently, the health resort status is granted to the area of the district where five cities maintain their health resort status (i.e., Bystrzyca Kłodzka, Duszniki-Zdrój, Polanica-Zdrój, Lądek-Zdrój, and Kudowa-Zdrój).
Currently the only synoptic station in the Kłodzko region is Kłodzko. Two climate stations in Słoszów and Lądek-Zdrój were decommissioned in 2006, while the station in Długopole-Zdrój was decommissioned in 2014 (Figure 1). Monitoring environmental changes is not only important for maintaining the tourism potential of the region [23], but also to plan further actions for the increasing effects of climate change [24,25]. The causes of change are due to both human activities and greenhouse gas emissions [26] as well as macrocirculation phenomena such as the North Atlantic oscillation (NAO), Atlantic multidecadal oscillation (AMO), Arctic oscillation (AO), or the Scandinavia SCAND [27,28,29,30,31,32,33,34]. The Kłodzko region, as part of the Sudety massif, is additionally an area in which dynamic meteorological phenomena such as fen activity occur locally, which is typical for mountain areas. Fen phenomena due to their diversity still pose a challenge today in terms of forecasting and modeling [35,36].
This paper focuses on the use of bioclimatic indicators to determine bioclimatic changes in the area of Kłodzko for the period 1966–2020 based on measurement series conducted by the Polish MetOffice (Institute of Meteorology and Water Management—IMGW). The following measurement series were analyzed: 1980–2006 for the climate station in Słoszów and Lądek-Zdrój; 1980–2014 for climate station Długopole-Zdrój; and the synoptic station in Kłodzko (1966–2020). Bioclimatic conditions of the Kłodzko region were determined using the Universal Thermal Climate Index (UTCI). The UTCI index was selected based on a recommendation of the World Meteorological Organization (WMO), which was promoted during the meeting in April 2009 [37]. For more than 10 years this index has been tested by scientists from Poland and abroad confirming its applicability for different climatic conditions [8,38,39,40].
Air temperature data reconstruction was made via methods for non-stationary time series. Typical dynamics of climatic data at all scales and over the period of available measurements is considered as evidence of changes occurring in the Anthropocene [41]. This includes the long-term trend component, which in this paper is considered as a deterministic factor [28,30,42]. Additionally, climatic data can be decomposed by separating the (almost deterministic) seasonal and the stochastic components [43]. Stochastic-deterministic models constitute a good compromise between full deterministic precise but very time consuming modeling, and stochastic quick but wide margin of error approach [30,43]. This combination offers an opportunity to model or reconstruct the data to achieve mid-range forecasts. Stochastic modeling often requires large datasets to be performing [43] at time scales where the deterministic approach is not effective [44].
The novelty of this study is to apply a non-linear deterministic approach in combination with stochastic modelling in order to reconstruct climate change dynamics on the time series measured in the health resort cities of the Kłodzko region. The stochastic-deterministic model that reconstructs the temporal dynamics was developed on the basis of historical data from meteorological stations in Lower Silesia [28,33,45]. Eventually, the paper shows how bioclimatic conditions are affected by meso-tropospheric circulation that occurs in the northern hemisphere, which is in turn affected by climate changes.
The reconstruction results were verified on the basis of meteorological measurements conducted in Słoszów and Długopole-Zdrój over the five years period ranging from April 2017 to March 2022.

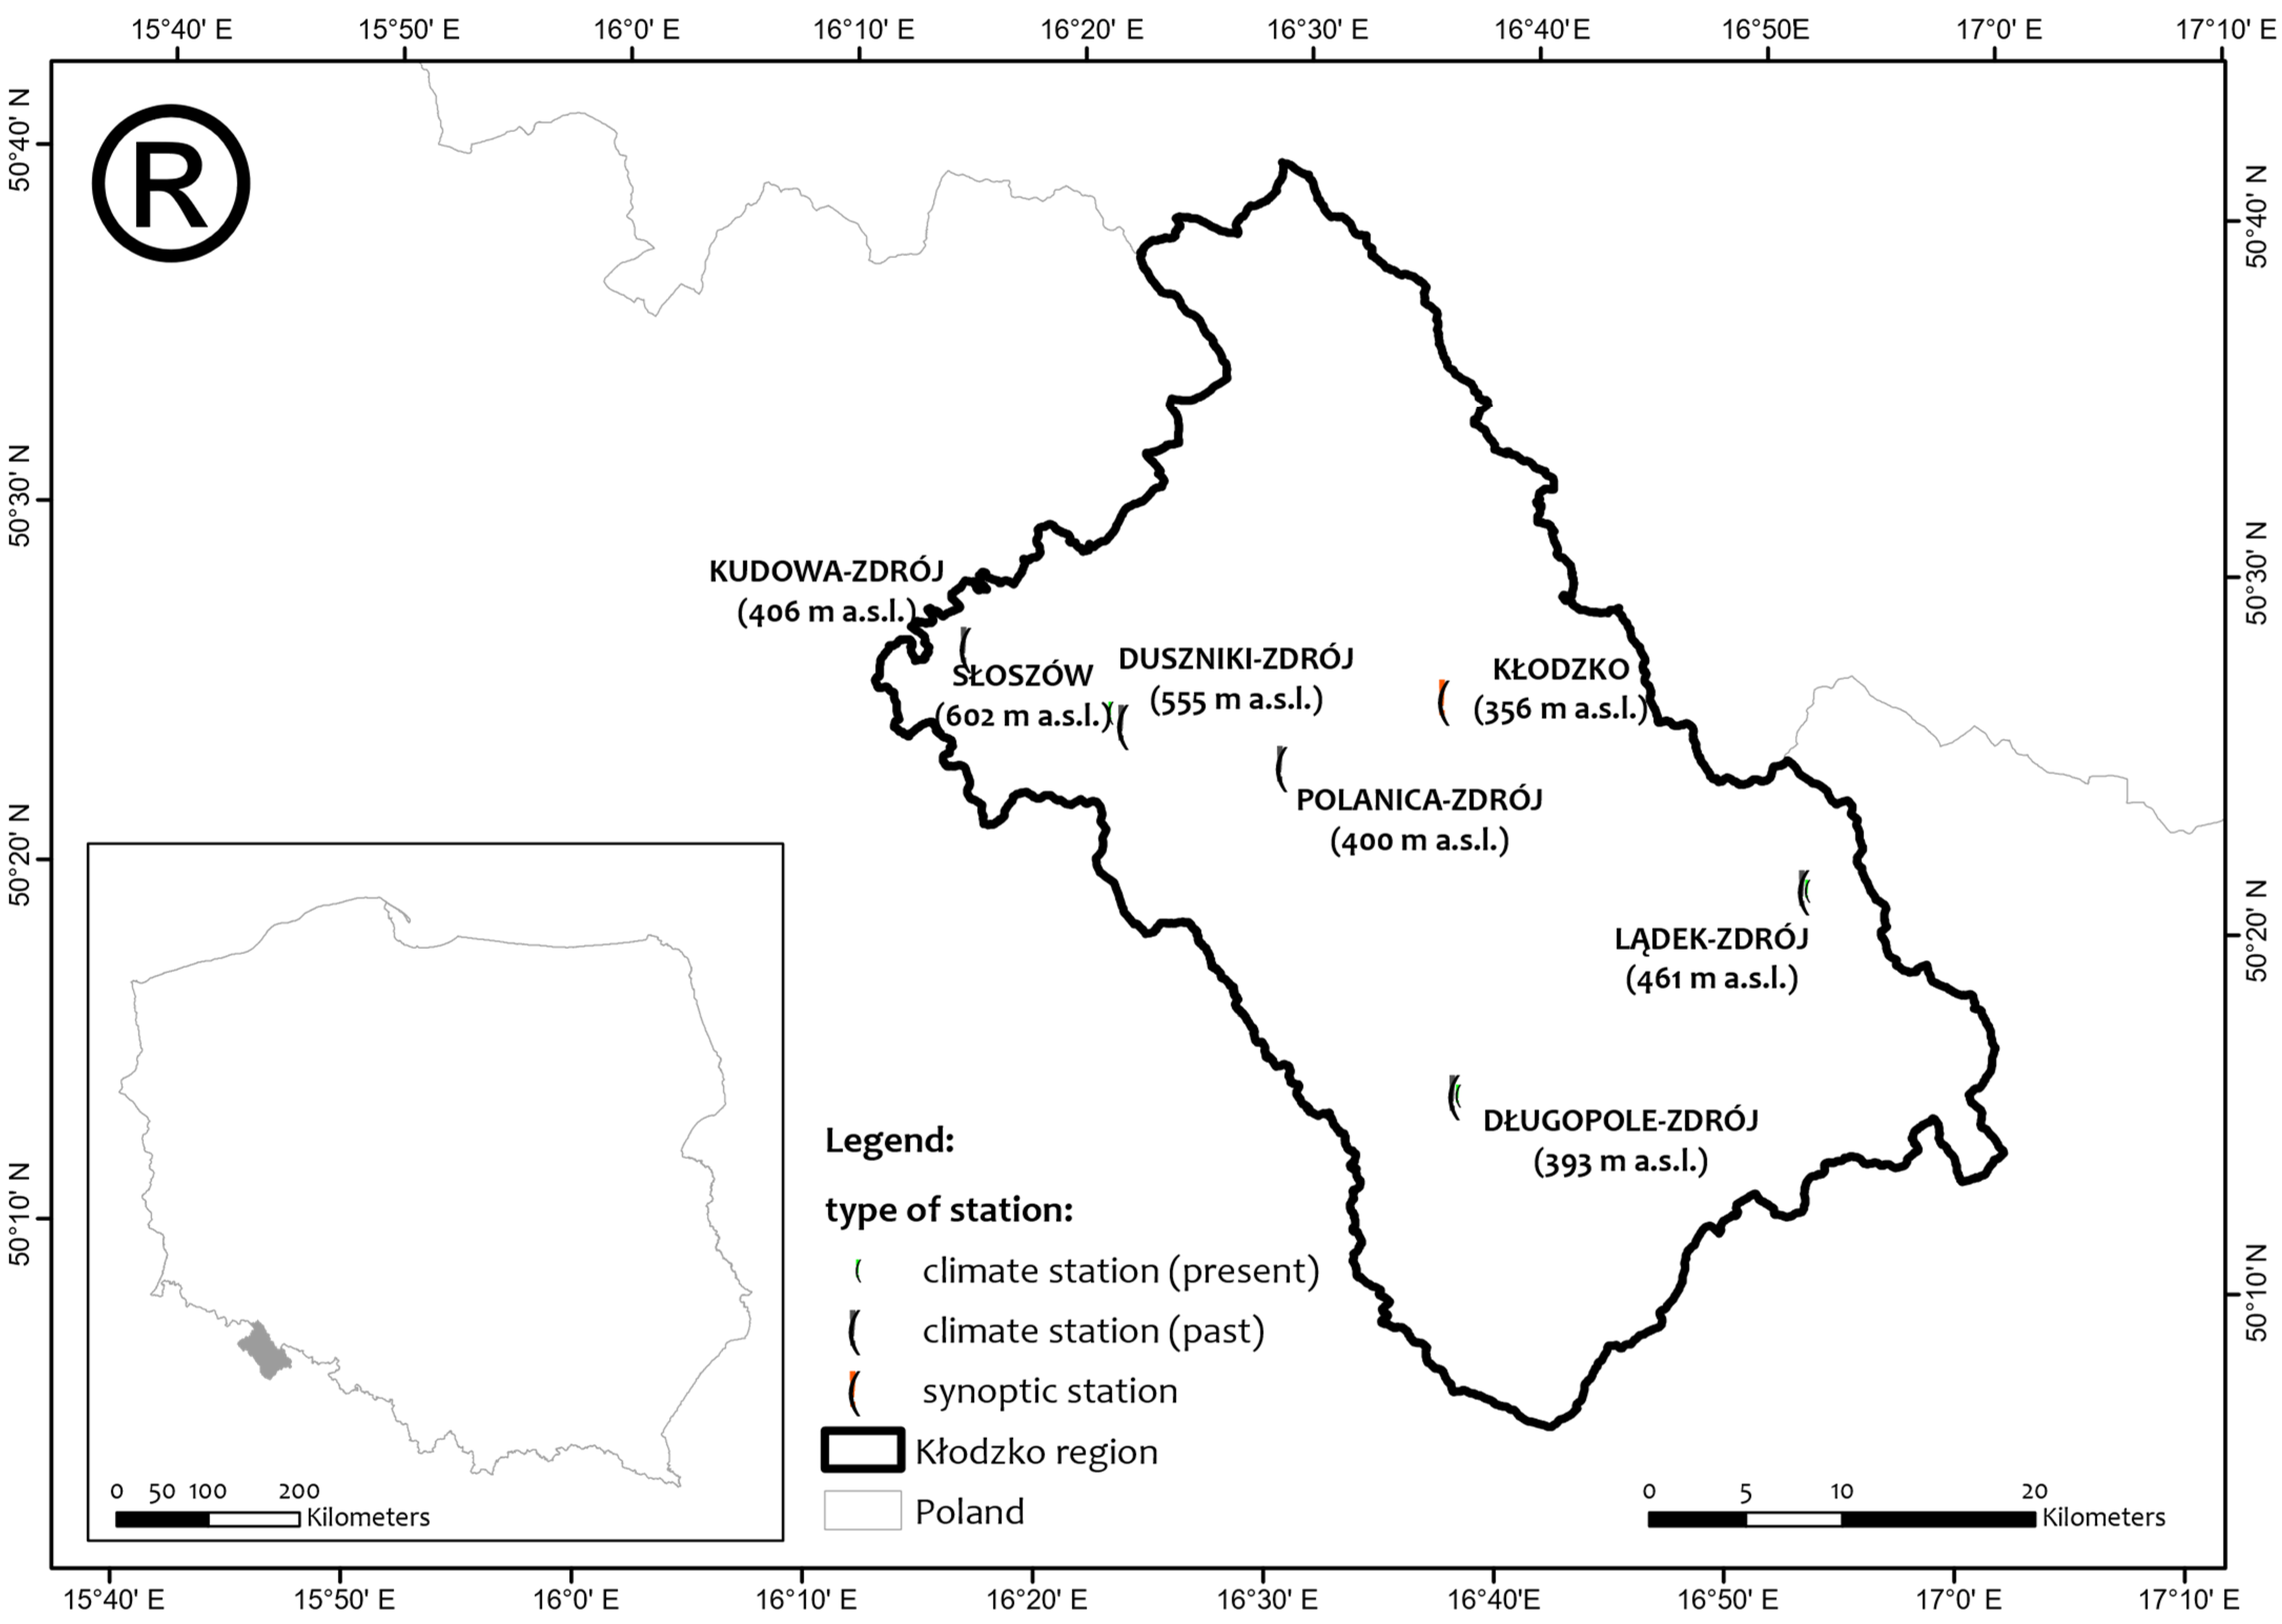
2. Materials and Methods

The Kłodzko region is located in the southern part of the Lower Silesia voivodship and is limited from the west by the Central Sudetes and from the southeast by the East Sudetes. The altitudinal diversity of the area ranges from 240 m a.s.l. in the northern part to the highest peak in the East Sudety–Śnieżnik mountain 1423 m a.s.l. (Figure 1). All the health resorts were in the VI bioclimatic region (“submontane and mountain”) and characterized by a moderately stimulating and periodically strongly stimulating climate, with the exception of the Duszniki-Zdrój municipality which was characterized by a strongly stimulating and periodically moderately stimulating climate [2,46]. The size of the health resorts vary from 568 inhabitants in Długopole-Zdrój, which is the only village in the analyzed area, to almost 10,000 inhabitants in Kudowa-Zdrój.
Data provided by the Institute of Meteorology and Water Management (IMGW) cover the period 1980 to June 2014 for the Długopole-Zdrój station and the period 1980–2006 for Słoszów and Lądek-Zdrój stations. These stations have the status of climatic stations. Stations such as Kudowa-Zdrój or Polanica-Zdrój do not have archival data in the IMGW repository. The synoptic station in Kłodzko has complete meteorological records for the years 1966–2020. Access to the data was obtained using the climate tool of the R software environment [47,48]. Meteorological stations in health resort districts have the status of climate stations and measure wind speed and direction, air temperature, cloud cover, humidity, and precipitation. The synoptic station in Kłodzko meets WMO standards [49] and can be treated as a reference station for the whole region in the context of multiannual changes in the bioclimate of Kłodzko Land [45]. From April 2017 to March 2022, the author additionally conducted temperature and humidity measurements using HOBO U23 sensors. Data from 12 GMT were used to determine the bioclimatological conditions [50].

2.1. Bioclimatic Indexes

Indices such as UTCI require calculation of the components of the heat balance equation. The general human heat balance equation reads as follows:
M + Q + C + E + R e s + K d = S
where: M is metabolic heat production (both during rest and physical activity), Q is human absorbed solar radiation, C is turbulent sensible heat transfer (convection), E is turbulent latent heat transfer through evaporation (evaporation), Res is heat loss due to respiration, S is heat transfer balance. All heat fluxes are expressed in W∙m−2. Heat conductivity (Kd) with the ground is not included in the model due to negligible values. Components of heat balance between humans and the environment were determined according to equations described in MENEX [51]. Due to the application character of this work, the equations of human heat balance components will not be described in detail. Detailed descriptions can be found in the work of Błażejczyk [51].

2.2. Universal Thermal Climate Index (UTCI)

The UTCI is a function of air temperature Ta (°C), wind speed v (m⋅s−1), water vapor pressure e (hPa), and mean radiant temperature Tmrt (°C) [52]:
U T C I = f ( T a , v , e , T m r t )
The mean radiant temperature was also calculated using Bioklima 2.6 software [53] as in the following formula:
T m r t = ( R I r c + 0.5 L g + 0.5   L a   s h · σ ) 0.25 273
where R is the absorbed solar radiation by the human body (W⋅m−2), Irc is the coefficient reducing convective and radiative heat transfer through clothing, Lg is the ground radiation (W⋅m− 2), La is the atmosphere’s back radiation (W⋅m−2), sh is the emissivity coefficient for humans (0.95), and σ is the Stefan–Boltzmann constant (5.667⋅10− 8 W⋅m−2⋅K−4). The absorbed solar radiation (R) was calculated using the SolAlt model based on cloudiness (n [%]) and position of the sun (hSl [°]). The detailed formulas have been reported by Błażejczyk [51].
The scale of thermal stress was taken from the physiological model and is presented in Table 1. The range of limiting conditions in order for UTCI to be applicable is as follows: wind speed between 0.5 and 20 m⋅s− 1 [39], air temperature from −50 to 50 °C, mean radiant temperature and air temperature difference (TmrtTa) should be from −30 to 70 °C, and relative humidity needs to be higher than 5% [54]. In the analysis presented here, only wind speeds that exceeded assumptions are presented above. There were 3261 observations in which the wind speed did not exceed 0.5 m⋅s− 1 (6%). For these values, measurements were set to the lower limiting condition of 0.5 m⋅s−1 [39]. For other limiting conditions such as high wind speed, air temperature limits, and differences between mean radiant temperature and air temperature (TmrtTa), no values exceeded the assumptions.

2.3. Nonlinear Reconstruction of Historical Time Series and Validation with Current Meteorological Measurements

Reconstruction of the missing air temperature data for Słoszów and Długopole-Zdrój, where additional air temperature measurements were conducted, was based on the previous work performed in the Lower Silesia region [28,45]. In general, time series x(t) can be described as follows:
x ( t ) = x s ( t ) + x f ( t )
where x s ( t ) is the long-term trend (slow component), whereas the fast component, x f ( t ) , may contain yearly seasonal variability, x f s ( t )   a n d correlated noise fluctuations x f c ( t ) , so that the original data can be further described as:
x ( t ) = x s ( t ) + x f ( t ) = x s ( t ) + x f s ( t ) + x f c ( t )
The seasonal variability x f s ( t ) can be very well described by monthly average multi-year values and in order to determine the monthly fluctuations x f c ( t ) , it has to be decomposed from the original time series along with the long-term trend. After standardization the correlated monthly fluctuations of x f c ( t ) can be obtained using linear stochastic models, e.g., autoregressive AR(p) [43,45,55]:
x f c ( t ) = j = 1 p ϕ j ( x f c ( t j ) μ ) + ε t
with p being the autoregressive parameters ϕ(1), … ϕ(p), while the noise ε t is an uncorrelated Gaussian process with zero mean and unit variance [55].
The multi-year trend of x s ( t ) using a 3-dimensional autonomous system of ordinary differential equations (ODEs) based on 117 years of data for Wroclaw (1891–2007) has been presented in previous papers by Bryś and Bryś [56,57] and Głogowski et al. [28]. The autonomous system of differential equations (Equation (7)) used in the work of Głogowski et al. [28] was used to perform a nonlinear time series reconstruction to fill in the missing measurement history for the health resorts and the model coefficients are presented in Table 2:
{ x ˙ = c 1 , 1 + c 1 , 2 x + c 1 , 3 y + c 1 , 4 z + ... + c 1 , 10 z 3 y ˙ = c 2 , 1 + c 2 , 2 x + c 2 , 3 y + c 2 , 4 z + ... + c 2 , 10 z 3 z ˙ = c 3 , 1 + c 3 , 2 x + c 3 , 3 y + c 3 , 4 z + ... + c 3 , 10 z 3
Validation of the time series reconstruction was performed on the basis of HOBO U23 sensor measurements from 2017 to 2022. Reconstruction of air temperature trend for these stations was performed on the basis of column x ˙ , whose coefficients fill the equation x ˙ that corresponds to air temperature.

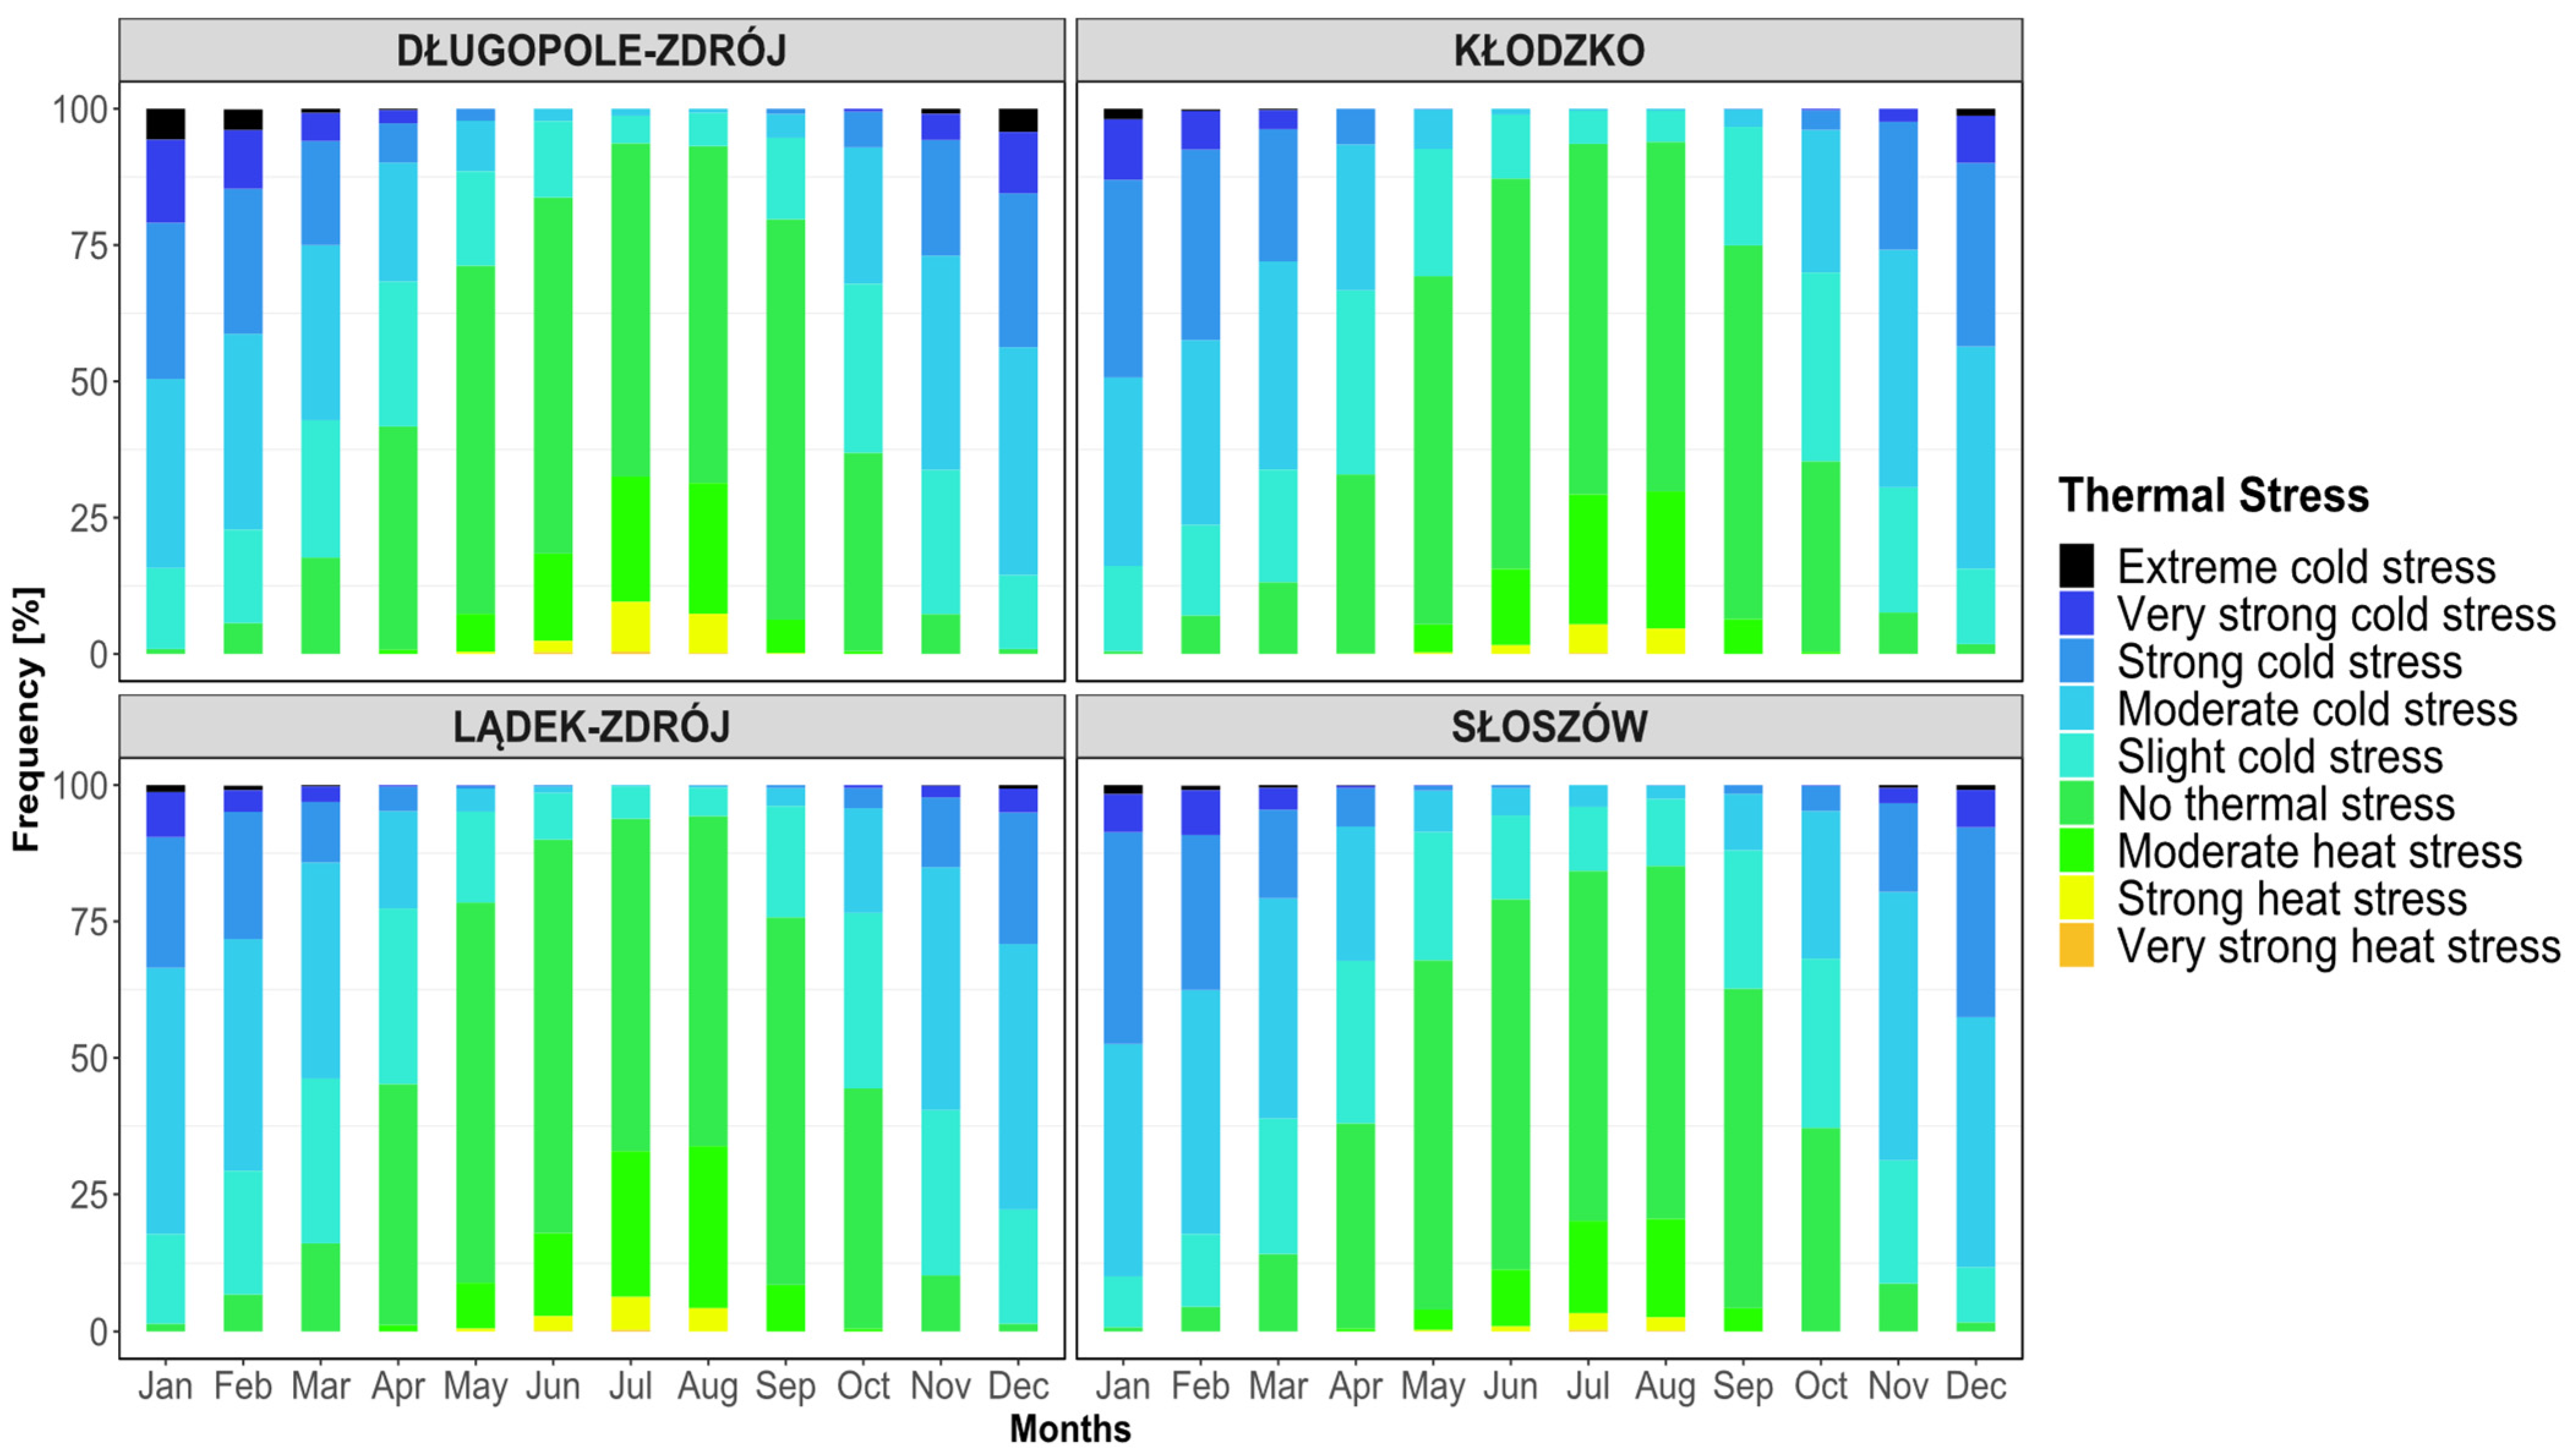
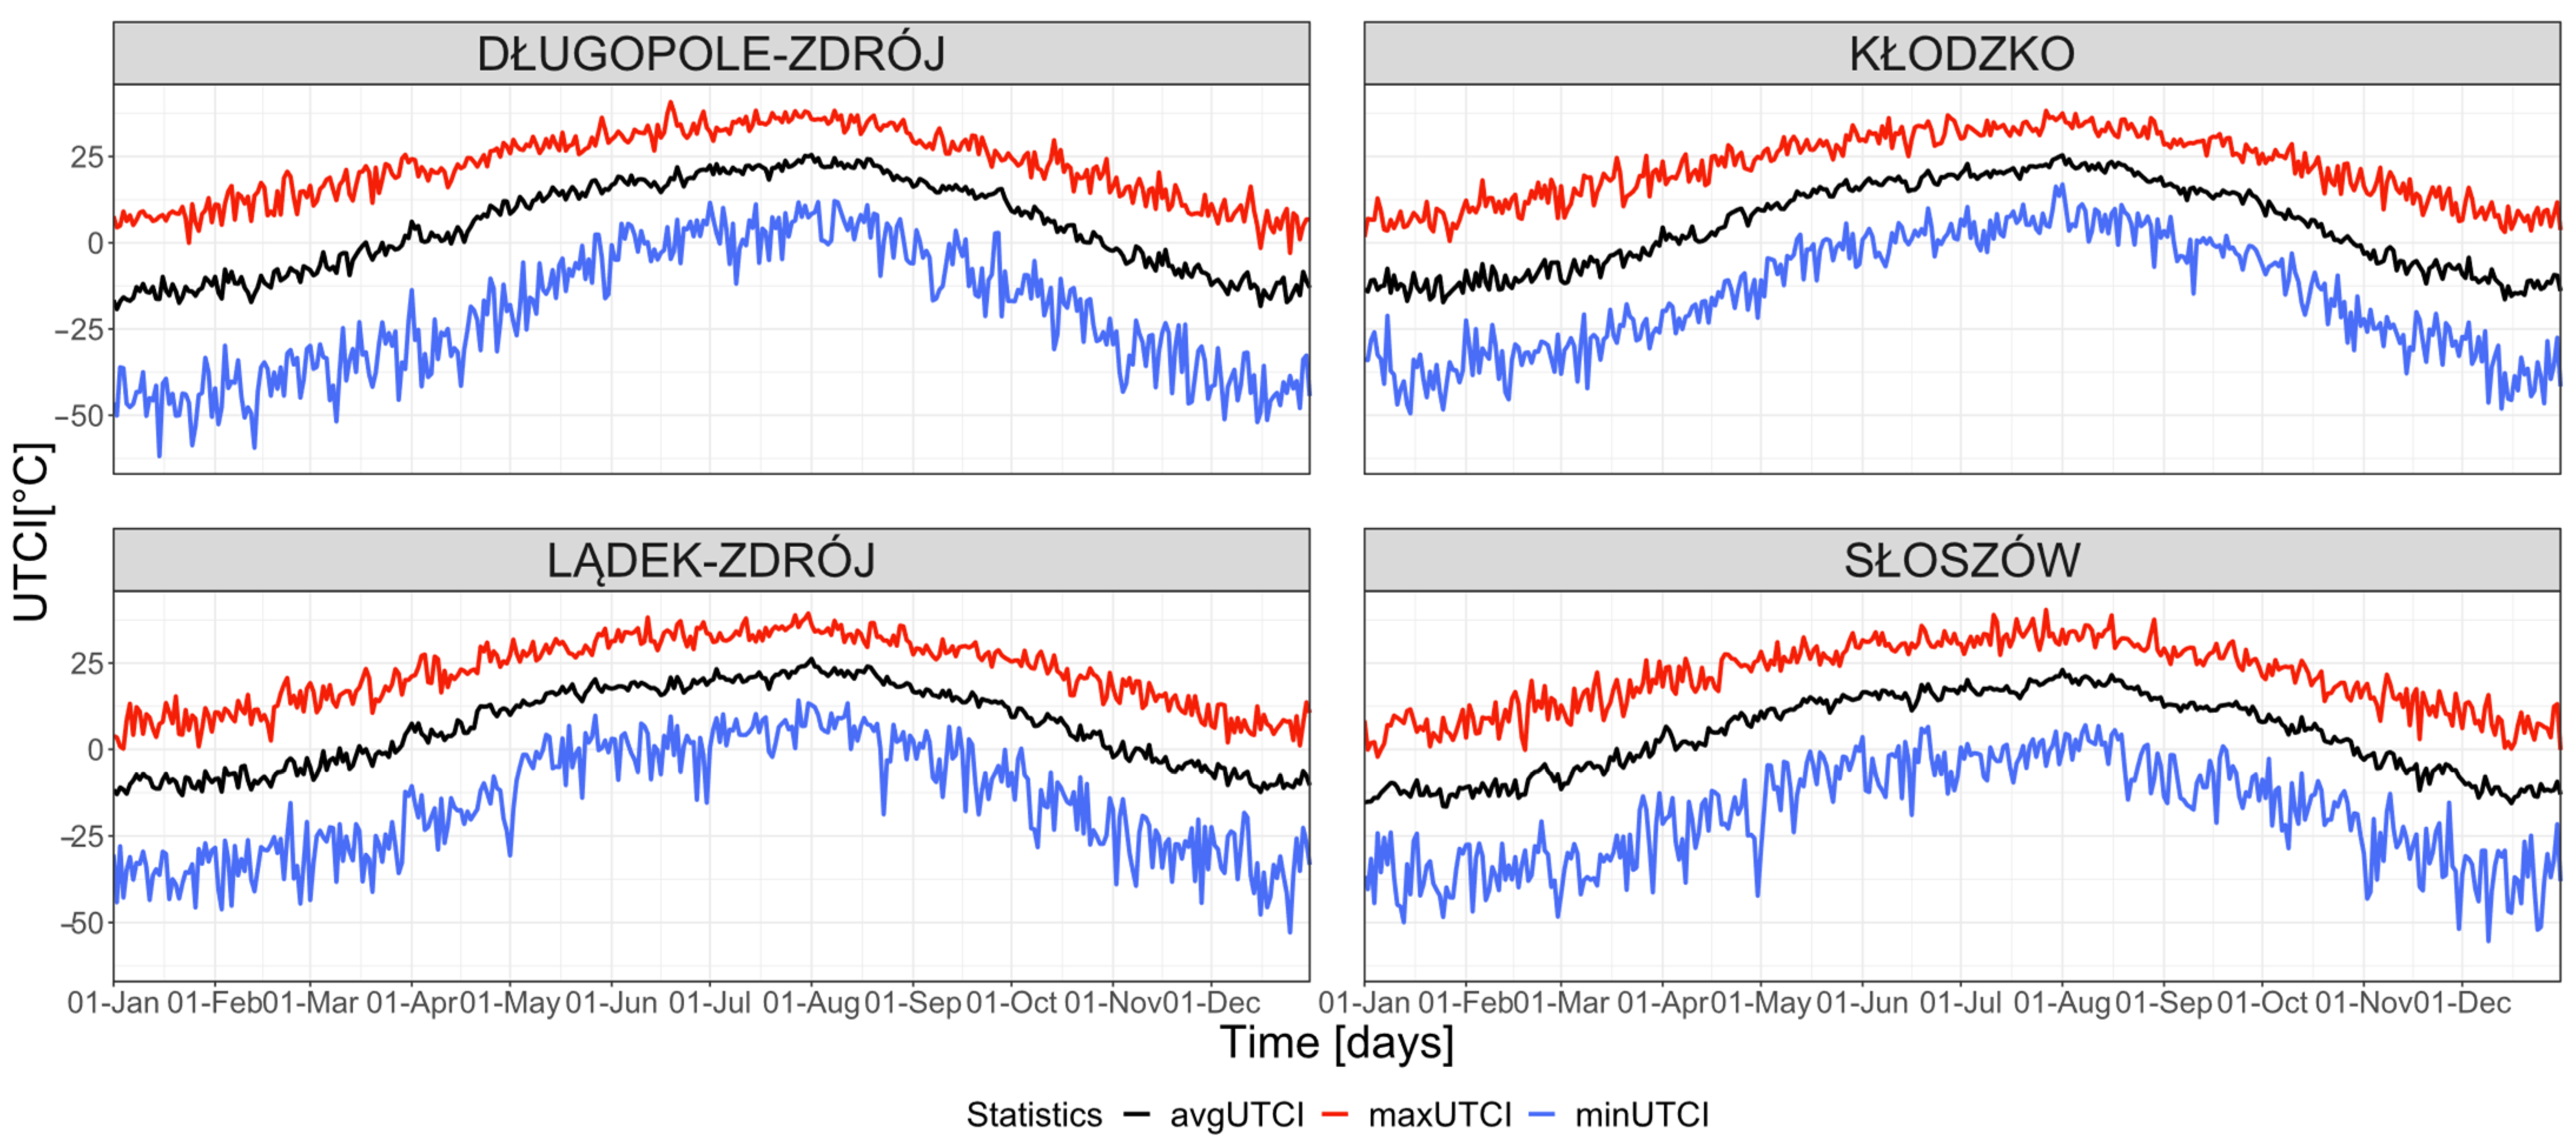
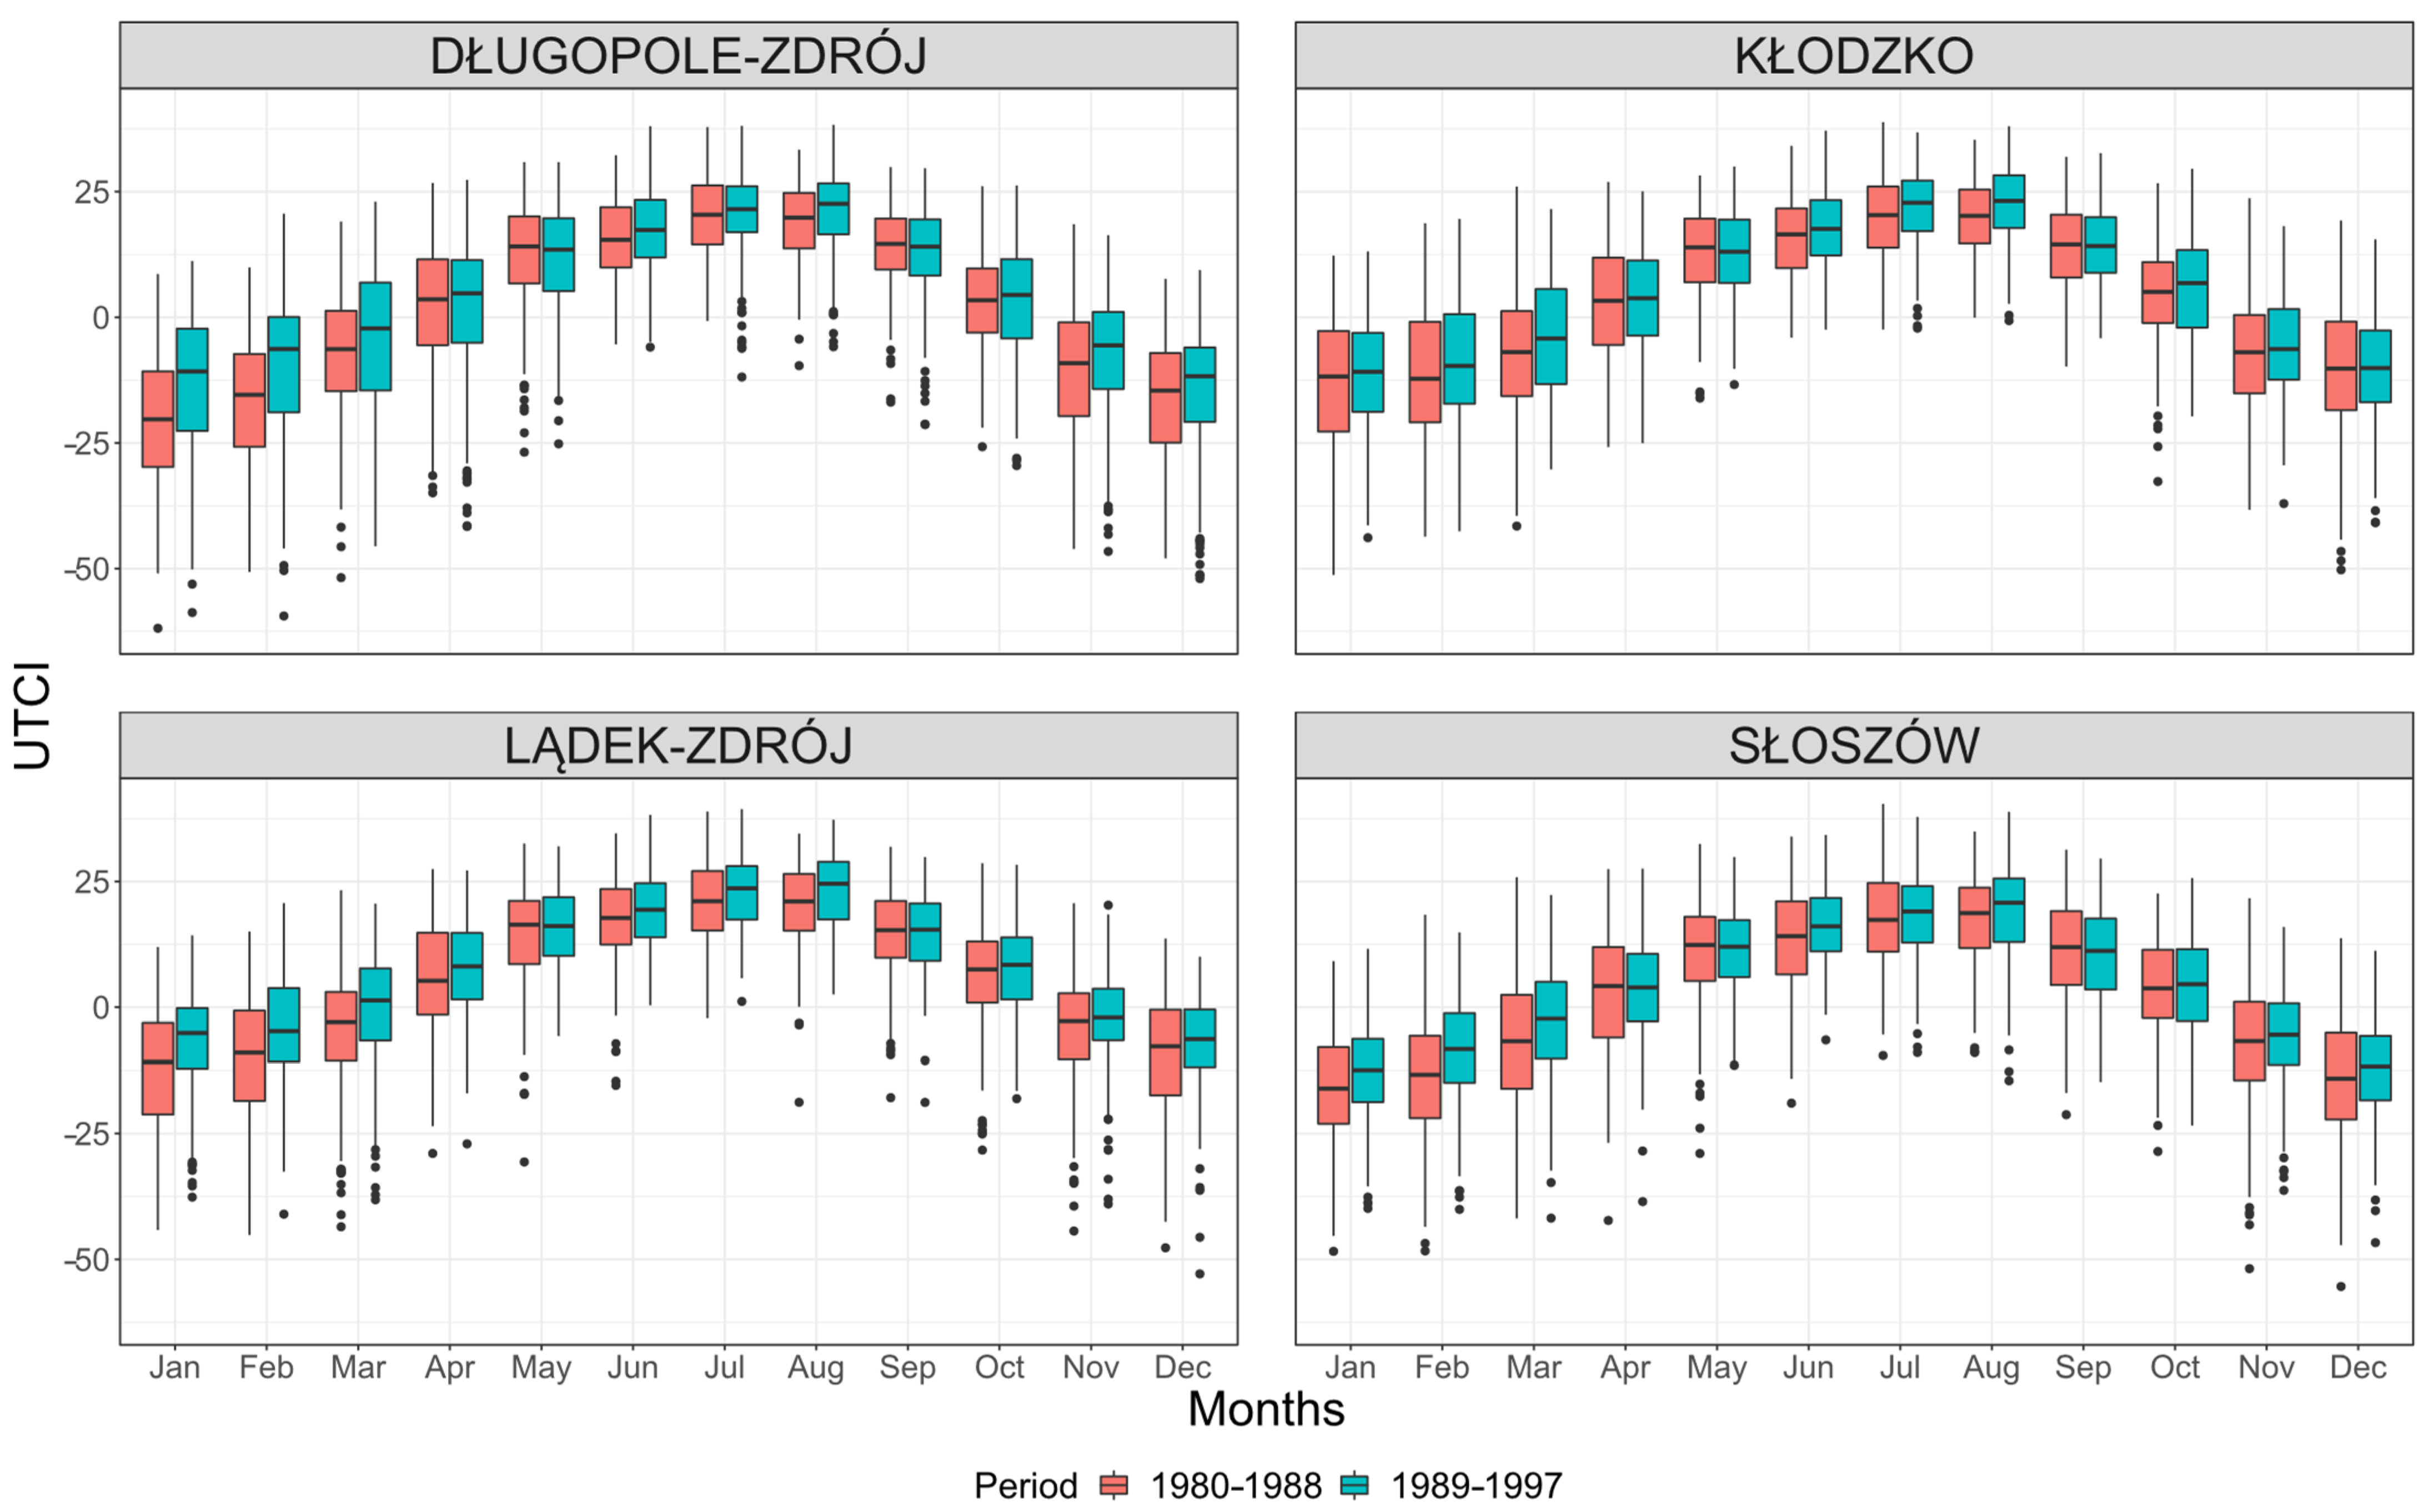
3. Results and Discussion

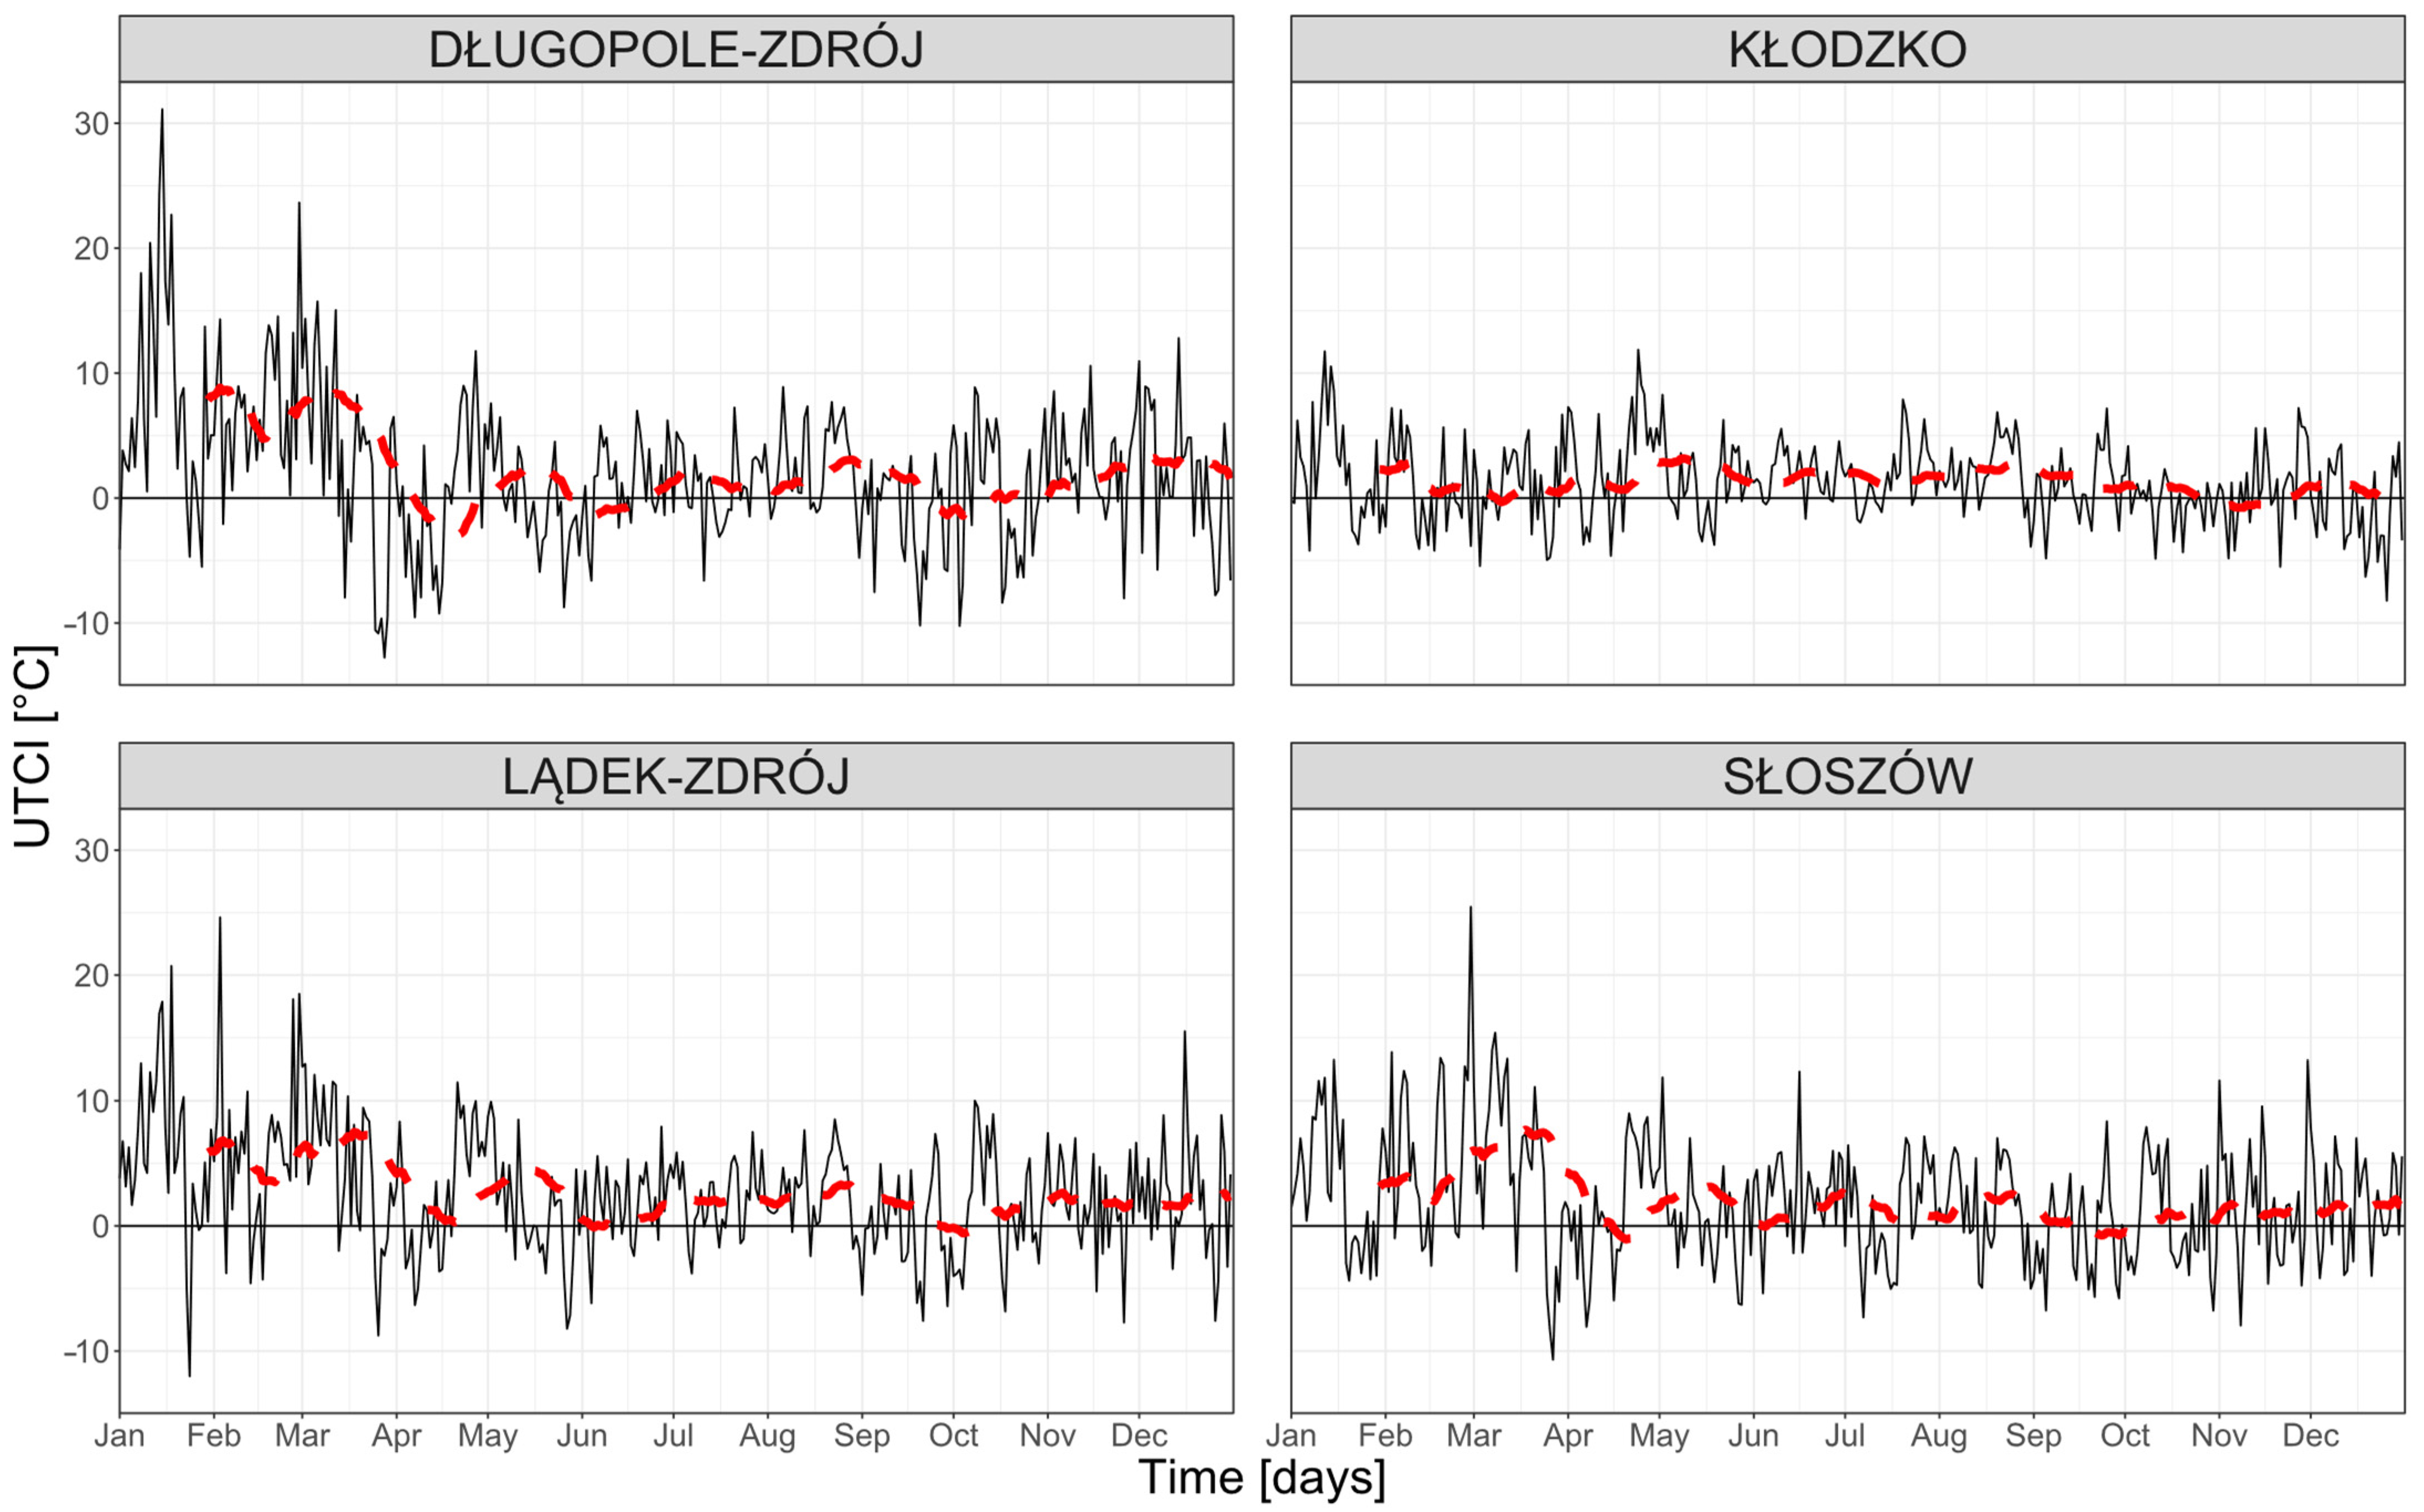
3.1. Annual and Seasonal Variability of Bioclimatic Indicators in Health Resorts of the Kłodzko Region

On the basis of available meteorological data for all 4 analyzed stations (1980–2006), we can observe differences in bioclimatic conditions based on UTCI thermal classes (Figure 2). All stations are located within 20 km distance from Kłodzko in a straight line, while differences in altitude above sea level between the stations do not exceed 200 m (Kłodzko—356 m a.s.l., Długopole-Zdrój—398 m a.s.l., Słoszów—602 m a.s.l., and Lądek-Zdrój—461 m a.s.l.). Topoclimatic conditions are crucial for differences in bioclimatic conditions that occur in the region [2,23]. As part of Sudety Massif the region is associated with relatively frequent occurrence of foehn or foehn-like phenomena [36,58]. Due to denivelation as well as the diversity of land use, the area is prone to local convections and local wind circulation conditioned by orography, which is clearly visible in local variability of frequencies of particular thermal classes despite small distances between the examined stations.
Analyzing the annual variability of thermal classes (Figure 2), “Extreme cold stress” occurred with a frequency of 1.2% in Długopole-Zdrój and less than 0.4% in Kłodzko, Słoszow and Lądek-Zdrój; “Very strong cold stress” occurred with a frequency of 4.4% in Długopole-Zdrój, 3.2% Kłodzko, 2.4% Słoszów, and 2% Lądek-Zdrój; “Strong cold stress” occurred with a frequency of 11.2% in Długopole-Zdrój, 12.8% Kłodzko, 8.8% Słoszów, and 12.4% Lądek-Zdrój; “Moderate cold stress” occurred with a frequency of 21.2% in Długopole-Zdrój, 21.2% Kłodzko, 25.2% Słoszów, and 22.4% Lądek-Zdrój; “Slight cold stress” occurred with a frequency of 18% in Długopole-Zdrój, 18.4% Kłodzko, 19.2% Słoszów, and 20.4% Lądek-Zdrój; “No thermal stress” occurred with a frequency of 36% in Długopole-Zdrój, 36% Kłodzko, 34% Słoszów, and 40% Lądek-Zdrój; “Moderate heat stress” occurred with a frequency of 6% in Długopole-Zdrój, 6% Kłodzko, 4% Słoszów, and 8% Ladek-Zdrój; “Strong heat stress” occurred with a frequency of 1.6% in Długopole-Zdrój, 1% Kłodzko, 1% Słoszów, and 0.8% Lądek-Zdrój; “Very strong heat stress” occurred 6 times in Długopole-Zdrój, 1 time in Kłodzko, 3 times in both Słoszów and Lądek-Zdrój (Figure 2). The results are similar to those in studies by others conducting research in Poland [5,16,33,45,58,59,60,61,62,63].
The station characterized by colder thermal conditions is Słoszów, where thermal classes connected to cold occurred 5–10% more often than in the other three stations. The station Długopole-Zdrój experienced “Extreme cold stress” (33 times in December, 44 in January, 27 in February, and 6 in March—a total of 110). For comparison, in winter (DJFM) in Kłodzko classes characterized by “Extreme cold stress” were 29, in Słoszów 30, and in Lądek-Zdrój 23. The situation is similar for extreme heat classes. In the period 1980–2006, “Extreme heat stress” was never recorded; however, the next extreme thermal class “Very strong heat stress” occurred 6 times in Dlugopole-Zdrój during summer (JJAS), in Kłodzko 1 time, and in Lądek-Zdrój and Słoszów 3 times. “Strong heat stress” occurred in Długopole-Zdrój 144 times, while in Kłodzko 89 times, in Słoszów 50 times, and in Lądek-Zdrój 90 times. The frequency of occurrence of thermal classes for the period 1980–2006 shows that the most comparable bioclimatic conditions according to UTCI occur in Kłodzko and Lądek-Zdrój. Długopole-Zdrój is characterized by the most frequent occurrence of extreme thermal classes, while Słoszów is clearly cooler than the other three meteorological stations.
Annual courses of minimum, mean, and maximum values reflect thermal variability typical for the transitional climate of Poland (Figure 3). The minimum UTCI values in the Kłodzko region in 1980–2006 were as follows: −61.8 °C for Długopole-Zdrój in January, −55.4 °C for Słoszów in December, −52.9 °C for Lądek-Zdrój in December, and −49.5 °C for Kłodzko in December. The maximum UTCI values were 40.7 °C for Długopole-Zdrój in June, 40.4 °C for Słoszów in July, 39.4 °C for Lądek-Zdrój in July, and 38.3 °C for Kłodzko in July (Figure 3).
High standard deviations for individual months are also typical of UTCI variability (Table 3). The reason for such high variability is the sensitivity of UTCI to different meteorological components such as wind speed or air humidity. In January where the minimum UTCI value in Długopole-Zdrój was −61.8 °C, the maximum UTCI value was 12.9 °C which gives a difference of 74.7 °C. UTCI value of −61.8 °C occurred on January 15, 1987 at air temperature of 15.3 °C, relative humidity 82%, wind speed 12 m∙s−1, and full cloud cover, while a UTCI value of 12.9 °C occurred at air temperature of 11.1 °C, humidity 78%, wind speed 2 m∙s−1, and no cloud cover. The annual mean values along with maximum and minimum values correspond to the results of other bioclimatic analyses conducted in Poland [5,16,59,64].

3.2. Influence of Meso-Tropospheric Circulation on Changes in Bioclimatic Conditions

The analysis of the significance of changes in bioclimatic conditions was based on meso-tropospheric circulation epochs according to Degirmendžić and Kożuchowski [65]. Previous analyses [28,33] of bioclimate variability in the region showed a considerable influence of macrocirculatory phenomena such as North Atlantic oscillation (NAO) or Atlantic multiannual oscillation (AMO) on basic meteorological parameters and UTCI index. The reconstruction of a 180-year sequence of meteorological measurements of temperature, precipitation, and insolation for Wroclaw based on an autonomous system of ordinary differential equations [30,42,66] showed a dynamical behavior sharing the AMO periodicity [67]. Based on a previous study, the analyzed bioclimatic conditions were therefore divided according to the epochs of the meso-tropospheric circulation macrotypes E (1964–1988) and W (1989–2022) [29,34,65,68,69]. The boundaries of these epochs are consistent with the phase boundaries of the North Atlantic thermohaline circulation (NA TCH) [34,70]. Comparing the UTCI values by circulation epochs E (before 1988) and W (after 1988) accordingly to two comparative division variants of years: (a) 1966–1988; 1989–2011 for Kłodzko as a reference station (Figure 4), (b) 1980–1988; 1989–1997 for all analyzed stations (Figure 5). In both situations the higher UTCI values were observed in the W circulation phase in relation to E at all four stations.
The main factor that determines UTCI values is air temperature (Ta), but it should be borne in mind that wind speed (v), water vapor pressure (e), or mean solar radiation (Tmrt) also have an impact on UTCI. In the study by Głogowski et al. [33] for Kłodzko, a bioclimatic analysis as well as an analysis of individual meteorological parameters in terms of NAO was performed. Each of the analyzed elements showed a different correlation with respect to NAO phases; for example, cloudiness (n), which is a component of mean solar radiation (Tmrt) [33], showed an inverse correlation with NAO.
The influence of meso-troposphere E and W circulation epochs on bioclimate of the Kłodzko region was determined on the basis of differences between those epochs in mean air temperatures (Figure 6) and UTCI index (Figure 7) for period 1980–1997. Additionally, for the periods determined, a 30-day moving average was calculated (Figure 6 and Figure 7 red dashed line). We can observe that air temperature is higher in the W epoch on average from 0.5 °C to even 5 °C throughout the year for all analyzed stations (Figure 6). In the case of the UTCI index, this dependence is visible in three out of the four analyzed stations (Figure 7).
In Kłodzko, UTCI differences between circulation epochs are less visible in a period January–March than in other stations. The lowest situated station is Kłodzko (Figure 1) whose local climate is influenced by evaporation of the Nysa Kłodzka River and its several tributaries located on the outskirts of the town. The city is surrounded by Bardzkie Mountains, but the meteorological station is located on their distant plain foreground. This favors both the catabatic inflow of cold air and the formation of cold stagnation and radiation fogs, as well as their longer persistence during the day. As a result, Kłodzko is characterized by higher relative humidity than the other stations studied, which is also evident in the water vapor pressure [71]. Hygric differences between epochs W and E are small in Kłodzko in contrast to the other stations. These stations are not connected with hydrographic nodes and their topoclimate features are shaped by higher altitude, different exposure, local wind circulation determined by their mid-mountain and forest surroundings. Słoszów situated on the Lewińskie Hills is surrounded by the Stołowe Mountains to the north and the Orlickie Mountains to the south, Długopole-Zdrój—the Bystrzyckie Mountains to the southwest, Lądek-Zdrój—the Złote Mountains to the north and east, the Śnieżnik Massif to the south, and the Krowiarki Mountains to the west, which are the northern extension of the massif. Terrain evaporation in the vicinity of these stations is related to the availability of water in the soil, i.e., precipitation and duration of snow cover, which change in the subsequent periods of circulation. In consequence, the role of evaporation in the surroundings is weaker than in Kłodzko. Therefore, the bioclimate of these stations is more sensitive, especially in winter, to the variability of circulation epochs in comparison to Kłodzko.
Due to the fact that the Kłodzko land contained valued health resorts, the observed bioclimatic differences are an important argument for further conducting meteorological measurements there in order to trace changes impossible to capture by a single synoptic station in such a naturally diversified region of Sudety.

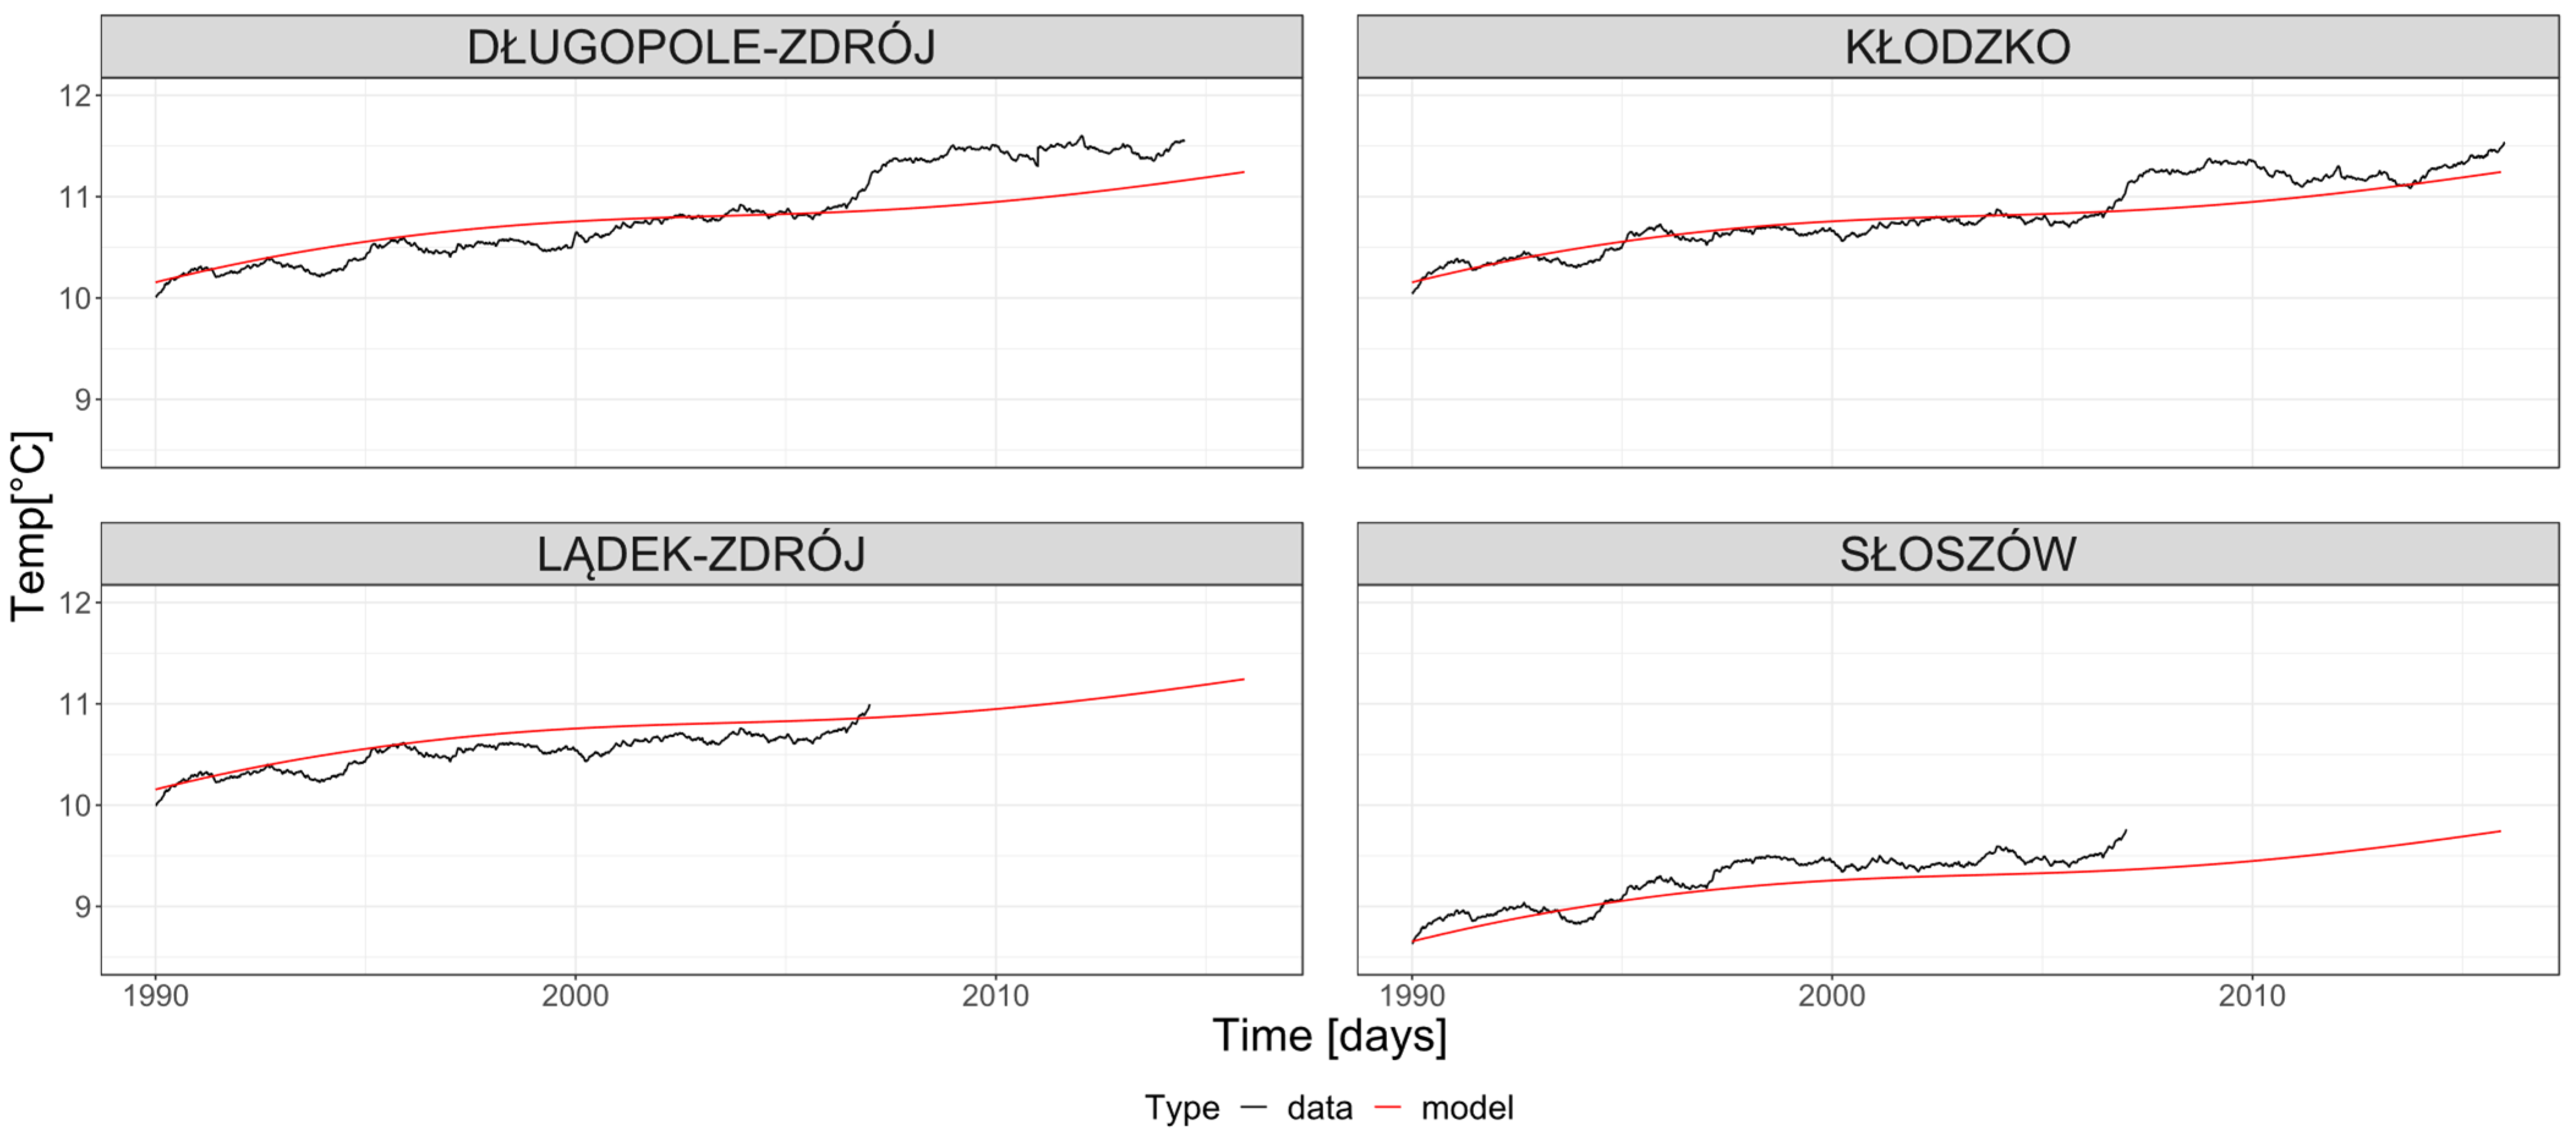
3.3. Reconstruction and Verification of Air Temperature in Słoszów and Długopole-Zdrój

The bioclimate of the Kłodzko region for the stations Słoszów, Długopole-Zdrój, and Lądek-Zdrój was previously analyzed for heat waves [60]. The linear increase in days considered as heat waves (Tair > 30 °C) as well as the increase in days with the thermal class “Very strong heat stress” (UTCI > 32 °C) for the multi-year period 1971–2010 and in the same multi-year period with atmospheric circulation according to Ojrzyńska [32] was presented. In that study, Miszuk [60] showed that the number of heat wave days for both air temperature (Tair > 30 °C) and UTCI (UTCI > 32 °C) is not increasing in a linear manner, but it is a dynamic variability with a positive trend over time. An attempt was made to map the non-linear variability of the long-term trend in air temperature over time for the analyzed stations with reference to the author’s earlier work [28], in which a non-linear model based on a system of differential equations was made on the basis of almost 120 years of observations of air temperature, precipitation, and insolation in Wrocław. This model further correlated well with the AMO [67].
The Ta time series generated by the model with parameters based on Table 2 was fitted to the respective stations of Długopole-Zdrój, Lądek-Zdrój, Słoszów, and Kłodzko by rescaling the initial condition of the model from dependence on the difference in altitude between the stations (100 m a.s.l. = +1 °C).
Figure 8 shows the 10-year moving average of air temperature, matched with the long-term trend of air temperature generated prior to the model from Table 2 [28]. The analysis of the residuals shows that the mean square error is respectively 0.25, 0.22, 0.27, and 0.23 for Długopole-Zdrój, Kłodzko, Lądek-Zdrój, and Słoszów. With such a performant fit, it was decided to reconstruct the data for Długopole-Zdrój and Słoszów, while comparing them with the author’s measurements collected using the Hobo-U23 sensor during the course of the study from April 2017 to March 2022. Although the model performed well in reproducing the measured data set, an increase of air temperature of about 1 °C was also observed. Oscillation caused by the AMO or NAO phenomena were likely triggered by past stress on the global climate caused by severe anthropic activities [24]. Those changes may be related both to regional increase of urbanization [72] and gas emissions [26,73] but also by global stressors, which are also responsible for the rising temperature of the oceans [74]. Such variability of air temperature for now is not above the accepted level of adaptation for humans but may change diversity of different species [75]. Increased air temperature by 1 °C also corresponds to the analysis by IPCC [25].
Data reconstructions were performed on the basis of three components: (1) non-linear long-term trend [28], (2) correlated fluctuations generated from the stochastic autoregression model [43] with parameter p = 1; AR(1) [45], and (3) seasonal variability as monthly mean values and the corresponding standard deviation. Components 1 and 2 were generated with a daily interval, while component 3 was aggregated according to respective months.
In accordance with the 3-σ law [76], the reconstructed data are within the interval defined by one standard deviation (σ-1) from the 30-day moving average of air temperature between autumn and winter (Figure 9). This means that the reconstructed data in Słoszów correctly represents the air temperature in relation to the measured data by about 67% or higher. The model overestimates values in the summer period for Słoszów. In Długopole-Zdrój, the model represents the values of air temperature in the period from spring to autumn with similar efficiency but overestimates the values in winter. These differences can be caused by topoclimatic conditions. The stations are located not only in different mountain massifs, but are also characterized by different exposures. For example, Słoszów, has an eastern exposure, while Długopole-Zdrój has northern exposure. Topoclimatic differences cause, for example, changes in the local direction and speed of the wind which explain the differences in UTCI between the stations studied.
Further monitoring of meteorological parameters such as wind speed and direction as well as air humidity will allow for a more precise estimation of changes both in the context of climate analysis and reconstruction, as well for short- and mid-term forecasting. Currently, despite the widespread use of climate models and reanalyses, the effectiveness of forecasts in places with different topoclimatic conditions is characterized by a much lower predictability.
In the long term, the reconstruction efficiency is sufficient and, despite dynamic climate changes in recent years, it is still able to reproduce the measured air temperature. The presented model has application potential for any location in the region that does not have a documented measurement history of meteorological conditions. Further research to determine the influence of macrocirculatory phenomena such as NAO and AMO on bioclimate may allow the described model to be used more universally for other locations where the influence of macrocirculatory phenomena is evident on a long-term basis. The model can also be used to reconstruct the meteorological data in Central Europe. Because the AMO oscillation also affects North America, the application of the model can be extended previa correcting the estimation parameters. Further investigation may also lead to extend its applicability not only to meteorological parameters but also to model bioclimatic conditions.

4. Conclusions

Bioclimatic analyses were performed for four localities of the Kłodzko region in the years 1980–2006 for Słoszów and Lądek-Zdrój, 1980–2014 for Długopole-Zdrój, and 1966–2020 for Kłodzko.based on data provided by the IMGW repository. Air temperature reconstruction dynamics were also performed on measurements done with HOBO-U23 loggers in Słoszów and Długopole-Zdrój during the five-year period (2017–2022). With the exception of Kłodzko, these localities are located in health resort districts where further meteorological measurements were discontinuous. The UTCI index was used to determine the bioclimate. Kłodzko was analyzed because it is the only synoptic station which serves as a reference point. It was shown that, in the Kłodzko region, despite its diversified topoclimatic conditions, the influence of macrocirculation phenomena plays a major role from a long-term perspective. The bioclimatic conditions in the multi-year period did not show anomalies both in terms of the occurrence of thermal stress classes and annual runs. The bioclimatic conditions were evaluated according to the cyclonic epochs of two periods: E (1980–1988) and W (1989–2006). It was shown that epoch W is characterized by a warmer air temperature in all analyzed stations, while bioclimatic conditions were higher in Długopole-Zdrój, Słoszów, and Lądek-Zdrój. Kłodzko shows almost identical conditions in both epochs, which may be caused by the available longer time-series. In addition, these differences may be caused by topoclimatic conditions and the lack of a mountain massif in close proximity compared to other stations.
In the next part of the study, an attempt was made to reconstruct air temperature as the main factor for determining the stimulus of most bioclimatic indices. It was shown that the model presented for Wrocław on the basis of data for 1891–2007 [28] built on a system of differential equations can be applied in the Kłodzko region after adjusting differences in altitude above sea level between Wrocław and the analyzed stations. The model of multiyear trend very accurately approximates the non-linear climate variability in a multiyear perspective for each of the four analyzed stations. The mean square error in the period 1990–2006 for Słoszów and Lądek-Zdrój and in the period 1990–2014 for Kłodzko and Długopole-Zdrój for each of the models after fitting ranged from 0.22 to 0.27.
In addition, model verification was performed by reconstruction based on three components: (1) non-linear multi-year trend, (2) correlated fluctuations generated on the basis of the stochastic AR(1) model, and (3) seasonal variability. Components 1 and 2 were generated with a daily interval, while component 3 was aggregated according to respective months. The reconstructed values were compared with the values of air temperature measured with our own HOBO-U23 logger in Słoszów and Długopole-Zdrój during the five-year period (2017–2022). The model correctly represented the air temperature in autumn, winter, and spring (in Słoszów at least 67%). Overestimated values were repeated cyclically every year in the summer period. In Długopole-Zdrój, on the other hand, the model was similarly effective in reproducing the values of air temperature in the period from spring to autumn, but overestimated the values of air temperature in winter. The model shows great potential for replication not only in the region, but also for different locations in Central Europe and after modification also in North America where the Atlantic oscillations are present. Presented analysis is beneficial for places that require meteorological analysis, but lack of continued measurement history is the issue. Since the model shows a high correlation with macrocirculatory phenomena such as NAO and AMO, further research to determine the impact of these phenomena on other locations may well allow the model to be used universally.

Author Contributions

A.G. resources, validation, formal analysis, investigation, writing—original draft preparation, visualization; P.P. methodology, review and editing; T.B. methodology, writing—review and editing K.B. resources, conceptualization, supervision, writing—review and editing. All authors have read and agreed to the published version of the manuscript.

Funding

This research was funded under the Leading Research Groups support project from the subsidy increased for the period 2020–2025 in the amount of 2% of the subsidy referred to Art. 387 (3) of the Law of 20 July 2018 on Higher Education and Science, obtained in 2019 and APC was funded by the internal funds of Department of Environmental Protection and Development, Wroclaw University of Environmental and Life Science.

Institutional Review Board Statement

Not applicable.

Informed Consent Statement

Not applicable.

Data Availability Statement

Not applicable.

Acknowledgments

Authors would like to thank all reviewers for the valuable comments that helped to improve the final version of the manuscript.

Conflicts of Interest

The authors declare no conflict of interest.

References

  1. Ge, Q.; Kong, Q.; Xi, J.; Zheng, J. Application of UTCI in China from tourism perspective. Theor. Appl. Climatol. 2017, 128, 551–561. [Google Scholar]
  2. Kozłowska-Szczęsna, T.; Błażejczyk, K.; Krawczyk, B.; Limanówka, D. Bioklimat Uzdrowisk Polskich i Możliwości Jego Wykorzystania w Lecznictwie; PAN, IGiPZ: Warsaw, Poland, 2002. (In Polish) [Google Scholar]
  3. Matzarakis, A.; Rammelberg, J.; Junk, J. Assessment of thermal bioclimate and tourism climate potential for central Europe—the example of Luxembourg. Theor. Appl. Climatol. 2013, 114, 193–202. [Google Scholar]
  4. De Freitas, C.R.; Grigorieva, E.A. The impact of acclimatization on thermophysiological strain for contrasting regional climates. Int. J. Biometeorol. 2014, 58, 2129–2137. [Google Scholar] [PubMed]
  5. Kuchcik, M.; Szmyd, K.B.; Milewski, P.; Błażejczyk, A.; Baranowski, J. Potencjał Leczniczy Klimatu Polski; Wydawnictwo Akademickie SEDNO Spółka z o.o.: Warsaw, Poland, 2013. (In Polish) [Google Scholar]
  6. Mąkosza, A. Bioclimatic conditions of the Lubuskie Voivodeship. Geogr. Pol. 2013, 86, 37–46. (In Polish) [Google Scholar]
  7. Di Napoli, C.; Pappenberger, F.; Cloke, H.L. Assessing heat-related health risk in Europe via the Universal Thermal Climate Index (UTCI). Int. J. Biometeorol. 2018, 62, 1155–1165. [Google Scholar] [PubMed] [Green Version]
  8. Idzikowska, D. Relationship between mortality and UTCI in Paris, Rome, Warsaw and Budapest. Pr. Stud. Geogr. 2011, 47, 311–318. [Google Scholar]
  9. Galan, J.C.A.; Guedes, J.C. Applicability of Heat Stress Index in the Context of Military Work: Pilot Study BT—Occupational and Environmental Safety and Health; Arezes, P.M., Baptista, J.S., Barroso, M.P., Carneiro, P., Cordeiro, P., Costa, N., Melo, R.B., Miguel, A.S., Perestrelo, G., Eds.; Springer: Cham, Switzerland, 2019; pp. 313–322. [Google Scholar]
  10. Bielec-Bąkowska, Z. Long-term variability of the frequency and persistence of strong highs over Poland. Environ. Socio-Econ. Stud. 2016, 4, 12–23. [Google Scholar]
  11. De Freitas, C.R.; Grigorieva, E.A. A comparison and appraisal of a comprehensive range of human thermal climate indices. Int. J. Biometeorol. 2017, 61, 487–512. [Google Scholar] [CrossRef]
  12. Vernon, H.M. The measurement of radiant heat in relation to human comfort. J. Ind. Hyg. 1932, 14, 95–111. [Google Scholar]
  13. Haldane, J.S. The influence of high air temperatures No. I. Epidemiol. Infect. 1905, 5, 494–513. [Google Scholar]
  14. Eissing, G. Climate assessment indices. Ergonomics 1995, 38, 47–57. [Google Scholar] [CrossRef]
  15. Masterton, J.M.; Richardson, F.A. Humidex: A Method of Quantifying Human Discomfort due to Excessive Heat and Humidity; Environment Canada, Atmospheric Environment: Gatineau, QC, Canada, 1979.
  16. Błażejczyk, K. Assessment of regional bioclimatic contrasts in Poland. Misc. Geogr. Stud. Dev. 2011, 15, 79–91. [Google Scholar]
  17. Moran, D.S.; Castellani, J.W.; O’Brien, C.; Young, A.J.; Pandolf, K.B. Evaluating physiological strain during cold exposure using a new cold strain index. Am. J. Physiol. Integr. Comp. Physiol. 1999, 277, R556–R564. [Google Scholar]
  18. Terjung, W.H. World patterns of the distribution of the monthly comfort index. Int. J. Biometeorol. 1968, 12, 119–151. [Google Scholar] [CrossRef]
  19. Błażejczyk, K.; Matzarakis, A. Assessment of bioclimatic differentiation of Poland based on the human heat balance. Geogr. Pol. 2007, 80, 63–82. [Google Scholar]
  20. Havenith, G.; Fiala, D.; Blazejczyk, K.; Richards, M.; Bröde, P.; Holmér, I.; Rintamaki, H.; Benshabat, Y.; Jendritzky, G. The UTCI-clothing model. Int. J. Biometeorol. 2012, 56, 461–470. [Google Scholar]
  21. Mayer, H.; Höppe, P. Thermal comfort of man in different urban environments. Theor. Appl. Climatol. 1987, 38, 43–49. [Google Scholar] [CrossRef]
  22. Hori, S. Index for the assessment of heat tolerance. J. Hum. Ergol. 1978, 7, 135–144. [Google Scholar]
  23. Milewski, P. Application of the UTCI to the Local Bioclimate of Poland’s Ziemia Kłodzka Region; IGiPZ, PAN: Warsaw, Poland, 2013; Volume 86, pp. 47–54. [Google Scholar]
  24. IPCC. Climate Change 2014: Synthesis Report; Contribution of Working Groups I, II and III to the fifth Assessment Report of the Intergovernmental Panel on Climate Change; IPCC: Geneva, Switzerland, 2014. [Google Scholar]
  25. Zhongming, Z.; Linong, L.; Xiaona, Y.; Wangqiang, Z.; Wei, L. AR6 Climate Change 2021: The Physical Science Basis; IPCC: Geneva, Switzerland, 2021. [Google Scholar]
  26. Werner, M.; Kryza, M.; Pagowski, M.; Guzikowski, J. Assimilation of PM2.5 ground base observations to two chemical schemes in WRF-Chem—The results for the winter and summer period. Atmos. Environ. 2019, 200, 178–189. [Google Scholar] [CrossRef]
  27. Bednorz, E.; Tomczyk, A.M. Influence of macroscale and regional circulation patterns on low- and high-frequency sea level variability in the Baltic Sea. Theor. Appl. Climatol. 2021, 144, 115–125. [Google Scholar]
  28. Głogowski, A.; Perona, P.; Bryś, K.; Bryś, T. Nonlinear reconstruction of bioclimatic outdoor-environment dynamics for the Lower Silesia region (SW Poland). Int. J. Biometeorol. 2021, 65, 1189–1203. [Google Scholar] [CrossRef] [PubMed]
  29. Girs, A.A. Macro-Circulation Method of Long-Term Meteorological Forecasts; Gidrometeoizdat: Leningrad, Russia, 1974; p. 488. (In Russian) [Google Scholar]
  30. Malik, A.; Brönnimann, S.; Perona, P. Statistical link between external climate forcings and modes of ocean variability. Clim. Dyn. 2017, 50, 3649–3670. [Google Scholar] [CrossRef]
  31. Marsz, A.; Styszyńska, A. Changes in Sea Surface Temperature of the South Baltic Sea (1854–2005) BT—The Polish Climate in the European Context: An Historical Overview; Przybylak, R., Ed.; Springer: Dordrecht, The Netherlands, 2010; pp. 355–374. [Google Scholar]
  32. Ojrzyńska, H. Cyrkulacyjne Uwarunkowania Przestrzennego Rozkładu Temperatury Powietrza w Terenie Zróżnicowanym Morfologicznie na Przykładzie Sudetów; Instytut Geografii i Rozwoju Regionalnego Uniwersytetu Wrocławskiego: Wrocław, Poland, 2015. (In Polish) [Google Scholar]
  33. Głogowski, A.; Bryś, K.; Bryś, T. Influence of NAO on forming the UTCI index in Kłodzko. Theor. Appl. Climatol. 2020, 142, 1555–1567. [Google Scholar] [CrossRef]
  34. Savichev, A.I.; Mironicheva, N.P.; Tsepelev, V.Y. Atmospheric circulation characteristics of the Northern Hemisphere Atlantic-Eurasian sector for last decade. Uchenye Zap. RGGMU 2015, 39, 120–131. (In Russian) [Google Scholar]
  35. Richner, H.; Hächler, P. Understanding and Forecasting Alpine Foehn BT—Mountain Weather Research and Forecasting: Recent Progress and Current Challenges; Chow, F.K., De Wekker, S.F.J., Snyder, B.J., Eds.; Springer: Dordrecht, The Netherlands, 2013; pp. 219–260. [Google Scholar]
  36. Kwiatkowski, J. Zasięg fenów sudeckich i ich wpływ na mezoklimat regionów południowo-zachodniej i środkowej Polski. Przegląd Geogr. 1975, 20, 15–30. (In Polish) [Google Scholar]
  37. WMO. WMO Holds Symposium on Universal Thermal Climate Index. 2009. Available online: http://sdg.iisd.org/news/wmo-holds-symposium-on-universal-thermal-climate-index/ (accessed on 19 January 2019).
  38. Błażejczyk, K.; Kuchcik, M.; Błażejczyk, A.; Milewski, P.; Szmyd, J. Assessment of urban thermal stress by UTCI–experimental and modelling studies: An example from Poland. ERDE J. Geogr. Soc. Berl. 2014, 145, 16–33. [Google Scholar]
  39. Novak, M. Use of the UTCI in the Czech Republic. Geogr. Pol. 2013, 86, 21–28. [Google Scholar] [CrossRef]
  40. Wu, F.; Yang, X.; Shen, Z. Regional and seasonal variations of outdoor thermal comfort in China from 1966 to 2016. Sci. Total Environ. 2019, 665, 1003–1016. [Google Scholar] [CrossRef]
  41. Brönnimann, S.; Allan, R.; Ashcroft, L.; Baer, S.; Barriendos, M.; Brázdil, R.; Brugnara, Y.; Brunet, M.; Brunetti, M.; Chimani, B.; et al. Unlocking pre-1850 instrumental meteorological records: A global inventory. Bull. Am. Meteorol. Soc. 2019, 100, ES389–ES413. [Google Scholar] [CrossRef]
  42. Perona, P.; Porporato, A.; Ridolfi, L. On the Trajectory Method for the Reconstruction of Differential Equations from Time Series. Nonlinear Dyn. 2000, 23, 13–33. [Google Scholar] [CrossRef]
  43. Brockwell, P.J.; Davis, R.A. Introduction to Time Series and Forecasting; Springer: New York, NY, USA, 2016. [Google Scholar]
  44. Głogowski, A.; Chalfen, M. Analysis of the effectiveness of the systems protecting against the impact of water damming in the river on the increase of groundwater level on the example of the Malczyce dam. In ITM Web of Conferences; EDP Sciences: Les Ulis, France, 2018; Volume 23, p. 11. [Google Scholar]
  45. Głogowski, A.; Bryś, K.; Perona, P. Bioclimatic conditions of the Lower Silesia region (South West Poland) from 1966–2017. Int. J. Biometeorol. 2021, 65, 1515–1527. [Google Scholar] [CrossRef] [PubMed]
  46. Krzyżewska, A.; Wereski, S.; Dobek, M. Summer UTCI variability in Poland in the twenty-first century. Int. J. Biometeorol. 2020, 65, 1497–1513. [Google Scholar] [CrossRef]
  47. Czernecki, B.; Głogowski, A.; Nowosad, J. Climate: An R Package to Access Free In-Situ Meteorological and Hydrological Datasets for Environmental Assessment. Sustainability 2020, 12, 394. [Google Scholar] [CrossRef] [Green Version]
  48. R Core Team. R: A Language and Environment for Statistical Computing; R Foundation for Statistical Computing: Vienna, Austria, 2013. [Google Scholar]
  49. Jarraud, M. Guide to Meteorological Instruments and Methods of Observation (WMO-No. 8); World Meteorological Organization: Geneva, Switzerland, 2008; Volume 29. [Google Scholar]
  50. Błażejczyk, K. Bioklimatyczne Uwarunkowania Rekreacji i Turystyki w Polsce; IGiPZ PAN: Warsaw, Poland, 2004; Volume 192. [Google Scholar]
  51. Błażejczyk, K. Menex2005 the Updated Version of Man-Environment Heat Exchange Model; Institute of Geography and Spatial Organization: Warsaw, Poland, 2005. [Google Scholar]
  52. Blazejczyk, K.; Jendritzky, G.; Bröde, P.; Fiala, D.; Havenith, G.; Epstein, Y.; Psikuta, A.; Kampmann, B. An introduction to the universal thermal climate index (UTCI). Geogr. Pol. 2013, 86, 5–10. [Google Scholar] [CrossRef] [Green Version]
  53. Błażejczyk, K. BioKlima 2.6; Institute of Geography and Spatial Organization: Warsaw, Poland, 1996. [Google Scholar]
  54. Bröde, P.; Fiala, D.; Błażejczyk, K.; Holmér, I.; Jendritzky, G.; Kampmann, B.; Tinz, B.; Havenith, G. Deriving the operational procedure for the Universal Thermal Climate Index (UTCI). Int. J. Biometeorol. 2012, 56, 481–494. [Google Scholar] [CrossRef] [Green Version]
  55. Maidment, D.R. Handbook of Hydrology; McGraw-Hill: New York, NY, USA, 1993; Volume 9780070. [Google Scholar]
  56. Bryś, K.; Bryś, T. The variability of solar conditions of Wroclaw climate in the 1875–2004 years. Pamiet. Pulawski 2007, 46, 13–33. [Google Scholar]
  57. Bryś, K.; Bryś, T. Reconstruction of the 217-year (1791–2007) Wrocław air temperature and precipitation series. Bull. Geogr. Phys. Geogr. Ser. 2010, 3, 121–171. [Google Scholar] [CrossRef] [Green Version]
  58. Bryś, K.; Ojrzyńska, H. Stimulating qualities of biometorological conditions in Wrocław. Acta Geogr. Lodz. 2016, 104, 193–200. (In Polish) [Google Scholar]
  59. Chabior, M. Wybrane aspekty bioklimatu Szczecina. Pr. Stud. Geogr. 2011, 47, 293–300. (In Polish) [Google Scholar]
  60. Miszuk, B. Evaluation of Tourism-Climate Conditions in the Region of Kłodzko Land (Poland). Atmosphere 2021, 12, 907. [Google Scholar] [CrossRef]
  61. Nidzgorska-Lencewicz, J. Variability of Human-Biometeorological Conditions in Gdańsk. Pol. J. Environ. Stud. 2015, 24, 215–226. [Google Scholar] [CrossRef]
  62. Okoniewska, M.; Więcław, M. Long-term variability of bioclimatic conditions in the second half of the 20 century at noon hours in Poland based on Universal Thermal Climate Index. J. Health Sci. 2013, 3, 116–129. [Google Scholar]
  63. Rozbicka, K.; Rozbicki, T. Variability of UTCI index in South Warsaw depending on atmospheric circulation. Theor. Appl. Climatol. 2018, 133, 511–520. [Google Scholar] [CrossRef] [Green Version]
  64. Nidzgorska-Lencewicz, J.; Mąkosza, A. Assessment of bioclimatic conditions within the area of Szczecin agglomeration. Meteorol. Z. 2013, 22, 615–626. [Google Scholar] [CrossRef]
  65. Degirmendžić, J.; Kożuchowski, K. Circulation epochs based on the Vangengeim-Girs large scale patterns (1891–2010). Acta Univ. Lodz. Folia Geogr. Phys. 2018, 17, 7–13. [Google Scholar] [CrossRef]
  66. Eisenhammer, T.; Hübler, A.; Packard, N.; Kelso, J.A.S. Modeling experimental time series with ordinary differential equations. Biol. Cybern. 1991, 65, 107–112. [Google Scholar] [CrossRef] [PubMed]
  67. Knudsen, M.F.; Seidenkrantz, M.-S.; Jacobsen, B.H.; Kuijpers, A. Tracking the Atlantic Multidecadal Oscillation through the last 8000 years. Nat. Commun. 2011, 2, 178. [Google Scholar] [CrossRef]
  68. Girs, A.A. Multi-Year Changes of the Atmospheric Circulation and Long-Term Hydro-Meteorological Forecasts; Gidrometeoizdat: Leningrad, Russia, 1971. (In Russian) [Google Scholar]
  69. Marsz, A.; Styszyńska, A.; Bryś, K.; Bryś, T. Role of Internal Variability of Climate System in Increase of Air Temperature in Wrocław (Poland) in the Years 1951–2018. Quaest. Geogr. 2021, 40, 109–124. [Google Scholar] [CrossRef]
  70. Marsz, A.A. Does the atmospheric circulation is determined and predictable? In Extreme Hydro-Meteorological Phenomena; IMGW Monographs; IMGW: Warsaw, Poland, 2005. (In Polish) [Google Scholar]
  71. Sobik, M. Klimat. In Przyroda Dolnego Śląska; Fabiszewski, J., Ed.; PAN, Polska Akademia Nauk Oddział we Wrocławiu: Wrocław, Poland, 2005; pp. 39–57. (In Polish) [Google Scholar]
  72. Christen, A.; Vogt, R. Energy and radiation balance of a central European city. Int. J. Climatol. 2004, 24, 1395–1421. [Google Scholar] [CrossRef]
  73. Szymanowski, M.; Kryza, M. GIS-based techniques for urban heat island spatialization. Clim. Res. 2009, 38, 171–187. [Google Scholar] [CrossRef]
  74. Marsz, A.; Styszyńska, A. Climate and Climate Change at Hornsund, Svalbard; Gdynia Maritime University: Gdynia, Poland, 2013. [Google Scholar]
  75. Battisti, C.; Poeta, G.; Fanelli, G. An Introduction to Disturbance Ecology; Springer: Cham, Switzerland, 2016; pp. 13–29. [Google Scholar]
  76. Pukelsheim, F. The three sigma rule. Am. Stat. 1994, 48, 88–91. [Google Scholar]
Figure 1. Location of synoptic and climate stations from the IMGW repository in the Kłodzko region (SW Poland) along with station heights in meters above sea level.
Sustainability 14 06770 g001
Figure 2. Occurrence of UTCI thermal stress for the period 1980–2006 in the Kłodzko region.
Sustainability 14 06770 g002
Figure 3. Annual courses of minimal, average, and maximal UTCI values for multi-annual period 1980–2006 in the Kłodzko region.
Sustainability 14 06770 g003
Figure 4. Boxplots of bioclimatic conditions in Kłodzko with division into E (1966–1988) and W (1989–2011) circulation epochs. Black dots represent statistically outstanding values.
Sustainability 14 06770 g004
Figure 5. Boxplots of bioclimatic conditions in all four stations with division into E (1980–1988) and W (1989–1997) circulation epochs. Black dots represent statistically outstanding values.
Sustainability 14 06770 g005
Figure 6. Differences in mean annual air temperature courses between W and E (W–E) circulation epochs in the Kłodzko region in years 1980–1997. The red dashed line indicates 30-day moving average.
Sustainability 14 06770 g006
Figure 7. Differences in mean annual UTCI runs between the W and E (W–E) circulation epochs in the Kłodzko region in years 1980–1997. Red dashed line indicates 30-day moving average.
Sustainability 14 06770 g007
Figure 8. Reconstructed long-term trend (red line) with comparison of 10-year moving average (black line) for four climate stations: 16 years for Lądek-Zdrój and Słoszów stations (1990–2006), 24 years for Klodzko and Długopole-Zdrój stations (1990–2014).
Sustainability 14 06770 g008
Figure 9. Reconstruction of air temperature (red dashed line) together with verification of own meteorological data (black line) made with HOBO-23U logger for two stations (Długopole-Zdrój and Słoszów) in the period April 2017 to March 2022. The grey box on the graph marks the sigma-1 area from the 30-day moving average air temperature.
Sustainability 14 06770 g009
Table 1. Assessment scale of UTCI [20].
UTCI (°C)Heat Stress Classes
UTCI > 46Extreme heat stress
38.1 < UTCI < 46Very strong heat stress
32.1 < UTCI < 38Strong heat stress
26.1 < UTCI < 32Moderate heat stress
9.1 < UTCI < 26No thermal stress
0.1 < UTCI < 9Slight cold stress
−12.9 < UTCI < 0Moderate cold stress
−26.9 < UTCI < −13.0Strong cold stress
−39.9 < UTCI < −27.0Very strong cold stress
UTCI ≤ −40Extreme cold stress
Table 2. Coefficients of a 3-dimensional autonomous system of ordinary differential equations (ODEs).
x (1)y (2)z (3)
c1−62.579494850917−4.4864030398010.477293701549
c20.4331222988862−0.0334123644410.002145656022
c3−0.2237615300582−0.1001861412120.023175707507
c48.51591179995142.161665825319−0.264916946833
c56.1482989371 × 10−64.680494293 × 10−68.651454913 × 10−8
c6−0.04417223462350.005695657529−0.000427317332
c7−0.00756349833080.0192109192770.000941485688
c8−0.0001590541067−6.605875852 × 10−56.194962197 × 10−6
c90.0033515051403−0.000693175621−0.000325469465
c10−0.1197790303992−0.2235540320390.015477710082
Table 3. Mean monthly values and their standard deviations (sd) for meteorological stations in the Kłodzko region in period 1980–2006.
StationIIIIIIIVVVIVIIVIIIIXXXIXII
Długopole-ZdrójMean−14.4−11.0−3.74.813.718.221.921.815.24.7−5.8−12.9
sd14.514.413.512.910.38.47.97.88.510.812.113.1
KłodzkoMean−12.9−12.9−9.8−5.24.313.618.021.121.314.65.0−6.0
sd12.012.111.710.58.67.77.57.37.89.710.511.7
Lądek-ZdrójMean−9.9−7.5−2.07.315.618.421.421.514.96.6−3.1−8.8
sd11.011.411.310.78.68.17.67.68.210.010.010.3
SłoszówMean−12.7−12.7−10.1−3.95.012.815.918.118.712.14.9−5.0
sd10.411.211.911.08.89.09.08.59.59.910.610.7
Publisher’s Note: MDPI stays neutral with regard to jurisdictional claims in published maps and institutional affiliations.

