Article

Optimal Operation of Microgrids with Demand-Side Management Based on a Combination of Genetic Algorithm and Artificial Bee Colony

by
Masoud Dashtdar
1,*,
Aymen Flah
2,*,
Seyed Mohammad Sadegh Hosseinimoghadam
1,
Hossam Kotb
3,
Elżbieta Jasińska
4,
Radomir Gono
5,
Zbigniew Leonowicz
6 and
Michał Jasiński
6
1
Electrical Engineering Department, Bushehr Branch, Islamic Azad University, Bushehr 7515895496, Iran
2
National Engineering School of Gabès, Processes, Energy, Environment and Electrical Systems, University of Gabès, LR18ES34, Medinine 6072, Tunisia
3
Department of Electrical Power and Machines, Faculty of Engineering, Alexandria University, Alexandria 21526, Egypt
4
Department of Operations Research and Business Intelligence, Wrocław University of Science and Technology, 50-370 Wroclaw, Poland
5
Department of Electrical Power Engineering, Faculty of Electrical Engineering and Computer Science, VSB—Technical University of Ostrava, 708-00 Ostrava, Czech Republic
6
Faculty of Electrical Engineering, Wrocław University of Science and Technology, 50-370 Wroclaw, Poland
*
Authors to whom correspondence should be addressed.
Sustainability 2022, 14(11), 6759; https://doi.org/10.3390/su14116759
Submission received: 22 April 2022 / Revised: 23 May 2022 / Accepted: 27 May 2022 / Published: 31 May 2022
(This article belongs to the Section Resources and Sustainable Utilization)

Abstract

:
An important issue in power systems is the optimal operation of microgrids with demand-side management. The implementation of demand-side management programs, on the one hand, reduces the cost of operating the power system, and on the other hand, the implementation of such programs requires financial incentive policies. In this paper, the problem of the optimal operation of microgrids along with demand-side management (DSM) is formulated as an optimization problem. Load shifting is considered an effective solution in demand-side management. The objective function of this problem is to minimize the total operating costs of the power system and the cost of load shifting, and the constraints of the problem include operating constraints and executive restrictions for load shifting. Due to the dimensions of the problem, the simultaneous combination of a genetic algorithm and an ABC is used in such a way that by solving the OPF problem with an ABC algorithm and applying it to the structure of the genetic algorithm, the main problem will be solved. Finally, the proposed method is evaluated under the influence of various factors, including the types of production units, the types of loads, the unit uncertainty, sharing with the grid, and electricity prices all based on different scenarios. To confirm the proposed method, the results were compared with different algorithms on the IEEE 33-bus network, which was able to reduce costs by 57.01%.

1. Introduction

Today, power system operators face issues such as significant load changes, rapid demand growth, and the geographical expansion of customers. On the other hand, due to the reduction of fossil resources, low energy efficiency, and environmental policies, investors are reluctant to build fossil fuel power plants and a new challenge has arisen involving the use of power generation resources to operate the power system. Therefore, these problems have increased the tendency to generate power at the distribution voltage level. Therefore, the appropriate solution is to build small networks independent of the main networks or microgrids [1,2].
The optimal operation of power systems requires the use of proper planning, which is mainly conducted in three sections: long-term planning, medium-term planning, and short-term planning. Microgrids also have been planned in these three intervals. In long-term planning, each microgrid must anticipate the purchase and installation of generators by the load growth forecast. Medium-term planning should take into account repair times, the maintenance of generators and storage, and fuel costs. Short-term planning for microgrids is done in one week, one day, and one-hour intervals, and the purpose of doing so is to determine the output power of the units [3,4].
In a microgrid, the energy management system is responsible for the optimal operation of the microgrid in the presence of programmable distributed generation (DG) units, probabilistic DG units, interruptible loads, energy storage units, and final consumers as the central core [5]. In [6], the operation of microgrids equipped with renewable resources and power storage resources is investigated. In [7], a smart microgrid is used and it is shown that the use of a smart microgrid not only increases energy efficiency but also enables a complementary and effective network that can improve reliability and power quality. In [8], it is shown that by installing suitable energy storage, changes, and fluctuations, the active power can be stabilized and the microgrid frequency can be maintained within the specified limit. In [9], a microgrid equipped with the energy management center system is introduced, whose task is to optimize the operation of the microgrid in both island and grid-connected modes. In [10], which focuses on an important criterion of meeting the power demand with the minimum operating cost, the use of an optimal combination of the main grid and microgrid with a 24-h planning horizon is introduced. In [11], economic planning is used for production and load, which requires management of the demand side. In [12], a market strategy is described, because with the increasing expansion of small sources of energy generation the production planning of small units acting as large generation units necessitates such a market strategy.
In [13,14], a Fuzzy-PSO self-adaptation algorithm for power flow in a specific microgrid is presented considering economic and environmental issues. The results indicate that with the high participation of renewable resources, the reduction of pollution and microgrid costs is serious and the energy exchange between the microgrid and the network connected to it has many benefits. In [15], the authors provide a multi-agent system for smart energy management on the demand side for microgrids, which includes predictive algorithms to improve system management. The simulation results show that the smart demand-side management system has met all the design objectives and has also led to the effective operation of boundary conditions in the microgrid. In [16], PSO applications for real-time energy management solutions for hybrid systems are presented and the results show that the proposed method can combine a wide range of solutions to integrate many objectives such as reducing costs, increasing wind turbine efficiency, and reducing environmental pollution. The management of microgrid units requires an accurate economic model to describe the operation costs of generating power. This model continues to be discrete and nonlinear; therefore, a strong and effective optimization tool is needed to reduce operating costs to a minimum. Various algorithms have been used to solve such models. For example, in [17], the problem of optimal microgrid management based on the flexible load shaping DSM strategy as well as the price-based and incentive-based demand response programs is solved through the Black Widow Optimization algorithm. In [18], the fmincon interior-point algorithm is used for the optimal operation of the microgrid consisting of photovoltaics with a diesel generator under the probabilistic scenario. In [19], the authors provide a real-time predictive control model to minimize the cost of operation of the microgrid under uncertainty. Further authors discuss the application of algorithms in these references: in [20], a Quantum Particle Swarm Optimization algorithm is discussed; in [21], four heuristically guided optimization algorithms; in [22], a self-crossover genetic algorithm; in [23], a two-level genetic algorithm to solve microgrid energy management problem has been implemented.
In this paper, by developing common methods in the operation of the power system, and by considering the appropriate constraints, the problem of optimal operation of microgrids along with demand-side management has been formulated. The objective function is to minimize operating costs and demand-side management costs, and the constraints of optimization include constraints on generators and constraints on power balance. Also, the amount of load shifting in terms of hours has been considered a problem variable, and to solve this optimization problem, a combined genetic algorithm and ABC have been used. The following is the division of the article: In the second part, the demand side management is introduced, in the third part, the objective function of the problem and the formulation method is defined, and in the fourth part, the problem-solving method is presented and in the fifth part, the simulation results of the proposed method are shown, Finally, a conclusion is presented in the sixth section.

2. Demand-Side Management

Demand-side management generally refers to programs that affect the electricity consumption pattern of subscribers. In other words, some activities are designed by electricity companies to change the amount of time of electricity consumption in a way that provides the necessary opportunity to benefit consumers and even themselves. In general, demand-side programs consist of two main parts.
Optimal energy efficiency: The goal of these programs is to reduce energy consumption permanently, which is usually provided by changes in technology and equipment of the final consumer [24,25].
Demand response: These programs are one of the new developments in the field of demand-side management, which means consumer participation in improving the pattern of energy consumption. This partnership is in response to instantaneous price changes [26,27].
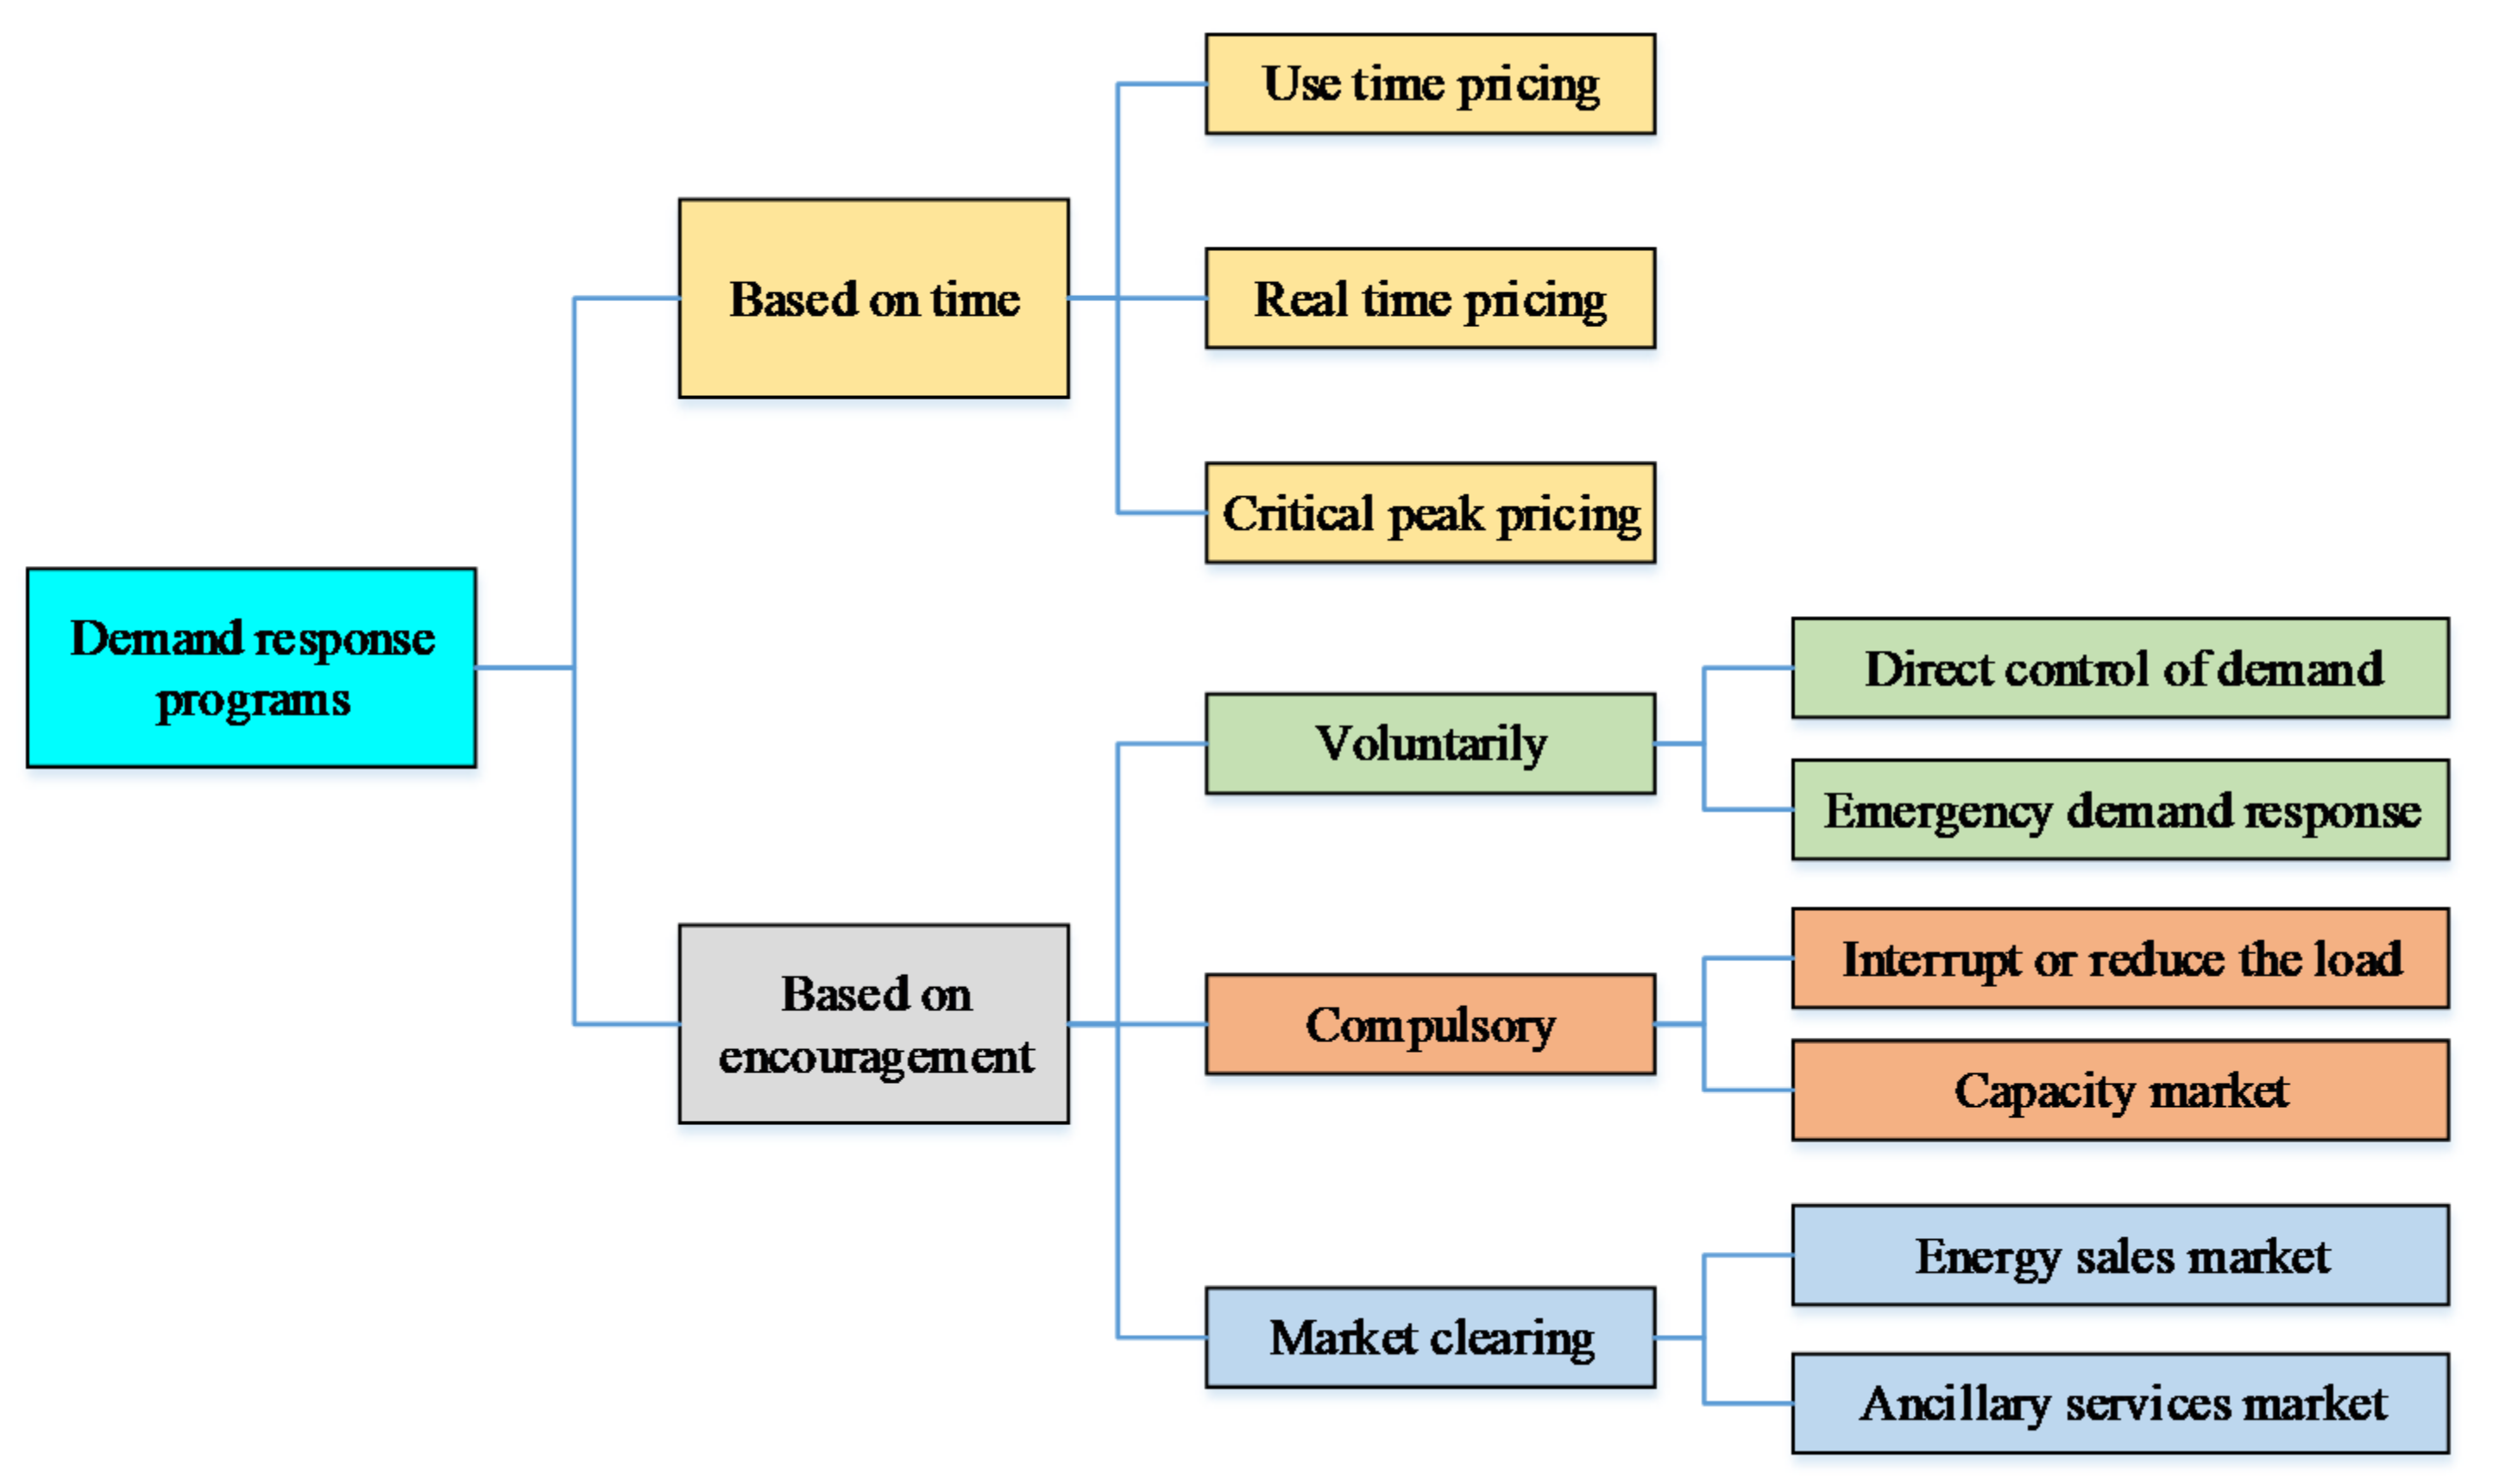
Today, these programs are considered a suitable solution to solve some problems of the deregulated power system. By definition, demand response is the empowerment of industrial, commercial, and residential customers to improve the pattern of electricity consumption to achieve reasonable prices and improve network reliability. In other words, demand response can change the form of electrical energy consumption in such a way that the system load peak is reduced and consumption is shifted to non-peak hours [28]. In general, demand response methods can be divided into two general categories, which are: electricity price-based demand response programs, and incentive-based demand response programs, and Figure 1 show the classification of demand response programs.
In this paper, among the various demand-side management programs, the load shifting program has been used to reduce peak load and increase network load during low load hours (ie de-peaking and filling the valley). There are also restrictions on the shifting of consumption time for each of the loads. Because consumption time-shifting causes customer dissatisfaction, in this paper, an inconvenience function is used to consider the cost of load shifting.

3. Formulation of the Problem

Optimal unit generation planning is formulated as an optimization problem. In the optimal operation of a microgrid, on the one hand, the lowest cost is considered and on the other hand, operation constraints and demand-side management constraints must be considered. In this issue, the total generation costs and costs of implementing demand-side management are considered in objective functions. Therefore, the objective function of the problem of optimal operation of microgrids can be defined as Equation (1) by considering the demand-side management [29].
min F = w 1 × C F + w 2 × D C
where F is the total operating costs of the microgrid, CF is the total operating costs of the power generation units, and DC is the total cost of implementing the demand-side programs. The coefficients w1 and w2 are the weight coefficients of the cost of operating the network and the cost of implementing demand-side management programs, respectively. If these two coefficients are considered as one, the value of operation cost and demand-side management cost are considered the same. But if the goal is to add more value to consumption management programs, the weight factor w2 can be considered larger [30].
The execution of the use-time shift program causes dissatisfaction among the subscribers. Therefore, the cost of implementing the load shifting program in this paper is modeled as an inconvenience function as a third-degree function according to Equation (2)
D C = l = 1 m A l s t l 3 + B l s t l 2 + C l s t l
where l is the numeral of loads that can be shifted and the coefficients A, B and C are related to the cost of shifting for that load. stl is the number of hours of load I shifting and m is the total number of shiftable loads. Operating costs of generation units include generation costs, starting costs, and maintenance costs. Also, because in the microgrid it is possible to buy or sell energy to the network, the cost of buying and selling energy from the network is included in the operation cost function. Equation (3) shows the CF operation cost function in the optimization problem [31].
C F = t = 1 T i = 1 I C i , t + M C i , t + S C i , t + t = 1 T C t R t
where C(i, t) is the cost of generating power of unit i at hour t of operation, MC(i, t) is the cost of maintenance and SC(i, t) is the cost of starting unit i at hour t. Also, C(t) is the cost of electricity purchased at hour t is from the grid, and R(t) is the revenue from energy sales at that time. I is the number of power generation units and T is the study time (T = 24) in terms of the hour. Here I can include a variety of generation units such as photovoltaic (PV) cells, wind turbine (WT), microturbine (MT), fuel cell (FC), and battery (Bat) with a different cost functions. The model used to calculate the wind turbine output power in terms of wind speed according to Equation (4) is:
P W T = 0 0 < V < V c i a · V 2 + b · V + c P r V c i < V < V r P r V r < V < V c o 0 V c o < V <
where, P r : rated power of wind turbine, Vci, and Vco: minimum and maximum allowable wind speed; Vr and V: are the nominal speed and the actual speed of the wind, respectively. The coefficients a, b and c are obtained according to the catalog information of the existing device. The power generated by solar cells depends on the intensity of light and ambient temperature, which is obtained according to Equation (5):
P P V = P S T C G I N C G S T C 1 + k T c T r
where, P P V : solar cell output power at ambient radiation intensity; PSTC: Maximum cell generation power under standard test conditions;   G I N C : ambient light intensity; G S T C : Radiation intensity under standard test conditions, k: Output power temperature coefficient; Tc: cell temperature, Tr: reference temperature. Renewable sources of WT and PV generate electricity through wind and solar energy instead of fuel. Therefore, the fuel cost for these units will be zero. On the other hand, the investment cost of constructing these units is heavy and should be considered along with the maintenance costs in examining the microgrid status from an economic perspective. Accordingly, the total cost of WT and PV units is calculated using Equation (6):
C R E S = t = 1 24 P W T , t × A C × I W T I n v × I W T M + t = 1 24 P P V , t × A C × I P V I n v × I P V M
where C R E S : cost of renewable units, AC: annual cost factor, IInv: ratio of investment cost to generate power of the unit, IM: unit maintenance cost.
The output power of the diesel generator (DE) is controlled by the governor installed on it. The amount of diesel generator fuel consumption (L/h) as a quadratic function of generating power is as Equation (7):
C D E = α · P D E 2 + β · P D E + γ
where, C D E : diesel generator fuel consumption cost L/h, P D E : diesel generator output power; α, β and γ are constant coefficients. According to Equation (8), fuel cell efficiency is the output power to the input fuel if both are calculated in the same unit.
C F C = C g a s F C P F C μ F C
where C F C : the cost of fuel consumed by a fuel cell ($/h); C g a s F C : the price of natural gas to feed the fuel cell ($/kWh); PFC: the output power of the fuel cell; μ F C : the efficiency of the fuel cell. According to Equation (9), the economic model of a microturbine is similar to a fuel cell, except that the efficiency of the microturbine increases with increasing power.
C M T = C g a s M T P M T μ M T
The cost of electricity purchased C(t) and sold R(t) (Equation (3)) is expressed through Equations (10) and (11).
C t = T p p × P p p
R t = T s p × P s p
T p p is the tariff for purchasing electricity from the grid, P p p is the power purchased from the grid, T s p is the tariff for selling electricity to the grid and Psp is the power sold to the grid. The cost of repairing and maintaining units is directly related to their power generation. Therefore, the cost of repair and maintenance of unit i at hour t is expressed as Equation (12).
M C i , t = P i , t × K i
where K i is the cost of repair and maintenance of unit i per kW of electrical power and P i , t is the output power of unit i per hour t. The starting cost is intended only for fossil fuel generation units. Given that the starting cost is only attributed to each period that the unit is turned on, how to calculate the starting cost of unit i at hour t is given in Equation (13).
S C i , t = S c o s t i × U i , t U i , t 1
where S c o s t i   is the starting cost of unit i and U i , t   is a binary variable that indicates the status of unit i is on or off at hour t. Equality constraints in the problem are the power balance constraint (power flow equations) shown in Equations (14) and (15).
P k G P k L = i = 1 N V k V i G k i cos θ k θ i + B k i s i n θ k θ i
Q k G Q k L = i = 1 N V k V i G k i sin θ k θ i + B k i c o s θ k θ i
Inequality constraints include unit output power constraints, control variable constraints, line power constraints, and voltage constraints, which are expressed in Equations (16) to (19), respectively.
P m i n P P m a x
U m i n U U m a x
P i j P i j m a x
V j m i n V j V j m a x
The shifting time of each load is also considered in the demand response program as a constraint according to Equation (20).
s t l T l , l = 1 , , m
where Tl is the permissible time to shift the load lth.
If the load shift time is known, the optimization problem presented in this section will become an optimal power flow (OPF) problem. By solving the OPF problem, the power generation of each unit and the power received and sent to the global network will be calculated. In this paper, the ABC algorithm is used to solve the OPF problem. Therefore, in the next section, the combination of genetic algorithm and ABC has been used to solve the problem of optimal operation in general.

4. Proposed Hybrid Algorithm

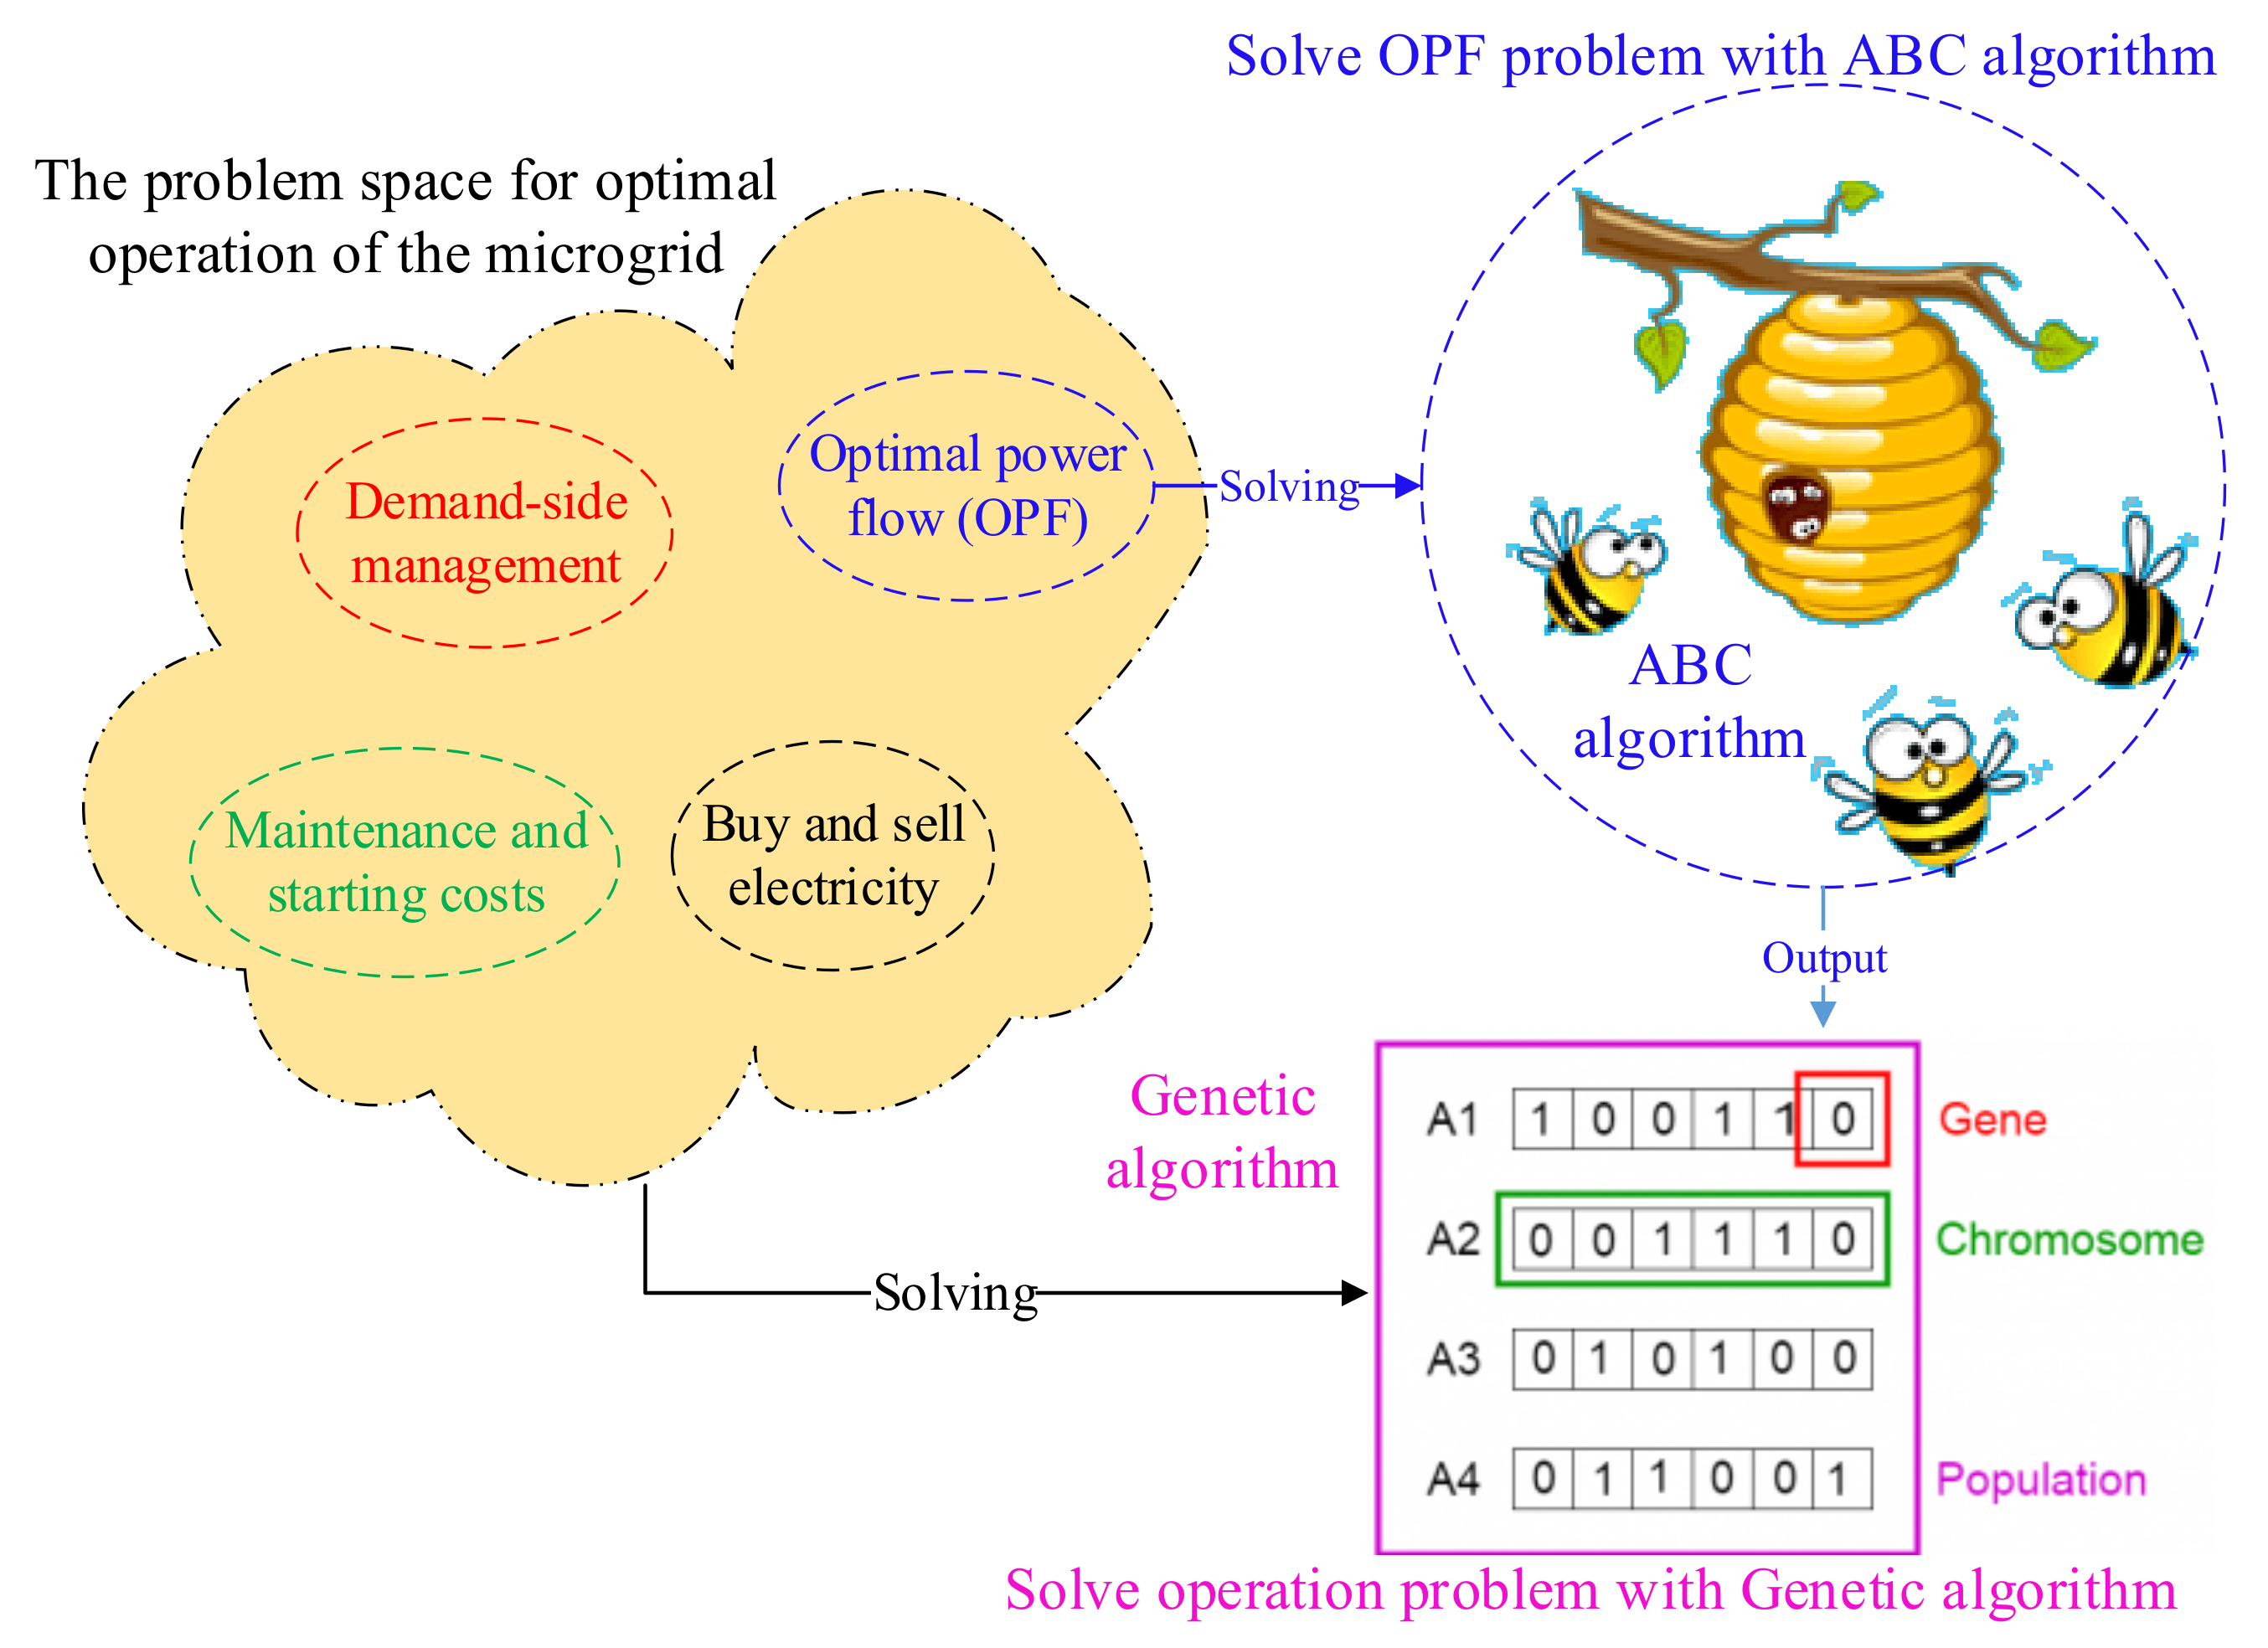
In the proposed algorithm, a combination of the ABC algorithm (to solve OPF) and the genetic algorithm is used to solve the problem of optimal operation of microgrids with demand-side management. As you can see in Figure 2, the optimization problem space has different dimensions, and due to the dependence of the problem on different parameters, in this article, we have tried to avoid reducing computational accuracy and increasing computational speed instead of using an algorithm to solve the problem (which caused complexity) used a combination of ABC and GA algorithms to solve the problem. So that by solving the OPF problem by the ABC algorithm and transferring the output of the algorithm to the GA algorithm, the problem of optimal operation of the microgrid can be solved with better speed and accuracy.
The ABC algorithm is based on collective intelligence. This algorithm simulates the behavior of a bee collecting food. In the real world, bees live in densely populated colonies, creating a complex social organization. This algorithm uses three types of bees (employed bees (forager bees), onlooker bees (observer bees), and scouts bees) that continuously improve the answer. Initial production of all candidate responses is done by scouts bees (the initial population is randomly generated). After that, food nectar is used through the coordinated behavior of all types of bees. Bees from every generation search the space and find food sources of different qualities. Observer bees take advantage of search space near better food sources. Bees with depleted food sources are randomly produced in the scout’s bees phase. These continuous cycles of exploration and exploitation lead to one of the following two situations: (1) the final answer can no longer be searched; (2) food resources have been depleted. Table 1 shows the concepts and parameters of the ABC algorithm.
The steps for implementing the ABC algorithm are as follows: The first stage is the production of the initial population. In such a way that for each bee we have like m and every dimension like i will have:
x m i = l b i + r a n d o m 0 , 1 u b i l b i
In the second stage, the employee bee activity begins. In this case, the entire search space is checked. So for every bee-like m and every random dimension like i and a random bee-like k:
y m i = x m i + m i x m i x k i
f i t n e s s X m ¯ = 1 1 + f X m ¯ i f   f X m ¯ 0 1 + a b s f X m ¯   i f   f X m ¯ < 0
X m ¯ = b e t t e r   o f   X m ¯ , Y m ¯
According to Equation (22), the employee bees go to their food source and choose a new food source in the neighborhood to the previous food source, and according to Equations (23) and (24), after the new position of the employee bee m feed source is obtained, the value of the fitness function (objective function) is recalculated for it. Now if the value of the fitness function for the new answer is better than the previous answer, the previous answer is discarded and the new answer replaces it. Otherwise, the previous answer is preserved.
Next step observer bees randomly select a food source to search. Here the probability of selection of each food source by the observer bees is calculated by Equation (25). The lower the fitness function for a food source, the more probability it is to be selected.
p m = f i t X m ¯ m = 1 P f i t X m ¯
After each of the observer bees selects their desired food source from the food sources of the employee bees, they fly to it and select a new food source in their neighborhood. Equations (22) to (24) is again used to evaluate the value of the fitness function for the new position of the observer bee food source. If the new response value of the fitness function is better than the previous response, it is replaced, otherwise, the previous response is preserved.
Another phase of the ABC algorithm is the presence of scouts bee, which allows you to search for new positions instead of where they can no longer be searched. That is, for each bee m, if its performance does not improve, use Equation (21) to reconstruct it and repeat the process until it reaches the best position.
In this paper, a combination of GA and ABC algorithms is used to improve the speed and accuracy of problem-solving. Part of the problem space, OPF, is solved by the ABC algorithm, and its optimal response is considered as GA algorithm genes. In this method, the disciplines (chromosomes) of the GA algorithm consist of two parts. The first part includes the amount of shifting of each load in terms of hours and the second part includes the optimal response received from the ABC algorithm. Figure 3 shows an example of the disciplines of the GA algorithm. The first part of this discipline has m cells, which is the number of manageable loads. In each cell, the numbers are between 0 and 24, which indicates the shifting of the load (st) in terms of hours. The cells of the second part will include the minimum generation cost and generation power of the units.
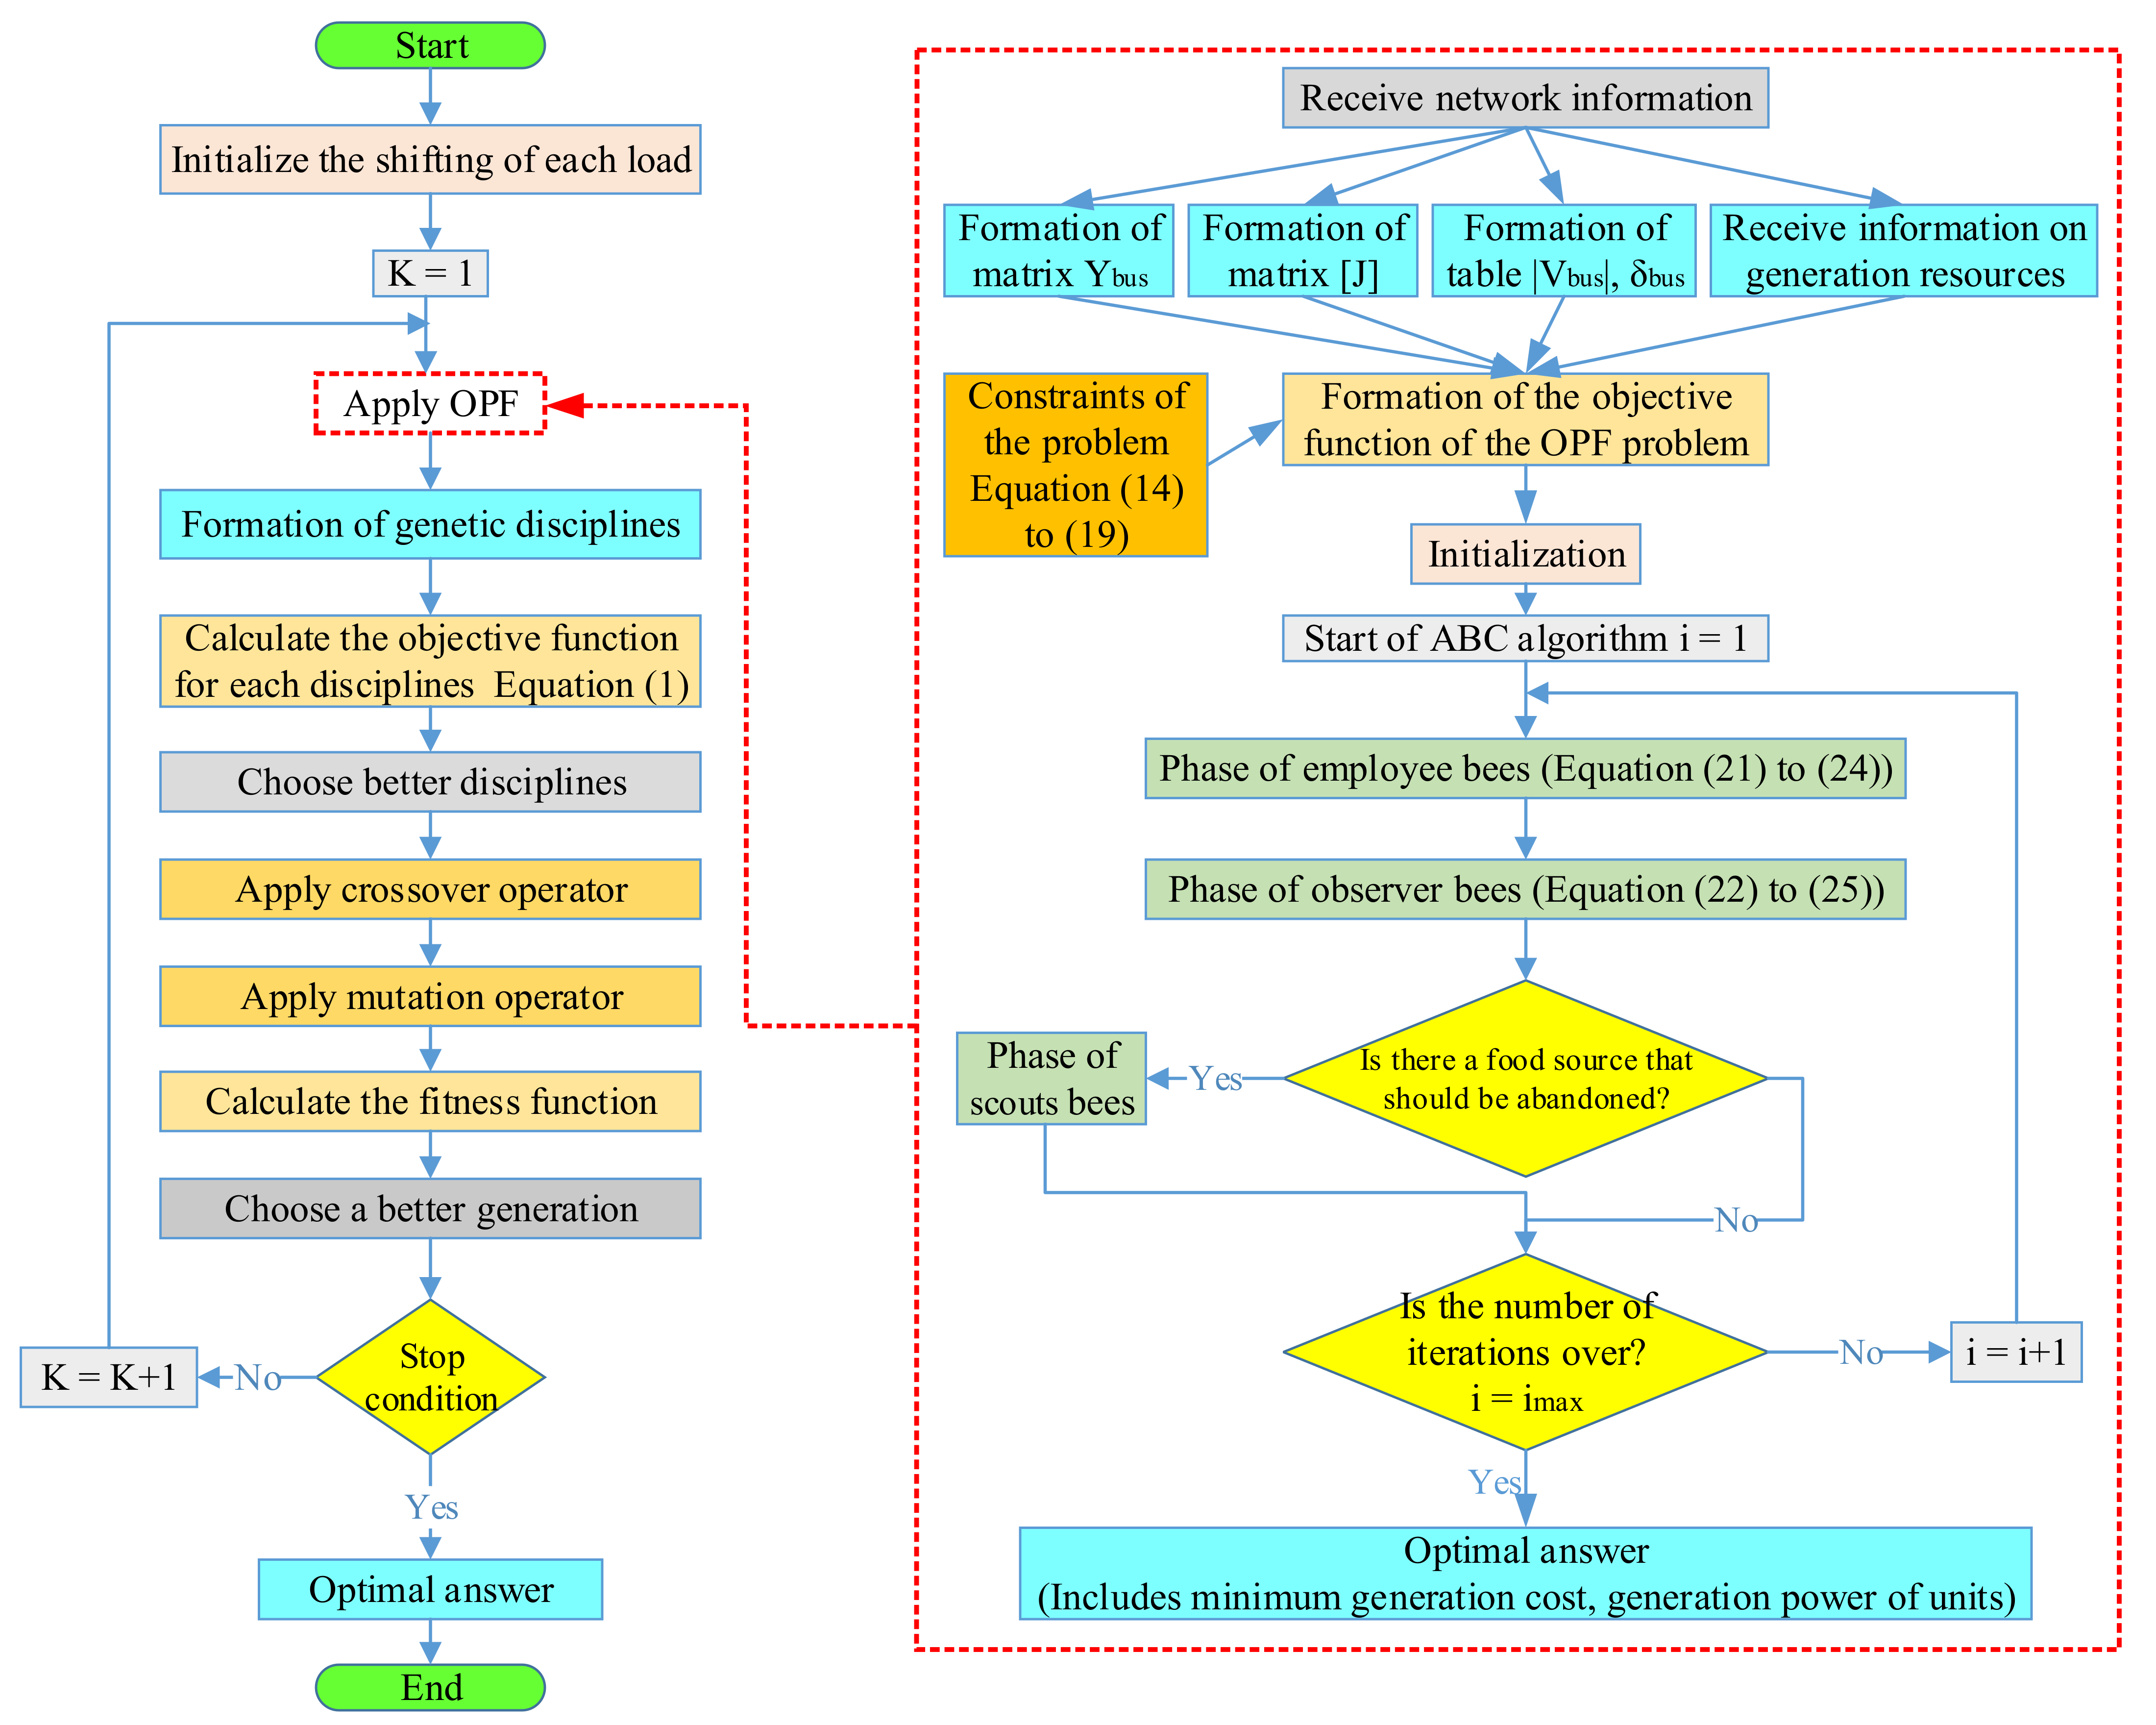
Figure 4 shows a flowchart of the proposed algorithm. In this algorithm, the initial guesses for the shifting of the load in terms of hours are determined randomly. Then, by receiving the network information, the OPF problem is formed and solved through the ABC algorithm. By solving the OPF problem, the optimal amount of unit production is calculated, and also by knowing the number of hours of shifting each load, the cost of shifting the load is calculated and the disciplines of the genetic algorithm are formed. Once these two costs are known for each GA discipline, the objective function and the amount of the fitness function of that discipline are determined. Next, the disciplines that have a higher value from the point of view of the fitness function are selected and genetic operators, including the crossover and mutation operators, are applied to those disciplines. This process is repeated until the final answer is reached. The condition for stopping the algorithm is not to change the answer for a large number of iterations.
5. Simulation Results

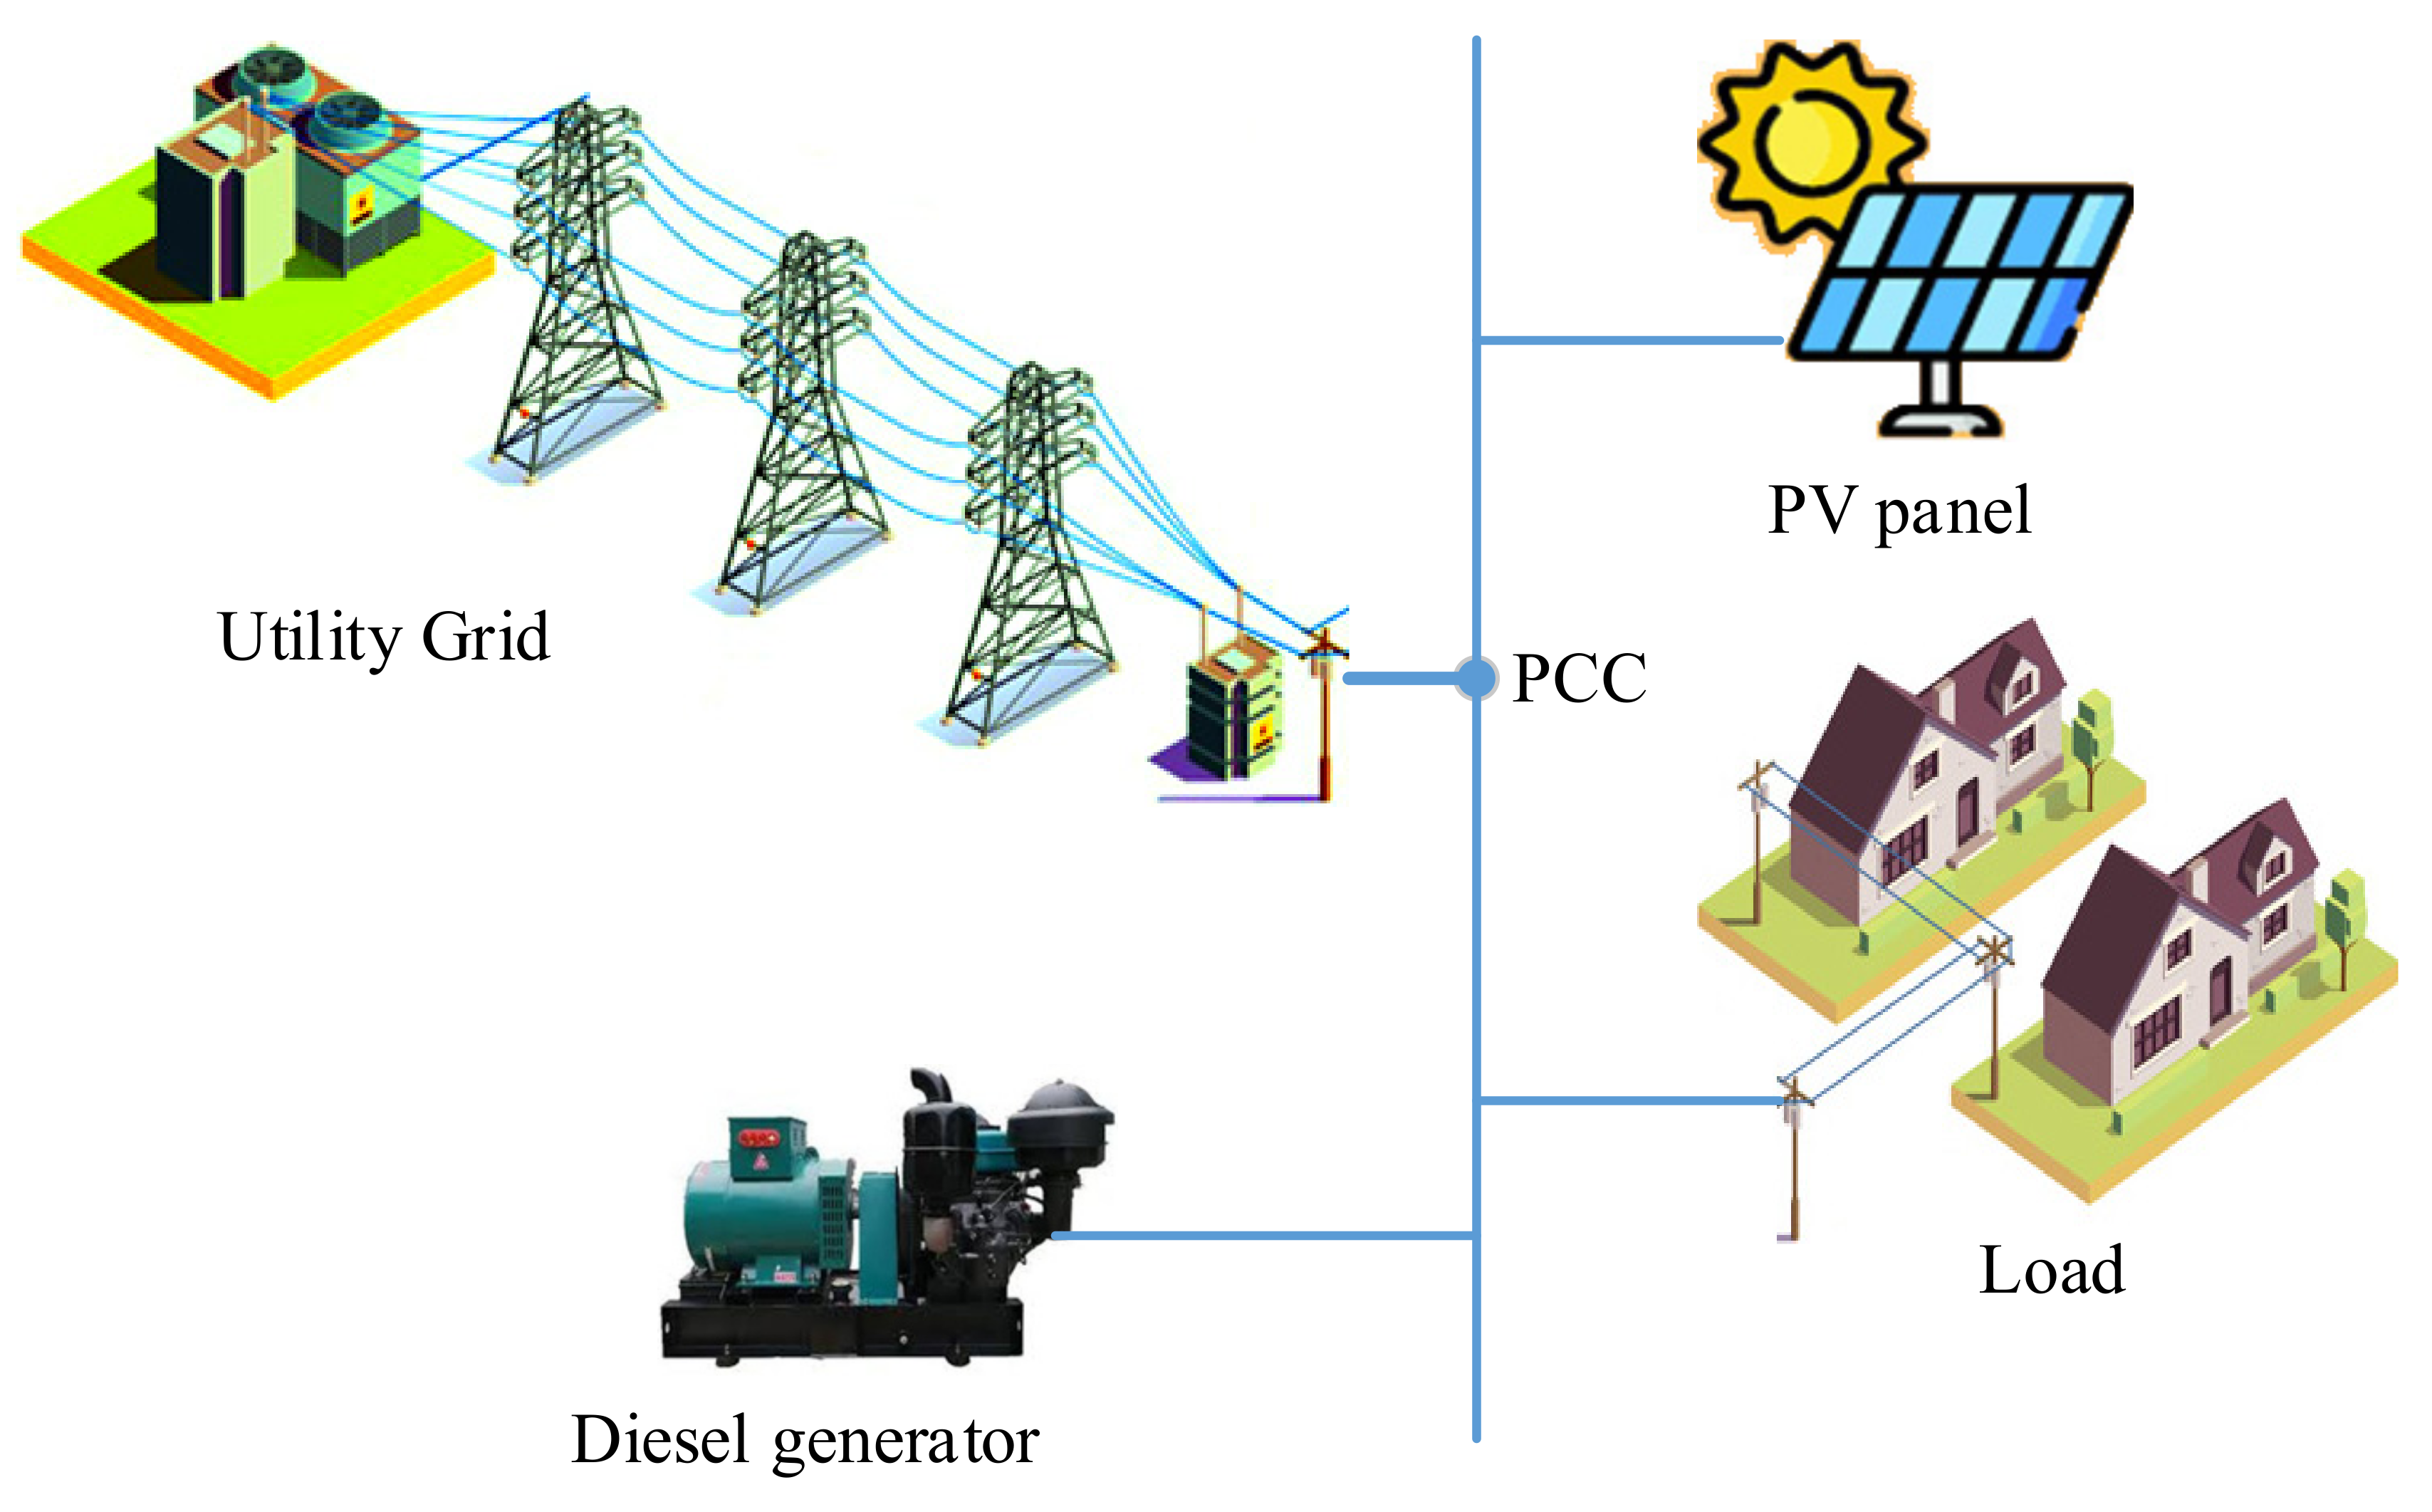
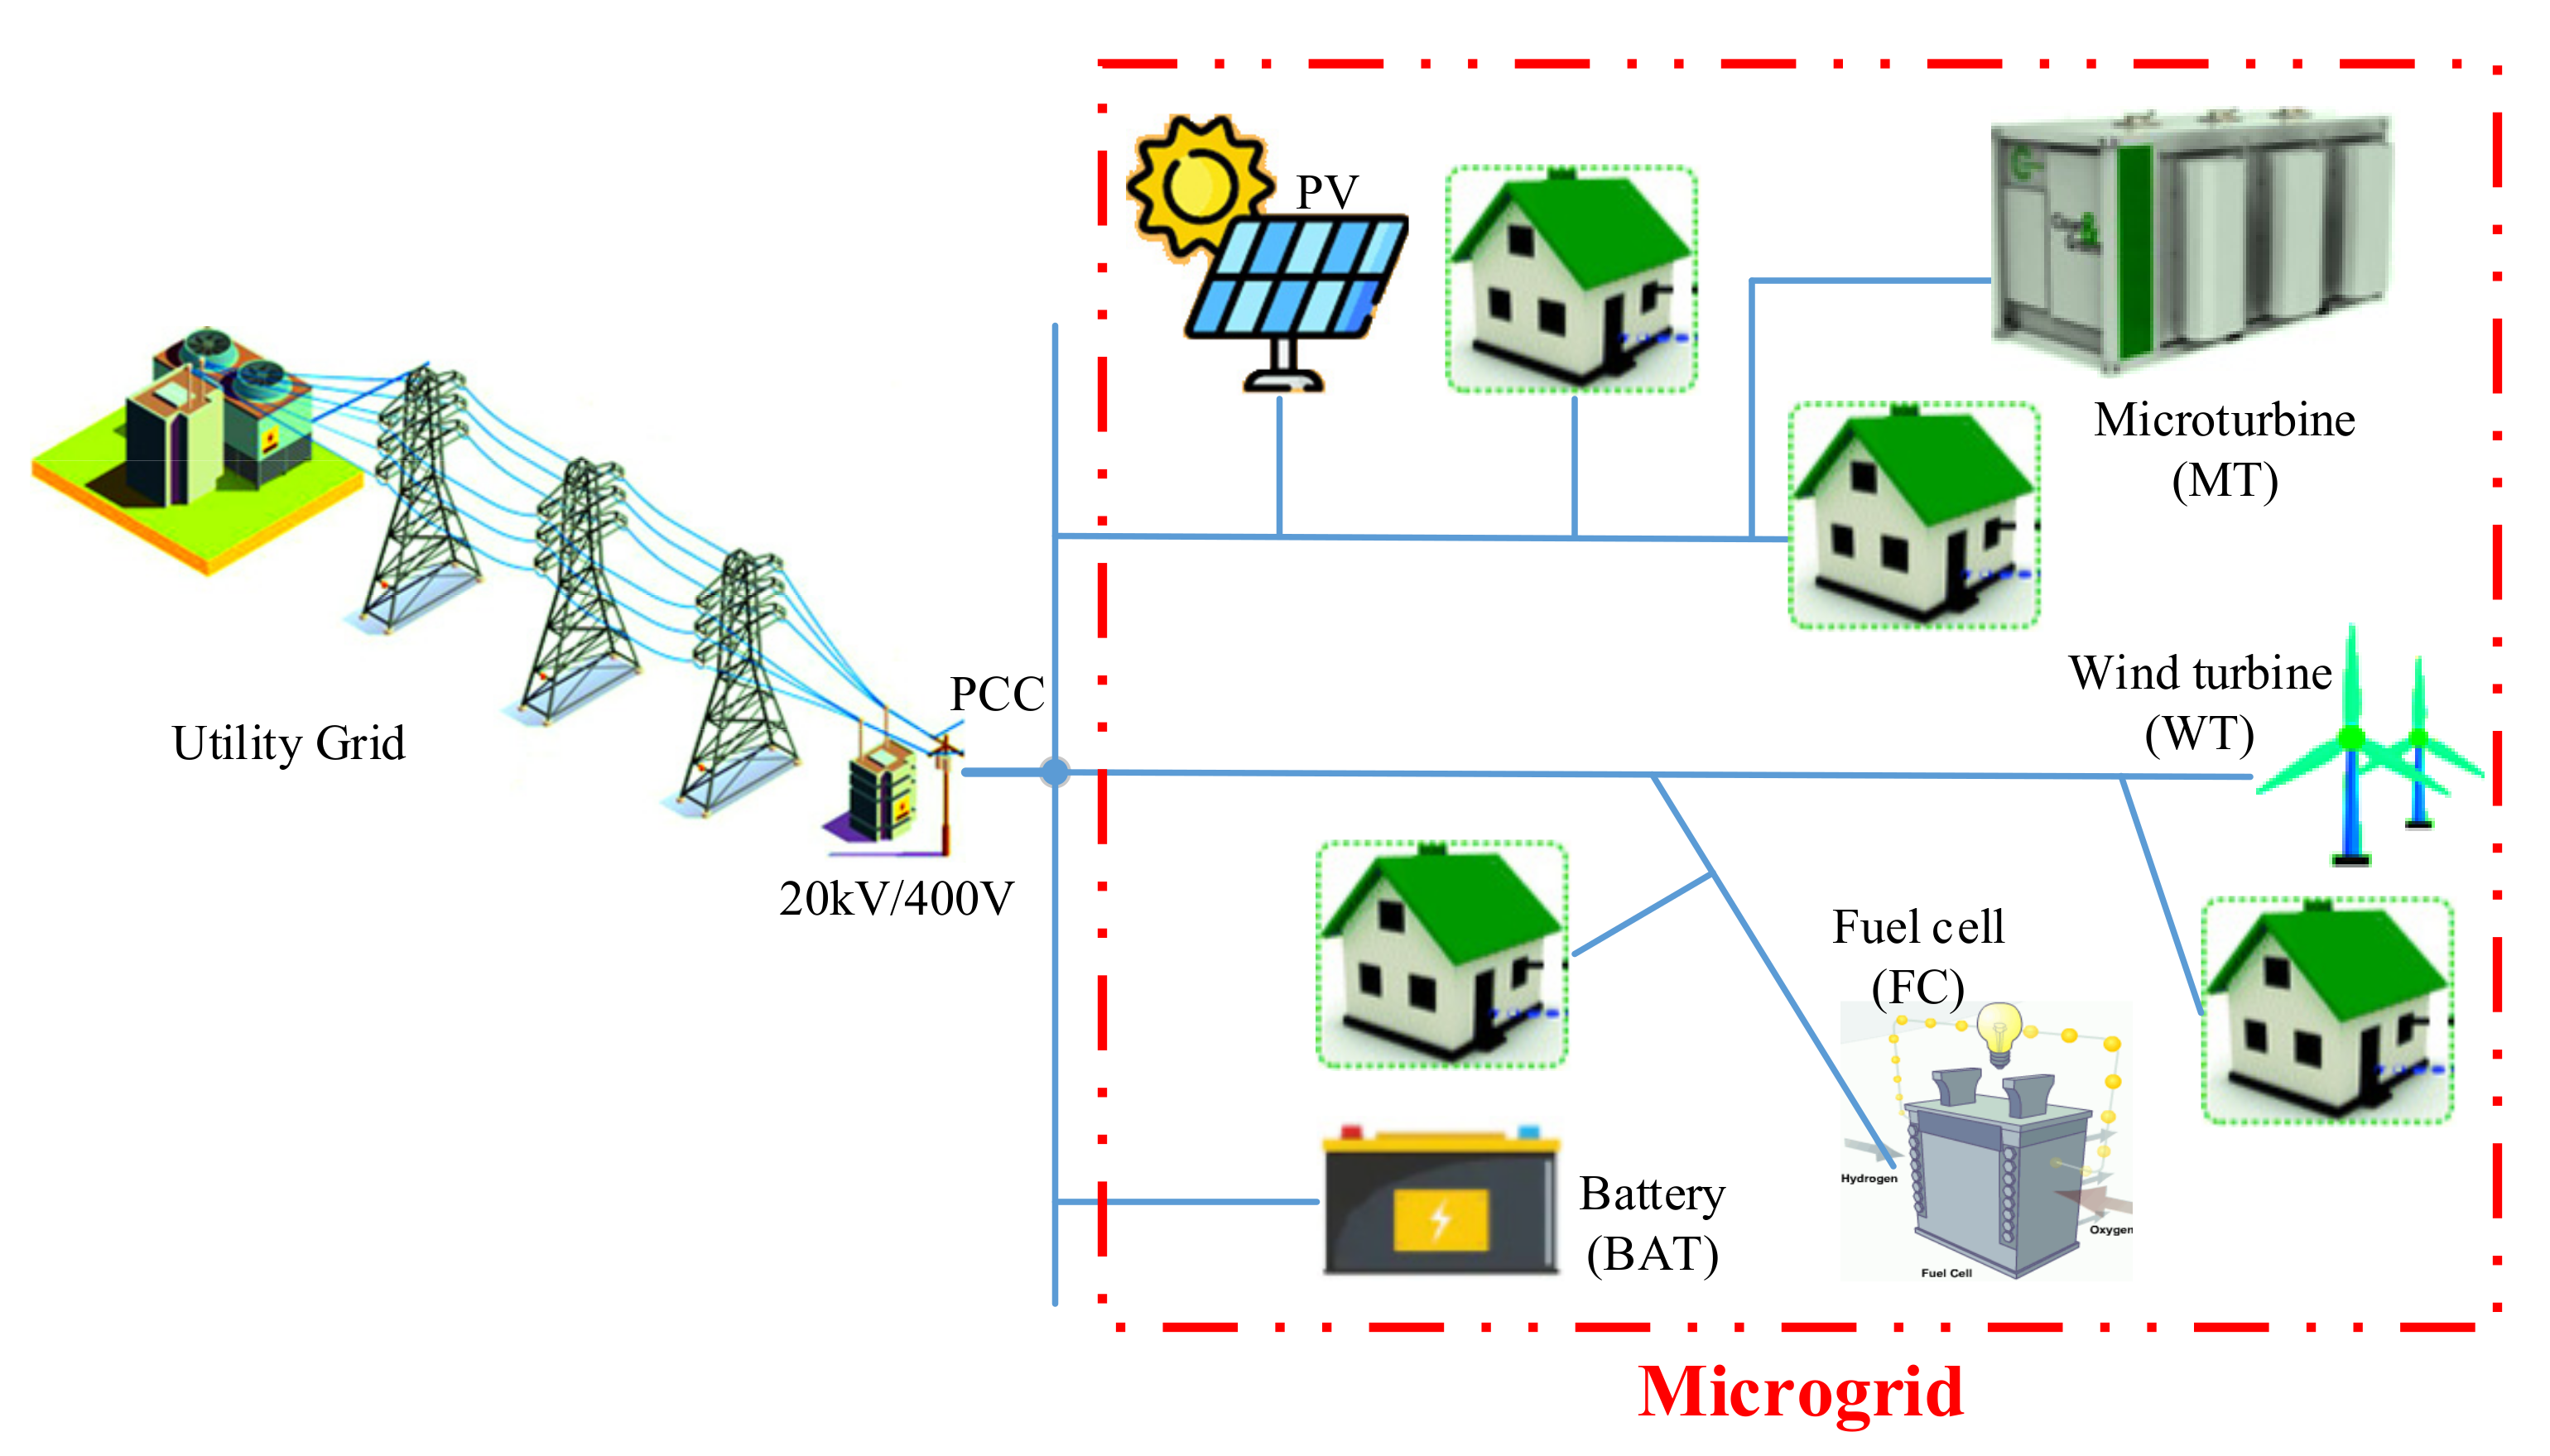
In this section, the proposed method is evaluated for different situations and the results are presented. An example of the microgrid used in this paper is shown in Figure 5. Which is connected to the main grid from the PCC point. This network has a diesel generator, PV panel, and various loads.
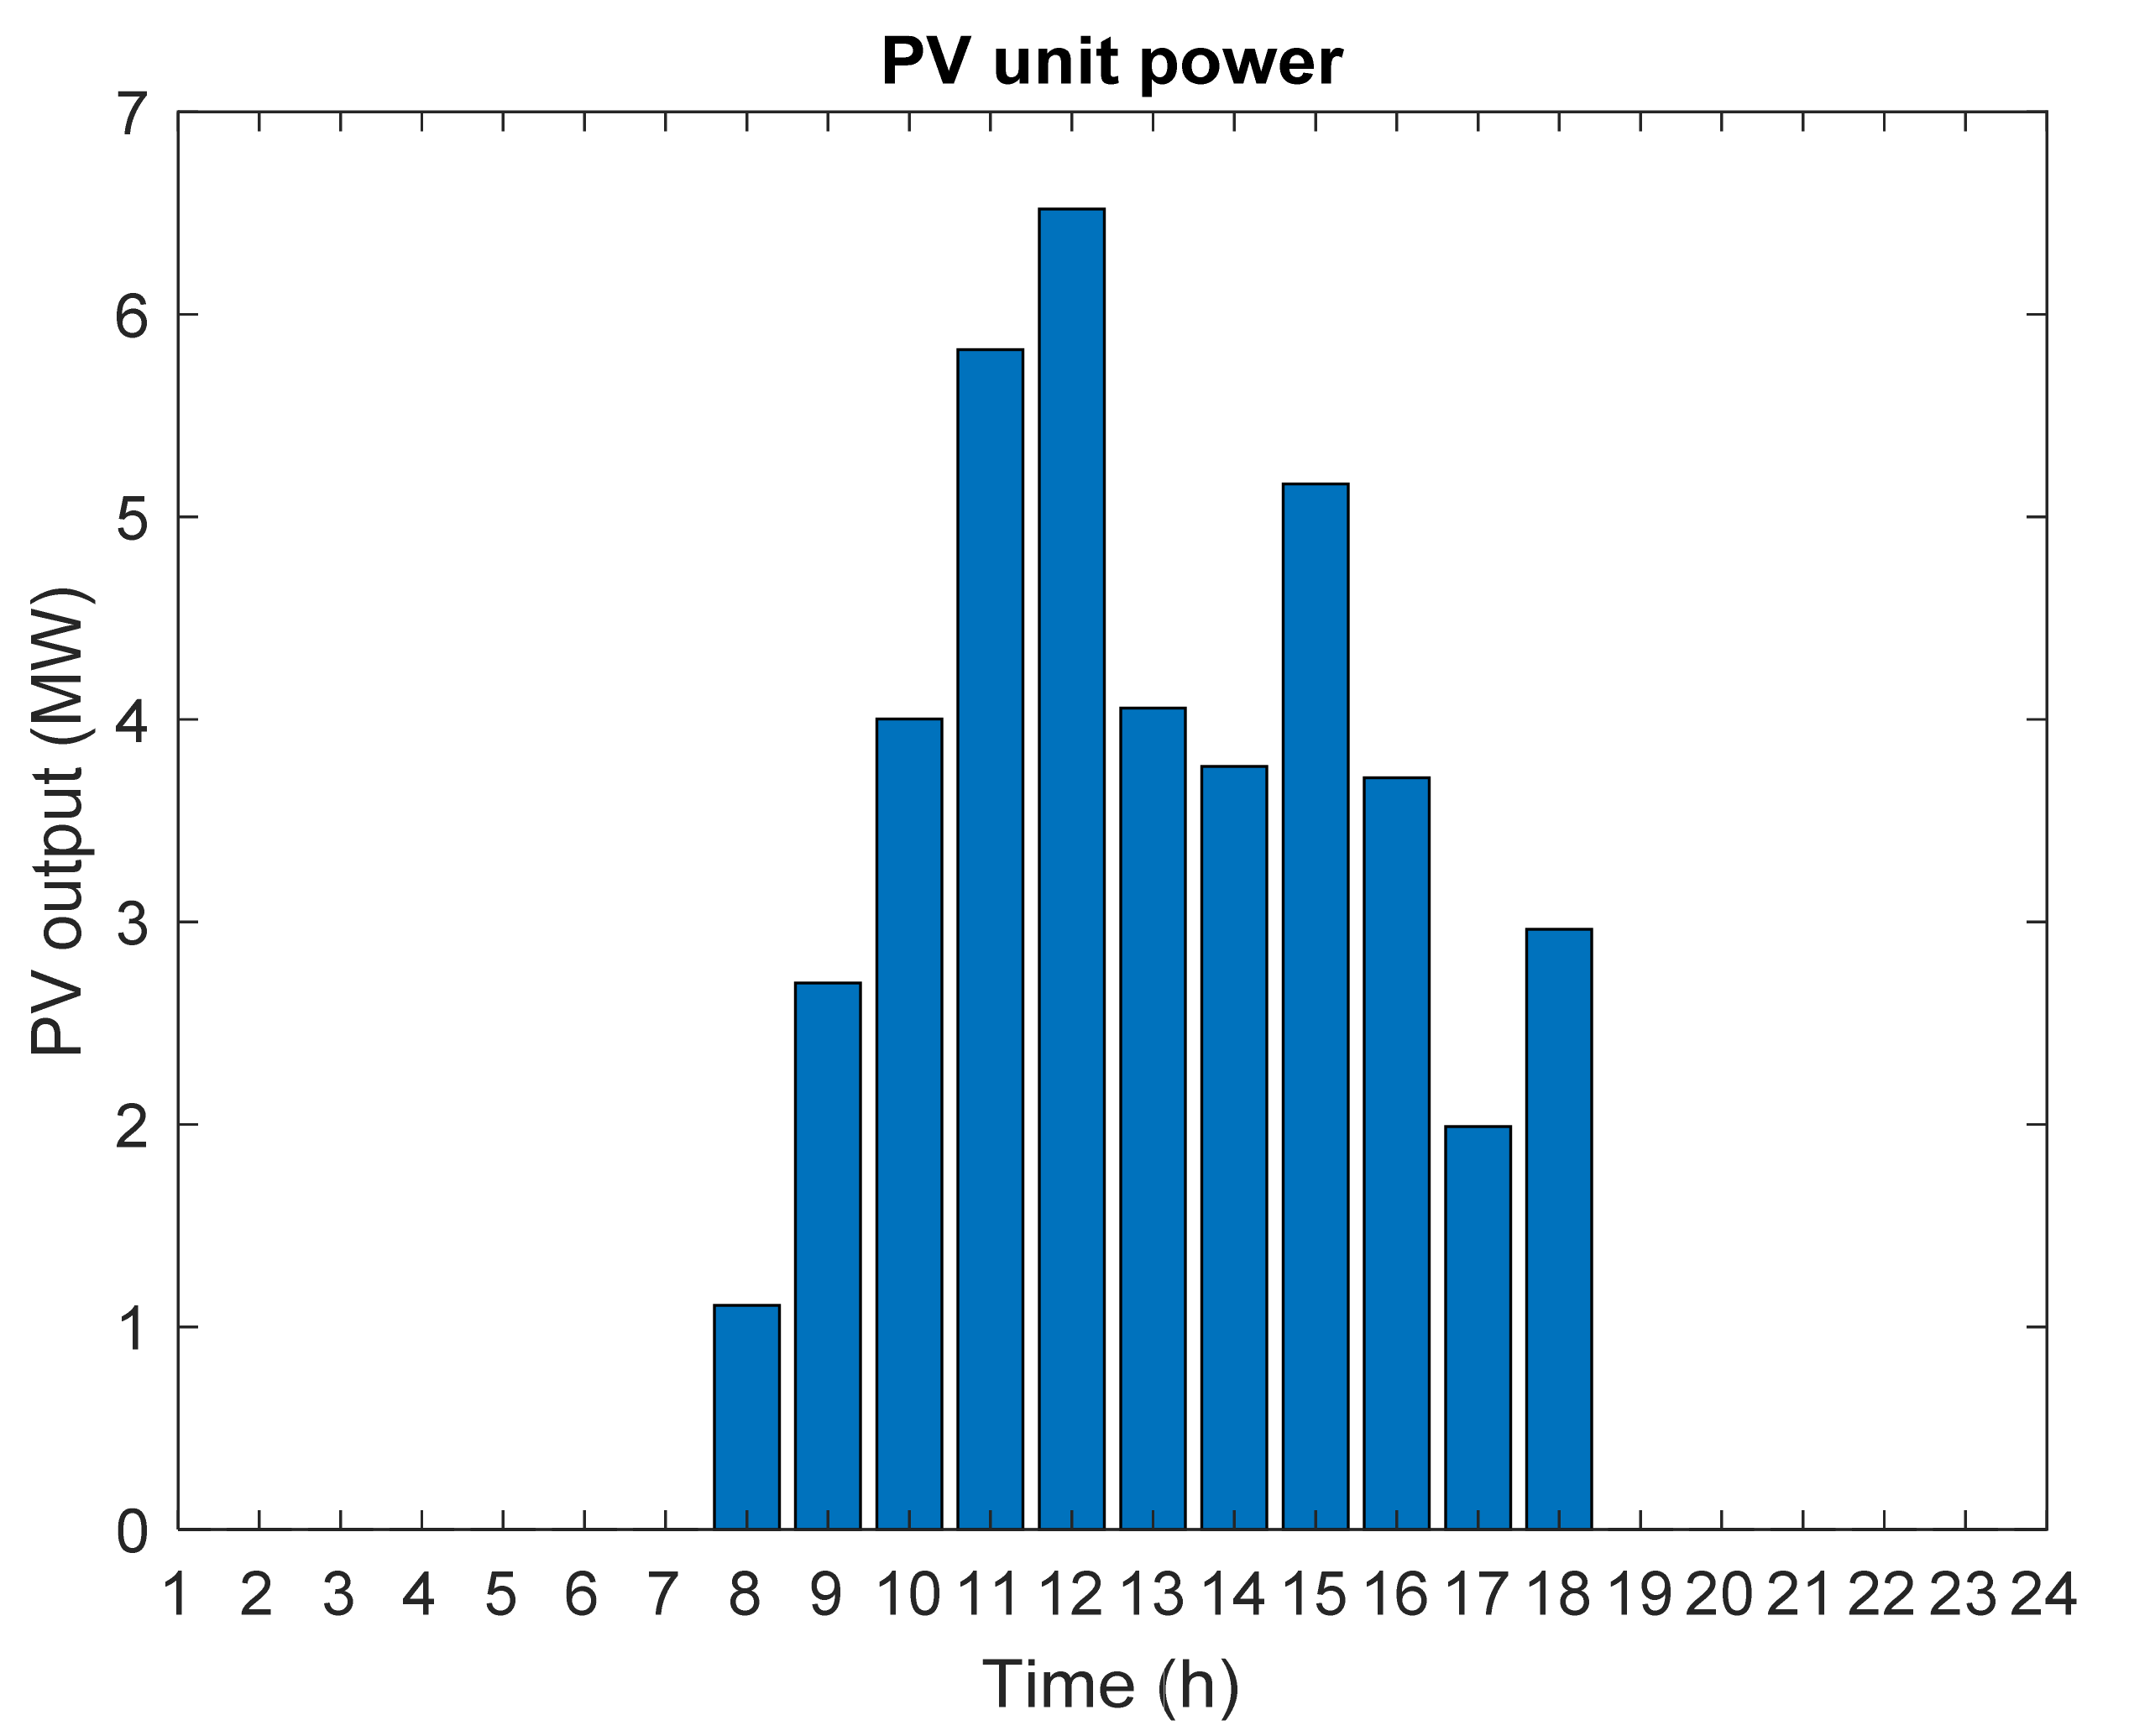
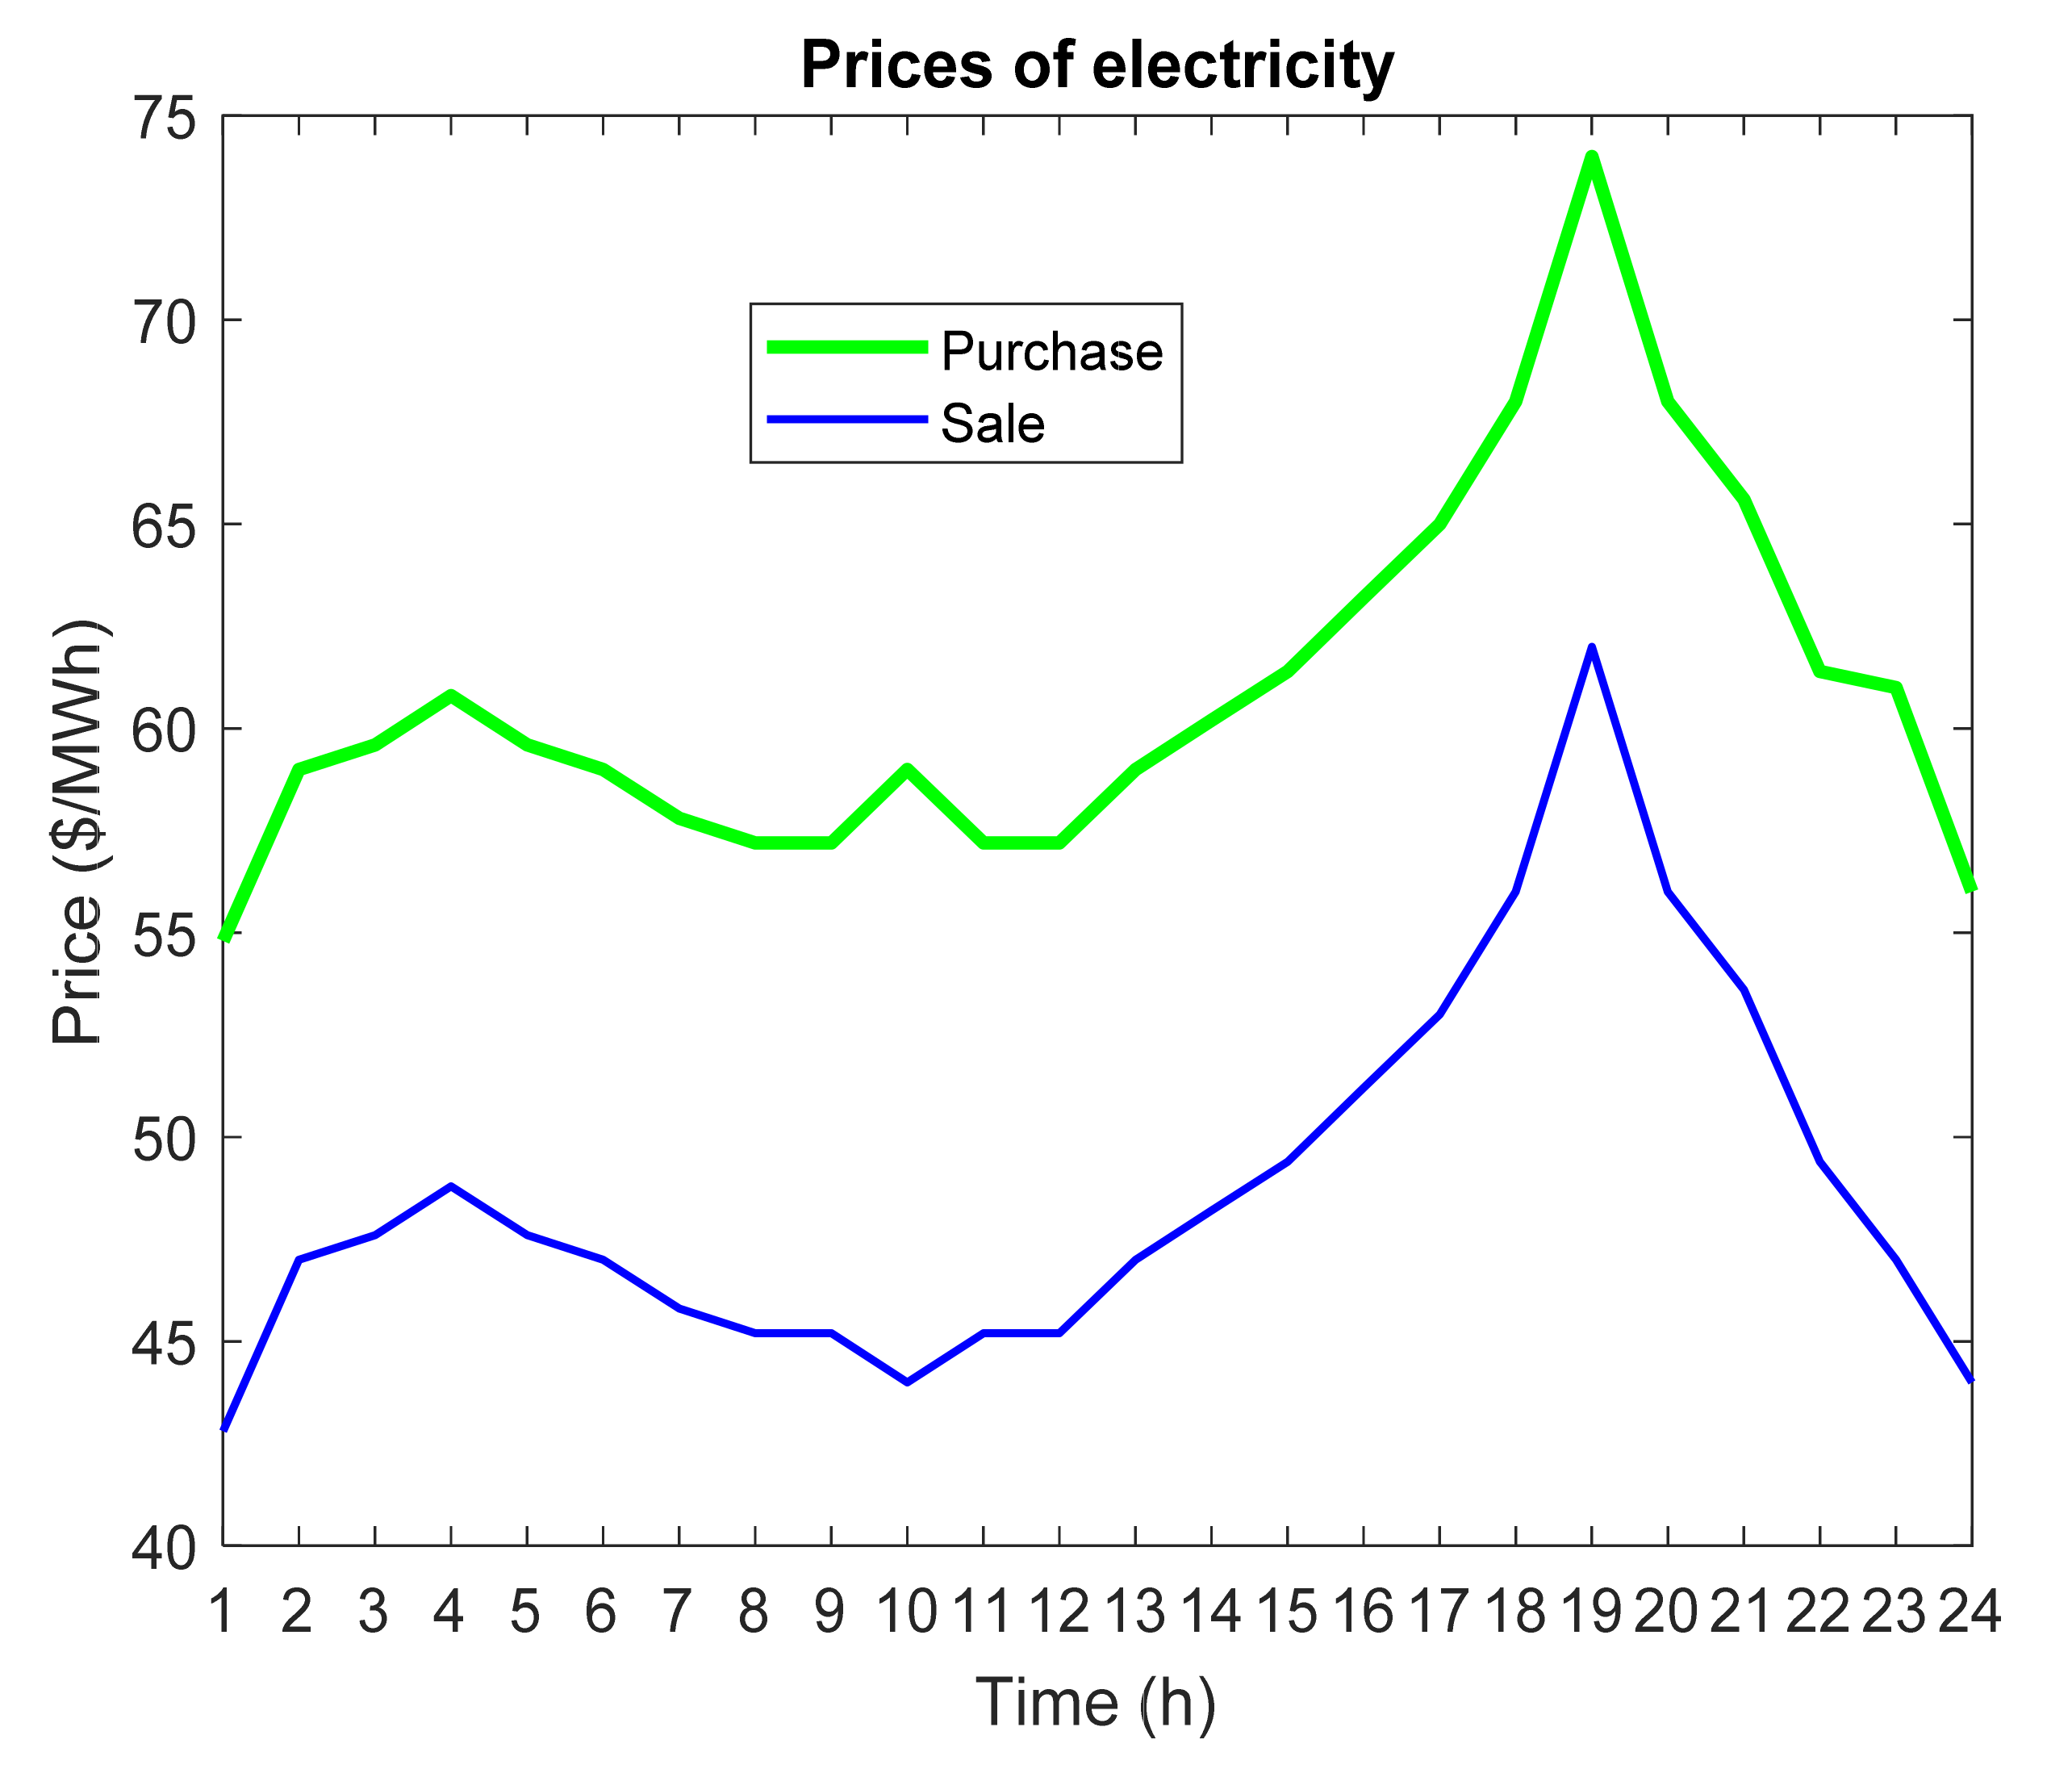
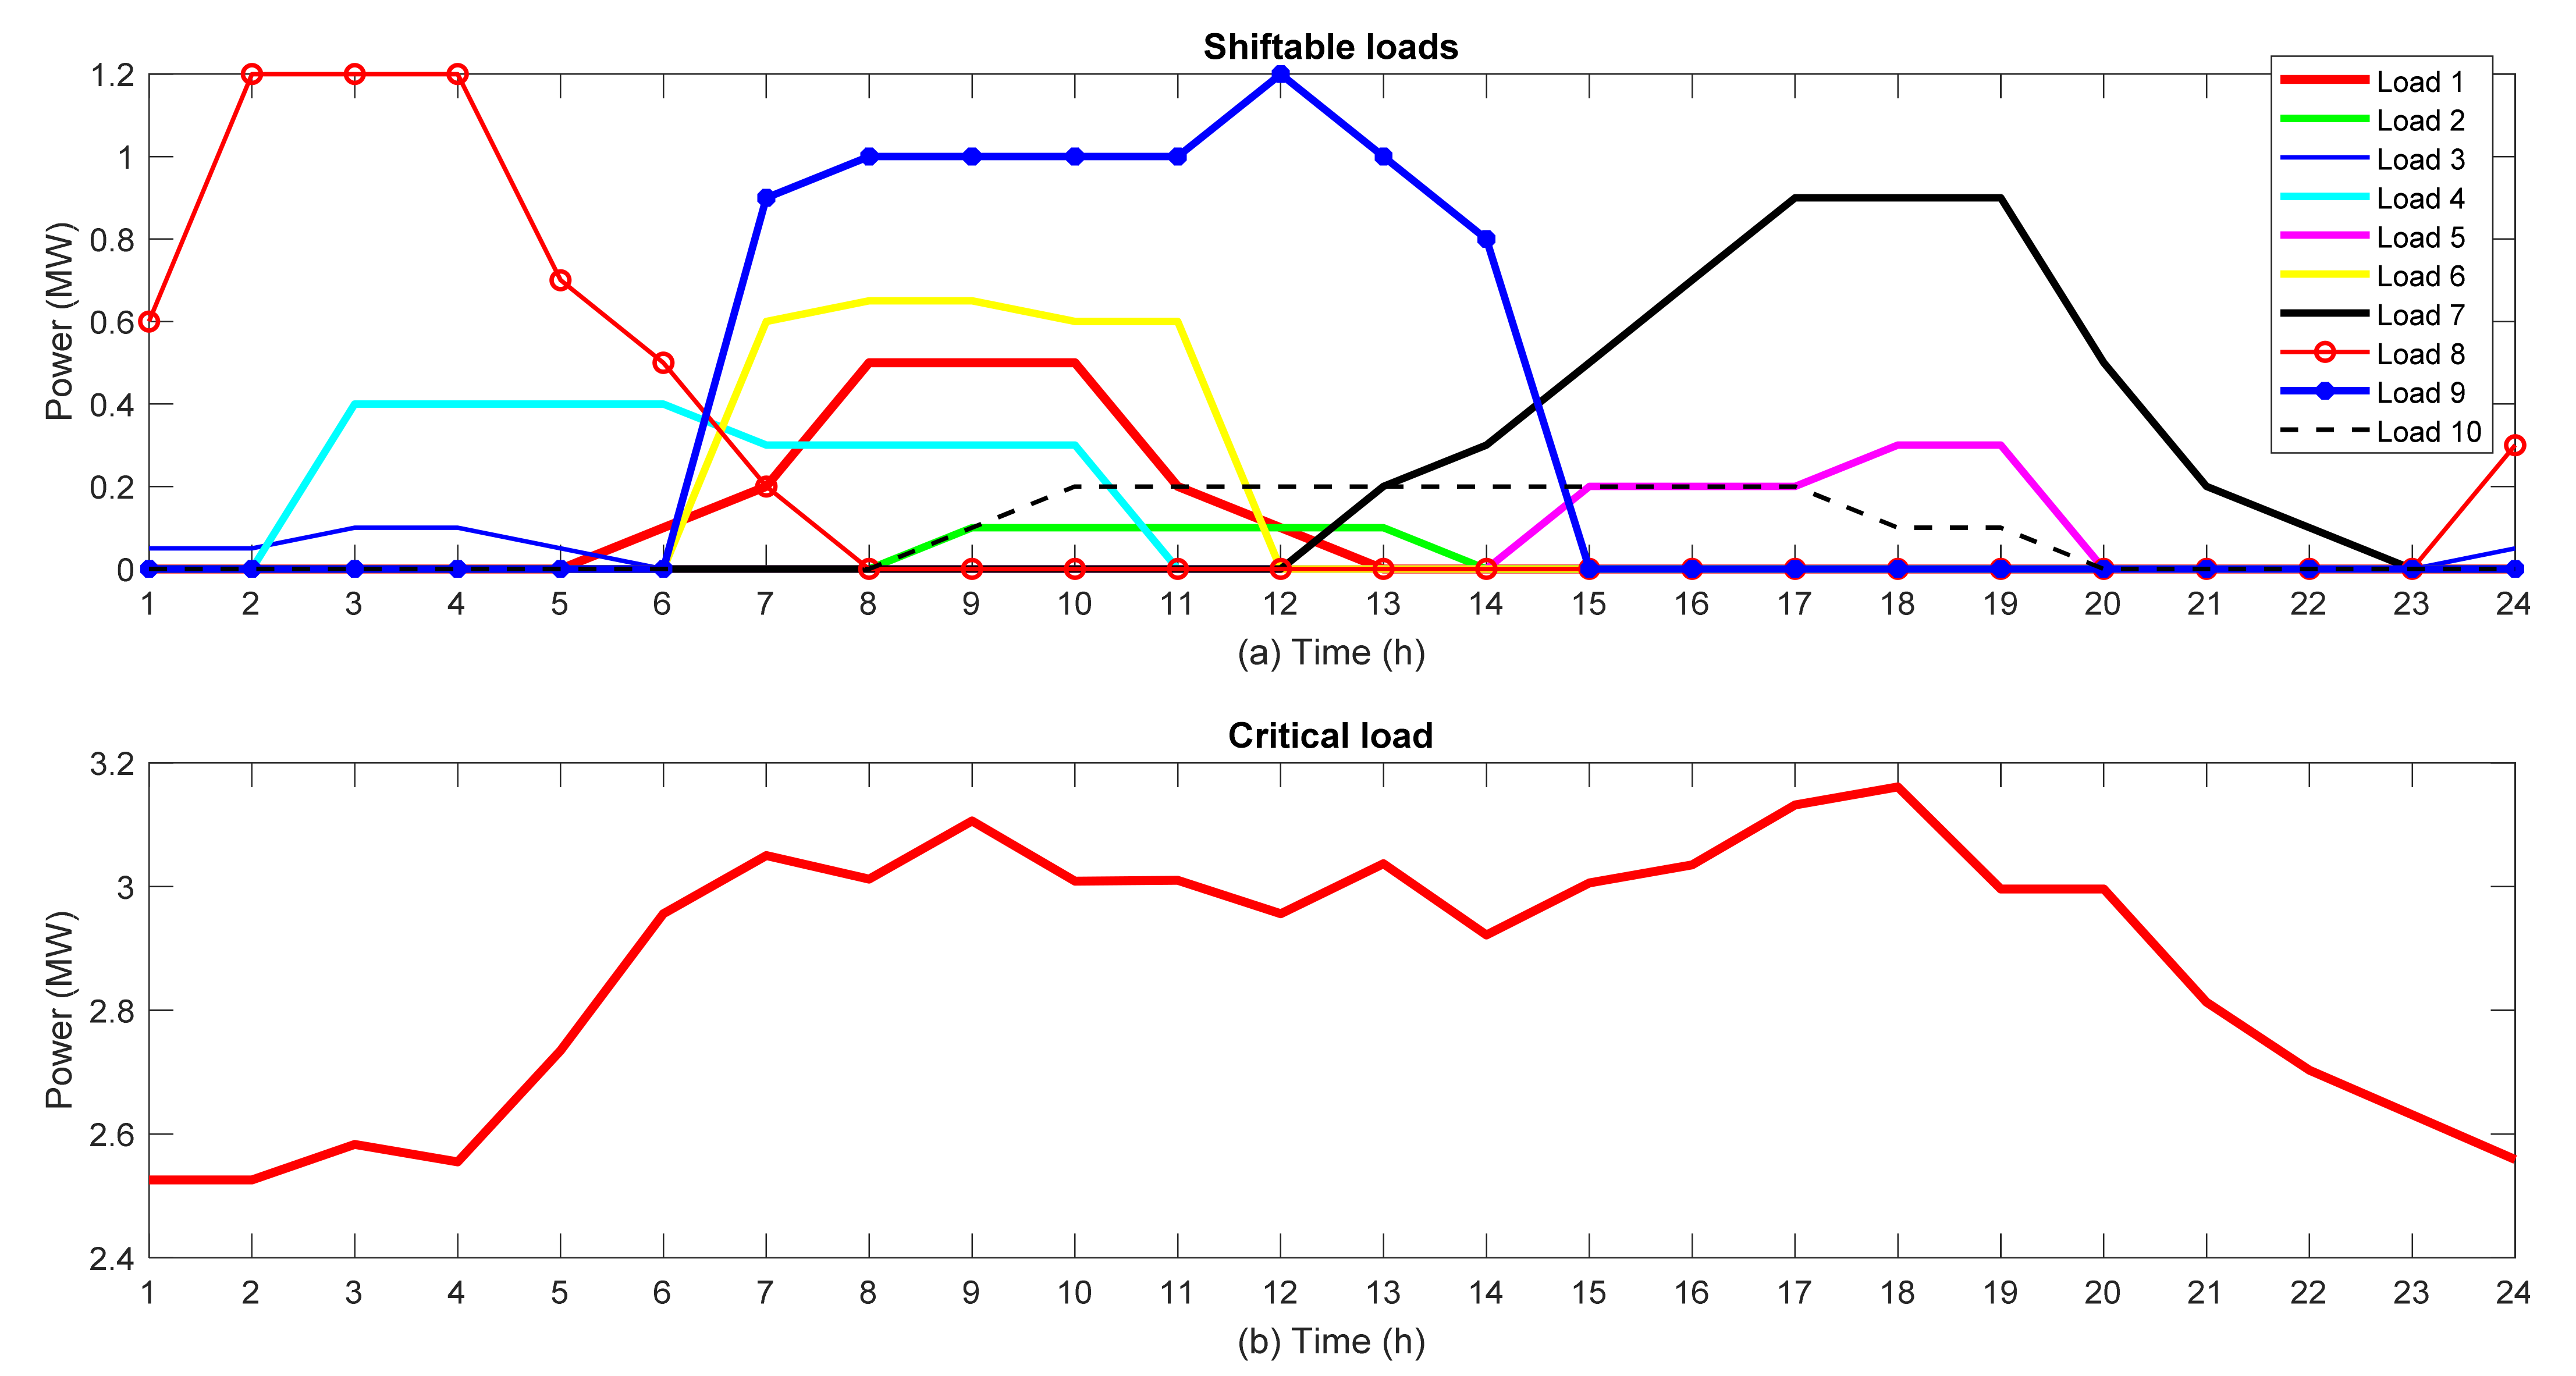
Table 2 shows the information on diesel generators, Figure 6 shows the PV power generation curve in 24 h, Figure 7 shows the purchase and sale prices of electricity from the grid, and Figure 8 shows the information on shiftable loads and critical loads. Figure 7 shows the purchase and sale prices of electricity from the grid in ($/hour) 24 h a day. If prices are stable, the selling price of electricity to the grid is 40 $/h and the purchase price of electricity from the grid is 60 $/h. Table 3 shows the cost function coefficients for implementing the demand side management program.

5.1. Implementation of the Proposed GA-ABC Algorithm

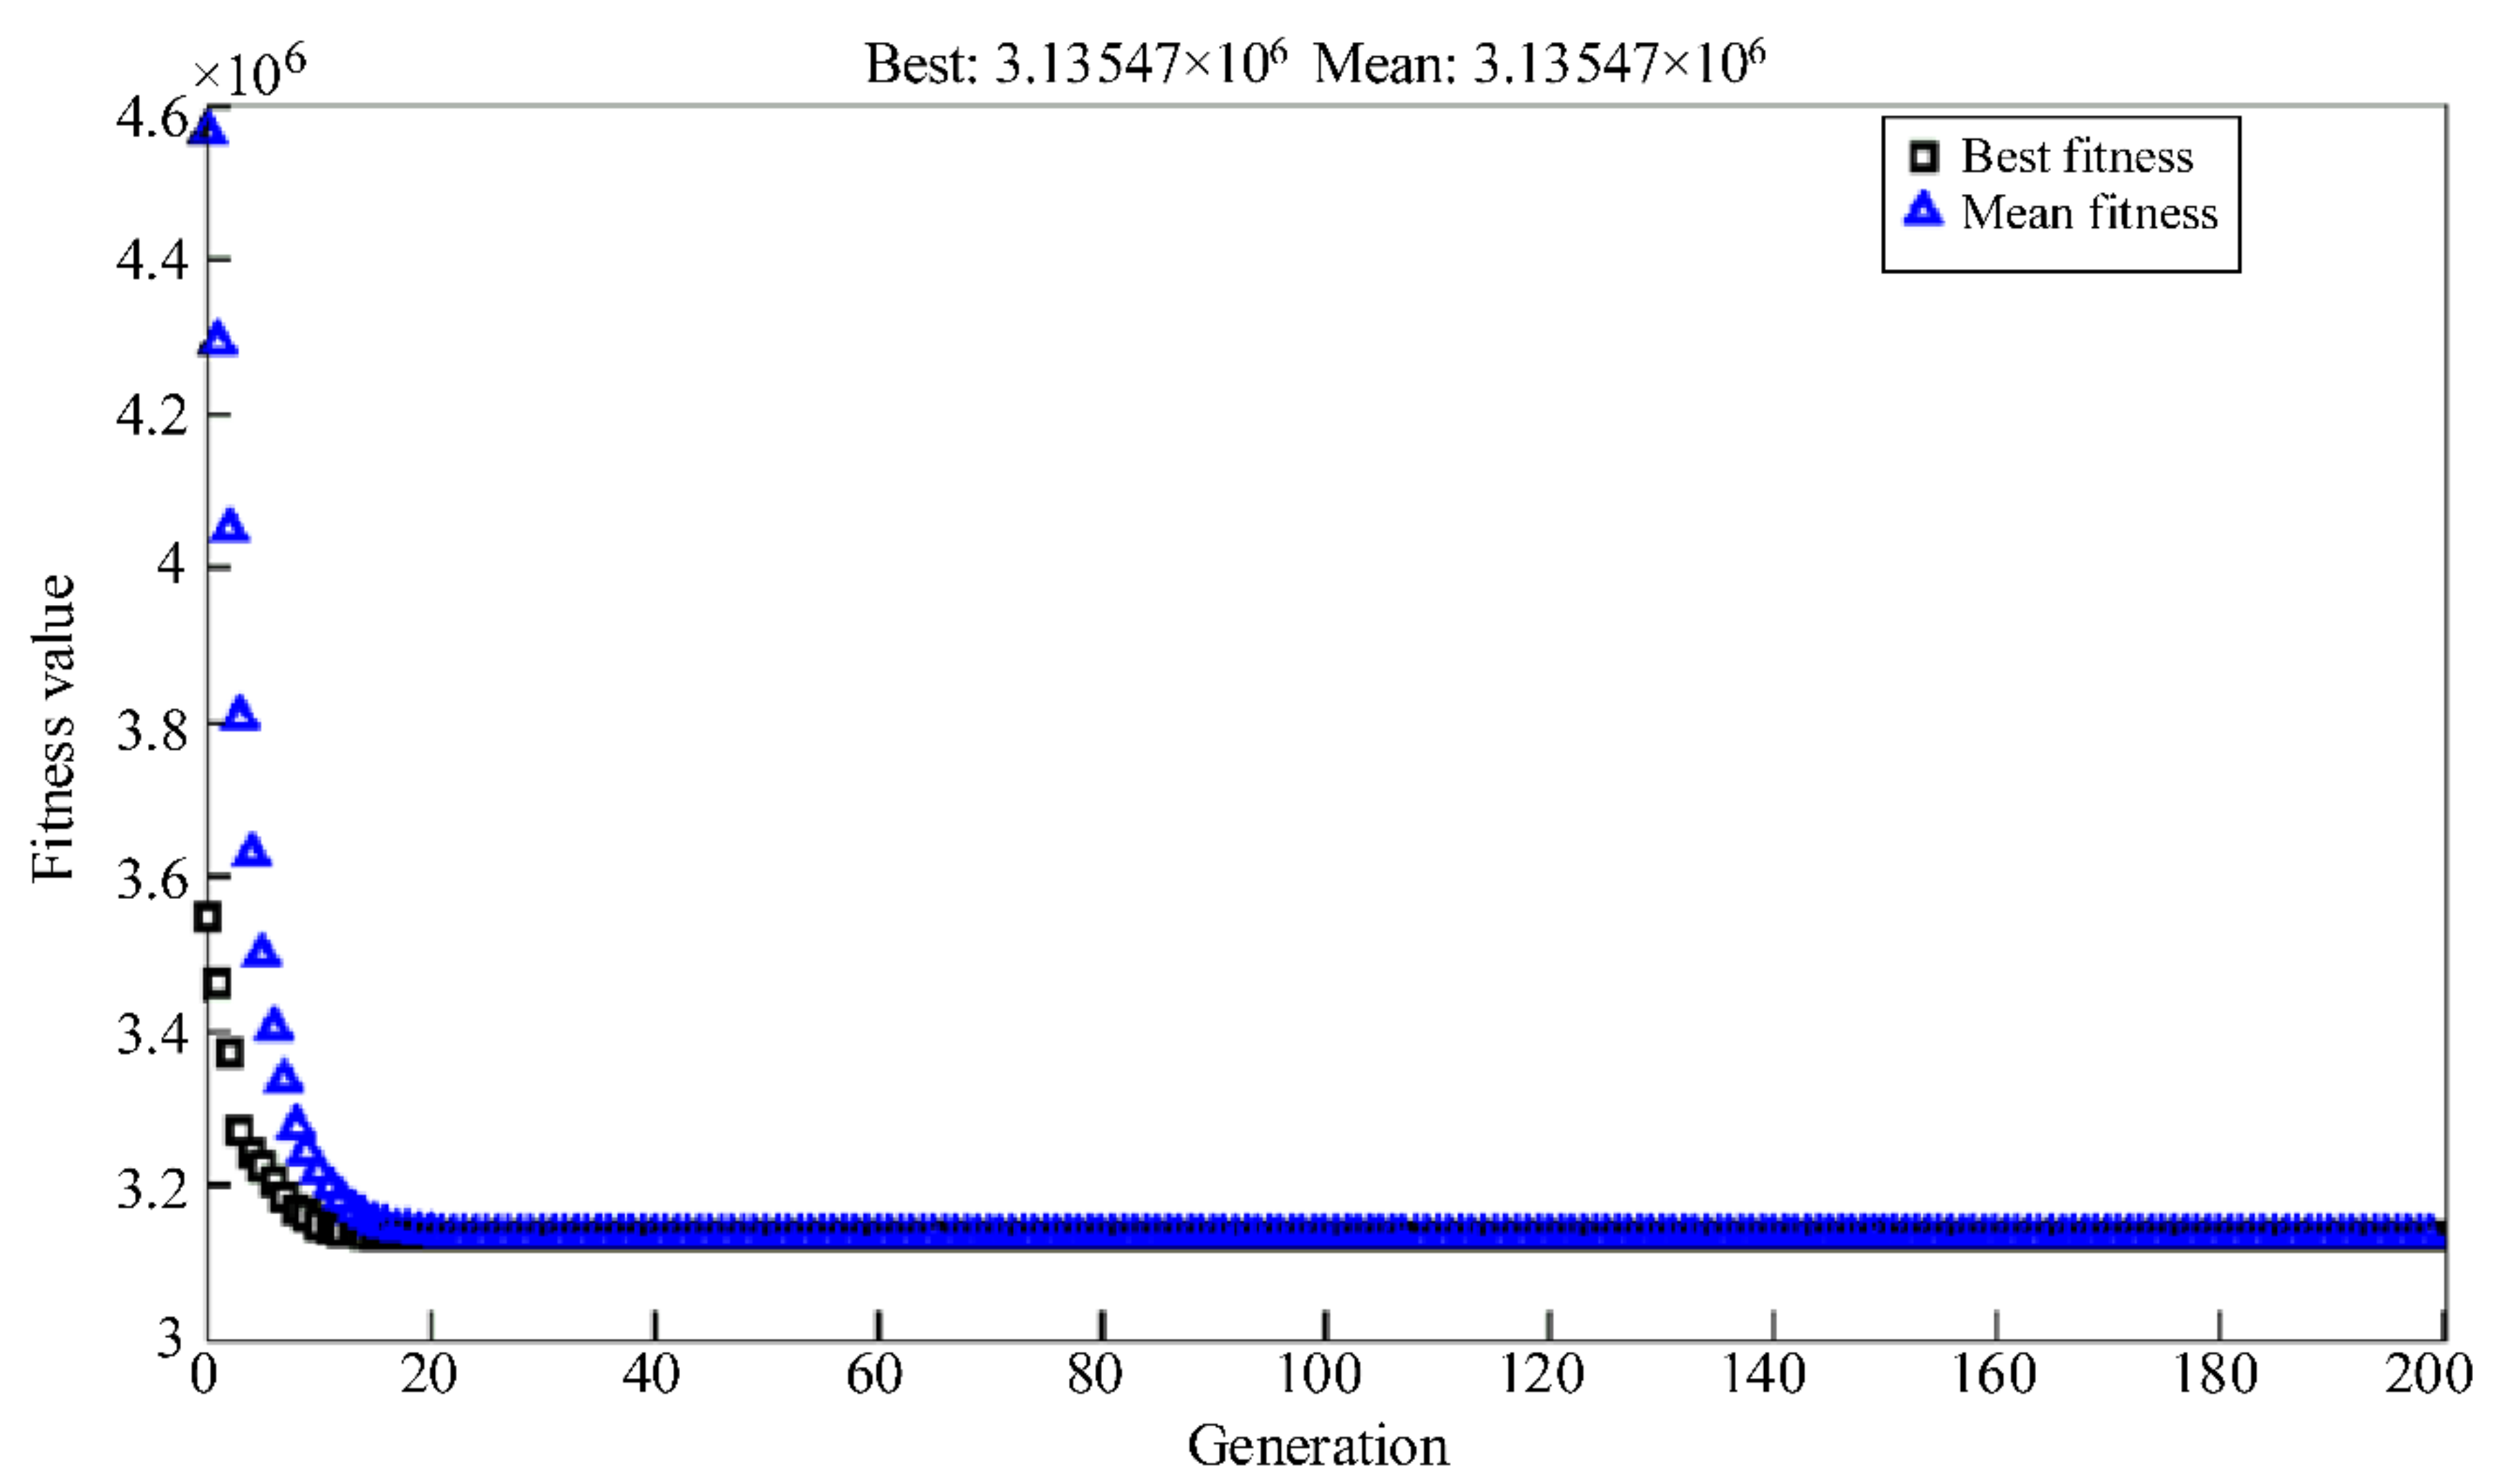
In this section, the proposed algorithm is applied to the network in Figure 5. For this purpose, the weighting coefficients w1 and w2 are equal to one and the electricity purchase and sale prices of the grid are considered variable (According to Figure 7). In the proposed algorithm, the population is 500 and the number of iterations is 200. Figure 9 shows the convergence process of the proposed algorithm. In this figure, the horizontal axis represents the number of iterations and the vertical axis represents the value of the fitness function, the □ symbol represents the best value and the Δ symbol represents the average value of the fitness function. In Figure 9, “BEST”, represents the best value nomination, which is equal to 3.13547 × 10⁶ at the end of the generation section and which mixed up with the mean value. However, it is important to mention, that the “FIT” value is the fitness value that evaluates the function of the generation ratio as it is in Figure 9. At the depart, the “FIT” value is around 4.6 × 10⁶, and at the end of the generation ratio, the “FIT”, takes the best FIT value, which is the possible minimum value.
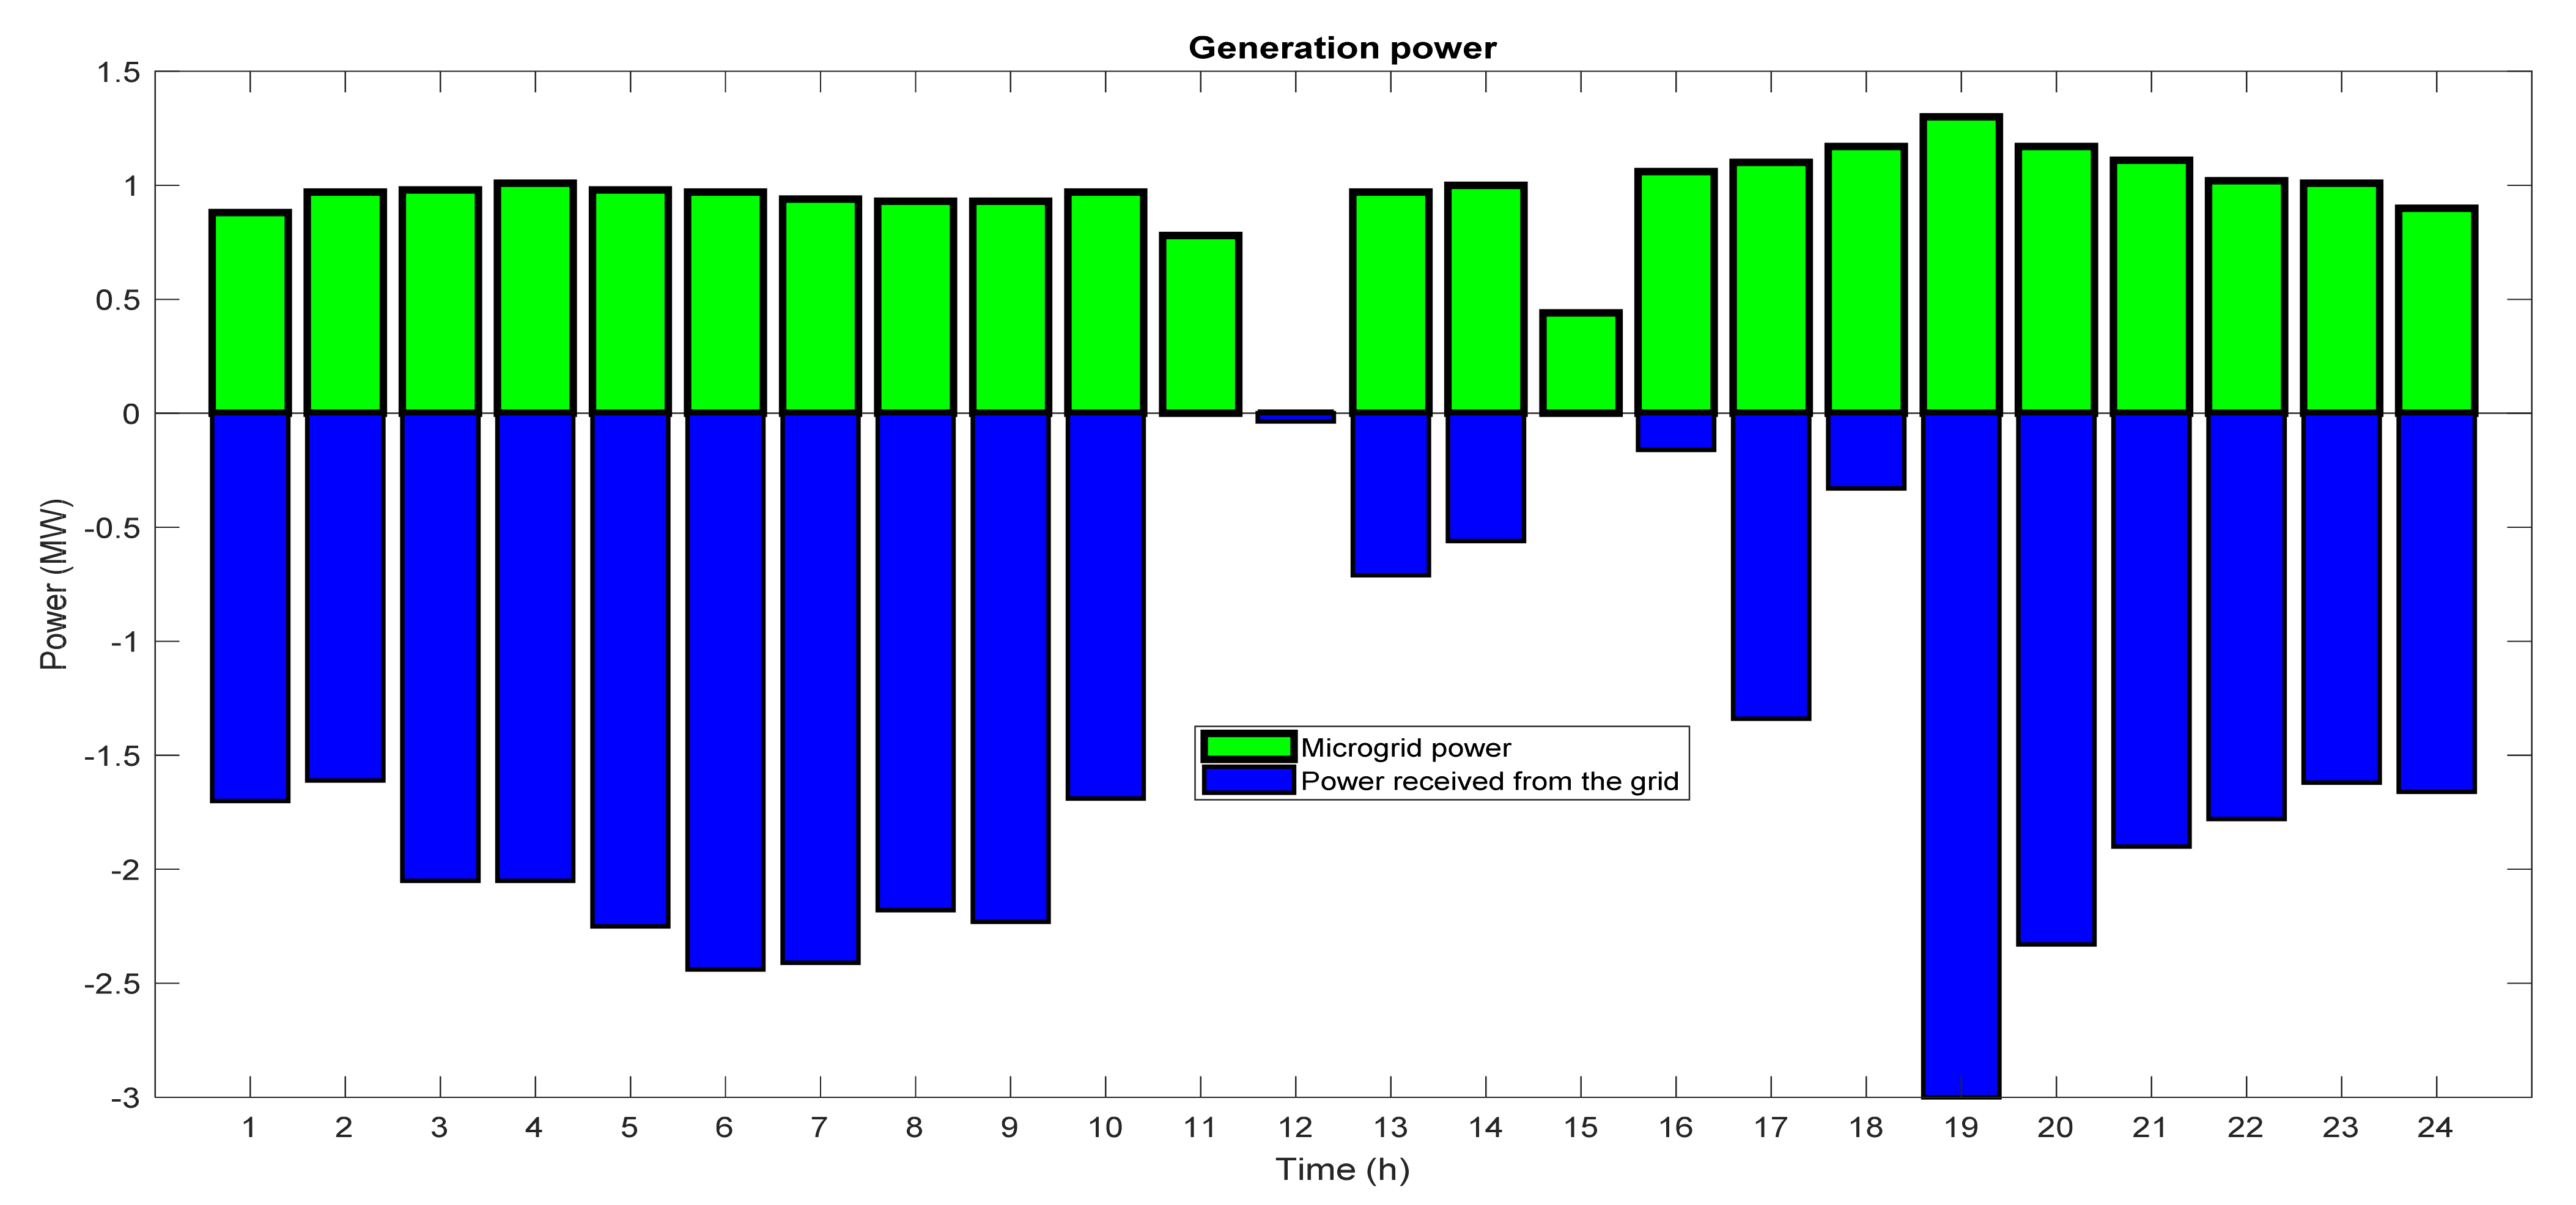
The results of applying the proposed algorithm are given in Table 4 and Figure 10. Table 4 shows the amount of shifting for each load, the amount of operating cost (CF), and the demand side management cost (DC). Figure 10 shows the output power of microgrid units and power received from the grid.
In the following, the effect of weighting coefficients, PV panels, and the price of electricity on the operating costs and the cost of demand-side management programs are evaluated and the results are analyzed.

5.2. The Effect of Weighting Coefficients

The objective function of the optimization problem consists of two parts, including the operating cost and the cost of implementing the demand-side management program. In this section, the weighting coefficients of each of these sections have been changed to determine the impact of that section on the total cost. For this purpose, the weighting coefficients are changed according to Table 5 and the results are presented.
In Table 5, the weighting coefficient of the operating cost is assumed to be equal to one, while the weighting coefficient of the cost of demand-side programs is increased from zero to two. If W2 is zero, load shifting is considered non-cost. It is clear that in this case, the lowest operating cost and the highest amount of load shifting have been created. In a state where both weight coefficients are equal to one; Operating costs have increased and load shifting has decreased compared to the previous case. As the demand-side management weight coefficient increased, the number and hours of shifting load decreased but the operating cost increased. Therefore, due to the importance of reducing load management costs, the appropriate coefficient can be selected for the demand side management costs. In the last row (without DSM) there is a case where the demand side management program is not considered and shifting is considered zero all the load.

5.3. The Effect of PV Panels

Table 6 shows the effect of the presence and absence of PV panels on the problem of optimal operation of the microgrid. This table shows that with the removal of PV panels, load shifting, as well as the cost of demand-side management programs, has decreased compared to the case where PV panels are present in the system, but the operating cost when PV panels are removed has increased significantly. Because by removing PV panels, all the energy required by the system is supplied by the diesel generator.

5.4. The Effect of Electricity Prices

In this section, once the price of electricity at different hours of the day and night is considered according to Figure 7, once again the prices of buying and selling energy from the grid are considered constant and the problem of optimization is solved. The results of performing these two modes are given in Table 7. As prices stabilize, load shifting increases, and the cost of implementing demand-side management programs increases, but the cost of operating the system decreases.

5.5. Comparison of GA-ABC Algorithm Performance

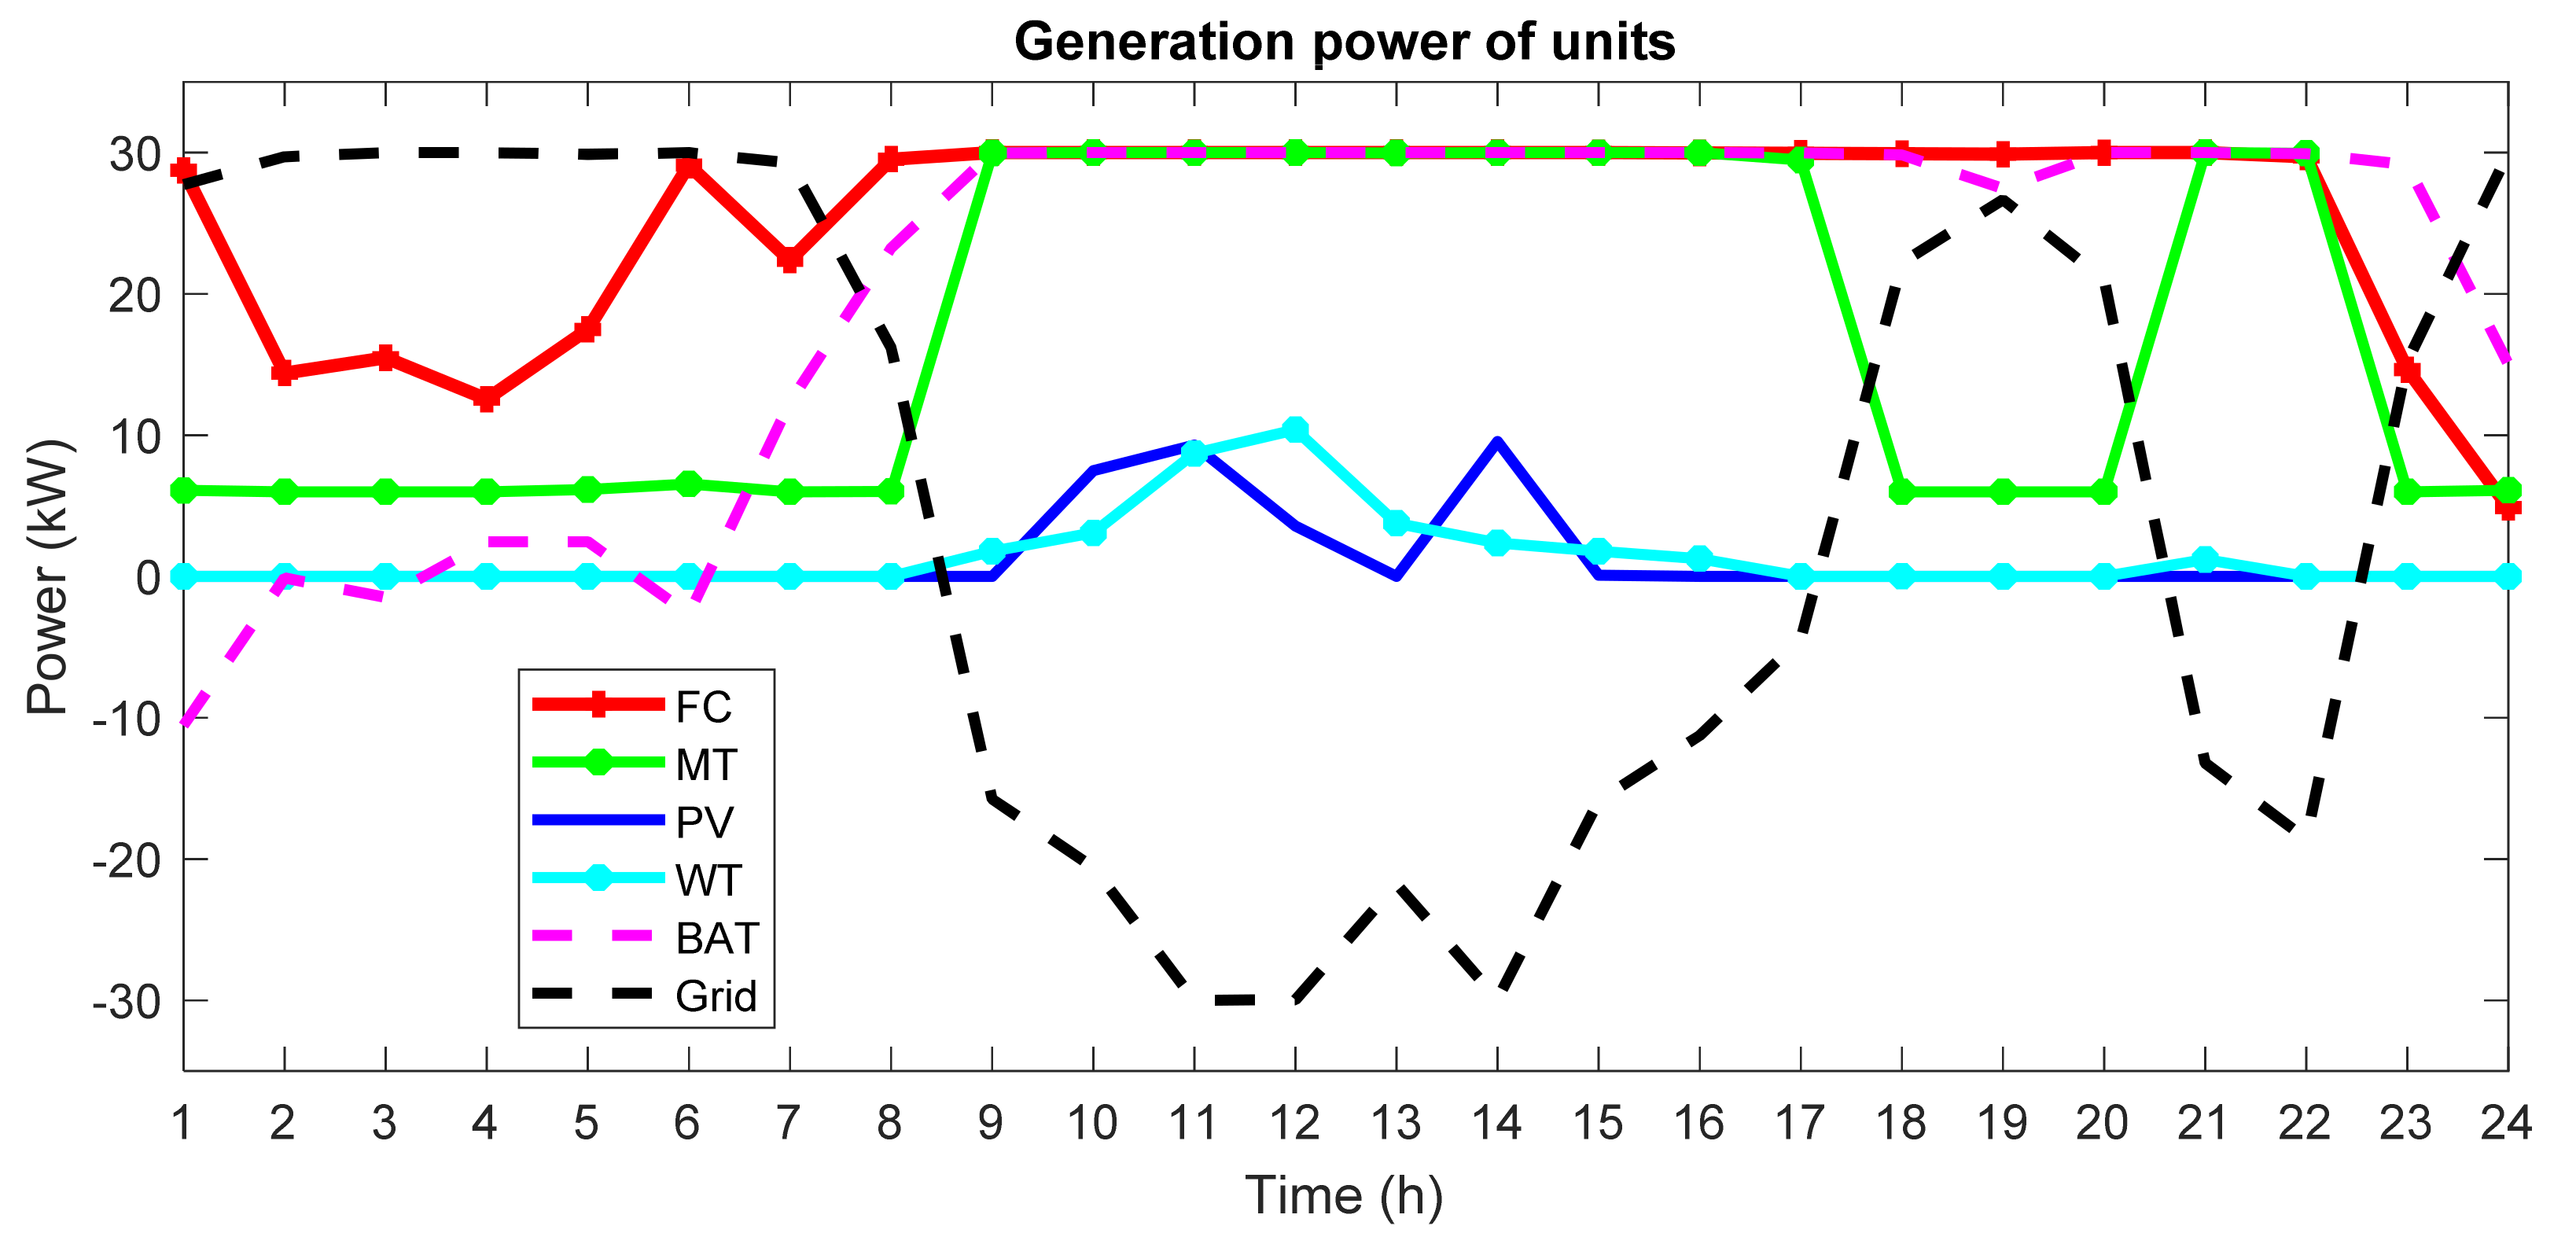
In this section, to evaluate and confirm the performance of the GA-ABC hybrid algorithm, the proposed method is implemented on microgrids with different types of generation units and the results are compared with other meta-heuristic algorithms. Figure 11 shows the second low voltage microgrid under study. In the studied microgrid, PV, WT, MT, and FC units have been used as power generation sources and batteries have been used as power storage and power generation sources in different microgrid points. The power range of each generation unit is given in Table 8. Network information including load demand, electricity prices, etc is provided in reference [33]. In Table 8, negative power for the battery means storage by the battery, and also this negative value for the grid means the sale of electricity to the global grid by the microgrid.
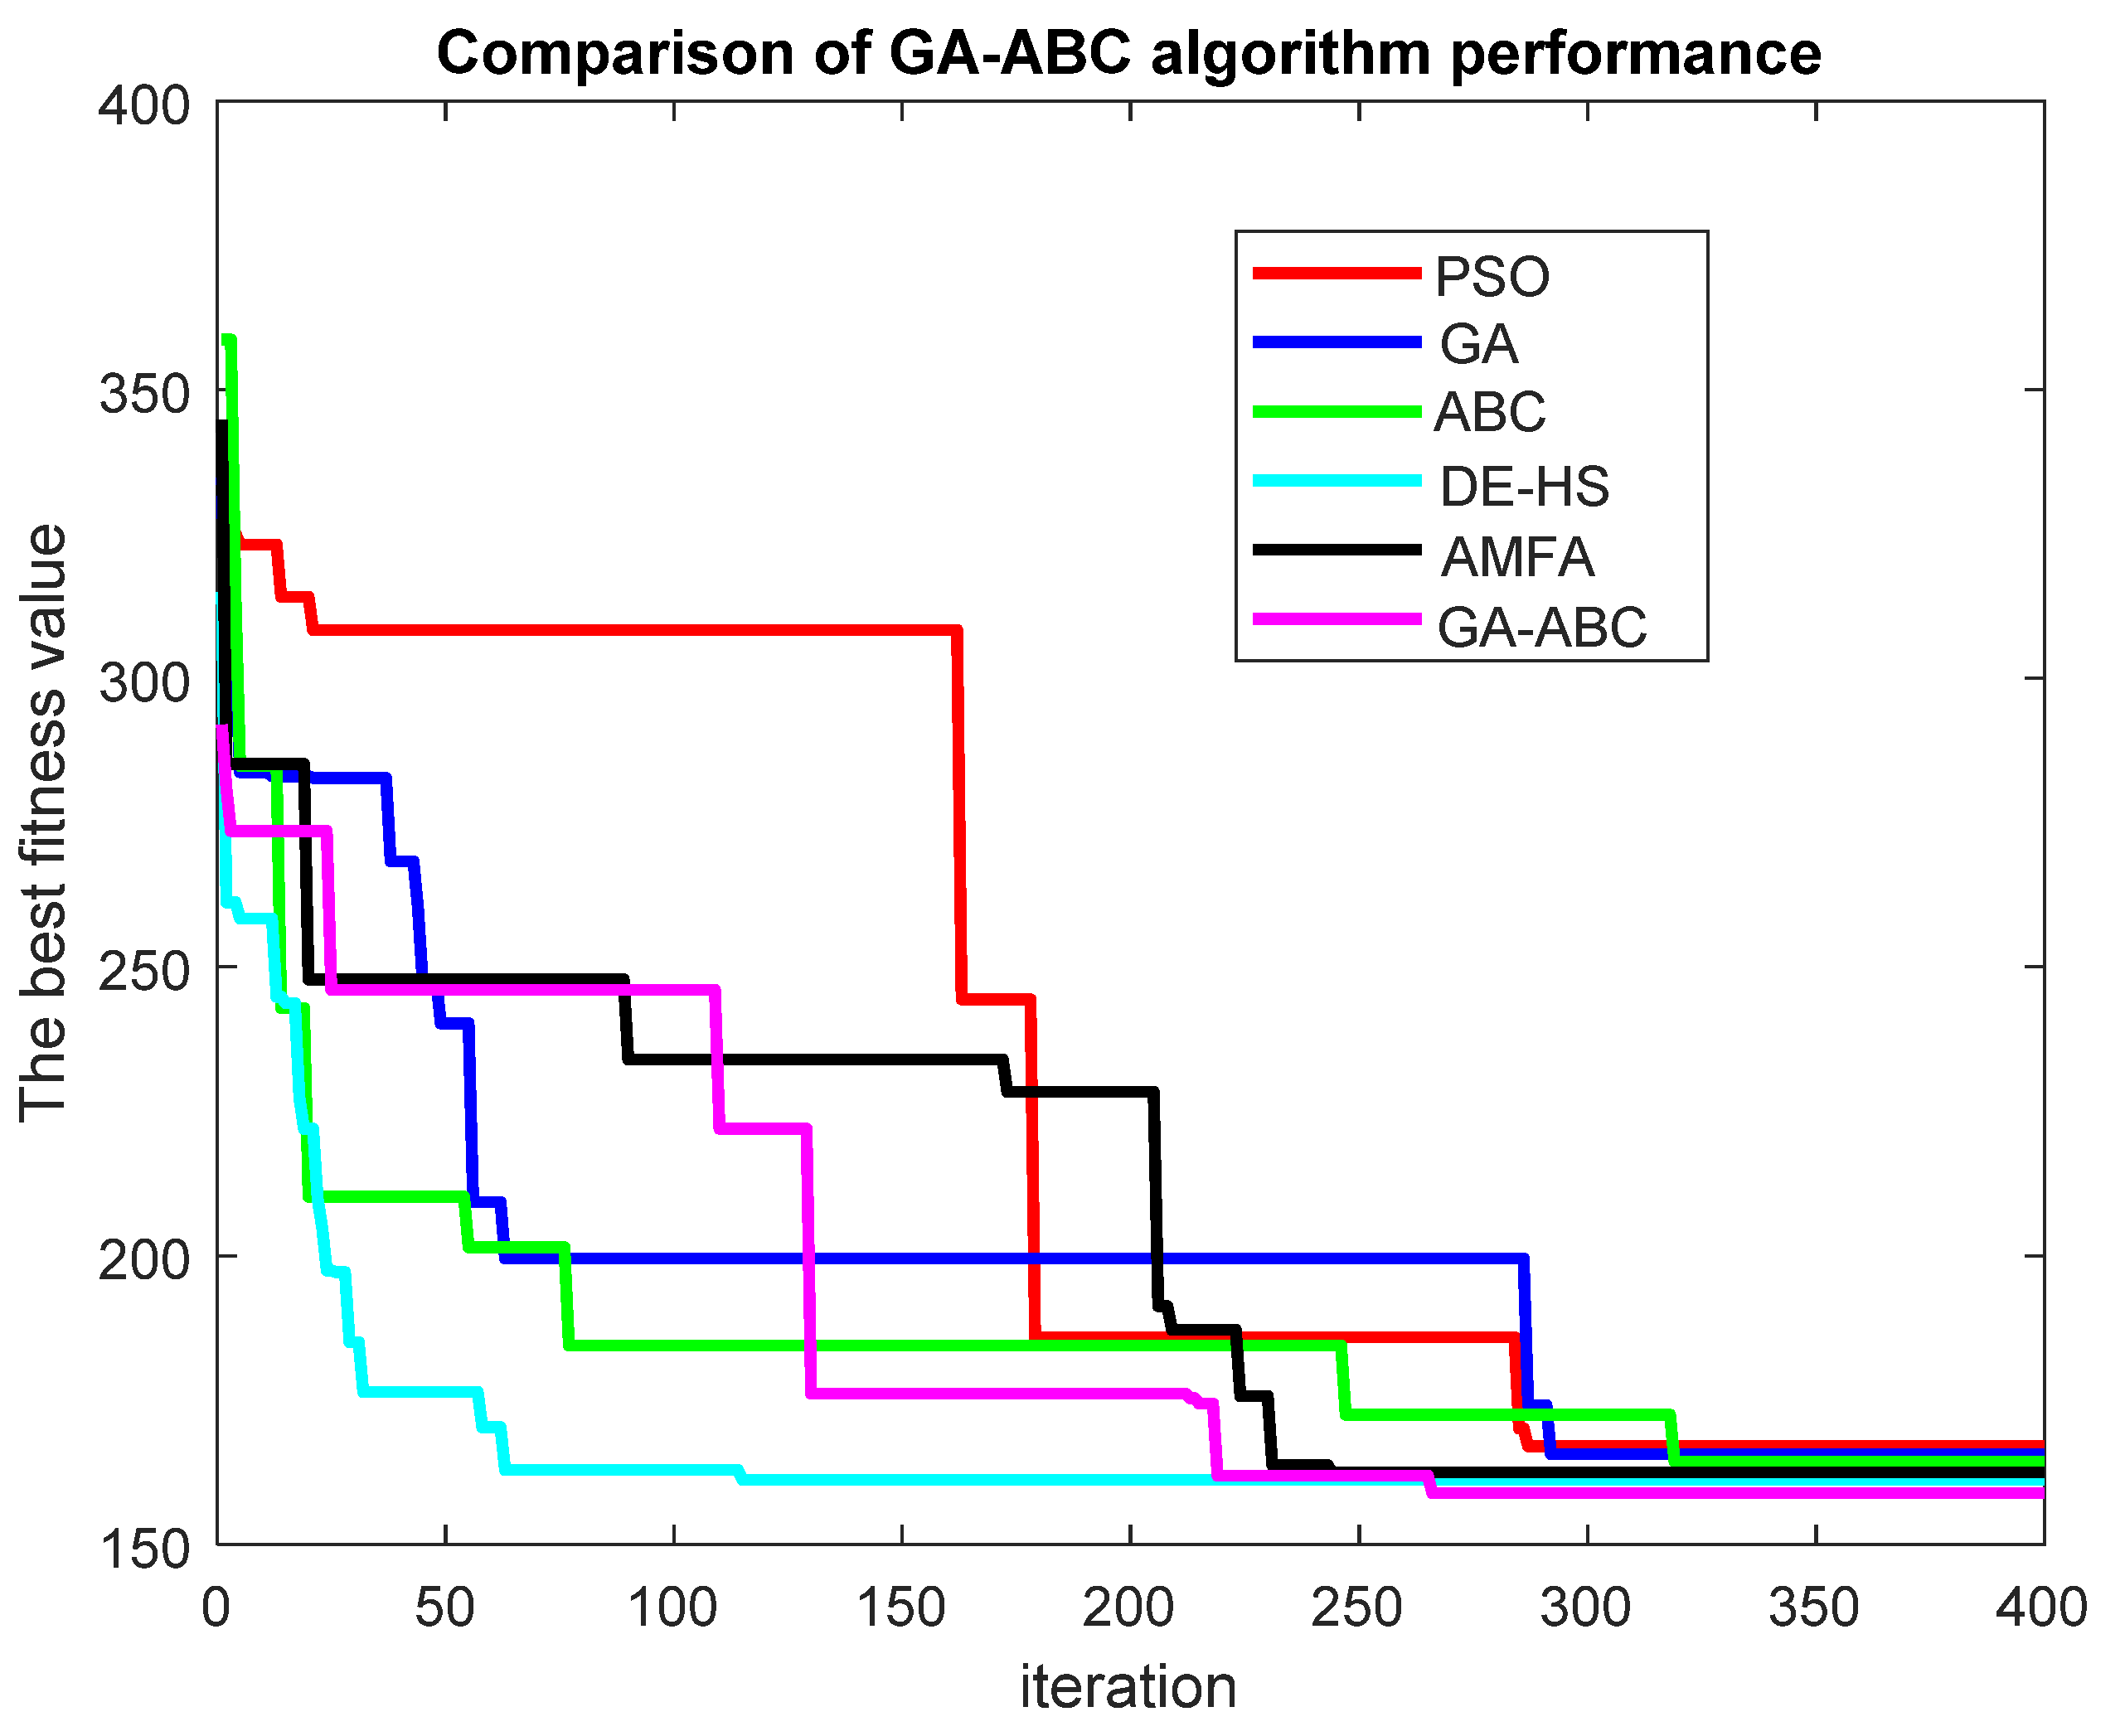
Based on the given results in Figure 12, the proposed optimization solution has given a better Fitness cost value, which proves the efficiency of the algorithm combination and the rapidity for minimizing the objective function expressed in Equation (1).
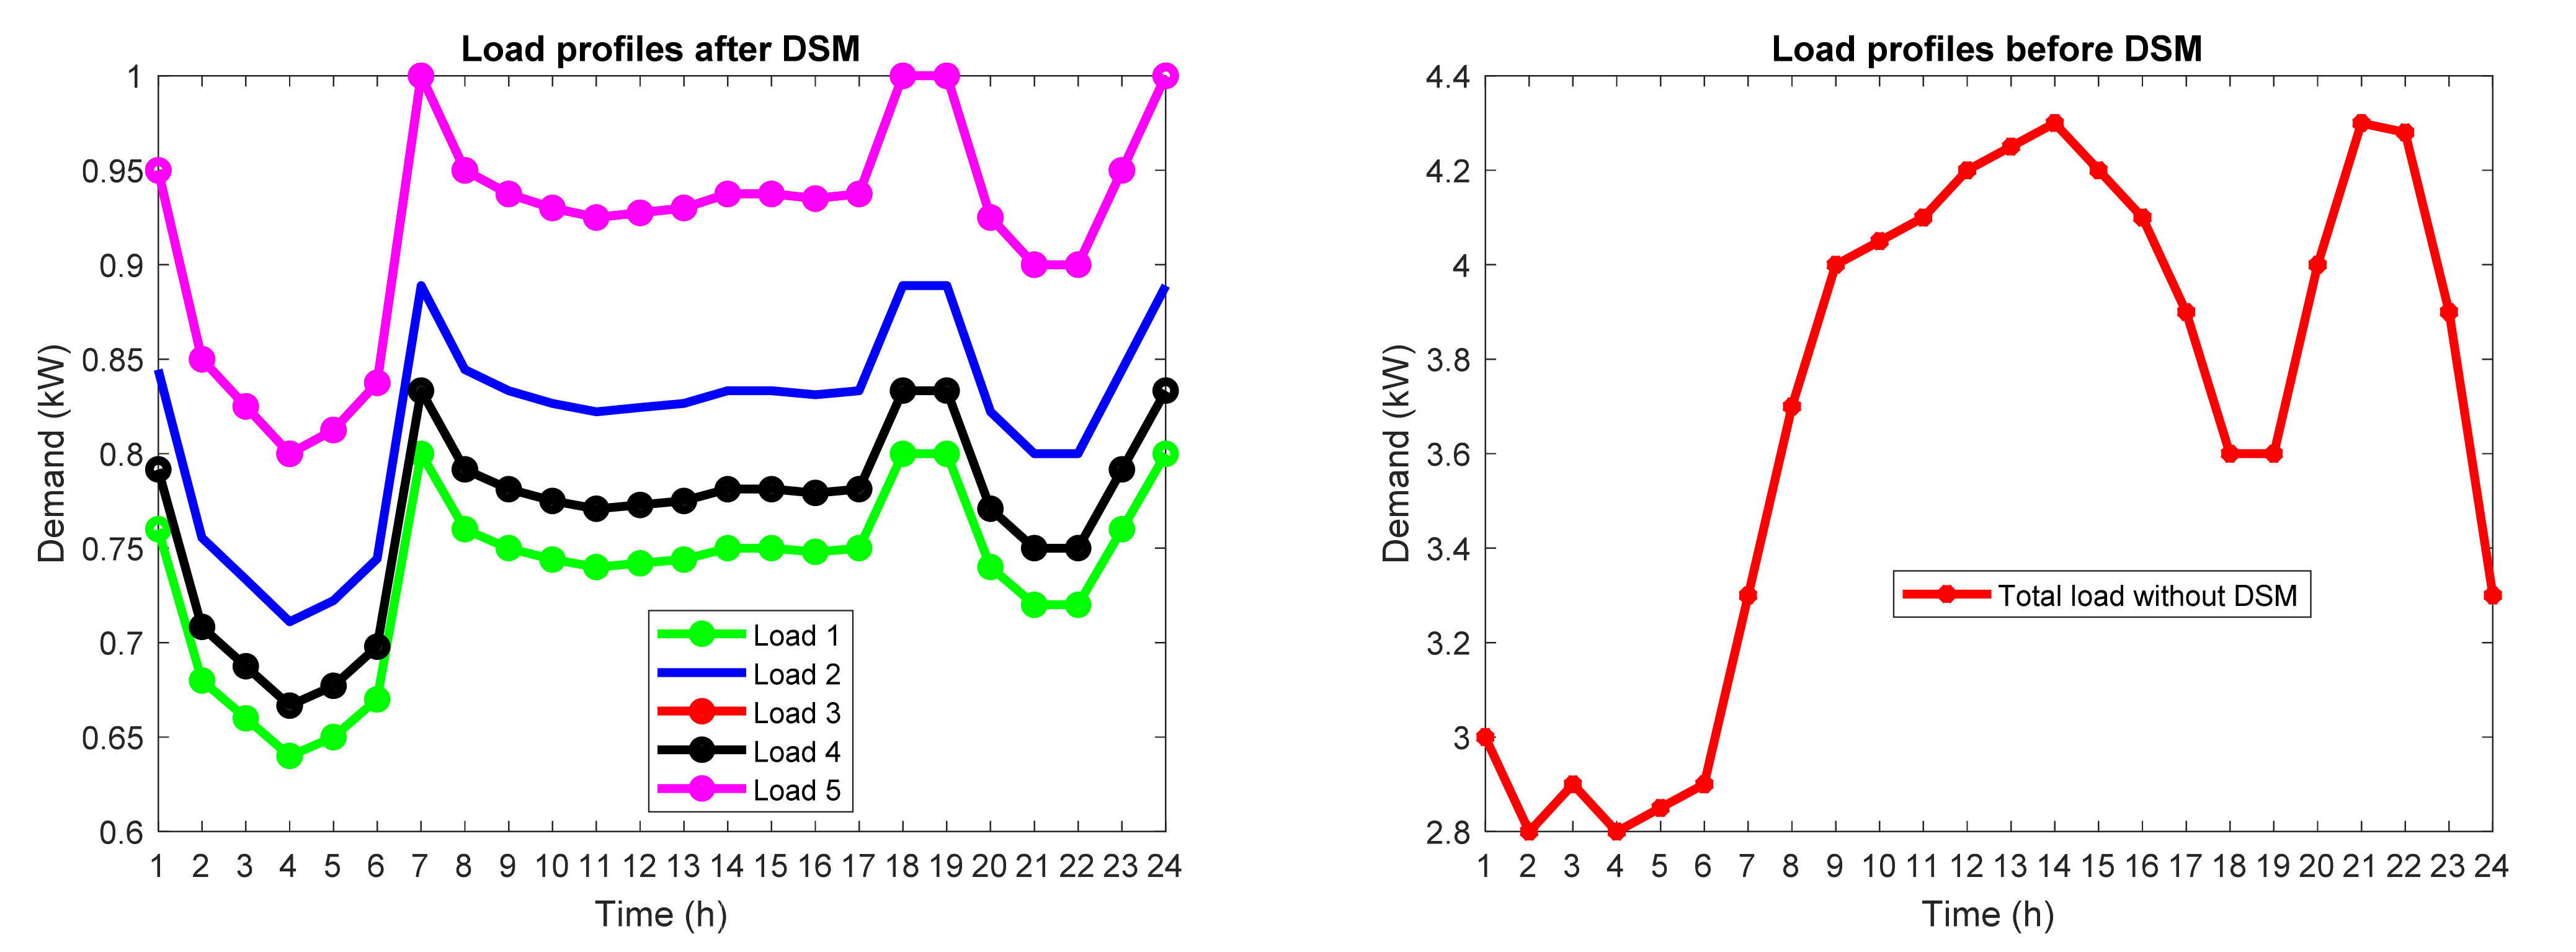
In the following, the proposed algorithm is implemented on the microgrid in Figure 11 and its performance is compared with the reference algorithms [33,34], the results of which are shown in Figure 12. In this case, the weighting coefficients of W1, and W2 are assumed to be one, and as a result, the total cost of Equation (1) is $156.8897, and for the case without DSM, the value is $160.8619. Comparing the results of Figure 12, you can see that the proposed algorithm has performed well. In the reference [33], the Fuzzy Self Adaptive PSO algorithm is used to dispatch the management of microgrid production units, the best answer of which is obtained here at $164.9967. Reference [34] presents an improved genetic algorithm for optimal microgrid power-sharing, the best answer obtained here is $163.6199 . In reference [35], for optimal economic dispatch in the microgrid, the improved ABC algorithm is used, where the best answer is 162.3335 $. In reference [36], the combined algorithm differential evolution and harmony search are used for optimal planning of microgrid unit production and cost reduction, and the best answer obtained here is $159.2037. In reference [37], to optimize the operation of the microgrid and reduce the cost, the Adaptive Modified Firefly Algorithm has been used, and the best answer obtained here is 160.4894. Finally, the output of the proposed algorithm including the generation power of microgrid units cost reduction, and DSM results are shown in Figure 13 and Figure 14. Figure 13 shows the microgrid and main grid generation power, and Figure 14 shows the network load profile changes as a result of DSM.

5.6. Implement the Proposed Method on the Standard 33-Bus IEEE Network

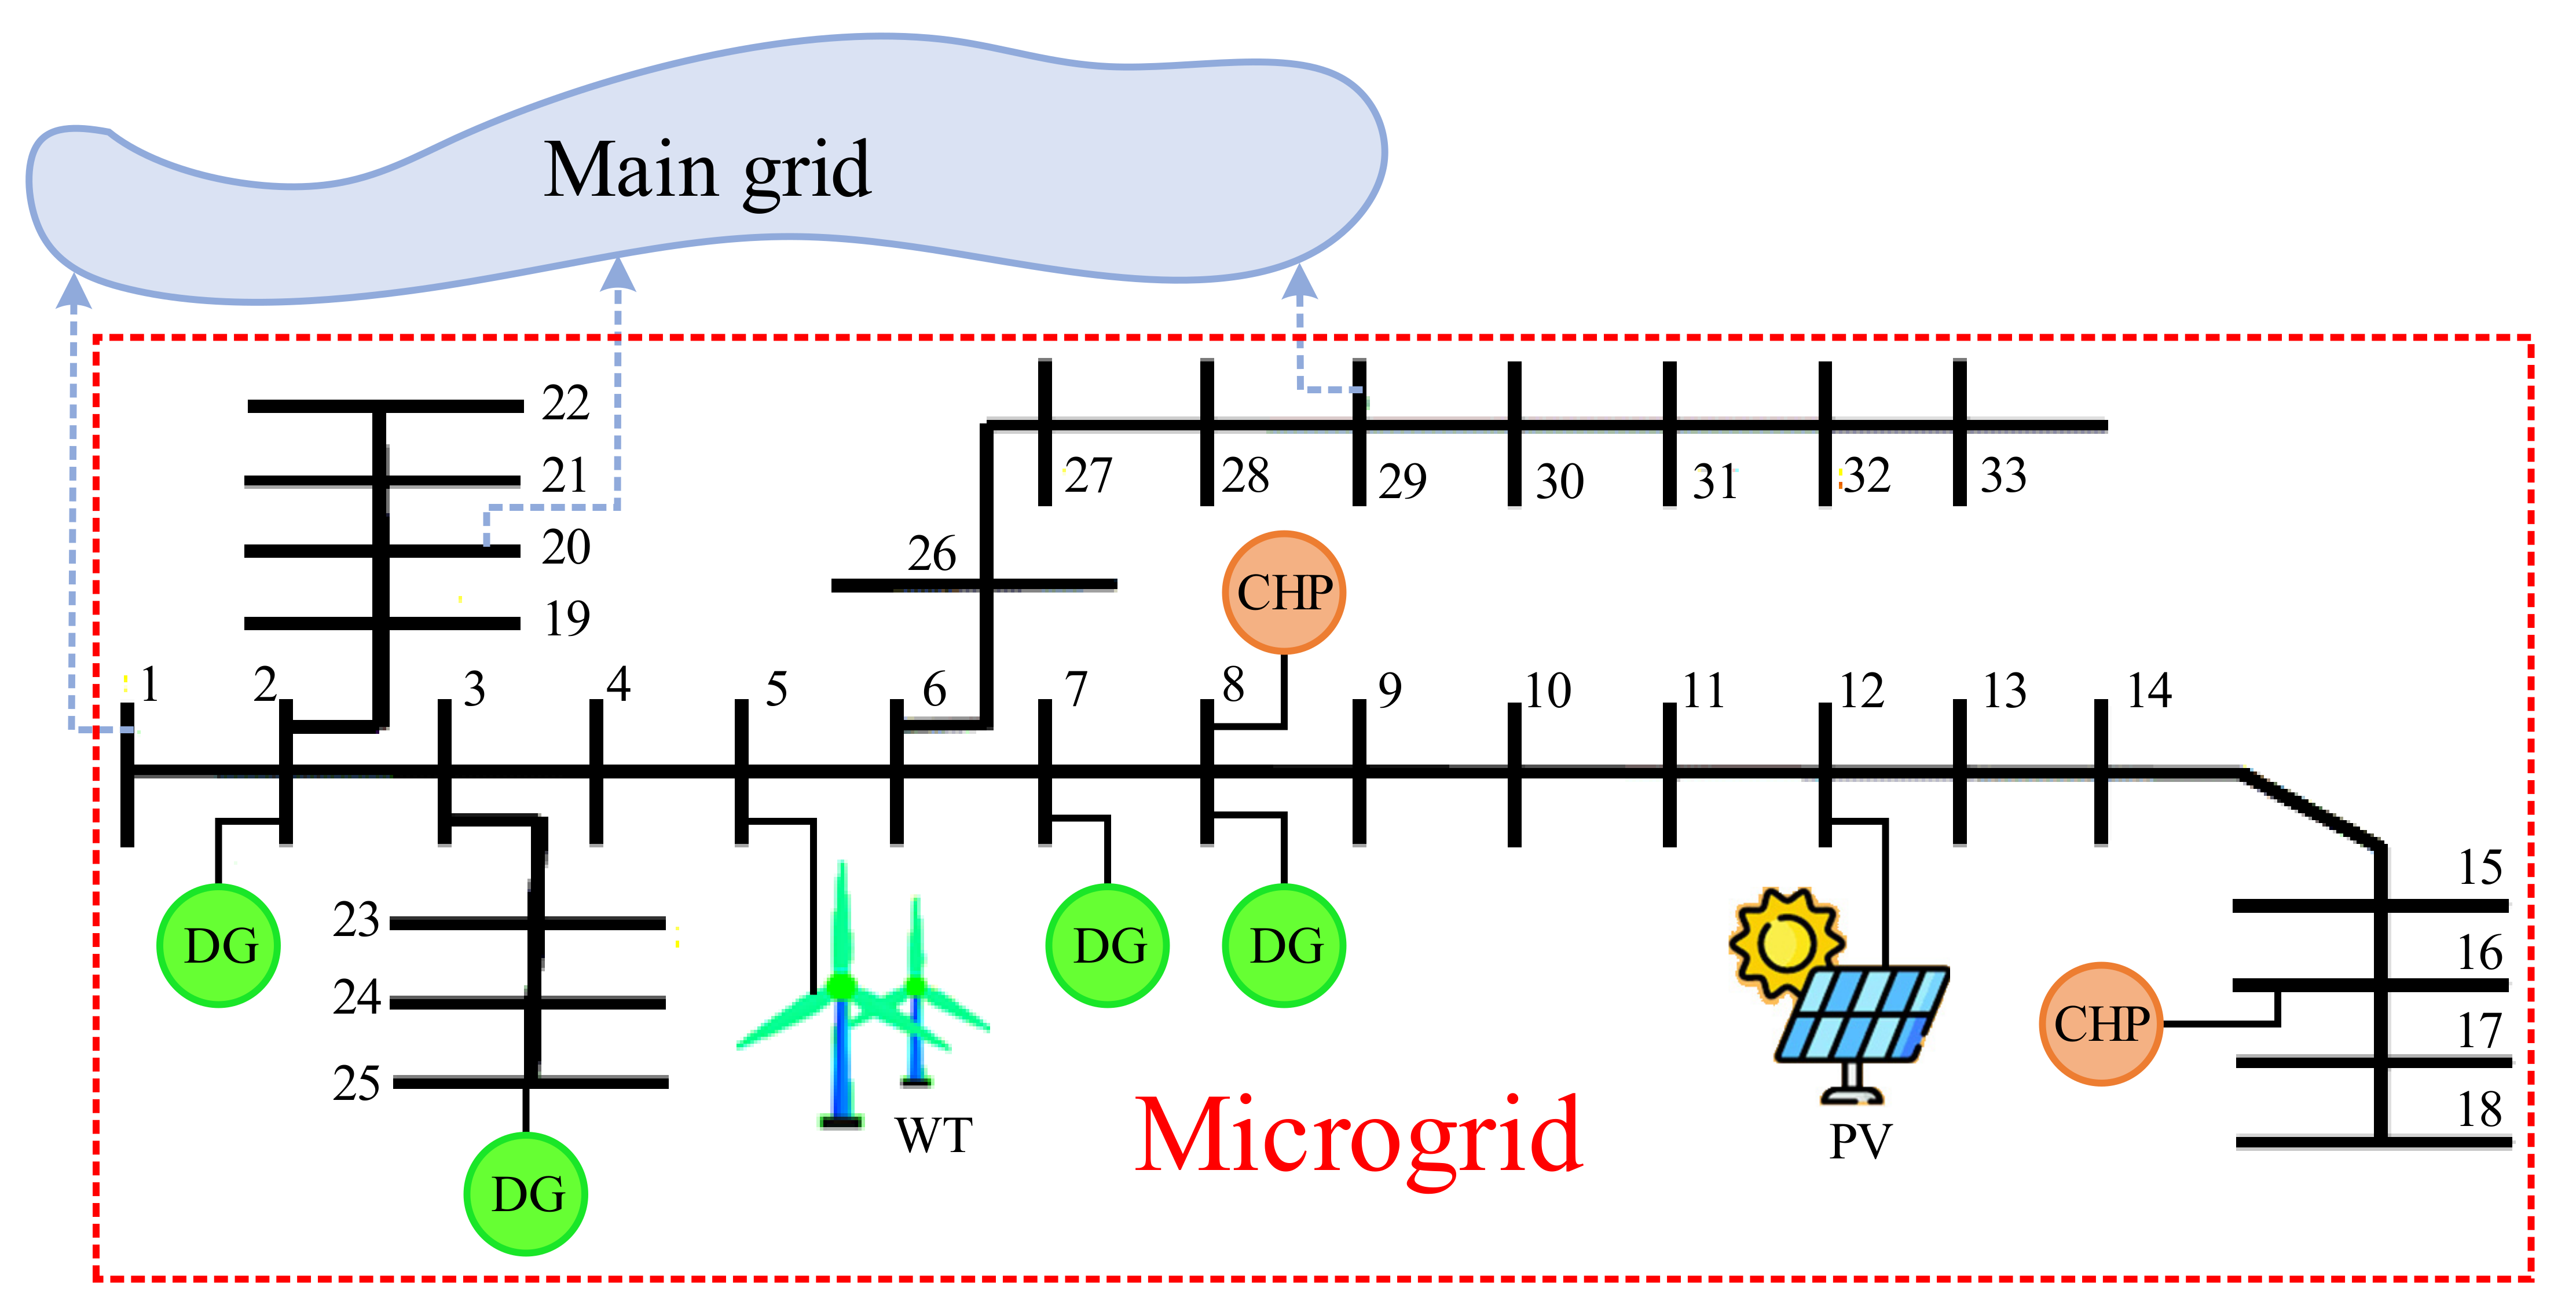
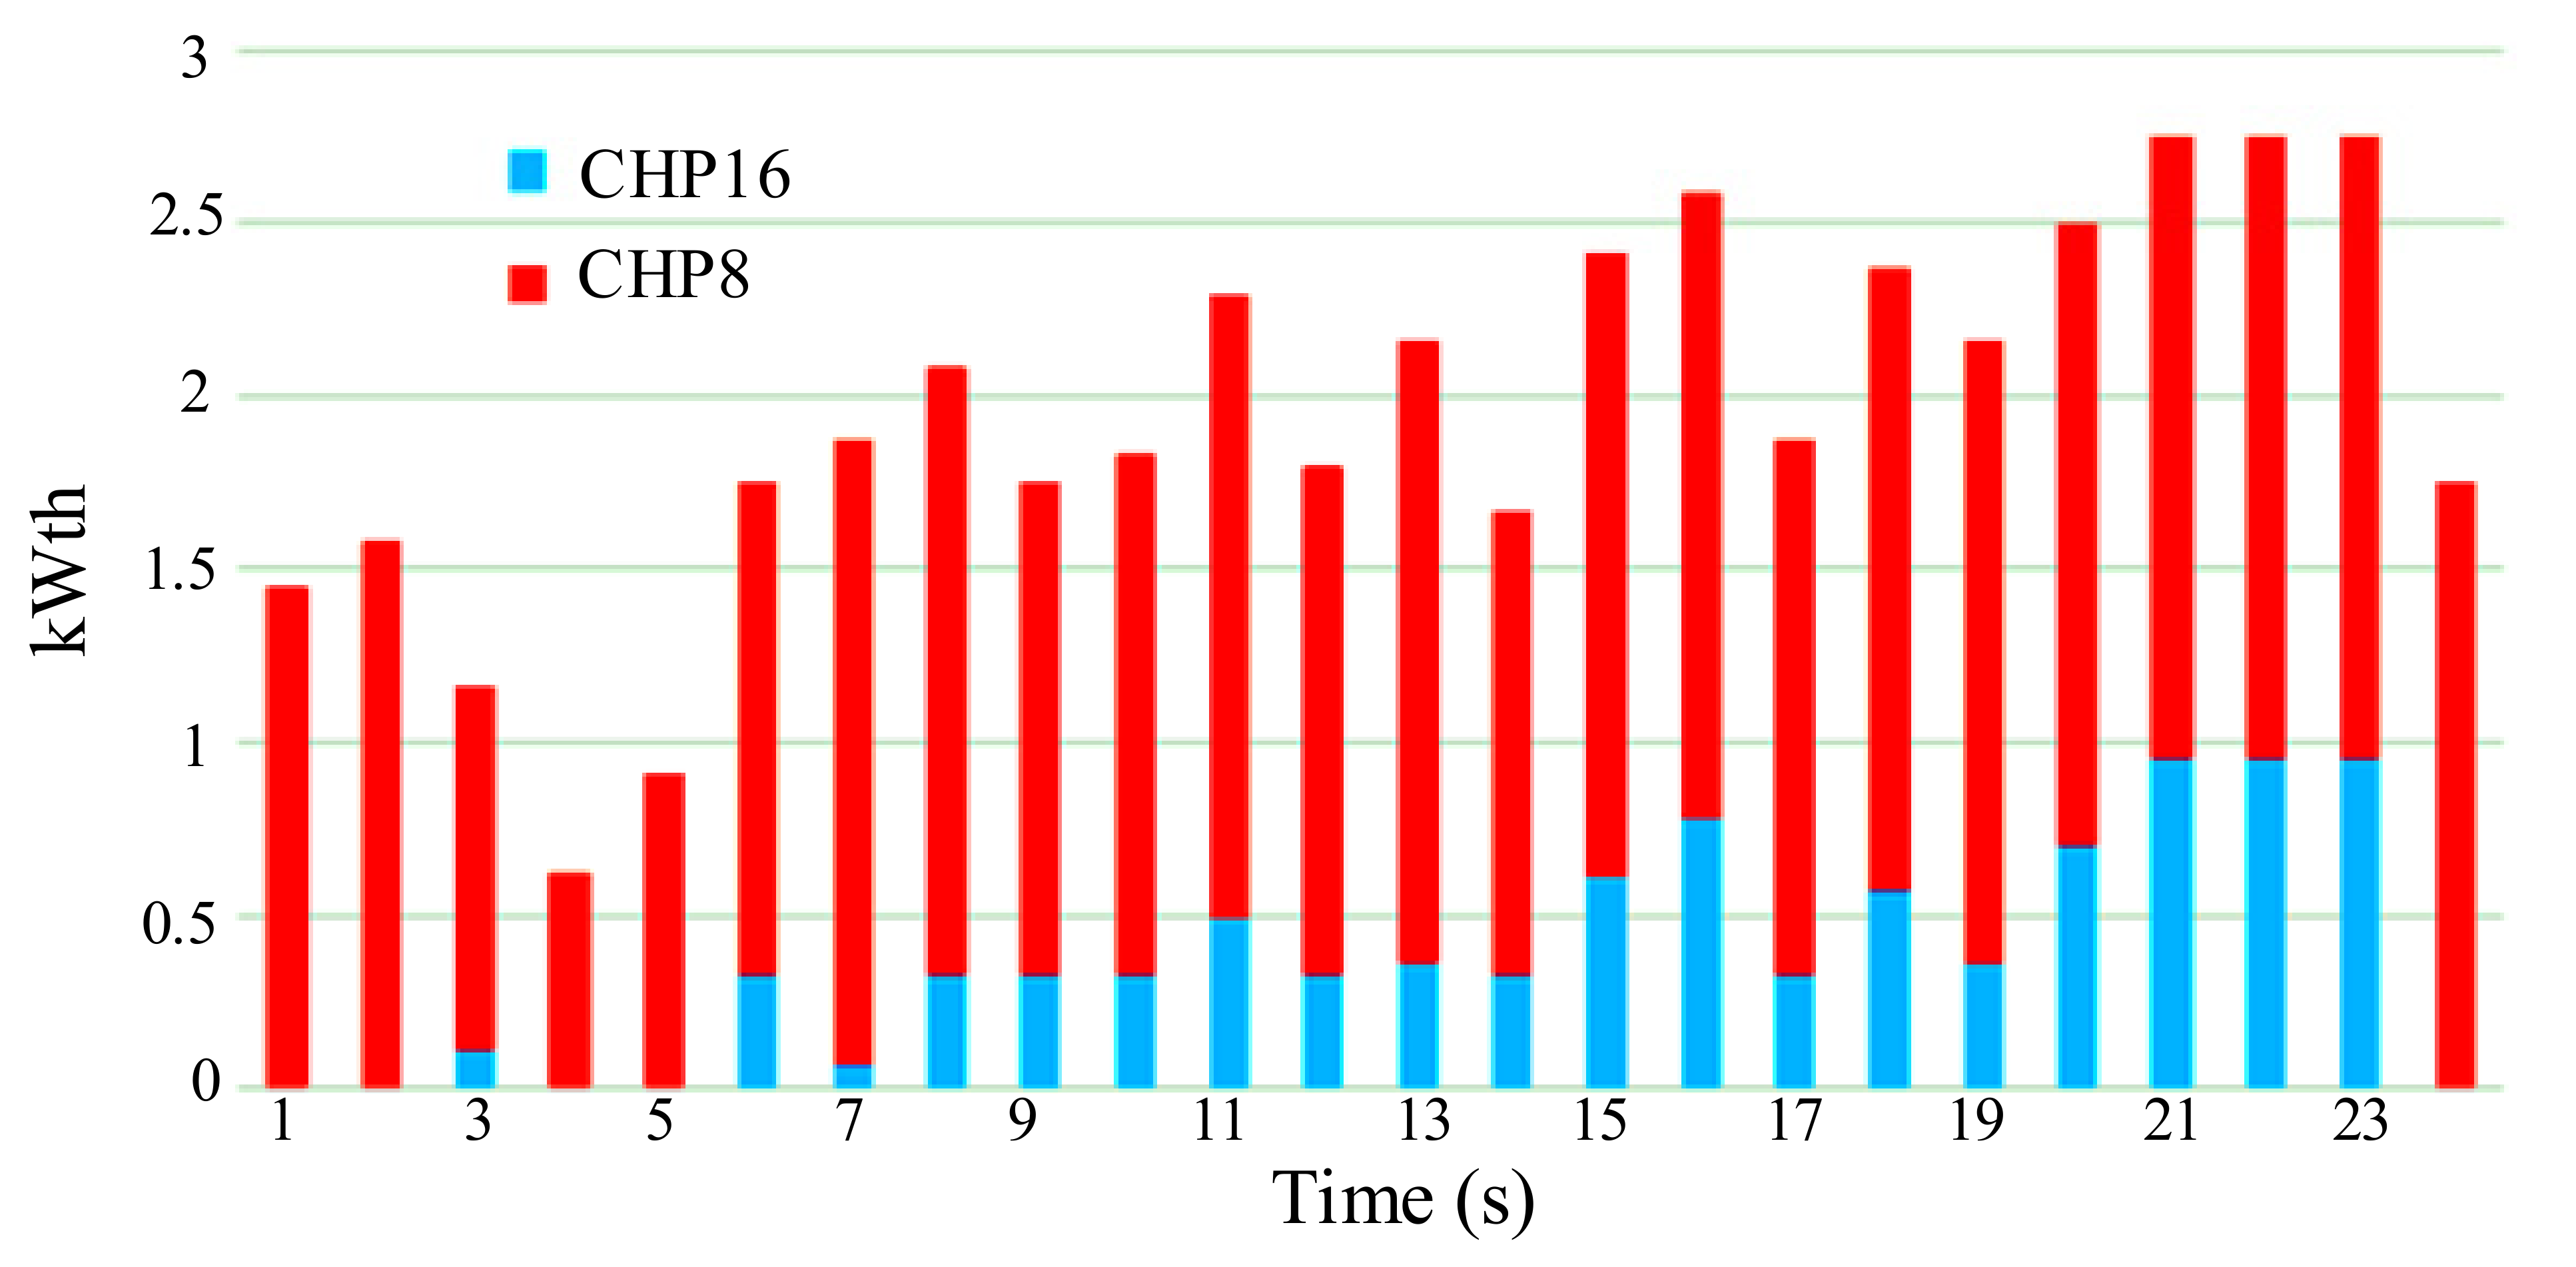
In this section, to confirm the performance of the proposed method, we use the standard 33-bus IEEE network with the presence of various units during different scenarios. The studied microgrid production units include four DG units, two combined heat and power (CHP) units, a WT unit, and a PV unit, and the microgrid is connected to the main network from buses 1, 20, and 29. Figure 15 shows the modified 33-bus IEEE microgrid, which can sell or buy electricity from the electricity market. Four DG units are connected to buses 2, 7, 8, and 25 microgrids, and their information is presented in Table 9. Where SDc and SUc are the cost of turning on and the cost of turning off, respectively, Rup, and Rdn are the increasing and decreasing slope rates of unit production, and Pmin, and Pmax are the maximum and minimum production capacity of the units. In this microgrid, CHPs are located in buses 8 and 16, and due to the limited capacity of CHPs, the minimum and maximum amount of electricity and heat production of these two units, along with fixed coefficients of a cost function, are given in Table 10. Figure 16 shows the predicted heat load of subscribers during a day. According to this figure, the peak heat consumption (Hmax) coincides with the peak electric load.
In this section, the performance of the proposed method is implemented on the third microgrid in 4 scenarios and the results are compared with other optimization methods. These four scenarios are as follows:
  • Scenario 1: Without considering DSM and without the presence of CHP units in the microgrid.
  • Scenario 2: Without considering DSM and with the presence of CHP units in the microgrid.
  • Scenario 3: With considering DSM and without the presence of CHP units in the microgrid.
  • Scenario 4: With considering DSM and with the presence of CHP units in the microgrid.
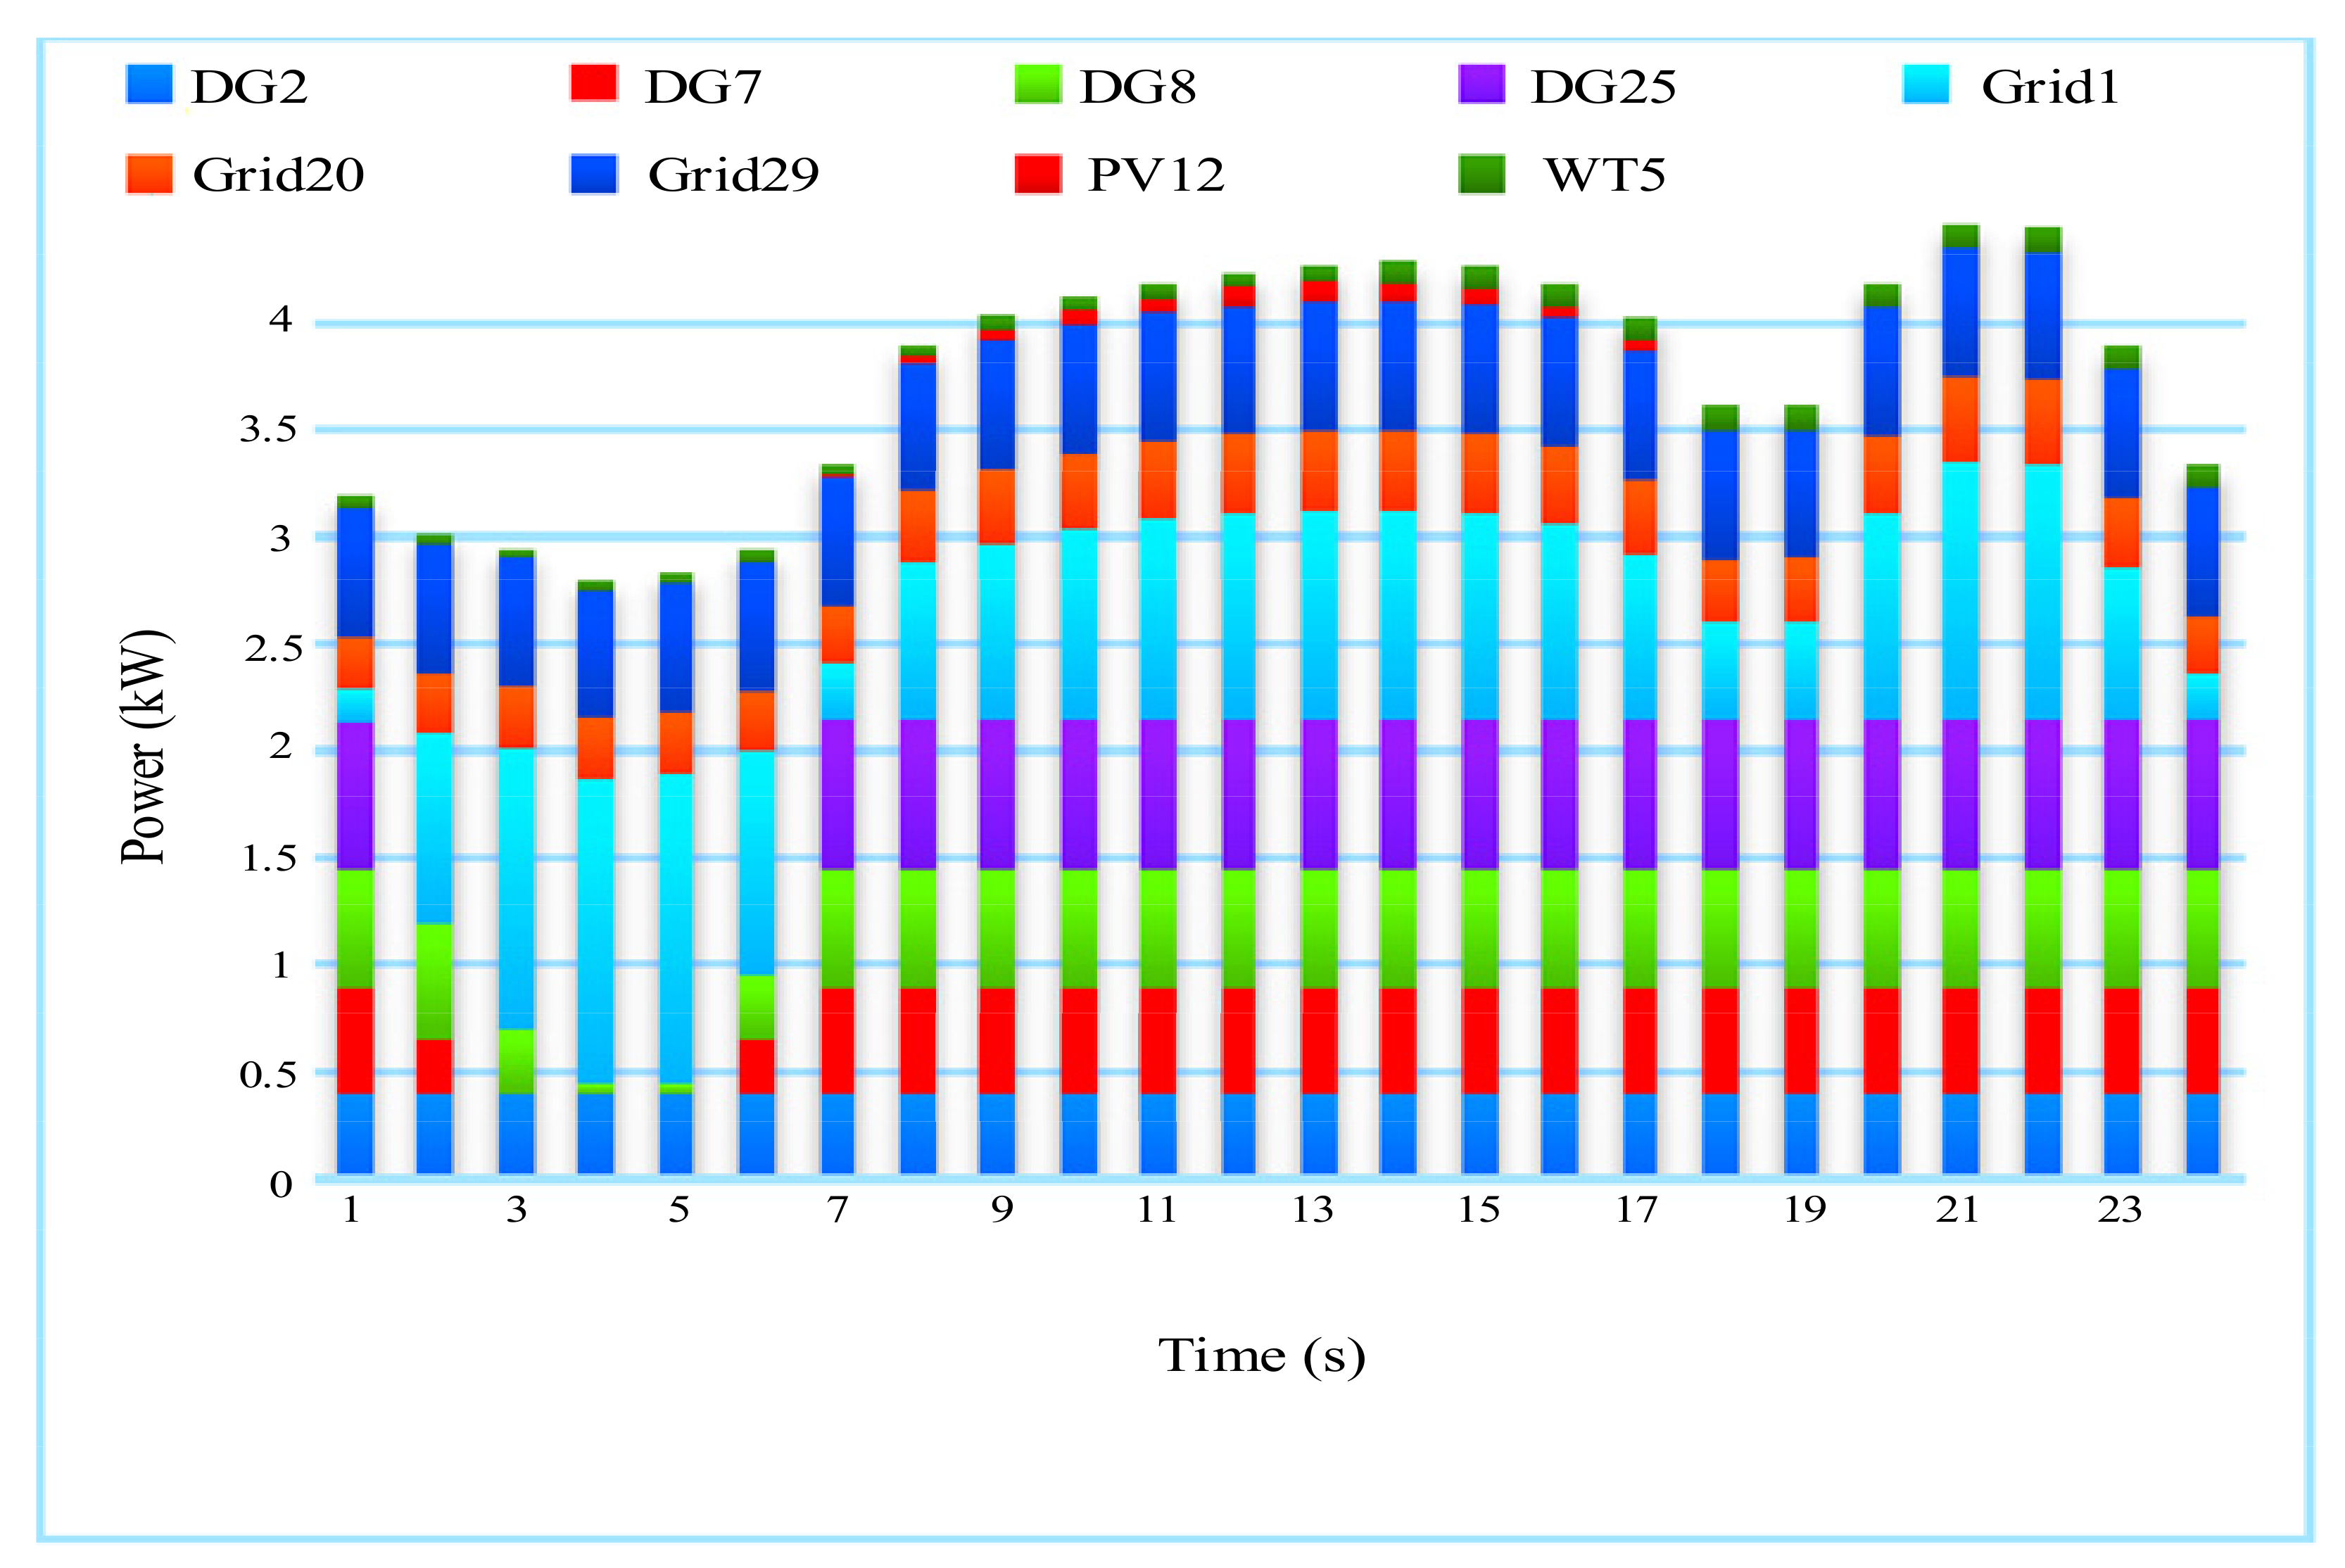
For Scenario 1, the amount of units participating and receiving electrical power from the main grid is shown in Figure 17. According to Figure 17, the microgrid tends to purchase the maximum amount of load from the main grid through bus 1 at peak consumption. Also, the presence of WT and PV units within 24 h is acceptable production. In this scenario, due to the high efficiency of the PV unit during the day from 8 am to 5 pm, it has generated electrical power for the 12 bus. Finally, the maximum profit of the microgrid in this scenario is $2185.7133.
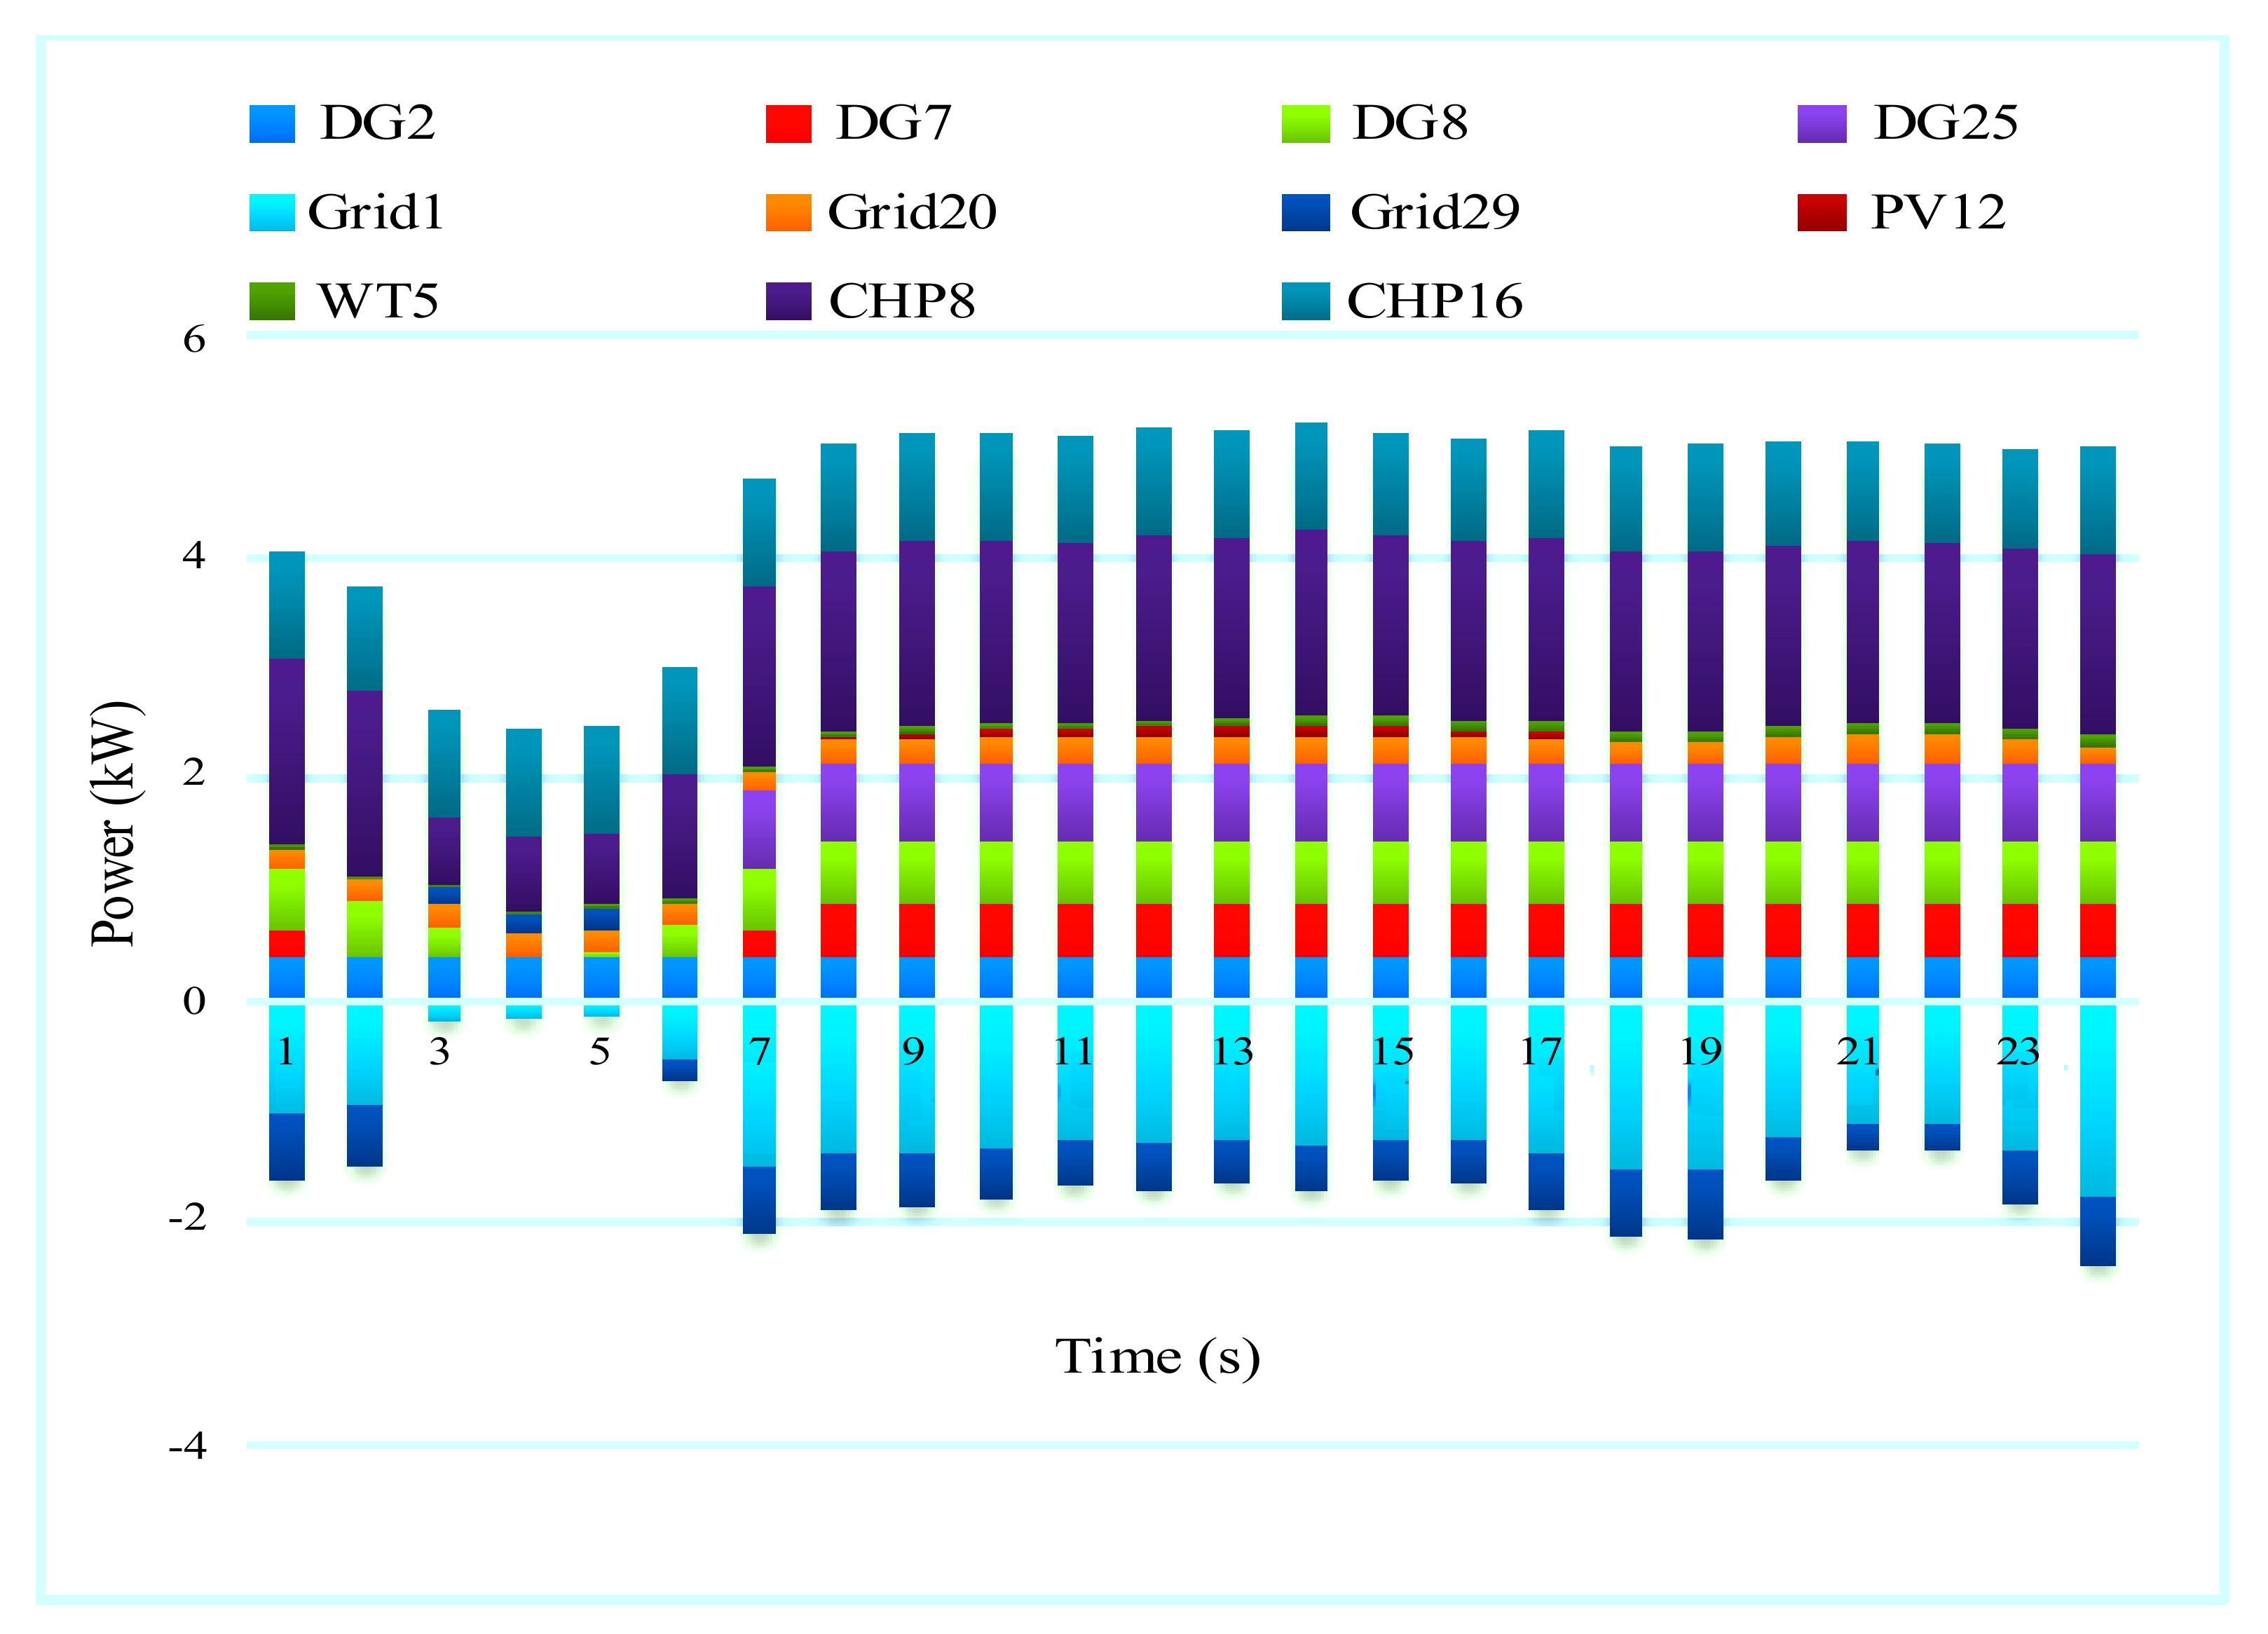
Figure 18 shows the unit participation rates for Scenario 2. In this scenario, due to the presence of high-efficiency CHPs in buses 8 and 16, the microgrid tends to sell active power to the main grid with revenue of $2681.55 and the highest profit is $5607.0256.
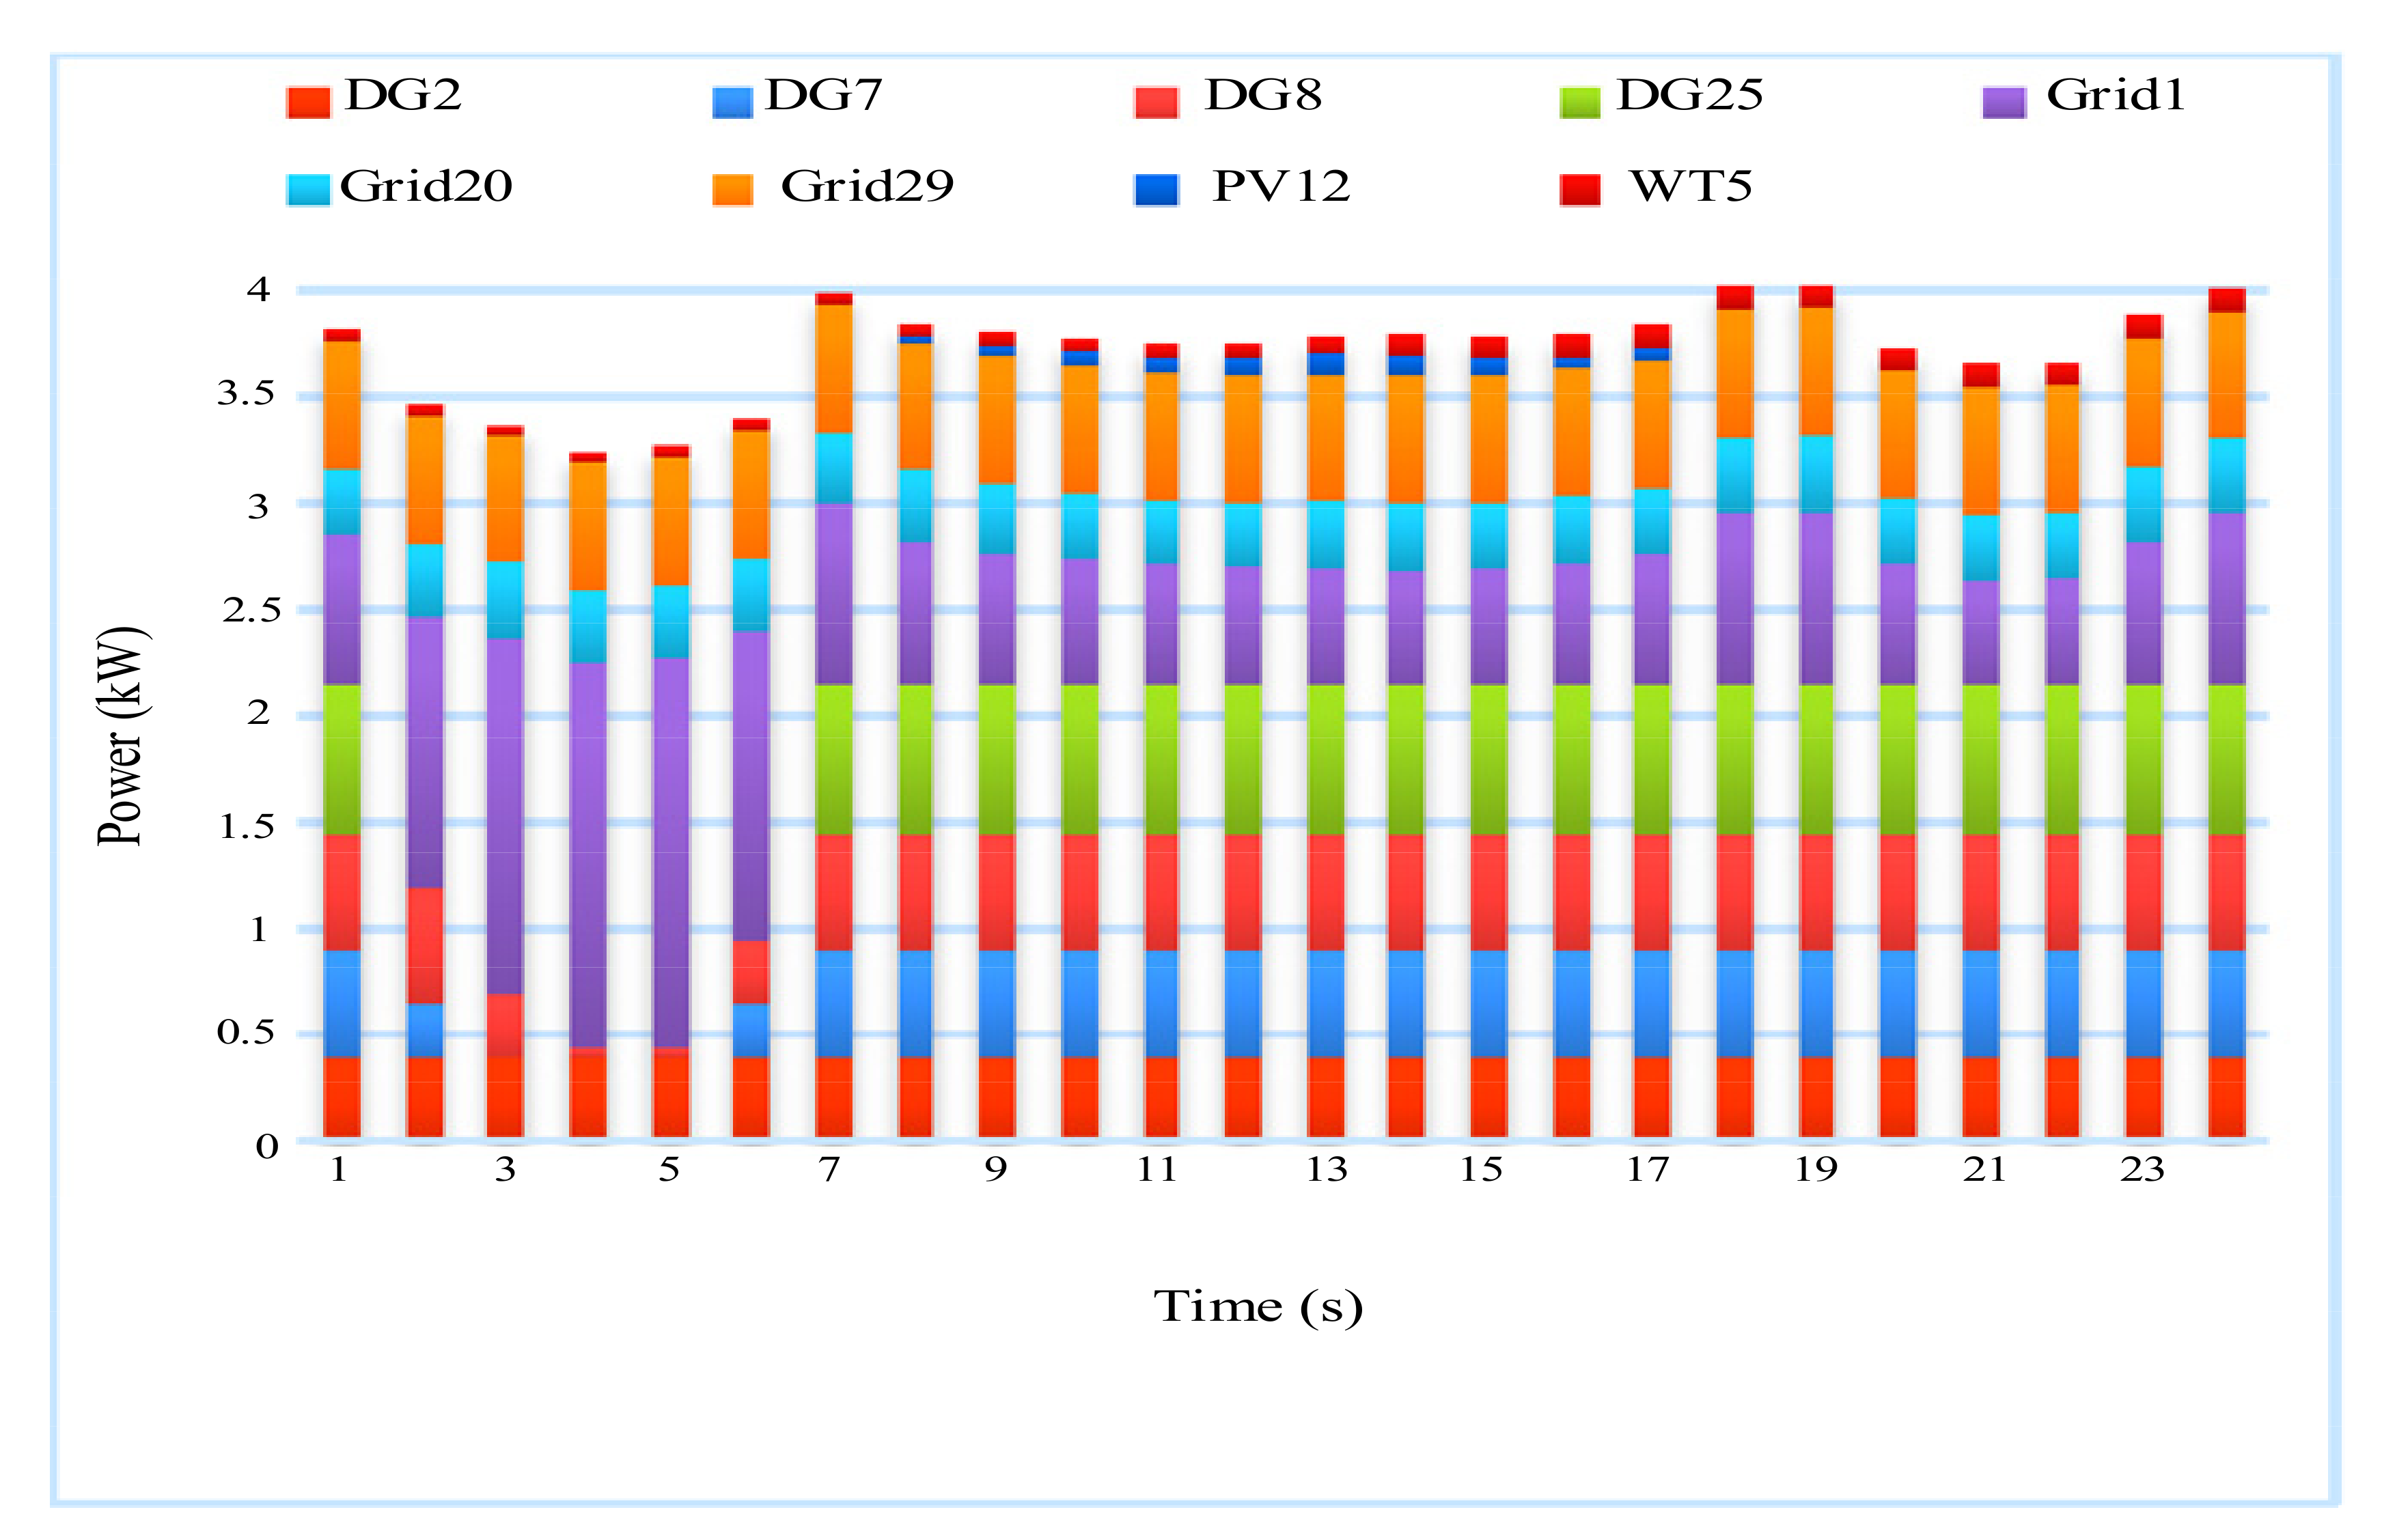
Figure 19 shows the participation rate of units in Scenario 3. In Scenario 3, the microgrid revenue increased by $2194.4243 with the implementation of DSM, which resulted in a profit of $8.711 compared to Scenario 1.
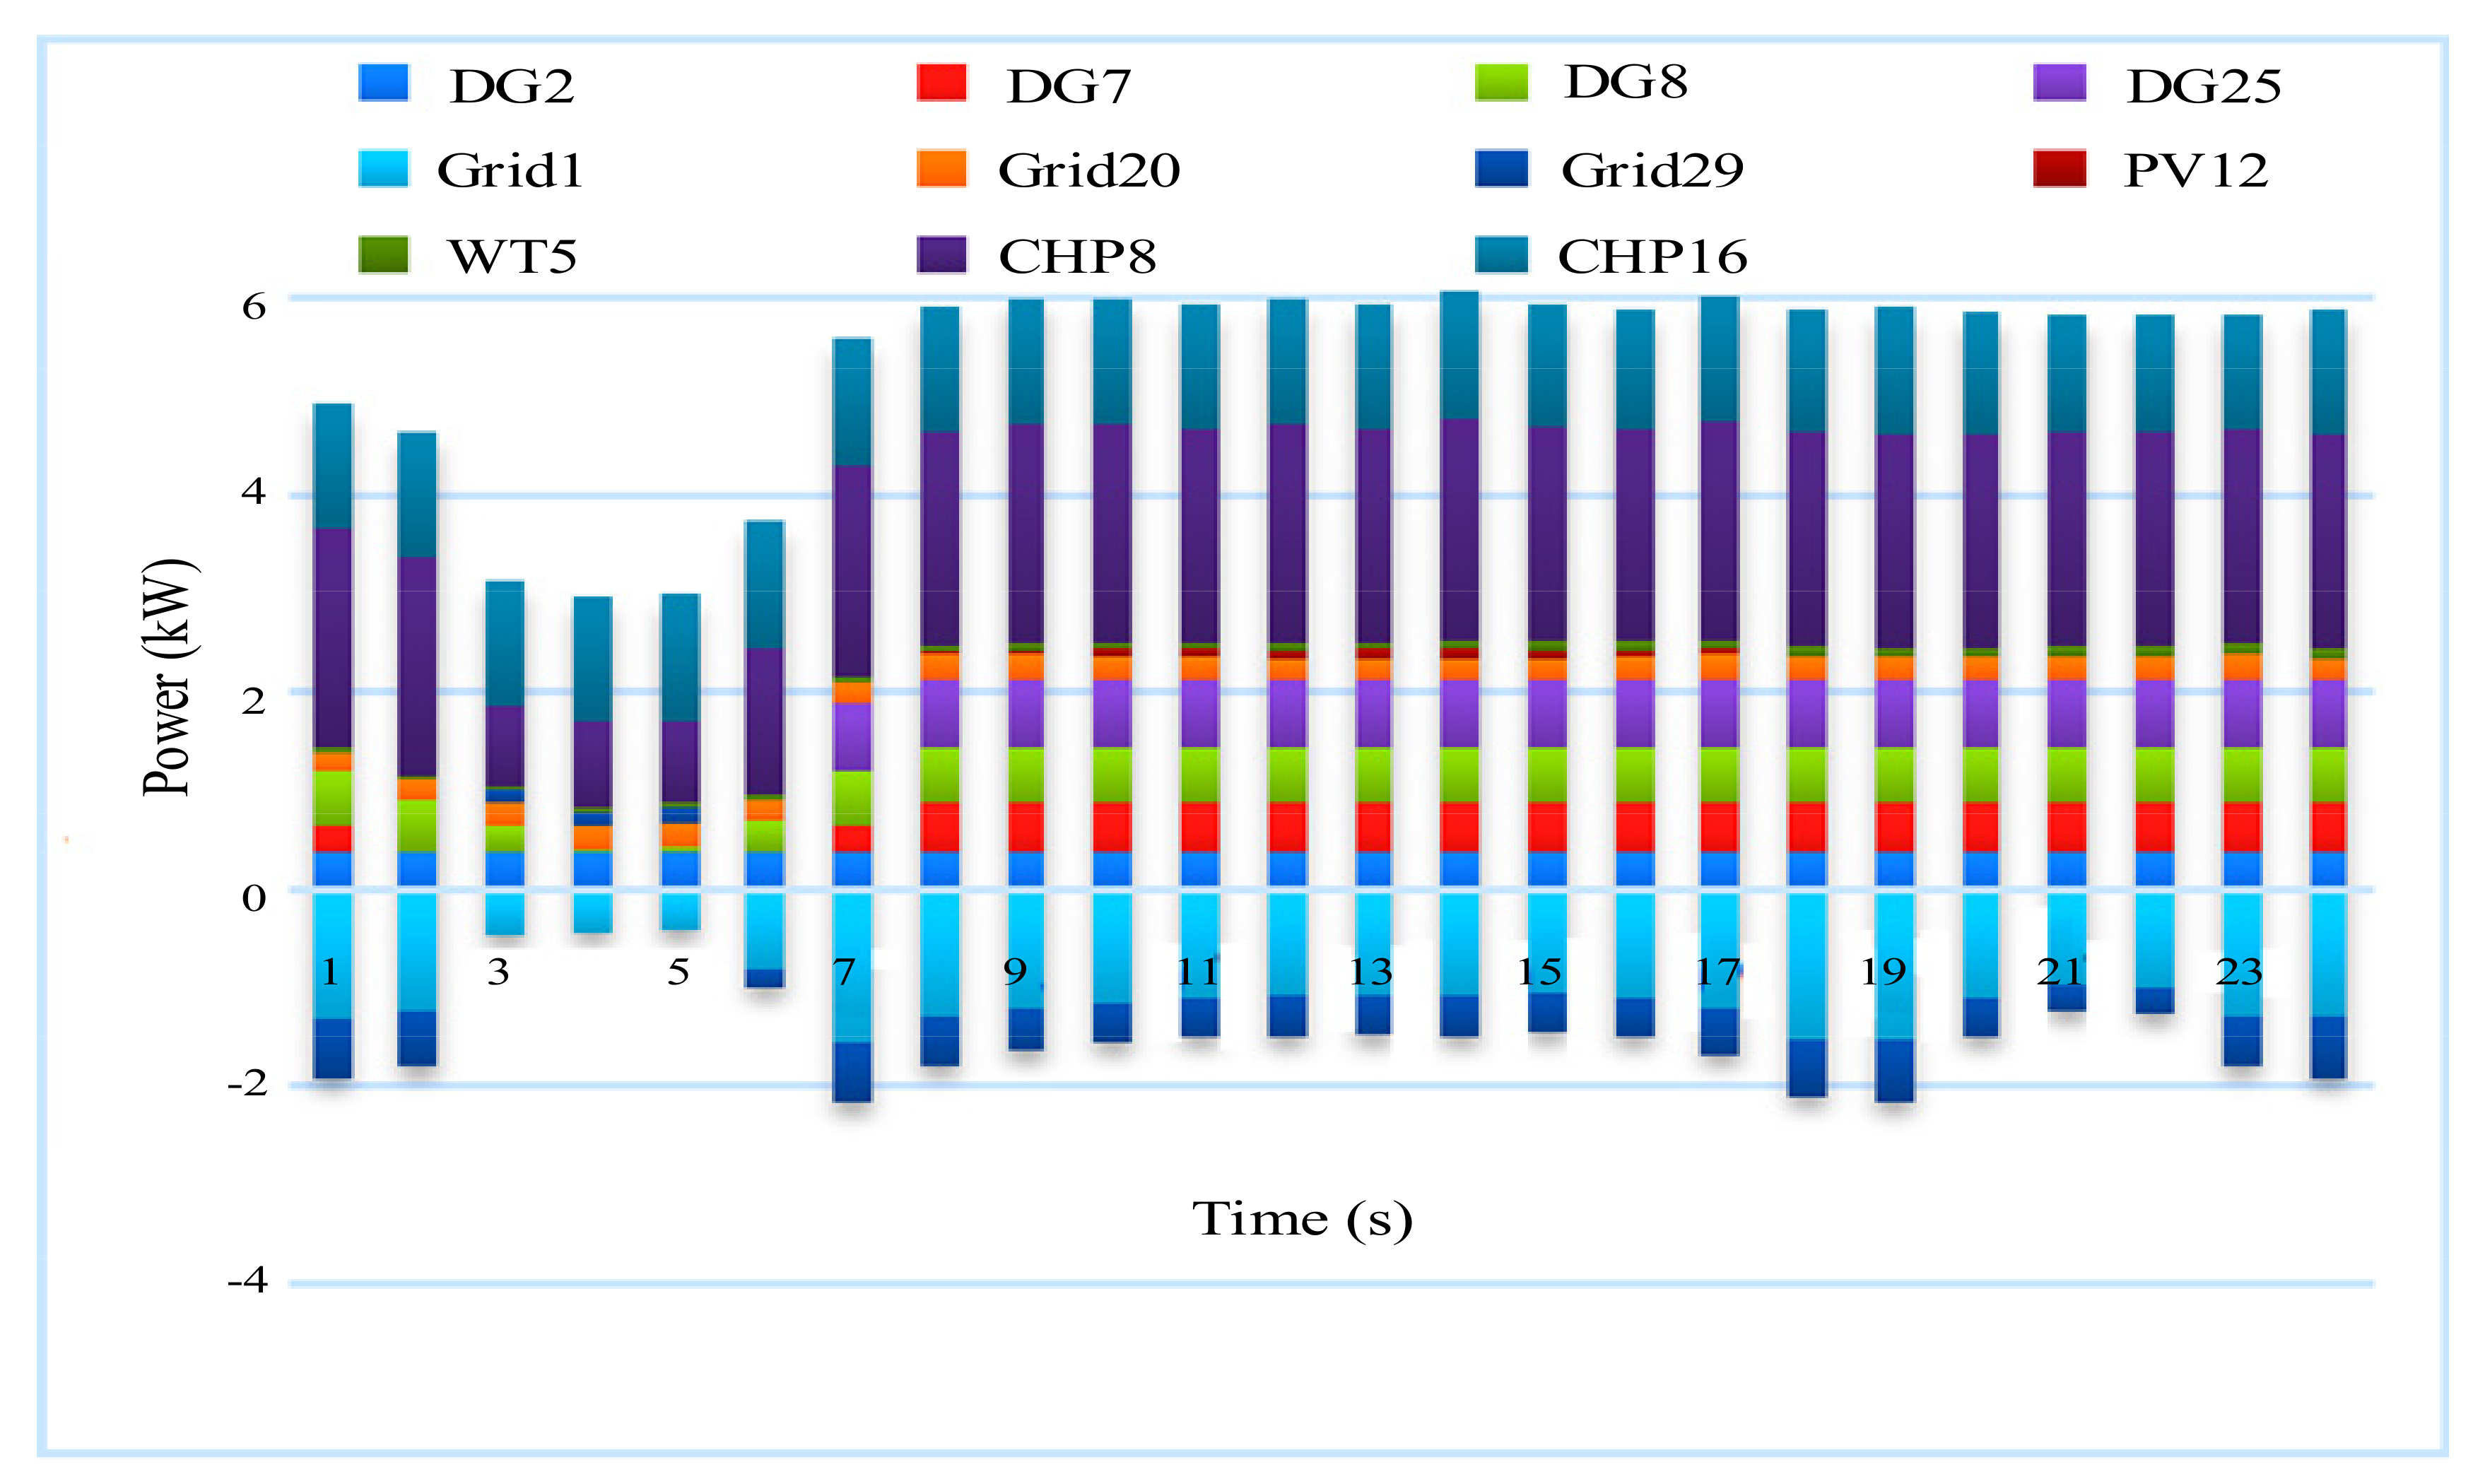
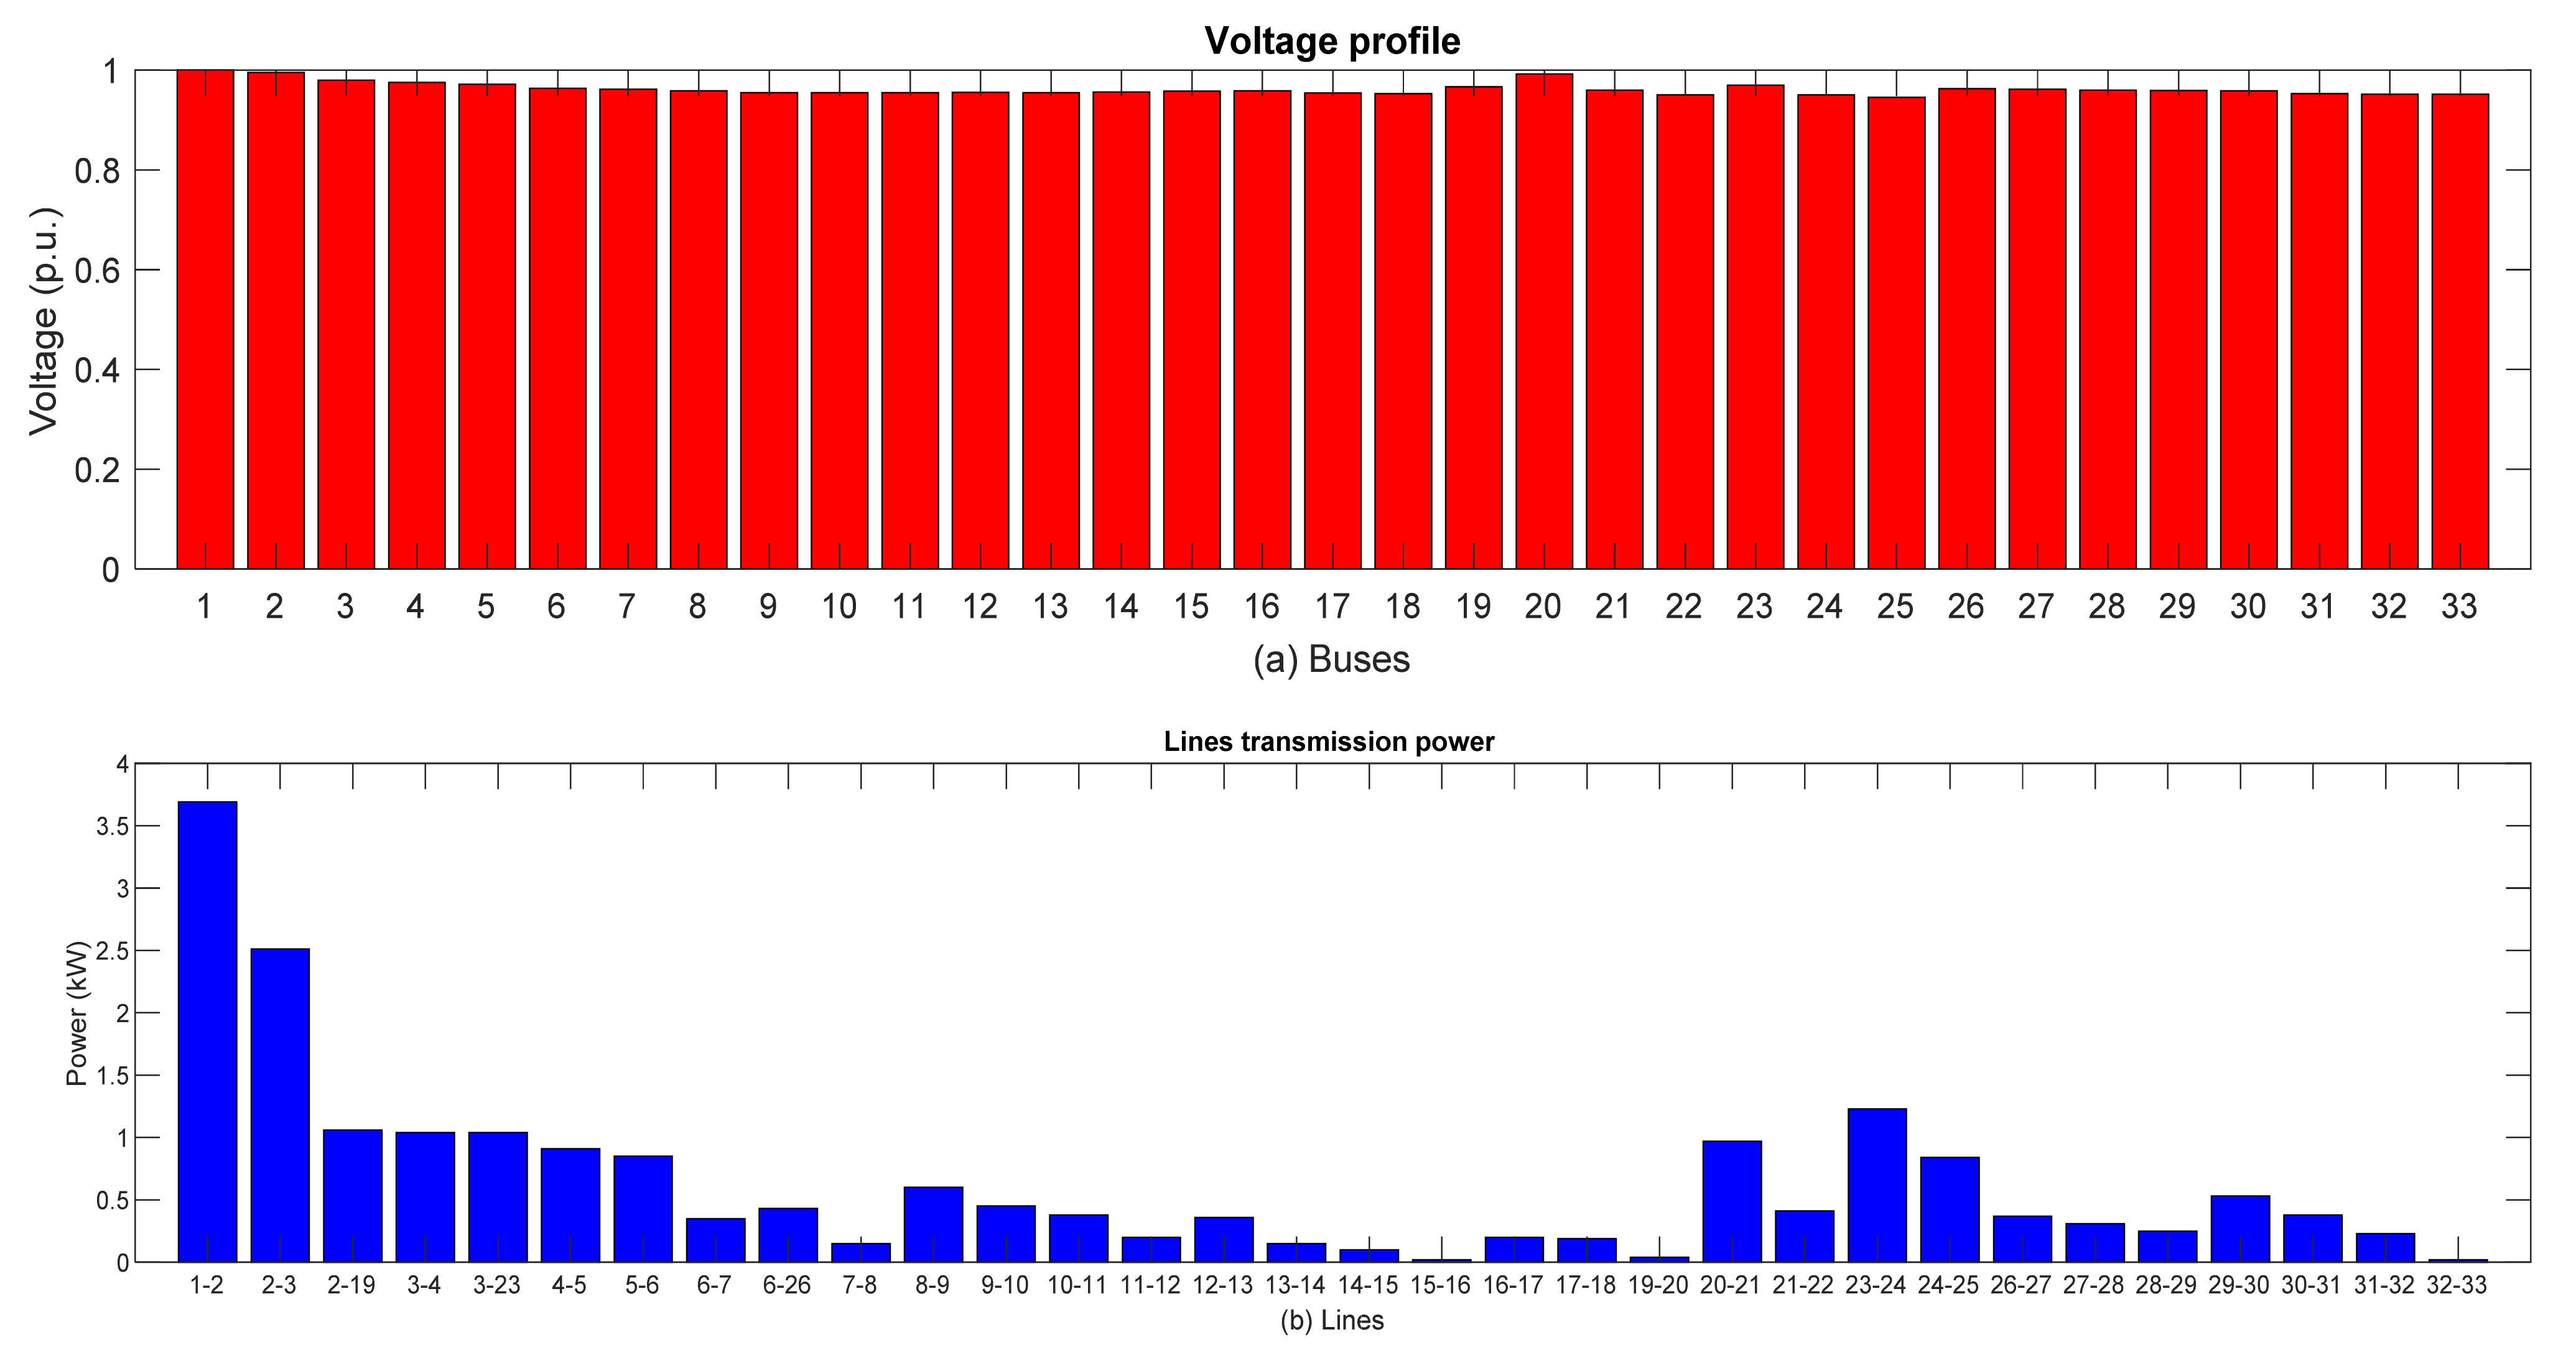
Figure 20 shows the participation rate of units in Scenario 4. In this scenario, due to the production of CHP, the microgrid is more inclined to sell electrical power to the main grid. Finally, in this scenario, the microgrid profit is $5617.706. According to Figure 21, the largest share of heat production is related to CHP bus 8 due to its low production cost. As mentioned in this paper, the ABC algorithm is used simultaneously to solve the OPF problem and its application in the structure of the GA algorithm to solve the main problem. Figure 22 shows the results of the ABC algorithm in solving the OPF problem, including the network voltage profile along with the transmission power of each network line for maximum load demand in Scenario 4.
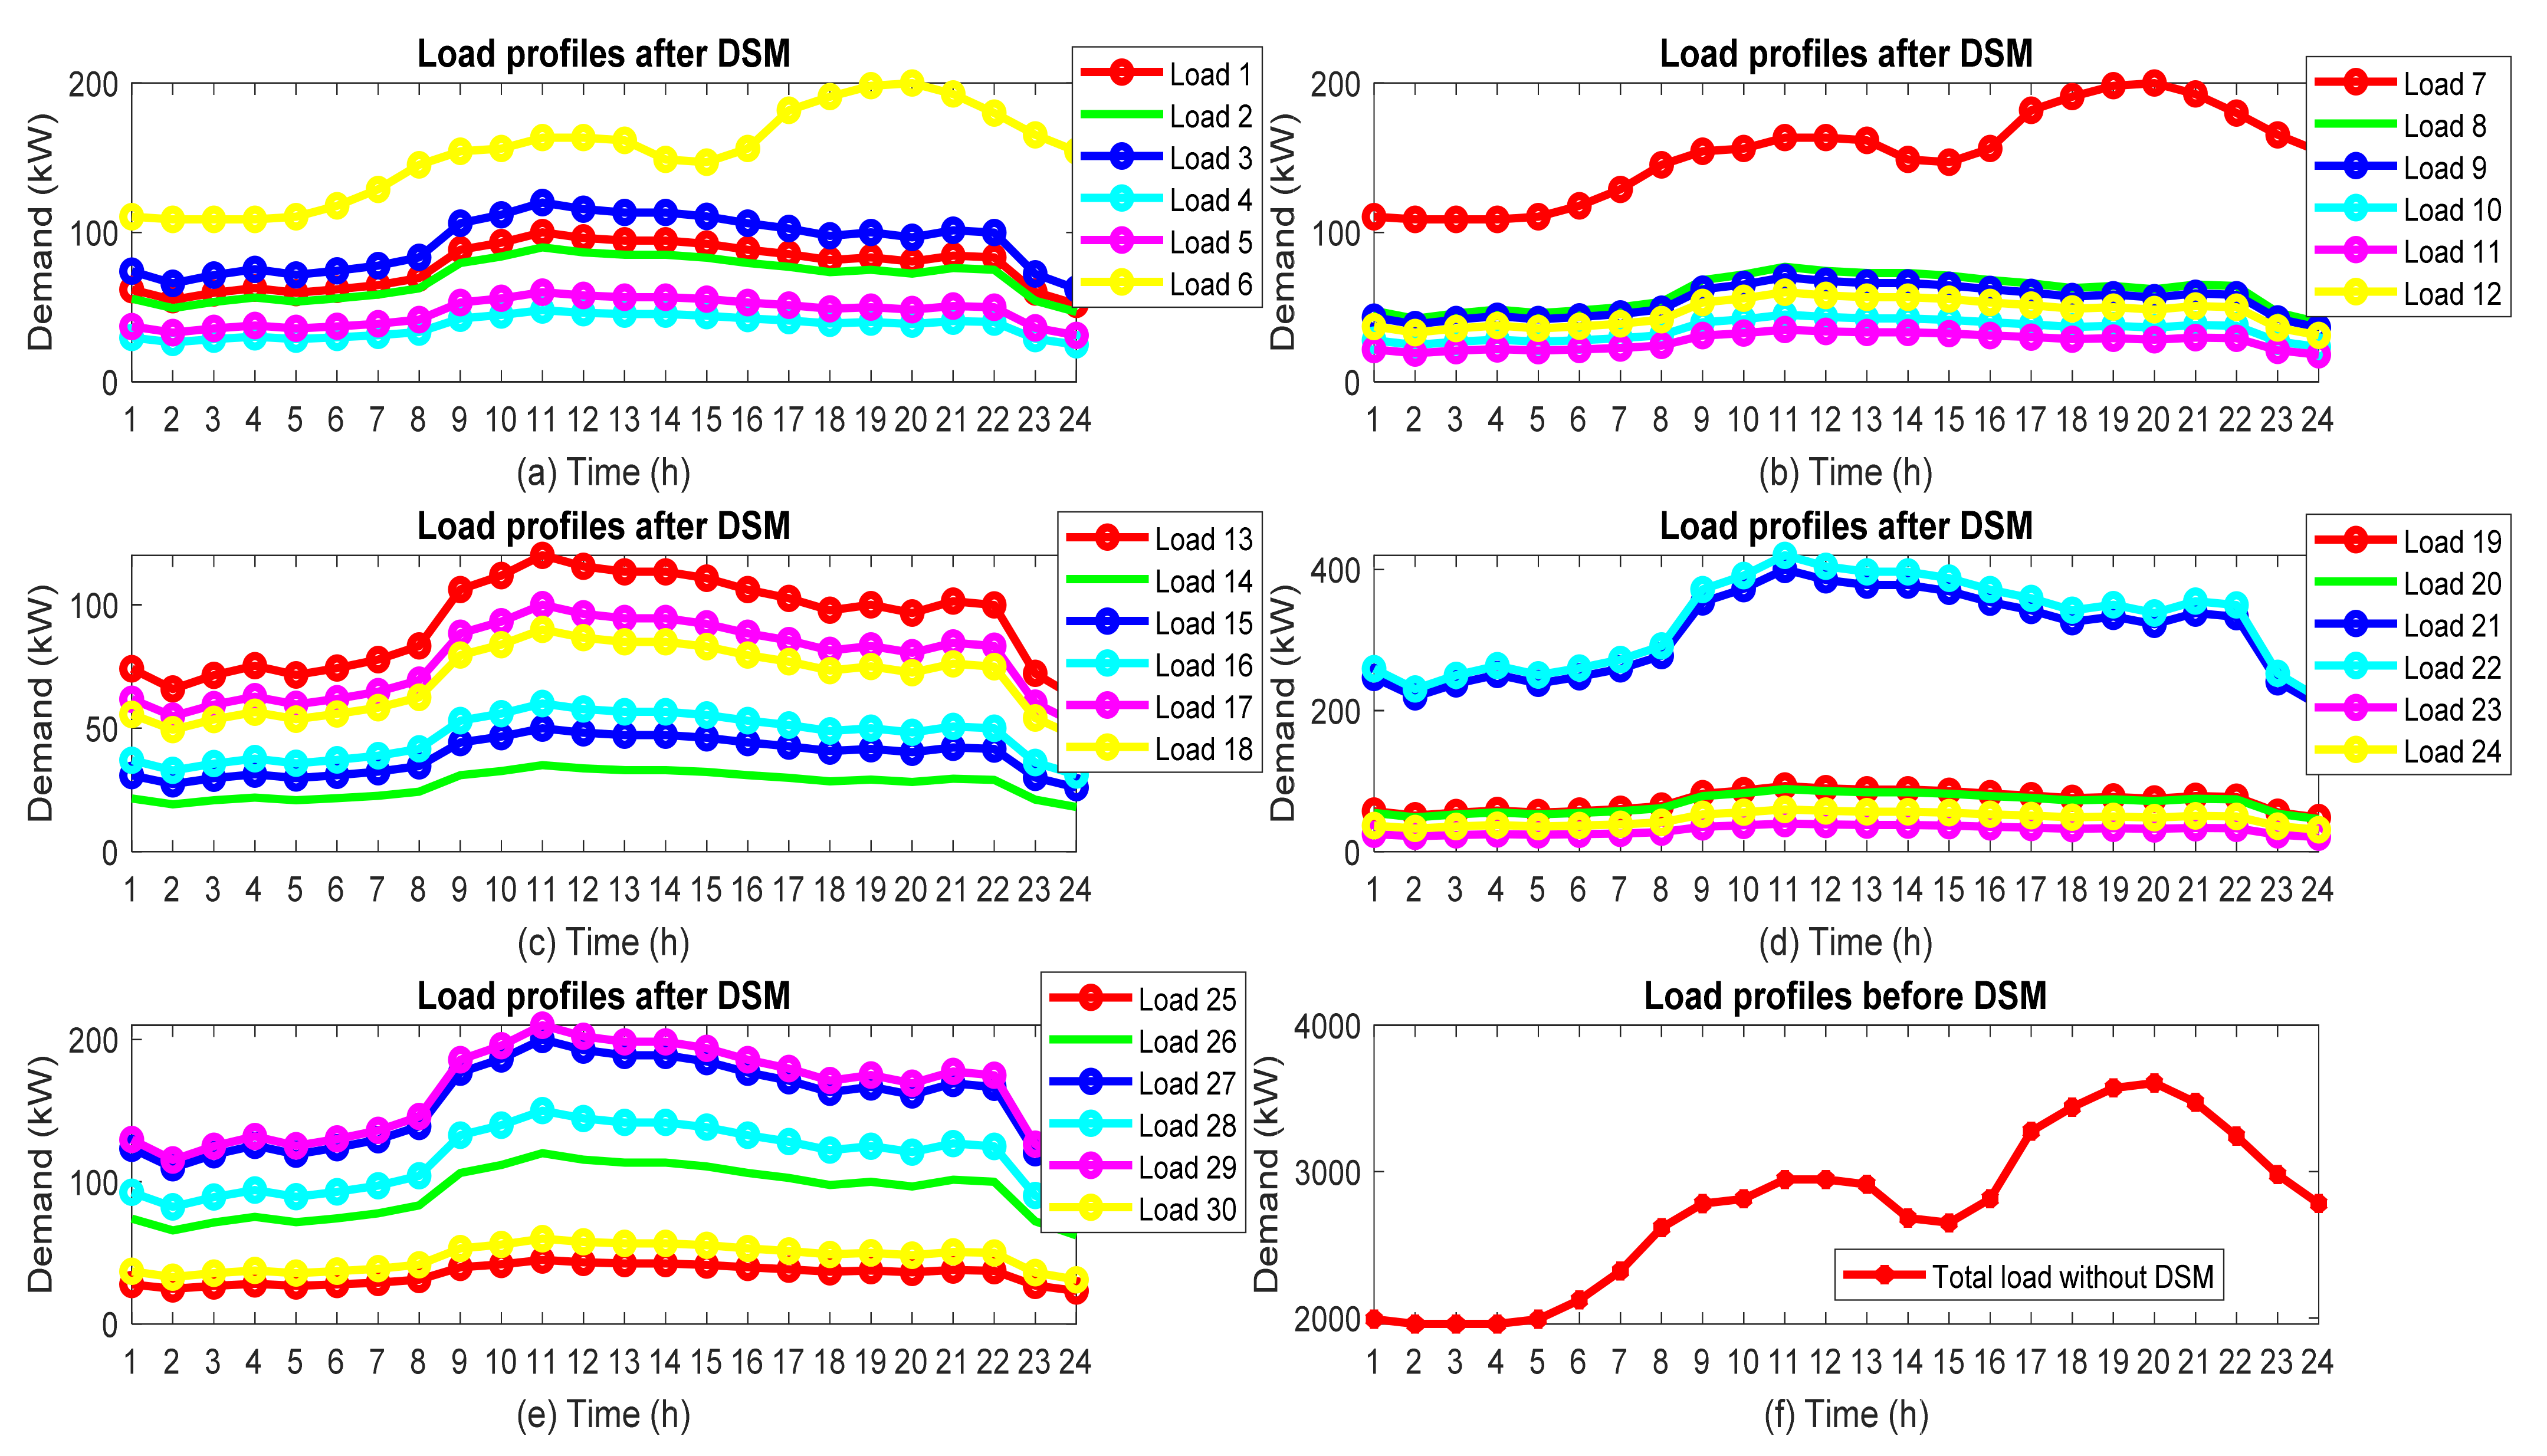
Figure 23 shows the microgrid load variation curve with DSM implementation for Scenario 4. In this paper, instead of cutting and shedding the load, the load shifting technique is used to manage the cost of the microgrid. In addition, critical loads are considered non-shiftable loads and the microgrid is responsible for supplying the load. Here, as shown in Figure 23, load6, and load7 are considered non-shiftable loads and will not participate in the DSM program. As you can see in Figure 23, the microgrid loads with shifting were able to peak shaving and smooth the microgrid load profile compared to the case without DSM (Figure 23f).
Finally, Table 11 summarizes the status of the proposed method in different scenarios. Where income, cost, and profit of microgrids with and without DSM can be seen in four scenarios. Here income is the result of the sale of electricity, the cost of the sum of DC and CF, and profit is the difference between the two amounts. As you can see, with the implementation of DSM and the presence of a variety of units in the microgrid for scenario 4, the maximum profit is obtained. In Table 12 and Figure 24, the performance of the proposed method is compared with the reference methods [38,39]. As you can see, the proposed method was able to reduce costs by 57.01% and improve by 32.01% compared to the standard GA algorithm.

6. Conclusions

In this paper, the optimal operation of microgrids along with the implementation of DSM programs was modeled as an optimization problem. The objective function used in this optimization problem is to minimize costs including the cost of operating the microgrid and the cost of implementing DSM programs to reduce customer dissatisfaction. Here, to solve the optimization problem, a hybrid algorithm including a genetic algorithm and ABC is used. All the constraints were included in the optimal power flow program and the load shifting constraints were included in the genetic algorithm. The results obtained from the implementation of this hybrid algorithm in three sample networks showed that, firstly, the implementation of the DSM program (load time shift) reduces the cost of operating the entire microgrid. Second, with the increase of the weight factor of the DSM, the number and hours of load shifting have decreased and as a result, the operating cost has increased. It was also found that the instantaneous price of electrical energy can have a great impact on the problem of optimal operation of the microgrid. Finally, to confirm the performance of the proposed method, it was implemented on the IEEE 33-bus network in different scenarios and the results were compared with AHP and IQPSO algorithms, especially if comparing the financial feedback of this algorithm faces the improved genetic algorithm where the obtained value is $2280.98, and with a standard GA algorithm gives a value of $3979.71. With other AHP and IQPSO Algorithms, the best answer obtained here is $2713.10 and $2616.53 which decreased by 48.87% and 50.69%, respectively, although it had a good performance, with the proposed method, we were able to reduce by 57.01% and improve by 32.01% compared to the standard GA algorithm. Finally, the design features are as follows:
  • Provide shifting load instead of cutting and shedding load and supply of critical load by microgrid.
  • Improved 32.01% performance of genetic algorithm based on combination with ABC algorithm.
  • Investigating the effect of unit types on cost reduction including PV, WT, MT, FC, MT, BAT and CHP.
  • Comparison of GA-ABC algorithm with meta-heuristic algorithms such as PSO, DEHS, AHP and IQPSO.
  • Analysis and review of the results of the proposed method during different scenarios with the best performance reduction of 57.01%.

Author Contributions

Conceptualization, M.D. and A.F.; methodology, M.D.; software, M.D.; validation, S.M.S.H.; formal analysis, M.D.; investigation, H.K.; resources, S.M.S.H.; data curation, S.M.S.H. and E.J.; writing—original draft preparation, M.D. and M.D.; writing—review and editing, M.J., E.J. and A.F.; visualization, A.F.; supervision, H.K., M.J., R.G. and Z.L.; project administration, M.J.; funding acquisition, H.K., R.G. and Z.L. All authors have read and agreed to the published version of the manuscript.

Funding

This research is under the SGS Grant from VSB—the Technical University of Ostrava under grant number SP2022/21.

Institutional Review Board Statement

Not applicable.

Informed Consent Statement

Not applicable.

Data Availability Statement

Not applicable.

Conflicts of Interest

The authors declare no conflict of interest.

Nomenclature

DSMdemand-side management
ABCartificial bee colony
OPFoptimal power flow
DGdistributed generation
PSOParticle swarm optimization algorithm
DSMDemand-side management
GAGenetic algorithm
CHPCombined heat and power

References

  1. Hosseinimoghadam, S.M.S.; Dashtdar, M.; Dashtdar, M. Improving the Sharing of Reactive Power in an Islanded Microgrid Based on Adaptive Droop Control with Virtual Impedance. Autom. Control Comput. Sci. 2021, 55, 155–166. [Google Scholar] [CrossRef]
  2. Dashtdar, M.; Nazir, M.S.; Hosseinimoghadam, S.M.S.; Bajaj, M. Improving the Sharing of Active and Reactive Power of the Islanded Microgrid Based on Load Voltage Control. Smart Sci. 2021, 10, 142–157. [Google Scholar] [CrossRef]
  3. Aghdam, F.H.; Sina, G.; Navid, T.K. Evaluation of loss minimization on the energy management of multi-microgrid based smart distribution network in the presence of emission constraints and clean produc-tions. J. Clean. Prod. 2018, 196, 185–201. [Google Scholar] [CrossRef]
  4. Dashtdar, M.; Najafi, M.; Esmaeilbeig, M. Probabilistic planning for participation of virtual power plants in the presence of the thermal power plants in energy and reserve markets. Sādhanā 2020, 45, 1–9. [Google Scholar] [CrossRef]
  5. Dashtdar, M.; Bajaj, M.; Hosseinimoghadam, S.M.S. Design of Optimal Energy Management System in a Residential Microgrid Based on Smart Control. Smart Sci. 2021, 10, 25–39. [Google Scholar] [CrossRef]
  6. Bazmohammadi, N.; Tahsiri, A.; Anvari-Moghaddam, A.; Guerrero, J. A hierarchical energy management strategy for interconnected microgrids considering uncertainty. Int. J. Electr. Power Energy Syst. 2019, 109, 597–608. [Google Scholar] [CrossRef]
  7. Kakran, S.; Chanana, S. Smart operations of smart grids integrated with distributed generation: A review. Renew. Sustain. Energy Rev. 2018, 81, 524–535. [Google Scholar] [CrossRef]
  8. Jafari, M.; Zahra, M.; Jianguo, Z. A magnetically coupled multi-port, multi-operation-mode mi-cro-grid with a predictive dynamic programming-based energy management for residential applications. Int. J. Electr. Power Energy Syst. 2019, 104, 784–796. [Google Scholar] [CrossRef]
  9. Polanco Vasquez, L.O.; Carreño Meneses, C.A.; Pizano Martínez, A.; López Redondo, J.; Pérez García, M.; Álvarez Hervás, J.D. Optimal energy management within a microgrid: A comparative study. Energies 2018, 11, 2167. [Google Scholar] [CrossRef] [Green Version]
  10. Utkarsh, K.; Srinivasan, D.; Trivedi, A.; Zhang, W.; Reindl, T. Distributed model-predictive re-al-time optimal operation of a network of smart microgrids. IEEE Trans. Smart Grid 2018, 10, 2833–2845. [Google Scholar] [CrossRef]
  11. Aghajani, G.R.; Shayanfar, H.A.; Shayeghi, H. Demand-side management in a smart micro-grid in the presence of renewable generation and demand response. Energy 2017, 126, 622–637. [Google Scholar] [CrossRef]
  12. Dey, B.; Raj, S.; Mahapatra, S.; Márquez, F.P.G. Optimal scheduling of distributed energy resources in microgrid systems based on electricity market pricing strategies by a novel hybrid optimization technique. Int. J. Electr. Power Energy Syst. 2021, 134, 107419. [Google Scholar] [CrossRef]
  13. Xie, S.; Zhai, R.; Liu, X.; Li, B.; Long, K.; Ai, Q. Self-adaptive genetic algorithm and Fuzzy decision-based multi-objective optimization in microgrid with DGs. Open Electr. Electron. Eng. J. 2016, 10, 46–57. [Google Scholar] [CrossRef] [Green Version]
  14. Moghaddam, A.A.; Seifi, A.; Niknam, T.; Pahlavani, M.R.A. Multi-objective operation management of a renewable MG (micro-grid) with back-up micro-turbine/fuel cell/battery hybrid power source. Energy 2011, 36, 6490–6507. [Google Scholar] [CrossRef]
  15. Dashtdar, M.; Flah, A.; Hosseinimoghadam, S.M.S.; Fard, M.Z.; Dashtdar, M. Optimization of microgrid operation based on two-level probabilistic scheduling with benders decomposition. Electr. Eng. 2022, 1–15. [Google Scholar] [CrossRef]
  16. Eseye, A.T.; Zheng, D.; Zhang, J.; Wei, D. Optimal energy management strategy for an isolated industrial microgrid using a Modified Particle Swarm Optimization. In Proceedings of the 2016 IEEE International Conference on Power and Renewable Energy (ICPRE), Shanghai, China, 21–23 October 2016; pp. 494–498. [Google Scholar]
  17. Kumar, R.S.; Raghav, L.P.; Raju, D.K.; Singh, A.R. Impact of multiple demand side management programs on the optimal operation of grid-connected microgrids. Appl. Energy 2021, 301, 117466. [Google Scholar] [CrossRef]
  18. Ndwali, P.K.; Njiri, J.G.; Wanjiru, E.M. Optimal Operation Control of Microgrid Connected Photovoltaic-Diesel Generator Backup System Under Time of Use Tariff. J. Control. Autom. Electr. Syst. 2020, 31, 1001–1014. [Google Scholar] [CrossRef]
  19. Yang, X.; Zhang, Y.; He, H.; Ren, S.; Weng, G. Real-Time Demand Side Management for a Microgrid Considering Uncertainties. IEEE Trans. Smart Grid 2018, 10, 3401–3414. [Google Scholar] [CrossRef]
  20. Kumar, R.S.; Raghav, L.P.; Raju, D.K.; Singh, A.R. Intelligent demand side management for optimal energy scheduling of grid connected microgrids. Appl. Energy 2021, 285, 116435. [Google Scholar] [CrossRef]
  21. Marzband, M.; Fouladfar, M.H.; Akorede, M.; Lightbody, G.; Pouresmaeil, E. Framework for smart transactive energy in home-microgrids considering coalition formation and demand side management. Sustain. Cities Soc. 2018, 40, 136–154. [Google Scholar] [CrossRef]
  22. Xu, F.; Wu, W.; Zhao, F.; Zhou, Y.; Wang, Y.; Wu, R.; Zhang, T.; Wen, Y.; Fan, Y.; Jiang, S. A micro-market module design for university demand-side management using self-crossover genetic algorithms. Appl. Energy 2019, 252, 113456. [Google Scholar] [CrossRef]
  23. Sedhom, B.E.; El-Saadawi, M.M.; El Moursi, M.S.; Hassan, M.A.; Eladl, A.A. IoT-based optimal demand-side management and control scheme for smart microgrid. Int. J. Electr. Power Energy Syst. 2021, 127, 106674. [Google Scholar] [CrossRef]
  24. Eid, C.; Koliou, E.; Valles, M.; Reneses, J.; Hakvoort, R. Time-based pricing and electricity demand response: Existing barriers and next steps. Util. Policy 2016, 40, 15–25. [Google Scholar] [CrossRef] [Green Version]
  25. Mohsin, M.; Hanif, I.; Taghizadeh-Hesary, F.; Abbas, Q.; Iqbal, W. Nexus between energy efficiency and electricity reforms: A DEA-Based way forward for clean power development. Energy Policy 2021, 149, 112052. [Google Scholar] [CrossRef]
  26. Hu, Z.; Han, X.; Wen, Q. Integrated Resource Strategic Planning and Power Demand-Side Management; Springer: Berlin/Heidelberg, Germany, 2013; pp. 63–133. [Google Scholar]
  27. Keyhani, A.; Mohammad, A. Smart Power Grids 2011; Springer Science & Business Media: Berlin, Germany, 2012. [Google Scholar]
  28. Feuerriegel, S.; Dirk, N. Integration scenarios of Demand Response into electricity markets: Load shifting, financial savings and policy implications. Energy Policy 2016, 96, 231–240. [Google Scholar] [CrossRef] [Green Version]
  29. Kong, J.; Skjelbred, H.I.; Fosso, O.B. An overview on formulations and optimization methods for the unit-based short-term hydro scheduling problem. Electr. Power Syst. Res. 2020, 178, 106027. [Google Scholar] [CrossRef]
  30. Roldán-Blay, C.; Miranda, V.; Carvalho, L.; Roldán-Porta, C. Optimal Generation Scheduling with Dynamic Profiles for the Sustainable Development of Electricity Grids. Sustainability 2019, 11, 7111. [Google Scholar] [CrossRef] [Green Version]
  31. Liaquat, S.; Zia, M.F.; Benbouzid, M. Modeling and formulation of optimization problems for optimal scheduling of mul-ti-generation and hybrid energy systems: Review and recommendations. Electronics 2021, 10, 1688. [Google Scholar] [CrossRef]
  32. Jayadev, V.; Swarup, K.S. Optimization of microgrid with demand-side management using Genetic Algorithm. In Proceedings of the IET Conference on Power in Unity: A Whole System Approach, London, UK, 16–17 October 2013; pp. 1–12. [Google Scholar]
  33. Moghaddam, A.A.; Seifi, A.; Niknam, T. Multi-operation management of a typical micro-grids using Particle Swarm Optimization: A comparative study. Renew. Sustain. Energy Rev. 2012, 16, 1268–1281. [Google Scholar] [CrossRef]
  34. Askarzadeh, A. A memory-based genetic algorithm for optimization of power generation in a microgrid. IEEE Trans. Sustain. Energy 2017, 9, 1081–1089. [Google Scholar] [CrossRef]
  35. Gao, R.; Juebo, W.; Wen, H.; Yun, Z. An improved ABC algorithm for energy management of microgrid. Int. J. Comput. Commun. Control. 2018, 13, 477–491. [Google Scholar] [CrossRef] [Green Version]
  36. Reddy, S.S.; Park, J.Y.; Jung, C.M. Optimal operation of microgrid using hybrid differential evolution and harmony search algorithm. Front. Energy 2016, 10, 355–362. [Google Scholar] [CrossRef]
  37. Mohammadi, S.; Mozafari, B.; Solimani, S.; Niknam, T. An Adaptive Modified Firefly Optimisation Algorithm based on Hong‘s Point Estimate Method to optimal operation management in a microgrid with consideration of uncertainties. Energy 2013, 51, 339–348. [Google Scholar] [CrossRef]
  38. Raghav, L.P.; Kumar, R.S.; Raju, D.K.; Singh, A.R. Analytic Hierarchy Process (AHP)—Swarm intelligence based flexible demand response management of grid-connected microgrid. Appl. Energy 2021, 306, 118058. [Google Scholar] [CrossRef]
  39. Ge, L.; Liu, H.; Yan, J.; Zhu, X.; Zhang, S.; Li, Y. Optimal Integrated Energy System Planning with DG Uncertainty Affine Model and Carbon Emissions Charges. IEEE Trans. Sustain. Energy 2021, 13, 905–918. [Google Scholar] [CrossRef]
Figure 1. Division of demand response programs.
Sustainability 14 06759 g001
Figure 2. General space of the problem and solution method.
Sustainability 14 06759 g002
Figure 3. Genetic disciplines in the proposed hybrid algorithm.
Sustainability 14 06759 g003
Figure 4. Flowchart of the proposed hybrid algorithm.
Sustainability 14 06759 g004
Figure 5. The first microgrid understudy.
Sustainability 14 06759 g005
Figure 6. PV power generation curve.
Sustainability 14 06759 g006
Figure 7. Purchase and sale prices of electricity.
Sustainability 14 06759 g007
Figure 8. Loads information, (a) Shiftable loads, (b) Non-shiftable loads.
Sustainability 14 06759 g008
Figure 9. Convergence process of the proposed algorithm.
Sustainability 14 06759 g009
Figure 10. Microgrid power generation and power received from the grid.
Sustainability 14 06759 g010
Figure 11. The second microgrid understudy.
Sustainability 14 06759 g011
Figure 12. Convergence curve of the proposed algorithm.
Sustainability 14 06759 g012
Figure 13. Generation power of microgrid and main grid.
Sustainability 14 06759 g013
Figure 14. Network load changes in 24 h.
Sustainability 14 06759 g014
Figure 15. The third microgrid understudy.
Sustainability 14 06759 g015
Figure 16. Predicted heat load demand in a day.
Sustainability 14 06759 g016
Figure 17. Units participation rate in supplying electric load for scenario 1.
Sustainability 14 06759 g017
Figure 18. Units participation rate in supplying electric load for scenario 2.
Sustainability 14 06759 g018
Figure 19. Units participation rate in supplying electric load for scenario 3.
Sustainability 14 06759 g019
Figure 20. Units participation rate in supplying electric load for scenario 4.
Sustainability 14 06759 g020
Figure 21. Participation of CHP units in bases 8 and 16 to provide heat load in scenario 4.
Sustainability 14 06759 g021
Figure 22. OPF results with ABC algorithm, (a) Voltage profile, (b) Line transmission power changes for scenario 4.
Sustainability 14 06759 g022
Figure 23. (af) Microgrid load variation curve in 24 h with DSM implementation for scenario 4.
Sustainability 14 06759 g023
Figure 24. Convergence curve comparison of the proposed GA-ABC algorithm.
Sustainability 14 06759 g024
Table 1. Parameters of ABC algorithm.
ParametersDescription
X ¯ m{(xmi, i = 1,…, d)}mth of a candidate answer
DNumber of problem dimensions
ȳmNeighborhood of X ¯ m
xmiThe value of the variable mth in the ith dimension
|P|Population size
lbiThe lower limit for the ith dimension
μbiThe upper limit for the ith dimension
ϕmiRandom number in the range (−1, 1)
pmProbability of selecting the feed source of the employed bee m by the observer bees
Table 2. Diesel Generator Information [32].
Generation UnitMaximum PowerMinimum PowerCost Function
Diesel generator4 MW0.1 MWF(p) = 0.02268p2 + 15.06p + 817.47
Table 3. Coefficients of DSM cost function [32].
LoadABC
Load 100.231
Load 200.532
Load 300.611
Load 40.0320.965
Load 500.523
Load 600.114
Load 70.020.335
Load 800.253
Load 900.162
Load 1000.483
Table 4. The amount of load shifting and costs.
CoefficientsCostsTime of Loads Shifting in Terms of Hours
W1W2CF ($)DC ($)FSt1St2St3St4St5St6St7St8St9St10
113,081,652.335453,8203,135,472.3353010010820
Table 5. The effect of weighting coefficients on the objective function.
CoefficientsCostsTime of Loads Shifting in Terms of Hours
W1W2CF ($)DC ($)FSt1St2St3St4St5St6St7St8St9St10
103,016,445.004303,016,445.0046056174179223
113,081,652.335453,8203,135,472.3353000010820
123,174,678.162818,6003,193,278.1620100100100
Without DSM3,144,023.2700-3,144,023.27----------
Table 6. The effect of PV panels on the objective function.
PVCostsTime of Loads Shifting in Terms of Hours
CF ($)DC ($)FSt1St2St3St4St5St6St7St8St9St10
Presence 3,081,652.335453,8203,135,472.33543000010820
Absence 5,556,267.240026,7205,582,987.241110001400
Table 7. The effect of the electricity price on the objective function.
Price CostsTime of Loads Shifting in Terms of Hours
CF ($)DC ($)FSt1St2St3St4St5St6St7St8St9St10
Variable3,081,652.335453,8203,135,472.33543000010820
Fixed3,026,958.290064,2403,091,198.293110010831
Table 8. Range of power changes of generation units.
UnitsPmin (kW)Pmax (kW)
PV025
WT015
MT630
FC330
BAT−3030
Grid−3030
Table 9. Characteristics of DG units.
BusPmin (kW)Pmax (kW)CDG ($/kWH)Rup (kW/H)Rdn (kW/H)SUc ($)SDc ($)
250400272001002025
740500452502502025
820550352502505025
25507005070070000
Table 10. Characteristics of CHP units.
BusPmin (kW)Pmax (kW)Hmax (kWth)ABCDEF
8810247018000.04353612.50.0270.60.011
16400125813560.034514.526.50.034.20.031
Table 11. The results of profit and cost of microgrids in different scenarios.
Scenarios CoefficientsIncome ($)Cost ($) Profit ($)
W1W2
Scenario11074925306.292185.7133
Scenario2107956.6362349.385607.2560
Scenario3117185.8144991.392194.4243
Scenario4117898.6862280.985617.7067
Table 12. Comparison of the results of the proposed GA-ABC algorithm.
AlgorithmsCost ($)Cost Reduction (%)
GA algorithm3979.7125
GA-ABC algorithm2280.9857.01
Analytic Hierarchy Process (AHP)—Swarm intelligence [38]2713.1048.87
Improved quantum particle swarm optimization (IQPSO) algorithm [39]2616.5350.69
Publisher’s Note: MDPI stays neutral with regard to jurisdictional claims in published maps and institutional affiliations.