Article

Validation of an Empirical Model with Risk Assessment Functionalities to Simulate and Evaluate the Tailings Dam Failure in Brumadinho

1
Geomatics Research Group, Institute of Geography, Faculty of Geosciences, Ruhr University Bochum, 44870 Bochum, Germany
2
GRID-Arendal, N-4836 Arendal, Norway
*
Author to whom correspondence should be addressed.
Sustainability 2022, 14(11), 6681; https://doi.org/10.3390/su14116681
Submission received: 11 March 2022 / Revised: 16 May 2022 / Accepted: 25 May 2022 / Published: 30 May 2022
(This article belongs to the Special Issue Risk Assessment and Sustainable Disaster Management)

Abstract

:
The failure of tailings dams causes ecological damage and economic loss and can cause casualties. The simulation of the tailings’ spill path in the event of tailings dam failures (TDFs) can mitigate the risk by the provision of spatial information for disaster prevention and preparedness. In order to close the gap between basic one-dimensional spill-path routing models and complex numerical models, this paper examines an empirical model based on the freely available Laharz model. The model incorporates a tailings-specific planimetric area regression from the literature to describe the spatial extent of tailings flows based on the released volume. By providing information about affected residents and infrastructure, such a model can be used for preliminary risk evaluation. The model was validated against the TDF in Brumadinho (2019) and reached hit rates of over 80%, critical success indices of approximately 60% and false alarm ratios of roughly 30%. The latter is particularly evident in the overestimation of the lower part of the tailings flow. The risk assessment identified 120 affected residents, 117 destroyed buildings (109 reported) and several kilometres of affected roads (1.9 km) and railway (2.75 km). However, the OpenStreetMap-based part of the risk assessment inherits some uncertainties to be investigated in the future.

1. Introduction

Over the last decades, the mining industry has reported a steady increase in the volume of extracted minerals and other materials due to the growing demand for consumer goods—an increase of approximately 250% between 1900 and 2015 (material consumption per capita) [1]. Simultaneously, the amount of extracted materials increased twelvefold and reached 89 Gt per year in 2015 [1]. However, the extraction of most minerals also produces waste tailings. Tailings are a conglomerate of crushed rock and fluids separated from the extracted valuable minerals during different processing steps [2]. These by-products might contain heavy metals or toxic substances like chemicals that mining companies use during milling or washing procedures [3]. As the main waste stream of the mining sector, tailings are usually stored behind embankments, termed tailings dams or tailings storage facilities (TSFs). Several billion tonnes of tailings are produced annually worldwide—with roughly 14 Gt in 2010 [4]. The average TSF stores approximately 26 million m3 tailings [5]. The failure of a tailings dam can result in the release of a slurry of mud and rock causing severe damage to the environment and in some instances claiming lives [6]. At least 2375 deaths have been recorded between 1961 and 2019 linked to tailings dam failures (TDFs) [4]. Thus, TSFs carry a potential disaster risk for local people and the environment.
Apart from structural innovations on the TSFs themselves, early warning systems or the identification of designated danger zones can help to reduce the risk to surrounding communities of a dam burst. The TDF in the Córrego do Feijão iron ore mine, situated east of the municipality of Brumadinho in the Brazilian state Minas Gerais and whose collapse happened on 25 January 2019 at 12:28 p.m., showed that a TDF can occur rapidly and without premonitions [6,7]. The mine’s Dam 1 collapsed and released approximately 9.7 of its 12.7 million m3 of stored tailings within less than five minutes, which resulted in a mud wave up to a height of 30 m [7]. The facility was examined by local consultants and monitored by several safety systems, but none of the systems triggered warnings until the dam collapsed, releasing its tailings downhill and causing 270 known casualties (most of those killed were employees of the mine) [7,8,9]. Besides human casualties and material losses, the tailings contaminated the Paraopeba River’s water and sediments which were toxic to different trophic levels [8]. The TDF triggered an unprecedented series of actions within the mining sector’s disclosure policy. Nevertheless, this turn in policy was not the mining company’s action but provoked by the Investor Mining and Tailings Safety Initiative (IMTSI) in 2019. The IMTSI is “a group of institutional investors, governed through a steering committee chaired by the Church of England Pension Board and the Swedish Council of Ethics of the AP Funds” [4]. Together they released the first Global Industry Standard on Tailings Management (GISTM) and the Global Tailings Dam Portal Project (GTD) [9]. The portal represents the most comprehensive global database listing disclosed data of 1847 TSFs from 105 mining companies [5,10]. This dataset can improve geoinformatics-based research by providing information about TSF’s location as well as current and future storage volumes among other inherent properties.
Several studies have been conducted to identify early warning signs in the subsidence processes of the TSF in Brumadinho using Interferometric Synthetic Aperture Radar (InSAR) and Differential InSAR (DInSAR) methods [6,7,11]. However, they come to different conclusions suggesting that further approaches to disaster prevention should be consulted. Modelling possible dam failure scenarios can provide spatial information about potentially affected areas and quantify possibly affected people and infrastructure. The resulting spatial data can be incorporated into construction planning processes to contribute to prevention and preparedness and therefore mitigate the risk.
There are two types of models to predict the spill paths after dam breaks—numerical and empirical models. The latter makes use of regression equations based on historical dam breaks and requires limited variables, such as storage volume or dam height, to simulate the event of a breaking dam. These models do not take into account any special features of the rheological properties of the stored material or the individual surface properties of the environment which might result in inaccuracies and missing information about the flow pattern [12]. Numerical models can consider various variables including material-specific properties and can describe hazardous events, such as mud or tailings flows in three dimensions making them the preferred approach in literature [12,13].
Yu et al. [12] applied a three-dimensional computational fluid dynamics method and investigated its accuracy based on the incident in the Córrego do Feijão iron ore mine. The authors ran the numerical model on a supercomputer cluster. The necessary topographic mesh was derived from the ALOS PALSAR RTC digital elevation model [12]. Unlike empirical models, their applied model considered the tailings’ rheological properties based on estimations from literature. As a result, the spatial extent of the calculated mudflow satisfactorily matched the actual inundation area. Furthermore, the model estimated that the tailings needed 40 min before reaching the Paraopeba River [12].
Lumbroso et al. [14] simulated the TDF in Brumadinho based on the EMBREA-MUD dam breach model and the two-dimensional hydrodynamic model MIKE 21. EMBREA-MUD sets the released tailings [m3/s] in relation to the time after the initial dam breach and provides a two-dimensional hydrograph [14]. MIKE 21 incorporates those results and renders a dynamic spatiotemporal model of the flow based on additional variables, such as fluid density, yield stress and dynamic viscosity, as well as a high-resolution digital elevation model (DEM). However, the values for the variety of required variables had been unknown until the release of the expert panel’s report and were adapted after its publication. The modelled tailings flow corresponds well with Brumadinho’s iron ore mine’s actual flow [14]. According to the model’s calculation, the tailings flow took roughly 1.5 h to reach the Paraopeba River, thus taking more than twice the time calculated by Yu et al. [12,14].
Several papers state that numerical models should be preferred over empirical models to simulate mud- or tailings flows as they consider individual parameters for each investigation [12,15,16]. However, it must be noted that numerical models require additional case-specific information about the physical properties of the materials. Such site-specific information is usually not disclosed to the public and is not currently contained in the GTD database. Yu et al. [12] circumvented this problem by using the material density, viscosity and yield stress information from literature to model the TDF of Brumadinho. However, numerical models differ in complexity (e.g., 2D, 3D) and their application can be time and computationally intensive [12,14]. Even though the exact global number of TSFs is unknown and figures in the literature vary between 8500 and 105, it is clear that the number of existing TSFs is too high to apply numerical models in order to conduct risk assessments for each TSF [5,12]. Hence, the TSFs must be pre-evaluated and ranked based on their possible impact in case of a dam failure. Numerical models can then be applied more efficiently to elaborate on possible high-risk TSFs.
This paper suggests that the two-dimensional empirical Laharz tool, developed by the United States Geological Survey, can be applied to estimate the inundated area after TDFs and thus provides information to identify high-risk TSFs in a fast and cost-efficient way [17]. The use of the Laharz model for the simulation of TDFs was also presented by Innis and Kunz [18]. Being one of the most recent and severe TDF, the TDF of Brumadinho will be the case object in this paper. Changes have been applied to the model to allow the simulation of tailings flows in the ArcGIS Pro environment. Besides the two-dimensional simulation of the tailings flow, the model includes a basic risk assessment in which the simulation results are blended with population data from WorldPop and infrastructure data from OpenStreetMap (OSM). To validate the simulation results of the TDF in Brumadinho, they are tested against the tailings flow mapped by the OSM community. Besides the validation of the simulation results, the OSM-based results of the in-built risk assessment are checked for their informative value by analysing the historical development of the OSM data around the former TSF.
This paper focuses on the questions [i] whether the Laharz model can serve as a suitable basis for the modelling of tailings flows, [ii] if a GTD data structure orientated modelling approach can be efficiently automatised, and [iii] whether OSM and WorldPop Application Programming Interfaces (APIs) can deliver suitable information for a first risk assessment.
In the following, the methodology, the data used, and the functionality of the model itself are explained. Subsequently, the model’s results including spatial and numerical data are presented and discussed followed by a conclusion.

2. Materials and Methods

We divide this section into three subsections and first discuss the materials and methods used for modelling; thereafter we focus on those used for the risk analysis and finally describe the approach applied for validation. It should be noted, however, that the modelling and the risk assessment are combined in one tool.

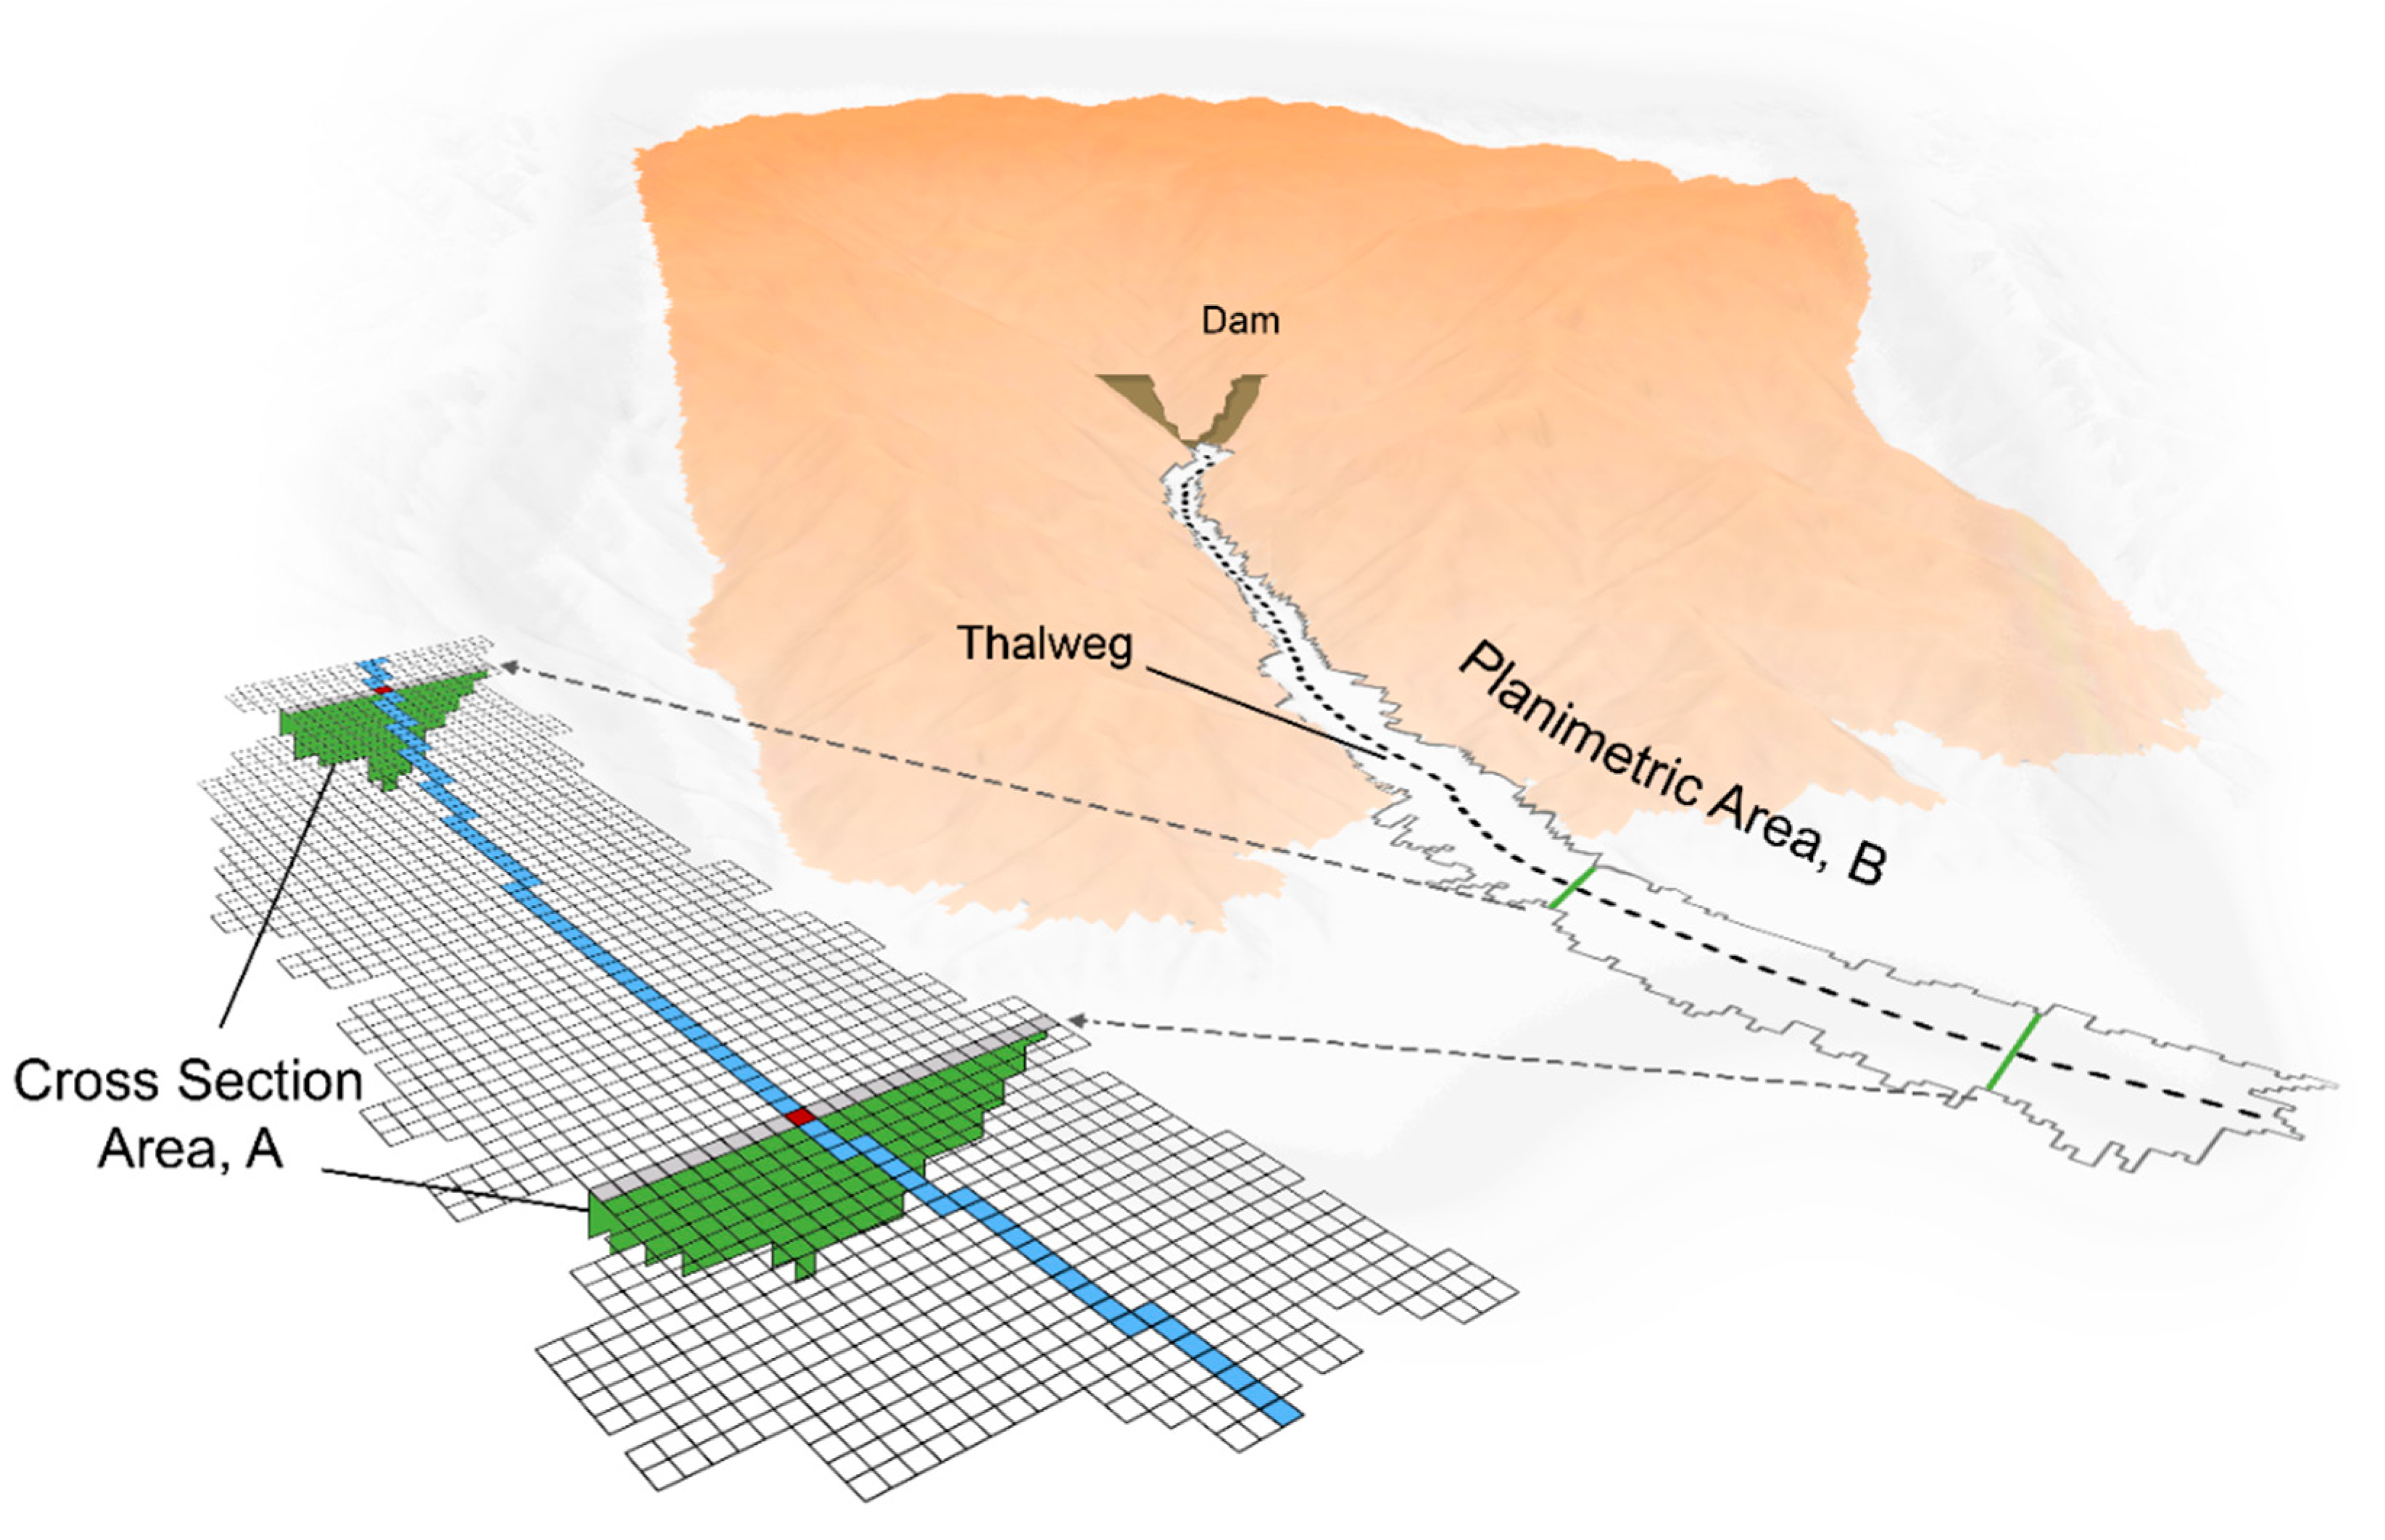
2.1. Modelling the Tailings Flow

The utilised Laharz model was originally developed to calculate the spatial extent of lahars, debris flows and rock avalanches in a geographic information system (GIS) environment. It estimates the spatial extent of the spill with the help of regressions to predict the cross-section and planimetric area under consideration of the released material volume [17]. As Laharz does not incorporate tailings flows, we took the tailings-specific planimetric area regression equation (B) from Ghahramani et al. [19] and added it to the model’s formulary. However, we kept the cross-section regression equation of lahars (A) as—to our knowledge—there is no tailings-specific research on the relationship between the cross-section and the released tailings volume. The following equations are used to estimate the spatial extent of the tailings flow:
A = 0.05 V2/3
B = 80 V2/3
where A is the cross-section area, B is the planimetric area and V is the released volume provided by the user [17,19]. On its thalweg, Laharz constantly calculates the cross-section area of the current grid cells starting with each profile’s lowest elevation value (based on the underlying DEM). Next, the cross-section is extended vertically along with the increasing DEM values until the cross-section area is greater or equal to the calculated A (volume-based cross-section) [17]. Even though A is constant throughout the simulation, its shape depends on the surface’s topography (derived from the DEM). Each grid cell used to calculate a cross-section occupies a particular area given by the DEM’s resolution and depicts a fraction of the planimetric area B (see Figure 1). The simulation stops when the current modelled area is greater or equal to B [17]. The Laharz model was embedded in an overarching script combined with several additional Python scripts which prepare and post-process data. Hence, the overall model became an automatised, scenario-based and transferable model guided by the data structure of the GTD. The GTD’s data on the TSFs (including coordinates and storage volumes) is therefore sufficient to provide the TSF-specific information for the model which allows for easy and fast portability as well as batch processing. However, the possible mobilised tailings volume [V] must be provided as a percentage of the TSFs total storage volume if the GTD is utilised as a data source.
The pre-processing of the data for the flow modelling is constituted of an API and additional Python scripts, which create and derive necessary data. The model takes TSF point features as an input and processes them one by one. Several requirements regarding their information content have to be fulfilled—which is the case with the GTD data. They need to be geocoded and hold the following information within their attribute table:
  • Feature identification or any identification number of the TSF
  • Name of the TSF or any string that identifies the TSF
  • Storage volume(s)
The latter is needed to provide information about the released tailings volume. The released volume of 9.7 million m3 for the TDF in Brumadinho is taken from Robertson et al. [7]. Several Python-based tools automatically gather all additional data. We accomplished the download of an appropriate DEM employing the OpenTopography API. The extent of a rectangular buffer around the TSF point feature is used to specify the Uniform Resource Locator (URL) for the API, which itself is operated by Python’s “requests” module. The API is programmed to download the DEM of the Shuttle Radar Topography Mission (SRTM) with a resolution of 1 arc-second—roughly 30 m at the Equator—if the TSF is located between 60° North and 56° South (coverage of SRTM data) otherwise the ALOS (Advanced Land Observing Satellite) World 3D dataset is downloaded, which also has a resolution of about 30 m [20,21]. Hui and Zhao [22] investigated the accuracy of both DEMs and outlined a better root-mean-mean-square error of the ALOS World 3D data regarding the horizontal and vertical accuracy. However, as ALOS World 3D is a photogrammetric product based on optical images, it might contain artefacts in cloudy areas [22]. As the automatised processing of the DEM within the Tailings Flow Model does not allow a visual validation or built-in check for artefacts, the SRTM DEM is preferred. The DEM gets reprojected into a coordinate system, which uses metres for its X-, Y- and Z-values (WGS 1984 Web Mercator auxiliary sphere for this case study) and serves as an input for the calculation of several hydrology raster datasets (sink filled DEM, flow direction, flow accumulation and streams). The delineation of those raster datasets is done by a Python script from Laharz, which we adapted to Python 3. The TSF’s storage volume and coordinates are obtained from the feature’s attribute table and saved as text files. Several volume fields can be provided by the user and multiplied by an individual constant (e.g., to estimate different percentages of storage volume run out). Hence, the model becomes not just automatised and transferable but also scenario oriented. Another Python script dedicates the coherent designation of file names. It extracts the name and a unique identification number from the TSF feature and uses them for the naming convention of all output products to ensure the results’ correct assignment to the corresponding TSF. All the data from pre-processing come together within the actual simulation model from Schilling [17] (adapted to Python 3), which we supplemented by the planimetric area formula proposed by Ghahramani et al. [19]. The resulting raster file contains nested information about all simulated mudflows (results based on different storage volumes combined in a single cascading grid) and needs to be vectorised into individual features by another Python script so the results can be used for further investigations (e.g., intersection with infrastructure). The resolution of the DEM determines the resolution of the result.

2.2. The Risk Assessment
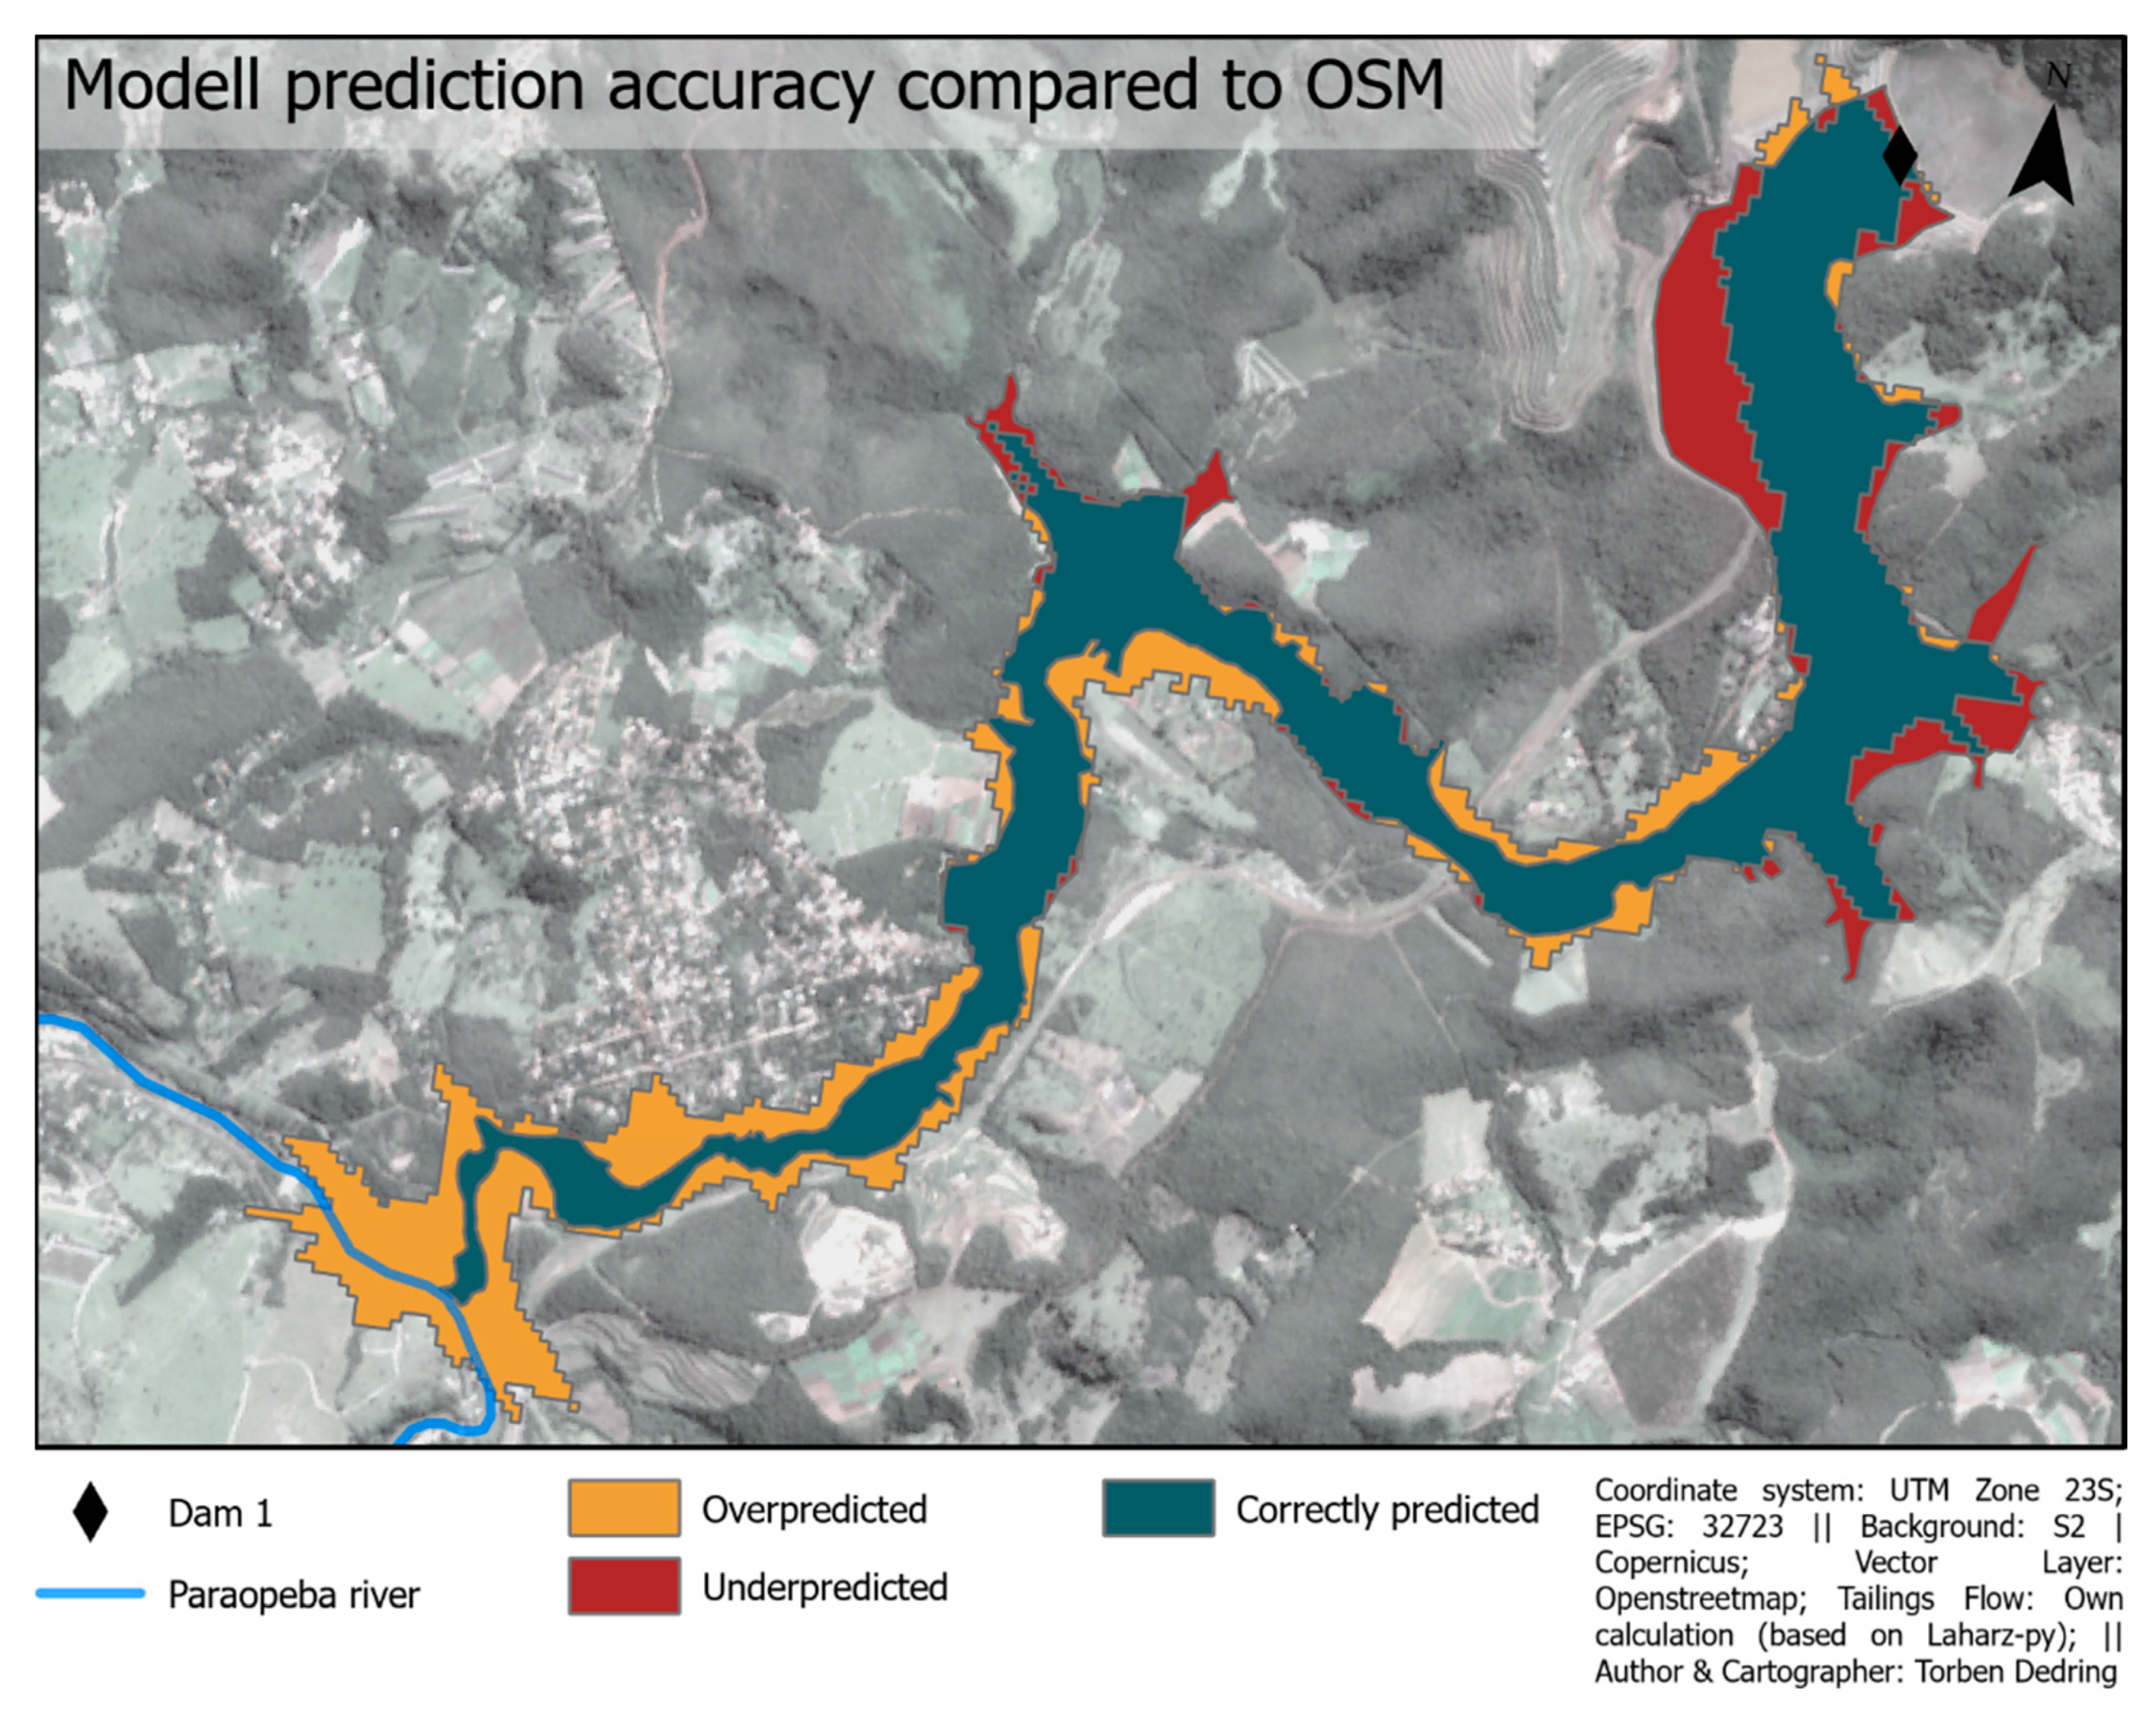
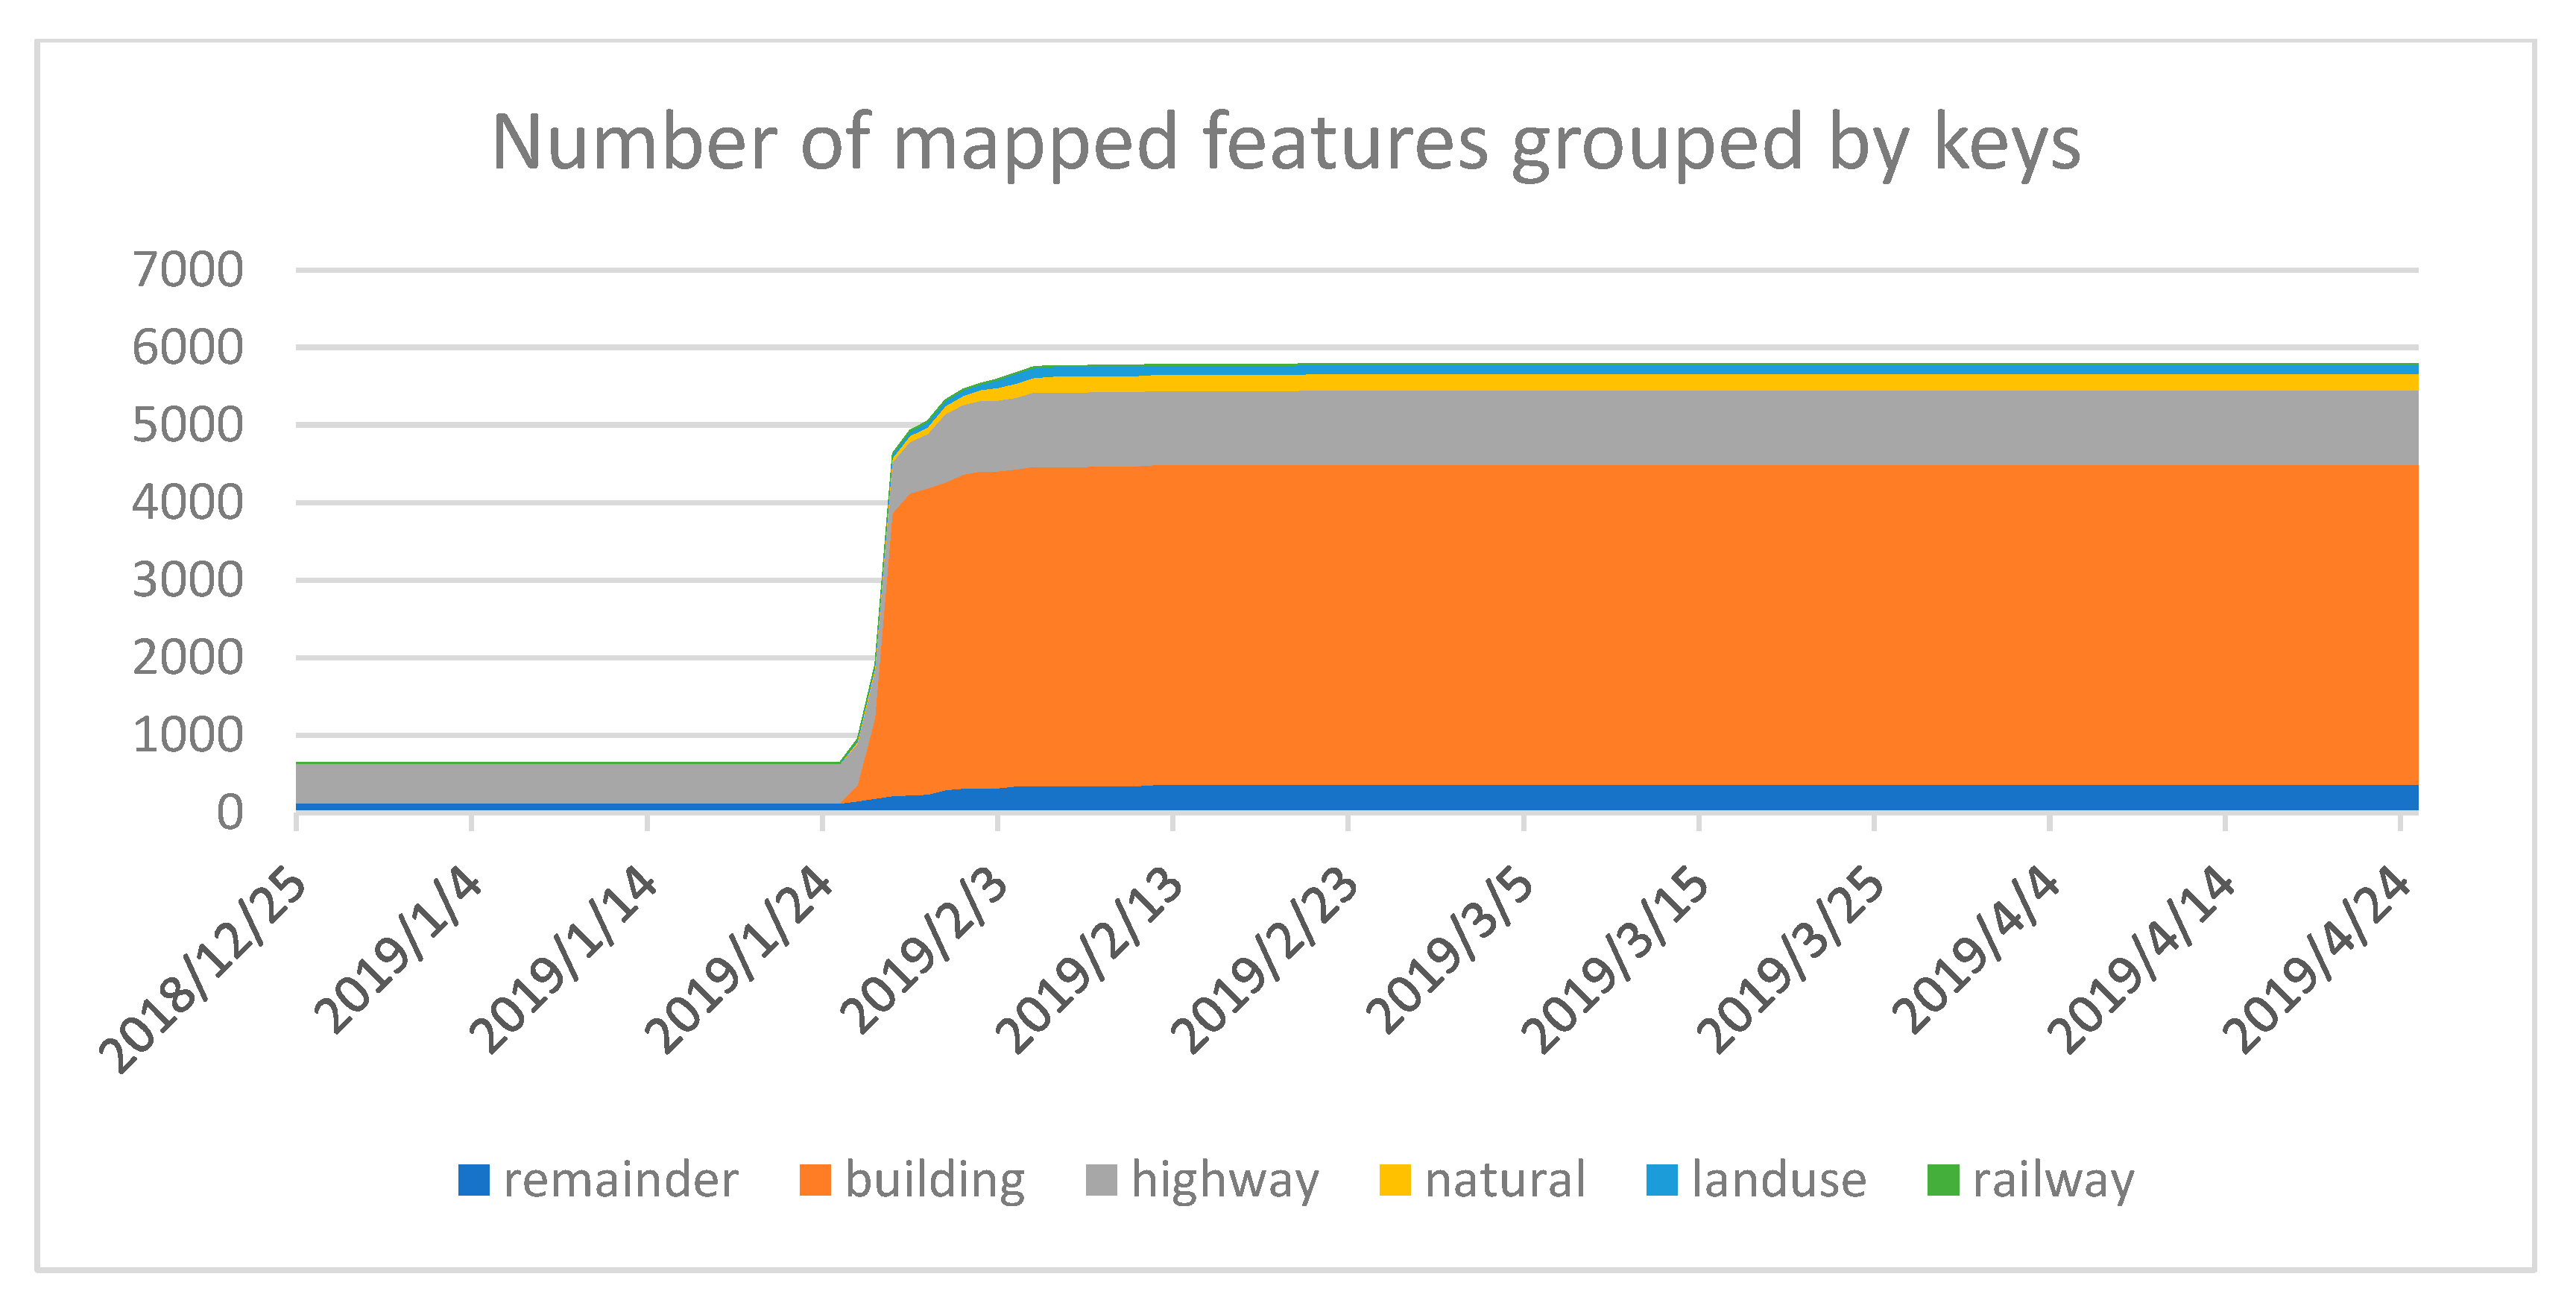
The post-processing of the model result is connected to a risk assessment. The assessment combines the spatial extent of the modelled tailings flows with population and infrastructure data using two additional APIs. Population data can either be received via the basic or advanced API of WorldPop. Both WorldPop APIs are implemented in a Python script for ArcGIS Pro, which allows the selection of a specific year (of population data) as well as the respective API. The basic API uses the alpha-3 code of the country where the TSF is located. The code is provided by a worldwide country shapefile, which the user has to supply if the basic API is selected. The adjusted URL is then used to download the population raster of the whole country using the “requests” module. This raster has a resolution of approximately 100 m and contains the total population count for each pixel. The population count within the tailings-flow-affected area is calculated using the “Zonal Statistics” tool of ArcGIS. Downloading and processing the population file of a whole country delivers accurate results but is time- and storage-intensive. Addressing the problem of a time- and storage-intensive download, the script scans the destination folder for existing files before it starts the download and, if applicable, uses them to save processing time. The advanced API avoids the download of raster files and is implemented for faster processing. This API requests the WorldPop server to compute the population within an abstracted geometry of the modelled flow. As the API only allows a limited number of coordinates, it is not possible to query the population count for the exact spatial coverage of the tailings flow. Thus, the population count is requested for the minimum bounding geometry of the tailings flow and adjusted by the percentage of the tailings flow area out of the area of the minimum bounding geometry. This approach is faster and does not require a file with alpha-3 country codes or additional storage space. However, the resulting population count is an estimation and less accurate as it assumes equal distribution of the population within the minimum bounding geometry.
Information about the local infrastructure and settlements is aggregated with the OSM API. To adjust the URL and request the OSM data for the spatial location of the tailings flow, we retrieve the flow’s extent from its properties, add them to the URL request and trigger the download of an OSM file with the help of the “requests” module in Python. An additional ArcGIS Pro license for the “Data Interoperability Toolbox” is required, as a direct import of OSM data is not supported by the software. The same Python script, which starts the download of OSM data, applies this toolbox to convert the OSM file into a Geodatabase and later extracts the features with the keys “highway”, “railway”, and “building” from it. The script then clips all features to the tailings flow’s extent, calculates the length for the line features (highways and railways) and counts the number of building polygons. Finally, the abstracted numerical information is added to the attribute table of the corresponding tailings flow shapefile. As highway objects include infrastructure features of different levels, they get filtered by “motorways”, “trunks”, “primary”, “secondary”, “tertiary” and “residential” roads. Thus, the risk assessment does not consider other categories. We combined all those scripts and tools into one model (as presented in Figure 2) to facilitate an automatised, scenario-based and transferable process for tailings flow simulations. The following sections refer to this model as the “Tailings Flow Model”.

2.3. Validation

To validate the spatial coverage of the modelled tailings flow, we used OSM data due to a lack of official and freely available reference data. However, other data sources are available. The German Aerospace Center published maps about the incident four days after the disaster [23]. We investigated their data and recognised minor but visible discrepancies regarding the spatial conformity with high-resolution images of Google Earth. As the data of OSM apparently delivered a higher accuracy, we decided to utilise it as the benchmark for the validation of the Tailings Flow Model. Therefore, the Tailings Flow Model result is intersected with the OSM reference dataset by combining the respective prioritised feature (modelled or OSM) with the total area of both datasets. The two shapefiles (Tailings Flow Model result and OSM reference data) were rasterised based on the resolution of the DEM which has also been used for modelling. These two rasters are binary grids, in which the value “1” in the respective raster represents no affectedness, and the value “2” stands for an affectedness of the pixel. The pixel values of the modelled raster dataset are converted into points and matched with the pixel values of the reference raster. Finally, the results of the validation are aggregated in a confusion matrix. Figure 3 illustrates the schematic workflow of the validation process. As the literature provides no information on tailings’ cross-section area, the formula of a lahar is primarily considered. However, we tested different constant values in the cross-section formula to analyse their effects on the validation results.
Given the fact that this model had been applied after the actual TDF occurred and therefore the OSM API requested data from the time after the event, the information content of the OSM data at the time before the TDF needs to be analysed to check for possible version differences. We utilised the Ohsome API by Heidelberg Institute For Geoinformation Technology [24] to plot the development of mapped OSM features within a five by five kilometre bounding box around the tailings flow and disaggregated them by their OSM key (building, highway, railway, natural, land use).

3. Results

The Tailings Flow Model is a ready-to-use toolbox and can be added to any ArcGIS Pro project. With a dynamic user interface, the model tool itself adapts to the user’s settings making the usage more straightforward. Furthermore, an option to provide external DEMs enables the user to run the model with a high-resolution DEM to improve the modelling. In the first part of this section, we will present the results of the spatial modelling of the TDF in Brumadinho followed by the results of the risk analysis.

3.1. Results of the Spatial Modelling

The results of the Tailings Flow Model come as an ESRI Shapefile. It includes the flow feature for every given tailings volume. In addition, information about the flow features’ underlying volume and all information from the risk assessment are stored in the file’s attribute table. The simulation calculated an inundated area of 3.64 million m2 (approximately 16% larger than the actual area [6]) reaching from the crest of Dam 1 roughly 9.3 km down to the Paraopeba River. Figure 4 shows the spatial distribution of the modelled tailings flow.
The model predicts the tailings flow based on planimetric and cross-section area formulas abstracted from empirical research [17,19]. Furthermore, a validation of the modelled tailings flow in comparison to OSM data was conducted. Figure 5 illustrates the validation, differentiating between correctly predicted pixels and over-, respectively, underpredicted cells.
The validation results of several model walkthroughs are based on a storage volume of 9.7 million m3 and a flow mobility coefficient of 80 for the planimetric area. However, we analysed different constants for the cross-section area formula. The following table (Table 1) summarises the validation results.
The hit rate represents the proportion of affected pixels in the OSM benchmark data replicated by the Tailings Flow Model, whereas the false alarm ratio tests the proportion of simulated tailings pixels that were not affected according to the benchmark data. The critical success index takes under- and overprediction into account and scales the model’s accuracy from 0 to 1—zero indicates no match between modelled and reference data and one a perfect match. The error bias represents the model’s tendency to over- or underprediction (underprediction: 0 ≤ E ≤ 1; overprediction: 1 < E ≤ ∞) [25]. The model scored a hit rate of 0.809, a false alarm ratio of 0.321, a critical success index of 0.585 and an error bias of 1.993 under a cross-section constant of 0.05. In general, the model delivered a hit rate of over 80% regardless of the underlying cross-section area constant. The comparatively high false alarm ratio and the error bias of >1 indicate that the model tends to overpredict. The spatial distribution of over- and underprediction can be seen in the map above (see Figure 5). While the model underpredicts the flooded area in the upper part of the flow, it overpredicts the inundation area in the lower part. Those erroneous predictions affect the model’s overall performance, represented by the critical success index of roughly 60 per cent. The validation was carried out based on the merged area of the modelled and the target flow (Figure 3) to circumvent the statistic distortion of an arbitrary selected assessment area. Since this leads to the absence of true negatives in the underlying confusion matrices, statistical parameters such as Cohen’s kappa cannot be calculated in a meaningful way.
Unlike the planimetric area of tailings, no research has been done regarding the relationship between the cross-section area and the tailings volume so far. Hence, the cross-section area formula for a lahar has primarily been used. However, different constants were experimentally tested in this regard in order to verify the validity of a lahar-based constant for this use case. The results indicate better performance with a constant between 0.06 and 0.07. The latter delivers a better hit rate, false alarm ratio and critical success ratio but is fraught with a higher error bias, which indicates an overprediction of the model. The case study of Brumadinho implies that a constant between 0.06 and 0.07 seems to be applicable for describing the relation between the released tailings volume and the cross-section area for this case. Further research on this topic is necessary to improve the Tailing Flow Model. The volume-based planimetric area formula slightly overpredicts the inundated area by 16% for this example. The Tailings Flow Model currently uses one or several user-given percentage value(s) to calculate the tailings runoff’s volume of the total storage volume. This calculation principle needs to be improved or replaced by more advanced equations during the model’s future development. More research on meaningful equations is necessary, as Kheirkhah Gildeh et al. [26] pointed out.

3.2. Results of the Risk Assessment

All results from the risk assessment are based on a simulation with an underlying tailings volume of 9.7 million m3, a flow mobility coefficient of 80 and a cross-section area constant of 0.05. The number of people who lived within the modelled tailings flow zone in 2019 was calculated using the WorldPop API. While the approach with the basic API (zonal statistics based on a population grid of the whole country) calculates a population count of 120.33 within the area of the modelled tailings flow, the approach with the advanced API puts the number of affected people at 172.71. Hence, the approach with the advanced API shows an overprediction of 43.53% for this case example.
Besides the sedentary population, the flow also affected buildings and infrastructure. The Tailings Flow Model extracts information about those geo-objects based on OSM data. For the case example of Brumadinho, the model calculated 1.02 km of affected primary, 1.77 km of tertiary and 1.91 km of residential roads. Furthermore, the modelled flow intersects with 117 buildings and 2.75 km of railway tracks. Robertson et al. [7] provide only a little information about the affected infrastructure but mention 100 m of destroyed railway in addition to the railway bridge. Atif et al. [27] reported 109 affected buildings in their analysis of the disaster, showing only minor discrepancies with the calculated number based on OSM. The benefit of OSM data lies in its free data availability and its large user community. Possible disadvantages in connection with the use of OSM data are discussed in the following chapter under consideration of the results gathered in the context of the Ohsome-based analysis.

4. Discussion

All in all, the Tailings Flow Model showed a satisfying performance. By utilising APIs, only spatially relevant tailored information is used for modelling, thus reducing the amount of data and avoiding a big data problem. Furthermore, the APIs ensure that the population and OSM data are up to date.

4.1. Discussion of the Spatial Modelling

The model itself tends to underestimate the upper part of the tailings flow and overestimates the lower part. This phenomenon could be caused by the underlying DEM or the assumption of the tailings’ steady physical properties throughout the flow. The origin of this problem is still to be determined and can be traced, for example, by using a high-resolution DEM. Yu et al. [12] experienced similar problems in their analysis in the upper part of their modelled flow and linked them to the railway network which had not been built at the time the DEM was generated, but its subsequent construction might have caused changes to the topography. Those unconsidered topography changes could lead to a narrower thalweg in the upper part of the model, which might entail the overestimation of the affected areas in the lower part due to the assumption of a fixed planimetric area. Further research on regression analyses is necessary to describe the relationship between the tailings volume and the cross-section area. This study of the tailings breach in Brumadinho showed that using a lahar-related cross-section area formula tends to cause a higher false alarm ratio. The experimentally tested changes in the cross-section area constant (c) only served to test the validity of a lahar-based formula. The results indicate the need for further empirical research in order to establish a universal tailings-specific cross-section formula. Another shortcoming of the proposed model is the determination of the released tailings volume which is currently done by a user-defined percentage of the total storage volume. A release estimation based on statistical regression, geometric estimation or flowability approximation methods, as discussed by Kheirkhah Gildeh et al. [26] is not implemented in the presented version of the model.
As mentioned before, other tailings breach models have already been applied for the incident in Brumadinho, but none of them provides numerical information about its accuracy, making it difficult to benchmark the Tailings Flow Model [12,14,27]. The power of this empirical model lies in its simplicity and highly aggregated information content coming from the build-in risk assessment. As the only necessary input is a point feature with information about the storage volume, it is easily transferable to other case studies assuming that the causes of the dam failure are comparable. Still, a DEM with a higher spatial resolution and better accuracy could significantly improve the results. A conversion of the Tailings Flow Model to QGIS might also be beneficial due to the need for several additional licenses in ArcGIS Pro. More complex tailings breach models, such as the model proposed by Yu et al. [12], apparently deliver better results (based on visual interpretation due to missing numerical accuracy data). Thus, a transition from the Tailings Flow Model to more complex models is reasonable if all their variables are known. As such information is often not disclosed and not included in the GTD, the Tailings Flow Model can provide a usable alternative to the too simplistic models and very complex models. While this study proved that the Tailings Flow Model is an automatised and scenario-based model, its transferability has been technically made possible but still needs to be confirmed by using other historical TDFs.

4.2. Discussion of the Risk Assessment

Regarding the risk assessment functionalities, the applied WorldPop dataset depicts people living in a particular area in a specific year and not the number of people located in the zone of the tailings flow during the disaster. Hence, these numbers can be seen as a proxy for possible affected people but not as an indicator of the number of threatened lives. Taking a closer look at the OSM data availability around the Córrego do Feijão iron ore mine in a temporal context, OSM contained only a few mapped features before the TDF as shown by the Ohsome-based analysis. The extraction and analysis of historical OSM data before and after the TDF in Brumadinho showed that mapping activity increased immediately after the TDF, as depicted in Figure 6.
The figure shows that highways were the most mapped feature in the research area before the TDF. However, this changed during the aftermath of the disaster, when the OSM community predominantly mapped buildings. Taking all OSM keys into account, the number of mapped features rose by 777% to 5054 features within the first five days after the TDF. The maximum of mapped features (5798) was reached on 21st February 2019 (within the bounds of the AOI and the observed period). Thus, the mapping activity increased rapidly within the first days and provided large amounts of data but stagnated within the following month. Similar contribution patterns have been observed during other hazards like earthquakes [28]. Considering that the modelling of the tailings flow is meant to be done before a TDF happens, it is obvious that OSM would have not been able to provide crucial information for the risk assessment. As the global distribution of OSM data is uneven, this problem may also exist for other and future studies. The quality and validity of the integrated risk assessment depend heavily on the contributions of the volunteered geographic information (VGI) community. Hence, OSM cannot guarantee its data integrity—as it is based on VGI—and thus might deliver incomplete information about the affected infrastructure. Therefore, additional functionalities that enable integrating other data sources for the risk assessment are to be implemented. Even though OSM data cannot replace official geospatial data, it inherits features that national data providers do not have—a standardised access point for global data.

5. Conclusions

This paper presents an empirical model to estimate tailings breach-related spill paths. The model is based on Laharz, a model developed by Schilling [17], which we extended by the tailings-specific planimetric area formula presented by Ghahramani et al. [19]. We tested the model on the tailings dam failure in Brumadinho where it reached a critical success index of roughly 60% and identified about 80% of the affected area compared to OSM data.
Considering this as an acceptable performance, we conclude that the Laharz model could have served as a basis to predict possible inundated areas in Brumadinho. However, the research question [i] can only be confirmed with a certain reservation, as a transfer to further research areas is required to accomplish a more general statement. Several Python scripts and APIs enable an automatised processing procedure, which is based on the information provided by the GTD [ii]. The integrated risk assessment, which considers the number of people in the calculated hazardous zone (based on WorldPop data) as well as infrastructural information (coming from OSM), can provide information about the possible impact on a course scale. However, especially the OSM data might not depict the real situation on-site, as the data tends to be incomplete in secluded areas as shown in the case study of Brumadinho [iii].
Even though this empirical approach comes with several drawbacks, such as the negligence of individual rheological properties, an unknown tailings-specific cross-section area and the generalisation of released tailings volumes to a user-given percentage, it can close the gap between very simplified one-dimensional channel routing models and computational strenuous numerical models. An automatised modelling tool is needed to efficiently pre-evaluate the large amount of TSFs concerning their risk to residents, employees and infrastructure. Risk-aware planning based on such a model could have saved several lives in Brumadinho if buildings were placed outside hazardous zones. For future work, more empirical research is needed to refine the planimetric area formula and an empirically based tailings-specific cross-section formula needs to be established. Furthermore, the model has to be tested on other TDFs—for example, on the TDF of the Mount Polley mine in Canada—to prove general applicability.

Author Contributions

Conceptualization, T.D. and K.T.; methodology, T.D.; software, T.D.; validation, T.D.; formal analysis, T.D.; investigation, T.D.; resources, T.D.; data curation, T.D.; writing—original draft preparation, T.D.; writing—review and editing, T.D., V.G., A.R., K.T.; visualization, T.D.; supervision, A.R. and V.G.; project administration, T.D. All authors have read and agreed to the published version of the manuscript.

Funding

This research received no external funding.

Institutional Review Board Statement

Not applicable.

Informed Consent Statement

Not applicable.

Data Availability Statement

The data presented in this study are available on request from the corresponding author.

Acknowledgments

We acknowledge support by the DFG Open Access Publication Funds of the Ruhr-Universität Bochum. This study was conducted at the Institute of Geography, Ruhr University Bochum, Germany. The geodata used in this study were obtained from OpenTopography, WorldPop and OpenStreetMap. Thanks to Valerie Graw and Andreas Rienow for supervising this project and proofreading the article, to Debhasish Bhakta (GRID, Norway), who was always available in case of technical problems and Kristina Thygesen for helping during conceptualization.

Conflicts of Interest

The authors declare no conflict of interest.

References

  1. Krausmann, F.; Lauk, C.; Haas, W.; Wiedenhofer, D. From resource extraction to outflows of wastes and emissions: The socioeconomic metabolism of the global economy, 1900–2015. Glob. Environ. Chang. 2018, 52, 131–140. [Google Scholar] [CrossRef] [PubMed]
  2. Kossoff, D.; Dubbin, W.E.; Alfredsson, M.; Edwards, S.J.; Macklin, M.G.; Hudson-Edwards, K.A. Mine tailings dams: Characteristics, failure, environmental impacts, and remediation. Appl. Geochem. 2014, 51, 229–245. [Google Scholar] [CrossRef] [Green Version]
  3. Mahmood, A.A.; Elektorowicz, M. A Review of Sustainable Management of Mine Tailings. Appl. Mech. Mater. 2015, 773–774, 1256–1260. [Google Scholar] [CrossRef] [Green Version]
  4. Owen, J.R.; Kemp, D.; Lèbre, É.; Svobodova, K.; Pérez Murillo, G. Catastrophic tailings dam failures and disaster risk disclosure. Int. J. Disaster Risk Reduct. 2020, 42, 101361. [Google Scholar] [CrossRef]
  5. Franks, D.M.; Stringer, M.; Baker, E.; Valenta, R.; Torres-Cruz, L.A.; Thygesen, K.; Matthews, A.; Howchin, J.; Barrie, S. Lessons from Tailings Facility Data Disclosures. In Towards Zero Harm: A Compendium of Paper Prepared for the Global Tailings Review; Oberle, B., Brereton, D., Mihaylova, A., Eds.; Global Tailings Review: London, UK, 2020; pp. 84–108. [Google Scholar]
  6. Rotta, L.; Alcântara, E.; Park, E.; Negri, R.G.; Lin, Y.N.; Bernardo, N.; Mendes, T.; Souza Filho, C.R. The 2019 Brumadinho tailings dam collapse: Possible cause and impacts of the worst human and environmental disaster in Brazil. Int. J. Appl. Earth Obs. Geoinf. 2020, 90, 102119. [Google Scholar] [CrossRef]
  7. Robertson, P.K.; Melo, L.; Williams, D.J.; Wilson, G.W. Report of the Expert Panel on the Technical Causes of the Failure of Feijão Dam I. 2019. Available online: http://www.b1technicalinvestigation.com/ (accessed on 29 December 2020).
  8. Vergilio, C.; Lacerda, D.; Oliveira, B.; Sartori, E.; Campos, G.M.; Pereira, A.; Aguiar, D.B.; Da Souza, T.S.; Almeida, M.G.; Thompson, F.; et al. Metal concentrations and biological effects from one of the largest mining disasters in the world (Brumadinho, Minas Gerais, Brazil). Sci. Rep. 2020, 10, 5936. [Google Scholar] [CrossRef]
  9. Innis, S.; Kunz, N.C. The role of institutional mining investors in driving responsible tailings management. Extr. Ind. Soc. 2020, 7, 1377–1384. [Google Scholar] [CrossRef]
  10. GRID. Global Tailings Portal. Available online: https://tailing.grida.no/ (accessed on 29 October 2020).
  11. Gama, F.F.; Mura, J.C.; Paradella, W.R.; Oliveira, C.O. Deformations Prior to the Brumadinho Dam Collapse Revealed by Sentinel-1 InSAR Data Using SBAS and PSI Techniques. Remote Sens. 2020, 12, 3664. [Google Scholar] [CrossRef]
  12. Yu, D.; Tang, L.; Chen, C. Three-dimensional numerical simulation of mud flow from a tailing dam failure across complex terrain. Nat. Hazards Earth Syst. Sci. 2020, 20, 727–741. [Google Scholar] [CrossRef] [Green Version]
  13. Han, Z.; Su, B.; Li, Y.; Wang, W.; Wang, W.; Huang, J.; Chen, G. Numerical simulation of debris-flow behavior based on the SPH method incorporating the Herschel-Bulkley-Papanastasiou rheology model. Eng. Geol. 2019, 255, 26–36. [Google Scholar] [CrossRef]
  14. Lumbroso, D.; Davison, M.; Body, R.; Petkovšek, G. Modelling the Brumadinho tailings dam failure, the subsequent loss of life and how it could have been reduced. Nat. Hazards Earth Syst. Sci. 2021, 21, 21–37. [Google Scholar] [CrossRef]
  15. Crosta, G.B.; Imposimato, S.; Roddeman, D.G. Numerical modelling of large landslides stability and runout. Nat. Hazards Earth Syst. Sci. 2003, 3, 523–538. [Google Scholar] [CrossRef]
  16. Peruzzetto, M.; Mangeney, A.; Grandjean, G.; Levy, C.; Thiery, Y.; Rohmer, J.; Lucas, A. Operational Estimation of Landslide Runout: Comparison of Empirical and Numerical Methods. Geosciences 2020, 10, 424. [Google Scholar] [CrossRef]
  17. Schilling, S.P. Laharz_py: GIS Tools for Automated Mapping of Lahar Inundation Hazard Zones; Open-File Report 2014-1073; U.S. Geological Survey: Reston, VA, USA, 2014. Available online: http://pubs.er.usgs.gov/publication/ofr20141073 (accessed on 13 December 2020).
  18. Innis, S.; Kunz, N. Assessing Consequences of Potential Tailings Dam Failures on Canadian Communities. In Proceedings of the American Geophysical Union Fall Meeting, Online, 1–17 December 2020. [Google Scholar]
  19. Ghahramani, N.; Mitchell, A.; Rana, N.M.; McDougall, S.; Evans, S.G.; Take, W.A. Tailings-flow runout analysis: Examining the applicability of a semi-physical area–volume relationship using a novel database. Nat. Hazards Earth Syst. Sci. 2020, 20, 3425–3438. [Google Scholar] [CrossRef]
  20. Santillan, J.R.; Makinano-Santillan, M. Vertical Accuracy Assessment of 30-m Resolution ALOS, ASTER, and SRTM Global DEMS Over Northeastern Mindanao, Philippines. Int. Arch. Photogramm. Remote Sens. Spat. Inf. Sci. 2016, XLI-B4, 149–156. [Google Scholar] [CrossRef] [Green Version]
  21. Cowan, D.; Cooper, G. The Shuttle Radar Topography Mission—A New Source of Near-Global Digital Elevation Data. Explor. Geophys. 2005, 36, 334–340. [Google Scholar] [CrossRef]
  22. Li, H.; Zhao, J. Evaluation of the Newly Released Worldwide AW3D30 DEM Over Typical Landforms of China Using Two Global DEMs and ICESat/GLAS Data. IEEE J. Sel. Top. Appl. Earth Obs. Remote Sens. 2018, 11, 4430–4440. [Google Scholar] [CrossRef]
  23. DLR; ZKI. Dammbruch in Brasilianischen Eisenerzbergwerk. Available online: https://activations.zki.dlr.de/de/activations/items/ACT141.html (accessed on 8 February 2021).
  24. Heidelberg Institute For Geoinformation Technology. Ohsome—Eine Plattform zur Analyse der vollständigen Historie von OpenStreetMap. Available online: https://heigit.org/de/big-spatial-data-analytics/ohsome-3/ (accessed on 6 May 2021).
  25. Wing, O.; Bates, P.D.; Sampson, C.C.; Smith, A.M.; Johnson, K.A.; Erickson, T.A. Validation of a 30 m resolution flood hazard model of the conterminous United States. Water Resour. Res. 2017, 53, 7968–7986. [Google Scholar] [CrossRef]
  26. Kheirkhah Gildeh, H.; Halliday, A.; Arenas, A.; Zhang, H. Tailings Dam Breach Analysis: A Review of Methods, Practices, and Uncertainties. Mine Water Environ. 2020, 40, 1–23. [Google Scholar] [CrossRef]
  27. Atif, I.; Cawood, F.T.; Mahboob, M.A. Modelling and analysis of the Brumadinho tailings disaster using advanced geospatial analytics. J. S. Afr. Inst. Min. Metall. 2020, 120, 405–414. [Google Scholar] [CrossRef]
  28. Ahmouda, A.; Hochmair, H.H.; Cvetojevic, S. Analyzing the effect of earthquakes on OpenStreetMap contribution patterns and tweeting activities. Geo-Spat. Inf. Sci. 2018, 21, 195–212. [Google Scholar] [CrossRef] [Green Version]
Figure 1. Schematic illustration of the cross-section area A and planimetric area B for the grid-wise modelling of a tailings flow.
Sustainability 14 06681 g001
Figure 2. Schematic workflow of the Tailings Flow Model [17].
Sustainability 14 06681 g002
Figure 3. Main processing steps for the validation of the modelled tailings flow.
Sustainability 14 06681 g003
Figure 4. Modelling results of the TDF in Brumadinho, including the effected buildings and infrastructure.
Sustainability 14 06681 g004
Figure 5. Mapping of validation results considering the spatial distribution of over- and underprediction.
Sustainability 14 06681 g005
Figure 6. Development of the mapped OSM features within the research area before and after the TDF.
Sustainability 14 06681 g006
Table 1. Validation results of the Tailings Flow Model.
Validation Results Based on Model Walkthroughs with:
A = cV^(2/3) and B = 80 V^(2/3), with
c = 0.05c = 0.06c = 0.07c = 0.08
Hit rate0.8090.8240.8340.821
False alarm ratio0.3210.3070.3010.315
Critical Success Index0.5850.6040.6140.596
Error bias1.9932.0722.1582.111
where A is the cross-section area, B is the planimetric area, V is the volume with 9.7 million m3.
Publisher’s Note: MDPI stays neutral with regard to jurisdictional claims in published maps and institutional affiliations.

