Communication

The Relationship between Hydrological Connectivity Changes Inside and Outside Biodiversity Hotspots and Its Implication for Sustainable Environmental Management

1
Key Laboratory of Heilongjiang Province for Cold-Regions Wetlands Ecology and Environment Research, Harbin University, Harbin 150086, China
2
National and Local Joint Laboratory of Wetland and Ecological Conservation, Institute of Natural Resources and Ecology, Heilongjiang Academy of Sciences, Harbin 150040, China
*
Authors to whom correspondence should be addressed.
These authors contributed equally to this work.
Sustainability 2022, 14(11), 6654; https://doi.org/10.3390/su14116654
Submission received: 19 April 2022 / Revised: 19 May 2022 / Accepted: 24 May 2022 / Published: 29 May 2022
(This article belongs to the Special Issue Frontiers in Wetland Ecology and Environmental Sustainability)

Abstract

:
The conservation management of biodiversity hotspots is of vital significance for biological conservation. For wetlands, which are a special type of ecosystems that are based on water as their main medium, a decline in external hydrological connectivity often leads to wetland degradation inside biodiversity hotspots. In this context, the relationship between hydrological connectivity changes inside and outside hotspots is worth exploring. Based on the wetland biodiversity hotspots identified using systematic conservation planning, this study selected eight representative biodiversity hotspots with concentrated area. Integral index of connectivity, probability of connectivity (representing structural connectivity), and morphological spatial pattern analysis (representing functional connectivity) were used to analyze the hydrological connectivity changes inside various hotspots for 1995–2015. By taking the catchment area involved as the minimum basin perimeter, this study calculated the external hydrological connectivity changes of various hotspots during this period and analyzed the relationship between hydrological connectivity changes inside and outside of hotspots. The internal and external hydrological connectivity of wetland biodiversity hotspots were found to be significantly correlated. Moreover, the internal hydrological connectivity of hotspots not only declined with declining external structural connectivity, but also changed with the proportion of core wetlands, the proportion of edge wetlands, and the proportion of branch corridors. In addition, hotspots located at intersections of high-grade rivers were more significantly affected by climate change than by human activities and their hydrological connectivity increased with increasing rainfall. The internal hydrological connectivity of hotspots near low-grade rivers presented a declining trend, mainly because of human activities. This study clarified the relationship between internal and external hydrological connectivity of wetland biodiversity hotspots. Targeted internal and external control strategies are proposed, with the aim to offer references for the conservation of wetland biodiversity.

1. Introduction

Wetlands are essential ecosystems for the maintenance of biodiversity. With the acceleration of agricultural reclamation and urbanization, a series of ecological problems related to wetlands (such as a sharp drop in area, serious fragmentation, biodiversity loss, and service function degradation) have emerged. These pose considerable threats to regional ecological security, grain security, and sustainable socioeconomic development [1,2,3]. Efforts have been made by many studies to identify biodiversity hotspots and construct priority conservation networks, expecting to conserve remaining wetland ecosystems. However, the fragmentation of wetland ecosystems caused by improper land use not only reduces regional integral landscape connectivity, but also induces gradual wetland degradation inside conservation areas and biodiversity hotspots because of changes in hydrological regimes. In this sense, the conservation management of wetland biodiversity should not only focus on the internal hydrological connectivity of hotspots, but also consider the relationship between hydrological connectivity changes inside and outside hotspots. Thus, the areas outside hotspots can be properly controlled and the decline in external hydrological connectivity causing internal wetland degradation can be prevented.
Hydrological connectivity refers to the transport of materials, energy, and organisms mediated by water within or between hydrological cycle elements [4]. Wetland ecosystem management in a certain range is an important application to understand hydrological connectivity, which has been interpreted and measured by researchers [5]. Structurally, hydrological connectivity of wetland can be defined as the connectivity of wetland patches and the habitat accessibility of wetland species [6]. Functionally, different landscape types have different ecological meanings in terms of hydrological connectivity. For example, the core wetland is a large habitat patch, which plays the role of ecological source in the wetland connectivity function. The edge wetland refers to the transition zone between the core wetland and non-water area, which often has the characteristics of rich material and energy exchange. Bridges, branches, and loops play a similar role as ecological corridors [7]. Currently, large-scale, high-intensity land use changes have already reduced hydrological structural connectivity in many wetland biodiversity hotspots or conservation areas [8]. This has resulted in declined wetland hydrological connectivity and a degradation of wetland ecological functions [9]. In particular, the decline in hydrological connectivity weakens the biodiversity maintenance function of wetlands, a function that is of great concern [10,11]. The declining wetland landscape connectivity also changes hydrological quality [12,13] and further deepens the trend of gradual wetland degradation of conservation areas and biodiversity hotspots. Existing studies have shown that surface hydrological connectivity has potential ecological effects, such as maintaining biodiversity and ecological integrity, providing ecological diffusion channels, offering nutrients through biological-geographical-chemical processes, and transporting substance and energy downstream [14,15,16,17,18]. Hydrological connectivity and pattern changes caused by climate change and human interferences also exert significant effects on avian diversity in wetlands [19,20]. Thus, it is necessary to adopt hydrological connectivity as an important index for wetland conservation and monitoring. In any region, water has its own source and path, and interfering with the path water in a region takes may affect the hydrological state of the entire region. In this sense, the relationship between the internal and external hydrological connectivity of wetland biodiversity hotspots or conservation areas should become the center of focus. This enables targeted control strategies both inside and outside hotspots with the goal to better maintain wetland hydrological connectivity and guarantee normal ecological functions.
The quantification of hydrological connectivity constitutes the basis for evaluating the hydrological patterns of wetland biodiversity hotspots. To that end, many methods are available, including in situ monitoring, hydrological models, connectivity functions, graph theory, and remote sensing [21,22,23,24]. Two indexes that have combined graph theory and habitat availability, i.e., integral index of connectivity (IIC) and probability of connectivity index (PC), can express both the structural quantification of connectivity and the quantification of habitat functions. They are ideal indexes for quantifying connectivity related to species habitats on regional scales. However, morphological spatial pattern analysis (MSPA) classifies the foreground pixels of raster binary images into seven mutex types, namely, core, islet, edge, perforation, bridge, loop, and branch. Based on the definitions and characteristics of different landscape classes, it is possible to judge their significance as wetland connectivity indexes [7,25], thus giving a satisfactory description of connectivity in terms of wetland functions. Structurally and functionally, both types of connectivity offer sound quantitative indexes for the measurement of wetland hydrological connectivity, enabling convenient description and analysis of the internal and external hydrological connectivity of wetland biodiversity hotspots.
Starting with the management of wetland biodiversity hotspots, this study analyzed the trends of hydrological connectivity changes in biodiversity hotspots, identified the effect of external hydrological connectivity on internal connectivity, and proposed targeted control strategies. By identifying the multi-year changing trend of the internal hydrological connectivity of multiple wetland biodiversity hotspots on the mesoscale, hydrological connectivity changes of biodiversity hotspots with different spatial characteristics were examined. Moreover, the relationship between hydrological connectivity changes inside and outside of wetland biodiversity hotspots (the minimum basin) were clarified. Based on this, targeted conservation and management strategies were proposed for areas both inside and outside wetland biodiversity hotspots.

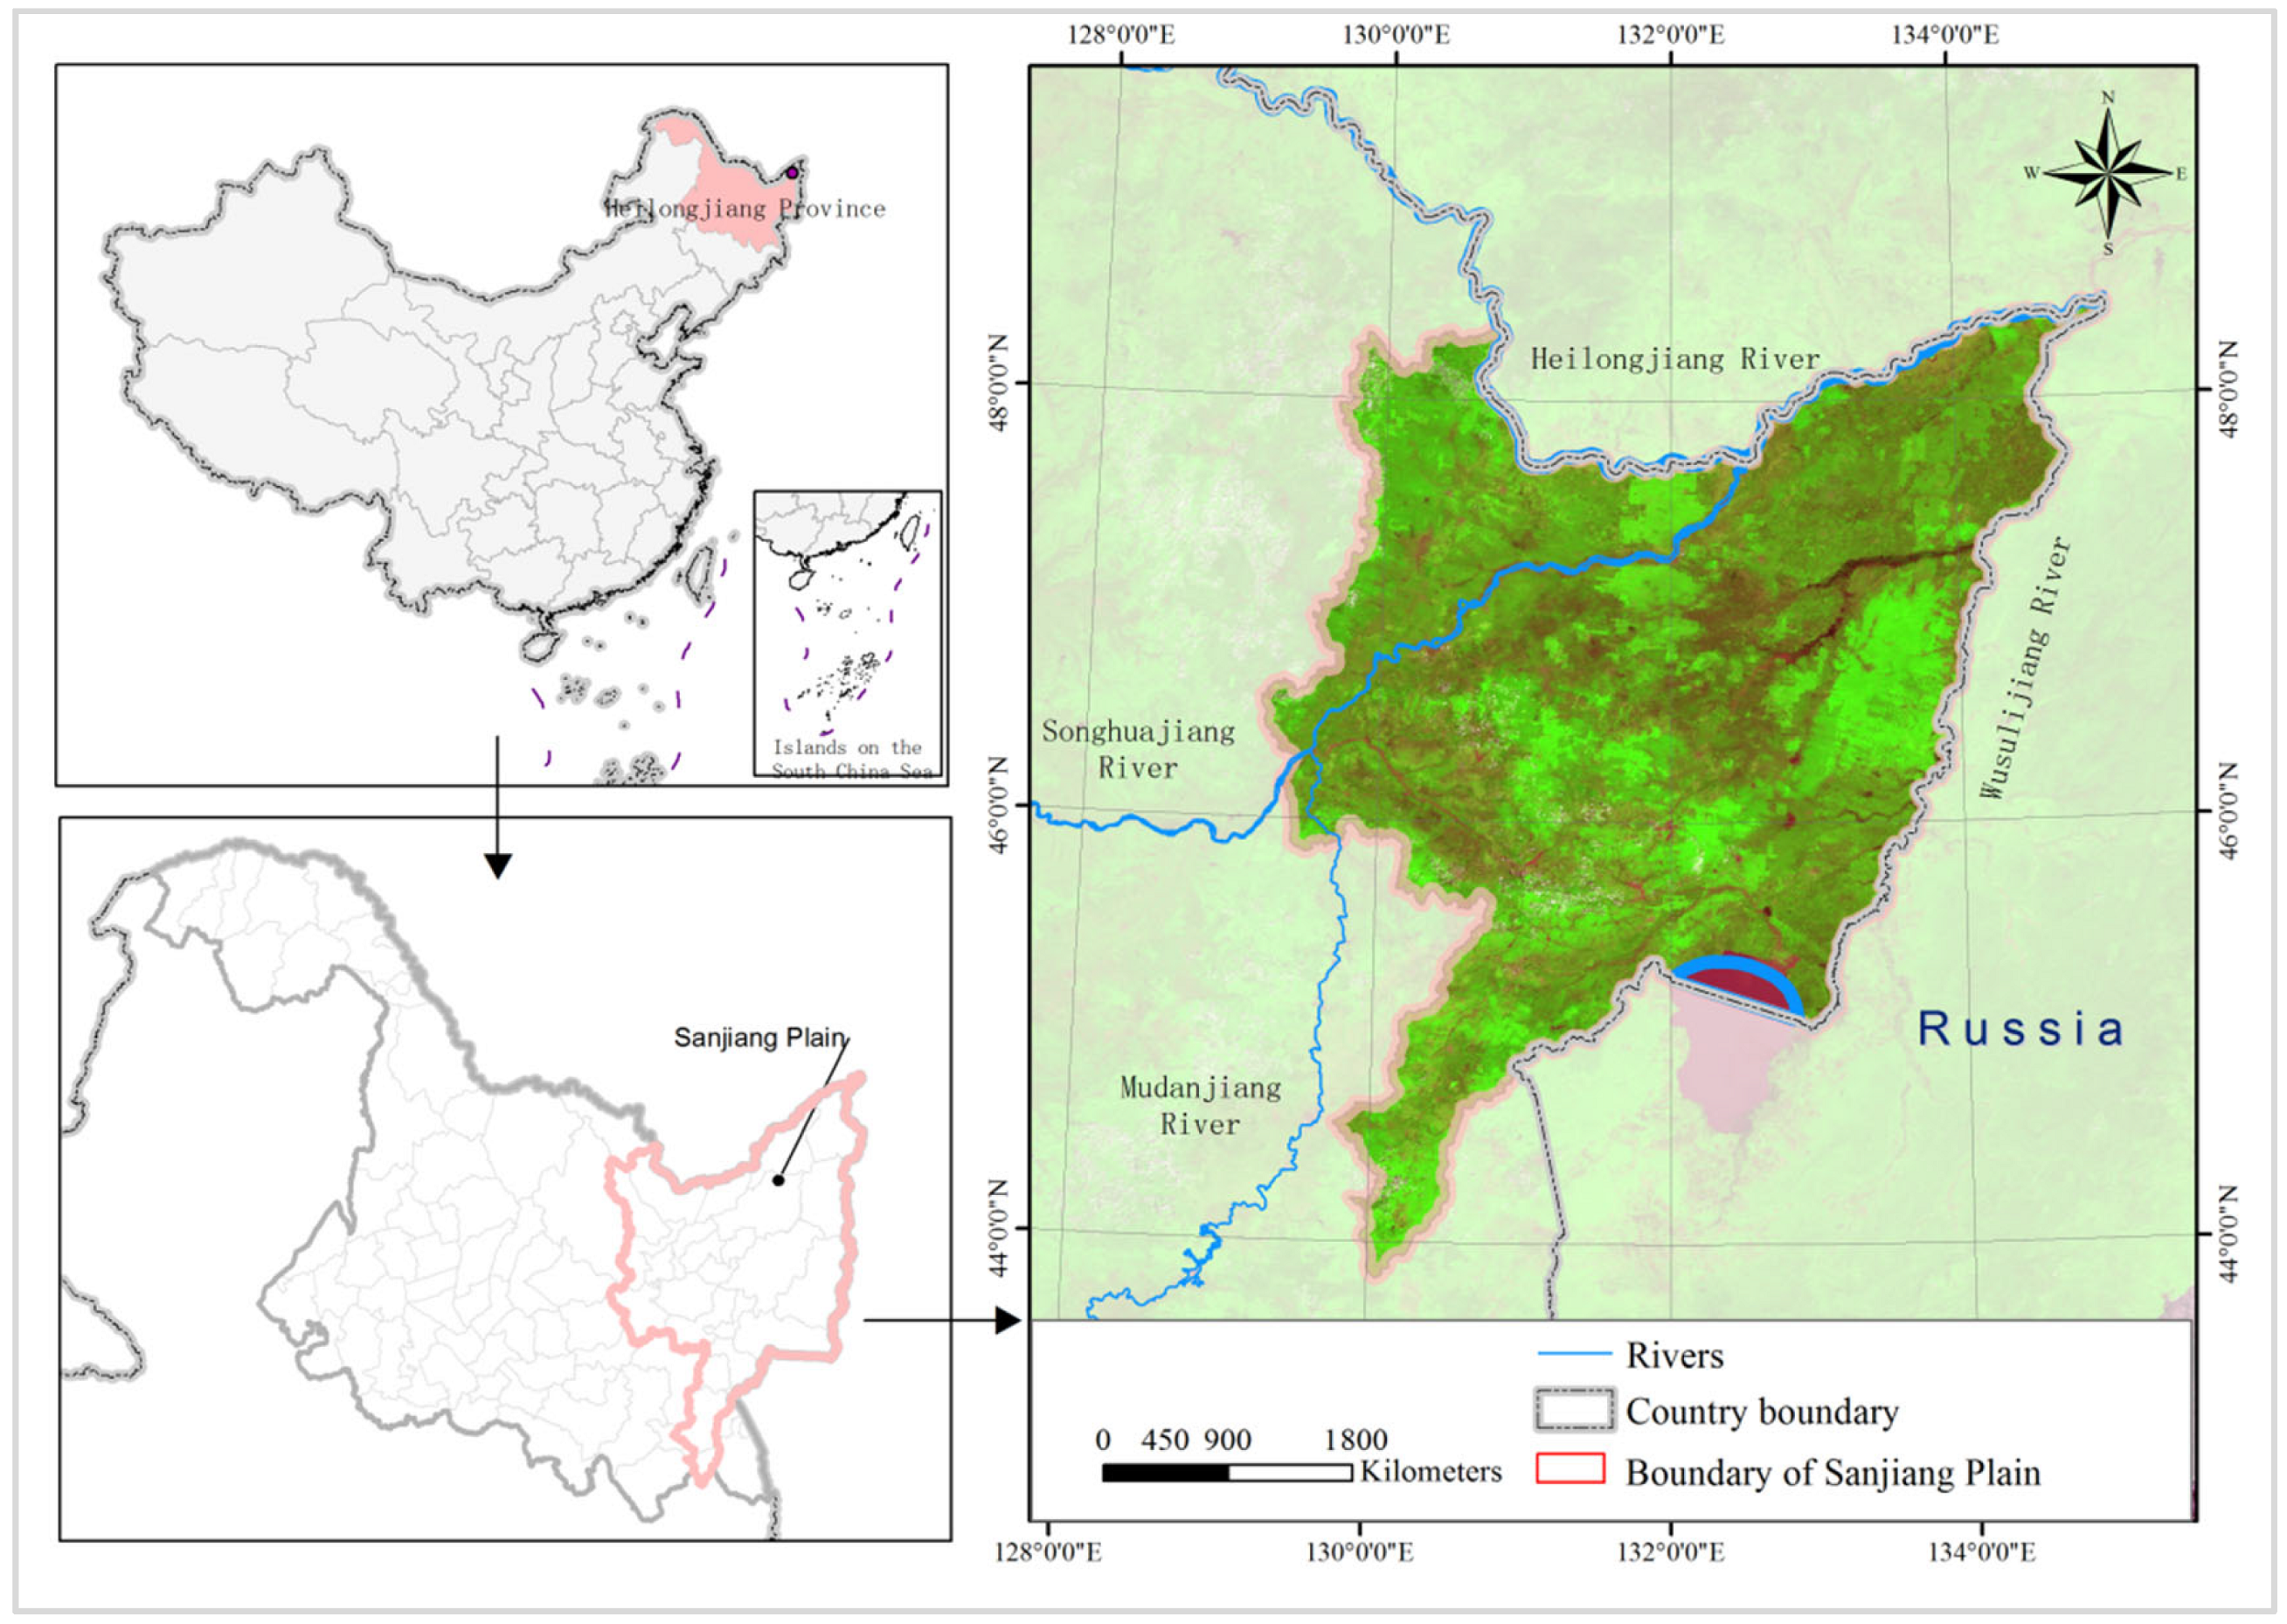
2. Overview of the Study Area

Sanjiang Plain, located in the east of Heilongjiang Province, is the largest freshwater swamp distribution area in China. Its geographical coordinates are 43°49′55″–48°27′40″ N and 129°11′20″–135°05′26″ E (Figure 1). Sanjiang Plain is rich in wetland biodiversity resources. It is the biodiversity hotspot designated by the Ministry of Environmental Protection of China and is known as the “unique gene bank of wildlife”. However, after more than half a century of development, Sanjiang Plain has also become the largest commercial grain base in China. Excessive agricultural reclamation and the destruction of the natural environment have led to many ecological and environmental problems.

3. Research Methods

In this study, we selected eight hotspots identified by systematic conservation planning (SCP) in the Sanjiang Plain wetlands in 1995. The normalized difference water index (NDWI) was used in combination to interpret remote sensing images and extract the distribution scope of wetlands inside and outside of hotspots. Connectivity indexes (IIC and PC) and MSPA models were employed to analyze the changing trend of the internal hydrological connectivity of hotspots for 1995–2015. The catchment area was taken as the minimum basin to calculate the external hydrological connectivity of hotspots, explore the effects of external structural and functional hydrological connectivity on the internal hydrological connectivity of hotspots, and clarify the relationship between hydrological connectivity changes inside and outside of hotspots.

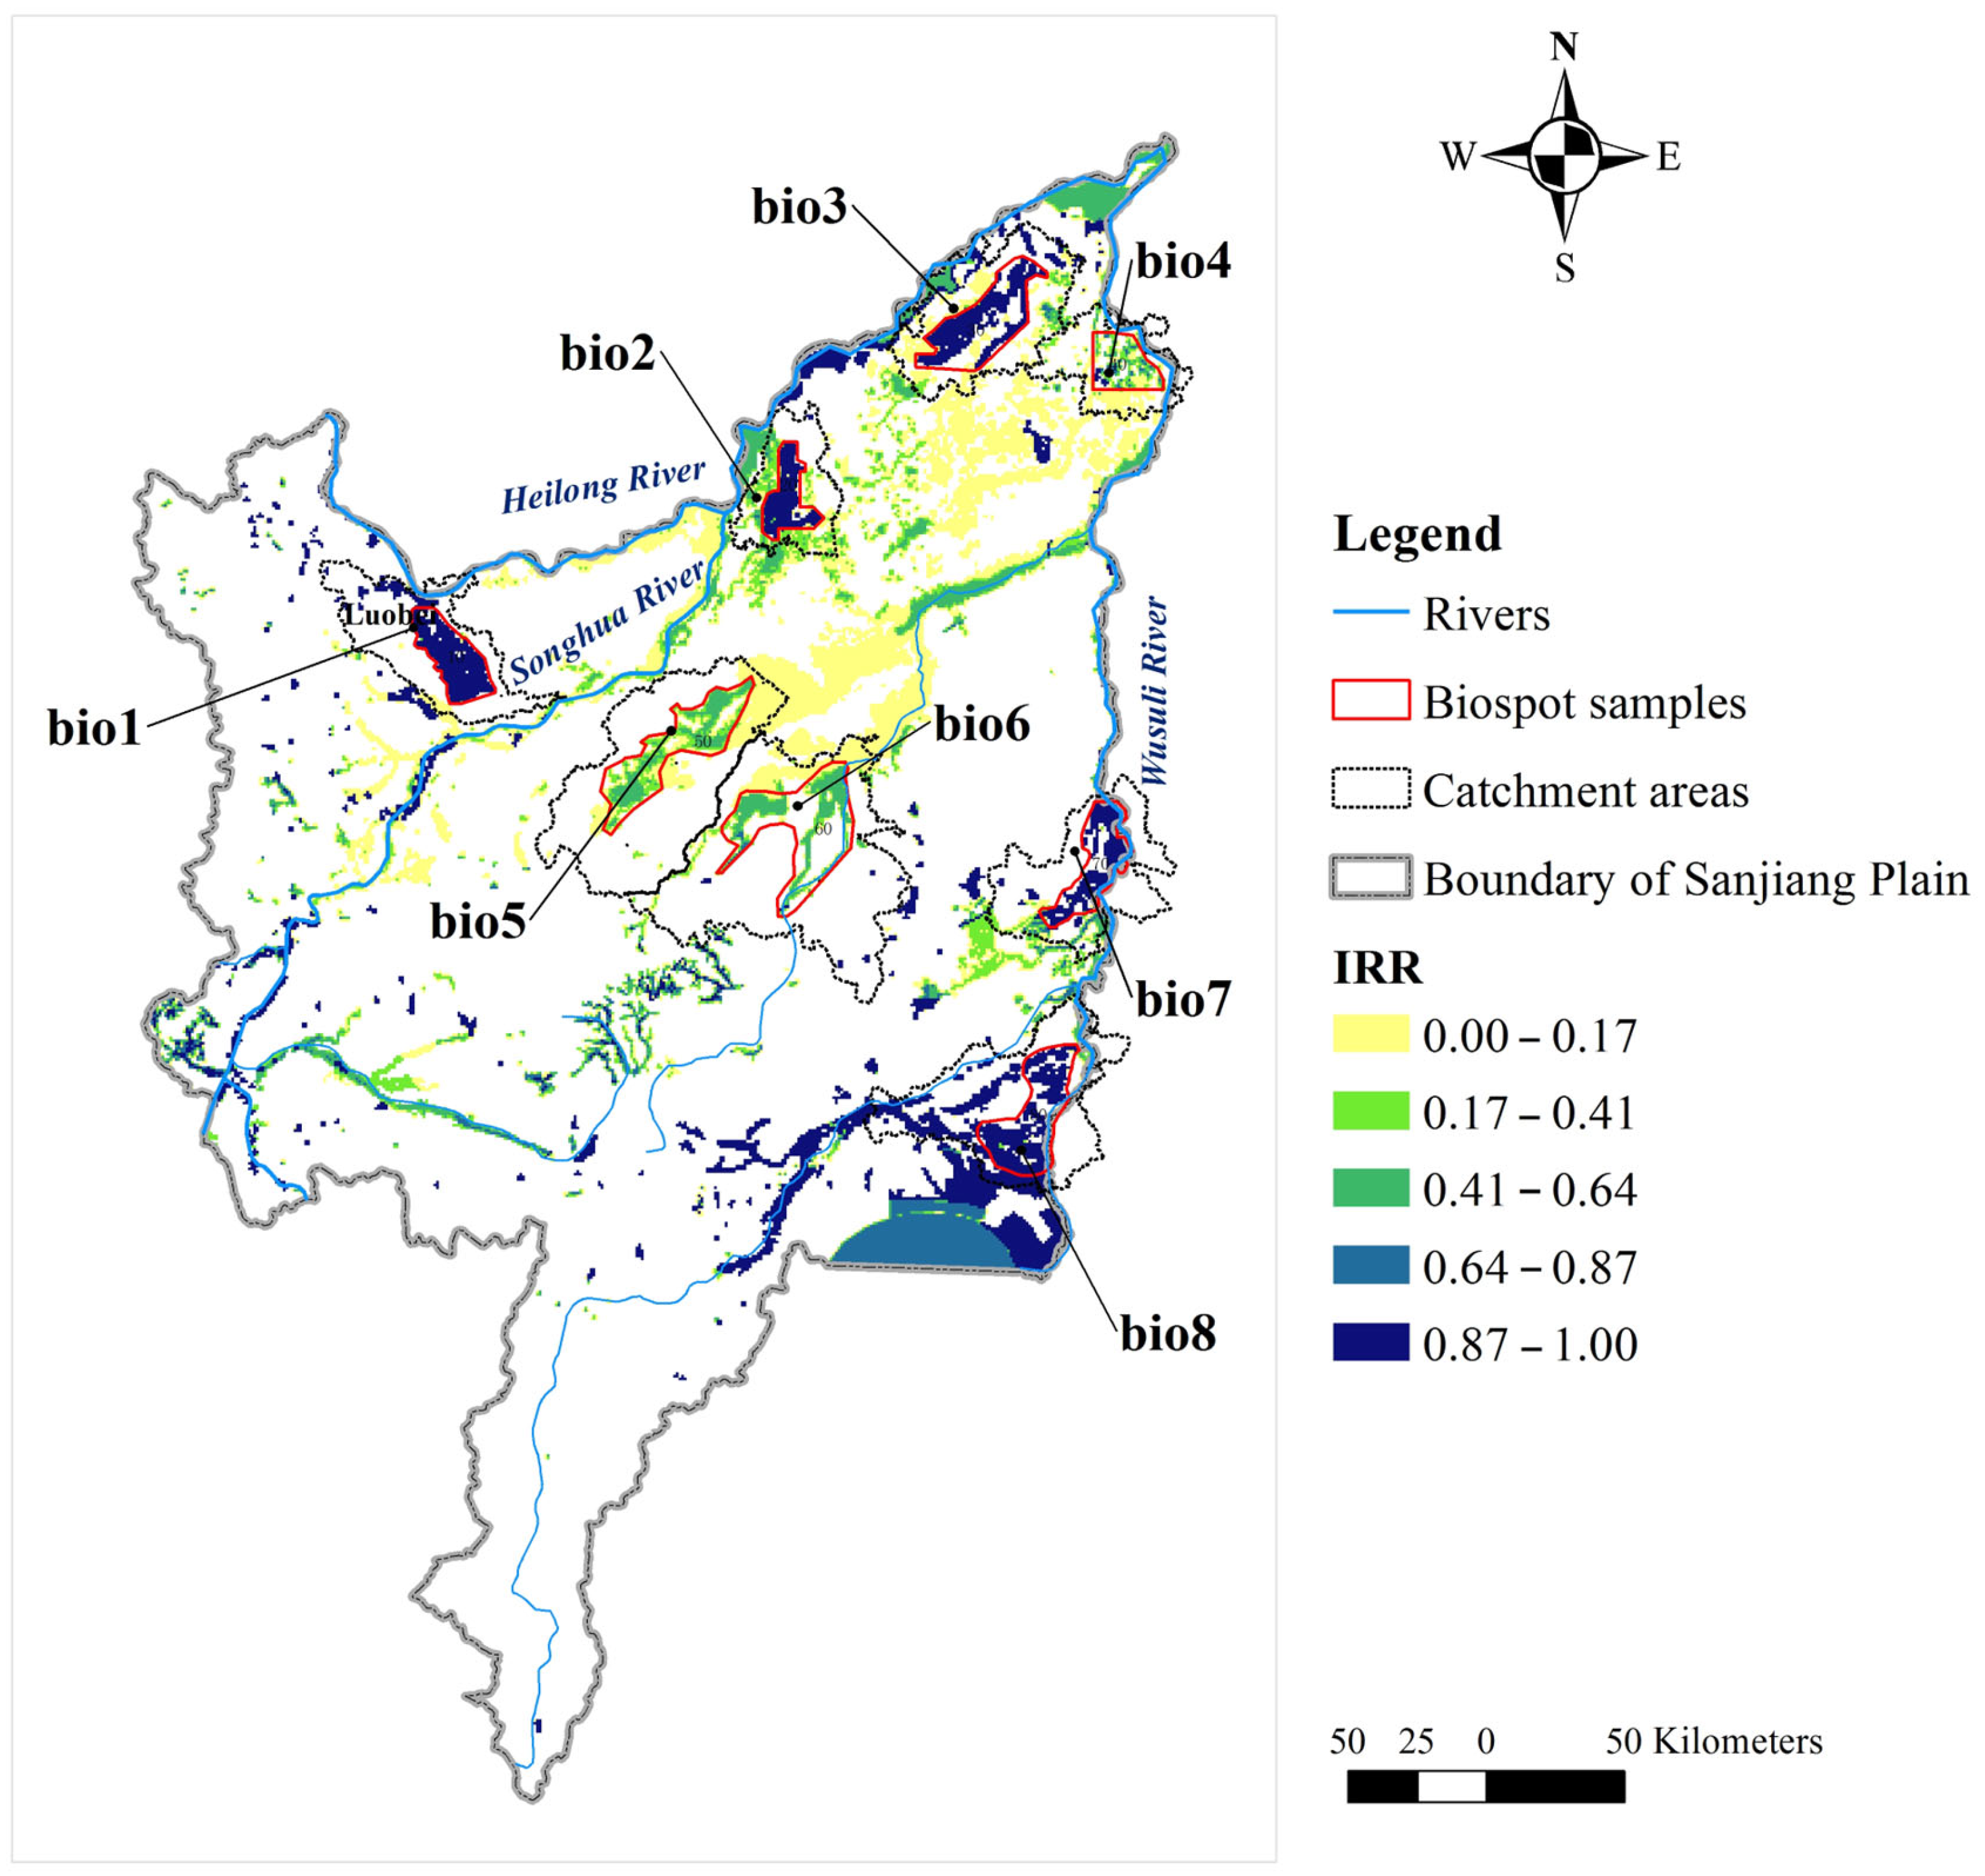
3.1. Identification of Biodiversity Hotspots

We used our previous results of biodiversity hotspots as the study objects (Qu et al., 2019). These biodiversity hotspots were identified using SCP, a method widely adopted for biodiversity conservation [26,27]. This method consists of three steps: selection and spatial distribution prediction of representative biodiversity features, setting the conservation target of representative features, and determining biodiversity conservation values through calculating irreplaceability (IRR). First, a total of 93 representative biodiversity features were selected from the study area, including 78 representative species, 9 key ecosystems, and 6 key ecological processes. China Red Data Book of Endangered Animals, China Species Red List, and other literature about corresponding species [28,29,30,31] were referenced for the spatial description of species habitat preferences, ecosystems, and ecological processes. Then, the potential spatial distribution of each representative biodiversity feature was simulated (or extracted) based on wetland vegetation type distribution data, soil data, and digital elevation model (DEM). The conservation target of each representative biodiversity feature (difined as the percentage to be conserved in the potential spatial distribution) was set by exponential interpolation. Features with distribution areas larger than 10,000 km2 were assigned a target of 15% based on the requirement of the Convention on Biological Diversity and features with distribution areas smaller than 7.8 km2, the minimum variable area for a key species in the region to avoid habitat deficiency, were assigned a target of 100%. The other intermediate-range restoration features were assigned targets exponentially interpolated between the above two thresholds [32]. To make the targets practical, they were revised by a local expert based on his experince on endangerment category, conservation priority, and habitat rarity. Finally, rasters 1 km × 1 km in size were adopted as planning units, and C-Plan conservation planning software was employed to calculate the IRR of each planning unit using SCP. Thus, the importance of each planning unit for realizing the overall conservation target could be expressed. SCP values are continuous values within a range of 0–1. Larger SCP values mean that the planning unit concerned has a higher conservation value, and that the number of other planning units that can replace this planning unit for accomplishing the conservation target is smaller [33,34]. To analyze the hydrological connectivity changes of biodiversity hotspots in different locations, biodiversity hotspots with concentrated area and different spatial characteristics from the study area were selected. These were used as sampling sites for analyzing the internal/external hydrological connectivity changes of hotspots and their influencing factors.

3.2. Relationship between Hydrological Connectivity and Pattern Changes Inside and Outside of Biodiversity Hotspots

3.2.1. Extraction of Wetland Distribution Based on NDWI

Wetlands inside and outside of biodiversity hotspots were identified by remote sensing interpretation. Landsat5 TM data were used to provide remote sensing images. With the experiences of experts, the geometric shapes, color characteristics, texture characteristics, and spatial distribution of ground features were analysed to build the interpretation standards. Water content distribution was simulated using NDWI for wetland distribution verification. NDWI was calculated according to green and near-infrared (NIR) bands combining with field survey data on water content. Finally, raster data on land use were acquired through interpretation, and the quality of data products was assessed through combining field survey with repeated interpretation of randomly selected dynamic map spots.

3.2.2. Changing Trends of Hydrological Connectivity Inside Biodiversity Hotspots

Wetland structural connectivity was evaluated using IIC and PC, and wetland functional connectivity was evaluated using the MSPA indexes. IIC and PC are connectivity indexes created based on habitat availability (Pascual-Hortal and Saura 2006; Saura and Pascual-Hortal 2007a, Saura and Pascual-Hortal 2007b). They were used to represent the IIC and PC between various nodes of the study area within a certain threshold range. To ensure comparability between the calculation results of IIC and PC, the probability of connectivity was set to 0.5 (Saura and Pascual-Hortal 2007b). IIC and PC indexes were calculated using Conefor26 software according to the following formula:
IIC = i = 1 n j = 1 n a i × a j 1 + nl ij A L 2     PC = i = 1 n j = 1 n p ij × a i × a j A L 2
where n denotes the total number of core wetland patches in the study area; ai and aj denote the areas of core wetland patches i and j, respectively; nlij denotes the number of connections between core wetland patches i and j; AL denotes the total area of core wetland patches in the study area; p*ij denotes the maximum product of all path probabilities between core wetland patches i and j. IIC and PC values have the same range of 0–1, where a larger value means better connectivity.
In the MSPA model, there are seven indexes for representing functional connectivity of wetlands: core, edge, branch, bridge, loop, islet, and perforation [7,25]. Core wetlands are large habitat patches in foreground wetlands, which play the role of ecological sources in terms of wetland connectivity functions. Shrinkage and fragmentation of core wetlands often lead to a decline in connectivity. Edge wetlands are transition zones between core wetlands and non-water areas, which are often characterized by frequent rich substance and energy exchange. Branches, bridges, and loops all play corridor-like roles in terms of wetland connectivity functions. Specifically, a bridge is the channel connecting two different core patches. A branch is the connection between a core wetland and another wetland type, and a channel for species diffusion and energy exchange between a core patch and its peripheral hydrological landscape. A loop is the shortcut for connection inside core wetlands that contributes to their internal connectivity. In general, branch, bridge, and loop wetlands can be ranked in descending order of their contribution to hydrological connectivity as follows: bridge wetlands > branch wetlands > loop wetlands. Islet wetlands are interconnected small patches that often exist in the form of separate small puddles or ponds in the wetland landscape. The possibility of substance and energy exchange between islet wetlands and the outside world is low. Perforation wetlands are the edge zones of core wetlands, which, to a certain extent, obstruct the internal connectivity of core wetlands.

3.2.3. Relationship between Hydrological Connectivity and Pattern Changes Inside and Outside of Biodiversity Hotspots

Analysis was performed to explore how the internal hydrological connectivity of wetland biodiversity hotspots was related to their external structural connectivity (IIC and PC) and functional connectivity (MSPA indexes). The connectivity indexes of eight biodiversity hotspots in 1995, 2000, 2005, 2010, and 2015 were calculated, including internal connectivity indexes (IIC, PC, CORE, ISLET, PERFORATION, EDGE, LOOP, BRIDGE, and BRANCH) and external connectivity indexes (IICe, PCe, COREe, ISLETe, PERFORATIONe, EDGEe, LOOPe, BRIDGeE, and BRANCHe).
Correlation coefficients between internal structural hydrological connectivity (IIC and PC) and external connectivity indexes (IICe, PCe, COREe, ISLETe, PERFORATIONe, EDGEe, LOOPe, BRIDGeE, and BRANCHe) were calculated. Thus, the relationships between internal structural connectivity and external structural connectivity and functional connectivity were determined. Furthermore, correlation coefficients between internal functional hydrological connectivity (CORE, ISLET, PERFORATION, EDGE, LOOP, BRIDGE, and BRANCH) and external connectivity indexes (IICe, PCe, COREe, ISLETe, PERFORATIONe, EDGEe, LOOPe, BRIDGeE, and BRANCHe) were calculated. Thus, the relationships between internal functional connectivity and external structural connectivity and functional connectivity were determined. IIC and PC were calculated using Conefor26 [35,36,37]. CORE, ISLET, PERFORATION, EDGE, LOOP, BRIDGE, and BRANCH were calculated using GuidosToolbox2.9 [25]. Correlation between indexes was analyzed in R [38]. Analysis was intended to identify whether the decline in the external hydrological connectivity of a biodiversity hotspot would affect its internal hydrological connectivity and further compromise its ecological functions.

4. Results

4.1. Identification of Biodiversity Hotspots

To analyze the internal hydrological connectivity changes of biodiversity hotspots in the study area, this study used the spatial pattern of biodiversity conservation values in 1995 as basis for identifying biodiversity hotspots. The spatial pattern of the biodiversity conservation values (IRR) of the Sanjiang Plain wetlands in 1995 was calculated using SCP, as shown in Figure 2. IRR values have a range of 0–1, where a larger IRR value means a higher biodiversity conservation value and vice versa. Biodiversity hotspots with concentrated area and different spatial characteristics were selected from the study area as sampling sites for analyzing the internal hydrological connectivity changes of hotspots and their influencing factors. Eight sampling sites were selected: two located at the intersection between a first-grade river and a second-grade river (bio3 and bio4), two distributed along a first-grade river at different distances from the source (bio1 and bio2), two distributed along a second-grade river at different distances from the source (bio7 and bio8), and two located at the end of a third or lower-grade river (bio5 and bio6). The external area of each sampling site was the catchment area involved, which served as the distribution scope of the basin where the hotspot is located.

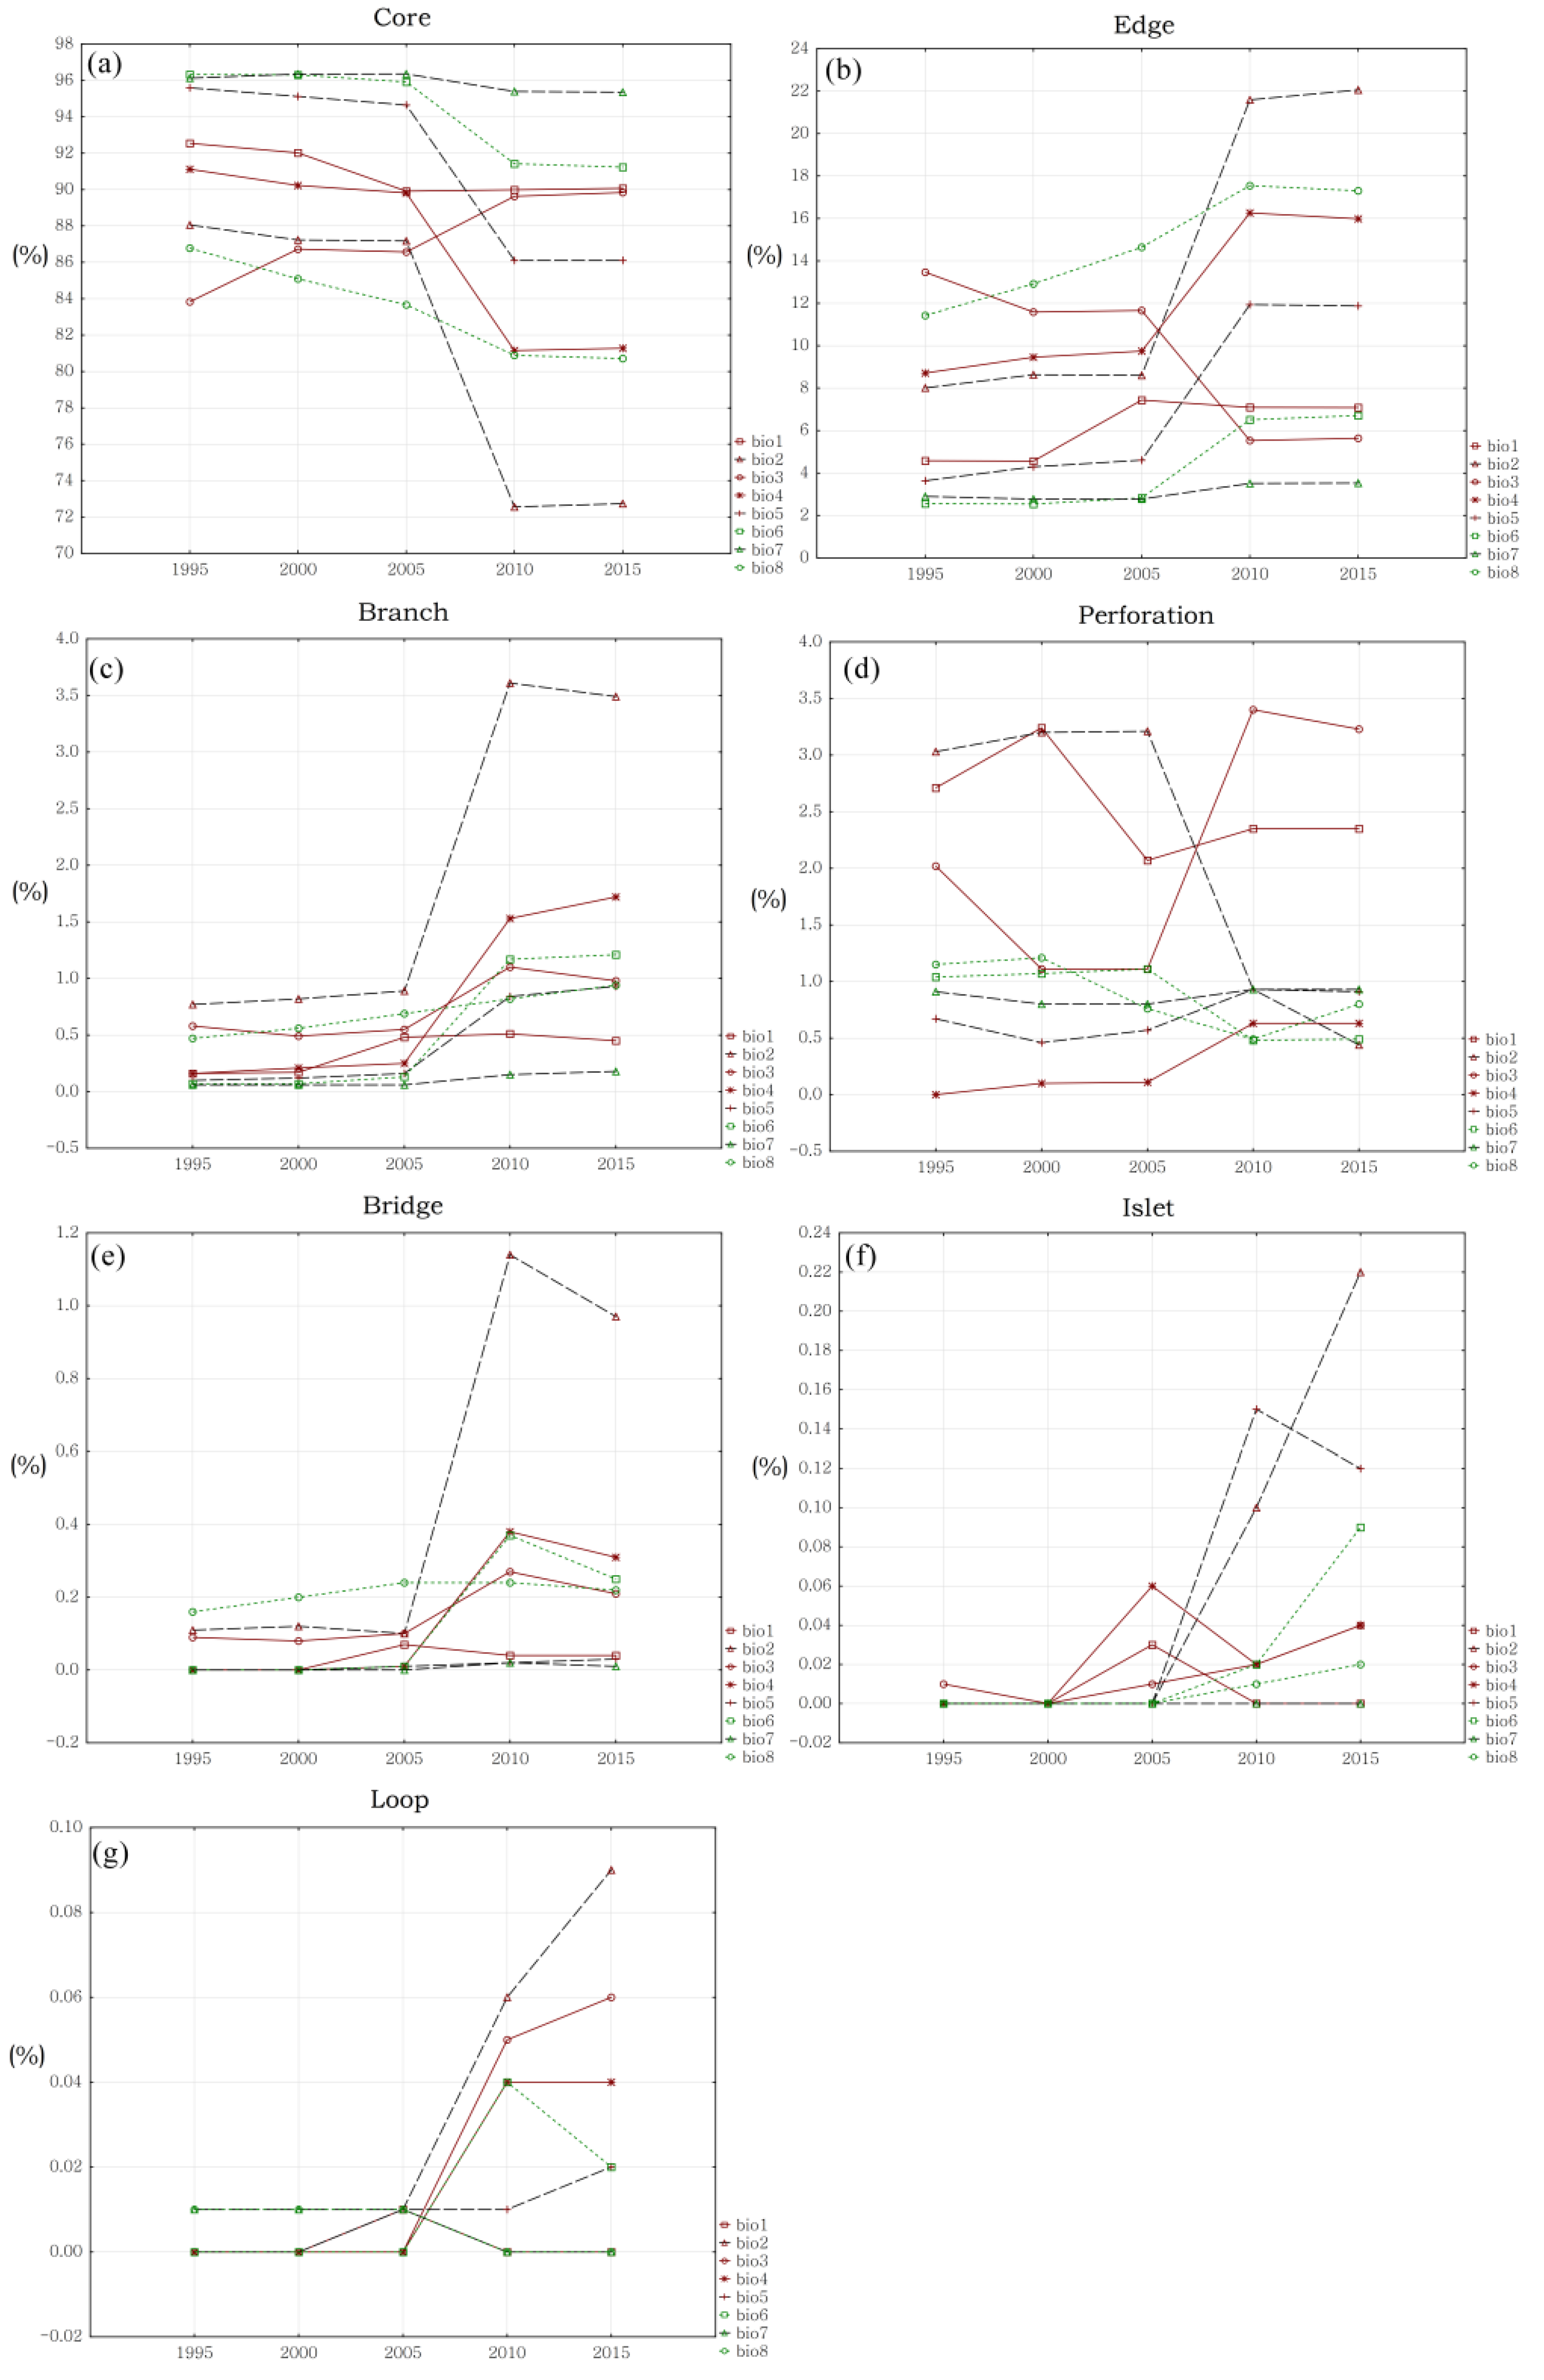
4.2. Changing Trends of Hydrological Connectivity Inside Biodiversity Hotspots

The distance threshold is the critical value for the distance between two patches with connection within the selected scope. If the distance between two patches exceeds the distance threshold, they are unconnected. If the distance threshold is greater, the connectivity indexes calculated will also be greater. IIC and PC express the structural connectivity of the wetland distribution. Studies have shown that in 1995–2015, the wetlands in the major biodiversity hotspots of the Sanjiang Plain had an IIC of above 0.5 (i.e., 0.5–0.7 in three hotspots and above 0.7 in all other hotspots), suggesting that most biodiversity hotspots have sound internal integral connectivity. Judging from temporal changes, biodiversity hotspots in different spatial locations presented different change laws (Figure 3). To be specific, the internal wetland hydrological connectivity of biodiversity hotspots located at the intersection between a first-grade river and a second-grade river presented a trend of declining first and rising afterwards, peaking in 2015. By contrast, the internal wetland hydrological connectivity of hotspots at other locations changed little in 1995–2010, but fluctuated abruptly in 2010–2015, showing declining trends of different amplitudes. The changing trend of PC was basically consistent with that of IIC.
MSPA analysis identified the changes in the functional type of the internal wetland hydrological connectivity of various biodiversity hotspots in 1995–2015, as shown in Figure 4.
The results (Figure 4a,b) indicated that, in 1990–2015, a declining trend was observed in the proportion of core wetlands in foreground wetlands in all hotspots except for hotspot bio3 (where a rising trend was observed); a rising trend was observed in the proportion of edge wetlands in foreground wetlands in all hotspots except for hotspot bio3 (where a declining trend was observed). Overall, the distribution of core wetlands and edge wetlands indicated that the core wetlands in most biodiversity hotspots of the Sanjiang Plain presented a trend of gradual fragmentation in 1990–2015. In combination with the changes in IIC and PC, core wetland changes had a dominant effect on hydrological connectivity.
Branch wetlands clearly accounted for a large proportion (0.00–3.60%) in all five stages under investigation, followed by bridge wetlands (0.00–1.15%) in the second place, while loop wetlands occupied the smallest proportion (0.00–0.09%). In 1995–2015, the proportions of the three types of wetland corridors in foreground wetlands presented basically the same changing trend, i.e., sharp increase in 2005 and increase at a reduced amplitude after 2010. In the background of a continuous decrease in core wetlands in these two decades, branch wetlands presented a rising trend in all hotspots except for bio3 and bio1. Bridge wetlands showed a trend of rising first and declining afterwards. Loop wetlands presented a rising trend in all hotspots except for bio6 (where they declined after 2010). This clarified that core wetlands basically degraded into edge wetlands and wetland corridors over the degradation process. The proportion of wetland corridors increased in most hotspots, but this increase failed to increase the internal connectivity of these hotspots, mainly because of the dominant effect of core wetlands (Figure 4c,e,g).
In 1995–2015, the proportion of islet wetlands increased in most hotspots but at an extremely small amplitude, except in bio2 and bio5, where it fluctuated considerably in 2005–2015. The largest amplitude of increase in the proportion of islet wetlands was 0.22%, and the effect of such increase on the internal wetland hydrological connectivity of hotspots was non-significant. In 1995–2015, the proportion of perforation wetlands increased in half of the biodiversity hotspots, and decreased in the other half. The amplitude of increase in the proportion of perforation wetlands was 1.35% at the maximum (bio3), and less than 1.00% in other hotspots (Figure 3f,g).

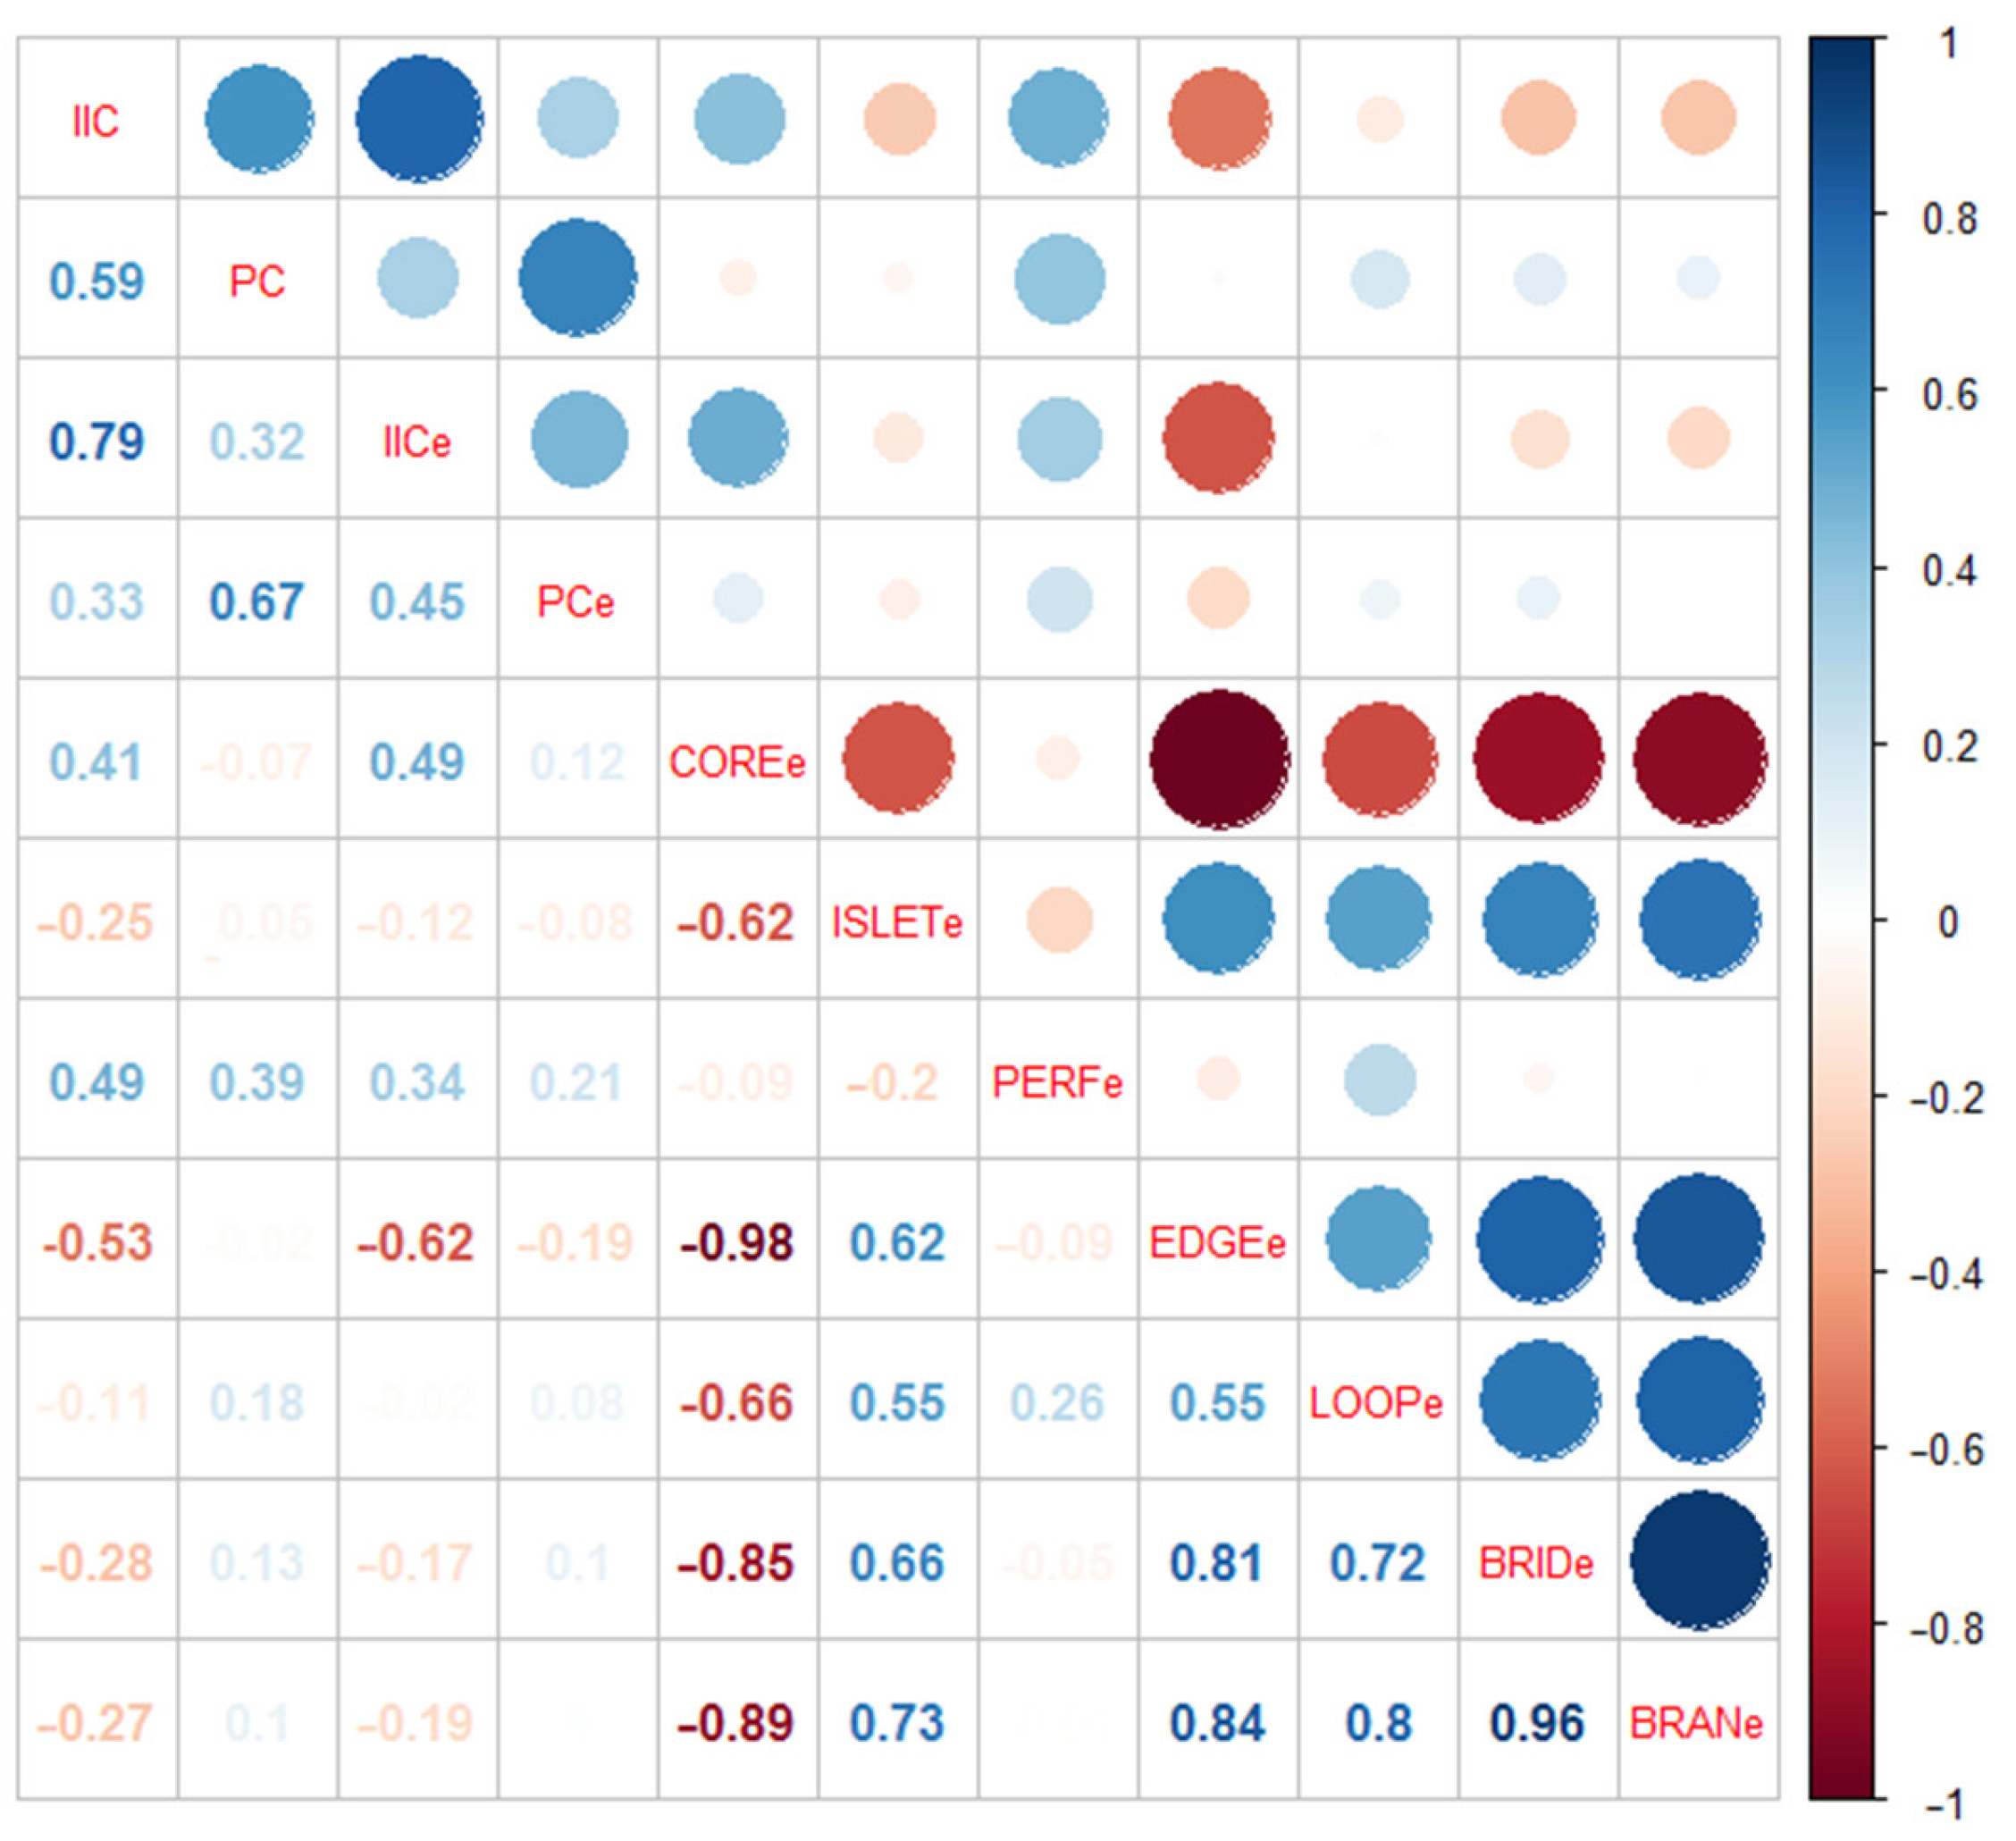
4.3. Relationship between Hydrological Connectivity Changes Inside and Outside of Biodiversity Hotspots

4.3.1. Effects of External Hydrological Connectivity on Internal Structural Hydrological Connectivity

(1) Effect of external structural hydrological connectivity on internal structural hydrological connectivity
The correlation coefficients between internal structural hydrological connectivity (IIC and PC) and external structural hydrological connectivity (IICe and PCe) (Figure 5) indicated that the internal integral connectivity (IIC) and external integral connectivity (IICe) of hotspots were significantly correlated (RIIC,IICe = 0.790, p < 0.01); furthermore, the internal PC and external PC (PCe) of hotspots were significantly correlated (RPC,PCe = 0.670, p < 0.01). The correlation between internal IIC and PC and external IICe and PCe of hotspots indicated that the internal wetland hydrological connectivity of a biodiversity hotspot was affected by the integral structural hydrological connectivity of the basin where the biodiversity hotspot is located; moreover, higher external structural connectivity meant higher internal hydrological connectivity and vice versa.
(2) Effect of external functional hydrological connectivity on internal structural hydrological connectivity
The correlation coefficients between internal structural hydrological connectivity (IIC and PC) and external functional hydrological connectivity (COREe, ISLETe, PERFORATIONe, EDGEe, LOOPe, BRIDGEe, and BRANCHe) (Figure 5) indicated that the internal integral connectivity (IIC) of hotspots was highly correlated with the proportion of external core wetlands (COREe), the proportion of edge wetlands (EDGEe), and the proportion of perforation wetlands (PERFORATIONe) (RIIC,COREe = 0.412, p < 0.01; RIIC,EDGEe = −0.531, p < 0.01; RIIC,PERFORATIONe = 0.487, p < 0.01). None of the external functional hydrological connectivity index was significantly correlated with internal PC at the level of 0.01. The correlation between the internal IIC and PC and external functional hydrological connectivity indexes of hotspots indicated that the internal wetland hydrological connectivity of a biodiversity hotspot was affected by the integral functional hydrological connectivity of the basin where the biodiversity hotspot is located; a higher proportion of external core wetlands and a lower proportion of edge wetlands meant higher internal hydrological connectivity and vice versa.

4.3.2. Effects of External Hydrological Connectivity on Internal Functional Hydrological Connectivity

(1) Effect of external structural hydrological connectivity on internal functional hydrological connectivity
The correlation coefficients between internal functional hydrological connectivity (CORE, ISLET, PERFORATION, EDGE, LOOP, BRIDGE, and BRANCH) and external structural hydrological connectivity (IICe and PCe) (Figure 6) indicated that the proportion of core wetlands as ecological sources (CORE) and the proportion of edge wetlands with frequent rich substance and energy exchange were significantly correlated with integral connectivity (IICe) of the basin where the hotspot is located (RCORE,IICe = 0.615, p < 0.01; REDGE,IICe = −0.707, p < 0.01). This indicated that the internal functional hydrological connectivity of biodiversity hotspots was affected by their external integral structural connectivity.
(2) Effect of external functional hydrological connectivity on internal functional hydrological connectivity
The correlation coefficients between internal functional hydrological connectivity (CORE, ISLET, PERFORATION, EDGE, LOOP, BRIDGE, and BRANCH) and external functional hydrological connectivity (COREe, ISLETe, PERFORATIONe, EDGEe, LOOPe, BRIDGEe, and BRANCHe) is shown in Figure 6. The results indicate that the internal functional hydrological connectivity indexes of biodiversity hotspots were all significantly correlated with external functional hydrological connectivity indexes. In particular, the proportion of external core wetlands (COREe) and the proportion of edge wetlands (EDGEe) significantly affected the proportion of internal core wetlands (CORE); moreover, the proportion of external branch corridors (BRANCHe) significantly affected the proportion of internal branch corridors (BRANCH) (p < 0.01). This indicated that the internal functional hydrological connectivity of biodiversity hotspots was also affected by their external functional connectivity.

5. Discussions

In this study, the internal hydrological connectivity changes of eight wetland biodiversity hotspots in 1995–2015 were explored using IIC and PC (structural connectivity) and MSPA (functional connectivity). Taking the catchment area involved as the minimum basin perimeter, this study analyzed the relationship between hydrological connectivity changes inside and outside hotspots. It was confirmed that the internal and external hydrological connectivity of wetland biodiversity hotspots were significantly correlated. Furthermore, the internal hydrological connectivity of hotspots not only declined with declining external structural connectivity, but also changed with the proportion of core wetlands, the proportion of edge wetlands, and the proportion of branch corridors. The wetlands in each biodiversity hotspot have undergone destruction of varying degrees. The loss ratio of core wetlands ranges from 1% to 14% in different hotspots. Most of the lost wetlands have been transferred to farmland, and a small amount have been converted to built-up areas. With the fragmentation of the core wetlands, the proportion of edge wetlands and branch corridors increases, and the ecological function of the wetlands degraded. If the situation is not controlled in time, with the continuous shrinking of area and the breaking of links, the core wetlands will lose their original function completely.
Judging from the internal hydrological connectivity changes of different hotspots, most hotspots in the study area presented a declining trend to varying extents in terms of both structural and functional connectivity. Further analysis indicated that the decline in hydrological connectivity was mainly attributable to climate change and human activities such as hydraulic engineering and land use [9,39,40].
Hotspots in different locations showed different patterns of hydrological connectivity changes. Hydrological connectivity gradually declined in most hotspots but began to rise in 2005 in several hotspots (bio3 and bio4, located at the intersection between a first-grade river and a second-grade river). An analysis of the rainfall and land use change of the area where bio3 and bio4 are located in 2005–2015 showed that rainfall increased and the connectivity of wetland decreased (caused by farmland occupation) year by year after 2005 [41,42]. The increase of structural hydrological connectivity index in bio3 and bio4 indicated that the internal hydrological connectivity changes of biodiversity hotspots located at the intersections of high-grade rivers or near the source were more significantly affected by climate change than by human activities. Comparing bio3 and bio4 in terms of the proportion of core wetlands showed that the proportion of core wetlands increased in bio3 but decreased in bio4. The changing trend of bio4 was contrary to that of structural hydrological connectivity index IIC, which is possibly because the wetland fragmentation process of bio4 was dispersed at small distances. The proportion of core wetlands decreased, but because of the effect of the threshold on IIC results [6], the connectivity between separated core wetlands would still present a rising trend if the distance between them did not exceed the threshold. Other hotspots were all greatly affected by human activities, because core wetlands changed into edge wetlands and branch corridors. Lastly, bio5 and bio6 were most significantly affected by human activities. Over the two investigated decades, the proportion of core wetlands in bio5 decreased by 10%. These core wetlands basically all degraded into edge wetlands, which played a connective role in the change into wetland corridors. Similarly, bio6 (located at the end of a fourth-grade river) experienced only a slight decline in structural and functional connectivity, mainly because of protection by conservation areas.
Judging from the relationship between the internal and external hydrological connectivity of hotspots, the external hydrological connectivity (the basin where the hotspot is located) of hotspots significantly affected their internal structural hydrological connectivity (IIC) and functional hydrological connectivity (COREe, EDGEe and, BRANCHe). IIC was significantly correlated with IICe, the proportion of external core wetlands, and the proportion of edge wetlands. Based on the descriptive statistics of the internal and external structural connectivity indexes of various hotspots (Figure 3c,d), external structural connectivity was lower than internal structural connectivity in most hotspots. This suggested that the decline in the structural connectivity of the basin where the hotspot is located likely causes a decline in the internal structural and functional connectivity of the hotspot. This conclusion is consistent with the conclusion of a prior study about the internal effect of land use changes on conservation areas on the basin scale [43].
Based on the internal hydrological connectivity changes of biodiversity hotspots in the study area and their relationship with external hydrological connectivity changes, different conservation management measures should be taken inside and outside of wetland biodiversity hotspots (the basin where the hotspot is located). First, depending on their current integral hydrological connectivity, hotspots should be classified into hotspots in need of urgent restoration (0–0.5), hotspots in need of general restoration (0.5–0.7), and hotspots in need of maintenance (0.7–1.00). Second, hotspots classified as hotspots in need of urgent or general restoration should be put under strict conservation without encroaching upon wetland resources in any form. Moreover, wetlands in basins where the hotspot is located should also be placed under restrictive control. For instance, the proportion of core wetlands in the basin should be no lower than 20% (this proportion is roughly the proportion of core wetlands in the external basin when the external integral connectivity of the hotspot is 0.7). Furthermore, restoration measures should be taken in cases where this requirement is not satisfied. For core wetlands outside the hotspot above the distance threshold, it is necessary to restore their hydrological state and vegetation state with core wetlands inside the hotspot, increase the area of core wetlands, and reduce the area of edge wetlands. For islets outside the hotspot above the distance threshold, the area of core wetlands and islets should be expanded through artificial interventions according to their distances away from adjacent core wetlands (with due consideration to restoration costs and islet values). Thus, their distances can be controlled within the threshold.
Wetland hydrological connectivity provides the basis for wetland ecosystems to function normally and constitutes the key to maintaining biodiversity. The efficient conservation of wetland biodiversity hotspots requires not only the internal hydrological connectivity of hotspots but also the external hydrological connectivity of hotspots, both structurally and functionally. The conservation management of wetland biodiversity hotspots located within basins of different grades, at different distances away from the source, or with different land use characteristics, should be customized with a focus on their specific characteristics. This study clarified the relationship between the internal and external hydrological connectivity of wetland biodiversity hotspots, offered scientific references for the effective conservation and management of wetland biodiversity hotspots in the future, and enables the prevention of the decline of external connectivity from causing the internal degradation of hotspots.

Author Contributions

Conceptualization, Y.Q. and N.X.; methodology, X.Z. and W.B.; software, X.Z.; validation, C.L.; formal analysis, X.Z. and W.B.; investigation, C.L.; resources, H.Z.; data curation, H.Z.; writing—original draft preparation, X.Z. and W.B.; writing—review and editing, Y.Q. and N.X.; supervision, N.X.; project administration, Y.Q. and N.X.; funding acquisition, Y.Q. All authors have read and agreed to the published version of the manuscript.

Funding

The National Natural Science Foundation of China;(Project Number 41971246) Heilongjiang Academy of Sciences (Project Number YY2020ZR01); Heilongjiang Province Key Laboratory of Cold Region Wetland Ecology and Environment Research of the Harbin University (Project Number 201910).

Data Availability Statement

Not applicable.

Acknowledgments

We thank the Resource and Environment Data Cloud Platform and the National Fundamental Geographic Information System for the provided the data set. Funding for data surveys and collection came from the The National Natural Science Foundation of China (Project Number 41971246), and Heilongjiang Academy of Sciences (YY2020ZR01).

Conflicts of Interest

The authors declare no conflict of interest.

References

  1. Yang, W.; Liu, Y.; Ou, C.; Gabor, S. Examining water quality effects of riparian wetland loss and restoration scenarios in a southern Ontario watershed. J. Environ. Manag. 2016, 174, 26–34. [Google Scholar] [CrossRef] [PubMed]
  2. Ahmed, F. Cumulative Hydrologic Impact of Wetland Loss: Numerical Modeling Study of the Rideau River Watershed, Canada. J. Hydrol. Eng. 2014, 19, 593–606. [Google Scholar] [CrossRef]
  3. Quesnelle, P.E.; Fahrig, L.; Lindsay, K. Effects of habitat loss, habitat configuration and matrix composition on declining wetland species. Biol. Conserv. 2013, 160, 200–208. [Google Scholar] [CrossRef]
  4. Freeman, M.C.; Pringle, C.M.; Jackson, R.C. Hydraulic connectivity and the contribution of stream headwaters to ecological integrity at regional scales. J. Am. Water Resour. Assoc. 2007, 43, 5–14. [Google Scholar] [CrossRef]
  5. Bracken, L.J.; Wainwright, J.; Ali, G.A.; Tetzlaff, D.; Smith, M.W.; Reaney, S.M.; Roy, A.G. Concepts of hydrological connectivity: Research approaches, pathways and future agendas. Earth Sci. Rev. 2013, 119, 17–34. [Google Scholar] [CrossRef] [Green Version]
  6. Pascual-Hortal, L.; Saura, S. Comparison and development of new graph-based landscape connectivity indexes: Towards the priorization of habitat patches and corridors for conservation. Landsc. Ecol. 2006, 21, 959–967. [Google Scholar] [CrossRef]
  7. Pedroli, B.; Pinto-Correia, T.; Cornish, P. Landscape—What’s in it? Trends in European Landscape Science and Priority Themes for Concerted Research. Landsc. Ecol. 2006, 21, 421–430. [Google Scholar] [CrossRef]
  8. Cui, Z.; Shen, H.; Zhang, G.X. Changes of Landscape Patterns and Hydrological Connectivity of Wetlands in Momoge National Natural Wetland Reserve and Their Driving Factors for Three Periods. Wetl. Sci. 2016, 14, 866–873. [Google Scholar]
  9. Zhang, M.M.; Wu, X.Q. Changes in hydrological connectivity and spatial morphology of Baiyangdian wetland over the last 20 years. Acta Ecol. Sin. 2018, 38, 4205–4213. [Google Scholar]
  10. Amoros, C.; Bornette, G. Connectivity and biocomplexity in waterboies of riverine floodplain. Freshw. Biol. 2002, 47, 761–776. [Google Scholar] [CrossRef]
  11. Simioni, J.P.D.; Guasselli, L.A.; Etchelar, C.B. Connectivity among Wetlands of EPA of Banhado Grande, RS. RBRH 2017, 22, UNSP e15. [Google Scholar] [CrossRef] [Green Version]
  12. Khoi, D.N.; Nguyen, V.T.; Sam, T.T.; Nhi, P.T.T. Evaluation on Effects of Climate and Land-Use Changes on Streamflow and Water Quality in the La Buong River Basin, Southern Vietnam. Sustainability 2019, 11, 7221. [Google Scholar] [CrossRef] [Green Version]
  13. Nie, W.; Yuan, Y.; Kepner, W.; Nash, M.S.; Jackson, M.; Erickson, C. Assessing impacts of Landuse and Landcover changes on hydrology for the upper San Pedro watershed. J. Hydrol. 2011, 407, 105–114. [Google Scholar] [CrossRef]
  14. Junk, W.J.; Bayley, P.B.; Sparks, R.E. The flood pulse concept in river-floodplain system. Can. Spec. Publ. Fish. Aquat. Sci. 1989, 106, 110–127. [Google Scholar]
  15. Tockner, K.; Schiemer, F.; Ward, J.V. Conservation by restoration: The management concept for a river-floodplain system on the Danube river in Austria. Aquat. Conserv. Mar. Freshw. Ecosyst. 1998, 8, 71–86. [Google Scholar] [CrossRef]
  16. Thoms, M.C.; Southwell, M.; McGinness, H. Floodplain–river ecosystems: Fragmentation and water resources development. Geomorphology 2005, 71, 126–138. [Google Scholar] [CrossRef]
  17. Ruiz, L.; Parikh, N.; Heintzman, L.J.; Collins, S.D.; Starr, S.M.; Wright, C.K.; Henebry, G.M.; van Gestel, N.; McIntyre, N.E. Dynamic connectivity of temporary wetlands in the southern Great Plains. Landsc. Ecol. 2014, 29, 507–516. [Google Scholar] [CrossRef]
  18. McDonough, O.T.; Lang, M.; Hosen, J.; Palmer, M.A. Surface Hydrologic Connectivity Between Delmarva Bay Wetlands and Nearby Streams Along a Gradient of Agricultural Alteration. Wetlands 2015, 35, 41–53. [Google Scholar] [CrossRef]
  19. Xia, G. Effects of Landscape Pattern on Bird Community Diversity—A Case Study of Jinhai Wetland in Shanghai; Shanghai Normal University: Shanghai, China, 2015. [Google Scholar]
  20. Li, W.; Kerrylee, R.; Neil, S.; Joanne, L. The influences of climate and hydrology on population dynamics of waterbirds in the lower Murrumbidgee Rive floodplains in Southeast Australia: Implication for environmental water management. Ecol. Model. 2011, 222, 154–163. [Google Scholar]
  21. Karim, F.; Kinsey-Henderson, A.; Wallace, J.; Arthington, A.H.; Pearson, R.G. Modelling wetland connectivity during overbank flooding in a tropical floodplain in north Queensland, Australia. Hydrol. Process. 2012, 26, 2710–2723. [Google Scholar] [CrossRef] [Green Version]
  22. Zhao, J.Y.; Dong, Z.R.; Zhai, Z.L.; Sun, D.Y. Evaluation method for river floodplain system connectivity based on graph theory. J. Hydraul. Eng. 2011, 42, 537–543. [Google Scholar]
  23. Meerkerk, A.L.; van Wesemael, B.; Bellin, N. Application of connectivity theory to model the impact of terrace failure on runoff in semi-arid catchments. Hydrol. Process. 2009, 23, 2792–2803. [Google Scholar] [CrossRef]
  24. Cui, B.; Wang, C.; Tao, W.; You, Z.Y. River channel network design for drought and flflood control: A case study of Xiaoqinghe River basin, Jinan City, China. J. Environ. Manag. 2009, 90, 3675–3686. [Google Scholar] [CrossRef] [PubMed]
  25. Vogt, P.; Riitters, K. GuidosToolbox: Universal digital image object analysis. Eur. J. Remote Sens. 2017, 50, 352–361. [Google Scholar] [CrossRef]
  26. Margules, C.R.; Pessey, R.L. Systematic conservation Planning. Nature 2000, 405, 243–253. [Google Scholar] [CrossRef]
  27. Pressey, R.L.; Cabeza, M.; Watts, M.E.; Richard, M.; Cowling, R.M.; Wilson, K.A. Conservation planning in a changing world. Trends Ecol. Evol. 2007, 22, 583–592. [Google Scholar] [CrossRef] [PubMed]
  28. Wang, S. China Red Data Book of Endangered Animals; Science Press: Beijing, China, 1998. [Google Scholar]
  29. Wang, S.; Xie, Y. Chinese Species Red List; Higher Education Press: Beijing, China, 2009. [Google Scholar]
  30. Lagabrielle, E.; Rouget, M.; Bourgeois, T.L.; Payet, K.; Durieux, L.; Baret, S.; Dupont, J.; Strasberg, D. Integrating conservation, restoration and land-use planning in islands—An illustrative case study in Réunion Island (Western Indian Ocean). Landsc. Urban Plan. 2011, 2, 120–130. [Google Scholar] [CrossRef] [Green Version]
  31. Higgins, J.V.; Bryer, M.T.; Khoury, M.L.; Fitzhugh, T.W. A Freshwater Classification Approach for Biodiversity Conservation Planning. Conserv. Biol. 2005, 19, 432–445. [Google Scholar] [CrossRef]
  32. Qu, Y.; Sun, G.; Luo, C.; Zeng, X.; Zhang, H.; Murray, N.J.; Xu, N. Identifying restoration priorities for wetlands based on historical distributions of biodiversity features and restoration suitability. J. Environ. Manag. 2019, 231, 1222–1231. [Google Scholar] [CrossRef]
  33. Carwardine, J.; Rochester, W.A.; Richardson, K.S.; Williams, K.J.; Pressey, R.L.; Possingham, H.P. Conservation planning with irreplaceability: Does the method matter? Biodivers. Conserv. 2007, 16, 245–258. [Google Scholar] [CrossRef]
  34. Ferrier, S.; Pressey, R.L.; Barrett, T.W. A new predictor of the irreplaceability of areas for achieving a conservation goal, its application to real-world planning, and a research agenda for further refinement. Biol. Conserv. 2000, 93, 303–326. [Google Scholar] [CrossRef]
  35. Saura, S.; Pascual-Hortal, L. A new habitat availability index to integrate connectivity in landscape conservation planning: Comparison with existing indices and application to a case study. Landsc. Urban Plan. 2007, 83, 91–103. [Google Scholar] [CrossRef]
  36. Saura, S.; Pascual-Hortal, L. Conefor Sensinode2.2 User’ s Manual; University of Lleida: Lleida, Spain, 2007; pp. 23–24. [Google Scholar]
  37. Saura, S.; Torné, J. Conefor 2.6 User Manual; Universidad Politécnica de Madrid: Madrid, Spain, 2012; Available online: www.conefor.org (accessed on 1 April 2021).
  38. RStudio Team. RStudio: Integrated Development Environment for R; RStudio: Boston, MA, USA, 2021; Available online: https://www.rstudio.com/ (accessed on 10 April 2021).
  39. Naskar, M.; Roy, K.; Karnatak, G.; Nandy, S.K.; Roy, A. Quantifying climate change induced threats to wetland fisheries: A stakeholder-driven approach. Environ. Dev. Sustain. 2018, 20, 2811–2830. [Google Scholar] [CrossRef]
  40. Chignell, S.M.; Laituri, M.J.; Young, N.E.; Evangelista, P.H. Afroalpine Wetlands of the Bale Mountains, Ethiopia: Distribution, Dynamics, and Conceptual Flow Model. Ann. Am. Assoc. Geogr. 2019, 109, 791–811. [Google Scholar] [CrossRef]
  41. Li, T.X.; Fu, Q.; Meng, F.X. Analysis of evolution trend and abrupt changes of annual precipitation in Sanjiang Plain from 1959 to 2013. China Rural. Water Hydropower 2016, 9, 201–204. [Google Scholar]
  42. Zhou, H.Y.; Diao, L.M.; Zheng, S.F. Remote Sensing Monitoring of Paddy Field Expansion in Fuyuan During 1990–2013. Chin. Agric. Sci. Bull. 2018, 34, 140–146. [Google Scholar]
  43. Liu, H.Y.; Zhang, S.; Li, Z.F. Impacts on wetlands of large-scale land-use changes by agricultural development: The small Sanjiang Plain, China. Ambio 2004, 33, 306–310. [Google Scholar] [CrossRef]
Figure 1. Location map of the study area.
Sustainability 14 06654 g001
Figure 2. Spatial pattern of biodiversity conservation values and distribution of sample plots for analyzing the hydrological connectivity of biodiversity hotspots.
Sustainability 14 06654 g002
Figure 3. Wetland IIC and PC changes inside hotspots in 1995–2015 (IIC variation in each hotspot (a); comparison of IIC numerical values inside and outside each hotspot (c); PC variation in each hotspot (b); comparison of PC numerical values inside and outside each hotspot (d).
Sustainability 14 06654 g003
Figure 4. Wetland hydrological connectivity (morphological spatial pattern analysis (MSPA)) changes inside hotspots in 1995–2015. These functional hydrological connectivity indexes include Core (a), Edge (b), Branch (c), Perforation (d), Bridge (e), Islet (f), Loop (g).
Sustainability 14 06654 g004
Figure 5. Correlation between internal structural hydrological connectivity (IIC and PC) and external hydrological connectivity of hotspots.
Sustainability 14 06654 g005
Figure 6. Correlation between internal functional hydrological connectivity (MSPA indexes) and external hydrological connectivity of hotspots.
Sustainability 14 06654 g006
Publisher’s Note: MDPI stays neutral with regard to jurisdictional claims in published maps and institutional affiliations.

